Subjective Hunger, Gastric Upset, and Sleepiness in Response to Altered Meal Timing during Simulated Shiftwork

 ,
,  ,
,
Abstract
1. Introduction
2. Materials and Methods
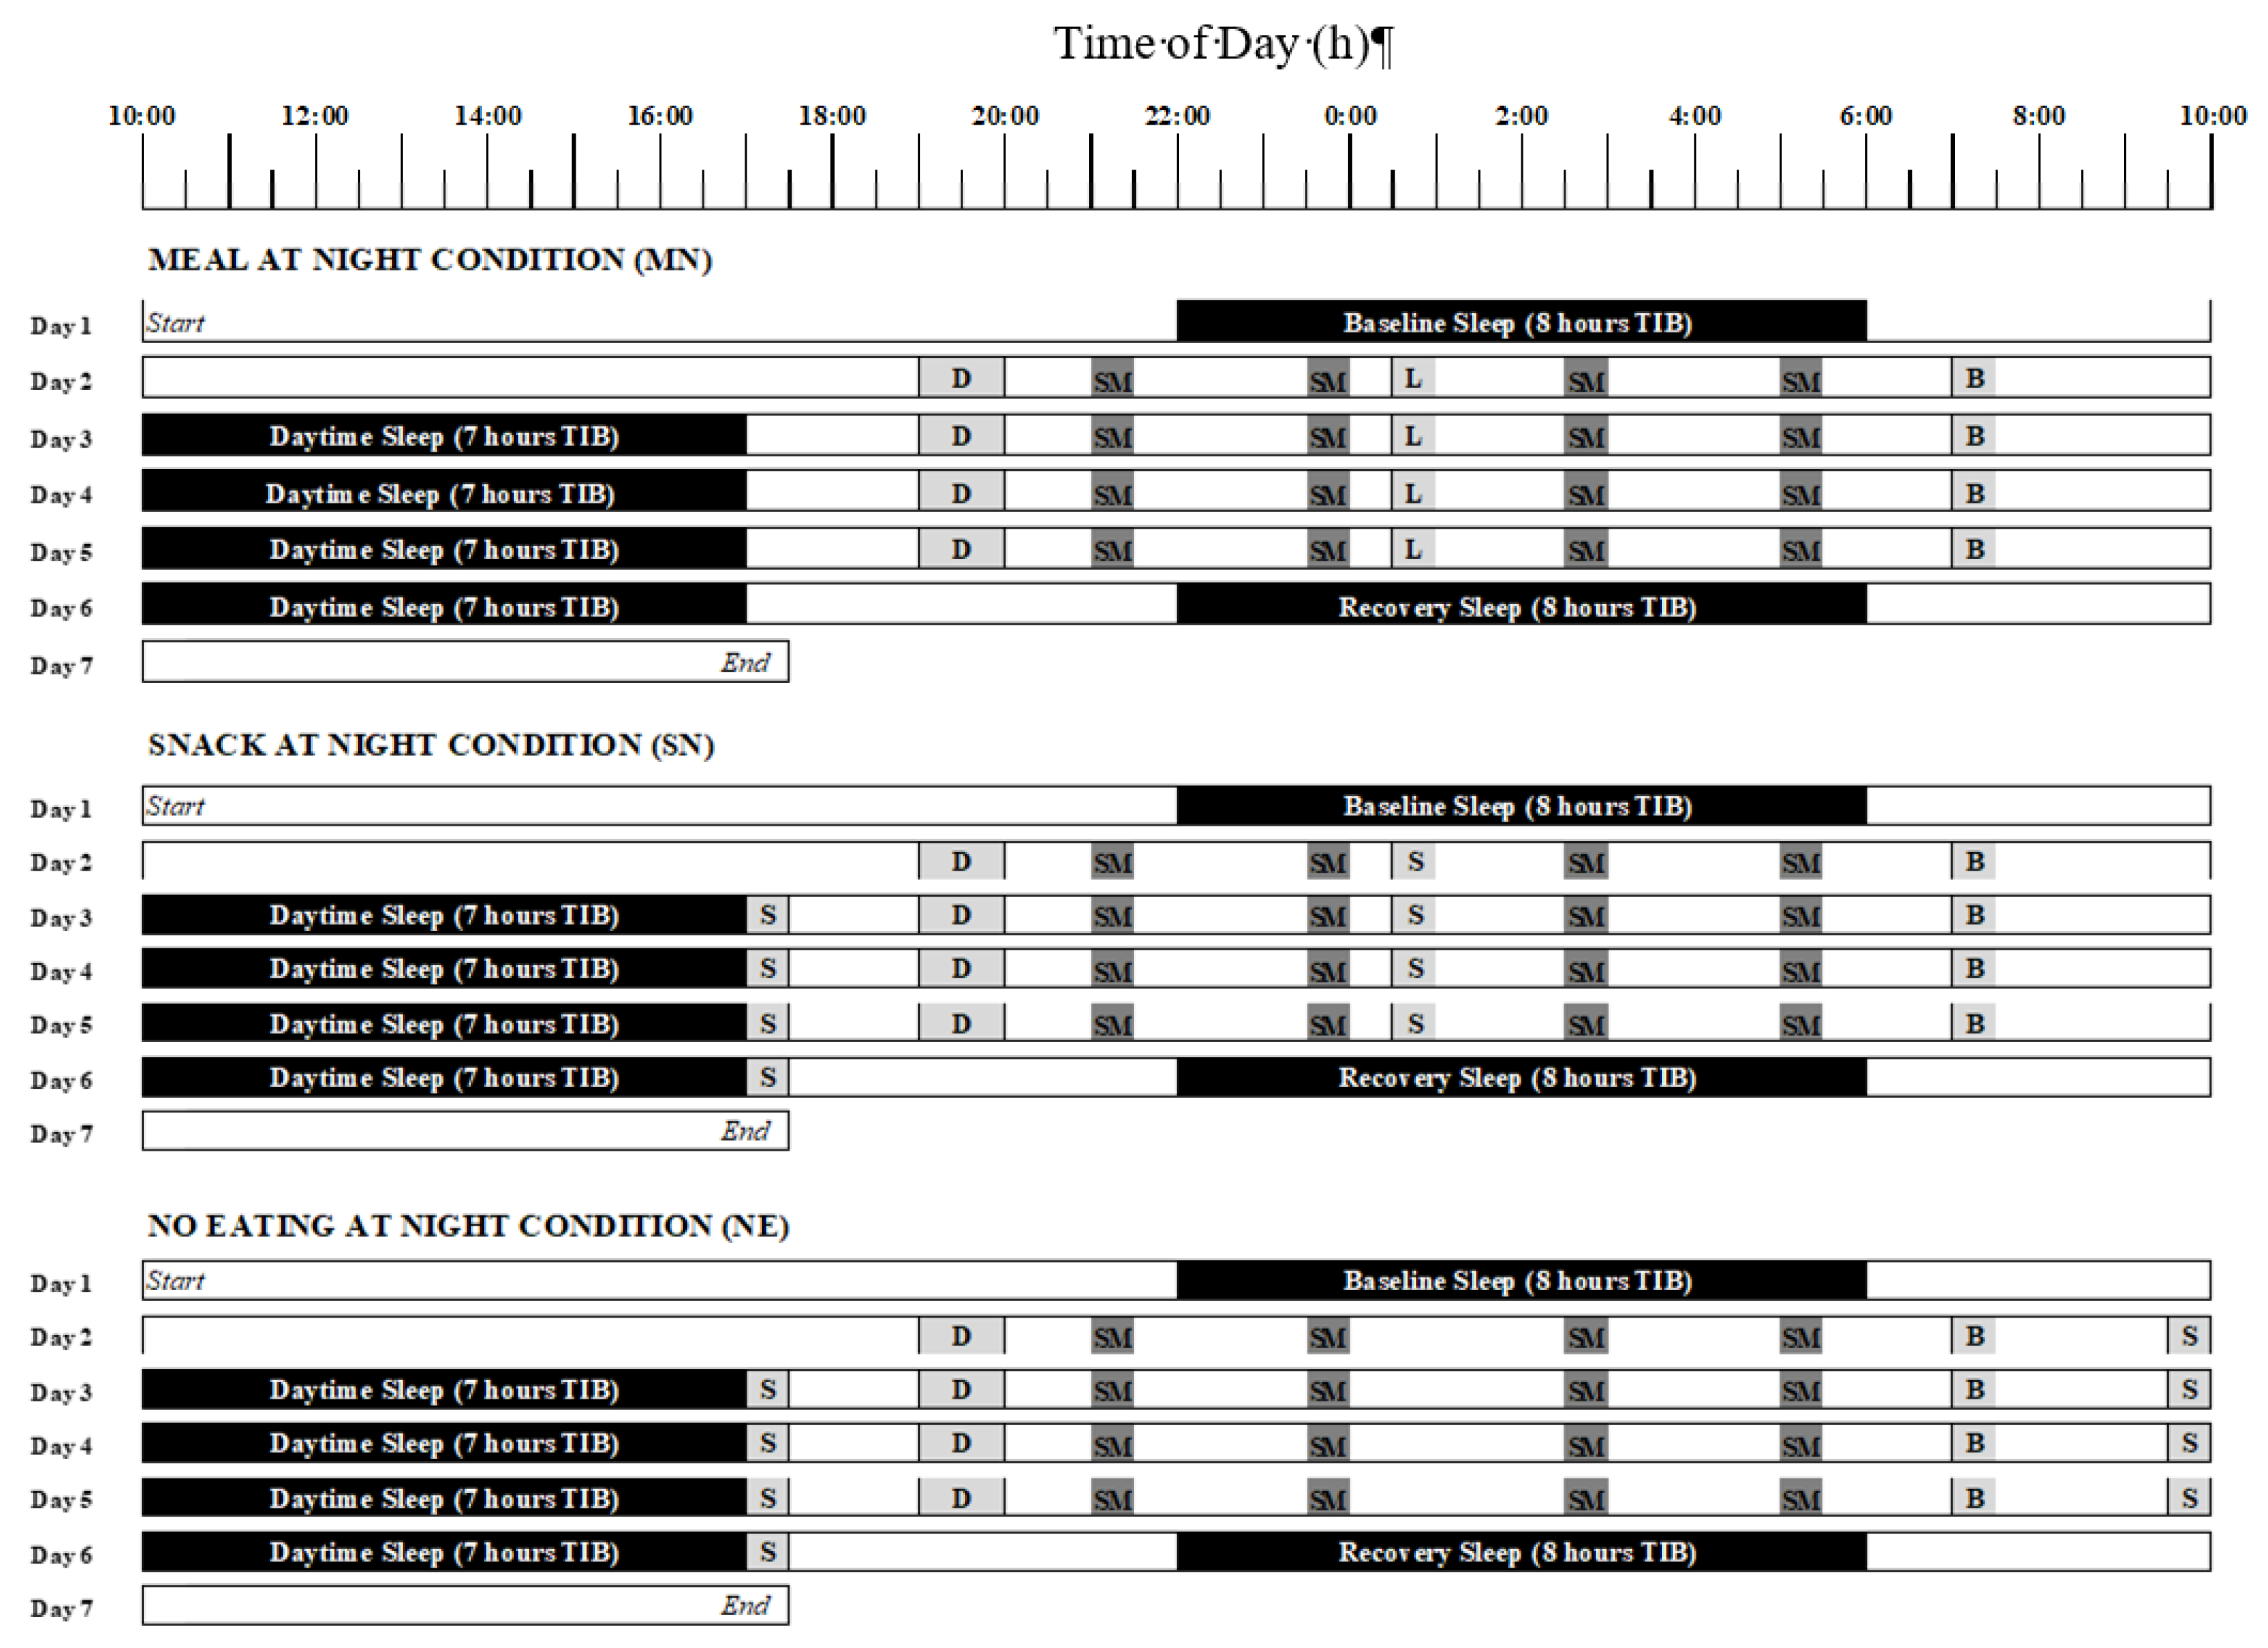
2.1. Study Design
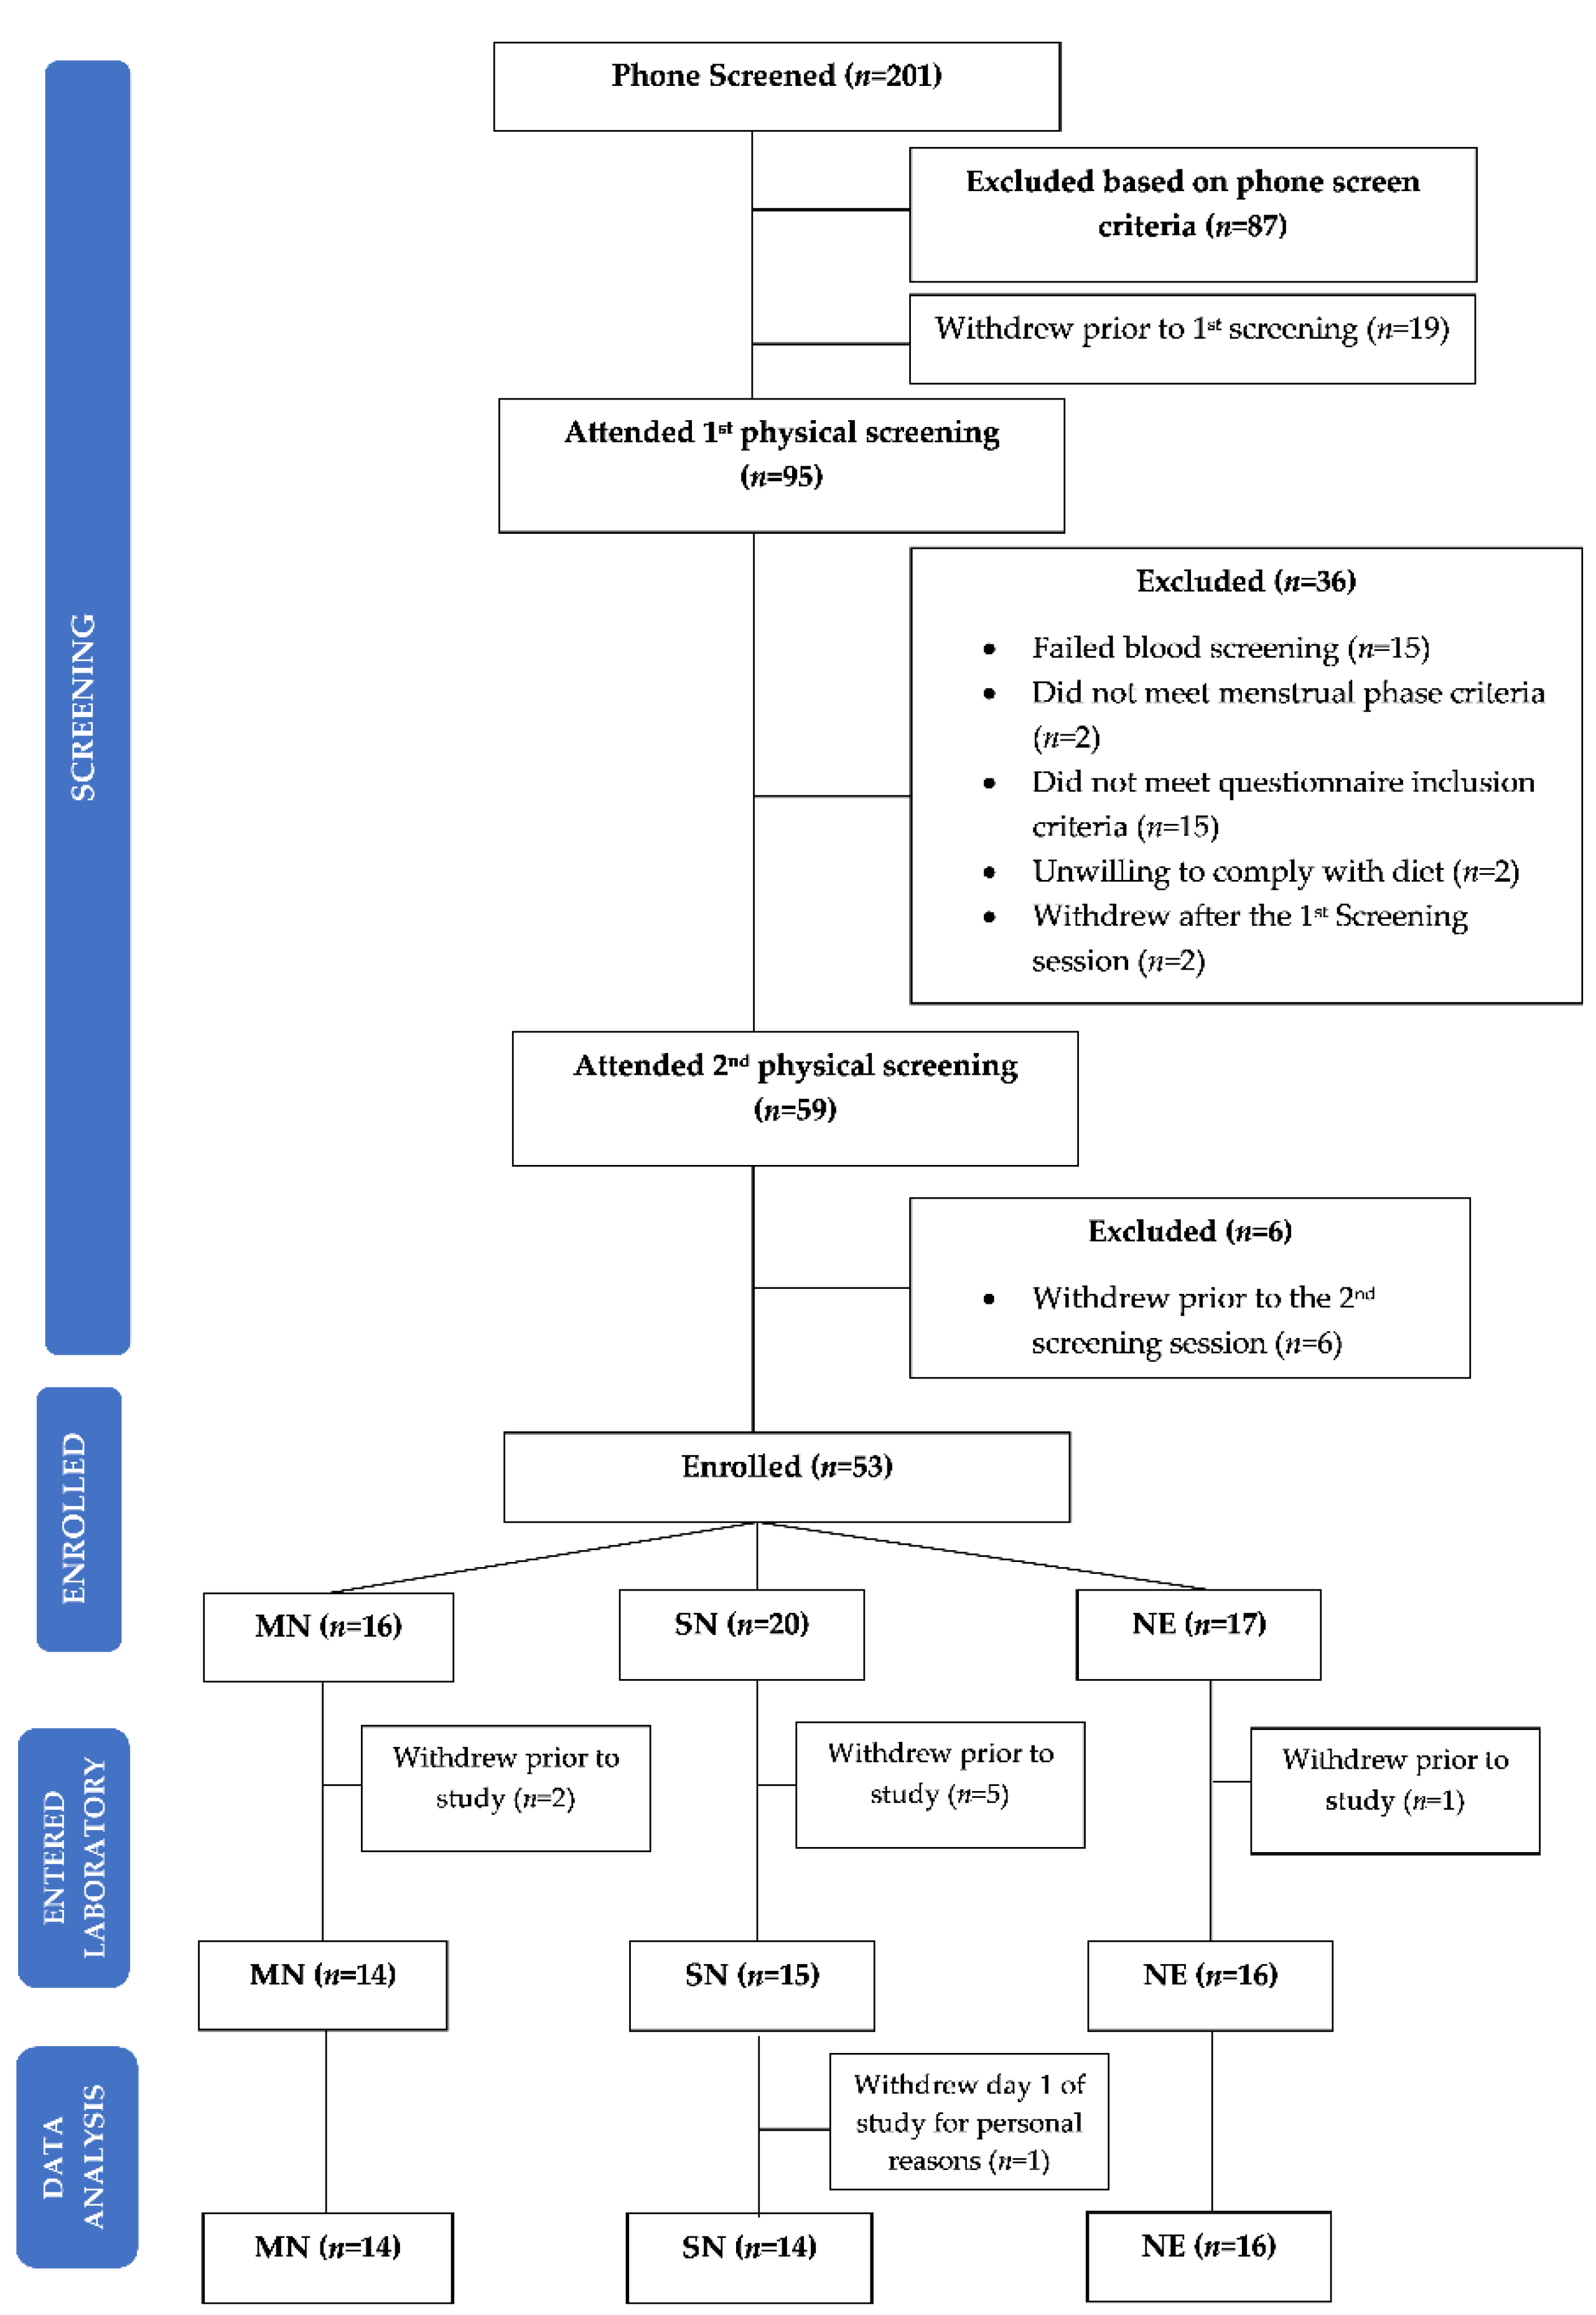
2.2. Participants
2.3. Protocol Design
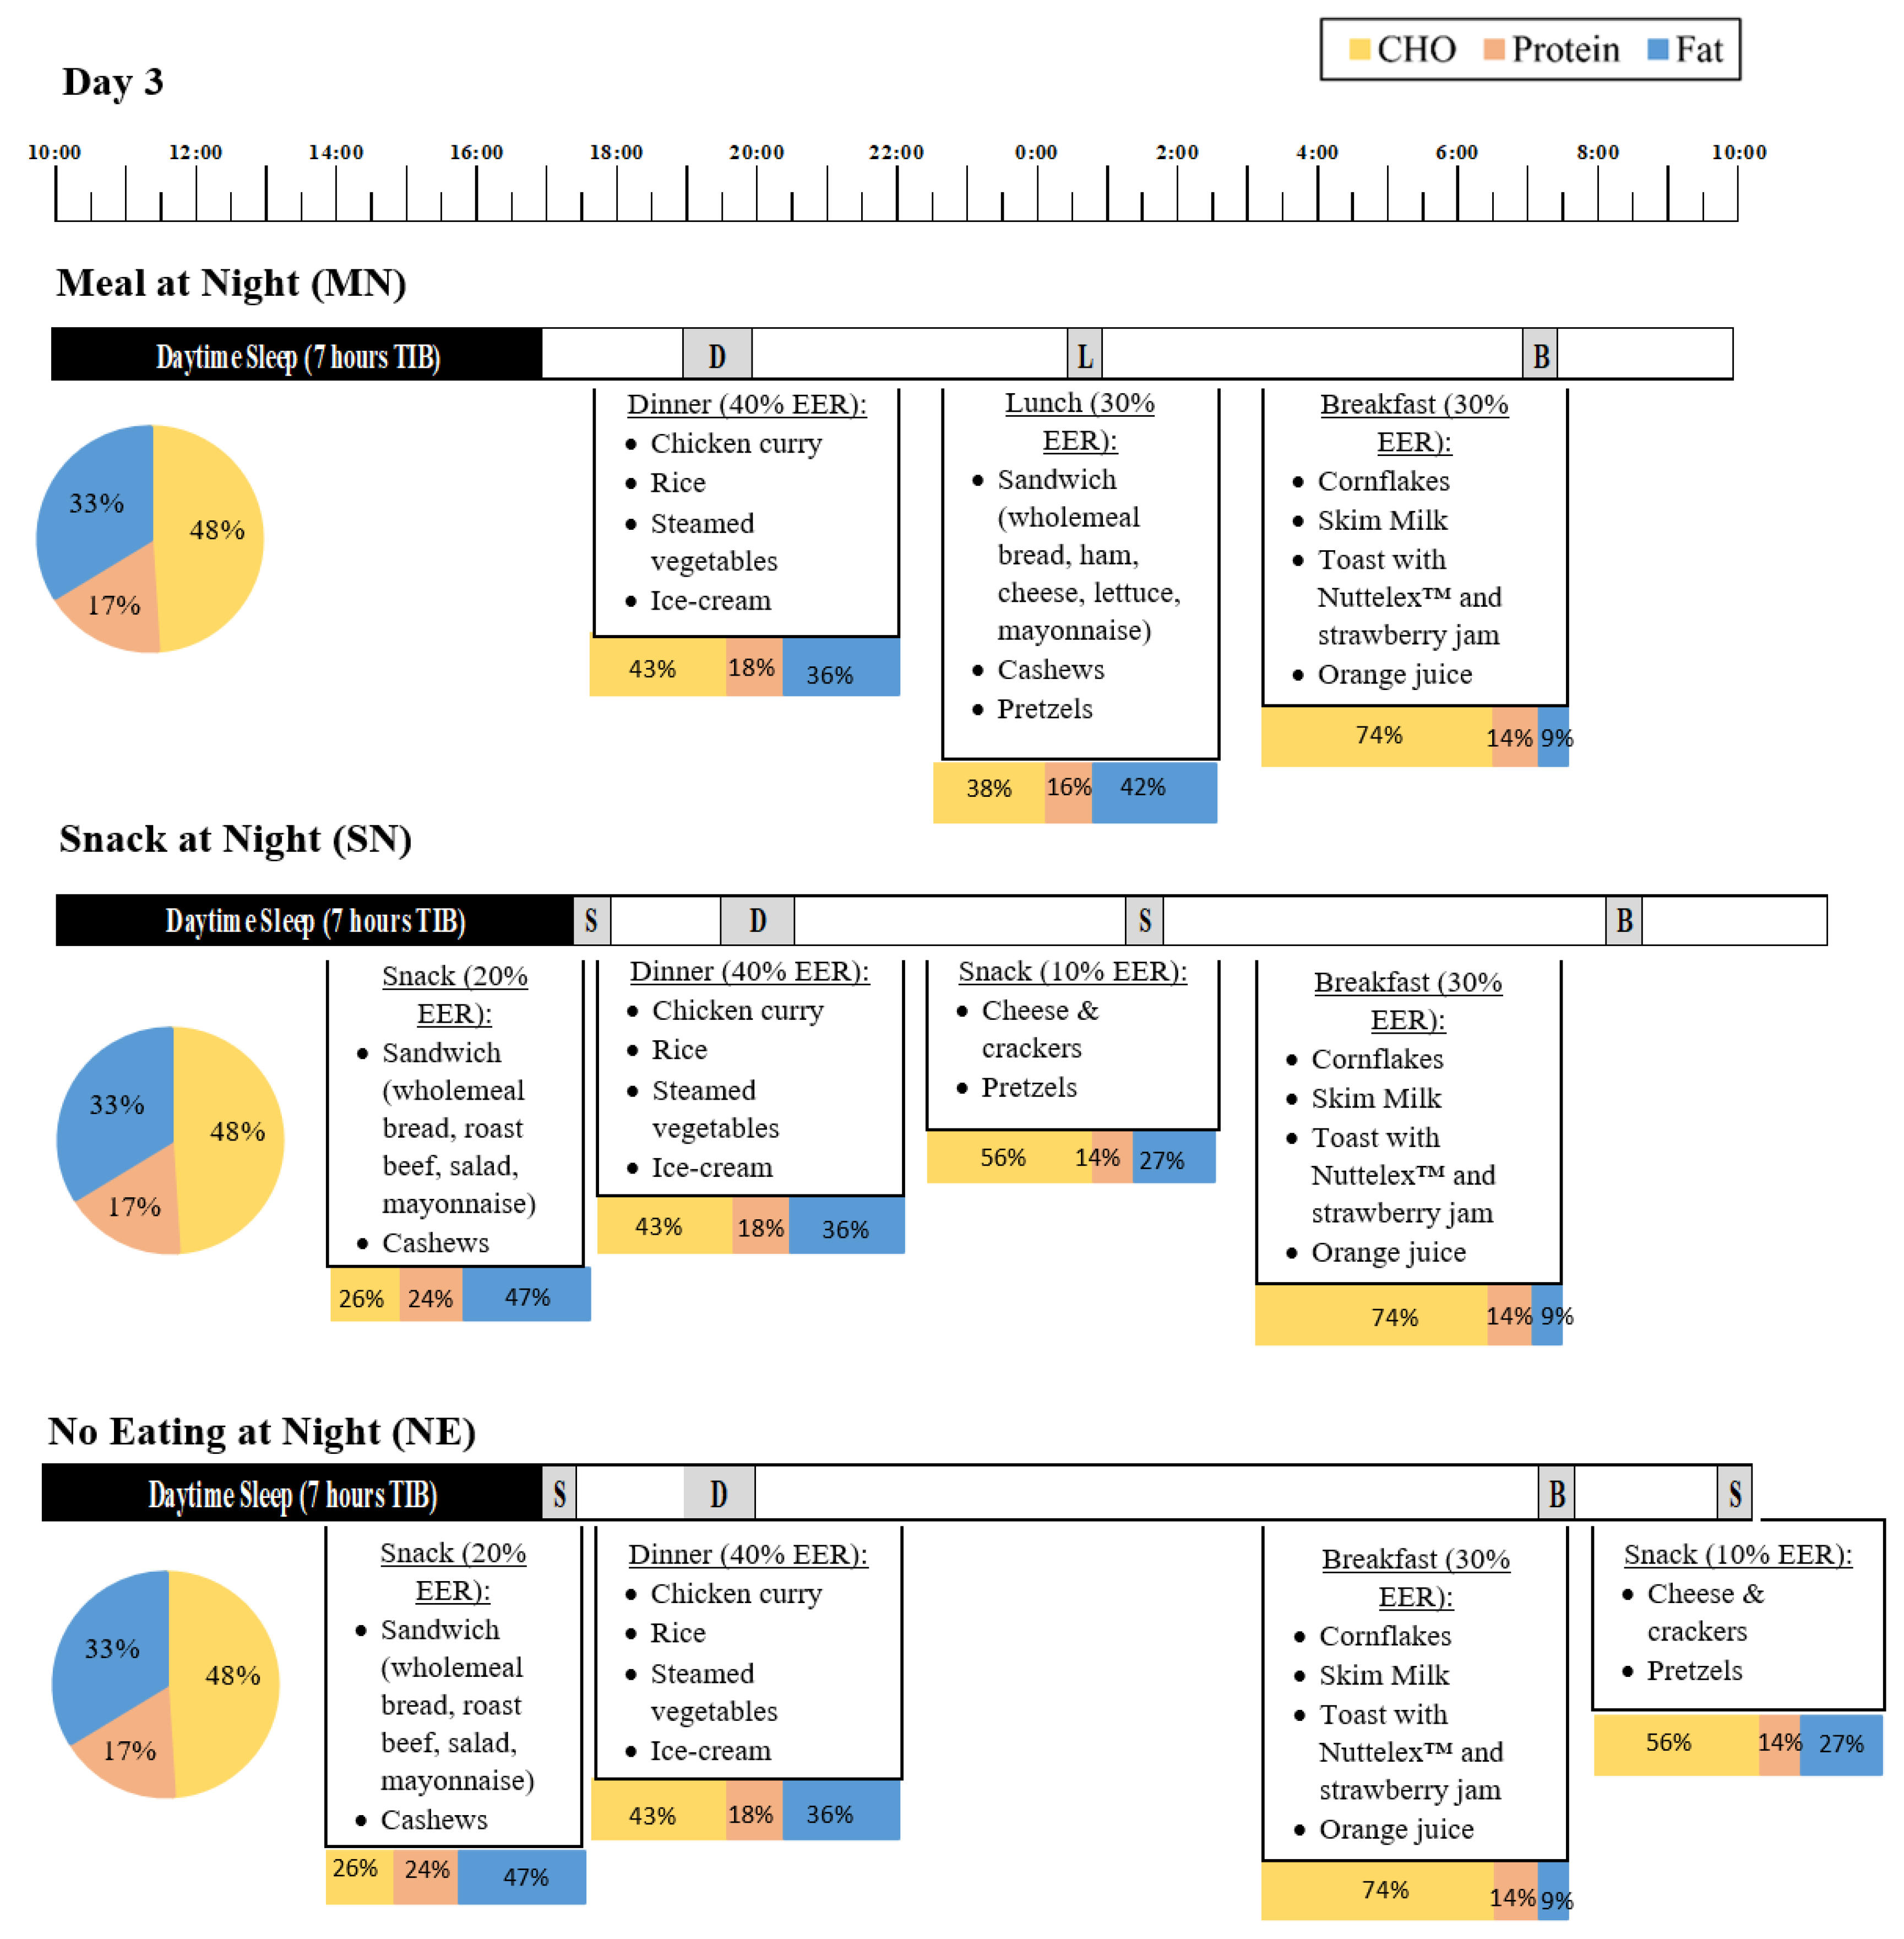
2.4. Eating Conditions
2.5. Measures
2.5.1. Hunger and Gut Reaction
2.5.2. Subjective Sleepiness and Fatigue
2.5.3. Polysomnography and Actigraphy
2.5.4. Statistical Analysis
3. Results
3.1. Demographic Information
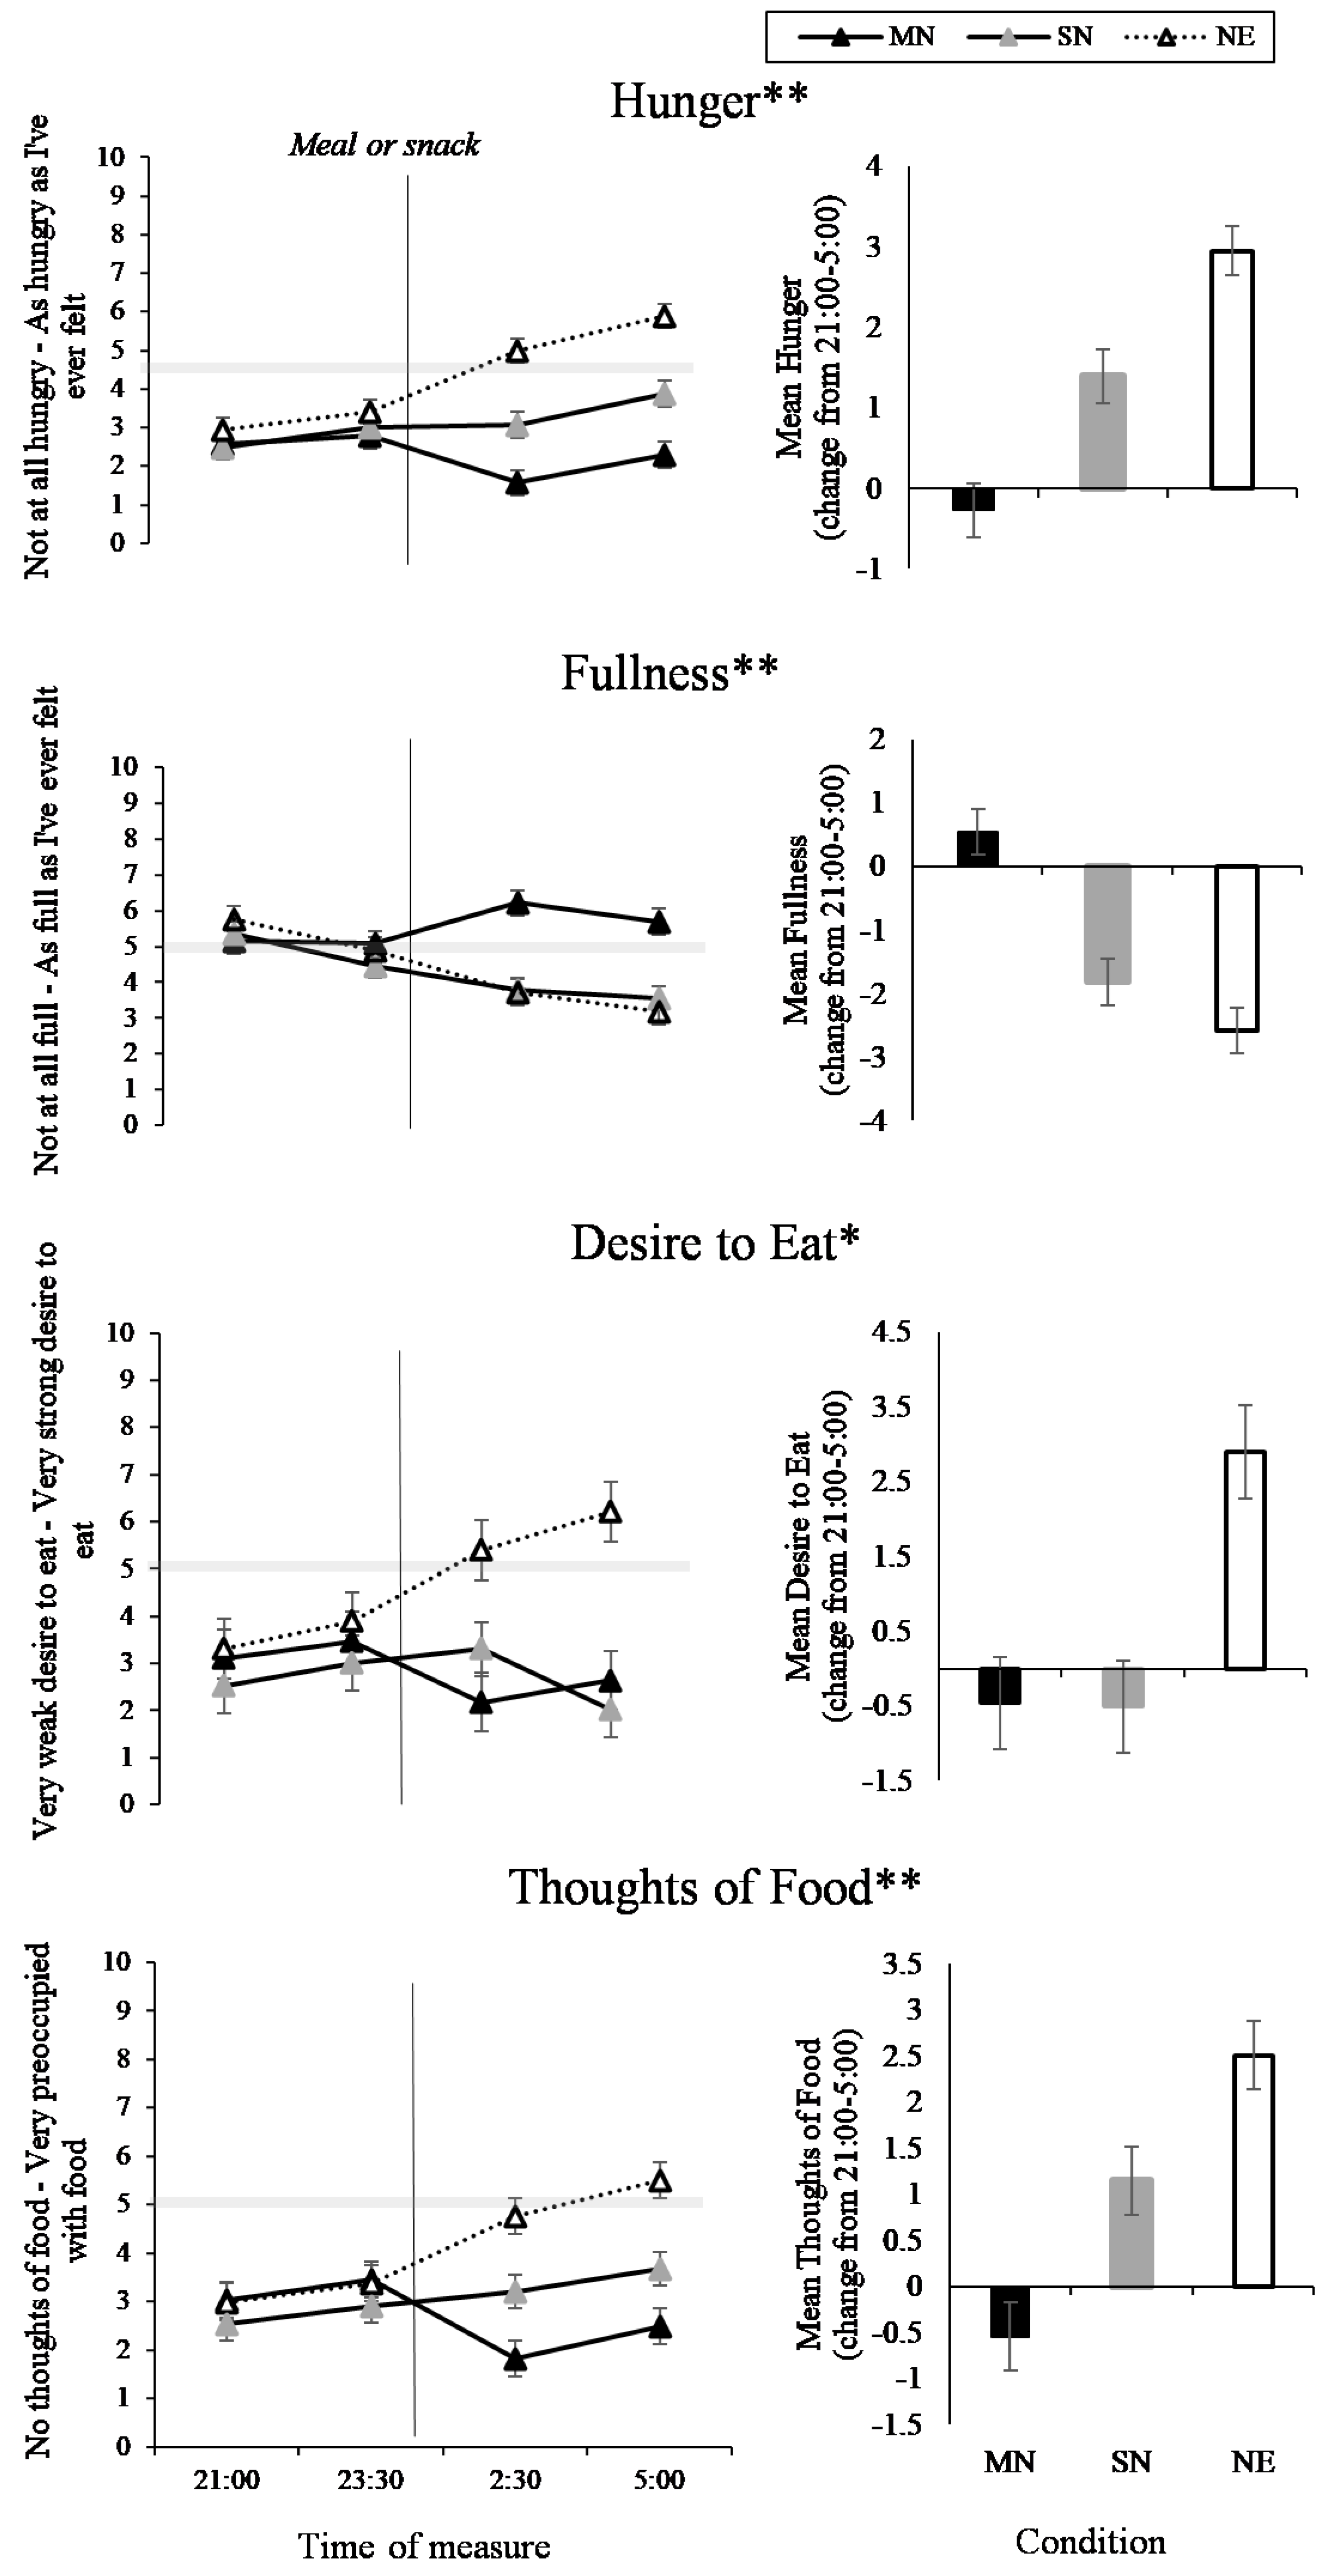
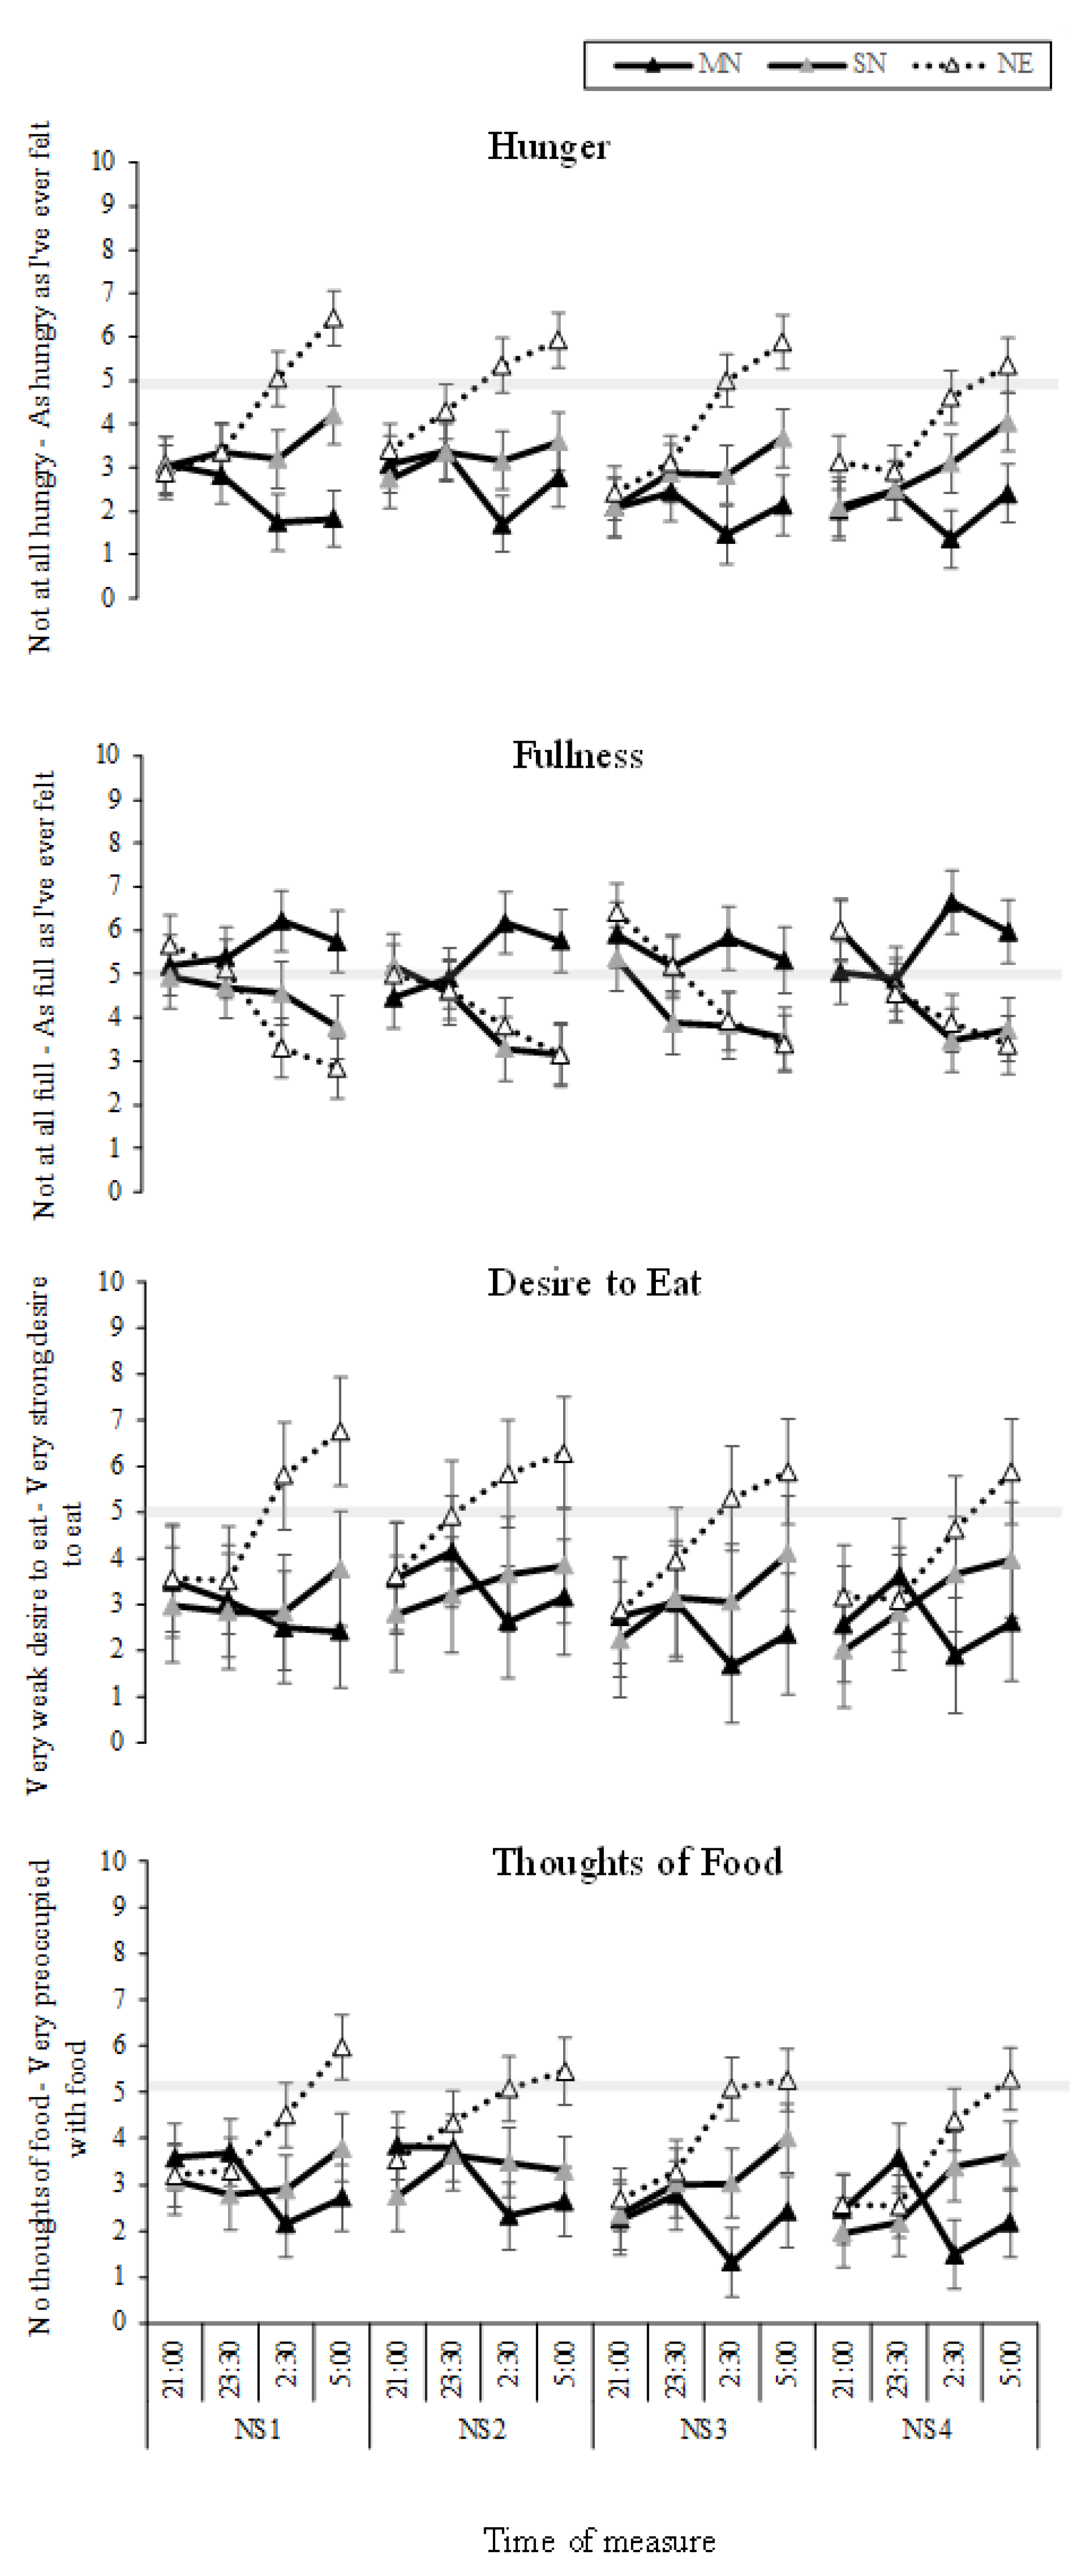
3.2. Food and Hunger
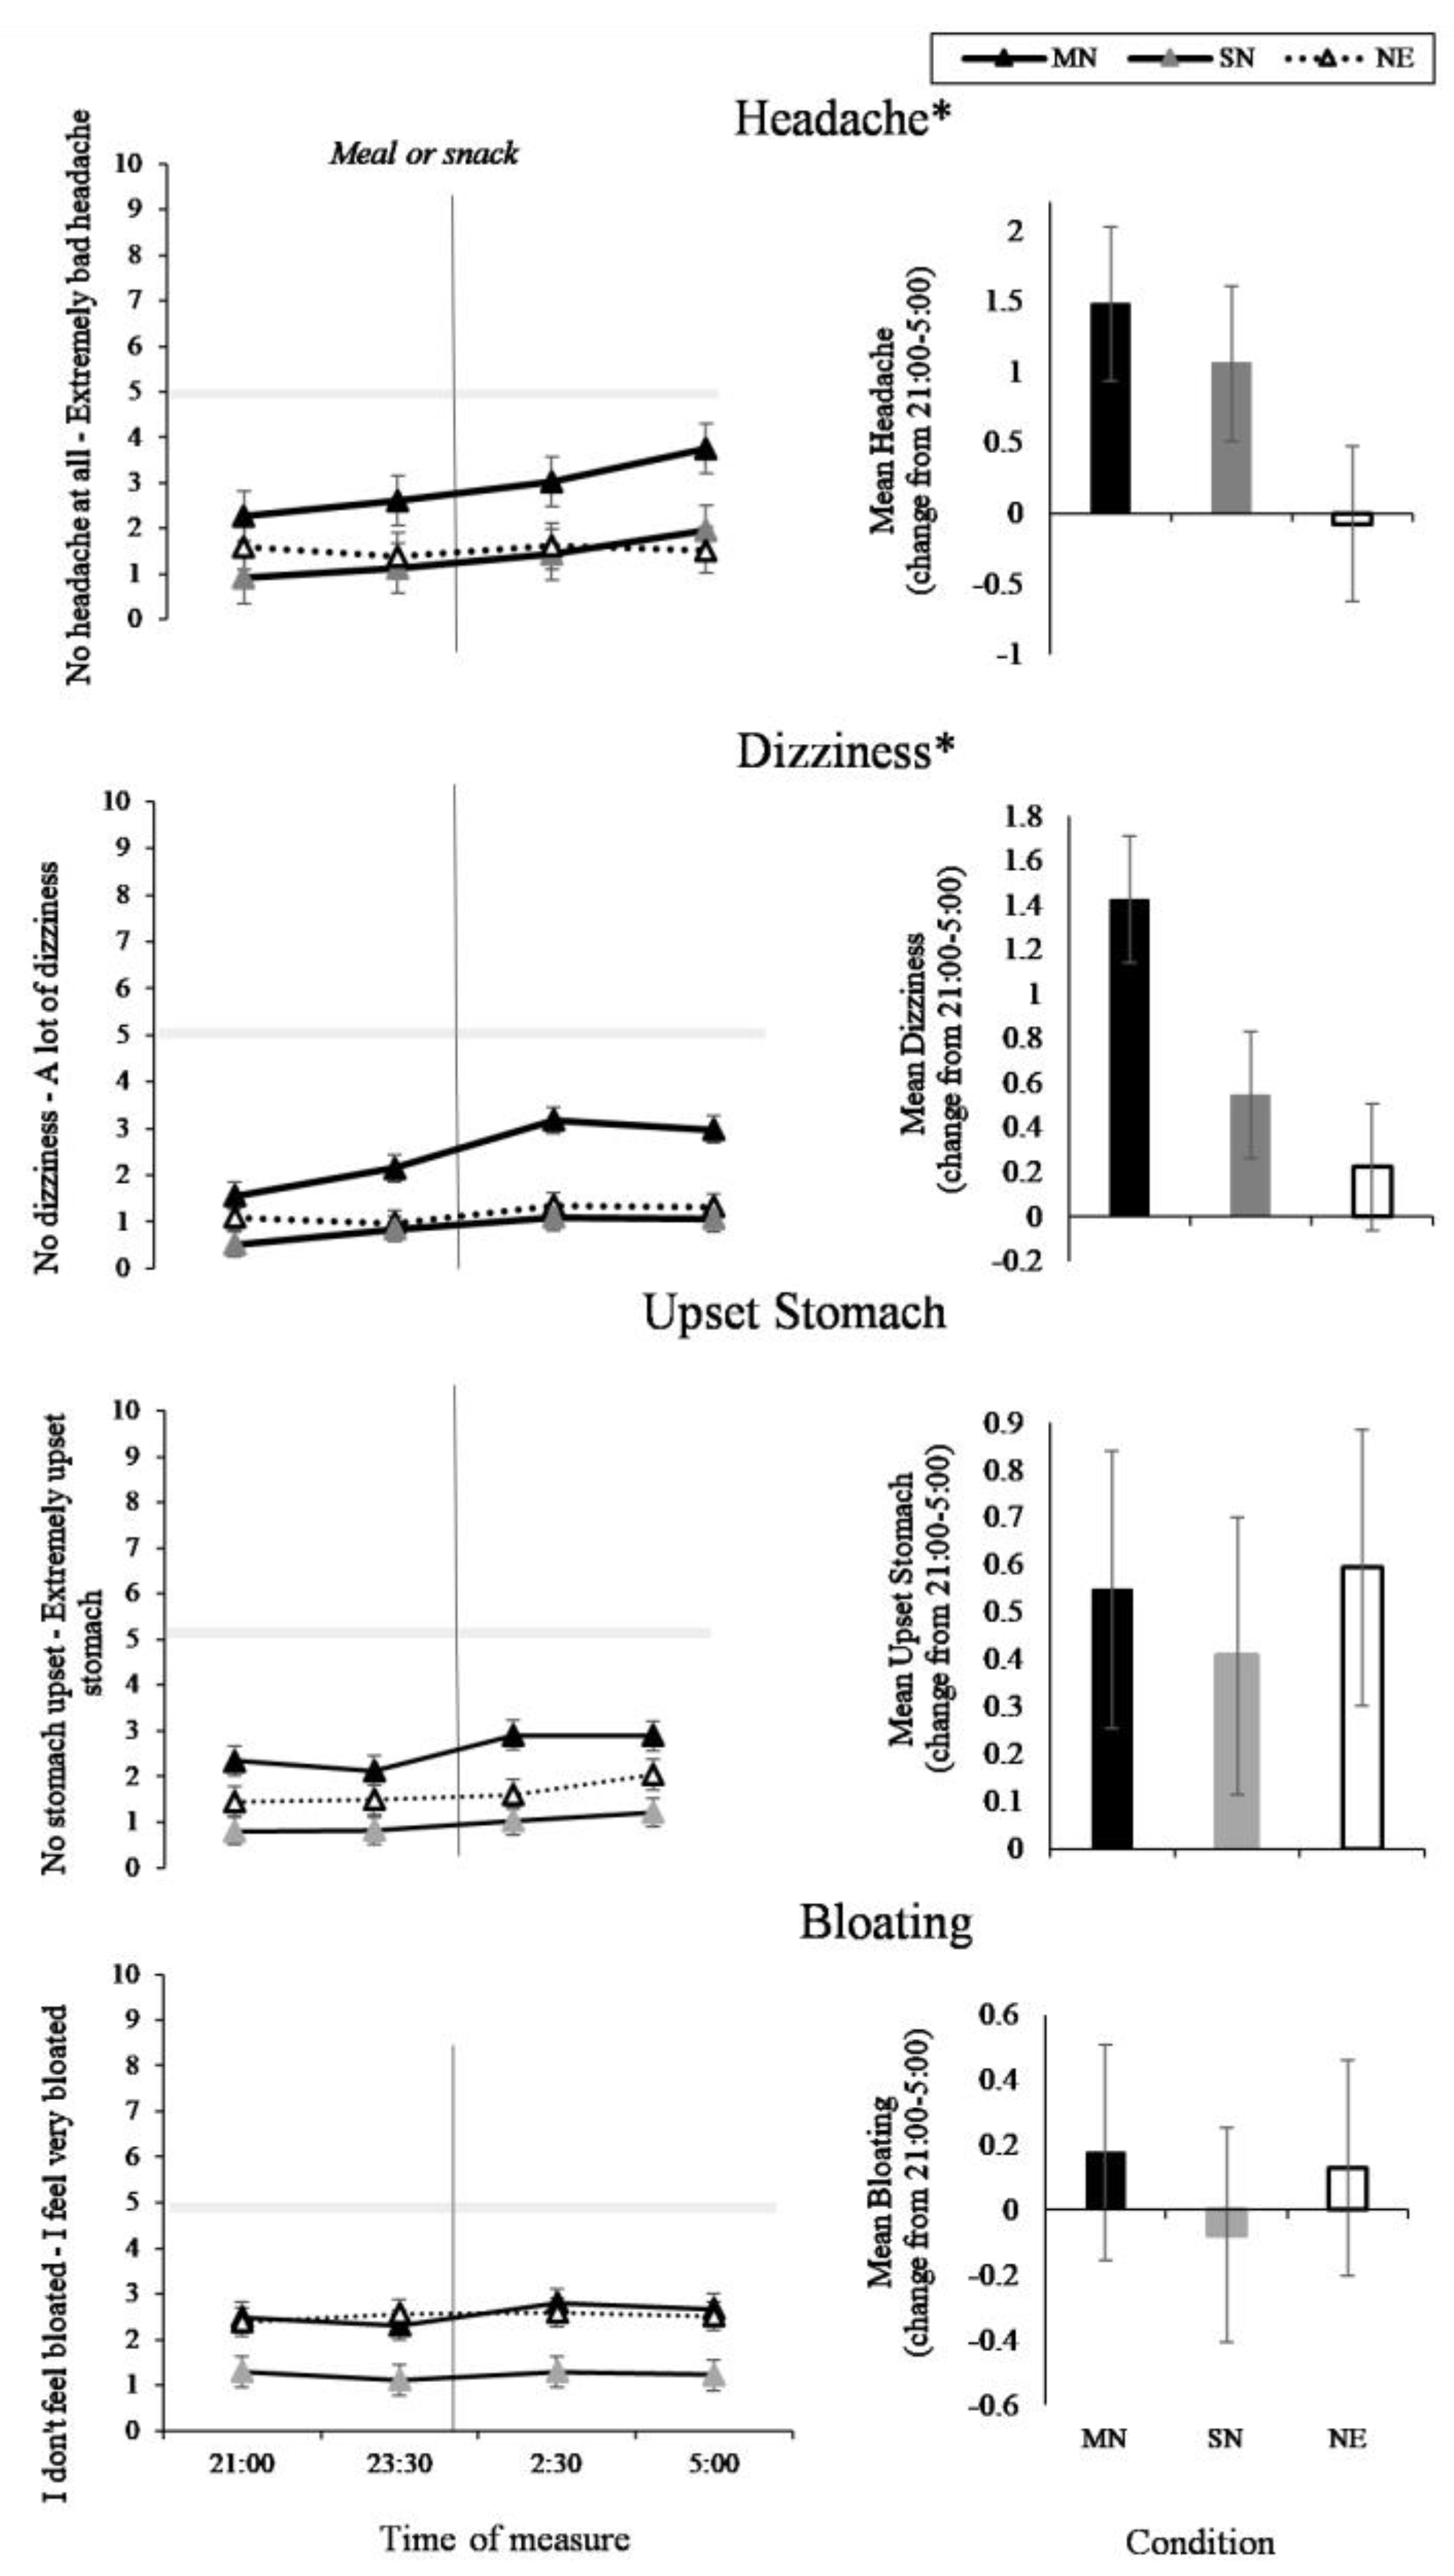
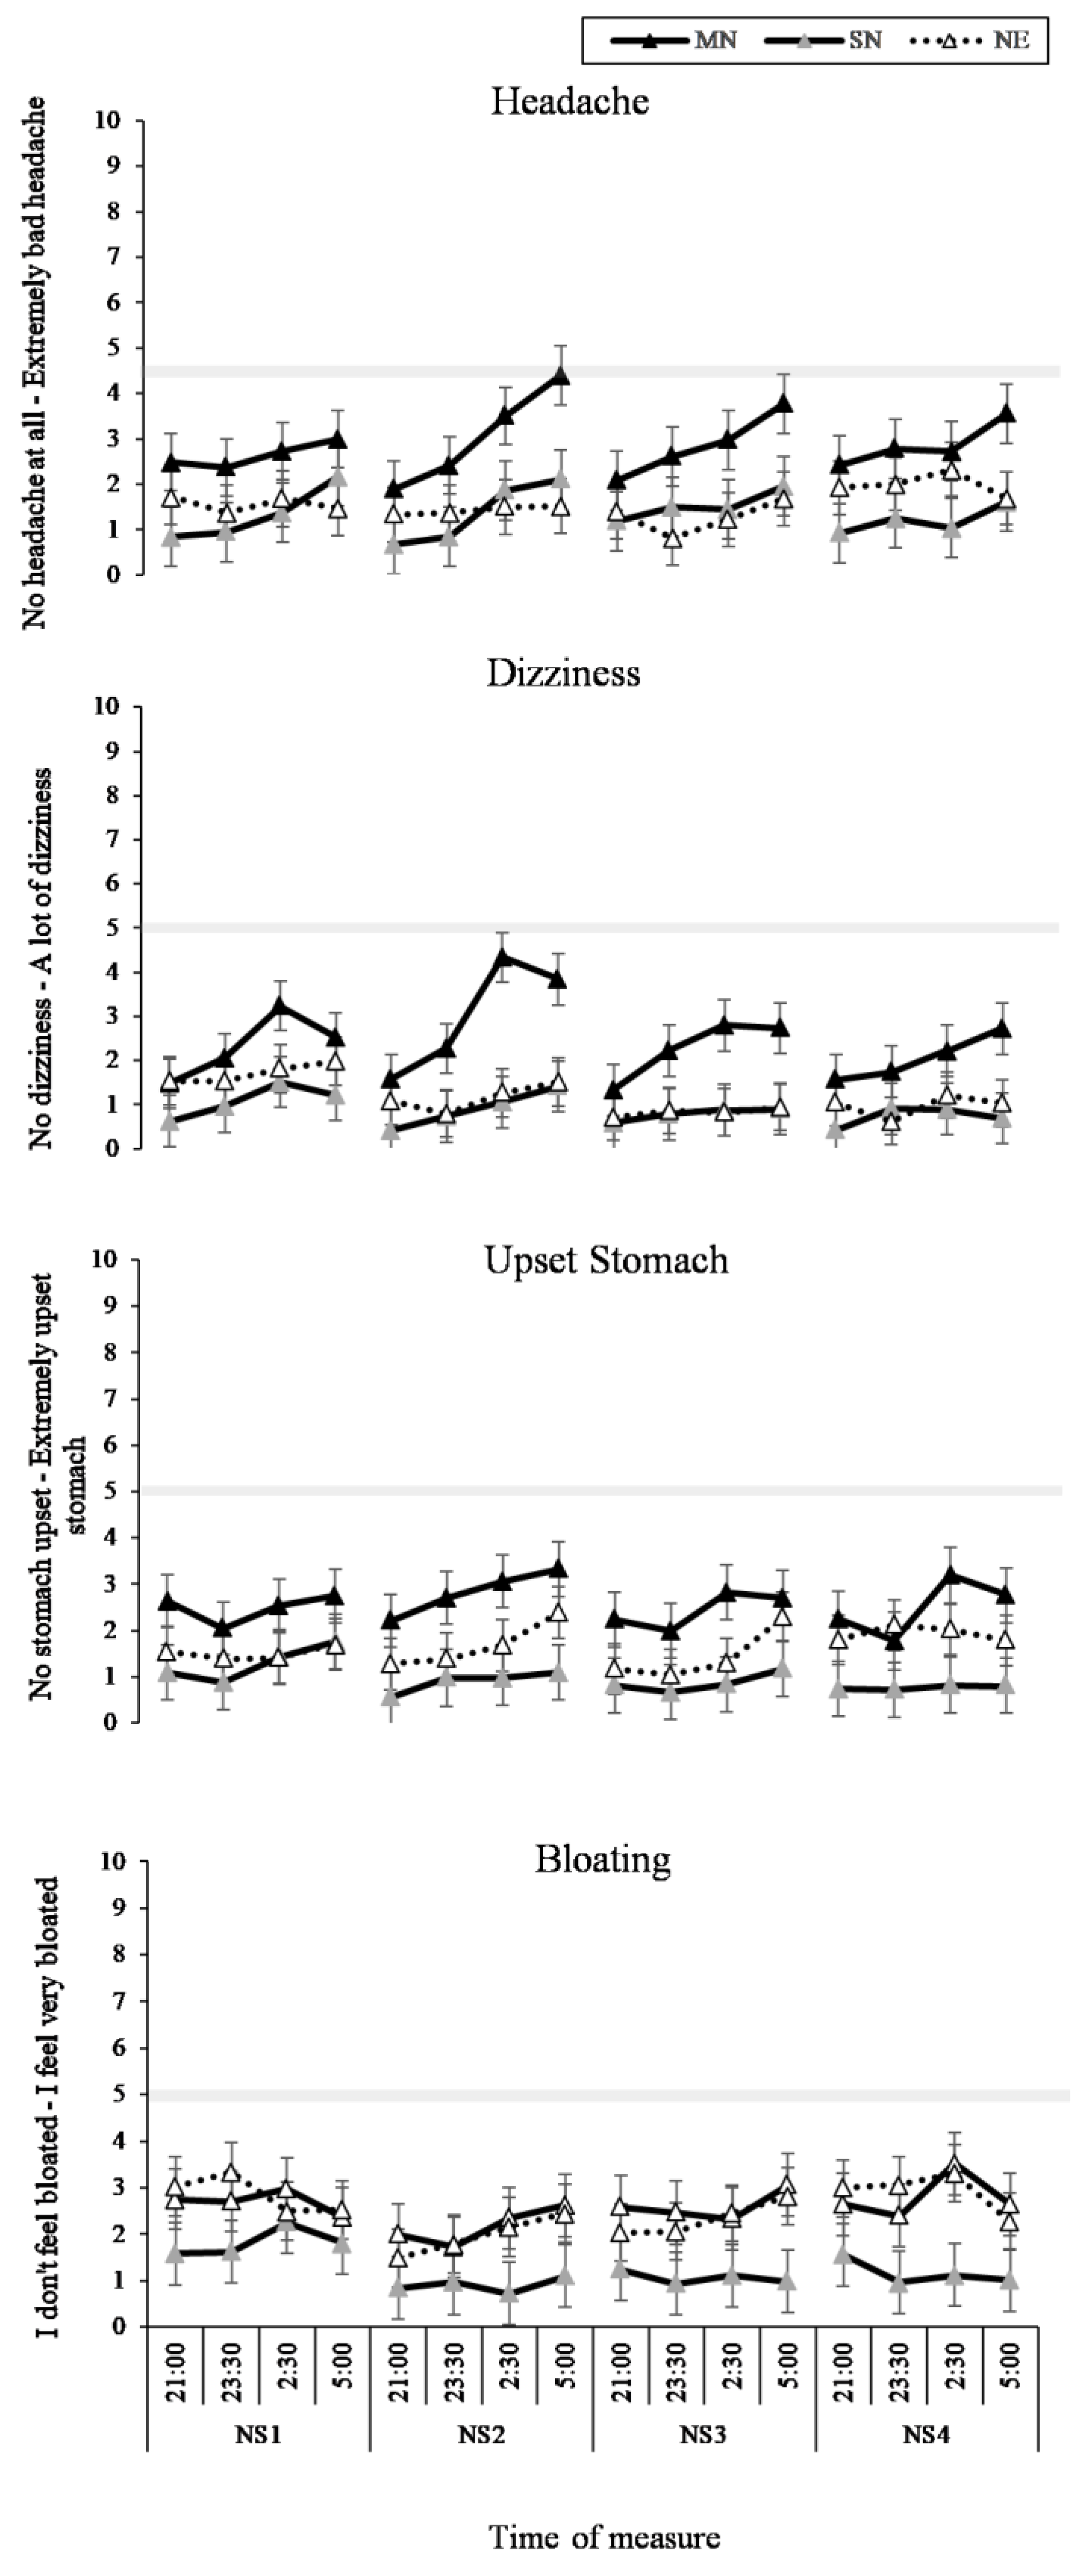
3.3. Headache and GI Symptoms
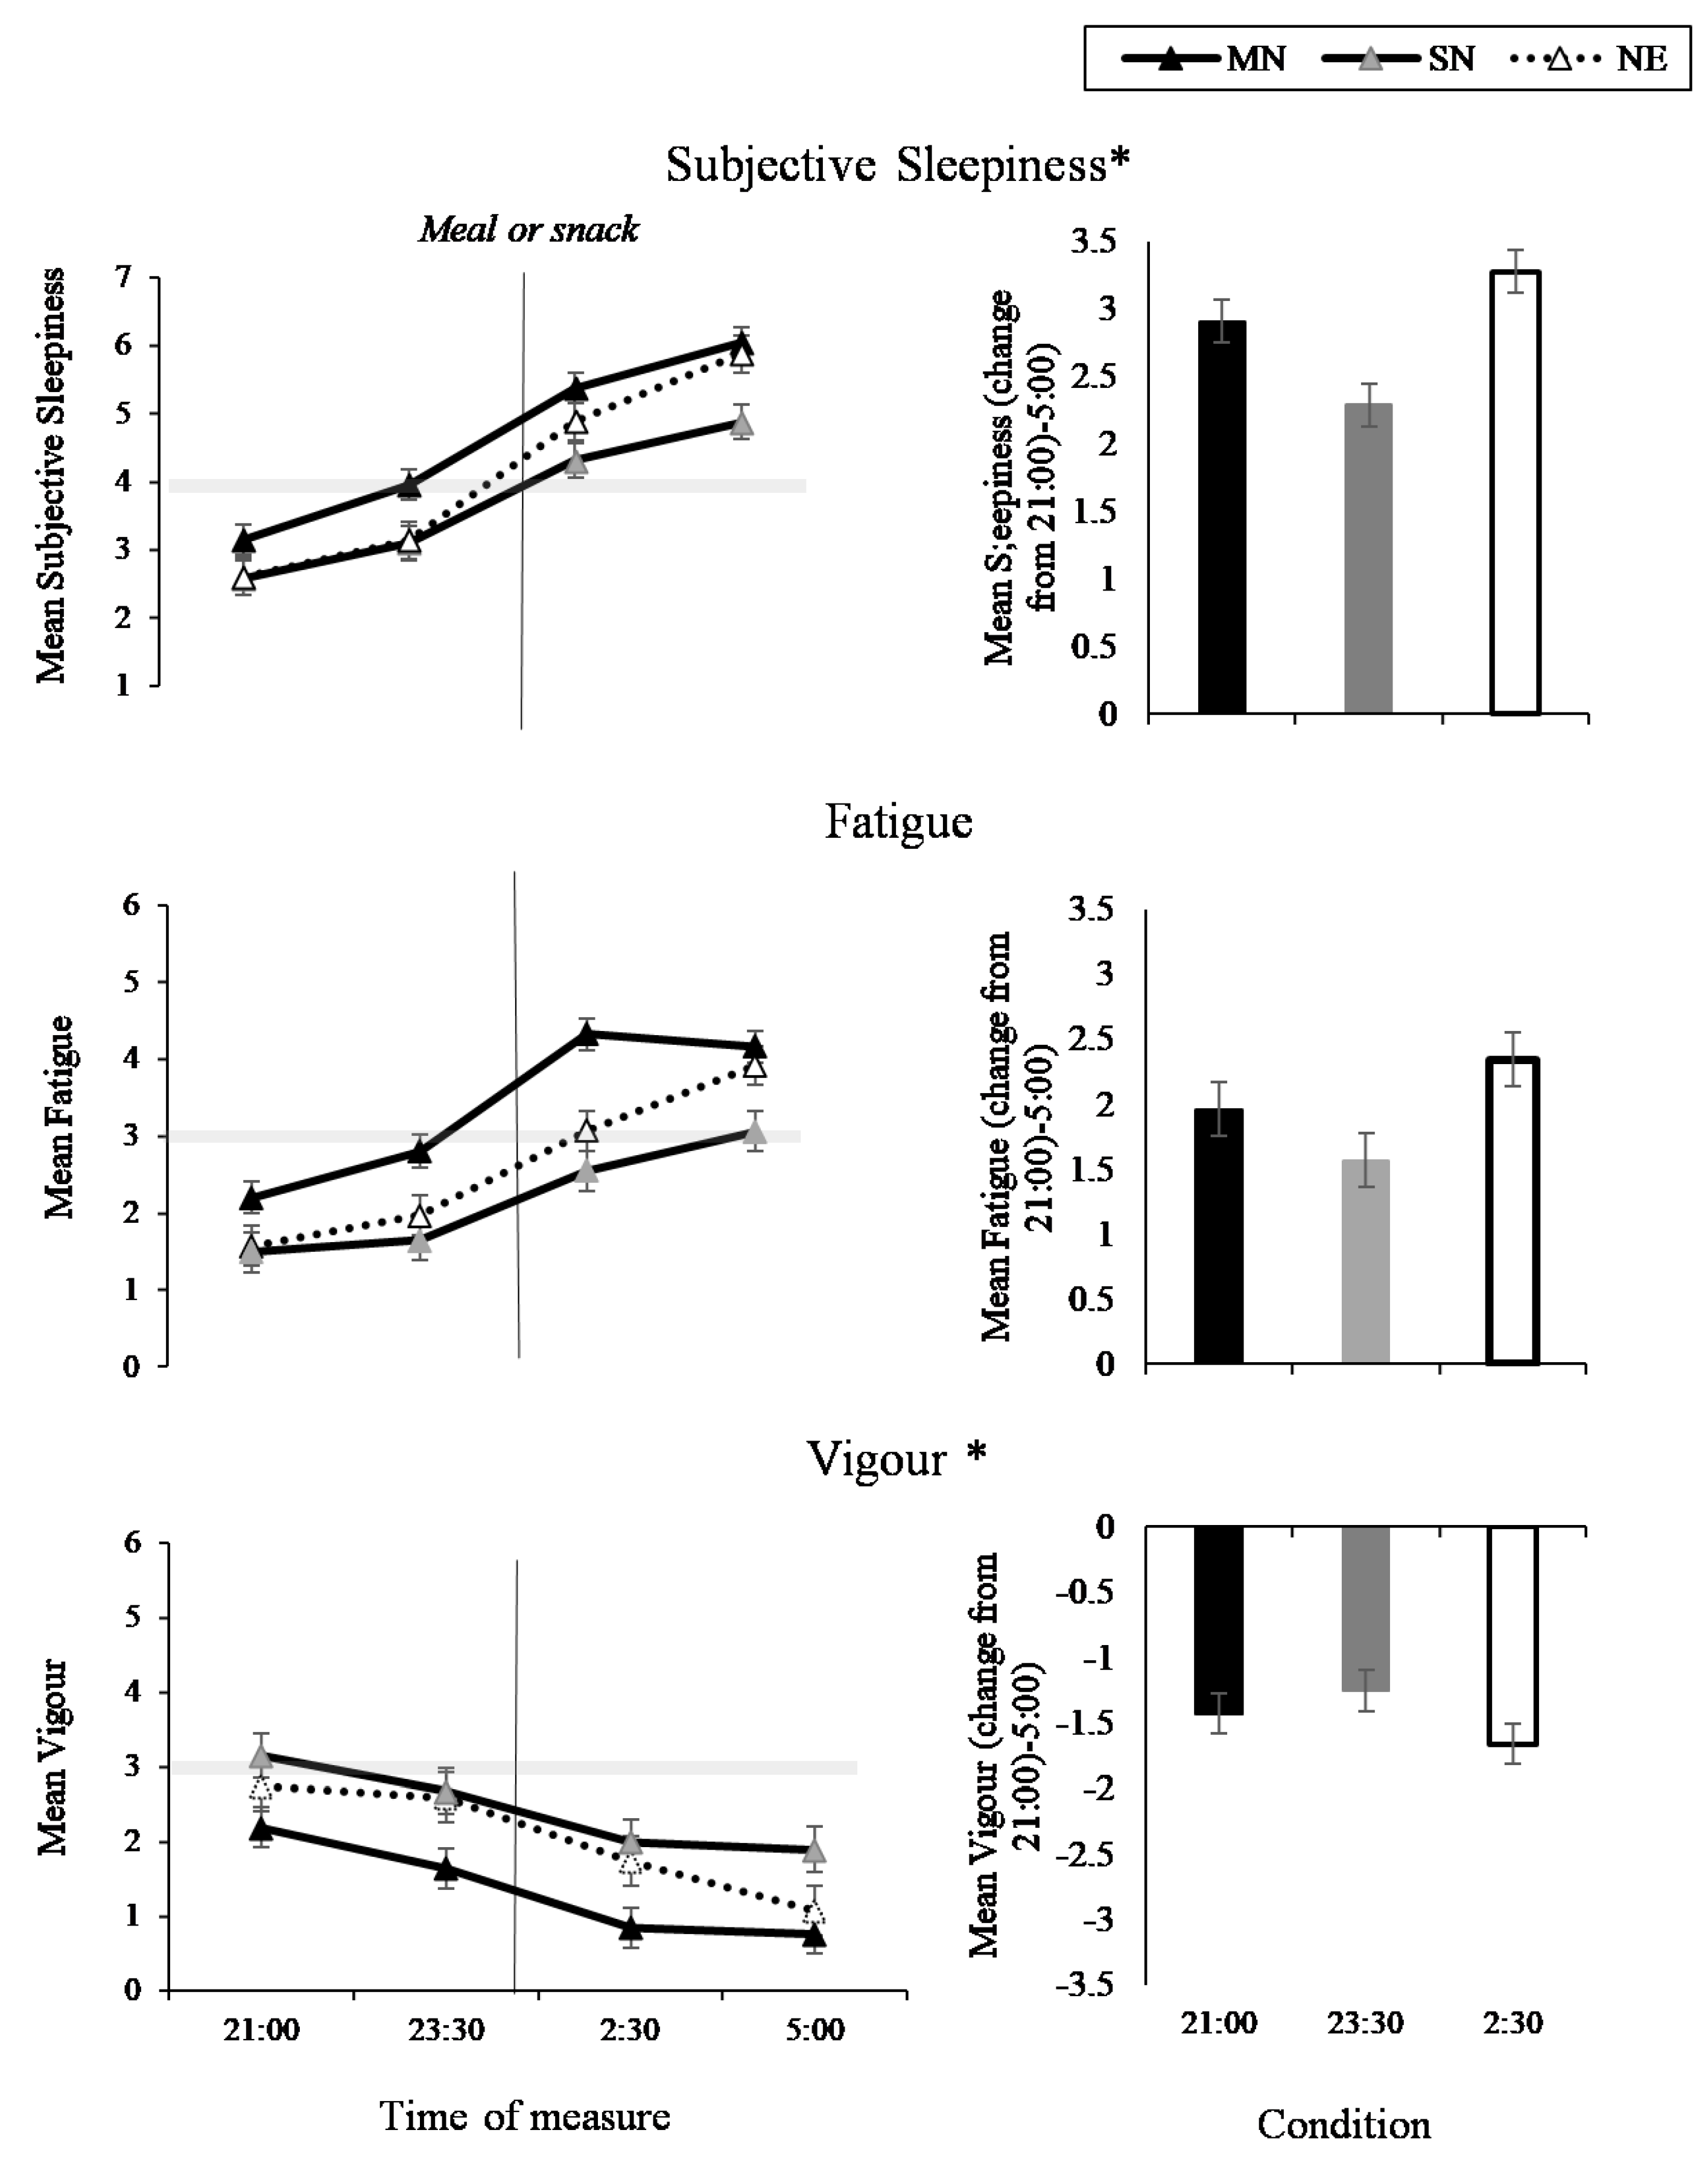
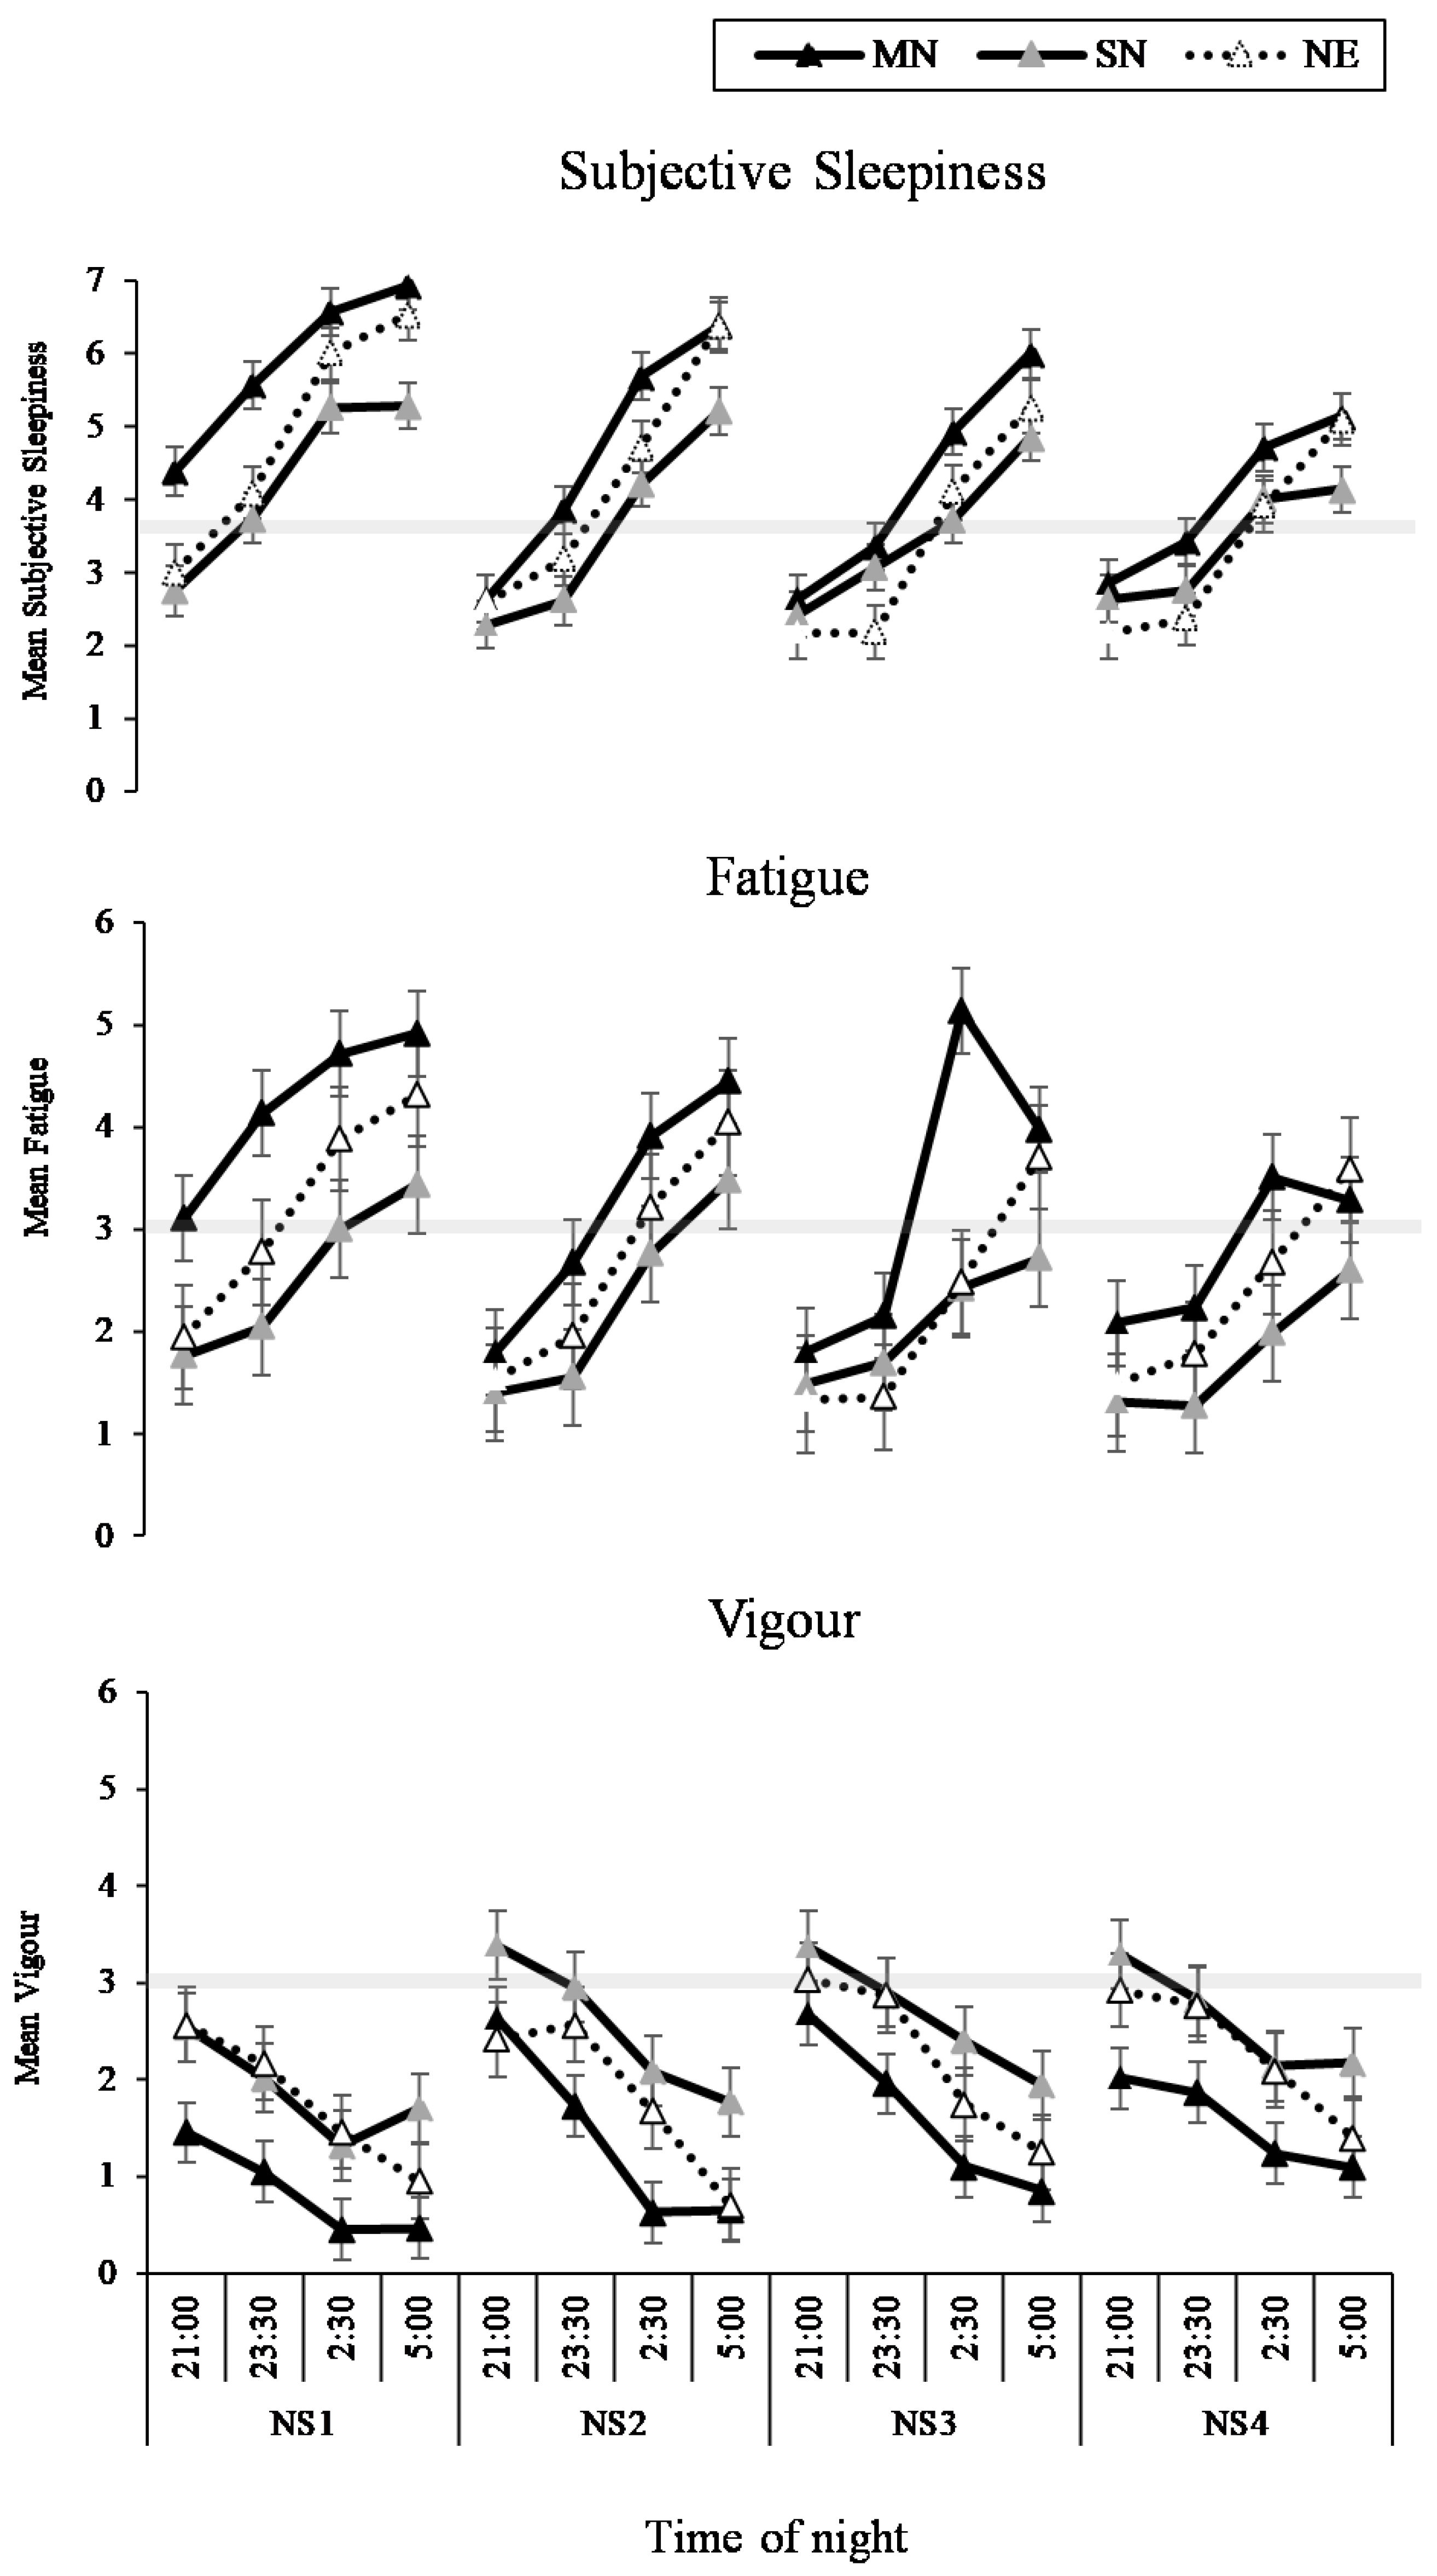
3.4. Sleep and Fatigue
4. Discussion
5. Conclusion
Author Contributions
Funding
Acknowledgments
Conflicts of Interest
References
- Åkerstedt, T. Shift work and disturbed sleep/wakefulness. Occup. Med. 2003, 53, 89–94. [Google Scholar] [CrossRef] [PubMed]
- Åkerstedt, T. Psychological and psychophysiological effects of shift work. Scand. J. Work Environ. Health 1990, 16, 67–73. [Google Scholar] [CrossRef] [PubMed]
- Eastman, C.I.; Martin, S.K. How to use light and dark to produce circadian adaptation to night shift work. Ann. Med. 1999, 31, 87–98. [Google Scholar] [CrossRef] [PubMed]
- Harrington, J.M. Health effects of shift work and extended hours of work. Occup. Environ. Med. 2001, 58, 68–72. [Google Scholar] [CrossRef]
- Sparks, K.; Cooper, C.; Fried, Y.; Shirom, A. The effects of hours of work on health: A meta-analytic review. J. Occup. Organ. Psychol. 1997, 70, 391–408. [Google Scholar] [CrossRef]
- Cavallo, A.; Jaskiewicz, J.; Ris, M.D. Impact of night-float rotation on sleep, mood, and alertness: The resident’s perception. Chronobiol. Int. 2002, 19, 893–902. [Google Scholar] [CrossRef] [PubMed]
- Wirz-Justice, A. Chronobiology and mood disorders. Dialogues Clin. Neurosci. 2003, 5, 315. [Google Scholar] [PubMed]
- Lowden, A.; Moreno, C.; Holmbäck, U.; Lennernäs, M.; Tucker, P. Eating and shift work—Effects on habits, metabolism, and performance. Scand. J. Work Environ. Health 2010, 36, 150–162. [Google Scholar] [CrossRef]
- Waterhouse, J.; Buckley, P.; Edwards, B.; Reilly, T. Measurement of, and some reasons for, differences in eating habits between night and day workers. Chronobiol. Int. 2003, 20, 1075–1092. [Google Scholar] [CrossRef]
- Waterhouse, J.; Minors, D.; Atkinson, G.; Benton, D. Chronobiology and meal times: Internal and external factors. Br. J. Nutr. 1997, 77, S29–S38. [Google Scholar] [CrossRef]
- Gupta, C.C.; Coates, A.M.; Dorrian, J.; Banks, S. The factors influencing the eating behaviour of shiftworkers: What, when, where and why. Ind. Health 2018. [Google Scholar] [CrossRef] [PubMed]
- Leech, R.M.; Timperio, A.; Livingstone, K.M.; Worsley, A.; McNaughton, S.A. Temporal eating patterns: Associations with nutrient intakes, diet quality, and measures of adiposity. Am. J. Clin. Nutr. 2017, 106, 1121–1130. [Google Scholar] [CrossRef]
- Yoshizaki, T.; Kawano, Y.; Noguchi, O.; Onishi, J.; Teramoto, R.; Sunami, A.; Yokoyama, Y.; Tada, Y.; Hida, A.; Togo, F. Association of eating behaviours with diurnal preference and rotating shift work in japanese female nurses: A cross-sectional study. BMJ Open 2016, 6, e011987. [Google Scholar] [CrossRef] [PubMed]
- Strzemecka, J.; Bojar, I.; Strzemecka, E.; Owoc, A. Dietary habits among persons hired on shift work. Ann. Agric. Environ. Med. 2014, 21, 128–131. [Google Scholar] [PubMed]
- Reeves, S.; Newling-Ward, E.; Gissane, C. The effect of shift-work on food intake and eating habits. Nutr. Food Sci. 2004, 34, 216–221. [Google Scholar] [CrossRef]
- Gander, P.H.; Gregory, K.B.; Connell, L.J.; Graeber, R.C.; Miller, D.L.; Rosekind, M.R. Flight crew fatigue iv: Overnight cargo operations. Aviat. Space Environ. Med. 1998, 69, B26. [Google Scholar] [PubMed]
- Haus, E.; Reinberg, A.; Mauvieux, B.; Le Floc’h, N.; Sackett-Lundeen, L.; Touitou, Y. Risk of obesity in male shift workers: A chronophysiological approach. Chronobiol. Int. 2016, 33, 1018–1036. [Google Scholar] [CrossRef]
- Holmes, S.M.; Power, M.L.; Walter, C.K. A motor carrier wellness program: Development and testing. Transp. J. 1996, 35, 33–48. [Google Scholar]
- Goo, R.; Moore, J.; Greenberg, E.; Alazraki, N. Circadian variation in gastric emptying of meals in humans. Gastroenterology 1987, 93, 515–518. [Google Scholar] [CrossRef]
- Pati, A.K.; Chandrawanshi, A.; Reinberg, A. Shift work: Consequences and management. Curr. Sci. 2001, 32–52. [Google Scholar]
- Van Cauter, E.; Shapiro, E.T.; Tillil, H.; Polonsky, K.S. Circadian modulation of glucose and insulin responses to meals: Relationship to cortisol rhythm. Am. J. Physiol. Endocrinol. Metab. 1992, 262, E467–E475. [Google Scholar] [CrossRef] [PubMed]
- Costa, G. The impact of shift and night work on health. Appl. Ergon. 1996, 27, 9–16. [Google Scholar] [CrossRef]
- Geliebter, A.; Gluck, M.E.; Tanowitz, M.; Aronoff, N.J.; Zammit, G.K. Work-shift period and weight change. Nutrition 2000, 16, 27–29. [Google Scholar] [CrossRef]
- Knutsson, A.; Bøggild, H. Gastrointestinal disorders among shift workers. Scand. J. Work Environ. Health 2010, 53, 85–95. [Google Scholar] [CrossRef]
- Perrin, S.L.; Dorrian, J.; Gupta, C.; Centofanti, S.; Coates, A.; Marx, L.; Beyne, K.; Banks, S. Timing of australian flight attendant food and beverage while crewing: A preliminary investigation. Ind. Health 2018. [Google Scholar] [CrossRef]
- Nyberg, M.; Lennernäs Wiklund, M. Impossible meals? The food and meal situation of flight attendants in Scandinavia—A qualitative interview study. Appetite 2017, 113, 162–171. [Google Scholar] [CrossRef] [PubMed]
- Persson, M.; Mårtensson, J. Situations influencing habits in diet and exercise among nurses working night shift. J. Nurs. Manag. 2006, 14, 414–423. [Google Scholar] [CrossRef]
- Grant, C.; Coates, A.; Dorrian, J.; Kennaway, D.; Wittert, G.; Heilbronn, L.; Pajcin, M.; Della Vedova, C.; Gupta, C.; Banks, S. Eating on simulated night shift effects glucose response to breakfast: Pilot study. FASEB J. 2016, 34, 1003–1013. [Google Scholar]
- Centofanti, S.; Dorrian, J.; Hilditch, C.; Grant, C.; Coates, A.; Banks, S. Eating on nightshift: A big vs small snack impairs glucose response to breakfast. Neurobiol. Sleep Circadian Rhythm. 2017, 4, 44–48. [Google Scholar] [CrossRef]
- Leung, G.K.; Huggins, C.E.; Bonham, M. Effect of meal timing on postprandial glucose responses to a low glycemic index meal: A crossover trial in healthy volunteers. Clin. Nutr. 2017, 38, 465–471. [Google Scholar] [CrossRef]
- Gupta, C.; Dorrian, J.; Grant, C.; Pajcin, M.; Coates, A.M.; Kennaway, D.J.; Wittert, G.A.; Heilbronn, L.K.; Della Vedova, C.B.; Banks, S. It’s not just what you eat but when: The impact of eating a meal during simulated shift work on driving performance. Chronobiol. Int. 2016, 34, 66–77. [Google Scholar] [CrossRef] [PubMed]
- Grant, C.; Dorrian, J.; Coates, A.M.; Pajcin, M.; Kennaway, D.J.; Wittert, G.A.; Heilbronn, L.K.; Della Vedova, C.; Gupta, C.C.; Banks, S. The impact of meal timing on performance, sleepiness, gastric upset, and hunger during simulated night shift. Ind. Health 2017, 55, 423–436. [Google Scholar] [CrossRef] [PubMed]
- Scheer, F.A.; Morris, C.J.; Shea, S.A. The internal circadian clock increases hunger and appetite in the evening independent of food intake and other behaviors. Obesity 2013, 21, 421–423. [Google Scholar] [CrossRef] [PubMed]
- Anstey, S.; Tweedie, J.; Lord, B. Qualitative study of queensland paramedics’ perceived influences on their food and meal choices during shift work. Nutr. Diet. 2016, 73, 43–49. [Google Scholar] [CrossRef]
- Novak, R.D.; Auvil-Novak, S.E. Focus group evaluation of night nurse shiftwork difficulties and coping strategies. Chronobiol. Int. 1996, 13, 457–463. [Google Scholar] [CrossRef]
- Chung, F.; Abdullah, H.R.; Liao, P. Stop-bang questionnaire: A practical approach to screen for obstructive sleep apnea. Chest 2016, 149, 631–638. [Google Scholar] [CrossRef] [PubMed]
- Netzer, N.C.; Stoohs, R.A.; Netzer, C.M.; Clark, K.; Strohl, K.P. Using the berlin questionnaire to identify patients at risk for the sleep apnea syndrome. Ann. Intern. Med. 1999, 131, 485–491. [Google Scholar] [CrossRef]
- Baker, F.C.; Driver, H.S. Circadian rhythms, sleep, and the menstrual cycle. Sleep Med. 2007, 8, 613–622. [Google Scholar] [CrossRef]
- Solomon, S.J.; Kurzer, M.S.; Calloway, D.H. Menstrual cycle and basal metabolic rate in women. Am. J. Clin. Nutr. 1982, 36, 611–616. [Google Scholar] [CrossRef]
- Faul, F.; Erdfelder, E.; Lang, A.-G.; Buchner, A. G* power 3: A flexible statistical power analysis program for the social, behavioral, and biomedical sciences. Behav. Res. Methods 2007, 39, 175–191. [Google Scholar] [CrossRef]
- Harris, J.A.; Benedict, F.G. A biometric study of human basal metabolism. Proc. Natl. Acad. Sci. USA 1918, 4, 370–373. [Google Scholar] [CrossRef] [PubMed]
- Thorne, D.R.; Genser, S.G.; Sing, H.C.; Hegge, F.W. The walter reed performance assessment battery. Neurobehav. Toxicol. Teratol. 1985, 7, 415–418. [Google Scholar] [PubMed]
- Hoddes, E.; Zarcone, V.; Smythe, H.; Phillips, R.; Dement, W. Quantification of sleepiness: A new approach. Psychophysiology 1973, 10, 431–436. [Google Scholar] [CrossRef] [PubMed]
- Johnson, D.R.; Vincent, A.S.; Johnson, A.E.; Gilliland, K.; Schlegel, R.E. Reliability and construct validity of the automated neuropsychological assessment metrics (ANAM) mood scale. Arch. Clin. Neuropsychol. 2008, 23, 73–85. [Google Scholar] [CrossRef] [PubMed]
- Rechtschaffen, A. A manual for standardized terminology, techniques and scoring system for sleep stages in human subjects. Brain Inf. Serv. 1968, 20, 246. [Google Scholar]
- Van Dongen, H.; Maislin, G.; Mullington, J.M.; Dinges, D.F. The cumulative cost of additional wakefulness: Dose-response effects on neurobehavioral functions and sleep physiology from chronic sleep restriction and total sleep deprivation. Sleep 2003, 26, 117–126. [Google Scholar] [CrossRef]
- Knutson, K.L.; Spiegel, K.; Penev, P.; Van Cauter, E. The metabolic consequences of sleep deprivation. Sleep Med Rev. 2007, 11, 163–178. [Google Scholar] [CrossRef] [PubMed]
- Mistlberger, R.E. Neurobiology of food anticipatory circadian rhythms. Physiol. Behav. 2011, 104, 535–545. [Google Scholar] [CrossRef]
- Omisade, A.; Buxton, O.M.; Rusak, B. Impact of acute sleep restriction on cortisol and leptin levels in young women. Physiol. Behav. 2010, 99, 651–656. [Google Scholar] [CrossRef]
- Spiegel, K.; Leproult, R.; Van Cauter, E. Impact of sleep debt on metabolic and endocrine function. Lancet 1999, 354, 1435–1439. [Google Scholar] [CrossRef]
- Heath, G.; Roach, G.D.; Dorrian, J.; Ferguson, S.A.; Darwent, D.; Sargent, C. The effect of sleep restriction on snacking behaviour during a week of simulated shiftwork. Accid. Anal. Prev. 2012, 45, 62–67. [Google Scholar] [CrossRef] [PubMed]
- Akerstedt, T. Work hours, sleepiness and the underlying mechanisms. J. Sleep Res. 1995, 4, 15–22. [Google Scholar] [CrossRef] [PubMed]
- Sahu, S.; Dey, M. Changes in food intake pattern of nurses working in rapidly rotating shift. Al Ameen J. Med. Sci. 2011, 4, 14–22. [Google Scholar]
- Bonnell, E.K.; Huggins, C.E.; Huggins, C.T.; McCaffrey, T.A.; Palermo, C.; Bonham, M.P. Influences on dietary choices during day versus night shift in shift workers: A mixed methods study. Nutrients 2017, 9, 193. [Google Scholar] [CrossRef] [PubMed]
- Lloyd, H.M.; Green, M.W.; Rogers, P.J. Mood and cognitive performance effects of isocaloric lunches differing in fat and carbohydrate content. Physiol. Behav. 1994, 56, 51–57. [Google Scholar] [CrossRef]
- Spring, B.; Maller, O.; Wurtman, J.; Digman, L.; Cozolino, L. Effects of protein and carbohydrate meals on mood and performance: Interactions with sex and age. J. Psychiatr. Res. 1982, 17, 155–167. [Google Scholar] [CrossRef]
- Spring, B.; Chiodo, J.; Bowen, D.J. Carbohydrates, tryptophan, and behavior: A methodological review. Psychol. Bull. 1987, 102, 234. [Google Scholar] [CrossRef] [PubMed]
- Borbély, A.A. A two process model of sleep regulation. Hum. Neurobiol. 1982, 1, 195–204. [Google Scholar] [PubMed]
- Zadeh, R.; Shepley, M.; Sadatsafavi, H.; Owora, A.H.; Krieger, A.C. Alert workplace from healthcare workers’ perspective: Behavioral and environmental strategies to improve vigilance and alertness in healthcare settings. Herd: Health Environ. Res. Des. J. 2018, 11, 72–88. [Google Scholar] [CrossRef]
- Baba, M.D.; Darina Indah Daruis, D.; Nuhmandeen, B. A survey on sleeping patterns and fatigue among pilots in South East Asia. Appl. Mech. Mater. 2011, 58–60, 715–721. [Google Scholar] [CrossRef]
- Spiegel, K.; Knutson, K.; Leproult, R.; Tasali, E.; Cauter, E. Sleep loss: A novel risk factor for insulin resistance and type 2 diabetes. J. Appl. Physiol. 2005, 99, 2008–2019. [Google Scholar] [CrossRef] [PubMed]
- Bøggild, H.; Knutsson, A. Shift work, risk factors and cardiovascular disease. Scand. J. Work Environ. Health 1999, 25, 85–99. [Google Scholar] [CrossRef] [PubMed]
- Knutsson, A. Health disorders of shift workers. Occup. Med. 2003, 53, 103–108. [Google Scholar] [CrossRef] [PubMed]
- Banks, S.; Dorrian, J.; Grant, C.; Coates, A. Circadian misalignment and metabolic consequences: Shiftwork and altered meal times. In Modulation of Sleep by Obesity, Diabetes, Age, and Diet; Elsevier: Amsterdam, The Netherlands, 2015; pp. 155–164. [Google Scholar]
- Åkerstedt, T.; Wright, K.P. Sleep loss and fatigue in shift work and shift work disorder. Sleep Med. Clin. 2009, 4, 257–271. [Google Scholar] [CrossRef] [PubMed]
- Barger, L.K.; Lockley, S.W.; Rajaratnam, S.M.; Landrigan, C.P. Neurobehavioral, health, and safety consequences associated with shift work in safety-sensitive professions. Curr. Neurol. Neurosci. Rep. 2009, 9, 155–164. [Google Scholar] [CrossRef]
- Malhi, G.; Kuiper, S. Chronobiology of mood disorders. Acta Psychiatr. Scand. 2013, 128, 2–15. [Google Scholar] [CrossRef]
- Kräuchi, H.; Nussbaum, P.; VVirz-Justice, A. Consumption of Sweets and Caffeine in the Night Shift: Relation to Fatigue; Pontengel Press: Basel, Switzerland, 1990. [Google Scholar]
- Schweitzer, P.K.; Randazzo, A.C.; Stone, K.; Erman, M.; Walsh, J.K. Laboratory and field studies of naps and caffeine as practical countermeasures for sleep-wake problems associated with night work. Sleep 2006, 29, 39–50. [Google Scholar] [CrossRef]
- Higdon, J.V.; Frei, B. Coffee and health: A review of recent human research. Crit. Rev. Food Sci. Nutr. 2006, 46, 101–123. [Google Scholar] [CrossRef]
- Tilg, H.; Kaser, A. Gut microbiome, obesity, and metabolic dysfunction. J. Clin. Investig. 2011, 121, 2126–2132. [Google Scholar] [CrossRef]


| Eating Condition | Time of Measure | Nightshift | Eating Condition* Time of Measure | Eating Condition* Nightshift | Eating Condition* Time of Measure* Nightshift | |||||||
|---|---|---|---|---|---|---|---|---|---|---|---|---|
| F(df) | p | F(df) | p | F(df) | p | F(df) | p | F(df) | p | F(df) | p | |
| Food and Hunger | ||||||||||||
| Hunger | 4.95(2, 41.07) | 0.12 | 19.58(3, 626.15) | <0.001 | 3.99(3, 626.27) | 0.01 | 15.85(6, 626.15) | <0.001 | 0.33(6, 626.27) | 0.92 | 0.41(18, 626.15) | 0.99 |
| Fullness | 1.80(2, 41.09) | 0.18 | 15.78(3, 627.16) | <0.001 | 0.86(3, 627.26) | 0.46 | 12.16(6, 627.16) | <0.001 | 0.41(9, 627.26) | 0.87 | 0.58(18, 627.16) | 0.92 |
| Desire to Eat | 4.08(2, 41.16) | 0.02 | 1.06(3, 627.46) | 0.37 | 0.22(3, 627.90) | 0.88 | 3.80(6, 627.46) | 0.01 | 1.46(6, 627.91) | 0.19 | 1.08(18, 627.47) | 0.37 |
| Thoughts of Food | 2.15(2, 41.03) | 0.13 | 9.72(3, 627.09) | <0.001 | 4.34(3, 627.19) | 0.01 | 13.71(6, 627.09) | <0.001 | 0.67(6, 627.19) | 0.67 | 0.42(18, 627.10) | 0.98 |
| Headache and Gastrointestinal Symptoms | ||||||||||||
| Headache | 2.73(2, 41.01) | 0.08 | 10.59(3, 630.05) | <0.001 | 0.20(3, 630.11) | 0.90 | 3.06(6, 630.05) | 0.01 | 1.24(6, 630.11) | 0.01 | 0.45(18, 630.05) | 0.98 |
| Dizziness | 3.81(2, 41.07) | 0.03 | 11.87(3, 630.11) | <0.001 | 6.41(3, 630.19) | <0.001 | 3.39(6, 630.12) | 0.003 | 2.33(6, 630.19) | 0.03 | 0.39(18, 630.12) | 0.99 |
| Upset Stomach | 3.21(2, 41.02) | 0.05 | 5.87(3, 627.07) | <0.001 | 0.98(3, 627.14) | 0.40 | 0.55(6, 627.07) | 0.77 | 1.37(6, 627.14) | 0.23 | 0.41(18, 627.07) | 0.99 |
| Bloating | 1.98(2, 41.02) | 0.15 | 0.62(3, 629.06) | 0.60 | 8.90(3, 629.11) | <0.001 | 0.50(6, 629.06) | 0.81 | 0.85(6, 629.11) | 0.53 | 0.65(18, 629.06) | 0.86 |
| Sleep and Fatigue | ||||||||||||
| Subjective Sleepiness | 4.50(2, 40.90) | 0.02 | 359.94(3, 596.06) | <0.001 | 80.35(3, 596.10) | <0.001 | 4.12(6, 596.05) | <0.001 | 3.37(6, 596.09) | <0.01 | 0.83(18, 596.06) | 0.66 |
| Fatigue | 6.01(2, 41.00) | 0.01 | 63.89(3, 615.00) | <0.001 | 14.27(3, 615.00) | <0.001 | 2.05 (6, 615.00) | 0.06 | 1.19(6, 615.00) | 0.31 | 0.69(18, 615.00) | 0.82 |
| Vigour | 3.95(2, 41.00) | 0.03 | 119.19(3, 615.00) | <0.001 | 25.03(3, 615.00) | <0.001 | 2.72(6, 615.00) | 0.01 | 1.52(6, 615.00) | 0.17 | 0.70(18, 615.00) | 0.81 |
| Variable | MN | SN | NE | All |
|---|---|---|---|---|
| n (%male) | 14 (57%) | 14 (57%) | 16 (63%) | 44 (59%) |
| Age (years) | 23.3 ± 3.7 | 25.4 ± 5.7 | 24.9 ± 2.6 | 25.0 ± 4.9 |
| BMI (kg/m2) | 23.9 ± 2.8 | 23.9 ± 2.8 | 23.7 ± 2.4 | 23.8 ± 2.6 |
| Average 24 h energy intake (kJ) | 9416.9 ± 961.0 | 9300.0 ± 942.3 | 9392.3 ± 1028.8 | 9638.2 ± 959.1 |
| Average 24 h macronutrient consumption | ||||
| Carbohydrate (g) | 267.9 ± 24.9 | 267.3 ± 25.2 | 269.7 ± 25.6 | 268.4 ± 25.1 |
| Protein (g) | 93.2 ± 8.7 | 91.3 ± 9.9 | 92.0 ± 10.4 | 92.1 ± 9.7 |
| Fat (g) | 86.9 ± 11.6 | 84.6 ± 12.7 | 85.2 ± 12.8 | 85.6 ± 12.4 |
| Fibre (g) | 27.4 ± 3.0 | 26.0 ± 2.5 | 26.8 ± 2.5 | 26.5 ± 2.7 |
| Polysomnography | ||||
| TST (h) | ||||
| Baseline (8 h) | 7.2 ± 0.7 | 7.0 ± 0.5 | 7.19 ± 0.4 | 7.1 ± 0.5 |
| Day 5 recovery sleep (7 h) | 6.4 ± 0.9 | 6.3 ± 0.6 | 6.3 ± 0.6 | 6.2 ± 0.9 |
| Recovery (8 h) | 6.1 ± 0.9 | 5.8 ± 1.3 | 6.2 ± 1.3 | 5.8 ± 1.5 |
| WASO (min) | ||||
| Baseline (8 h) | 25.71 ± 26.51 | 27.68 ± 16.89 | 29.00 ± 13.91 | 27.39 ± 19.64 |
| Day 5 recovery sleep (7 h) | 32.31 ± 53.80 | 34.18 ± 35.33 | 37.54 ± 34.74 | 33.81 ± 40.94 |
| Recovery (8 h) | 57.85 ± 65.72 | 66.50 ± 56.61 | 50.75 ± 45.34 | 72.66 ± 82.80 |
| SE (%) | ||||
| Baseline (8 h) | 90.09 ± 8.31 | 87.61 ± 6.46 | 90.25 ± 4.51 | 89.27 ± 6.65 |
| Day 5 recovery sleep (7 h) | 91.07 ± 13.10 | 90.31 ± 9.01 | 89.81 ± 8.27 | 90.56 ± 10.01 |
| Recovery (8 h) | 76.13 ± 12.11 | 73.04 ± 15.90 | 76.92 ± 15.90 | 72.78 ± 18.11 |
| SOL (min) | ||||
| Baseline (8 h) | 21.68 ± 15.49 | 31.68 ± 24.06 | 17.67 ± 11.69 | 23.98 ± 18.63 |
| Day 5 recovery sleep (7 h) | 5.31 ± 3.33 | 6.57 ± 3.82 | 5.29 ± 2.51 | 5.71 ± 3.24 |
| Recovery (8 h) | 56.77 ± 35.52 | 62.69 ± 59.72 | 60.17 ± 85.24 | 57.95 ± 60.20 |
| REM (min) | ||||
| Baseline (8 h) | 103.43 ± 29.54 | 87.86 ± 15.94 | 94.5 ± 22.07 | 95.30 ± 23.60 |
| Day 5 recovery sleep (7 h) | 107.81 ± 29.55 | 86.54 ± 18.75 | 104.71 ± 19.91 | 98.04 ± 25.40 |
| Recovery (8 h) | 88.46 ± 23.93 | 84.92 ± 25.63 | 88.08 ± 30.34 | 83.91 ± 29.15 |
| Stage 1 (min) | ||||
| Baseline (8 h) | 5.64 ± 2.78 | 6.93 ± 5.48 | 4.96 ± 3.67 | 5.89 ± 4.13 |
| Day 5 recovery sleep (7 h) | 5.42 ± 2.96 | 6.25 ± 3.53 | 4.83 ± 3.54 | 5.41 ± 3.37 |
| Recovery (8 h) | 6.58 ± 3.94 | 8.92 ± 5.74 | 6.83 ± 5.69 | 7.46 ± 5.17 |
| Stage 2 (min) | ||||
| Baseline (8 h) | 157.25 ± 52.22 | 158.54 ± 60.93 | 151.92 ± 39.35 | 156.10 ± 50.90 |
| Day 5 recovery sleep (7 h) | 111.23 ± 30.86 | 121.79 ± 46.76 | 109.88 ± 38.27 | 112.38 ± 40.77 |
| Recovery (8 h) | 159.50 ± 46.17 | 140.77 ± 56.39 | 153.79 ± 49.17 | 146.69 ± 53.23 |
| Stage 3 (min) | ||||
| Baseline (8 h) | 79.68 ± 25.25 | 80.75 ± 33.48 | 89.08 ± 38.64 | 82.88 ± 32.01 |
| Day 5 recovery sleep (7 h) | 65.92 ± 20.97 | 63.96 ± 22.21 | 61.13 ± 22.66 | 62.90 ± 21.84 |
| Recovery (8 h) | 63.54 ± 21.93 | 66.54 ± 48.97 | 68.08 ± 38.02 | 63.98 ± 37.11 |
| Stage 4 (min) | ||||
| Baseline (8 h) | 86.36 ± 32.80 | 86.18 ± 49.50 | 91.00 ± 22.24 | 87.69 ± 36.33 |
| Day 5 recovery sleep (7 h) | 91.62 ± 40.20 | 100.11 ± 44.91 | 97.21 ± 29.37 | 96.05 ± 37.82 |
| Recovery (8 h) | 47.42 ± 23.08 | 48.88 ± 24.51 | 52.67 ± 25.03 | 47.21 ± 25.28 |
| Actigraphy | ||||
| TST (h) | ||||
| Baseline (8 h) | 7.8 ± 0.5 | 7.2 ± 1.3 | 7.8 ± 0.1 | 7.9 ± 0.5 |
| Day 3 sleep (7 h) | 6.9 ± 0.1 | 6.7 ± 0.7 | 6.9 ± 0.1 | 6.9 ± 0.1 |
| Day 4 sleep (7 h) | 6.7 ± 0.6 | 6.7 ± 0.4 | 6.9 ± 0.1 | 6.8 ± 0.2 |
| Day 5 sleep (7 h) | 6.9 ± 0.1 | 6.7 ± 0.4 | 6.9 ± 0.1 | 6.8 ± 0.3 |
| Day 6 sleep (7 h) | 6.7 ± 0.5 | 6.8 ± 0.1 | 6.9 ± 0.1 | 6.8 ± 0.3 |
| Recovery (8 h) | 7.6 ± 0.8 | 7.9 ± 0.1 | 7.7 ± 0.5 | 7.7 ± 0.4 |
| SE (%) | ||||
| Baseline (8 h) | 83.00 ± 14.52 | 85.73 ± 11.30 | 90.67 ± 5.42 | 87.80 ± 9.99 |
| Day 3 sleep (7 h) | 86.98 ± 9.70 | 88.87 ± 10.00 | 90.88 ± 4.18 | 89.65 ± 7.10 |
| Day 4 sleep (7 h) | 83.90 ± 14.18 | 85.76 ± 10.42 | 90.74 ± 4.68 | 87.28 ± 10.63 |
| Day 5 sleep (7 h) | 84.91 ± 13.80 | 87.54 ± 10.88 | 91.30 ± 3.40 | 87.88 ± 10.66 |
| Day 6 sleep (7 h) | 84.28 ± 13.36 | 88.30 ± 7.63 | 89.48 ± 4.90 | 87.56 ± 9.59 |
| Recovery (8 h) | 77.25 ± 15.62 | 83.81 ± 10.84 | 85.57 ± 9.69 | 83.30 ± 11.48 |
| SOL (min) | ||||
| Baseline (8 h) | 5.85 ± 10.37 | 8.00 ± 12.20 | 5.17 ± 4.61 | 5.65 ± 9.08 |
| Day 3 sleep (7 h) | 2.54 ± 5.03 | 2.5 ± 4.91 | 1.25 ± 1.322 | 1.76 ± 3.36 |
| Day 4 sleep (7 h) | 1.31 ± 2.45 | 4.18 ± 5.52 | 2.75 ± 3.14 | 2.65 ± 4.10 |
| Day 5 sleep (7 h) | 1.38 ± 2.26 | 2.12 ± 3.17 | 2.58 ± 2.92 | 2.04 ± 2.83 |
| Day 6 sleep (7 h) | 3.23 ± 7.65 | 3.86 ± 5.16 | 2.54 ± 1.90 | 2.66 ± 3.59 |
| Recovery (8 h) | 13.27 ± 24.64 | 7.21 ± 21.16 | 6.23 ± 5.65 | 7.23 ± 12.18 |
© 2019 by the authors. Licensee MDPI, Basel, Switzerland. This article is an open access article distributed under the terms and conditions of the Creative Commons Attribution (CC BY) license (http://creativecommons.org/licenses/by/4.0/).
Share and Cite
Gupta, C.C.; Centofanti, S.; Dorrian, J.; Coates, A.M.; Stepien, J.M.; Kennaway, D.; Wittert, G.; Heilbronn, L.; Catcheside, P.; Noakes, M.; et al. Subjective Hunger, Gastric Upset, and Sleepiness in Response to Altered Meal Timing during Simulated Shiftwork. Nutrients 2019, 11, 1352. https://doi.org/10.3390/nu11061352
Gupta CC, Centofanti S, Dorrian J, Coates AM, Stepien JM, Kennaway D, Wittert G, Heilbronn L, Catcheside P, Noakes M, et al. Subjective Hunger, Gastric Upset, and Sleepiness in Response to Altered Meal Timing during Simulated Shiftwork. Nutrients. 2019; 11(6):1352. https://doi.org/10.3390/nu11061352
Chicago/Turabian StyleGupta, Charlotte C, Stephanie Centofanti, Jillian Dorrian, Alison M Coates, Jacqueline M Stepien, David Kennaway, Gary Wittert, Leonie Heilbronn, Peter Catcheside, Manny Noakes, and et al. 2019. "Subjective Hunger, Gastric Upset, and Sleepiness in Response to Altered Meal Timing during Simulated Shiftwork" Nutrients 11, no. 6: 1352. https://doi.org/10.3390/nu11061352
APA StyleGupta, C. C., Centofanti, S., Dorrian, J., Coates, A. M., Stepien, J. M., Kennaway, D., Wittert, G., Heilbronn, L., Catcheside, P., Noakes, M., Coro, D., Chandrakumar, D., & Banks, S. (2019). Subjective Hunger, Gastric Upset, and Sleepiness in Response to Altered Meal Timing during Simulated Shiftwork. Nutrients, 11(6), 1352. https://doi.org/10.3390/nu11061352