Assessment of Vitamin D Supplementation on Articular Cartilage Morphology in a Young Healthy Sedentary Rat Model

 ,
,  , ,
, ,  ,
,  and
and 
Abstract

1. Introduction
2. Materials and Methods
2.1. Breeding and Housing of Animals
2.2. Experimental Design
2.3. Histology
2.4. Histomorphometric Analysis
2.5. Immunohistochemistry (IHC)
2.6. Computerised Densitometric Measurements and Image Analysis
2.7. Statistical Analysis
3. Results
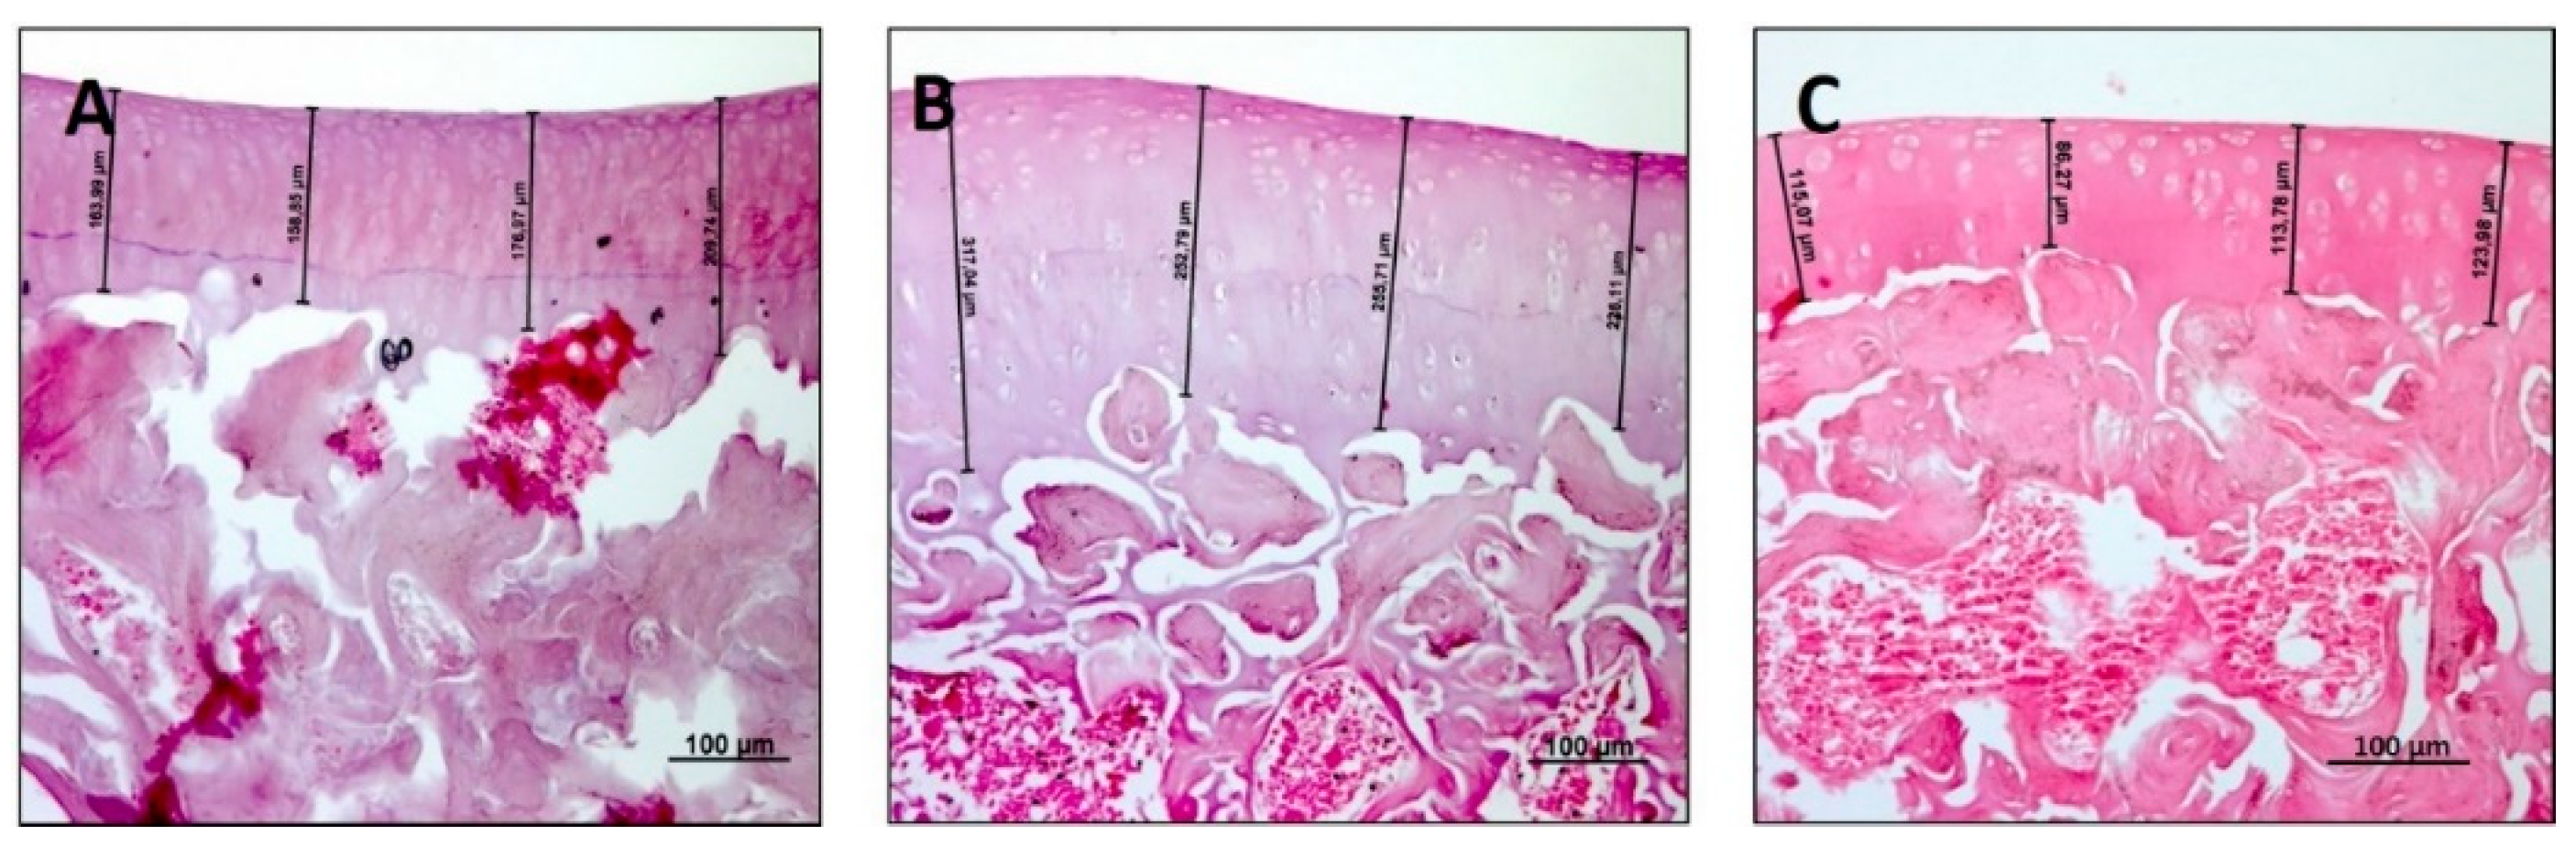
3.1. Histology and Histomorphometric Analysis
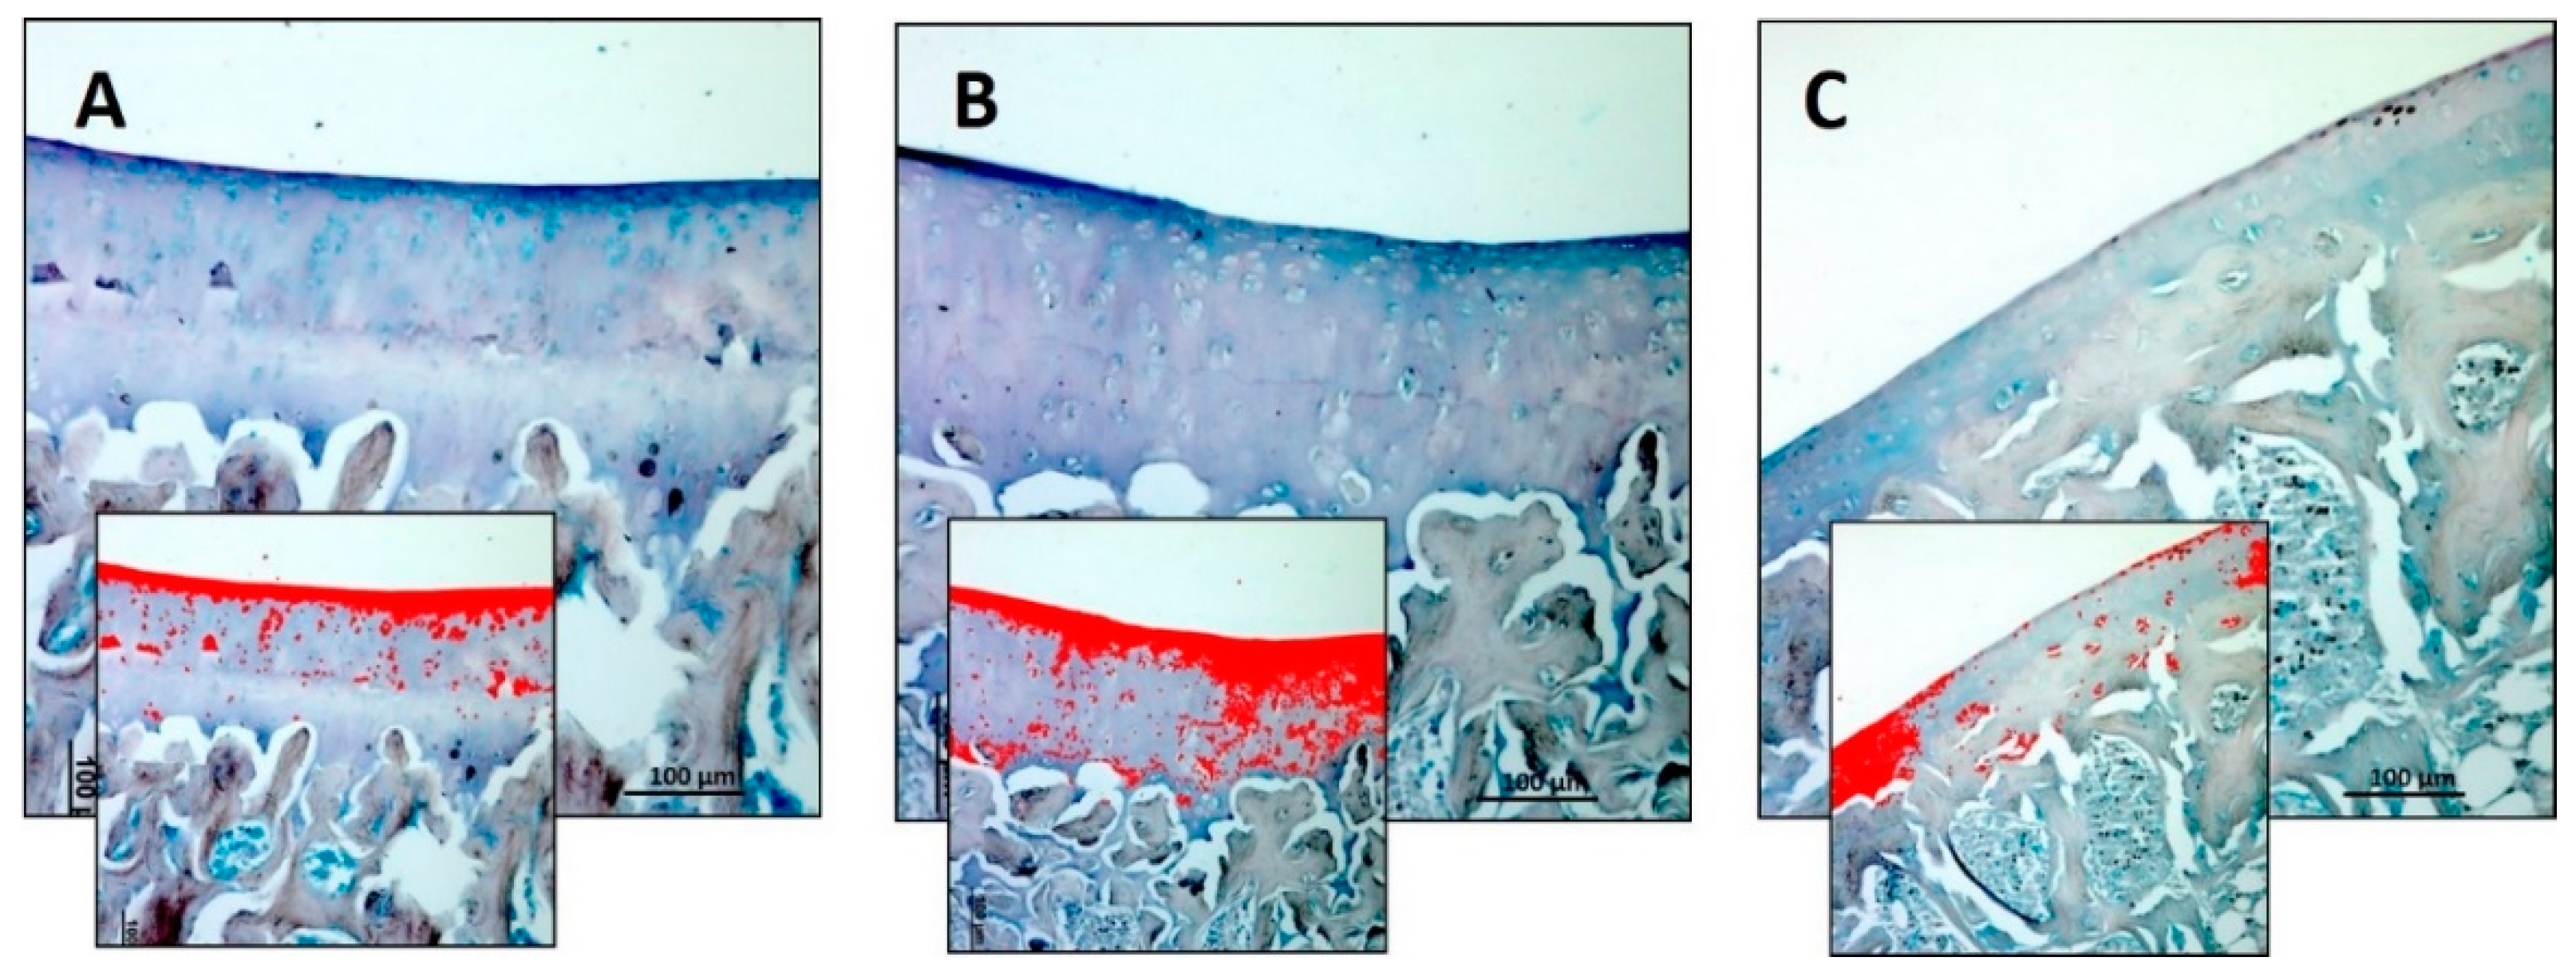
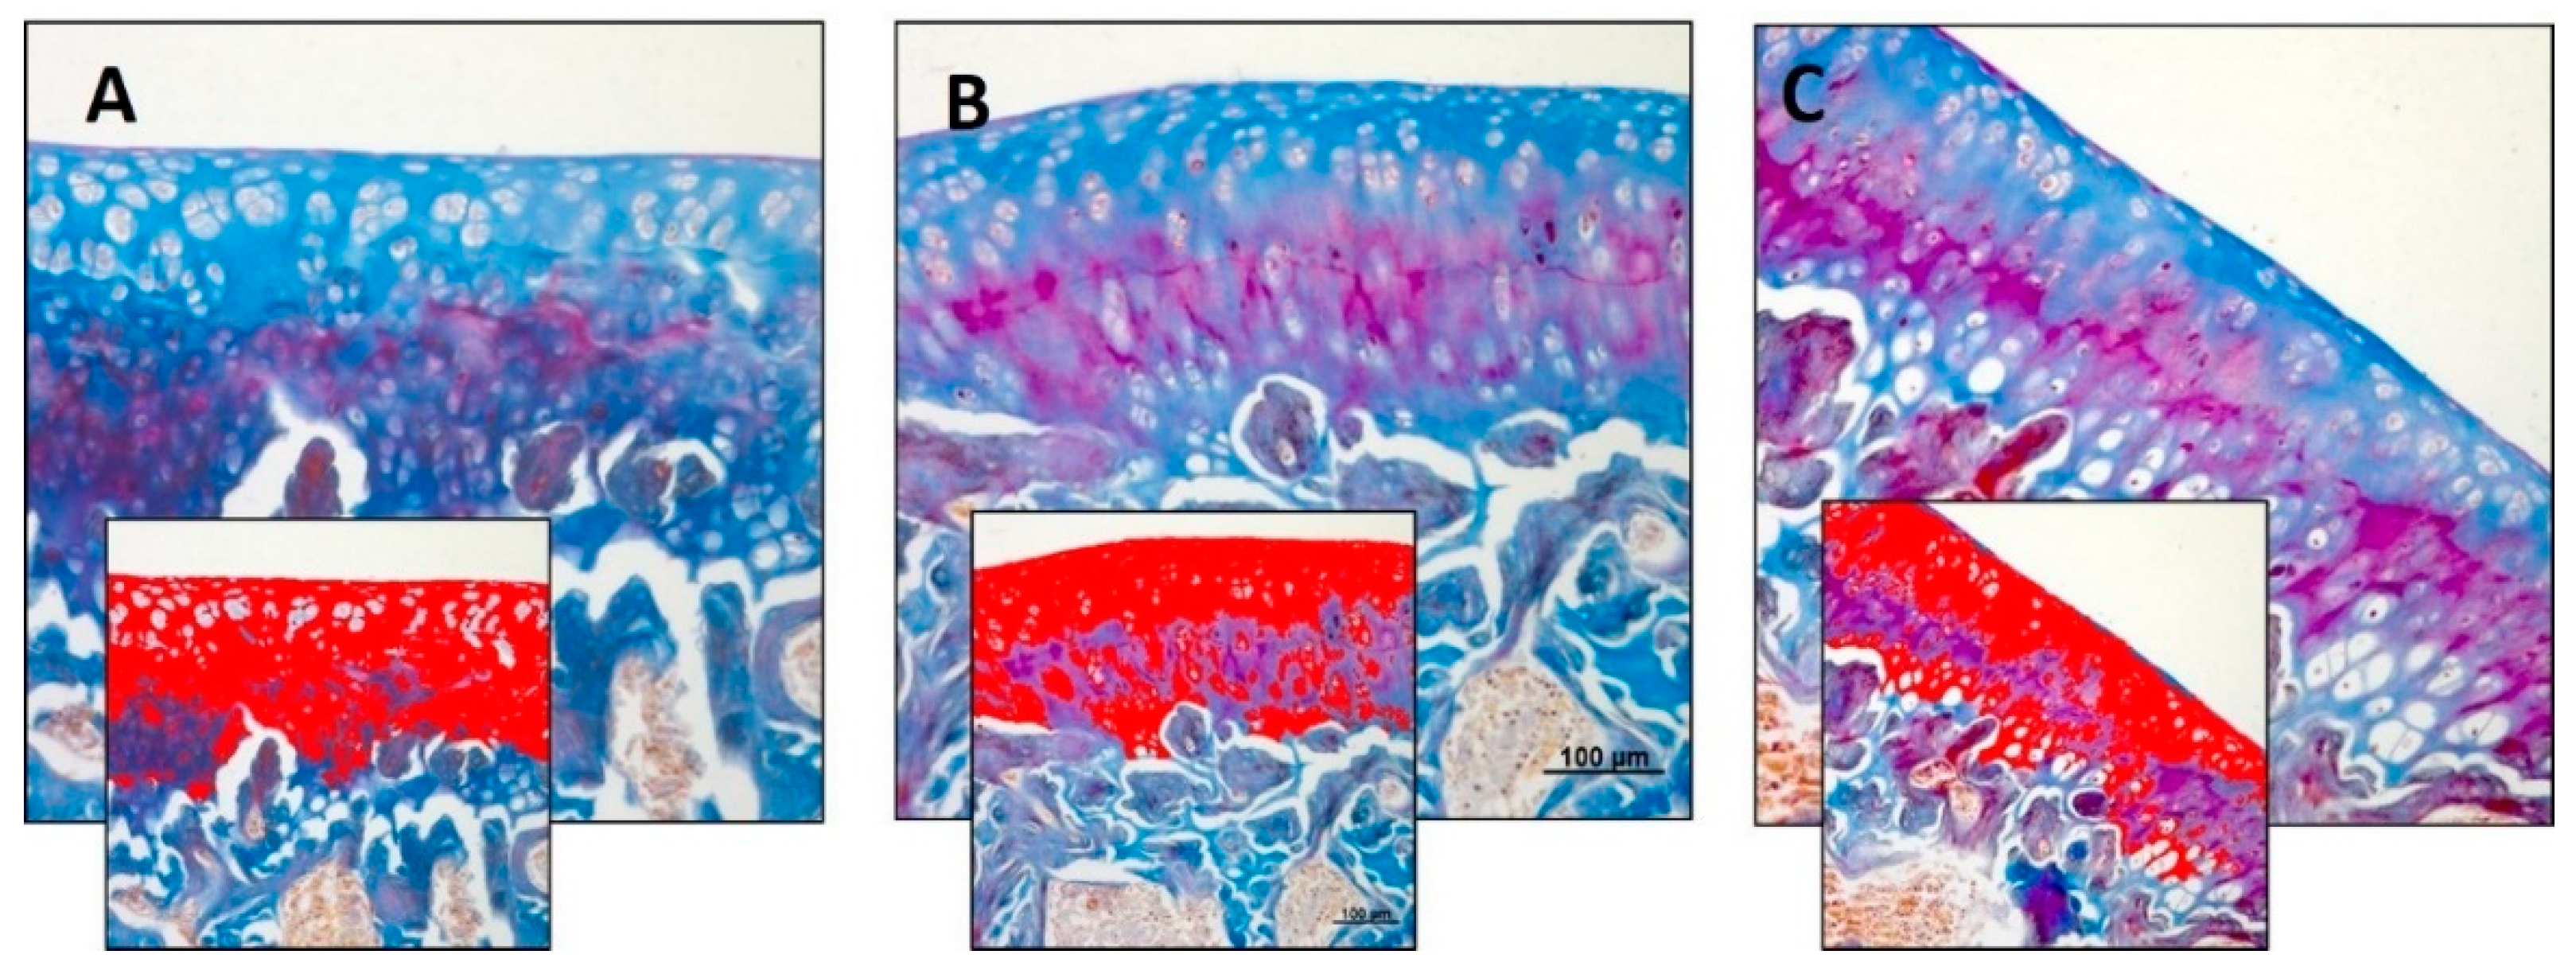
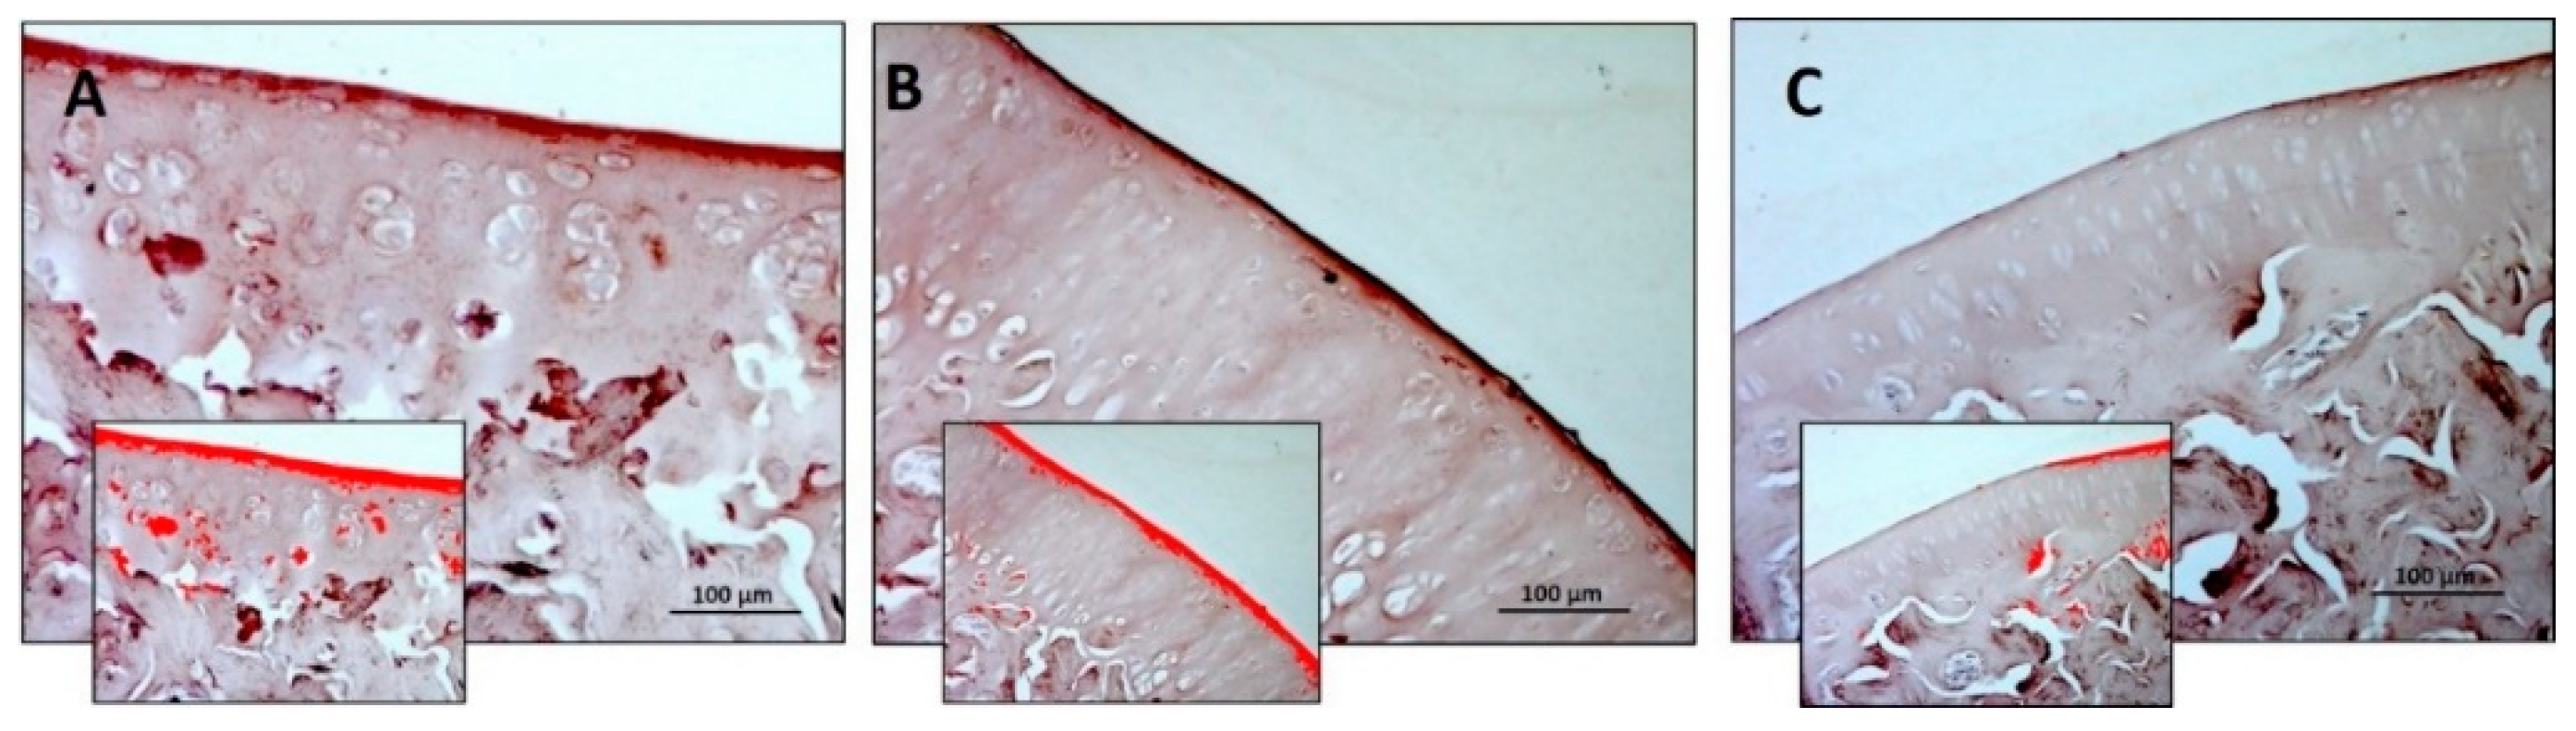
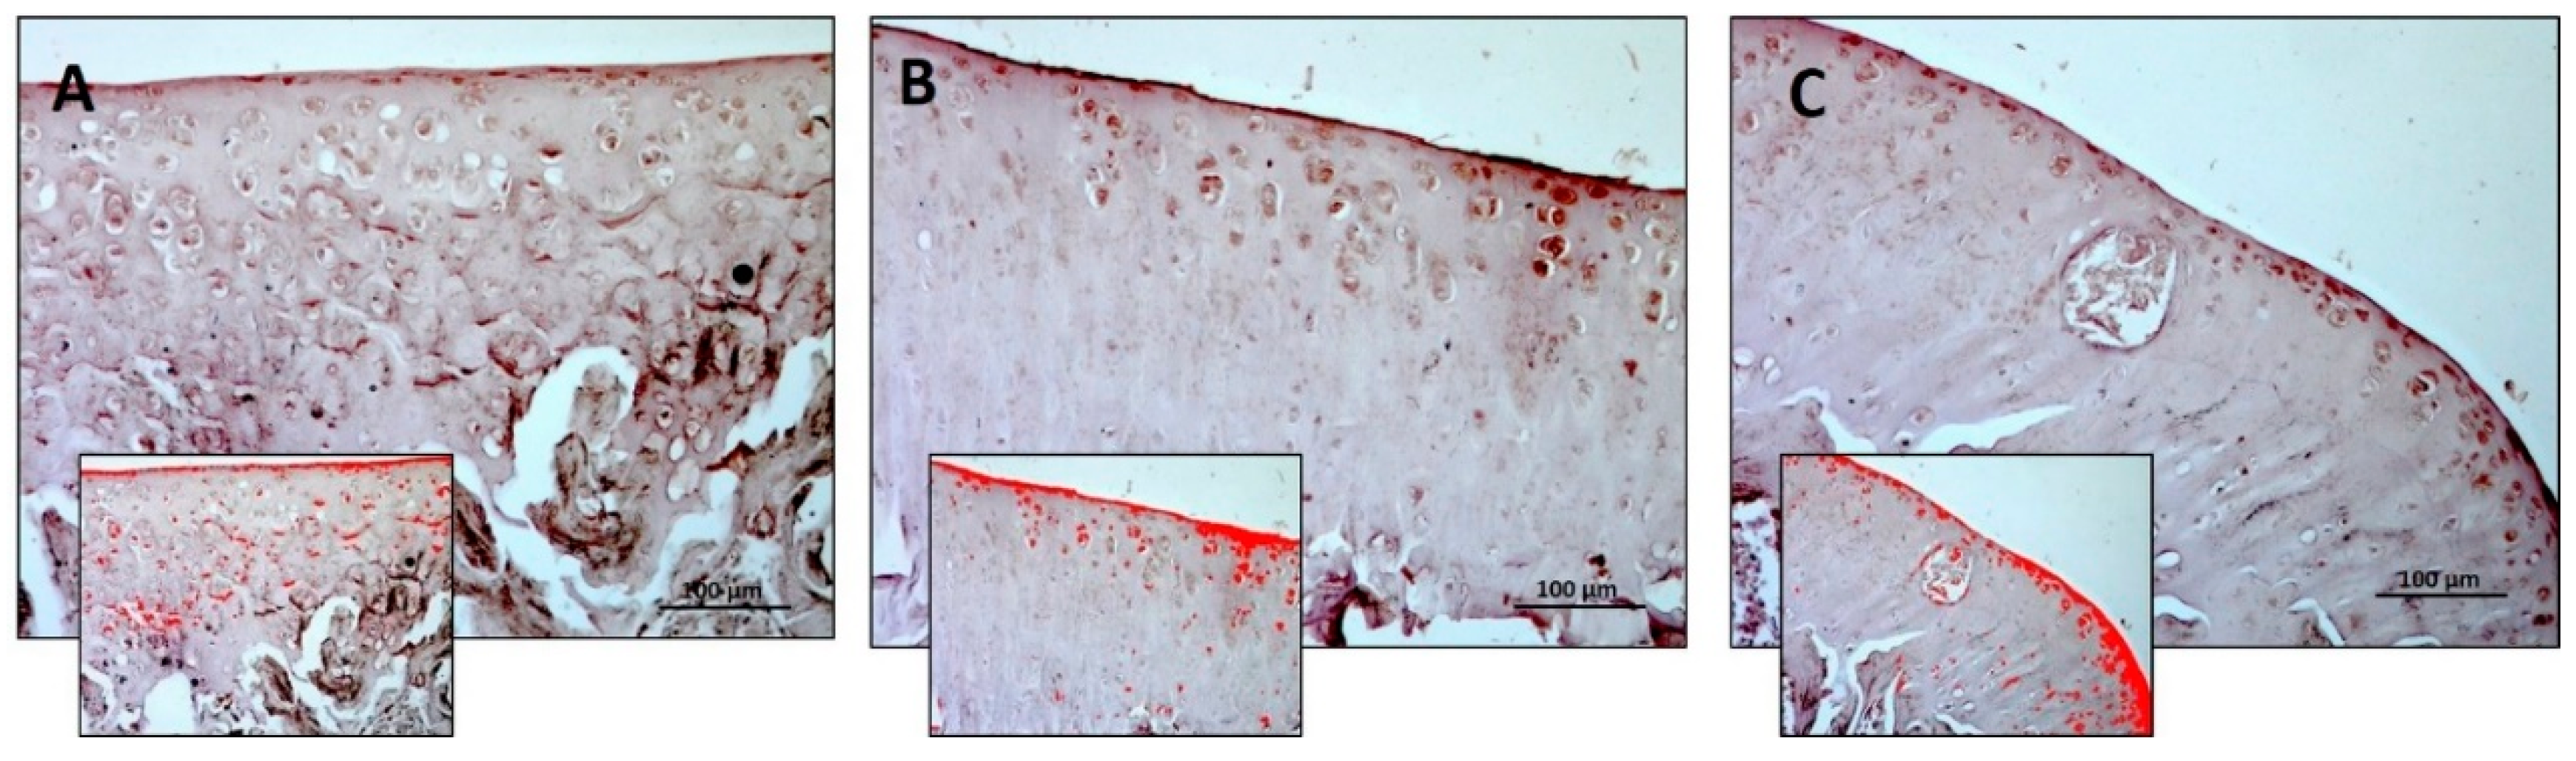
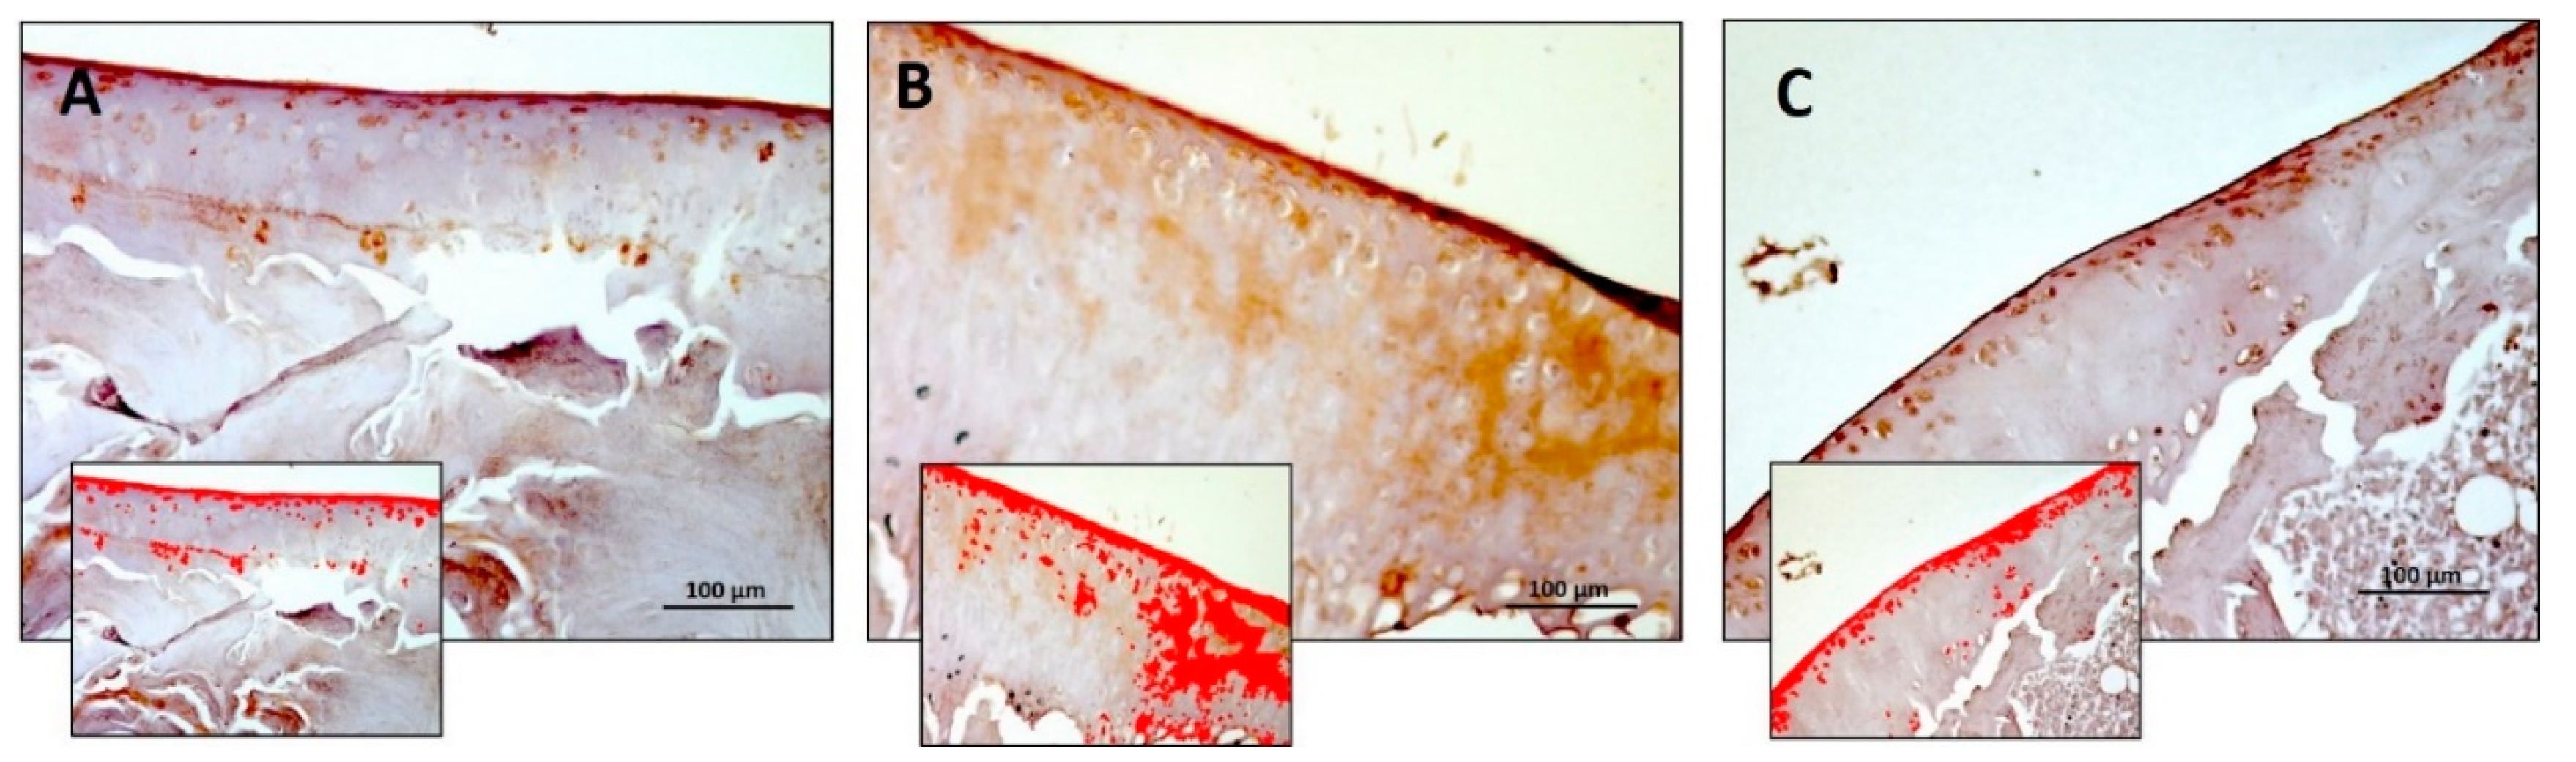
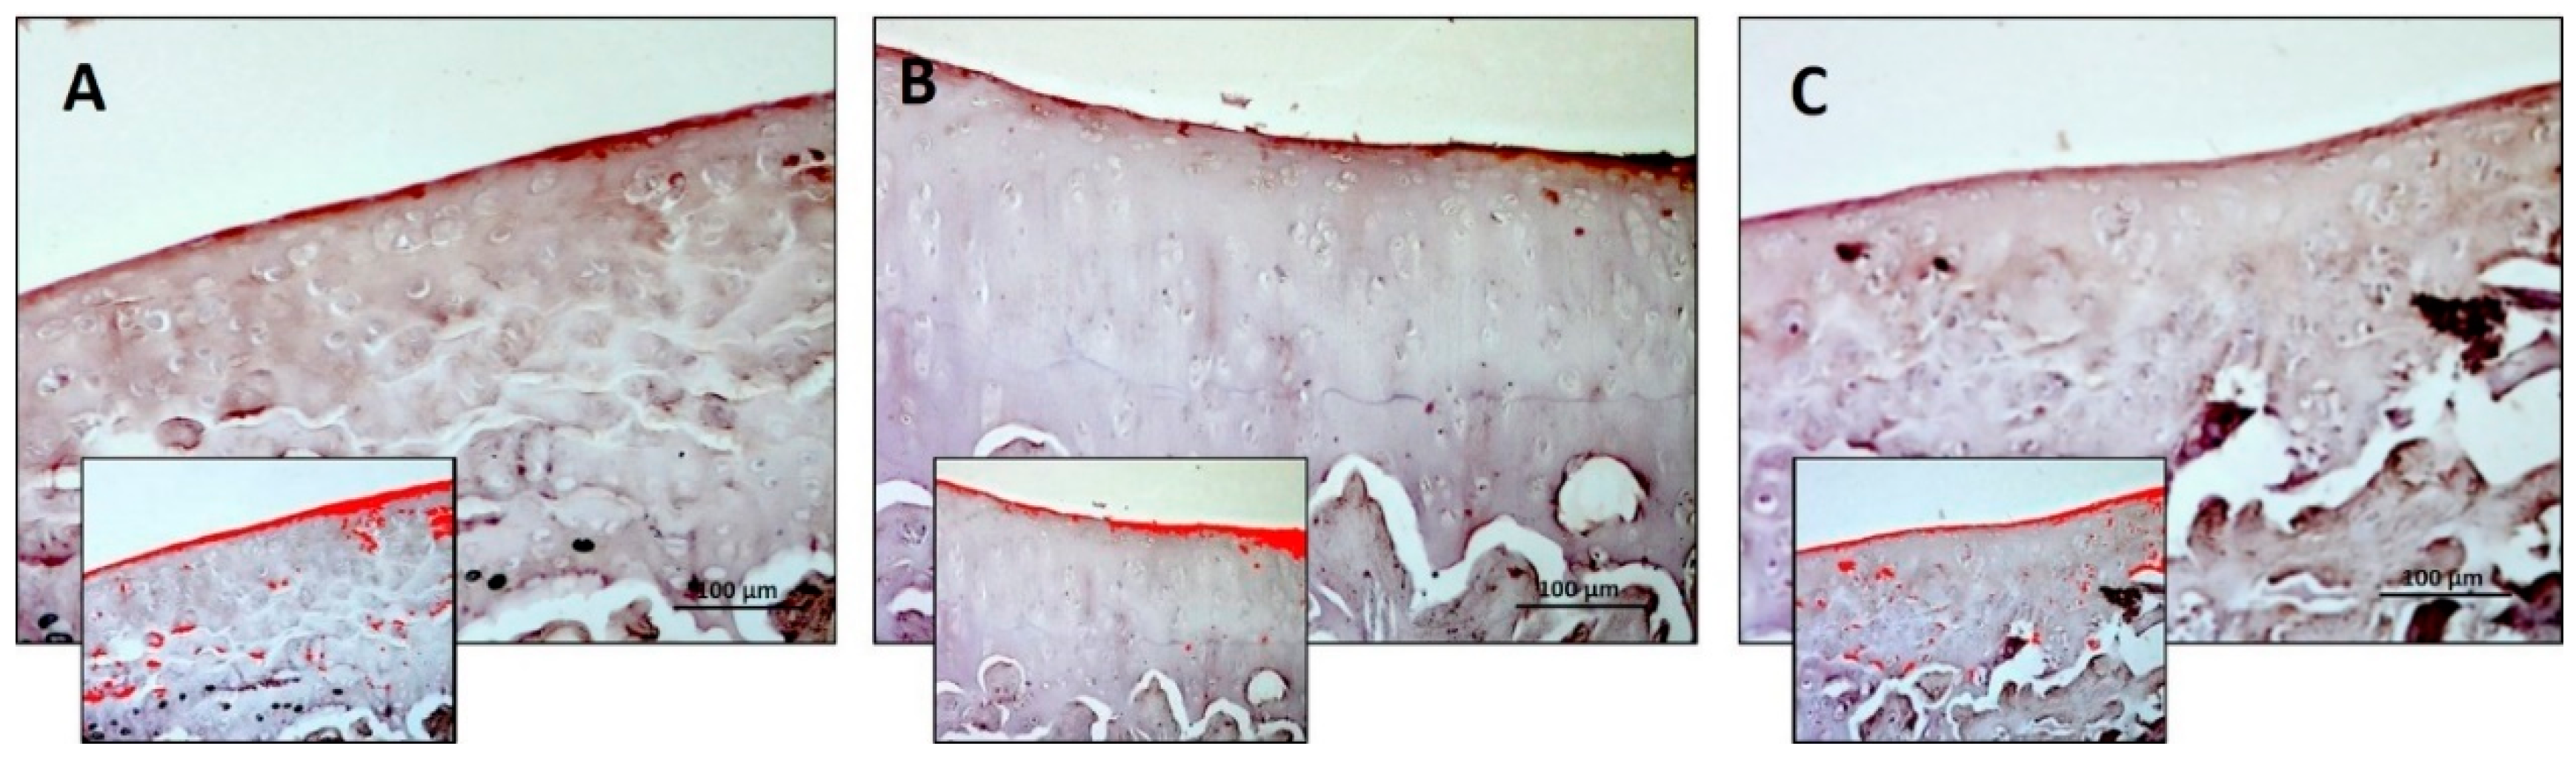
3.2. Immunohistochemistry (IHC)
4. Discussion
5. Conclusions
6. Limitations of the Study
Author Contributions
Funding
Acknowledgments
Conflicts of Interest
References
- Holick, M.F. High prevalence of vitamin D inadequacy and implications for health. Mayo Clin. Proc. 2006, 81, 353–373. [Google Scholar] [CrossRef] [PubMed]
- Wintermeyer, E.; Ihle, C.; Ehnert, S.; Stöckle, U.; Ochs, G.; de Zwart, P.; Flesch, I.; Bahrs, C.; Nussler, A.K. Crucial Role of Vitamin D in the Musculoskeletal System. Nutrients 2016, 8, 319. [Google Scholar] [CrossRef] [PubMed]
- Trovato, F.M.; Castrogiovanni, P.; Szychlinska, M.A.; Purrello, F.; Musumeci, G. Impact of Western and Mediterranean Diets and Vitamin D on Muscle Fibers of Sedentary Rats. Nutrients 2018, 10, 231. [Google Scholar] [CrossRef]
- Mueller, M.B.; Tuan, R.S. Anabolic/Catabolic balance in pathogenesis of osteoarthritis: Identifying molecular targets. PM R 2011, 3, S3–S11. [Google Scholar] [CrossRef] [PubMed]
- Musumeci, G.; Loreto, C.; Imbesi, R.; Trovato, F.M.; Di Giunta, A.; Lombardo, C.; Castorina, S.; Castrogiovanni, P. Advantages of exercise in rehabilitation, treatment and prevention of altered morphological features in knee osteoarthritis. A narrative review. Histol. Histopathol. 2014, 29, 707–719. [Google Scholar] [PubMed]
- Felson, D.T.; Niu, J.; Clancy, M.; Aliabadi, P.; Sack, B.; Guermazi, A.; Hunter, D.J.; Amin, S.; Rogers, G.; Booth, S.L. Low levels of vitamin D and worsening of knee osteoarthritis: Results of two longitudinal studies. Arthritis Rheumatol. 2007, 56, 129–136. [Google Scholar] [CrossRef] [PubMed]
- Bergink, A.P.; Uitterlinden, A.G.; Van Leeuwen, J.P.; Buurman, C.J.; Hofman, A.; Verhaar, J.A.; Pols, H.A. Vitamin D status, bone mineral density, and thedevelopment of radiographic osteoarthritis of the knee: The Rotterdam Study. J. Clin. Rheumatol. 2009, 15, 230–237. [Google Scholar] [CrossRef] [PubMed]
- Corvol, M.T.; Dumontier, M.F.; Tsagris, L.; Lang, F.; Bourguignon, J. Cartilage and vitamin D in vitro. Ann. Endocrinol. 1981, 42, 482–487. [Google Scholar]
- Schwartz, Z.; Bonewald, L.; Caulfield, F.; Brooks, B.; Boyan, B.D. Direct effects of transforming growth factors-B on chondrocytes are modulated by vitamin D metabolites in a cell maturation specific manner. Endocrinology 1993, 132, 1544–1552. [Google Scholar] [CrossRef]
- Dean, D.D.; Boyan, B.D.; Muniz, O.E.; Howell, D.S.; Schwartz, Z. Vitamin D metabolites regulate matrix vesicle metalloproteinase content in a cell maturation-dependent manner. Calcif. Tissue Int. 1995, 59, 109–116. [Google Scholar] [CrossRef]
- Pascual-Garrido, C.; Angeline, M.E.; Ma, R.; Chahla, J.; Voigt, C.; Deng, X.H.; Nguyen, J.; Warren, R.F.; Rodeo, S.A. Low Levels of Vitamin D have a Deleterious Effect on the Articular Cartilage in a Rat Model. HSS J. 2016, 12, 150–157. [Google Scholar] [CrossRef] [PubMed]
- Zhang, F.F.; Driban, J.B.; Lo, G.H.; Price, L.L.; Booth, S.; Eaton, C.B.; Lu, B.; Nevitt, M.; Jackson, B.; Garganta, C.; et al. Vitamin D deficiency is associated with progression of knee osteoarthritis. J. Nutr. 2014, 144, 2002–2008. [Google Scholar] [CrossRef] [PubMed]
- Konstari, S.; Paananen, M.; Heliovaara, M.; Knekt, P.; Marniemi, J.; Impivaara, O.; Arokoski, J.; Karppinen, J. Association of 25-hydroxyvitamin D with the incidence of knee and hip osteoarthritis: A 22-year follow-up study. Scand. J. Rheumatol. 2012, 41, 124–131. [Google Scholar] [CrossRef]
- Muraki, S.; Dennison, E.; Jameson, K.; Boucher, B.J.; Akune, T.; Yoshimura, N.; Judge, A.; Arden, N.K.; Javaid, K.; Cooper, C. Association of vitamin D status with knee pain and radiographic knee osteoarthritis. Osteoarthr. Cartil. 2011, 19, 1301–1306. [Google Scholar] [CrossRef] [PubMed]
- Wu, S.; Sun, J. Vitamin D, vitamin D receptor, and macroautophagy in inflammation and infection. Discov. Med. 2011, 11, 325–335. [Google Scholar] [PubMed]
- Tetlow, L.C.; Woolley, D.E. Expression of vitamin D receptors and matrix metalloproteinases in osteoarthritic cartilage and human articular chondrocytes in vitro. Osteoarthr. Cartil. 2001, 9, 423–431. [Google Scholar] [CrossRef]
- Colombini, A.; Cauci, S.; Lombardi, G.; Lanteri, P.; Croiset, S.; Brayda-Bruno, M.; Banfi, G. Relationship between vitamin D receptor gene (VDR) polymorphisms, vitamin D status, osteoarthritis and intervertebral disc degeneration. J. Steroid Biochem. Mol. Biol. 2013, 138, 24–40. [Google Scholar] [CrossRef] [PubMed]
- Goula, T.; Kouskoukis, A.; Drosos, G.; Tselepis, A.S.; Ververidis, A.; Valkanis, C.; Zisimopoulos, A.; Kazakos, K. Vitamin D status in patients with knee or hip osteoarthritis in a Mediterranean country. J. Orthop. Traumatol. 2015, 16, 35–39. [Google Scholar] [CrossRef][Green Version]
- Faul, F.; Erdfelder, E.; Lang, A.G.; Buchner, A. G*Power 3: A flexible statistical power analysis program for the social, behavioral, and biomedical sciences. Behav. Res. Methods 2007, 39, 175–191. [Google Scholar] [CrossRef]
- Pichler, K.; Loreto, C.; Leonardi, R.; Reuber, T.; Weinberg, A.M.; Musumeci, G. RANKL is downregulated in bone cells by physical activity (treadmill and vibration stimulation training) in rat with glucocorticoid-induced osteoporosis. Histol. Histopathol. 2013, 28, 1185–1196. [Google Scholar]
- Gardner, O.F.W.; Musumeci, G.; Neumann, A.J.; Eglin, D.; Archer, C.W.; Alini, M.; Stoddart, M.J. Asymmetrical seeding of MSCs into fibrin-poly(ester-urethane) scaffolds and its effect on mechanically induced chondrogenesis. J. Tissue Eng. Regen. Med. 2017, 11, 2912–2921. [Google Scholar] [CrossRef] [PubMed]
- Castrogiovanni, P.; Di Rosa, M.; Ravalli, S.; Castorina, A.; Guglielmino, C.; Imbesi, R.; Vecchio, M.; Drago, F.; Szychlinska, M.A.; Musumeci, G. Moderate Physical Activity as a Prevention Method for Knee Osteoarthritis and the Role of Synoviocytes as Biological Key. Int. J. Mol. Sci. 2019, 20, 511. [Google Scholar] [CrossRef]
- Musumeci, G.; Castrogiovanni, P.; Coleman, R.; Szychlinska, M.A.; Salvatorelli, L.; Parenti, R.; Magro, G.; Imbesi, R. Somitogenesis: From somite to skeletal muscle. Acta Histochem. 2015, 117, 313–328. [Google Scholar] [CrossRef] [PubMed]
- Malas, F.U.; Kara, M.; Aktekin, L.; Ersöz, M.; Ozçakar, L. Does vitamin D affect femoral cartilage thickness? An ultrasonographic study. Clin. Rheumatol. 2014, 33, 1331–1334. [Google Scholar] [CrossRef] [PubMed]
- Mow, V.C.; Ratcliffe, A.; Poole, A.R. Cartilage and diarthrodial joints as paradigms for hierarchical materials and structures. Biomaterials 1992, 13, 67–97. [Google Scholar] [CrossRef]
- Szychlinska, M.A.; Castrogiovanni, P.; Trovato, F.M.; Nsir, H.; Zarrouk, M.; Lo Furno, D.; Di Rosa, M.; Imbesi, R.; Musumeci, G. Physical activity and Mediterranean diet based on olive tree phenolic compounds from two different geographical areas have protective effects on early osteoarthritis, muscle atrophy and hepatic steatosis. Eur. J. Nutr. 2019, 58, 565–581. [Google Scholar] [CrossRef] [PubMed]
- Szychlinska, M.A.; Trovato, F.M.; Di Rosa, M.; Malaguarnera, L.; Puzzo, L.; Leonardi, R.; Castrogiovanni, P.; Musumeci, G. Co-Expression and Co-Localization of Cartilage Glycoproteins CHI3L1 and Lubricin in Osteoarthritic Cartilage: Morphological, Immunohistochemical and Gene Expression Profiles. Int. J. Mol. Sci. 2016, 17, 359. [Google Scholar] [CrossRef] [PubMed]
- Masuyama, R.; Stockmans, I.; Torrekens, S.; Van Looveren, R.; Maes, C.; Carmeliet, P.; Bouillon, R.; Carmeliet, G. Vitamin D receptor in chondrocytes promotes osteoclastogenesis and regulates FGF23 production in osteoblasts. J. Clin. Investig. 2006, 116, 3150–3159. [Google Scholar] [CrossRef] [PubMed]
- Rai, V.; Dietz, N.E.; Dilisio, M.F.; Radwan, M.M.; Agrawal, D.K. Vitamin D attenuates inflammation, fatty infiltration, and cartilage loss in the knee of hyperlipidemic microswine. Arthritis Res. Ther. 2016, 18, 203. [Google Scholar] [CrossRef]
- Diao, N.; Yang, B.; Yu, F. Effect of vitamin D supplementation on knee osteoarthritis: A systematic review and meta-analysis of randomized clinical trials. Clin. Biochem. 2017, 50, 1312–1316. [Google Scholar] [CrossRef]
- Gao, X.R.; Chen, Y.S.; Deng, W. The effect of vitamin D supplementation on knee osteoarthritis: A meta-analysis of randomized controlled trials. Int. J. Surg. 2017, 46, 14–20. [Google Scholar] [CrossRef] [PubMed]


| Compound | R | R-DS | R-DR |
|---|---|---|---|
| Water (% w/w) | 10.69 | 10.69 | 10.69 |
| Protein (% m/m) | 22.90 | 22.90 | 22.90 |
| Fat (% m/m) | 3.54 | 3.54 | 3.54 |
| Fiber (% m/m) | 3.63 | 3.63 | 3.63 |
| Ash (% m/m) | 7.55 | 7.55 | 7.55 |
| FNE (% m/m) | 51.44 | 51.44 | 51.44 |
| Carbohydrates (% m/m) | 55.07 | 55.07 | 55.07 |
| M.E. (kcal/kg) | 2757 | 2757 | 2757 |
| Vitamin A (IU/kg) | 16,000 | 16,000 | 16,000 |
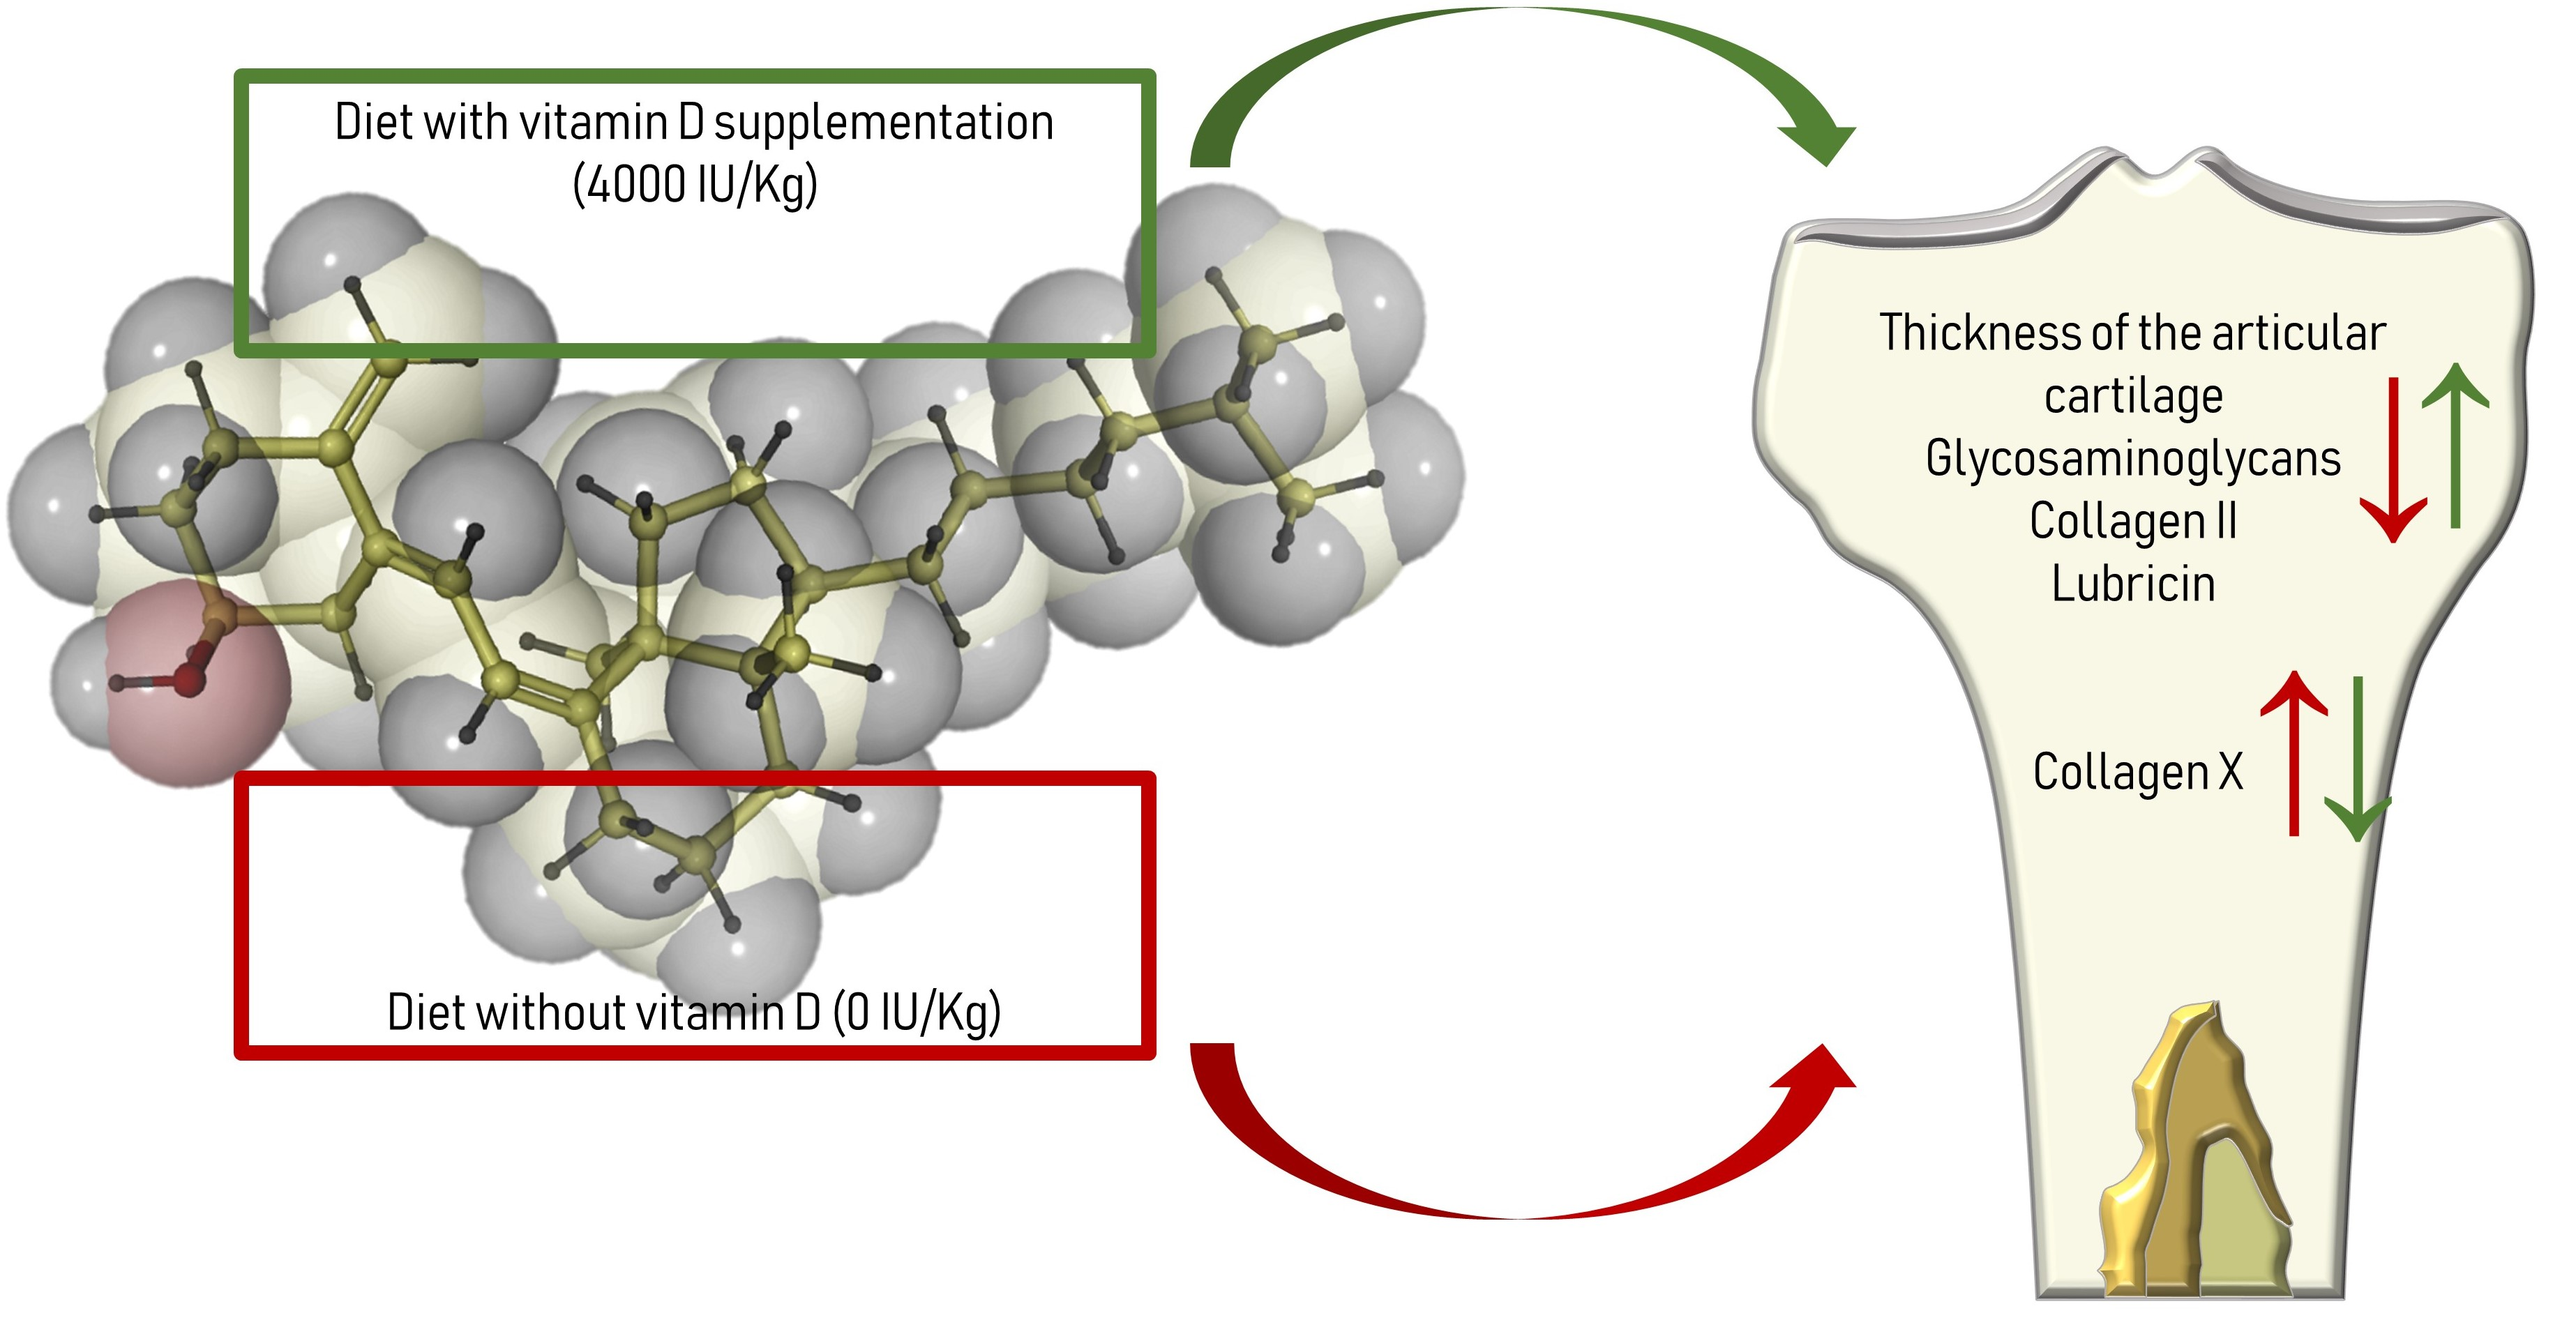
| Vitamin D3 (IU/kg) | 1400 | 4000 | 0 |
| Vitamin B1 (mg/kg) | 19.1 | 19.1 | 19.1 |
| Vitamin B2 (mg/kg) | 19.1 | 19.1 | 19.1 |
| Vitamin B6 (mg/kg) | 10.9 | 10.9 | 10.9 |
| Vitamin B12 (mg/kg) | 0.03 | 0.03 | 0.03 |
| Vitamin E (α-tocopherol) (mg/kg) | 68.5 | 68.5 | 68.5 |
| Vitamin PP (mg/kg) | 95.2 | 95.2 | 95.2 |
| Iron (mg/kg) | 599 | 599 | 599 |
| Calcium (mg/kg) | 10,575 | 10,575 | 10,575 |
| Magnesium (mg/kg) | 2485 | 2485 | 2485 |
| Phosphorus (mg/kg) | 9619 | 9619 | 9619 |
| Potassium (mg/kg) | 9782 | 9782 | 9782 |
| Zinc (mg/kg) | 106.9 | 106.9 | 106.9 |
| Sodium (mg/kg) | 3033 | 3033 | 3033 |
| R (Mean ± SD) | R-DS (Mean ± SD) | R-DR (Mean ± SD) | p-Value | |
|---|---|---|---|---|
| Thickness (µm) | 235.7 ± 12.20 | 301.6 ± 19.25 | 130.00 ± 13.19 | R vs. R-DS: 0.0071 R vs. R-DR: < 0.0001 R-DS vs. R-DR: < 0.0001 |
| R (Mean ± SD) | R-DS (Mean ± SD) | R-DR (Mean ± SD) | p-Value | |
|---|---|---|---|---|
| Densitometric count (pixel2)/μm2 | 1.940 ± 0.34 | 3.009 ± 0.44 | 0.980 ± 0.35 | R vs. R-DS: 0.0175 R vs. R-DR: 0.0359 R-DS vs. R-DR: < 0.0001 |
| R (Mean ± SD) | R-DS (Mean ± SD) | R-DR (Mean ± SD) | p-Value | |
|---|---|---|---|---|
| Densitometric count (pixel2)/μm2 | 4.246 ± 0.77 | 4.834 ± 0.74 | 2.925 ± 0.31 | R vs. R-DS: ns R vs. R-DR: 0.0120 R-DS vs. R-DR: 0.0003 |
| R (Mean ± SD) | R-DS (Mean ± SD) | R-DR (Mean ± SD) | p-Value | |
|---|---|---|---|---|
| Densitometric count (pixel2)/μm2 | 0.793 ± 0.20 | 0.889 ± 0.15 | 0.247 ± 0.09 | R vs. R-DS: ns R vs. R-DR: 0.0076 R-DS vs. R-DR: 0.0016 |
| R (Mean ± SD) | R-DS (Mean ± SD) | R-DR (Mean ± SD) | p-Value | |
|---|---|---|---|---|
| Densitometric count (pixel2)/μm2 | 0.236 ± 0.04 | 0.300 ± 0.06 | 0.517 ± 0.03 | R vs. R-DS: ns R vs. R-DR: < 0.0001 R-DS vs. R-DR: < 0.0001 |
| R (Mean ± SD) | R-DS (Mean ± SD) | R-DR (Mean ± SD) | P-Value | |
|---|---|---|---|---|
| Densitometric count (pixel2)/μm2 | 1.283 ± 0.34 | 2.427 ± 0.35 | 1.240 ± 0.50 | R vs. R-DS: 0.001 R vs. R-DR: ns R-DS vs. R-DR: 0.0008 |
| R (Mean ± SD) | R-DS (Mean ± SD) | R-DR (Mean ± SD) | p-Value | |
|---|---|---|---|---|
| Densitometric count (pixel2)/μm2 | 0.425 ± 0.08 | 0.306 ± 0.05 | 0.347 ± 0.04 | R vs. R-DS: ns R vs. R-DR: ns R-DS vs. R-DR: ns |
© 2019 by the authors. Licensee MDPI, Basel, Switzerland. This article is an open access article distributed under the terms and conditions of the Creative Commons Attribution (CC BY) license (http://creativecommons.org/licenses/by/4.0/).
Share and Cite
Szychlinska, M.A.; Imbesi, R.; Castrogiovanni, P.; Guglielmino, C.; Ravalli, S.; Di Rosa, M.; Musumeci, G. Assessment of Vitamin D Supplementation on Articular Cartilage Morphology in a Young Healthy Sedentary Rat Model. Nutrients 2019, 11, 1260. https://doi.org/10.3390/nu11061260
Szychlinska MA, Imbesi R, Castrogiovanni P, Guglielmino C, Ravalli S, Di Rosa M, Musumeci G. Assessment of Vitamin D Supplementation on Articular Cartilage Morphology in a Young Healthy Sedentary Rat Model. Nutrients. 2019; 11(6):1260. https://doi.org/10.3390/nu11061260
Chicago/Turabian StyleSzychlinska, Marta Anna, Rosa Imbesi, Paola Castrogiovanni, Claudia Guglielmino, Silvia Ravalli, Michelino Di Rosa, and Giuseppe Musumeci. 2019. "Assessment of Vitamin D Supplementation on Articular Cartilage Morphology in a Young Healthy Sedentary Rat Model" Nutrients 11, no. 6: 1260. https://doi.org/10.3390/nu11061260
APA StyleSzychlinska, M. A., Imbesi, R., Castrogiovanni, P., Guglielmino, C., Ravalli, S., Di Rosa, M., & Musumeci, G. (2019). Assessment of Vitamin D Supplementation on Articular Cartilage Morphology in a Young Healthy Sedentary Rat Model. Nutrients, 11(6), 1260. https://doi.org/10.3390/nu11061260