Effect of Red, Processed, and White Meat Consumption on the Risk of Gastric Cancer: An Overall and Dose–Response Meta-Analysis

 , ,
, ,
Abstract
:1. Introduction
2. Materials and Methods
2.1. Literature Search
2.2. Study Selection Criteria
2.3. Data Extraction and Quality Assessment
2.4. Statistical Analysis
3. Results
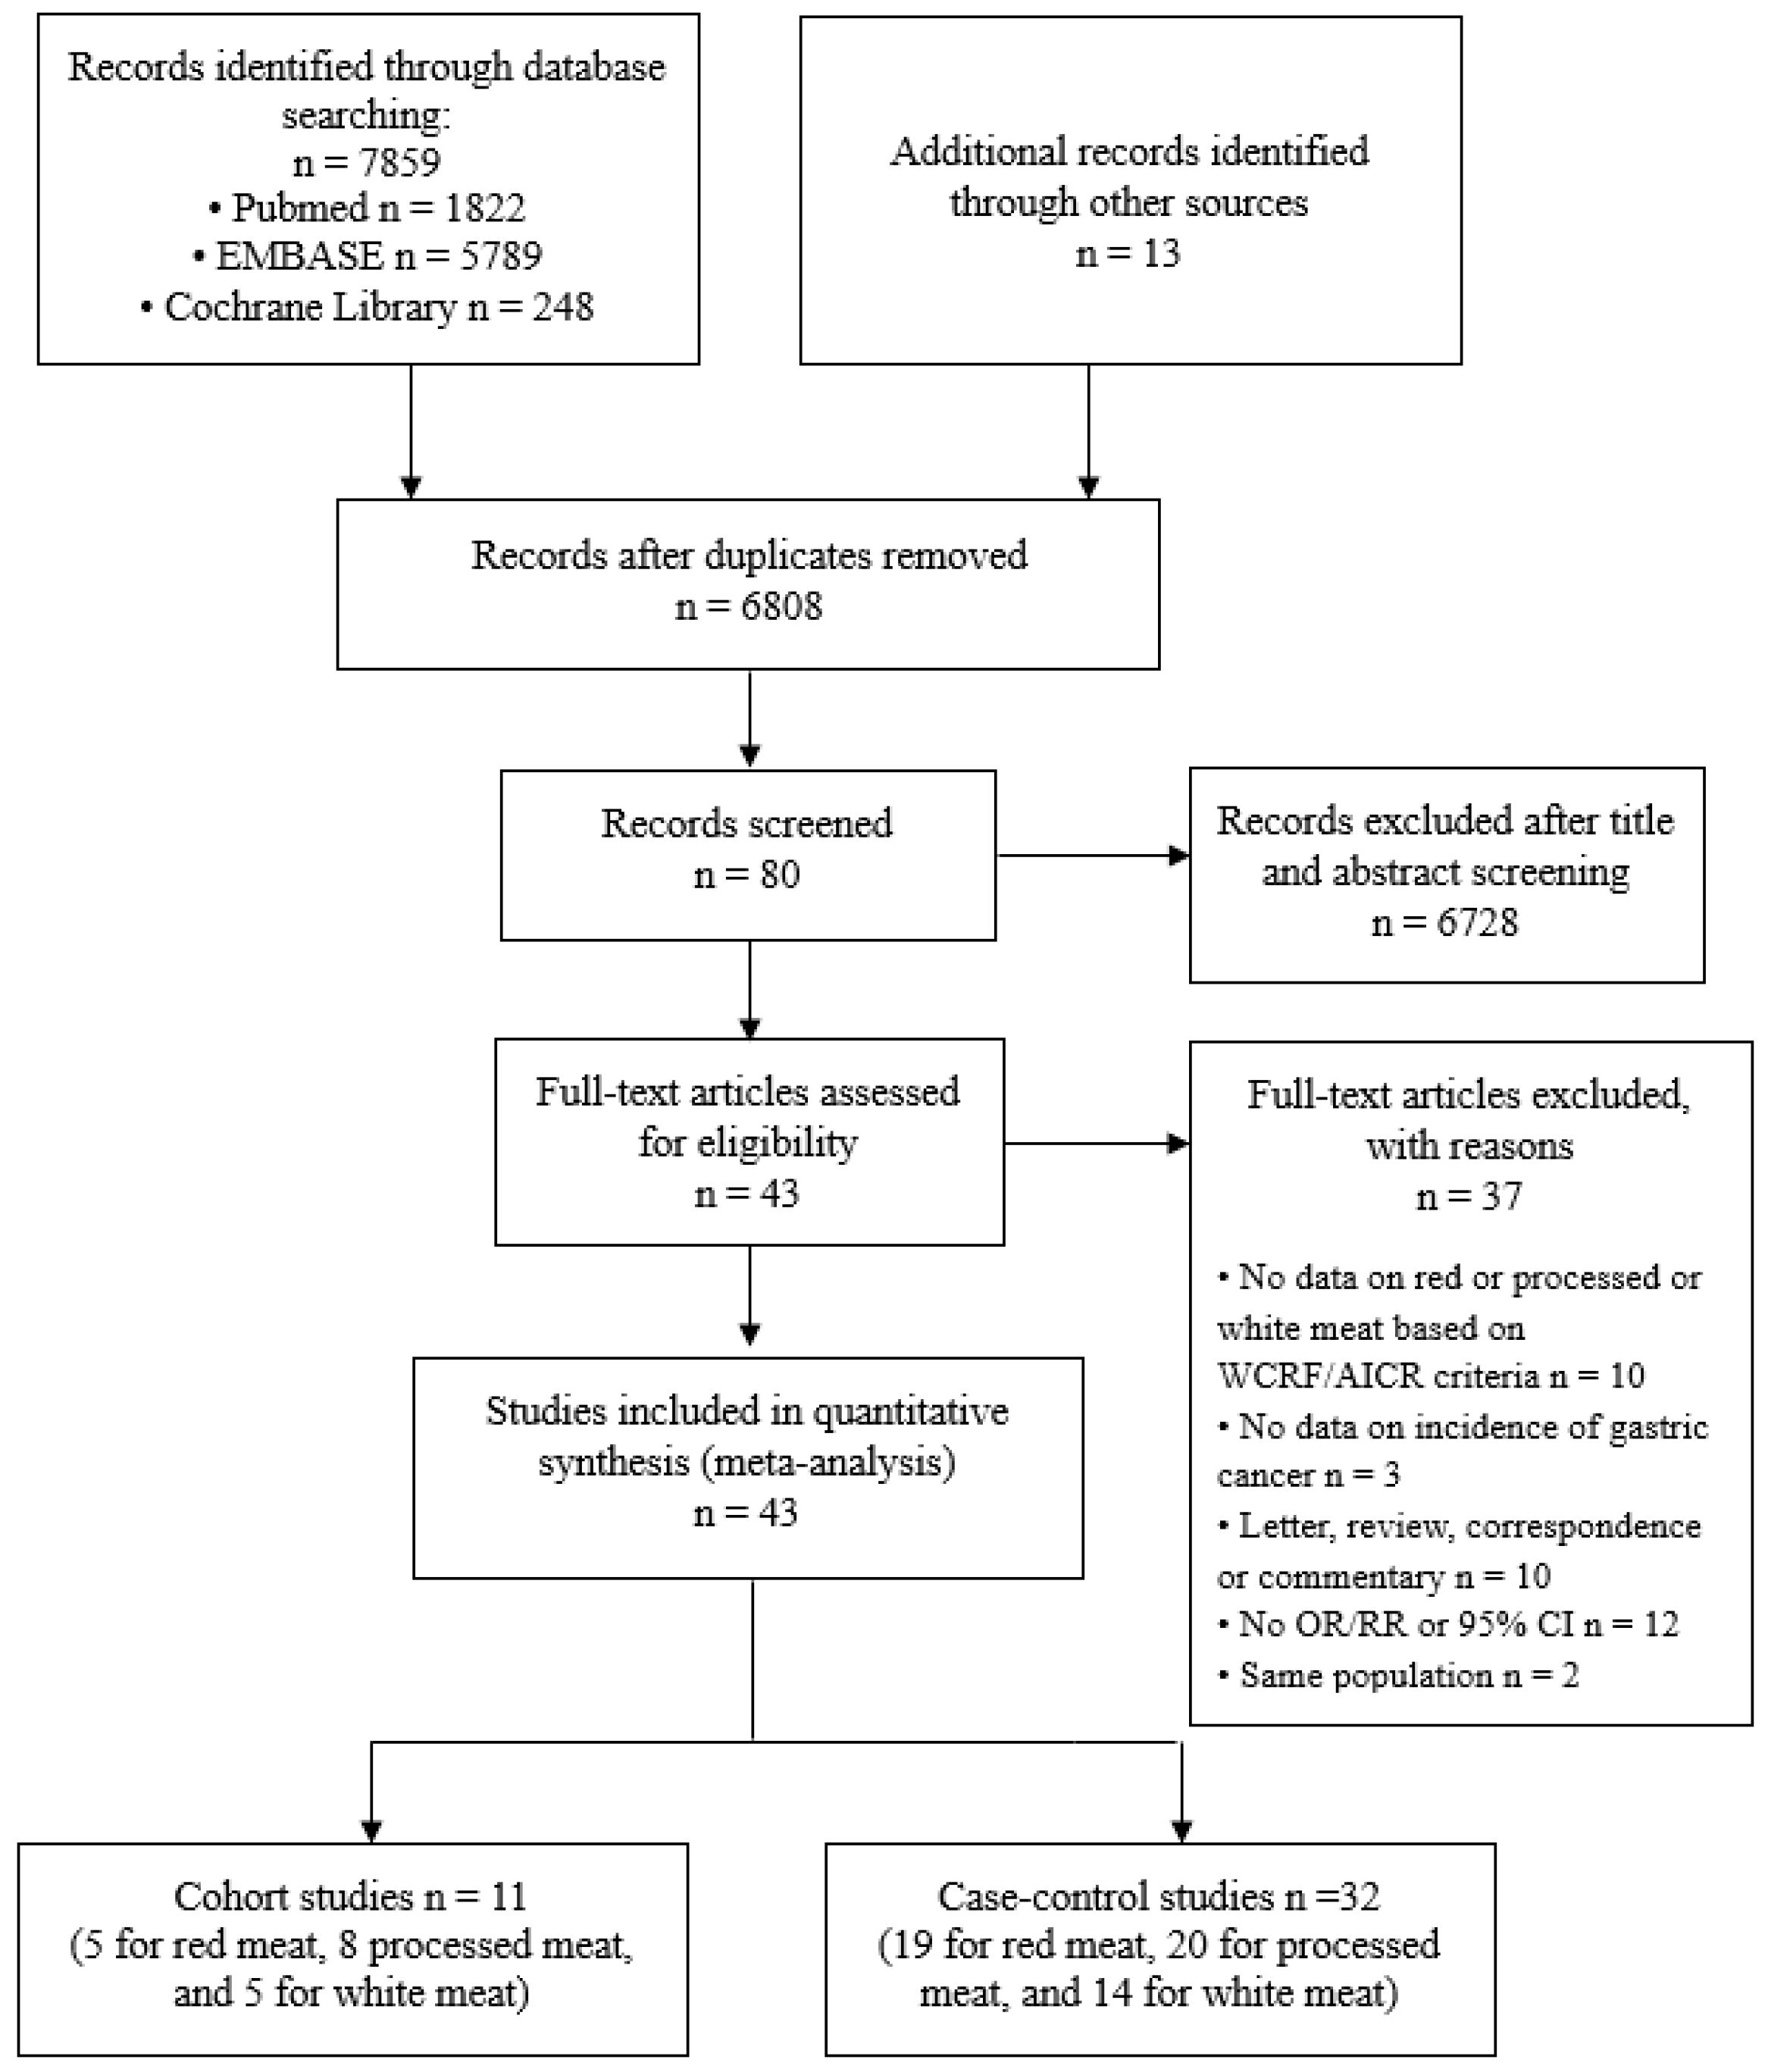
3.1. Literature Search and Study Characteristics.
3.2. Red Meat and Gastric Cancer
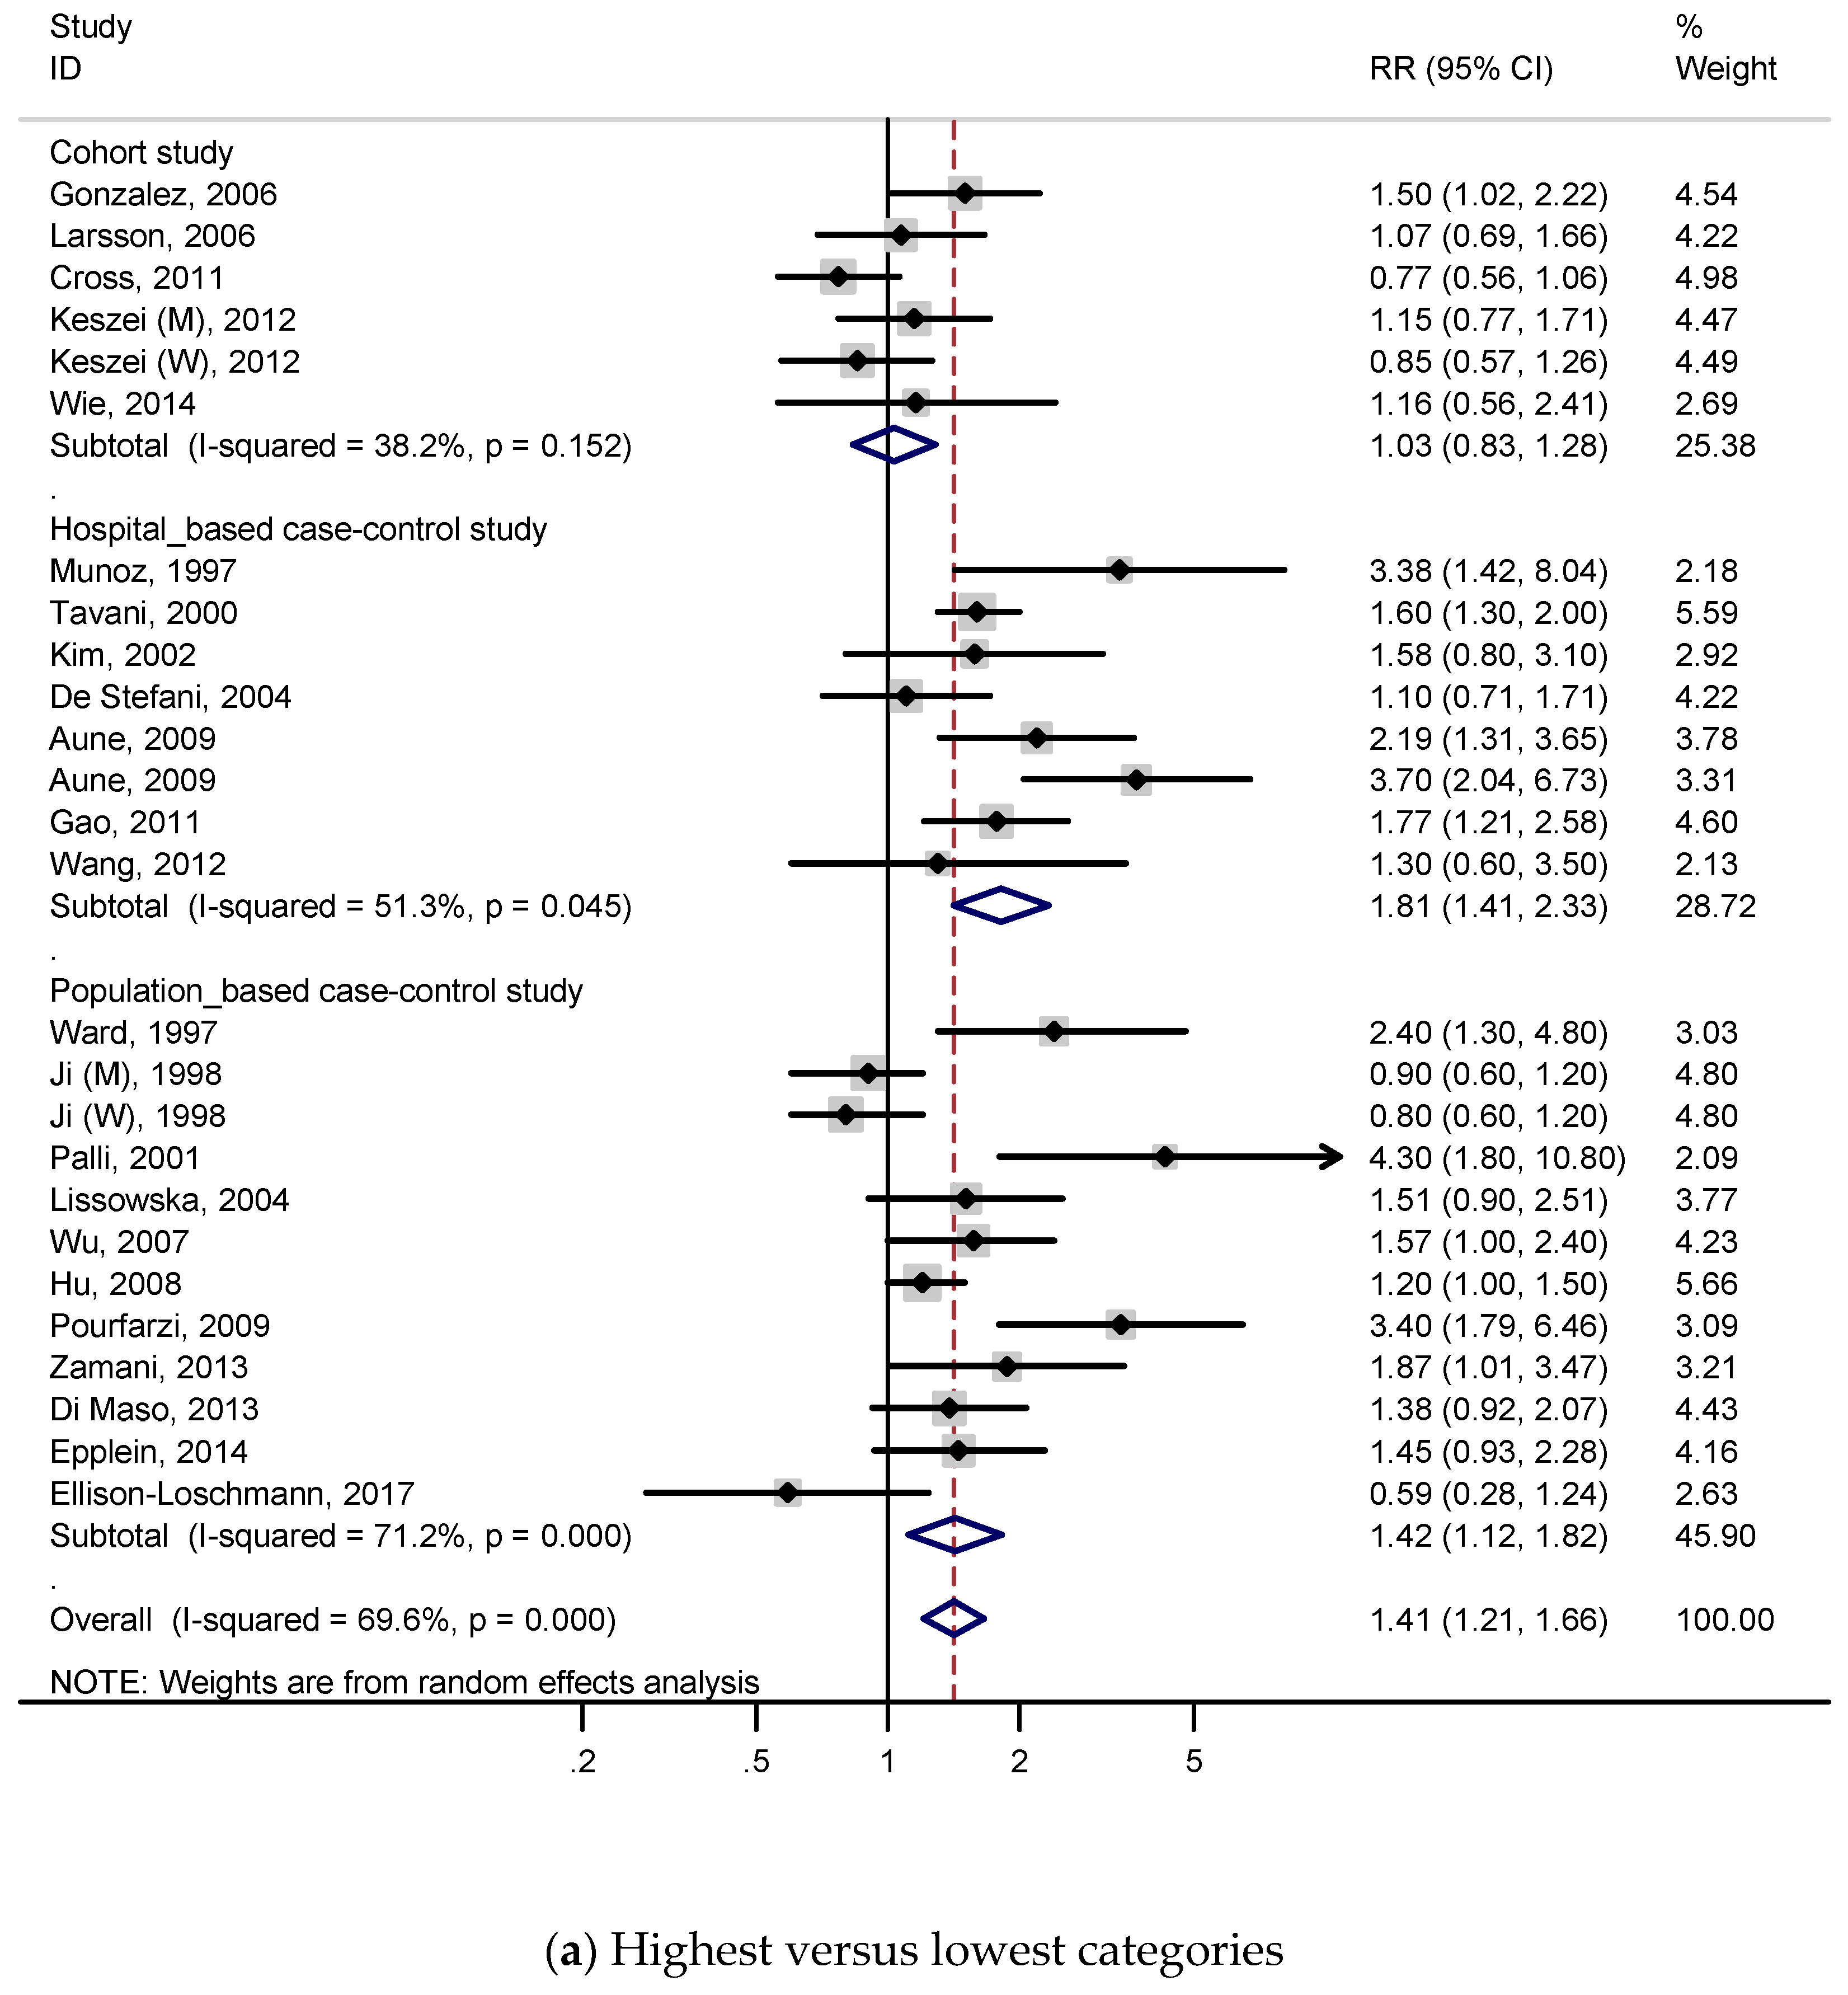
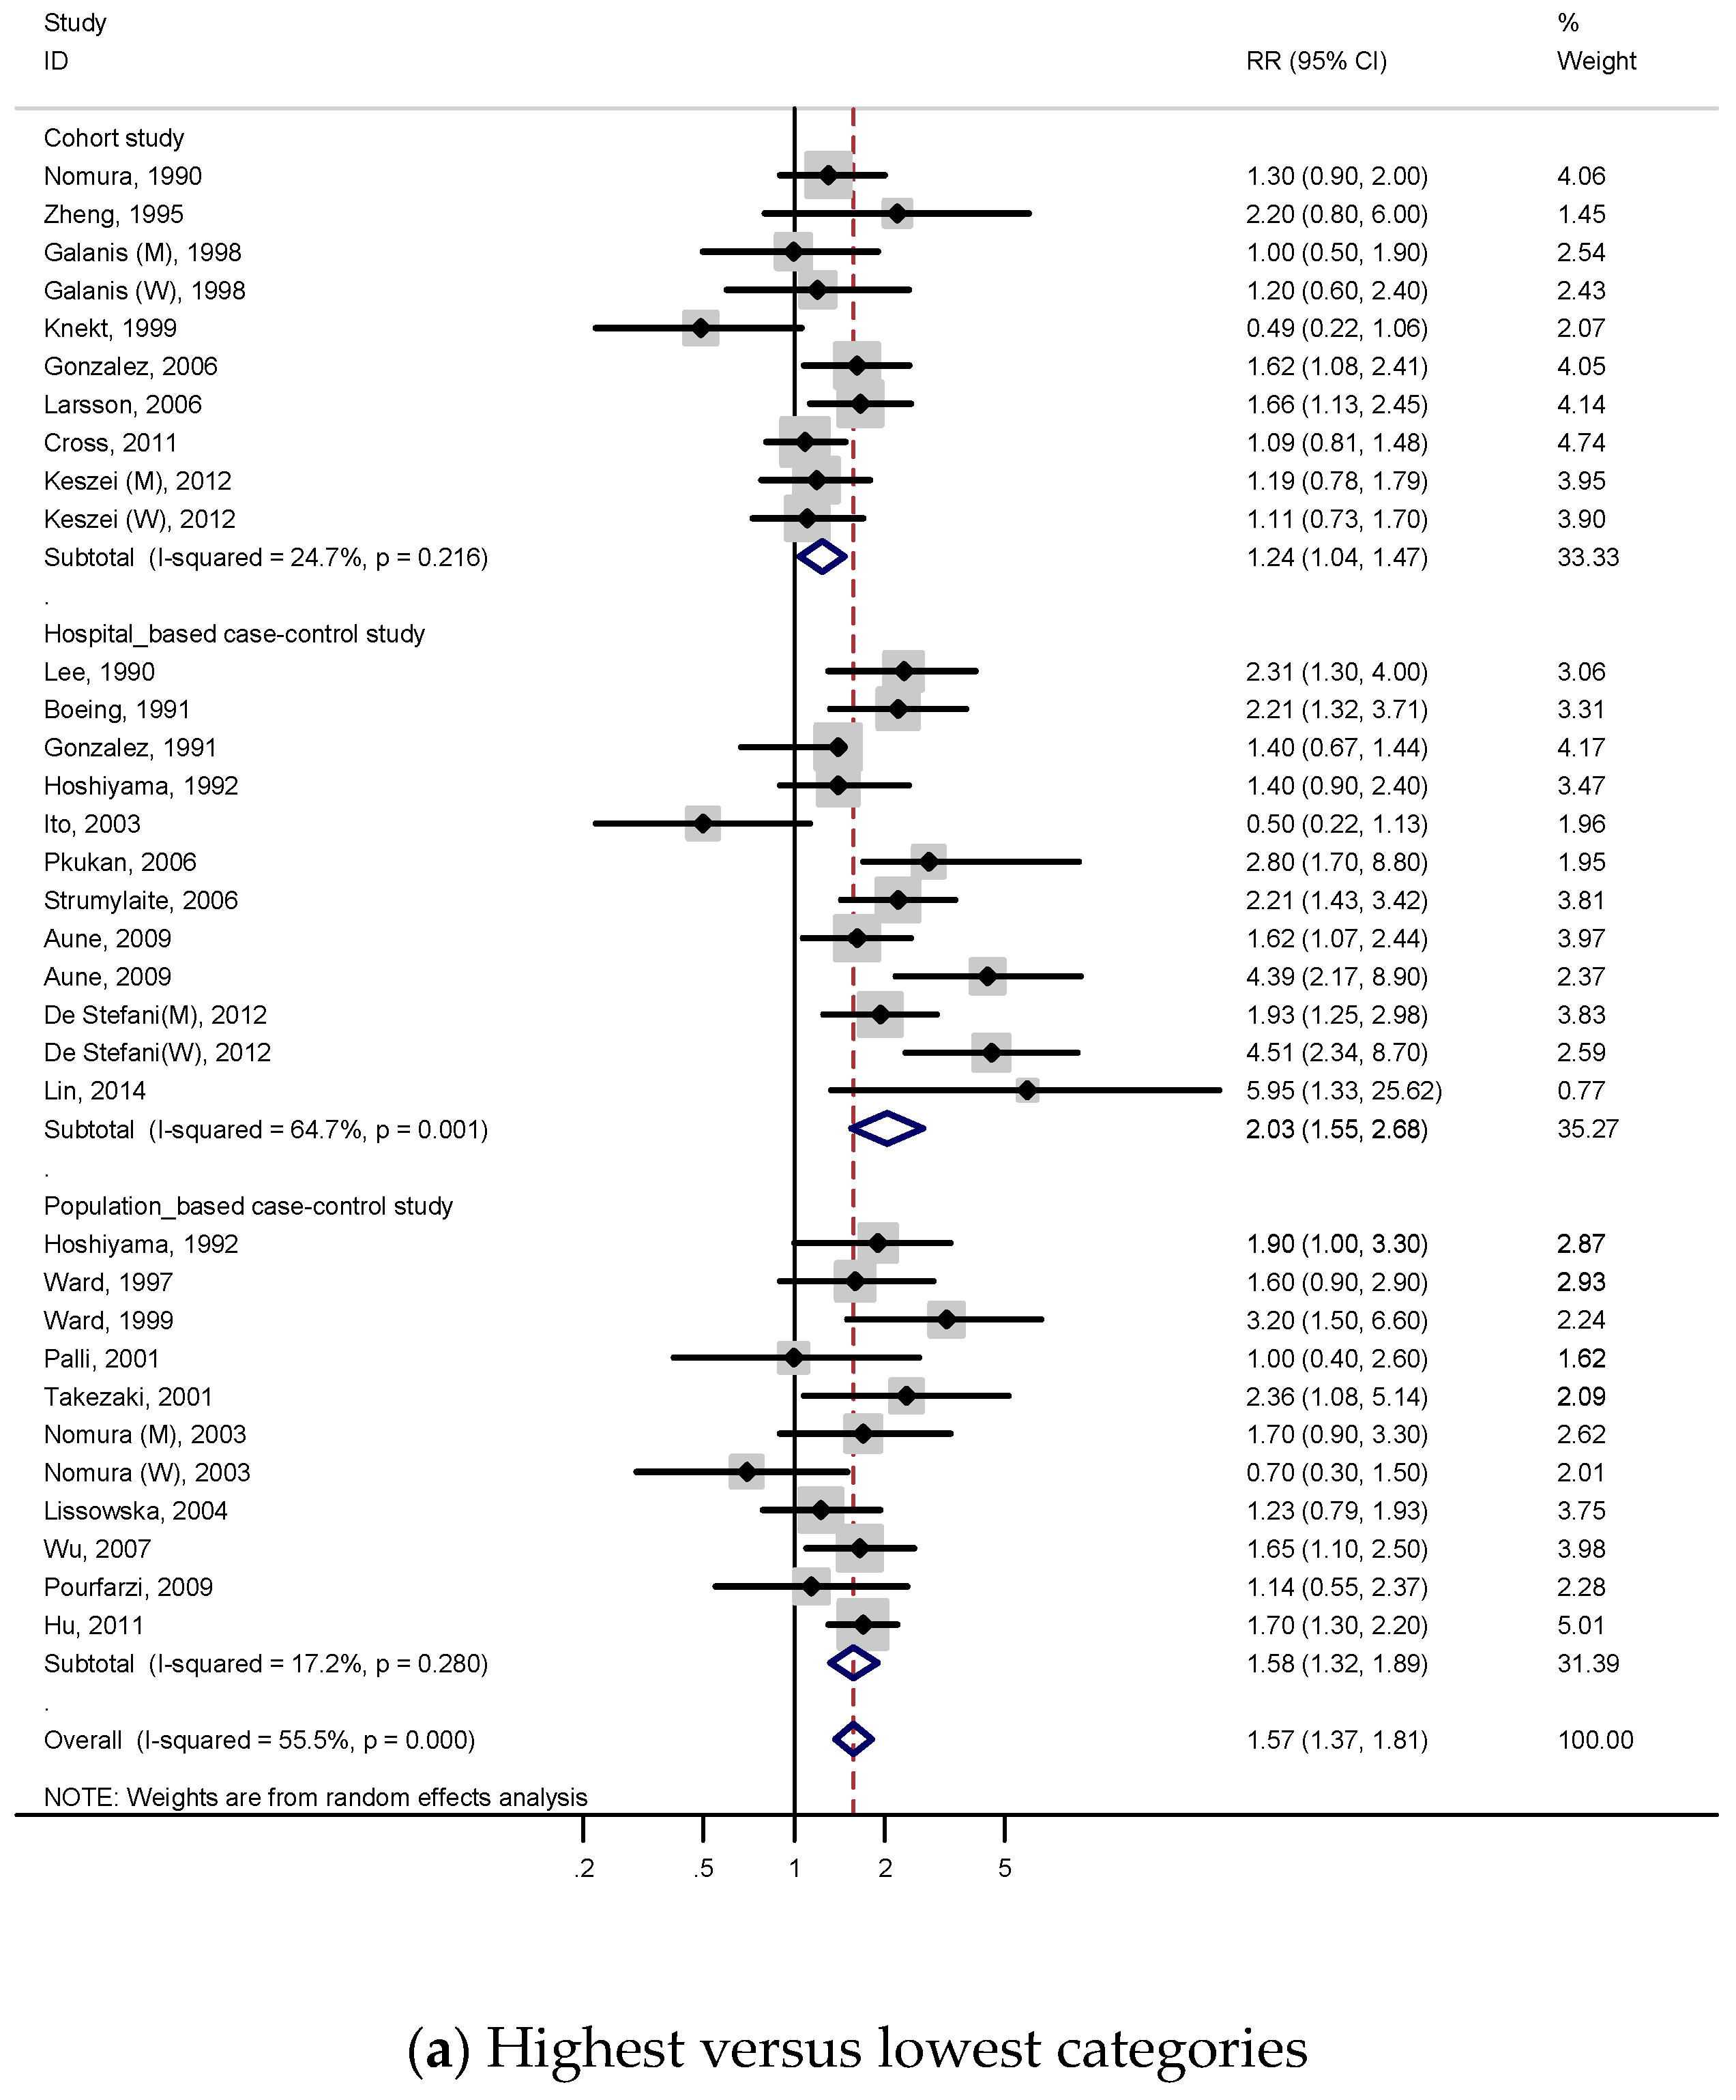
3.2.1. Highest Versus Lowest Consumption
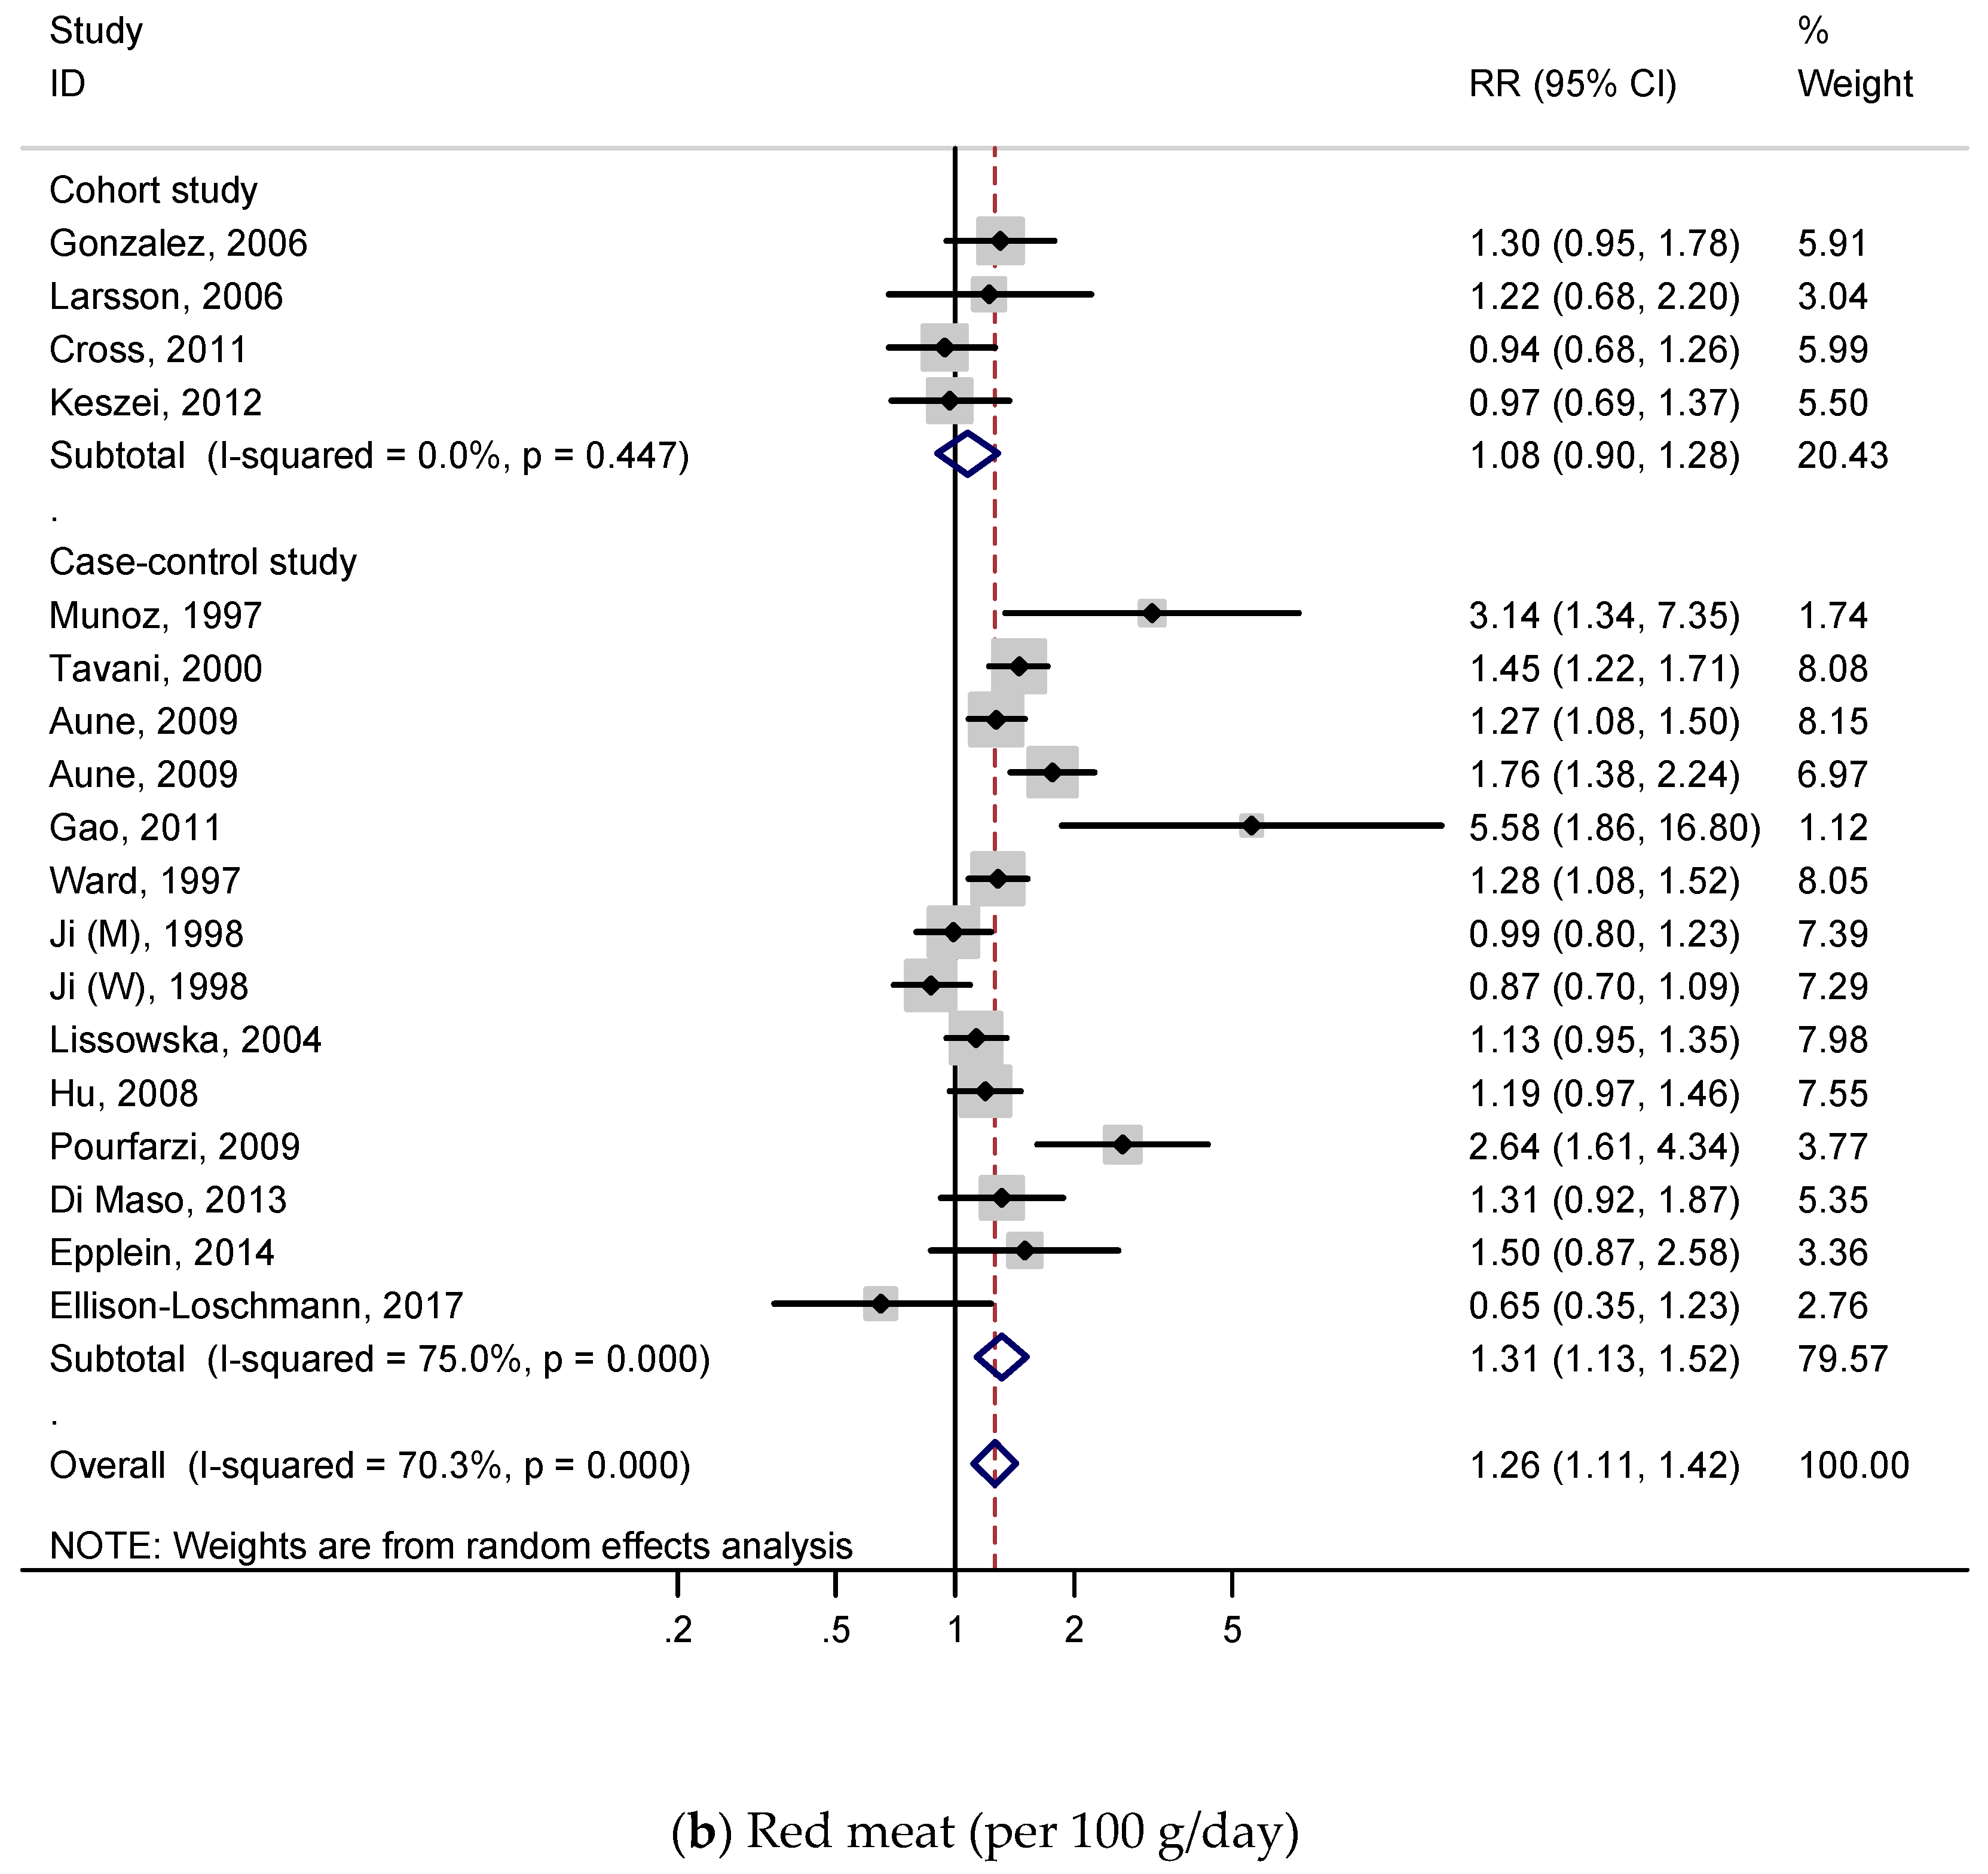
3.2.2. Dose–Response Analysis
3.3. Processed Meat and Gastric Cancer
3.3.1. Highest Versus Lowest Consumption
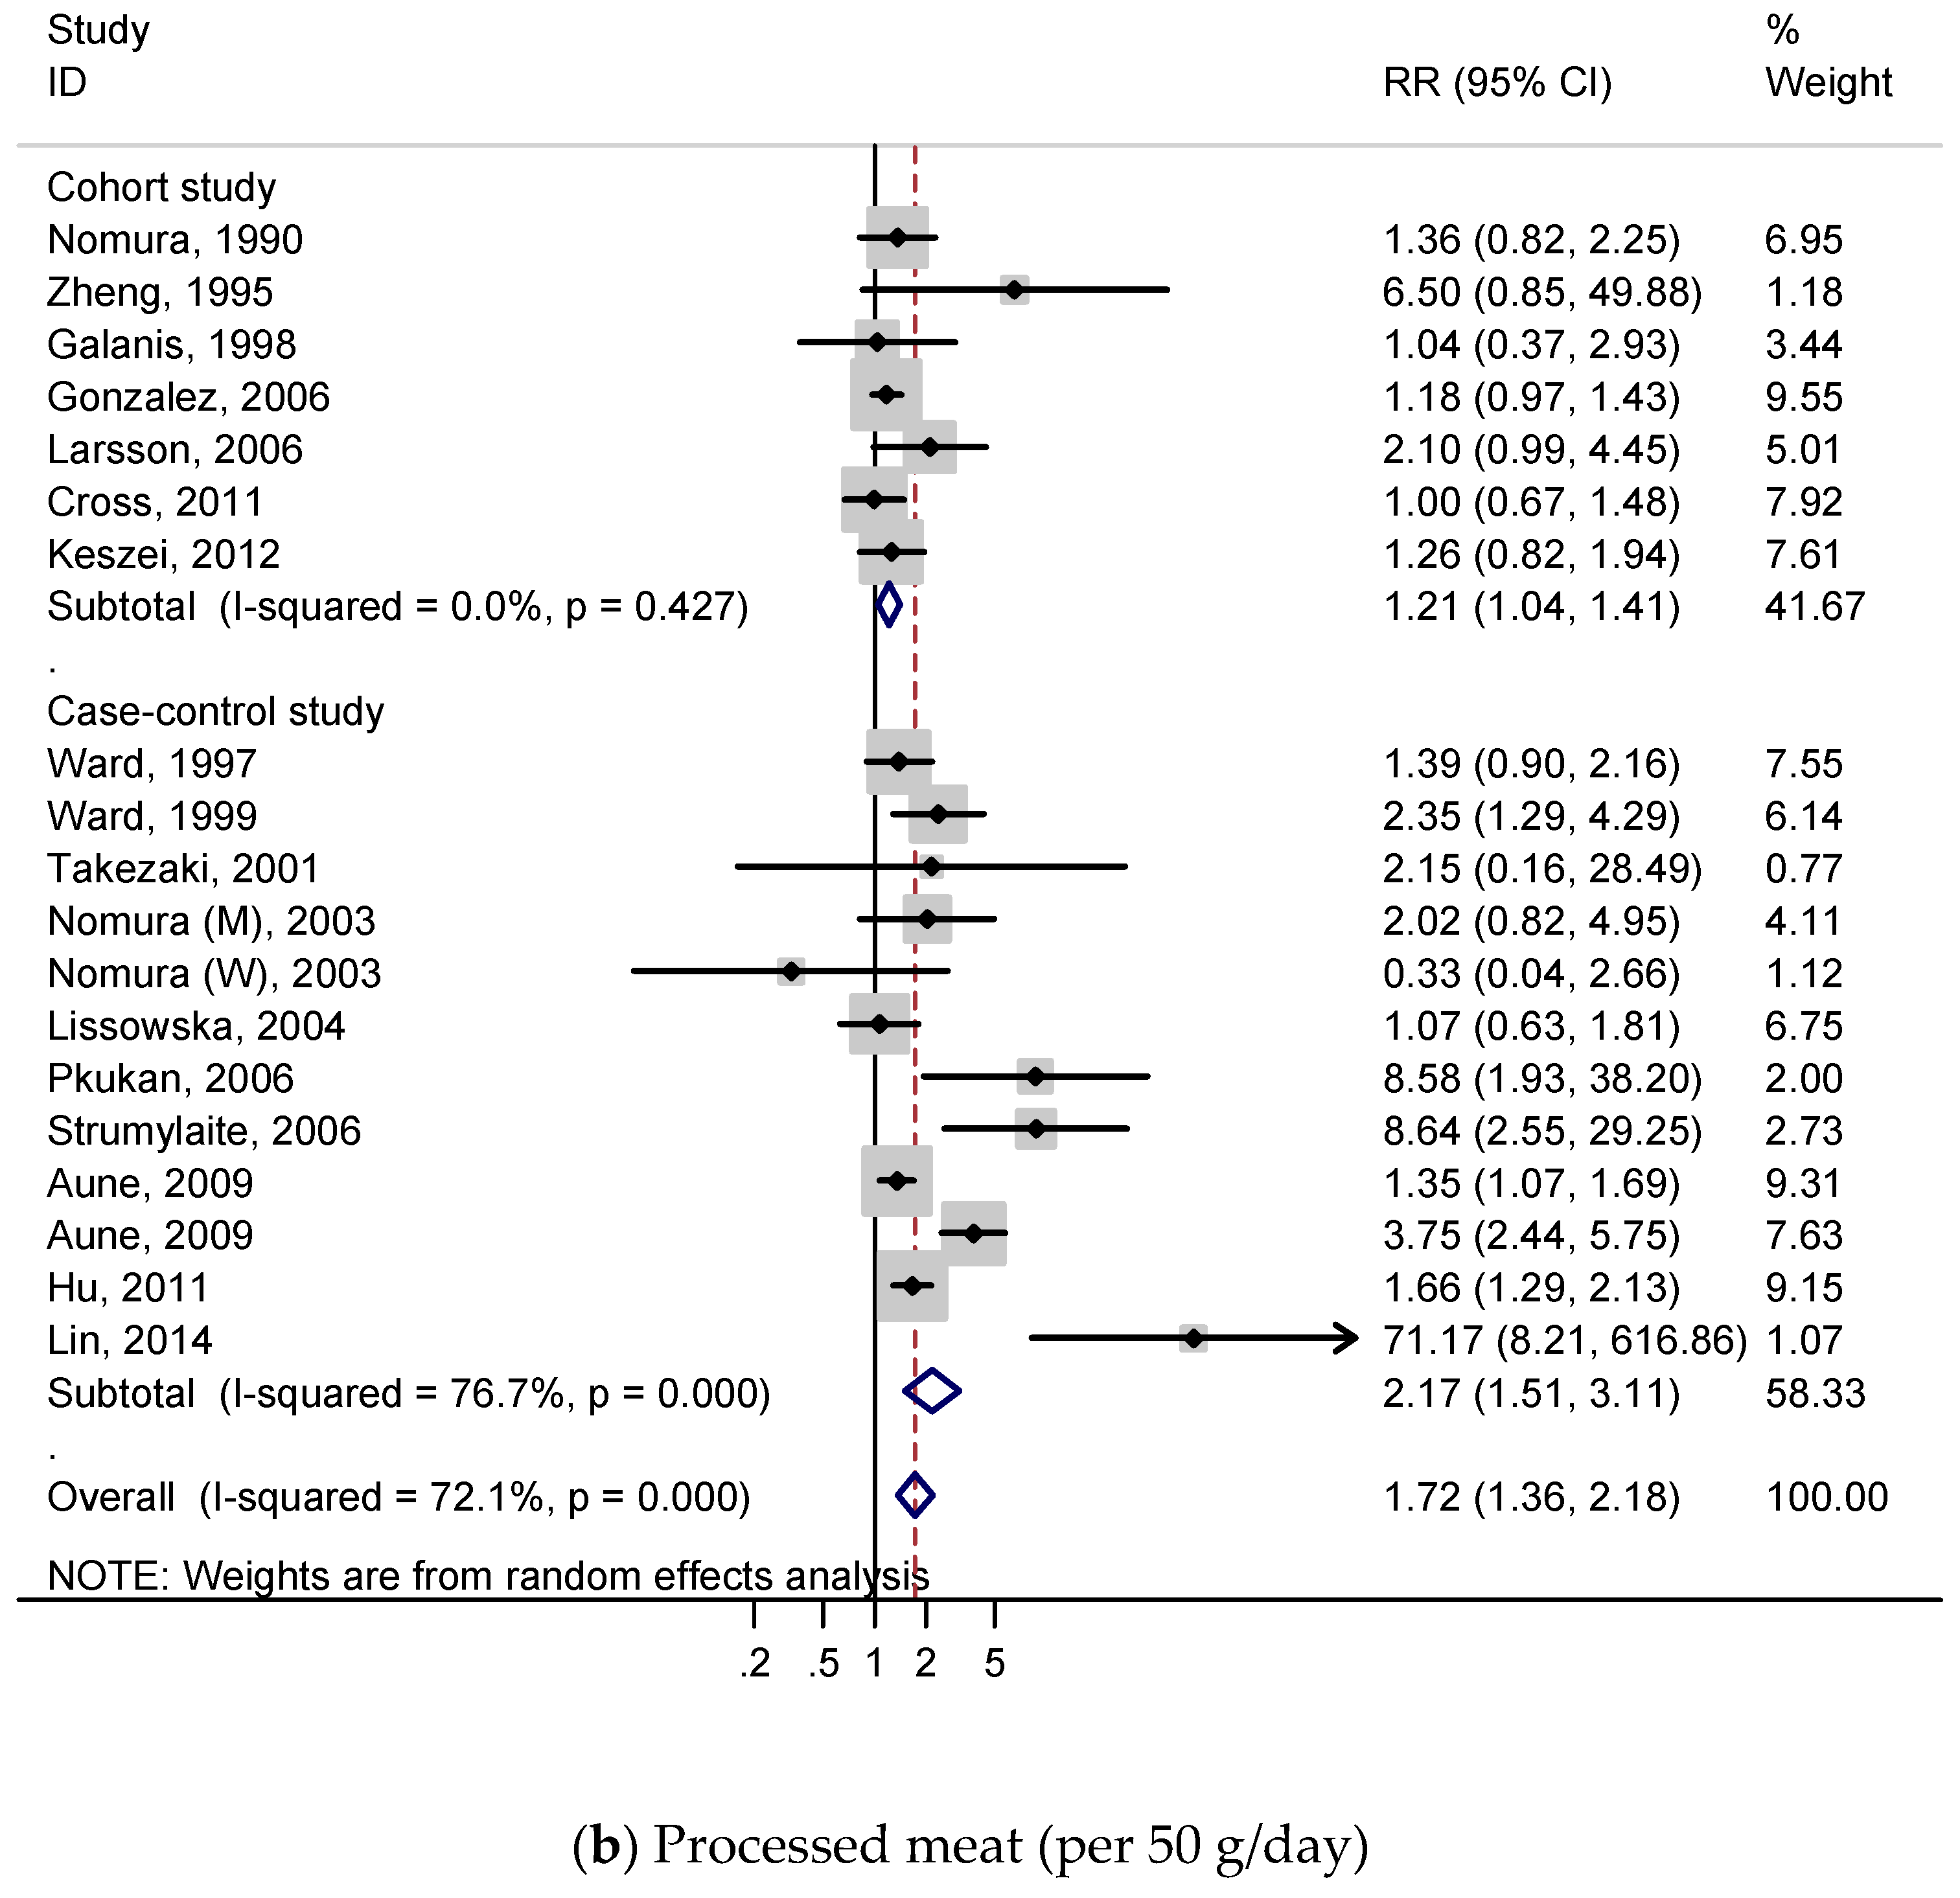
3.3.2. Dose–Response Analysis
3.4. White Meat and Gastric Cancer
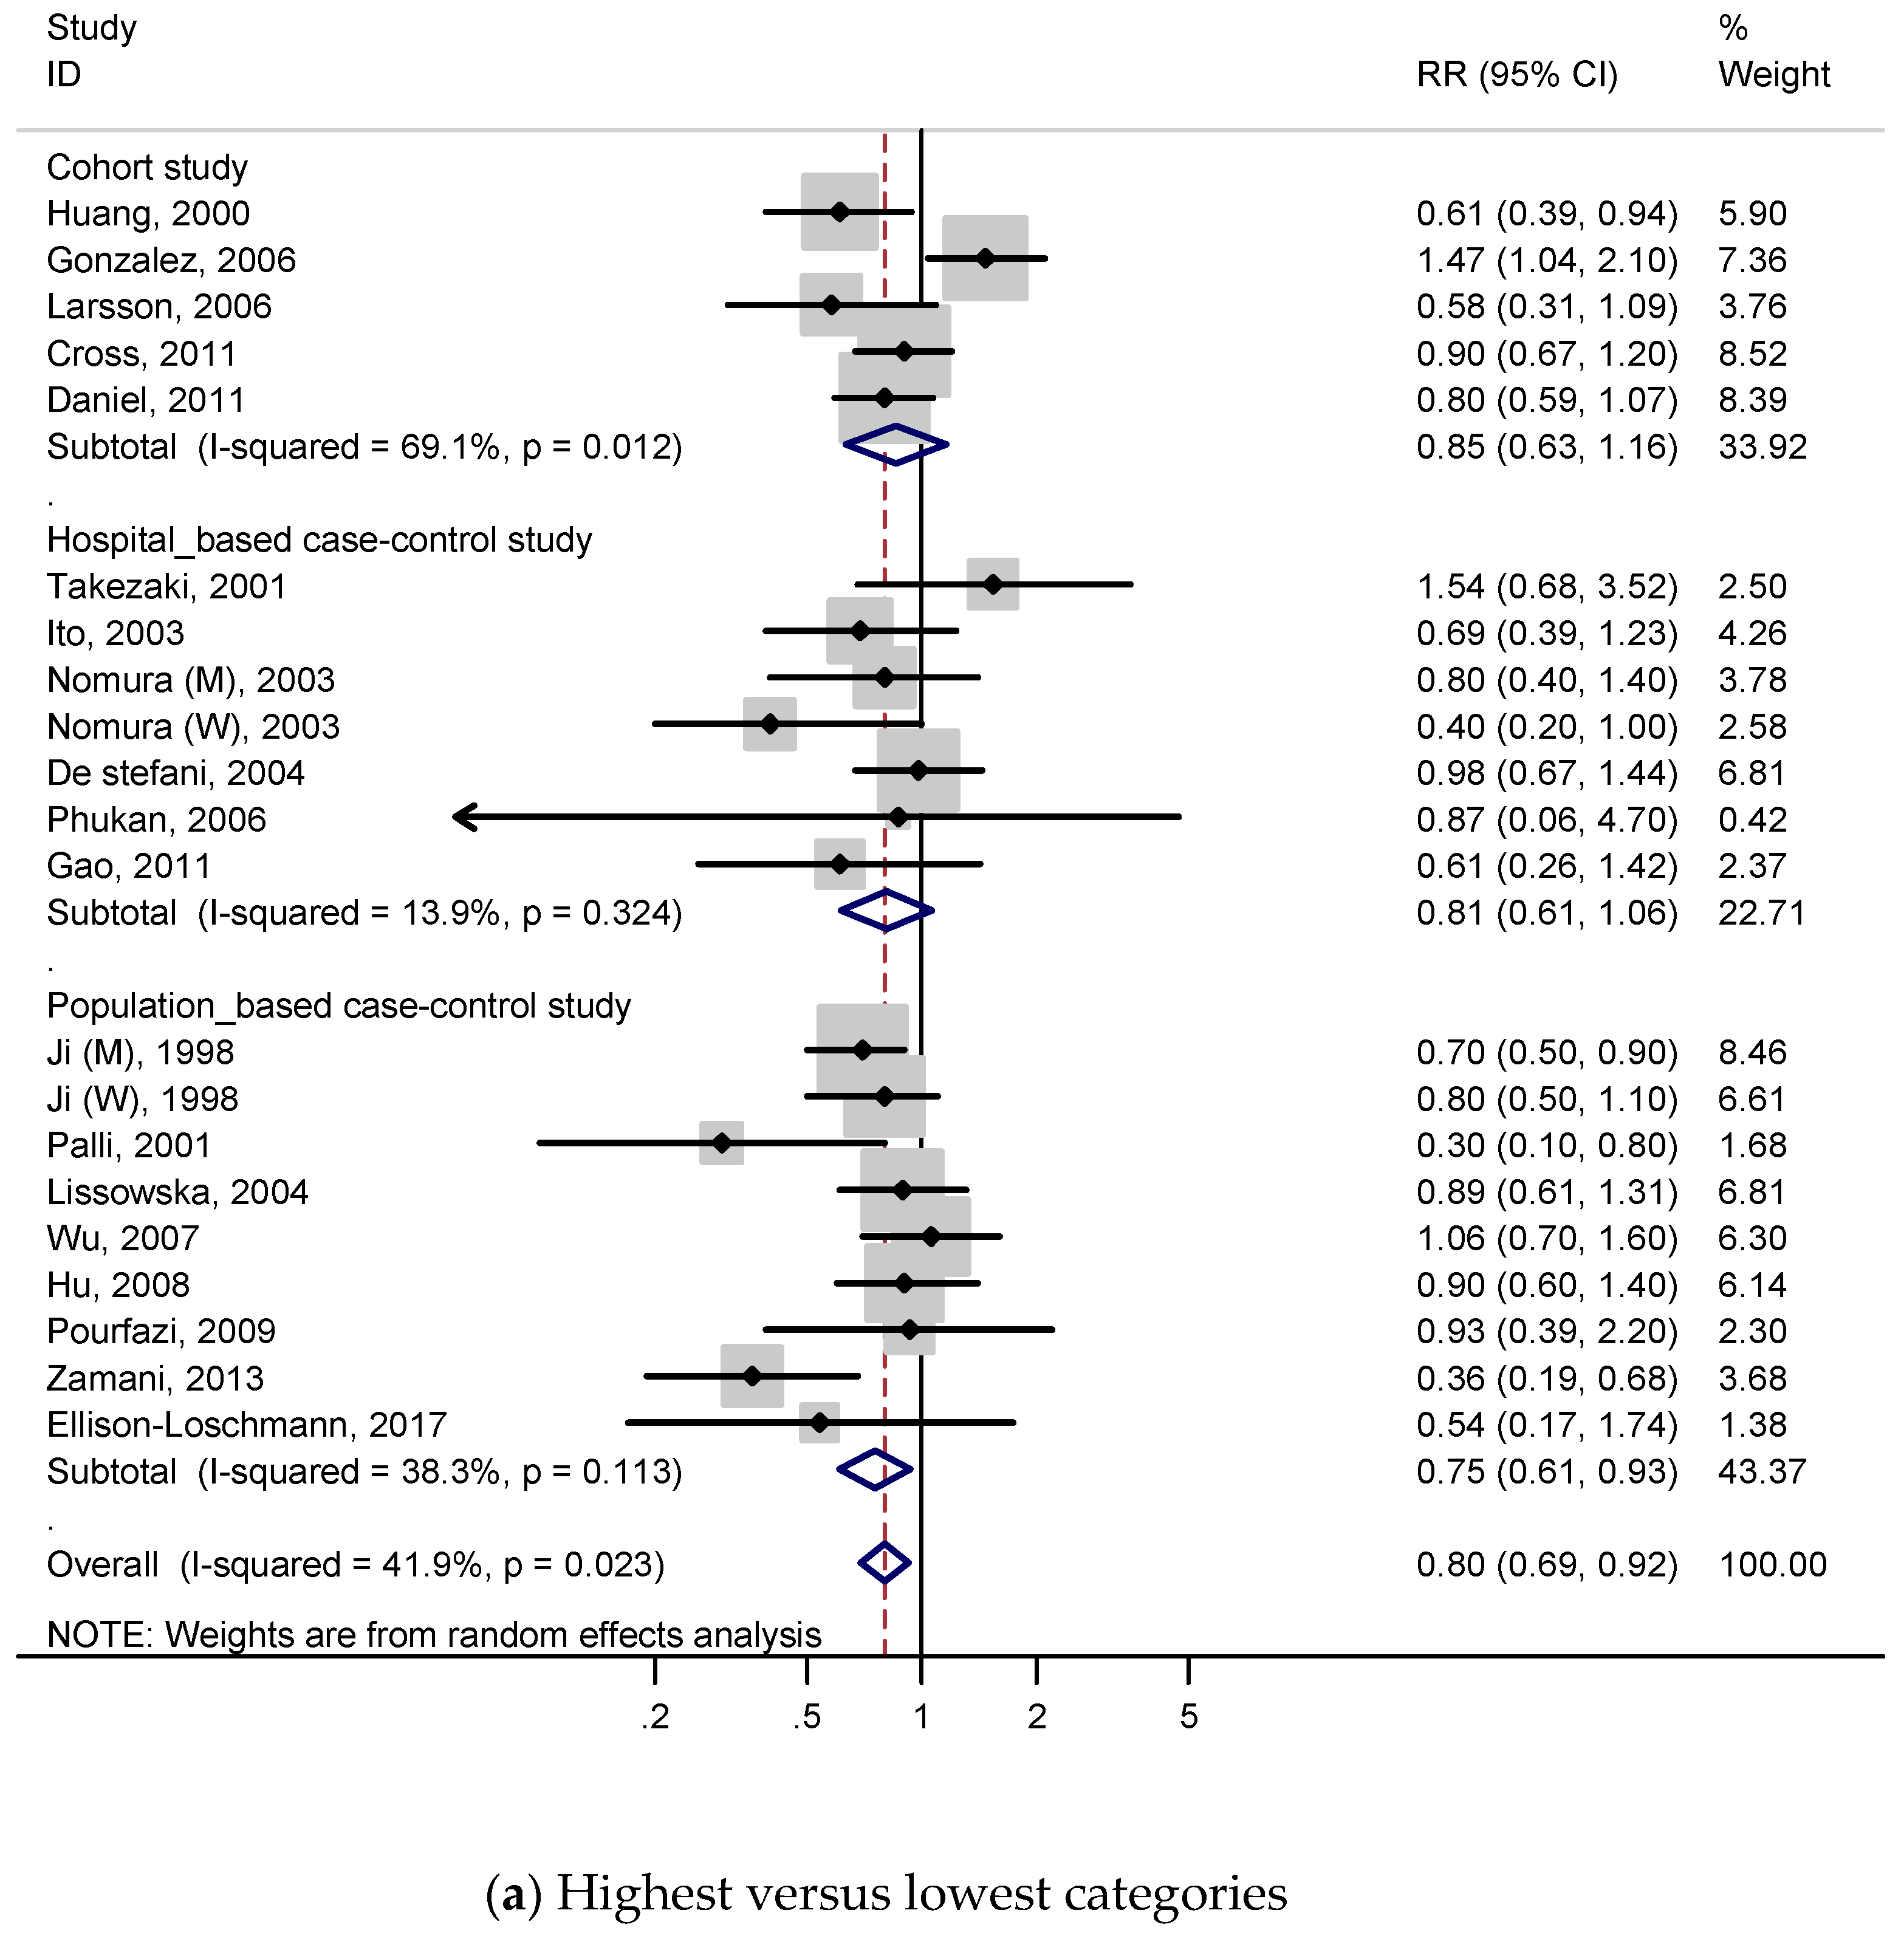
3.4.1. Highest Versus Lowest Consumption
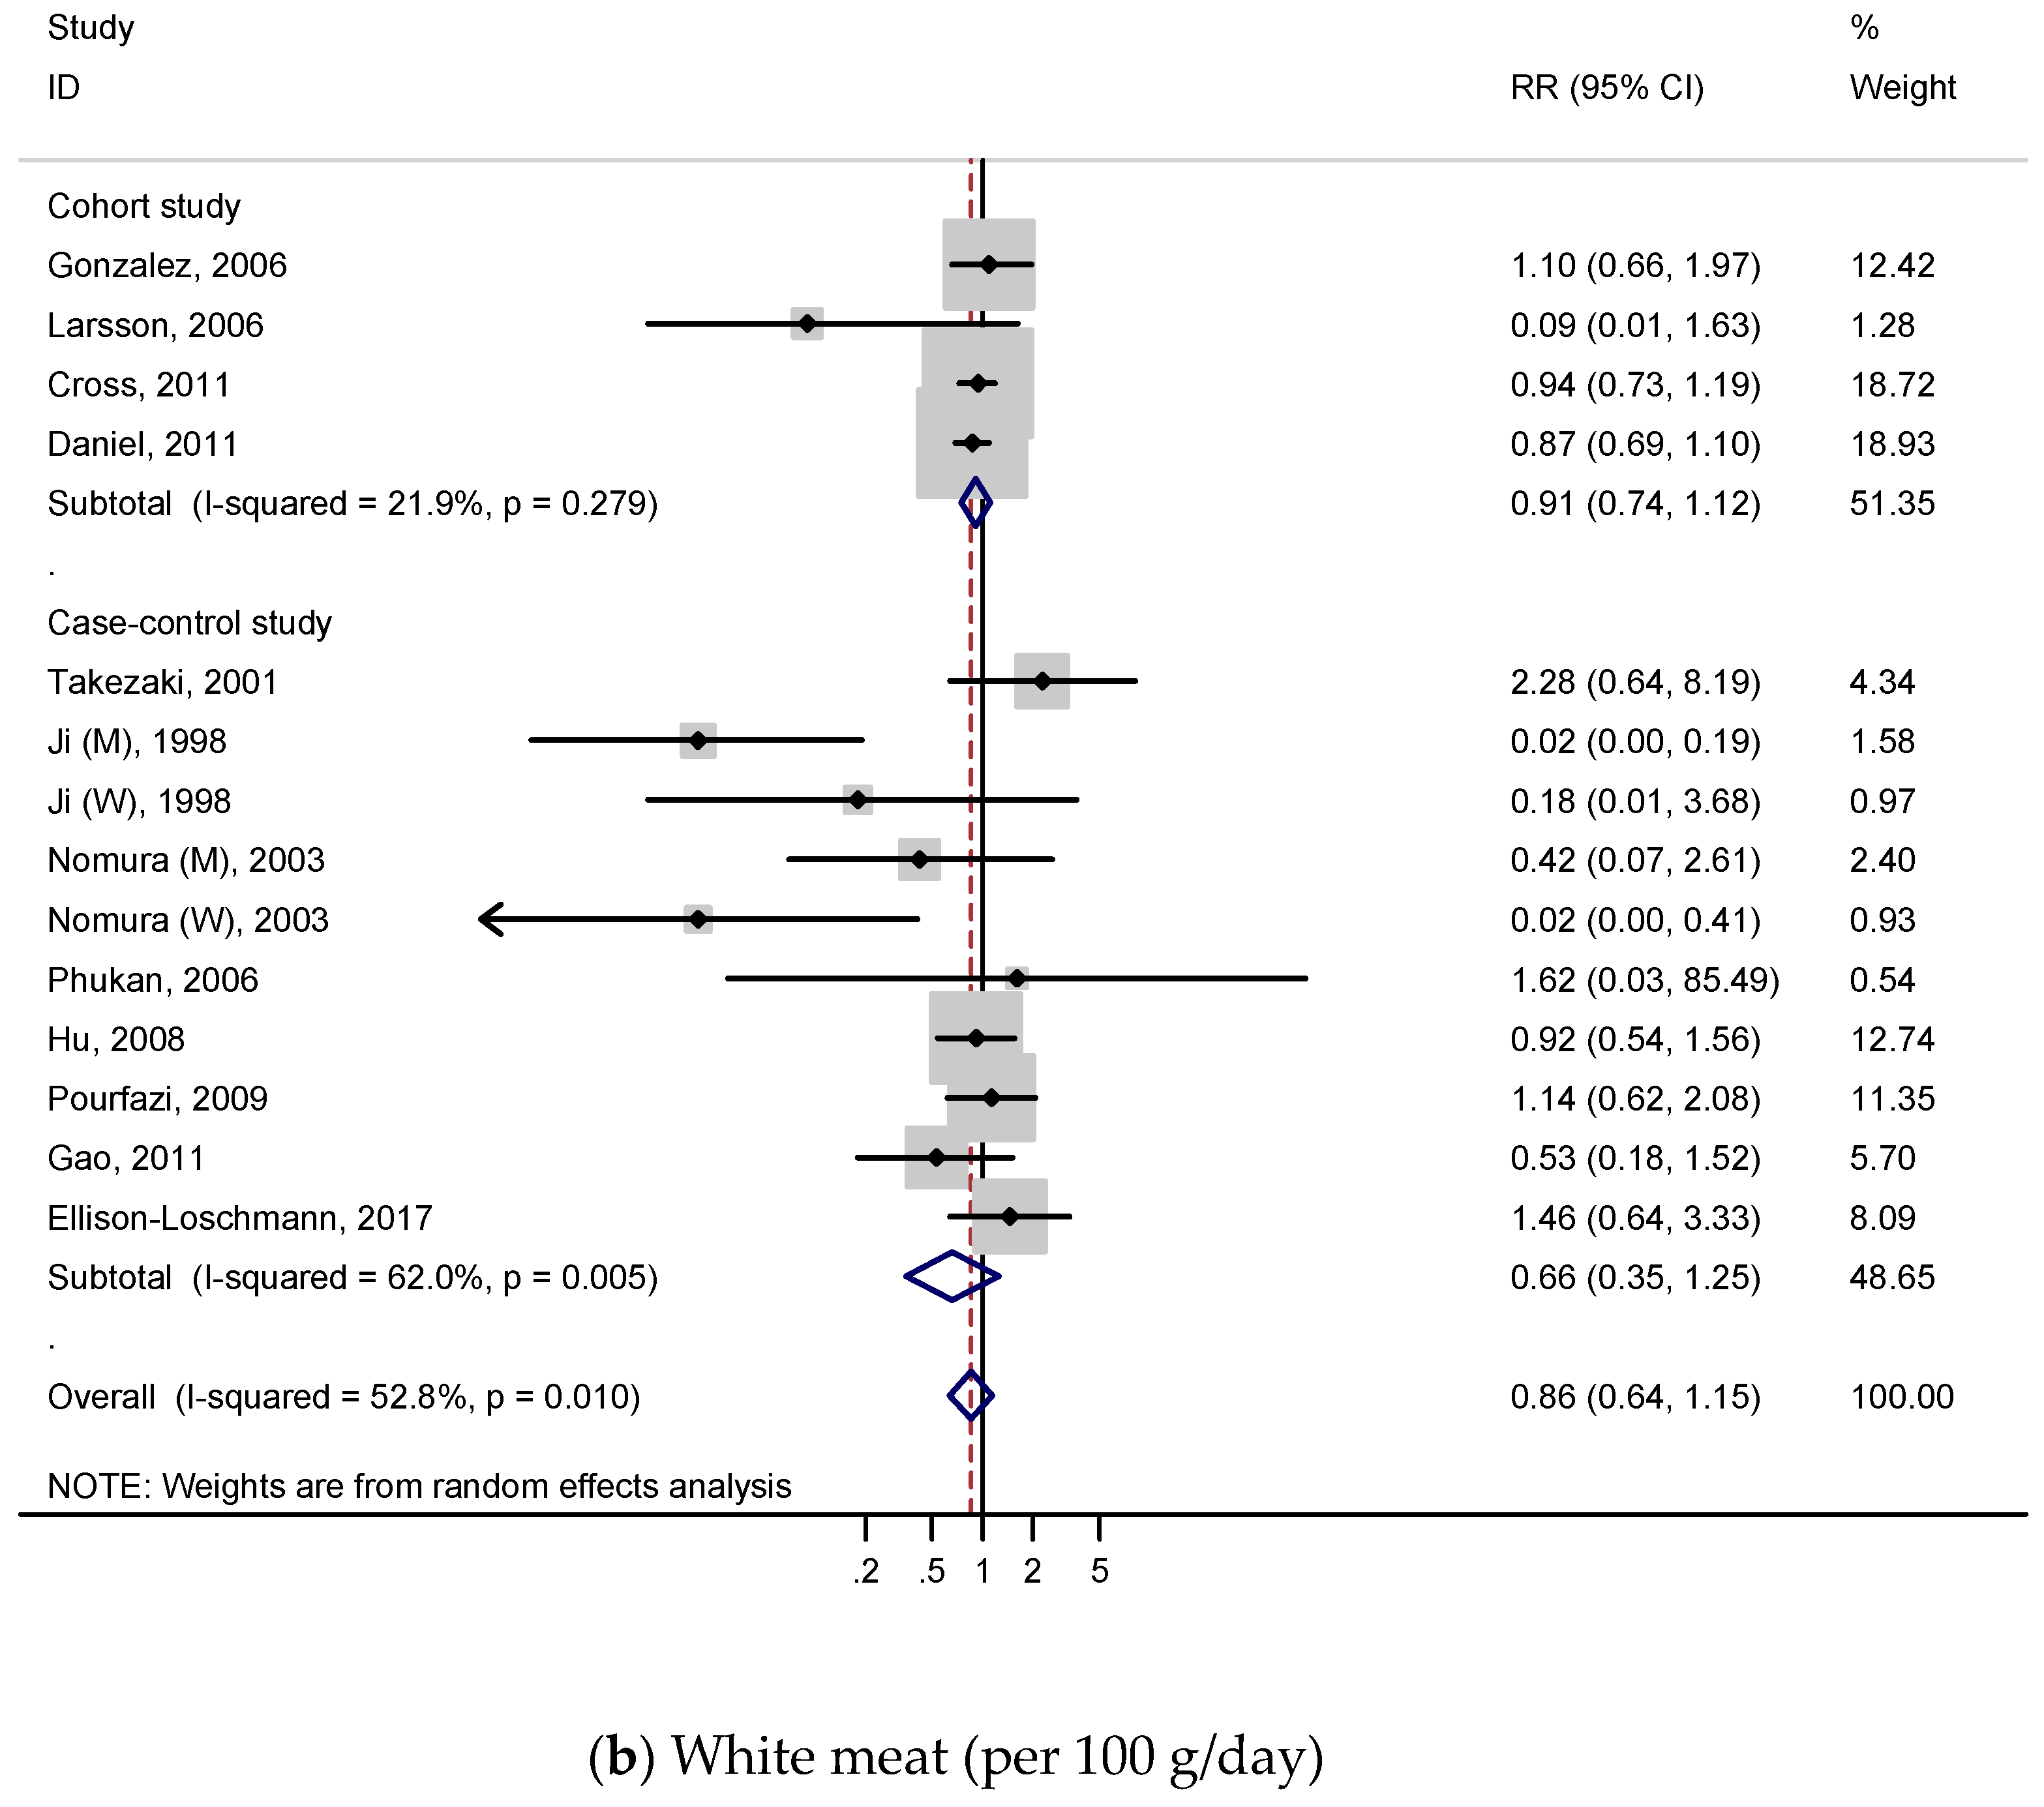
3.4.2. Dose–Response Analysis
4. Discussion
Supplementary Materials
Author Contributions
Funding
Conflicts of Interest
References
- Luo, G.; Zhang, Y.; Guo, P.; Wang, L.; Huang, Y.; Li, K. Global patterns and trends in stomach cancer incidence: Age, period and birth cohort analysis. Int. J. Cancer 2017, 141, 1333–1344. [Google Scholar] [CrossRef] [PubMed]
- Bray, F.; Ferlay, J.; Soerjomataram, I.; Siegel, R.L.; Torre, L.A.; Jemal, A. Global cancer statistics 2018: GLOBOCAN estimates of incidence and mortality worldwide for 36 cancers in 185 countries. CA Cancer J. Clin. 2018, 68, 394–424. [Google Scholar] [CrossRef]
- Grosso, G.; Bella, F.; Godos, J.; Sciacca, S.; Del Rio, D.; Ray, S.; Galvano, F.; Giovannucci, E.L. Possible role of diet in cancer: Systematic review and multiple meta-analyses of dietary patterns, lifestyle factors, and cancer risk. Nutr. Rev. 2017, 75, 405–419. [Google Scholar] [CrossRef] [PubMed]
- González, C.A.; Jakszyn, P.; Pera, G.; Agudo, A.; Bingham, S.; Palli, D.; Ferrari, P.; Boeing, H.; del Giudice, G.; Plebani, M.; et al. Meat intake and risk of stomach and esophageal adenocarcinoma within the European Prospective Investigation Into Cancer and Nutrition (EPIC). J. Natl. Cancer Inst. 2006, 98, 345–354. [Google Scholar] [CrossRef] [PubMed]
- Daniel, C.R.; Cross, A.J.; Koebnick, C.; Sinha, R. Trends in meat consumption in the USA. Public Health Nutr. 2011, 14, 575–583. [Google Scholar] [CrossRef]
- World Cancer Research Fund International/American Institute for Cancer Research. Continuous Update Project Report: Diet, Nutrition, Physical Activity and Stomach Cancer. 2016. Available online: wcrf.org/stomach-cancer-2016 (accessed on 26 January 2018).
- World Cancer Research Fund/American Institute for Cancer Research. Continuous Update Project Expert Report 2018. Diet, Nutrition, Physical Activity and Stomach Cancer. Available online: dietandcancerreport.org (accessed on 4 February 2018).
- Zhu, H.; Yang, X.; Zhang, C.; Zhu, C.; Tao, G.; Zhao, L.; Tang, S.; Shu, Z.; Cai, J.; Dai, S.; et al. Red and processed meat intake is associated with higher gastric cancer risk: A meta-analysis of epidemiological observational studies. PLoS ONE 2013, 8, e70955. [Google Scholar] [CrossRef] [PubMed]
- Zhao, Z.; Yin, Z.; Zhao, Q. Red and processed meat consumption and gastric cancer risk: A systematic review and meta-analysis. Oncotarget 2017, 8, 30563–30575. [Google Scholar] [CrossRef] [PubMed]
- Moher, D.; Liberati, A.; Tetzlaff, J.; Altman, D.G.; Group, P. Preferred reporting items for systematic reviews and meta-analyses: The PRISMA statement. PLoS Med. 2009, 6, e1000097. [Google Scholar] [CrossRef]
- Stroup, D.F.; Berlin, J.A.; Morton, S.C.; Olkin, I.; Williamson, G.D.; Rennie, D.; Moher, D.; Becker, B.J.; Sipe, T.A.; Thacker, S.B. Meta-analysis of observational studies in epidemiology: A proposal for reporting. Meta-analysis Of Observational Studies in Epidemiology (MOOSE) group. JAMA 2000, 283, 2008–2012. [Google Scholar] [CrossRef]
- World Cancer Research Fund/American Institute for Cancer Research. Food, Nutrition, Physical Activity, and the Prevention of Cancer: A Global Perspective; AICR: Washington, DC, USA, 2007.
- Wells, G.A.; Shea, B.; O’Connell, D.; Peterson, J.; Welch, V.; Losos, M.; Tugwell, P. The Newcastle-Ottawa Scale (NOS) for Assessing the Quality of Nonrandomised Studies in Metaanalyses. Available online: http://www.ohri.ca/programs/clinical_epidemiology/oxford.asp (accessed on 17 January 2017).
- Greenland, S. Quantitative methods in the review of epidemiologic literature. Epidemiol. Rev. 1987, 9, 1–30. [Google Scholar] [CrossRef]
- Rothman, K.J.; Greenland, S.; Lash, T.L. Modern Epidemiology, 3rd ed.; Lippincott Williams and Wilkins: Philadelphia, PA, USA, 2009. [Google Scholar]
- DerSimonian, R.; Laird, N. Meta-analysis in clinical trials. Control. Clin. Trials 1986, 7, 177–188. [Google Scholar] [CrossRef]
- Greenland, S.; Longnecker, M.P. Methods for trend estimation from summarized dose-response data, with applications to meta-analysis. Am. J. Epidemiol. 1992, 135, 1301–1309. [Google Scholar] [CrossRef]
- Higgins, J.P.; Thompson, S.G.; Deeks, J.J.; Altman, D.G. Measuring inconsistency in meta-analyses. BMJ 2003, 327, 557–560. [Google Scholar] [CrossRef]
- Egger, M.; Davey Smith, G.; Schneider, M.; Minder, C. Bias in meta-analysis detected by a simple, graphical test. BMJ 1997, 315, 629–634. [Google Scholar] [CrossRef]
- Begg, C.B.; Mazumdar, M. Operating characteristics of a rank correlation test for publication bias. Biometrics 1994, 50, 1088–1101. [Google Scholar] [CrossRef]
- Nomura, A.; Grove, J.S.; Stemmermann, G.N.; Severson, R.K. A prospective study of stomach cancer and its relation to diet, cigarettes, and alcohol consumption. Cancer Res. 1990, 50, 627–631. [Google Scholar]
- Galanis, D.J.; Kolonel, L.N.; Lee, J.; Nomura, A. Intakes of selected foods and beverages and the incidence of gastric cancer among the Japanese residents of Hawaii: A prospective study. Int. J. Epidemiol. 1998, 27, 173–180. [Google Scholar] [CrossRef]
- Knekt, P.; Järvinen, R.; Dich, J.; Hakulinen, T. Risk of colorectal and other gastro-intestinal cancers after exposure to nitrate, nitrite and N-nitroso compounds: A follow-up study. Int. J. Cancer 1999, 80, 852–856. [Google Scholar] [CrossRef]
- Huang, X.E.; Tajima, K.; Hamajima, N.; Kodera, Y.; Yamamura, Y.; Xiang, J.; Tominaga, S.; Tokudome, S. Effects of dietary, drinking, and smoking habits on the prognosis of gastric cancer. Nutr. Cancer 2000, 38, 30–36. [Google Scholar] [CrossRef]
- Larsson, S.C.; Bergkvist, L.; Wolk, A. Processed meat consumption, dietary nitrosamines and stomach cancer risk in a cohort of Swedish women. Int. J. Cancer 2006, 119, 915–919. [Google Scholar] [CrossRef]
- Cross, A.J.; Freedman, N.D.; Ren, J.; Ward, M.H.; Hollenbeck, A.R.; Schatzkin, A.; Sinha, R.; Abnet, C.C. Meat consumption and risk of esophageal and gastric cancer in a large prospective study. Am. J. Gastroenterol. 2011, 106, 432–442. [Google Scholar] [CrossRef]
- Daniel, C.R.; Cross, A.J.; Graubard, B.I.; Hollenbeck, A.R.; Park, Y.; Sinha, R. Prospective investigation of poultry and fish intake in relation to cancer risk. Cancer Prev. Res. 2011, 4, 1903–1911. [Google Scholar] [CrossRef]
- Keszei, A.P.; Schouten, L.J.; Goldbohm, R.A.; Van den brandt, P.A. Red and processed meat consumption and the risk of esophageal and gastric cancer subtypes in the netherlands cohort study. Ann. Oncol. 2012, 23, 2319–2326. [Google Scholar] [CrossRef]
- Wie, G.A.; Cho, Y.A.; Kang, H.H.; Ryu, K.A.; Yoo, M.K.; Kim, Y.A.; Jung, K.W.; Kim, J.; Lee, J.H.; Joung, H. Red meat consumption is associated with an increased overall cancer risk: A prospective cohort study in Korea. Br. J. Nutr. 2014, 112, 238–247. [Google Scholar] [CrossRef]
- Zheng, W.; Sellers, T.A.; Doyle, T.J.; Kushi, L.H.; Potter, J.D.; Folsom, A.R. Retinol, antioxidant vitamins, and cancers of the upper digestive tract in a prospective cohort study of postmenopausal women. Am. J. Epidemiol. 1995, 142, 955–960. [Google Scholar] [CrossRef]
- Lee, H.H.; Wu, H.Y.; Chuang, Y.C.; Chang, A.S.; Chao, H.H.; Chen, K.Y.; Chen, H.K.; Lai, G.M.; Huang, H.H.; Chen, C.J. Epidemiologic characteristics and multiple risk factors of stomach cancer in Taiwan. Anticancer Res. 1990, 10, 875–881. [Google Scholar]
- Boeing, H.; Frentzel-Beyme, R.; Berger, M.; Berndt, V.; Gores, W.; Korner, M.; Lohmeier, R.; Menarcher, A.; Mannl, H.F.; Meinhardt, M.; et al. Case-control study on stomach cancer in Germany. Int. J. Cancer 1991, 47, 858–864. [Google Scholar] [CrossRef]
- Gonzalez, C.A.; Sanz, J.M.; Marcos, G.; Pita, S.; Brullet, E.; Saiga, E.; Badia, A.; Riboli, E. Dietary factors and stomach cancer in Spain: A multi-centre case-control study. Int. J. Cancer 1991, 49, 513–519. [Google Scholar] [CrossRef]
- Hoshiyama, Y.; Sasaba, T. A case-control study of stomach cancer and its relation to diet, cigarettes, and alcohol consumption in Saitama Prefecture, Japan. Cancer Causes Control 1992, 3, 441–448. [Google Scholar] [CrossRef]
- Munoz, S.E.; Ferraroni, M.; La Vecchia, C.; Decarli, A. Gastric cancer risk factors in subjects with family history. Cancer Epidemiol. Biomark. Prev. 1997, 6, 137–140. [Google Scholar]
- Ward, M.H.; Sinha, R.; Heineman, E.F.; Rothman, N.; Marking, R.; Weisenburger, D.D.; Correa, P.; Zahm, S.H. Risk of adenocarcinoma of the stomach and esophagus with meat cooking method and doneness preference. Int. J. Cancer 1997, 71, 14–19. [Google Scholar] [CrossRef]
- Ji, B.T.; Chow, W.H.; Yang, G.; McLaughlin, J.K.; Zheng, W.; Shu, X.O.; Jin, F.; Gao, R.N.; Gao, Y.T.; Fraumeni, J.F., Jr. Dietary habits and stomach cancer in Shanghai, China. Int. J. Cancer 1998, 76, 659–664. [Google Scholar] [CrossRef]
- Ward, M.H.; Lopez-Carrillo, L. Dietary factors and the risk of gastric cancer in Mexico City. Am. J. Epidemiol. 1999, 149, 925–932. [Google Scholar] [CrossRef]
- Tavani, A.; La Vecchia, C.; Gallus, S.; Lagiou, P.; Trichopoulos, D.; Levi, F.; Negri, E. Red meat intake and cancer risk: A study in Italy. Int. J. Cancer 2000, 86, 425–428. [Google Scholar] [CrossRef]
- Palli, D.; Russo, A.; Ottini, L.; Masala, G.; Saieva, C.; Amorosi, A.; Cama, A.; D’Amico, C.; Falchetti, M.; Palmirotta, R.; et al. Red meat, family history, and increased risk of gastric cancer with microsatellite instability. Cancer Res. 2001, 61, 5415–5419. [Google Scholar]
- Takezaki, T.; Gao, C.M.; Wu, J.Z.; Ding, J.H.; Liu, Y.T.; Zhang, Y.; Li, S.P.; Su, P.; Liu, T.K.; Tajima, K. Dietary protective and risk factors for esophageal and stomach cancers in a low-epidemic area for stomach cancer in Jiangsu Province, China: Comparison with those in a high-epidemic area. Jpn. J. Cancer Res. 2001, 92, 1157–1165. [Google Scholar] [CrossRef]
- Kim, H.J.; Chang, W.K.; Kim, M.K.; Lee, S.S.; Choi, B.Y. Dietary factors and gastric cancer in Korea: A case-control study. Int. J. Cancer 2002, 97, 531–535. [Google Scholar] [CrossRef]
- Ito, L.S.; Inoue, M.; Tajima, K.; Yamamura, Y.; Kodera, Y.; Hirose, K.; Takezaki, T.; Hamajima, N.; Kuroishi, T.; Tominaga, S. Dietary factors and the risk of gastric cancer among Japanese women: A comparison between the differentiated and non-differentiated subtypes. Ann. Epidemiol. 2003, 13, 24–31. [Google Scholar] [CrossRef]
- Nomura, A.M.; Hankin, J.H.; Kolonel, L.N.; Wilkens, L.R.; Goodman, M.T.; Stemmermann, G.N. Case-control study of diet and other risk factors for gastric cancer in Hawaii (United States). Cancer Causes Control 2003, 14, 547–558. [Google Scholar] [CrossRef]
- De Stefani, E.; Correa, P.; Boffetta, P.; Deneo-Pellegrini, H.; Ronco, A.L.; Mendilaharsu, M. Dietary patterns and risk of gastric cancer: A case-control study in Uruguay. Gastric Cancer 2004, 7, 211–220. [Google Scholar] [CrossRef]
- Lissowska, J.; Gail, M.H.; Pee, D.; Groves, F.D.; Sobin, L.H.; Nasierowska-Guttmejer, A.; Sygnowska, E.; Zatonski, W.; Blot, W.J.; Chow, W.H. Diet and stomach cancer risk in Warsaw, Poland. Nutr. Cancer 2004, 48, 149–159. [Google Scholar] [CrossRef]
- Phukan, R.K.; Narain, K.; Zomawia, E.; Hazarika, N.C.; Mahanta, J. Dietary habits and stomach cancer in Mizoram, India. J. Gastroenterol. 2006, 41, 418–424. [Google Scholar] [CrossRef]
- Strumylaite, L.; Zickute, J.; Dudzevicius, J.; Dregval, L. Salt-preserved foods and risk of gastric cancer. Medicina 2006, 42, 164–170. [Google Scholar]
- Wu, A.H.; Tseng, C.C.; Hankin, J.; Bernstein, L. Fiber intake and risk of adenocarcinomas of the esophagus and stomach. Cancer Causes Control 2007, 18, 713–722. [Google Scholar] [CrossRef]
- Hu, J.; La Vecchia, C.; DesMeules, M.; Negri, E.; Mery, L.; Paulse, B.; Dewar, R.; Dryer, D.; Kreiger, N.; Whittaker, H.; et al. Meat and fish consumption and cancer in Canada. Nutr. Cancer 2008, 60, 313–324. [Google Scholar] [CrossRef]
- Aune, D.; De Stefani, E.; Ronco, A.; Boffetta, P.; Deneo-Pellegrini, H.; Acosta, G.; Mendilaharsu, M. Meat consumption and cancer risk: A case-control study in Uruguay. Asian Pac. J. Cancer Prev. 2009, 10, 429–436. [Google Scholar]
- Aune, D.; Ronco, A.; Boffetta, P.; Deneo-Pellegrini, H.; Barrios, E.; Acosta, G.; Mendilaharsu, M.; De Stefani, E. Meat consumption and cancer risk: A multisite case-control study in Uruguay. Cancer Ther. 2009, 7, 174–187. [Google Scholar]
- Pourfarzi, F.; Whelan, A.; Kaldor, J.; Malekzadeh, R. The role of diet and other environmental factors in the causation of gastric cancer in Iran—A population based study. Int. J. Cancer 2009, 125, 1953–1960. [Google Scholar] [CrossRef]
- Gao, Y.; Hu, N.; Han, X.Y.; Ding, T.; Giffen, C.; Goldstein, A.M.; Taylor, P.R. Risk factors for esophageal and gastric cancers in Shanxi Province, China: A case-control study. Cancer Epidemiol. 2011, 35, e91–e99. [Google Scholar] [CrossRef]
- Hu, J.; La Vecchia, C.; Morrison, H.; Negri, E.; Mery, L. Salt, processed meat and the risk of cancer. Eur. J. Cancer Prev. 2011, 20, 132–139. [Google Scholar] [CrossRef]
- De Stefani, E.; Boffetta, P.; Ronco, A.L.; Deneo-Pellegrini, H.; Correa, P.; Acosta, G.; Mendilaharsu, M.; Luaces, M.E.; Silva, C. Processed meat consumption and risk of cancer: A multisite casecontrol study in Uruguay. Br. J. Cancer 2012, 107, 1584–1588. [Google Scholar] [CrossRef]
- Wang, X.Q.; Yan, H.; Terry, P.D.; Wang, J.S.; Cheng, L.; Wu, W.A.; Hu, S.K. Interaction between dietary factors and helicobacter pylori infection in noncardia gastric cancer: A population-based case-control study in China. J. Am. Coll. Nutr. 2012, 31, 375–384. [Google Scholar] [CrossRef]
- Di Maso, M.; Talamini, R.; Bosetti, C.; Montella, M.; Zucchetto, A.; Libra, M.; Negri, E.; Levi, F.; La Vecchia, C.; Franceschi, S.; et al. Red meat and cancer risk in a network of case-control studies focusing on cooking practices. Ann. Oncol. 2013, 24, 3107–3112. [Google Scholar] [CrossRef]
- Zamani, N.; Hajifaraji, M.; Fazel-tabar Malekshah, A.; Keshtkar, A.A.; Esmaillzadeh, A.; Malekzadeh, R. A case-control study of the relationship between gastric cancer and meat consumption in Iran. Arch. Iran. Med. 2013, 16, 324–329. [Google Scholar]
- Epplein, M.; Zheng, W.; Li, H.; Peek, R.M., Jr.; Correa, P.; Gao, J.; Michel, A.; Pawlita, M.; Cai, Q.; Xiang, Y.B.; et al. Diet, Helicobacter pylori strain-specific infection, and gastric cancer risk among Chinese men. Nutr. Cancer 2014, 66, 550–557. [Google Scholar] [CrossRef]
- Lin, S.H.; Li, Y.H.; Leung, K.; Huang, C.Y.; Wang, X.R. Salt processed food and gastric cancer in a Chinese population. Asian Pac. J. Cancer Prev. 2014, 15, 5293–5298. [Google Scholar] [CrossRef]
- Ellison-Loschmann, L.; Sporle, A.; Corbin, M.; Cheng, S.; Harawira, P.; Gray, M.; Whaanga, T.; Guilford, P.; Koea, J.; Pearce, N. Risk of stomach cancer in Aotearoa/New Zealand: A Maori population based case-control study. PLoS ONE 2017, 12, e0181581. [Google Scholar] [CrossRef]
- Cross, A.J.; Pollock, J.R.; Bingham, S.A. Haem, not protein or inorganic iron, is responsible for endogenous intestinal N-nitrosation arising from red meat. Cancer Res. 2003, 63, 2358–2360. [Google Scholar]
- Ward, M.H.; Cross, A.J.; Abnet, C.C.; Sinha, R.; Markin, R.S.; Weisenburger, D.D. Heme iron from meat and risk of adenocarcinoma of the esophagus and stomach. Eur. J. Cancer Prev. 2012, 21, 134–138. [Google Scholar] [CrossRef]
- Santarelli, R.L.; Pierre, F.; Corpet, D.E. Processed meat and colorectal cancer: A review of epidemiologic and experimental evidence. Nutr. Cancer 2008, 60, 131–144. [Google Scholar] [CrossRef]
- Lewin, M.H.; Bailey, N.; Bandaletova, T.; Bowman, R.; Cross, A.J.; Pollock, J.; Shuker, D.E.; Bingham, S.A. Red meat enhances the colonic formation of the DNA adduct O6-carboxymethyl guanine: Implications for colorectal cancer risk. Cancer Res. 2006, 66, 1859–1865. [Google Scholar] [CrossRef]
- Jakszyn, P.; Bingham, S.; Pera, G.; Agudo, A.; Luben, R.; Welch, A.; Boeing, H.; Del Giudice, G.; Palli, D.; Saieva, C.; et al. Endogenous versus exogenous exposure to N-nitroso compounds and gastric cancer risk in the European Prospective Investigation into Cancer and Nutrition (EPIC-EURGAST) study. Carcinogenesis 2006, 27, 1497–1501. [Google Scholar] [CrossRef]
- Perez-Perez, G.I.; Israel, D.A. Role of iron in Helicobacter pylori: Its influence in outer membrane protein expression and in pathogenicity. Eur. J. Gastroenterol. Hepatol. 2000, 12, 1263–1265. [Google Scholar] [CrossRef]
- Suzuki, H.; Iwasaki, E.; Hibi, T. Helicobacter pylori and gastric cancer. Gastric Cancer 2009, 12, 79–87. [Google Scholar] [CrossRef]
- Skog, K.I.; Johansson, M.A.; Jagerstad, M.I. Carcinogenic heterocyclic amines in model systems and cooked foods: A review on formation, occurrence and intake. Food Chem. Toxicol. 1998, 36, 879–896. [Google Scholar] [CrossRef]
- Bergin, I.L.; Sheppard, B.J.; Fox, J.G. Helicobacter pylori infection and high dietary salt independently induce atrophic gastritis and intestinal metaplasia in commercially available outbred Mongolian gerbils. Dig. Dis. Sci. 2003, 48, 475–485. [Google Scholar] [CrossRef]
- Bingham, S.A.; Hughes, R.; Cross, A.J. Effect of white versus red meat on endogenous N-nitrosation in the human colon and further evidence of a dose response. J. Nutr. 2002, 132 (Suppl. 11), 3522s–3525s. [Google Scholar] [CrossRef]
- Koumbi, L. Dietary factors can protect against liver cancer development. World J. Hepatol. 2017, 9, 119–125. [Google Scholar] [CrossRef]
- Fauser, J.K.; Prisciandaro, L.D.; Cummins, A.G.; Howarth, G.S. Fatty acids as potential adjunctive colorectal chemotherapeutic agents. Cancer Biol. Ther. 2011, 11, 724–731. [Google Scholar] [CrossRef]
- Food and Agriculture Organization of the United Nations. Poultry Development Review. 2013. Available online: http://www.fao.org/3/i3531e/i3531e.pdf (accessed on 25 March 2019).
- Endres, S.; Ghorbani, R.; Kelley, V.E.; Georgilis, K.; Lonnemann, G.; van der Meer, J.W.; Cannon, J.G.; Rogers, T.S.; Klempner, M.S.; Weber, P.C.; et al. The effect of dietary supplementation with n-3 polyunsaturated fatty acids on the synthesis of interleukin-1 and tumor necrosis factor by mononuclear cells. N. Engl. J. Med. 1989, 320, 265–271. [Google Scholar] [CrossRef]
- Lim, K.; Han, C.; Dai, Y.; Shen, M.; Wu, T. Omega-3 polyunsaturated fatty acids inhibit hepatocellular carcinoma cell growth through blocking beta-catenin and cyclooxygenase-2. Mol. Cancer 2009, 8, 3046–3055. [Google Scholar] [CrossRef]
- OECD/FAO. OECD-FAO Agricultural Outlook 2016–2025; OECD: Paris, France, 2016. [Google Scholar] [CrossRef]
- Kim, Y.; Park, J.; Nam, B.H.; Ki, M. Stomach cancer incidence rates among Americans, Asian Americans and Native Asians from 1988 to 2011. Epidemiol. Health 2015, 37, e2015006. [Google Scholar] [CrossRef]
- Glade, M.J. Food, nutrition, and the prevention of cancer: A global perspective. American Institute for Cancer Research/World Cancer Research Fund, American Institute for Cancer Research, 1997. Nutrition 1999, 15, 523–526. [Google Scholar]


| Study | Study Type | No. of Cases | No. of Controls or Cohort Size | Study Period (Follow-Up Duration, Year) | Type of Meat | Consumption Comparison Category | Adjusted ORs/RRs (95% CI) | Adjusted Variables |
|---|---|---|---|---|---|---|---|---|
| Nomura et al. (1990) USA [21] | CO | 150 | 7990 | 1965–1968 (19 years) | Processed meat (ham, bacon, and sausage) | ≥5 vs. <1 (times/week) | 1.3 (0.9–2.0) | Age |
| Zheng et al. (1995) USA [30] | CO | 26 | 34,691 | 1986–1992 | Processed meat | ≥13 vs. <4.4 (times/month) | 2.20 (0.8–6.0) | Age, education, smoking status, and pack-years of smoking |
| Galanis et al. (1998) USA [22] | CO | 108 | 11,907 | 1975–1980 (14.8 years) | Processed meat | ≥3 vs. =0 (times/week) | 1.0 (0.6–1.7) | Age, sex, education, and Japanese place of birth |
| Knekt et al. (1999) Finland [23] | CO | 68 | 9989 | 1966–1972 (24 years) | Processed meat (cured meat) | Q4 vs. Q1 (quartiles) | 0.49 (0.22–1.06) | Age, sex, municipality, smoking, and energy intake |
| Huang et al. (2000) Japan [24] | CO | 877 | 1386 | 1988–1994 (11 years) | White meat (chicken) | ≥3–4 vs. =0 (times/week) | 0.61 (0.39–0.94) | Age, gender, and pathological type and stage of cancer. |
| Gonzalez et al. (2006) Europe [4] | CO | 348 | 521,457 | 1992–1998 (6.5 years) | Red, processed, white meat (poultry) | Red meat (g/day) | 1.5 (1.02–2.22) | Sex, height, weight, education, alcohol use, smoking, physical activity, energy intake, fruit and vegetable intake, and other meats intake. |
| (Man) ≥84 vs. <26 | ||||||||
| (Woman) ≥61 vs. <17 | ||||||||
| Processed meat (g/day) | 1.62 (1.08–2.41) | |||||||
| (Man) ≥59 vs. <16 | ||||||||
| (Woman) ≥37 vs. <9 | ||||||||
| White meat (g/day) | 1.47 (1.04–2.10) | |||||||
| (Man) ≥29 vs. <7 | ||||||||
| (Woman) ≥26 vs. <5 | ||||||||
| Larsson et al. (2006) Sweden [25] | CO | 156 | 61,433 | 1987–1997 (18 years) | Red meat (beef, pork, lamb, or veal), processed meat (bacon, side pork, sausage, hot dogs, ham, or salami), and white meat (poultry) | Red meat (times/week) | 1.07 (0.69–1.66) | Age, education, BMI, energy intake, alcohol, fruits and vegetables intake |
| ≥3.5 vs. <2 | ||||||||
| Processed meat (times/week) | 1.66 (1.13–2.45) | |||||||
| ≥3 vs. <1.5 | ||||||||
| White meat (times/week) | 0.58 (0.31–1.09) | |||||||
| ≥0.5 vs. <0.2 | ||||||||
| Cross et al. (2011) USA [26] | CO | 955 (454 cardia and 501 non-cardia) | 494,979 | 1996–2006 (10 years) | Red, processed, and white meat | Red meat (grams/1000 kcal) | Age, education, sex, BMI, ethnicity, smoking, alcohol drinking, physical activity, daily intake of fruits, vegetables, saturated fat, and calories | |
| (Cardia) ≥64.8 vs. <10.0 | 1.04 (0.72–1.51) | |||||||
| (Non-cardia) ≥64.8 vs. <10.0 | 0.77 (0.56–1.06) | |||||||
| Processed meat (g/1000 kcal) | ||||||||
| (Cardia) ≥23.2 vs. <1.7 | 0.82 (0.59–1.14) | |||||||
| (Non-cardia) ≥23.2 vs. <1.7 | 1.09 (0.81–1.48) | |||||||
| White meat (g/1000 kcal) | ||||||||
| (Cardia) ≥65.8 vs. <9.7 | 1.18 (0.87–1.60) | |||||||
| (Non-cardia) ≥65.8 vs. <9.7 | 0.90 (0.67–1.20) | |||||||
| Daniel et al. (2011) USA [27] | CO | 928 (418 cardia and 510 non-cardia) | 492,186 | 1995–2006 (9 years) | White meat (poultry) | (Cardia) ≥51.2 vs. <5.3 (grams/1000 kcal) | 1.00 (0.73–1.36) | Red meat intake, age, sex, education, marital status, family history of cancer, race, body mass index, smoking status, frequency of vigorous physical activity, menopausal hormone therapy in women, intake of alcohol, fruit, and vegetables, fish intake, and total energy |
| (Non-cardia) ≥51.2 vs. <5.3 (grams/1000 kcal) | 0.80 (0.59–1.07) | |||||||
| Keszei et al. (2012) Netherlands [28] | CO | 652 (men, 139 cardia and 329 non-cardia; women, 24 cardia and 160 non-cardia) | 120,852 | 1986–2002 (16.3 years) | Red meat (beef, pork, minced meat, liver, and other non-poultry meat) and processed meat (sausage, bacon, ham, cold cuts, croquettes, and frankfurters) | Red meat (g/day) | Age, smoking, energy intake, BMI, alcohol intake, vegetable intake, fruit intake, education and non-occupational physical activity | |
| men | ||||||||
| (Cardia) ≥145.9 vs. <45.8 | 1.00 (0.56–1.78) | |||||||
| (Non-cardia) ≥145.9 vs. <45.8 | 1.15 (0.77–1.71) | |||||||
| women | ||||||||
| (Cardia) ≥115.9 vs. <46.9 | 0.45 (0.16–1.19) | |||||||
| (Non-cardia) ≥115.9 vs <46.9 | 0.85 (0.57–1.26) | |||||||
| Processed meat (g/day) men | ||||||||
| (Cardia) ≥45.5 vs <3.7 | 1.49 (0.81–2.75) | |||||||
| (Non-cardia) ≥45.5 vs <3.7 | 1.19 (0.78–1.79) | |||||||
| women | ||||||||
| (Cardia) ≥26.0 vs. <3.5 | 1.12 (0.36–3.47) | |||||||
| (Non-cardia) ≥26.0 vs. <3.5 | 1.11 (0.73–1.70) | |||||||
| Wie et al. (2014) Korea [29] | CO | 46 | 8024 | 2004–2013 (7 years) | Red meat | ≥43 vs. <43 (g/day) | 1.16 (0.56–2.41) | Age, sex, energy intake, BMI, physical activity, smoking, alcohol use, income, education, and marital status. |
| Lee et al. (1990) Taiwan [31] | CC | 210 | 820 | . | Processed meat (cured meat) | ≥2 vs. <1 (meals/month) | 2.31 (1.3–4.0) | Age, sex, and hospital |
| Boeing et al. (1991) Germany [32] | CC | 143 | 579 | 1985–1988 | Processed meat | T3 vs. T1 (tertiles) | 2.21 (1.32–3.71) | Age, sex, hospital, and intake of raw vegetables, citrus fruits, cheese, and wholemeal bread |
| González et al. (1991) Spain [33] | CC | 354 | 354 | 1987–1989 | Processed meat (cured meat) | ≥57 vs. <3 (g/day) | 1.4 (0.8–2.2) | Intakes of preserved fish, egg, cooked vegetables, other fruits, nuts, dried fruits, meat, and total calories |
| Hoshiyama et al. (1992) Japan [34] | CC | 294 population-based | 294 population-based | 1984–1990 | Processed meat (smoked food, bacon, ham) | ≥2 vs. none (times/week) | Hospital-based: 1.9 (1.0–3.3) | Age, sex, area, and smoking status |
| 202 hospital-based | 294 hospital-based | Population-based: 1.4 (0.9–2.4) | ||||||
| Munoz et al. (1997) Italy [35] | CC | 88 | 103 | 1985–1992 | Red meat | ≥5 vs. ≤2 (times/week) | 3.38(1.42–8.04) | Sex, age, area of residence, and education |
| Ward et al. (1997) USA [36] | CC | 176 | 449 | 1988–1993 | Red meat (beef, processed meats, fresh ham/pork, and liver) and processed meat (bacon, sausage, processed ham, home-cured meats, and sandwich meats) | Red meat (times/week) | 2.4 (1.3–4.8) | Sex, age |
| >19 vs. <8 | ||||||||
| Processed meat (times/week) | 1.6 (0.9–2.9) | |||||||
| >8 vs. <4 | ||||||||
| Ji et al. (1998) China [37] | CC | 1124 (770 men, 353 women) | 1451 (819 men, 632 women) | 1988–1989 | Red meat (pork chops, pork spareribs, pig feet, fresh pork, beef, and mutton) and white meat (poultry, chicken, duck) | Red meat (times/month) ≥30.7 vs. ≤8.5 | Red meat | Age, income, education, smoking (males only). and alcohol drinking (males only) |
| (men) 0.9 (0.6–1.2) | ||||||||
| (women) 0.8 (0.6–1.2) | ||||||||
| white meat (times/month) ≥2.5 vs. ≤0.7 | White meat | |||||||
| (men) 0.7 (0.5–0.9) | ||||||||
| (women) 0.8 (0.5–1.1) | ||||||||
| Ward et al. (1999) Mexico [38] | CC | 220 | 752 | 1989–1990 | Processed meat | ≥6 vs. <1 (times/week) | 3.2 (1.5–6.6) | Age, sex, total calories, chili pepper consumption, added salt, history of peptic ulcer, cigarette smoking, and socioeconomic status |
| Tavani et al. (2000) Italy [39] | CC | 745 | 7990 | 1983–1996 | Red meat | ≥6 vs ≤3 (portions/week) an average Italian portion is 100 to 150 g | 1.6(1.3–2.0) | Age, year of recruitment, sex, education, smoking habits and alcohol, fat, fruit and vegetable intakes |
| Palli et al. (2001) Italy [40] | CC | 382 | 561 | 1985–1987 | Red meat (beef, pork, lamb, and game), processed meat (cured and canned meats), and white meat (poultry and rabbit) | Red, processed, and white meat | Red meat | Age, sex, social class, family history of GC, area of residence, BMI tertiles, total energy, and consumption tertiles of each food of interest |
| (MSI+) 4.3 (1.8–10.8) | ||||||||
| (MSI−) 2.1 (1.2–3.7) | ||||||||
| T3 vs. T1 (tertiles) | Processed meat | |||||||
| (MSI+) 1.0 (0.4–2.6) | ||||||||
| (MSI−) 1.9 (1.0–3.7) | ||||||||
| White meat | ||||||||
| (MSI+) 0.3 (0.1–0.8) | ||||||||
| (MSI−) 0.9 (0.5–1.6) | ||||||||
| Takezaki et al. (2001) China [41] | CC | 187 | 333 | 1996–2000 | Processed meat (salted meat) and white meat (poultry) | Processed meat (times/month) | 2.36 (1.08–5.14) | Age, sex, and smoking and drinking habits. |
| ≥4 vs. <1 | ||||||||
| White meat (times/month) | 1.54 (0.68–3.52) | |||||||
| ≥12 vs. <1 | ||||||||
| Kim et al. (2002) Korea [42] | CC | 136 | 136 | 1997–1998 | Red meat (grilled beef and pork over charcoal) | Q4 vs. Q1 (quartiles) | 1.58 (0.80–3.10) | Sex, age, socioeconomic status, family history and refrigerator use |
| Ito et al. (2003) Japan [43] | CC | 508 | 36,490 | 1988–1999 | Processed and white meat (chicken) | Processed and white meat | 0.50 (0.22–1.13) | Age, year, season at first hospital visit, smoking habits, and family history of gastric cancer |
| ≥5 vs <1 (times/week) | 0.69 (0.39–1.23) | |||||||
| Nomura et al. (2003) USA [44] | CC | 300 (186 men, 114 women) | 446 (282 men, 164 women) | 1993–1999 | Processed and white meat (poultry) | Processed meat (g/day) | Processed meat | Age, ethnicity, cigarette smoking status, education, history of gastric ulcer, NSAID use, family history of gastric cancer, total calories, and intake of other foods or food groups |
| (men) >27.2 vs. <9.2 | (men) 1.7 (0.9–3.3) | |||||||
| (women) >14.6 vs. <6.1 | (women) 0.7 (0.3–1.5) | |||||||
| White meat (g/day) | White meat | |||||||
| (men) >26.5 vs. <12.8 | (men) 0.8 (0.4–1.4) | |||||||
| (women) >20.3 vs. <11.2 | women) 0.4 (0.2–1.0) | |||||||
| De stefani et al. (2004) Uruguay [45] | CC | 240 | 960 | 1996–2000 | Red meat (beef and lamb), processed meat (salted meat), and white meat (poultry, fish) | Red, processed, and white meat | 1.10 (0.71–1.71) | Age, sex, residence, urban/rural status, education, body mass index, and total energy intake |
| 1.98 (1.35–2.90) | ||||||||
| T3 vs T1 (tertiles) | 0.98 (0.67–1.44) | |||||||
| Lissowska et al. (2004) Poland [46] | CC | 274 | 463 | 1994–1996 | Red meat (pork, beef, liver, and processed red meats), processed meat (Sausage and hot dog), and white meat (poultry) | Red meat (times/week) | 1.51 (0.90–2.51) | Age, sex, education, smoking, and calories from food |
| >14.5 vs. <8 | ||||||||
| Processed meat (times/week) | 1.23 (0.79–1.93) | |||||||
| >4.9 vs. <2.1 | ||||||||
| White meat (times/week) | 0.89 (0.61–1.31) | |||||||
| ≥0.7 vs. <0.7 | ||||||||
| Phukan et al. (2006) India [47] | CC | 329 | 658 | 2001–2004 | Processed meat (Smoked dried salted meat) and white meat (chicken) | Processed and white meat (times/week) | 2.8 (1.7–8.8) | Level of education, tobacco use, alcohol drinking, and each dietary variable |
| ≥2 vs. none | 0.87 (0.06–4.70) | |||||||
| Strumylaite et al. (2006) Lithuania [48] | CC | 379 | 1139 | 2002–2004 | Processed meat (salted meat) | ≥1–2 vs. Almost do not use (times/week) | 2.21 (1.43–3.42) | Smoking, alcohol consumption, family history of cancer, body mass index, education level, residence, diet (salt preserved food items, bread, noodles, rice, different dairy products, mayonnaise, eggs, carrots, cabbage, broccoli, tomatoes, garlic, onion, paprika, bean, potatoes), and physical activity |
| Wu et al. (2007) USA [49] | CC | 623 | 1308 | 1992–1997 | Red, processed, and white meat (poultry) | Red, processed, and white meat | (Cardia) | Age, sex, race, birthplace, education, smoking, BMI, reflux, use of vitamins, and total calories |
| 1.56 (0.97–2.5) | ||||||||
| 0.76 (0.5–1.2) | ||||||||
| 1.16 (0.8–1.8) | ||||||||
| Q4 vs. Q1 (quartiles) | (Non-cardia) | |||||||
| 1.57 (1.0–2.4) | ||||||||
| 1.65 (1.1–2.5) | ||||||||
| 1.06 (0.7–1.6) | ||||||||
| Hu et al. (2008) Canada [50] | CC | 1182 | 5039 | 1994–1997 | Red, processed, and white meat (poultry) | Red meat (times/week) | 1.2 (1.0–1.5) | Age, province, education, body mass index, sex, alcohol use, pack-year smoking, total vegetable and fruit intake, and total energy intake |
| ≥5.1 vs. ≤2 | ||||||||
| Processed meat (times/week) | 1.7 (1.3–2.2) | |||||||
| ≥5.42 vs. ≤0.94 | ||||||||
| White meat (oz/week) | 0.9 (0.6–1.4) | |||||||
| ≥13 vs. ≤4 | ||||||||
| Aune et al. (2009) Uruguay [51] | CC | 275 | 2032 | 1996–2004 | Red meat (fresh beef and lamb) and processed meat | Red meat (g/day) | 2.19 (1.31–3.65) | Age, sex, residence, education, income, interviewer, smoking status, cigarettes per day, duration of smoking, age at starting, years since quitting, alcohol, dairy foods, grains, fatty foods, fruits and vegetables, fish, poultry, mate drinking, BMI and energy intake; red meat was adjusted for processed meat and vice versa |
| 250–600 vs. <150 | ||||||||
| Processed meat (g/day) | 1.62 (1.07–2.44) | |||||||
| 40–258.8 vs. <10 | ||||||||
| Aune et al. (2009) Uruguay [52] | CC | 128 | 1832 | 1988–2000 | Red and processed meat | Red meat (servings/week) | 3.70 (2.04–6.73) | Age, sex (when applicable), education, residence, smoking status, cigarettes per day, age at starting smoking, years since quitting smoking, duration of smoking, type of tobacco, alcohol intake, fruits and vegetables and milk. |
| ≥9 vs. ≤4 | ||||||||
| Processed meat (servings/month) | 4.39 (2.17–8.90) | |||||||
| >1 vs. 0 | ||||||||
| Pourfarzi et al. (2009) Iran [53] | CC | 213 | 390 | 2003–2005 | Red, processed, and white meat (chicken) | Red meat (times/week) | 3.40 (1.79–6.46) | Sex, age group, education, family history of GC, citrus fruits, garlic, onion, red meat, fish, dairy products, strength and warmth of tea, preference for salt intake, and H. pylori |
| >7 vs. ≤2 | ||||||||
| Processed meat (times/week) | 1.14 (0.55–2.37) | |||||||
| ≥0.25 vs. never | ||||||||
| White meat (times/week) | 0.93 (0.39–2.20) | |||||||
| ≥7 vs. ≤2 | ||||||||
| Gao et al. (2011) China [54] | CC | 915 | 1514 | Red and white meat (chicken) | Red meat | (Cardia) | Age, gender, geographic region | |
| >weekly vs. monthly/seldom/never | 1.54 (1.15–2.07) (Non-cardia) 1.77 (1.21–2.58) | |||||||
| White meat | (Cardia) | |||||||
| 0.98 (0.52-1.86) (Non-cardia) | ||||||||
| daily/weekly vs. never | 0.61 (0.26–1.42) | |||||||
| Hu et al. (2011) Canada [55] | CC | 1182 | 5039 | 1994–1997 | Processed meat (hot dogs, luncheon meat, smoked meat or corned beef, bacon and sausage) | ≥5.42 vs. ≤0.94 (times/week) | 1.7 (1.3–2.2) | Age group, province, education, body mass index, sex, alcohol drinking (grams/day), pack-years smoking, total vegetable and fruit intake, and total energy intake |
| De stefani et al. (2012) Uruguay [56] | CC | 274 | 2532 | 1996–2004 | Processed meat (bacon, sausage, mortadella, salami, saucisson, hot dog, ham, and air-dried and salted lamb) | (Men) ≥28.3 vs. ≤11.4 | 1.93 (1.25–2.98) 4.51 (2.34–8.70) | Age, residence, body mass index, smoking status, smoking cessation, number of cigarettes smoked per day among current smokers, alcohol drinking, mate consumption, total energy, total vegetables and fruits, total white meat, and red meat intakes |
| (Women) ≥ 28.3 vs. ≤11.4 | ||||||||
| (g/day) | ||||||||
| Wang et al. (2012) China [57] | CC | 257 | 514 | 2008–2010 | Red meat | >T3 vs. <T1 (tertiles) | 1.3 (0.6–3.5) | Education, smoking, alcohol consumption, family history, total vegetable intake, total fruit intake, pickled food, soya products, total energy intake, and H. pylori. |
| Di maso et al. (2013) Italy and Switzerland [58] | CC | 230 | 547 | 1991–2009 | Red meat (beef, veal, pork, horsemeat, and half of the first course including meat sauce) | >90 vs. <60 (g/day) | 1.38 (0.92–2.07) | Study center, age, sex, education, body mass index, tobacco smoking, alcohol drinking, vegetable consumption, and fruit consumption |
| Zamani et al. (2013) Iran [59] | CC | 190 | 647 | 2004–2011 | Red meat (fresh red meat and processed red meat) and white meat (poultry and fish) | >Q4 vs. <Q1 (quartiles) | 1.87 (1.01–3.47) | Age, sex, energy intake, ethnicity, hot tea consumption, tooth brushing, cigarette smoking, SES, literacy, opium consumption, grains intake, dairy consumption, and vegetable and fruit intake. |
| 0.36 (0.19–0.68) | ||||||||
| Epplein et al. (2014) China [60] | CC | 226 | 451 | 2002–2009 | Red meat | >66.5 vs. ≤36.0 (g/day) | 1.45 (0.93–2.28) | Age, smoking, history of gastritis, regular aspirin use, total energy intake, and high-risk H. pylori infection |
| Lin et al. (2014) China [61] | CC | 107 | 209 | 2009–2010 | Processed meat (salted meat) | >100 vs. never (g/week) | 5.95 (1.33–25.62) | Age, gender, family history of cancer, ever smoking, alcohol drinking, fresh vegetable intake, fresh fruit intake, household income |
| Ellison-Loschmann et al. (2017) New Zealand [62] | CC | 165 | 480 | 2009–2013 | Red and white meat | Red meat (times/week) | 0.59 (0.28–1.24) | Gender, age and weighted using post-stratification weights to account for differential non-response bias by deprivation quintile. |
| ≥5 vs. none | ||||||||
| White meat (times/week) | 0.54 (0.17–1.74) | |||||||
| ≥5 vs. none |
| Red Meat | Processed Meat | White Meat | ||||||||||
|---|---|---|---|---|---|---|---|---|---|---|---|---|
| No. | RR (95% CI) | Heterogeneity Test | No. | RR (95% CI) | Heterogeneity Test | No. | RR (95% CI) | Heterogeneity Test | ||||
| p | I2% | p | I2% | p | I2% | |||||||
| Total | 26 | 1.41 (1.21–1.66) | <0.001 | 69.6 | 33 | 1.57 (1.37–1.81) | <0.001 | 55.5 | 21 | 0.80 (0.69–0.92) | 0.023 | 41.9 |
| Study design | ||||||||||||
| Cohort studies | 6 | 1.03 (0.83–1.28) | 0.152 | 38.2 | 10 | 1.24 (1.04–1.47) | 0.216 | 24.7 | 5 | 0.85 (0.63–1.16) | 0.012 | 69.1 |
| Case-control studies | 20 | 1.57 (1.30–1.89) | <0.001 | 69.4 | 23 | 1.79 (1.51–2.12) | 0.002 | 52.3 | 16 | 0.77 (0.66–0.91) | 0.167 | 25.5 |
| Population-based | 12 | 1.81 (1.41–2.33) | 0.045 | 51.3 | 11 | 1.58 (1.32–1.89) | 0.28 | 17.2 | 9 | 0.75 (0.61–0.93) | 0.006 | 62.5 |
| Hospital-based | 8 | 1.42 (1.12–1.82) | <0.001 | 71.2 | 12 | 2.03 (1.55–2.68) | 0.001 | 64.7 | 7 | 0.81 (0.61–1.06) | 0.324 | 13.9 |
| Sex | ||||||||||||
| Men | 4 | 1.09 (0.89–1.34) | 0.42 | 0 | 5 | 1.40 (1.13–1.74) | 0.388 | 3.3 | 3 | 0.81 (0.62–1.06) | 0.287 | 19.8 |
| Women | 4 | 0.91 (0.73–1.12) | 0.567 | 0 | 6 | 1.36 (0.84–2.18) | 0.001 | 75 | 5 | 0.67 (0.52–0.87) | 0.633 | 0 |
| Geographic region | ||||||||||||
| Asia | 9 | 1.40 (1.04–1.89) | 0.002 | 67.9 | 9 | 1.74 (1.22–2.48) | 0.033 | 52.2 | 9 | 0.70 (0.57–0.85) | 0.335 | 11.9 |
| Europe | 8 | 1.48 (1.15–1.92) | 0.008 | 63.2 | 10 | 1.40 (1.14–1.73) | 0.038 | 49.3 | 4 | 0.79 (0.46–1.37) | 0.005 | 76.9 |
| North America | 5 | 1.23 (0.92–1.65) | 0.011 | 69.3 | 9 | 1.36 (1.15–1.61) | 0.265 | 20.1 | 6 | 0.86 (0.73–1.01) | 0.432 | 0 |
| Latin America | 3 | 2.03 (1.01–4.06) | 0.004 | 81.8 | 5 | 2.69 (1.76–4.12) | 0.023 | 64.9 | 1 | 0.98 (0.67–1.44) | ||
| Oceania | 1 | 0.59 (0.28–1.24) | 1 | 0.54 (0.17–1.73) | ||||||||
| Anatomical subtype | ||||||||||||
| Cardia | 6 | 1.19 (0.91–1.56) | 0.128 | 41.5 | 5 | 0.95 (0.76–1.18) | 0.52 | 0 | 5 | 1.12 (0.94–1.34) | 0.776 | 0 |
| Non-cardia | 6 | 1.21 (0.89–1.63) | 0.005 | 70.6 | 5 | 1.34 (1.10–1.63) | 0.403 | 0.6 | 5 | 0.96 (0.75–1.24) | 0.12 | 45.4 |
| Histological subtype | ||||||||||||
| Intestinal (differentiated) | 1 | 1.23 (0.61–2.51) | 3 | 1.63 (0.87–3.04) | 0.264 | 25 | 2 | 1.25 (0.77–2.03) | 0.371 | 0 | ||
| Diffuse (undifferentiated) | 1 | 1.74 (0.93–3.24) | 3 | 1.11 (0.44–2.82) | 0.046 | 51.6 | 2 | 1.05 (0.32–3.43) | 0.014 | 83.3 | ||
| Quality score | ||||||||||||
| <7 | 3 | 1.39 (0.72–2.69) | 0.004 | 81.6 | 5 | 1.96 (1.55–2.49) | 0.341 | 11.4 | 2 | 0.80 (0.54–1.18) | 0.941 | 0 |
| ≥7 | 23 | 1.43 (1.21–1.68) | <0.001 | 66 | 28 | 1.50 (1.28–1.75) | <0.001 | 56.8 | 19 | 0.80 (0.68–0.93) | 0.011 | 47.7 |
| Adjustments | ||||||||||||
| Total energy intake, yes | 16 | 1.37 (1.14–1.64) | 0.001 | 61.9 | 15 | 1.47 (1.20–1.80) | 0.002 | 56.8 | 11 | 0.80 (0.64–1.00) | 0.003 | 62.7 |
| BMI, yes | 11 | 1.23 (1.01–1.50) | 0.004 | 61 | 7 | 1.89 (1.51–2.36) | 0.105 | 42.9 | 7 | 0.86 (0.72–1.02) | 0.299 | 17.2 |
| Smoking, yes | 15 | 1.34 (1.11–1.61) | <0.001 | 69.2 | 21 | 1.68 (1.37–2.07) | <0.001 | 65 | 11 | 0.84 (0.70–1.02) | 0.008 | 56.7 |
| Alcohol drinking, yes | 14 | 1.23 (1.01–1.49) | <0.001 | 71.8 | 9 | 2.34 (1.81–3.02) | 0.042 | 50.1 | 11 | 0.88 (0.73–1.06) | 0.041 | 47.3 |
| Vegetable intake, yes | 12 | 1.35 (1.10–1.66) | <0.001 | 70.9 | 12 | 2.02 (1.60–2.56) | 0.007 | 57.3 | 10 | 0.79 (0.61–1.02) | 0.01 | 58.2 |
| Fruit intake, yes | 13 | 1.43 (1.16–1.78) | <0.001 | 74 | 15 | 1.72 (1.42–2.10) | 0.001 | 62.2 | 8 | 0.83 (0.63–1.10) | 0.013 | 60.8 |
| Salt intake, yes | 1 | 3.40 (1.79–6.46) | 2 | 1.91 (0.69–5.24) | 0.052 | 73.6 | 1 | 0.93 (0.39–2.20) | ||||
| Socioeconomic status, yes | 21 | 1.40 (1.17–1.68) | <0.001 | 72 | 20 | 1.57 (1.33–1.85) | 0.007 | 49.5 | 15 | 0.80 (0.67–0.96) | 0.011 | 51.3 |
| Helicobacter pylori, yes | 3 | 1.88 (1.04–3.40) | 0.075 | 61.5 | 1 | 1.14 (0.55–2.37) | 1 | 0.93 (0.39–2.21) | ||||
| Red Meat (per 100 g/day) | Processed Meat (per 50 g/day) | White Meat (per 100 g/day) | ||||||||||
|---|---|---|---|---|---|---|---|---|---|---|---|---|
| No. | RR (95% CI) | Heterogeneity Test | No. | RR (95% CI) | Heterogeneity Test | No. | RR (95% CI) | Heterogeneity Test | ||||
| p | I2% | p | I2% | p | I2% | |||||||
| Total | 18 | 1.26 (1.11–1.42) | <0.001 | 70.3 | 19 | 1.72 (1.36–2.18) | <0.001 | 72.1 | 14 | 0.86 (0.64–1.15) | 0.01 | 52.8 |
| Study design | ||||||||||||
| Cohort studies | 4 | 1.08 (0.90–1.28) | 0.447 | 0 | 7 | 1.21 (1.04–1.41) | 0.427 | 0 | 4 | 0.91 (0.74–1.12) | 0.279 | 21.9 |
| Case-control studies | 14 | 1.31 (1.13–1.52) | <0.001 | 75 | 12 | 2.17 (1.36–2.18) | <0.001 | 76.7 | 10 | 0.66 (0.35–1.25) | 0.005 | 62 |
| Population-based | 9 | 1.17 (1.00–1.37) | 0.002 | 68 | 7 | 1.56 (1.25–1.93) | 0.347 | 10.8 | 5 | 0.70 (0.32–1.57) | 0.008 | 70.7 |
| Hospital-based | 5 | 1.64 (1.28–2.09) | 0.008 | 71.2 | 5 | 5.33 (2.06–13.82) | <0.001 | 89.7 | 5 | 0.56 (0.16–1.96) | 0.052 | 57.5 |
| Sex | ||||||||||||
| Men | 3 | 1.06 (0.90–1.26) | 0.365 | 0.7 | 3 | 1.40 (1.01–1.93) | 0.682 | 0 | 2 | 0.10 (0.01–1.96) | 0.04 | 76.2 |
| Women | 3 | 0.91 (0.75–1.10) | 0.572 | 0 | 4 | 1.59 (0.71–3.56) | 0.181 | 38.5 | 3 | 0.07 (0.01–0.36) | 0.578 | 0 |
| Geographic region | ||||||||||||
| Asia | 5 | 1.50 (0.97–2.33) | <0.001 | 85 | 4 | 10.17 (2.87–35.97) | 0.192 | 36.6 | 6 | 0.57 (0.19–1.66) | 0.008 | 67.8 |
| Europe | 6 | 1.32 (1.13–1.55) | 0.145 | 39.1 | 5 | 1.50 (1.01–2.22) | 0.016 | 67.1 | 2 | 0.43 (0.04–4.65) | 0.06 | 71.8 |
| North America | 4 | 1.14 (0.99–1.32) | 0.244 | 27.9 | 7 | 1.37 (1.11–1.69) | 0.292 | 18.1 | 5 | 0.86 (0.66–1.14) | 0.135 | 43 |
| Latin America | 2 | 1.48 (1.07–2.03) | 0.029 | 79.1 | 3 | 2.24 (1.12–4.50) | <0.001 | 88.9 | ||||
| Oceania | 1 | 0.65 (0.35–1.22) | 1 | 1.46 (0.64–3.33) | ||||||||
| Anatomical subtype | ||||||||||||
| Cardia | 4 | 1.19 (0.80–1.77) | 0.043 | 63.2 | 3 | 0.99 (0.81–1.21) | 0.791 | 0 | 4 | 1.16 (0.98–1.37) | 0.793 | 0 |
| Non-cardia | 4 | 1.37 (0.90–2.09) | 0.005 | 76.7 | 3 | 1.18 (1.01–1.37) | 0.348 | 5.2 | 4 | 0.84 (0.64–1.11) | 0.19 | 36.9 |
| Histological subtype | ||||||||||||
| Intestinal (differentiated) | 1 | 1.06 (0.58–1.96) | 1 | 1.27 (0.93–1.75) | 1 | 1.34 (0.48–3.39) | ||||||
| Diffuse (undifferentiated) | 1 | 1.28 (0.71–2.28) | 1 | 1.04 (0.75–1.43) | 1 | 1.63 (0.73–3.71) | ||||||
| Quality score | ||||||||||||
| <7 | 3 | 1.33 (0.78–2.26) | 0.005 | 81.1 | 2 | 8.62 (3.35–22.16) | 0.994 | 0 | 2 | 0.39 (0.04–4.21) | 0.385 | 0 |
| ≥7 | 15 | 1.27 (1.12–1.44) | <0.001 | 67.1 | 17 | 1.57 (1.26–1.96) | <0.001 | 68.4 | 12 | 0.86 (0.64–1.17) | 0.006 | 58.2 |
| Adjustments | ||||||||||||
| Total energy intake, yes | 9 | 1.22 (1.07–1.40) | 0.052 | 48.1 | 7 | 1.46 (1.21–1.77) | 0.232 | 25.8 | 6 | 0.84 (0.60–1.18) | 0.058 | 53.2 |
| BMI, yes | 6 | 1.18 (1.06–1.31) | 0.485 | 0 | 3 | 1.81 (1.15–2.83) | 0.01 | 78.5 | 4 | 0.89 (0.75–1.07) | 0.341 | 10.4 |
| Smoking, yes | 11 | 1.18 (1.05–1.33) | 0.001 | 67.6 | 13 | 2.21 (1.54–3.17) | <0.001 | 76 | 8 | 0.84 (0.58–1.21) | 0.005 | 65.6 |
| Alcohol drinking, yes | 11 | 1.19 (1.04–1.36) | 0.001 | 67.1 | 7 | 3.28 (1.87–5.76) | <0.001 | 84.8 | 10 | 0.80 (0.55–1.16) | 0.005 | 61.8 |
| Vegetable intake, yes | 9 | 1.28 (1.13–1.44) | 0.05 | 48.4 | 8 | 2.79 (1.66–4.68) | <0.001 | 83.3 | 9 | 0.91 (0.72–1.13) | 0.183 | 29.5 |
| Fruit intake, yes | 10 | 1.32 (1.15–1.52) | 0.006 | 61.1 | 9 | 1.78 (1.29–2.46) | <0.001 | 83.1 | 7 | 0.92 (0.80–1.07) | 0.62 | 0 |
| Salt intake, yes | 1 | 2.64 (1.61–4.34) | 1 | 2.35 (1.29–4.29) | 1 | 1.14 (0.62–2.08) | ||||||
| Socioeconomic status, yes | 13 | 1.26 (1.09–1.47) | <0.001 | 73 | 15 | 1.91 (1.43–2.55) | <0.001 | 77.7 | 11 | 0.80 (0.57–1.11) | 0.01 | 57 |
| Helicobacter pylori, yes | 2 | 2.01 (1.16–3.50) | 0.132 | 55.9 | 1 | 1.14 (0.62–2.08) | ||||||
© 2019 by the authors. Licensee MDPI, Basel, Switzerland. This article is an open access article distributed under the terms and conditions of the Creative Commons Attribution (CC BY) license (http://creativecommons.org/licenses/by/4.0/).
Share and Cite
Kim, S.R.; Kim, K.; Lee, S.A.; Kwon, S.O.; Lee, J.-K.; Keum, N.; Park, S.M. Effect of Red, Processed, and White Meat Consumption on the Risk of Gastric Cancer: An Overall and Dose–Response Meta-Analysis. Nutrients 2019, 11, 826. https://doi.org/10.3390/nu11040826
Kim SR, Kim K, Lee SA, Kwon SO, Lee J-K, Keum N, Park SM. Effect of Red, Processed, and White Meat Consumption on the Risk of Gastric Cancer: An Overall and Dose–Response Meta-Analysis. Nutrients. 2019; 11(4):826. https://doi.org/10.3390/nu11040826
Chicago/Turabian StyleKim, Seong Rae, Kyuwoong Kim, Sang Ah Lee, Sung Ok Kwon, Jong-Koo Lee, NaNa Keum, and Sang Min Park. 2019. "Effect of Red, Processed, and White Meat Consumption on the Risk of Gastric Cancer: An Overall and Dose–Response Meta-Analysis" Nutrients 11, no. 4: 826. https://doi.org/10.3390/nu11040826
APA StyleKim, S. R., Kim, K., Lee, S. A., Kwon, S. O., Lee, J.-K., Keum, N., & Park, S. M. (2019). Effect of Red, Processed, and White Meat Consumption on the Risk of Gastric Cancer: An Overall and Dose–Response Meta-Analysis. Nutrients, 11(4), 826. https://doi.org/10.3390/nu11040826