Associations between Macronutrient Intakes and Obesity/Metabolic Risk Phenotypes: Findings of the Korean National Health and Nutrition Examination Survey


Abstract
1. Introduction
2. Materials and Methods
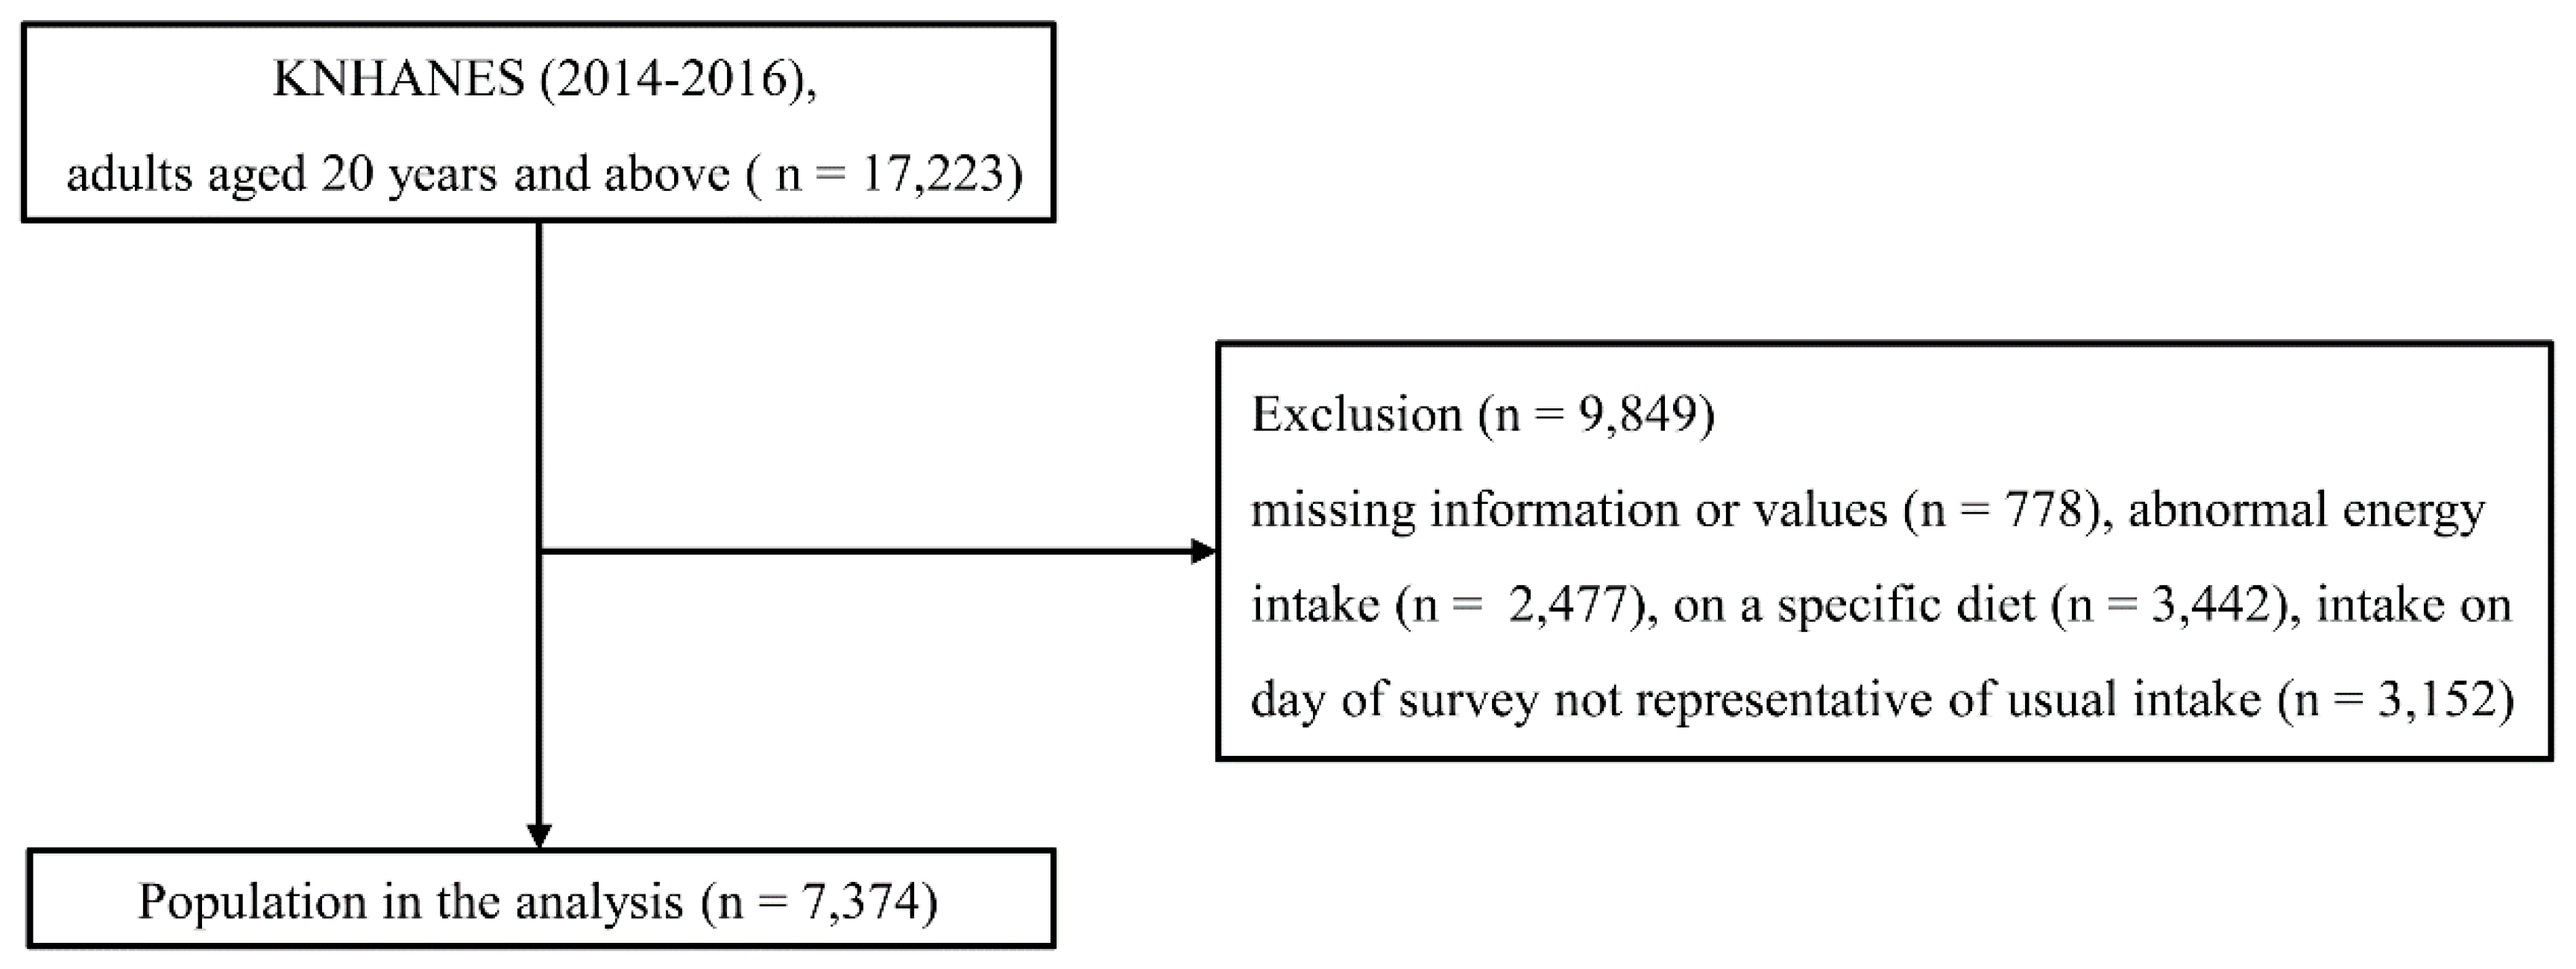
2.1. Study Population
2.2. Classification of Obesity/Metabolic Risk Phenotypes
2.3. Dietary Assessments
2.4. Laboratory and Anthropometric Measurements
2.5. Other Variables
2.6. Statistical Analysis
3. Results
3.1. Participant Characteristics by Obesity/Metabolic Risk Phenotypes
3.2. Mean Macronutrient Intakes by Obesity/Metabolic Risk Phenotypes
3.3. Associations between High or Low Macronutrient Intakes and the Obesity/Metabolic Risk Phenotypes
4. Discussion
5. Conclusions
Author Contributions
Funding
Conflicts of Interest
References
- Ng, M.; Fleming, T.; Robinson, M.; Thomson, B.; Graetz, N.; Margono, C.; Mullany, E.C.; Biryukov, S.; Abbafati, C.; Abera, S.F.; et al. Global, regional, and national prevalence of overweight and obesity in children and adults during 1980–2013: A systematic analysis for the Global Burden of Disease Study 2013. Lancet (London, England) 2014, 384, 766–781. [Google Scholar] [CrossRef]
- Karelis, A.D.; St-Pierre, D.H.; Conus, F.; Rabasa-Lhoret, R.; Poehlman, E.T. Metabolic and body composition factors in subgroups of obesity: What do we know? J. Clin. Endocrinol. Metab. 2004, 89, 2569–2575. [Google Scholar] [CrossRef] [PubMed]
- Ruderman, N.B.; Schneider, S.H.; Berchtold, P. The “metabolically-obese”, normal-weight individual. Am. J. Clin. Nutr. 1981, 34, 1617–1621. [Google Scholar] [CrossRef] [PubMed]
- Du, Y.; Zhu, H.; Zheng, S.; Zhu, X.; Zhang, X.; Xue, S.; Li, H.; Hong, W.; Tang, W.; Chen, M.; et al. Age and sex effects on the relationship between body composition and hip geometric structure in males and females from East China. Archives Osteoporos. 2018, 13, 79. [Google Scholar] [CrossRef] [PubMed]
- Lean, M.E.J.; Vlachou, P.; Govan, L.; Han, T.S. Different associations between body composition and alcohol when assessed by exposure frequency or by quantitative estimates of consumption. J. Hum. Nutr. Diet. 2018. [Google Scholar] [CrossRef]
- Rosique-Esteban, N.; Babio, N.; Diaz-Lopez, A.; Romaguera, D.; Alfredo Martinez, J.; Sanchez, V.M.; Schroder, H.; Estruch, R.; Vidal, J.; Buil-Cosiales, P.; et al. Leisure-time physical activity at moderate and high intensity is associated with parameters of body composition, muscle strength and sarcopenia in aged adults with obesity and metabolic syndrome from the PREDIMED-Plus study. Clin. Nutr. (Edinburgh, Scotland) 2018. [Google Scholar] [CrossRef]
- Mizuno, N.; Seko, Y.; Kataoka, S.; Okuda, K.; Furuta, M.; Takemura, M.; Taketani, H.; Hara, T.; Umemura, A.; Nishikawa, T.; et al. Increase in the skeletal muscle mass to body fat mass ratio predicts the decline in transaminase in patients with nonalcoholic fatty liver disease. J. Gastroenterol. 2019, 54, 160–170. [Google Scholar] [CrossRef]
- Calella, P.; Valerio, G.; Brodlie, M.; Donini, L.M.; Siervo, M. Cystic fibrosis, body composition, and health outcomes: A systematic review. Nutrition (Burbank, Los Angeles County, Calif.) 2018, 55–56, 131–139. [Google Scholar] [CrossRef]
- Choi, J.; Se-Young, O.; Lee, D.; Tak, S.; Hong, M.; Park, S.M.; Cho, B.; Park, M. Characteristics of diet patterns in metabolically obese, normal weight adults (Korean National Health and Nutrition Examination Survey III, 2005). Nutr. Metab. Cardiovasc. Dis. 2012, 22, 567–574. [Google Scholar] [CrossRef]
- Hashimoto, Y.; Fukuda, T.; Oyabu, C.; Tanaka, M.; Asano, M.; Yamazaki, M.; Fukui, M. Impact of low-carbohydrate diet on body composition: Meta-analysis of randomized controlled studies. Obes. Rev. 2016, 17, 499–509. [Google Scholar] [CrossRef]
- Parr, E.B.; Coffey, V.G.; Cato, L.E.; Phillips, S.M.; Burke, L.M.; Hawley, J.A. A randomized trial of high-dairy-protein, variable-carbohydrate diets and exercise on body composition in adults with obesity. Obesity (Silver Spring, Md.) 2016, 24, 1035–1045. [Google Scholar] [CrossRef]
- Layman, D.K.; Boileau, R.A.; Erickson, D.J.; Painter, J.E.; Shiue, H.; Sather, C.; Christou, D.D. A reduced ratio of dietary carbohydrate to protein improves body composition and blood lipid profiles during weight loss in adult women. J. Nutr. 2003, 133, 411–417. [Google Scholar] [CrossRef]
- Choi, H.; Song, S.; Kim, J.; Chung, J.; Yoon, J.; Paik, H.Y.; Song, Y. High carbohydrate intake was inversely associated with high-density lipoprotein cholesterol among Korean adults. Nutr. Res. (New York, N.Y.) 2012, 32, 100–106. [Google Scholar] [CrossRef]
- Pal, S.; Radavelli-Bagatini, S. The effects of whey protein on cardiometabolic risk factors. Obes. Rev. 2013, 14, 324–343. [Google Scholar] [CrossRef]
- Li, J.; Armstrong, C.L.; Campbell, W.W. Effects of Dietary Protein Source and Quantity during Weight Loss on Appetite, Energy Expenditure, and Cardio-Metabolic Responses. Nutrients 2016, 8, 63. [Google Scholar] [CrossRef]
- Vitale, M.; Masulli, M.; Rivellese, A.A.; Babini, A.C.; Boemi, M.; Bonora, E.; Buzzetti, R.; Ciano, O.; Cignarelli, M.; Cigolini, M.; et al. Influence of dietary fat and carbohydrates proportions on plasma lipids, glucose control and low-grade inflammation in patients with type 2 diabetes-The TOSCA.IT Study. Eur. J. Nutr. 2016, 55, 1645–1651. [Google Scholar] [CrossRef]
- Wen, C.P.; David Cheng, T.Y.; Tsai, S.P.; Chan, H.T.; Hsu, H.L.; Hsu, C.C.; Eriksen, M.P. Are Asians at greater mortality risks for being overweight than Caucasians? Redefining obesity for Asians. Public Health Nutr. 2009, 12, 497–506. [Google Scholar] [CrossRef]
- Grundy, S.M.; Cleeman, J.I.; Daniels, S.R.; Donato, K.A.; Eckel, R.H.; Franklin, B.A.; Gordon, D.J.; Krauss, R.M.; Savage, P.J.; Smith, S.C., Jr.; et al. Diagnosis and management of the metabolic syndrome: An American Heart Association/National Heart, Lung, and Blood Institute Scientific Statement. Circulation 2005, 112, 2735–2752. [Google Scholar] [CrossRef]
- Lee, S.Y.; Park, H.S.; Kim, D.J.; Han, J.H.; Kim, S.M.; Cho, G.J.; Kim, D.Y.; Kwon, H.S.; Kim, S.R.; Lee, C.B.; et al. Appropriate waist circumference cutoff points for central obesity in Korean adults. Diabetes Res. Clin. Pract. 2007, 75, 72–80. [Google Scholar] [CrossRef]
- The Korean Nutrition Society. Dietary Reference Intake for Korean; The Korean Nutrition Society Hanareum Press: Seoul, Korea, 2010. [Google Scholar]
- Paik, H.Y. Dietary Reference Intakes for Koreans (KDRIs). Asia Pac. J. Clin. Nutr. 2008, 17 (Suppl. 2), 416–419. [Google Scholar]
- The Korea Centers for Disease Control and Prevention: Alcohol Drinking. Available online: http://health.cdc.go.kr/health/HealthInfoArea/HealthInfo/View.do?idx=14520 (accessed on 25 July 2018).
- World Health Organization. Global Recommendations on Physical Activity for Health; World Health Organization: Geneva, Switzerland, 2010. [Google Scholar]
- Kaur, A.; Johnston, D.G.; Godsland, I.F. Does metabolic health in overweight and obesity persist?—Individual variation and cardiovascular mortality over two decades. Eur. J. Endocrinol. 2016, 175, 133–143. [Google Scholar] [CrossRef]
- Al-Khalidi, B.; Kimball, S.M.; Kuk, J.L.; Ardern, C.I. Metabolically healthy obesity, vitamin D, and all-cause and cardiometabolic mortality risk in NHANES III. Clin. Nutr. (Edinburgh, Scotland) 2018. [Google Scholar] [CrossRef]
- Fan, J.; Song, Y.; Chen, Y.; Hui, R.; Zhang, W. Combined effect of obesity and cardio-metabolic abnormality on the risk of cardiovascular disease: A meta-analysis of prospective cohort studies. Int. J. Cardiol. 2013, 168, 4761–4768. [Google Scholar] [CrossRef]
- Kim, H.N.; Kim, S.H.; Eun, Y.M.; Song, S.W. Obesity with metabolic abnormality is associated with the presence of carotid atherosclerosis in Korean men: A cross-sectional study. Diabetol. Metab. Syndrome 2015, 7, 68. [Google Scholar] [CrossRef]
- Park, K.B.; Park, H.A.; Kang, J.H.; Kim, K.; Cho, Y.G.; Jang, J. Animal and Plant Protein Intake and Body Mass Index and Waist Circumference in a Korean Elderly Population. Nutrients 2018, 10, 577. [Google Scholar] [CrossRef]
- Mansoor, N.; Vinknes, K.J.; Veierod, M.B.; Retterstol, K. Effects of low-carbohydrate diets v. low-fat diets on body weight and cardiovascular risk factors: A meta-analysis of randomised controlled trials. Br. J. Nutr. 2016, 115, 466–479. [Google Scholar] [CrossRef]
- Hall, K.D.; Bemis, T.; Brychta, R.; Chen, K.Y.; Courville, A.; Crayner, E.J.; Goodwin, S.; Guo, J.; Howard, L.; Knuth, N.D.; et al. Calorie for Calorie, Dietary Fat Restriction Results in More Body Fat Loss than Carbohydrate Restriction in People with Obesity. Cell Metab. 2015, 22, 427–436. [Google Scholar] [CrossRef]
- Wycherley, T.P.; Moran, L.J.; Clifton, P.M.; Noakes, M.; Brinkworth, G.D. Effects of energy-restricted high-protein, low-fat compared with standard-protein, low-fat diets: A meta-analysis of randomized controlled trials. Am. J. Clin. Nutr. 2012, 96, 1281–1298. [Google Scholar] [CrossRef]
- Kwon, Y.J.; Lee, H.S.; Lee, J.W. Association of carbohydrate and fat intake with metabolic syndrome. Clin. Nutr. (Edinburgh, Scotland) 2018, 37, 746–751. [Google Scholar] [CrossRef]
- Naude, C.E.; Schoonees, A.; Senekal, M.; Young, T.; Garner, P.; Volmink, J. Low carbohydrate versus isoenergetic balanced diets for reducing weight and cardiovascular risk: A systematic review and meta-analysis. PLoS ONE 2014, 9, e100652. [Google Scholar] [CrossRef]
- Perez-Martinez, P.; Alcala-Diaz, J.F.; Delgado-Lista, J.; Garcia-Rios, A.; Gomez-Delgado, F.; Marin-Hinojosa, C.; Rodriguez-Cantalejo, F.; Delgado-Casado, N.; Perez-Caballero, A.I.; Fuentes-Jimenez, F.J.; et al. Metabolic phenotypes of obesity influence triglyceride and inflammation homoeostasis. Eur. J. Clin. Investig. 2014, 44, 1053–1064. [Google Scholar] [CrossRef] [PubMed]
- Hyun, Y.J.; Koh, S.J.; Chae, J.S.; Kim, J.Y.; Kim, O.Y.; Lim, H.H.; Jang, Y.; Park, S.; Ordovas, J.M.; Lee, J.H. Atherogenecity of LDL and unfavorable adipokine profile in metabolically obese, normal-weight woman. Obesity (Silver Spring, Md.) 2008, 16, 784–789. [Google Scholar] [CrossRef] [PubMed]
- Smith, H.A.; Gonzalez, J.T.; Thompson, D.; Betts, J.A. Dietary carbohydrates, components of energy balance, and associated health outcomes. Nutr. Rev. 2017, 75, 783–797. [Google Scholar] [CrossRef] [PubMed]
- Flachs, P.; Rossmeisl, M.; Bryhn, M.; Kopecky, J. Cellular and molecular effects of n-3 polyunsaturated fatty acids on adipose tissue biology and metabolism. Clin. Sci. (London, England) 2009, 116, 1–16. [Google Scholar] [CrossRef] [PubMed]
- Leidy, H.J.; Clifton, P.M.; Astrup, A.; Wycherley, T.P.; Westerterp-Plantenga, M.S.; Luscombe-Marsh, N.D.; Woods, S.C.; Mattes, R.D. The role of protein in weight loss and maintenance. Am. J. Clin. Nutr. 2015, 101, 1320s–1329s. [Google Scholar] [CrossRef] [PubMed]


| Total | Males | Females | |||||||||
|---|---|---|---|---|---|---|---|---|---|---|---|
| MHNW | MHO | MANW | MAO | p Value | MHNW | MHO | MANW | MAO | p Value | ||
| N | 7374 | 1705 | 478 | 434 | 679 | - | 2079 | 386 | 818 | 795 | - |
| Age (years) | 48.7 ± 0.3 | 46.6 ± 0.5 | 43.2 ± 0.7 | 57.2 ± 0.9 | 50.4 ± 0.7 | <0.001 | 43.8 ± 0.4 | 48.7 ± 0.9 | 59.3 ± 0.7 | 58.3 ± 0.6 | <0.001 |
| Current smoking (%) | 21.8 | 38.4 | 36.2 | 41.7 | 37.0 | 0.509 | 4.5 | 5.0 | 4.7 | 5.1 | 0.964 |
| Heavy drinking (%) | 12.1 | 15.5 | 17.5 | 26.6 | 26.3 | <0.001 | 4.5 | 6.8 | 4.4 | 4.4 | 0.453 |
| Physical activity (low, %) | 44.6 | 50.1 | 55.6 | 43.4 | 38.8 | <0.001 | 45.3 | 42.0 | 33.8 | 34.0 | <0.001 |
| Household income (low, %) | 41.9 | 39.3 | 37.4 | 54.3 | 43.2 | <0.001 | 33.8 | 41.7 | 56.4 | 56.5 | <0.001 |
| Energy intake (kcal) | 2038.7 ± 12.2 | 2362.7 ± 25.5 | 2331.9 ± 46.5 | 2201.8 ± 45.4 | 2298.9 ± 39.0 | 0.013 | 1778.8 ± 15.8 | 1761.4 ± 38.8 | 1661.1 ± 25.9 | 1670.6 ± 26.0 | <0.001 |
| Carbohydrate intake (g) | 316.1 ± 1.8 | 355.1 ± 3.8 | 339.8 ± 6.3 | 334.3 ± 7.0 | 339.9 ± 5.2 | 0.007 | 282.2 ± 2.7 | 282.4 ± 6.4 | 286.1 ± 4.5 | 285.6 ± 4.6 | 0.830 |
| Fat intake (g) | 43.6 ± 0.5 | 51.0 ± 0.9 | 54.9 ± 2.0 | 41.1 ± 1.6 | 47.8 ± 1.5 | <0.001 | 41.1 ± 0.7 | 37.9 ± 1.5 | 29.7 ± 1.1 | 30.4 ± 0.9 | <0.001 |
| Protein intake (g) | 70.2 ± 0.6 | 81.3 ± 1.2 | 84.5 ± 2.3 | 73.5 ± 1.8 | 80.6 ± 1.8 | <0.001 | 61.3 ± 0.7 | 61.7 ± 2.1 | 55.1 ± 1.1 | 55.2 ± 1.2 | <0.001 |
| Fiber intake (g) | 24.0 ± 0.2 | 25.6 ± 0.4 | 24.6 ± 0.7 | 26.0 ± 0.7 | 25.9 ± 0.6 | 0.431 | 22.1 ± 0.3 | 22.7 ± 0.7 | 23.2 ± 0.5 | 22.3 ± 0.5 | 0.297 |
| Medical history (%) | |||||||||||
| Diabetes | 8.9 | 4.6 | 4.2 | 27.3 | 20.2 | <0.001 | 1.6 | 3.7 | 14.5 | 22.6 | <0.001 |
| Hypertension | 26.9 | 16.0 | 20.1 | 58.0 | 53.9 | <0.001 | 10.1 | 18.8 | 43.2 | 57.5 | <0.001 |
| Dyslipidemia | 16.1 | 9.4 | 12.2 | 24.7 | 23.3 | <0.001 | 10.8 | 19.8 | 25.2 | 32.5 | <0.001 |
| Waist circumference (cm) | 81.9 ± 0.2 | 79.9 ± 0.2 | 90.3 ± 0.3 | 85.1 ± 0.3 | 95.9 ± 0.3 | <0.001 | 72.9 ± 0.2 | 86.8 ± 0.4 | 79.4 ± 0.3 | 90.9 ± 0.3 | <0.001 |
| Body mass index (kg/m2) | 23.7 ± 0.1 | 22.1 ± 0.1 | 26.9 ± 0.1 | 23.0 ± 0.1 | 28.1 ± 0.1 | <0.001 | 21.1 ± 0.1 | 27.1 ± 0.1 | 22.6 ± 0.1 | 28.0 ± 0.1 | <0.001 |
| SBP (mmHg) | 118.1 ± 0.3 | 116.2 ± 0.4 | 119.8 ± 0.6 | 127.8 ± 0.8 | 127.4 ± 0.6 | <0.001 | 109.6 ± 0.3 | 116.5 ± 0.9 | 123.7 ± 0.8 | 127.1 ± 0.7 | <0.001 |
| DBP (mmHg) | 75.5 ± 0.2 | 75.5 ± 0.3 | 78.2 ± 0.5 | 79.7 ± 0.6 | 83.2 ± 0.4 | <0.001 | 70.8 ± 0.2 | 74.8 ± 0.5 | 74.7 ± 0.4 | 77.7 ± 0.4 | <0.001 |
| Fasting glucose (mL/dL) | 99.4 ± 0.3 | 96.1 ± 0.5 | 97.5 ± 0.8 | 117.7 ± 1.9 | 110.9 ± 1.1 | <0.001 | 91.2 ± 0.3 | 95.8 ± 1.1 | 103.9 ± 0.9 | 109.9 ± 1.2 | <0.001 |
| Total cholesterol (mg/dL) | 190.4 ± 0.5 | 185.8 ± 0.9 | 195.1 ± 1.7 | 187.4 ± 2.1 | 196.5 ± 1.9 | <0.001 | 188.9 ± 0.9 | 201.5 ± 2.0 | 187.9 ± 1.4 | 195.9 ± 1.6 | <0.001 |
| LDL-C (mg/dL) | 115.5 ± 0.7 | 113.7 ± 1.3 | 124.5 ± 2.1 | 105.6 ± 2.6 | 119.3 ± 1.9 | <0.001 | 110.1 ± 1.2 | 123.1 ± 3.1 | 115.9 ± 1.8 | 122.8 ± 2.0 | <0.001 |
| HDL-C (mg/dL) | 50.8 ± 0.2 | 51.1 ± 0.3 | 46.9 ± 0.4 | 41.2 ± 0.5 | 41.3 ± 0.4 | <0.001 | 59.9 ± 0.3 | 58.1 ± 0.5 | 43.6 ± 0.3 | 44.9 ± 0.4 | <0.001 |
| Triglycerides (mg/dL) | 141.2 ± 1.9 | 125.2 ± 3.7 | 142.9 ± 5.4 | 251.6 ± 11.3 | 248.7 ± 8.2 | <0.001 | 83.6 ± 1.0 | 108.1 ± 3.3 | 162.7 ± 4.2 | 172.7 ± 3.9 | <0.001 |
| MHNW | MHO | MANW | MAO | p Value | p for Trend | ||
|---|---|---|---|---|---|---|---|
| Males | |||||||
| Unadjusted | Carbohydrate (%) | 65.5 ± 0.3 | 63.1 ± 0.6 | 67.8 ± 0.6 | 65.6 ± 0.5 | <0.001 | 0.250 |
| Fat (%) | 19.9 ± 0.3 | 21.7 ± 0.5 | 17.6 ± 0.5 | 19.3 ± 0.4 | <0.001 | 0.017 | |
| Protein (%) | 14.7 ± 0.1 | 15.2 ± 0.2 | 14.6 ± 0.2 | 15.2 ± 0.2 | 0.025 | 0.069 | |
| Model 1 | Carbohydrate (%) | 65.8 ± 0.3 | 64.4 ± 0.5 | 65.1 ± 0.5 | 64.8 ± 0.4 | 0.074 | 0.044 |
| Fat (%) | 19.5 ± 0.2 | 20.5 ± 0.4 | 19.8 ± 0.4 | 19.8 ± 0.3 | 0.345 | 0.416 | |
| Protein (%) | 14.5 ± 0.1 | 15.0 ± 0.2 | 15.0 ± 0.2 | 15.2 ± 0.2 | 0.022 | 0.003 | |
| Model 2 | Carbohydrate (%) | 64.9 ± 0.3 | 63.5 ± 0.6 | 64.5 ± 0.5 | 64.2 ± 0.4 | 0.124 | 0.126 |
| Fat (%) | 19.8 ± 0.2 | 20.7 ± 0.5 | 20.0 ± 0.4 | 20.0 ± 0.4 | 0.347 | 0.492 | |
| Protein (%) | 15.2 ± 0.1 | 15.6 ± 0.2 | 15.4 ± 0.2 | 15.7 ± 0.2 | 0.117 | 0.030 | |
| Model 3 | Carbohydrate (%) | 64.3 ± 0.2 | 64.2 ± 0.3 | 63.9 ± 0.3 | 64.1 ± 0.3 | 0.542 | 0.280 |
| Fat (%) | 18.5 ± 0.2 | 19.2 ± 0.4 | 18.4 ± 0.4 | 18.4 ± 0.3 | 0.211 | 0.902 | |
| Protein (%) | 14.6 ± 0.1 | 14.9 ± 0.2 | 14.6 ± 0.2 | 14.9 ± 0.2 | 0.171 | 0.129 | |
| Females | |||||||
| Unadjusted | Carbohydrate (%) | 65.5 ± 0.3 | 66.6 ± 0.7 | 70.9 ± 0.5 | 70.6 ± 0.4 | <0.001 | <0.001 |
| Fat (%) | 20.4 ± 0.2 | 19.1 ± 0.5 | 15.7 ± 0.4 | 16.0 ± 0.3 | <0.001 | <0.001 | |
| Protein (%) | 14.0 ± 0.1 | 14.4 ± 0.4 | 13.4 ± 0.2 | 13.3 ± 0.2 | <0.001 | <0.001 | |
| Model 1 | Carbohydrate (%) | 67.2 ± 0.2 | 66.8 ± 0.6 | 67.9 ± 0.5 | 67.9 ± 0.4 | 0.333 | 0.138 |
| Fat (%) | 18.9 ± 0.2 | 18.8 ± 0.5 | 18.2 ± 0.4 | 18.3 ± 0.3 | 0.257 | 0.060 | |
| Protein (%) | 13.7 ± 0.1 | 14.3 ± 0.3 | 13.8 ± 0.2 | 13.7 ± 0.2 | 0.483 | 0.812 | |
| Model 2 | Carbohydrate (%) | 65.7 ± 0.6 | 65.2 ± 0.8 | 66.3 ± 0.7 | 66.2 ± 0.6 | 0.462 | 0.216 |
| Fat (%) | 19.6 ± 0.5 | 19.5 ± 0.7 | 18.9 ± 0.6 | 19.1 ± 0.5 | 0.366 | 0.098 | |
| Protein (%) | 14.6 ± 0.3 | 15.2 ± 0.6 | 14.8 ± 0.4 | 14.7 ± 0.4 | 0.489 | 0.724 | |
| Model 3 | Carbohydrate (%) | 65.4 ± 0.3 | 65.3 ± 0.4 | 65.6 ± 0.4 | 65.5 ± 0.4 | 0.730 | 0.464 |
| Fat (%) | 16.6 ± 0.5 | 16.3 ± 0.5 | 16.2 ± 0.4 | 16.3 ± 0.5 | 0.342 | 0.089 | |
| Protein (%) | 12.9 ± 0.3 | 13.2 ± 0.4 | 13.0 ± 0.3 | 12.9 ± 0.3 | 0.628 | 0.860 |
| Carbohydrate Intake | Fat Intake | Protein Intake | |||||
|---|---|---|---|---|---|---|---|
| Low | High | Low | High | Low | High | ||
| Unadjusted | MHNW | 1 | 1 | 1 | 1 | 1 | 1 |
| MHO | 1.41 (1.04–1.92) | 0.73 (0.58–0.92) | 0.75 (0.59–0.97) | 1.31 (0.94–1.83) | 0.36 (0.04–3.41) | 1.21 (0.81–1.80) | |
| MANW | 0.58 (0.39–0.86) | 1.39 (1.05–1.82) | 1.39 (1.09–1.78) | 0.58 (0.37–0.91) | 0.37 (0.04–3.51) | 0.71 (0.43–1.18) | |
| MAO | 0.88 (0.66–1.17) | 1.00 (0.80–1.24) | 1.05 (0.84–1.32) | 0.66 (0.47–0.93) | 1.36 (0.27–6.86) | 1.07 (0.75–1.53) | |
| p for trend | 0.106 | 0.503 | 0.275 | 0.004 | 0.877 | 0.946 | |
| Model 1 | MHNW | 1 | 1 | 1 | 1 | 1 | 1 |
| MHO | 1.26 (0.92–1.74) | 0.83 (0.65–1.06) | 0.89 (0.67–1.18) | 1.17 (0.83–1.65) | 0.39 (0.04–4.05) | 1.13 (0.75–1.70) | |
| MANW | 0.98 (0.65–1.48) | 0.84 (0.65–1.11) | 0.83 (0.64–1.09) | 1.00 (0.61–1.62) | 0.31 (0.04–2.54) | 0.92 (0.55–1.53) | |
| MAO | 1.08 (0.81–1.45) | 0.82 (0.66–1.03) | 0.88 (0.68–1.13) | 0.81 (0.56–1.15) | 1.28 (0.28–5.91) | 1.18 (0.82–1.69) | |
| p for trend | 0.573 | 0.056 | 0.193 | 0.313 | 0.949 | 0.466 | |
| Model 2 | MHNW | 1 | 1 | 1 | 1 | 1 | 1 |
| MHO | 1.26 (0.92–1.73) | 0.83 (0.65–1.07) | 0.88 (0.67–1.17) | 1.17 (0.83–1.65) | 0.43 (0.04–4.34) | 1.11 (0.73–1.69) | |
| MANW | 0.89 (0.58–1.38) | 0.86 (0.64–1.14) | 0.83 (0.63–1.09) | 0.95 (0.58–1.57) | 0.32 (0.04–2.72) | 0.81 (0.47–1.38) | |
| MAO | 1.02 (0.76–1.36) | 0.84 (0.67–1.05) | 0.87 (0.67–1.20) | 0.78 (0.54–1.13) | 1.35 (0.30–6.15) | 1.06 (0.74–1.52) | |
| p for trend | 0.931 | 0.086 | 0.178 | 0.242 | 0.903 | 0.923 | |
| Model 3 | MHNW | 1 | 1 | 1 | 1 | 1 | 1 |
| MHO | 1.08 (0.70–1.66) | 1.24 (0.82–1.86) | 0.96 (0.71–1.29) | 1.18 (0.78–1.77) | 0.58 (0.10–3.46) | 1.14 (0.71–1.82) | |
| MANW | 1.00 (0.55–1.81) | 0.88 (0.55–1.42) | 0.85 (0.60–1.21) | 0.86 (0.50–1.49) | 0.07 (0.001–9.47) | 0.68 (0.36–1.27) | |
| MAO | 0.93 (0.58–1.50) | 0.85 (0.56–1.28) | 0.91 (0.68–1.23) | 0.66 (0.40–1.09) | 2.02 (0.42–9.83) | 0.96 (0.63–1.46) | |
| p for trend | 0.804 | 0.416 | 0.415 | 0.122 | 0.765 | 0.641 | |
| Carbohydrate Intake | Fat Intake | Protein Intake | |||||
|---|---|---|---|---|---|---|---|
| Low | High | Low | High | Low | High | ||
| Unadjusted | MHNW | 1 | 1 | 1 | 1 | 1 | 1 |
| MHO | 0.72 (0.50–1.05) | 1.03 (0.79–1.33) | 1.26 (0.98-1.63) | 0.76 (0.50–1.14) | 1.15 (0.24–5.43) | 1.28 (0.75–2.16) | |
| MANW | 0.46 (0.32–0.65) | 2.24 (1.81–2.77) | 2.73 (2.26–3.30) | 0.44 (0.30–0.63) | 0.78 (0.23–2.70) | 1.02 (0.68–1.51) | |
| MAO | 0.45 (0.32–0.64) | 2.10 (1.71–2.57) | 2.18 (1.80–2.63) | 0.38 (0.26–0.54) | 2.30 (0.77–6.86) | 0.94 (0.61–1.45) | |
| p for trend | <0.001 | <0.001 | <0.001 | <0.001 | 0.259 | 0.846 | |
| Model 1 | MHNW | 1 | 1 | 1 | 1 | 1 | 1 |
| MHO | 0.87 (0.60–1.26) | 0.80 (0.60–1.07) | 0.96 (0.72–1.29) | 0.92 (0.60–1.42) | 1.32 (0.27–6.37) | 1.42 (0.83–2.42) | |
| MANW | 0.87 (0.60–1.27) | 1.12 (0.88–1.42) | 1.25 (1.01–1.56) | 0.85 (0.57–1.27) | 1.26 (0.35–4.55) | 1.44 (0.94–2.20) | |
| MAO | 0.85 (0.59–1.22) | 1.08 (0.87–1.35) | 1.03 (0.83–1.28) | 0.71 (0.49–1.04) | 3.65 (0.97–13.72) | 1.31 (0.83–2.07) | |
| p for trend | 0.277 | 0.378 | 0.368 | 0.076 | 0.090 | 0.092 | |
| Model 2 | MHNW | 1 | 1 | 1 | 1 | 1 | 1 |
| MHO | 0.85 (0.59–1.23) | 0.80 (0.60–1.07) | 0.96 (0.72–1.29) | 0.91 (0.59–1.40) | 1.35 (0.30–6.08) | 1.37 (0.82–2.30) | |
| MANW | 0.87 (0.59–1.26) | 1.11 (0.87–1.42) | 1.25 (1.00–1.56) | 0.85 (0.57–1.27) | 1.26 (0.34–4.60) | 1.42 (0.93–2.16) | |
| MAO | 0.84 (0.58–1.21) | 1.07 (0.86–1.35) | 1.02 (0.82–1.27) | 0.71 (0.49–1.03) | 3.69 (0.94–14.53) | 1.29 (0.82–2.04) | |
| p for trend | 0.256 | 0.444 | 0.415 | 0.068 | 0.097 | 0.110 | |
| Model 3 | MHNW | 1 | 1 | 1 | 1 | 1 | 1 |
| MHO | 0.77 (0.41–1.46) | 0.78 (0.41–1.46) | 1.01 (0.70–1.47) | 0.89 (0.51–1.53) | 5.85 (1.13–30.31) | 1.11 (0.60–2.07) | |
| MANW | 0.69 (0.39–1.21) | 1.01 (0.62–1.64) | 1.15 (0.86–1.54) | 0.80 (0.49–1.32) | 1.63 (0.09–29.26) | 1.47 (0.87–2.48) | |
| MAO | 0.81 (0.43–1.54) | 0.92 (0.59–1.43) | 0.89 (0.63–1.25) | 0.64 (0.38–1.09) | 6.40 (0.97–42.06) | 1.44 (0.81–2.54) | |
| p for trend | 0.288 | 0.739 | 0.751 | 0.084 | 0.096 | 0.119 | |
© 2019 by the authors. Licensee MDPI, Basel, Switzerland. This article is an open access article distributed under the terms and conditions of the Creative Commons Attribution (CC BY) license (http://creativecommons.org/licenses/by/4.0/).
Share and Cite
Kim, H.-N.; Song, S.-W. Associations between Macronutrient Intakes and Obesity/Metabolic Risk Phenotypes: Findings of the Korean National Health and Nutrition Examination Survey. Nutrients 2019, 11, 628. https://doi.org/10.3390/nu11030628
Kim H-N, Song S-W. Associations between Macronutrient Intakes and Obesity/Metabolic Risk Phenotypes: Findings of the Korean National Health and Nutrition Examination Survey. Nutrients. 2019; 11(3):628. https://doi.org/10.3390/nu11030628
Chicago/Turabian StyleKim, Ha-Na, and Sang-Wook Song. 2019. "Associations between Macronutrient Intakes and Obesity/Metabolic Risk Phenotypes: Findings of the Korean National Health and Nutrition Examination Survey" Nutrients 11, no. 3: 628. https://doi.org/10.3390/nu11030628
APA StyleKim, H.-N., & Song, S.-W. (2019). Associations between Macronutrient Intakes and Obesity/Metabolic Risk Phenotypes: Findings of the Korean National Health and Nutrition Examination Survey. Nutrients, 11(3), 628. https://doi.org/10.3390/nu11030628