Article

Nutrient Composition Comparison between the Low Saturated Fat Swank Diet for Multiple Sclerosis and Healthy U.S.-Style Eating Pattern

by
Catherine A. Chenard
1,*,
Linda M. Rubenstein
2,
Linda G. Snetselaar
2 and
Terry L. Wahls
1
1
Department of Internal Medicine, Carver College of Medicine, University of Iowa, Iowa City, IA 52242, USA
2
Department of Epidemiology, College of Public Health, University of Iowa, Iowa City, IA 52242, USA
*
Author to whom correspondence should be addressed.
Nutrients 2019, 11(3), 616; https://doi.org/10.3390/nu11030616
Submission received: 6 January 2019 / Revised: 1 March 2019 / Accepted: 4 March 2019 / Published: 13 March 2019
(This article belongs to the Special Issue Diet Diversity and Diet Quality)

Abstract

:
Multiple sclerosis (MS) is an incurable degenerative disease that attacks the central nervous system. Roy Swank proposed a low saturated fat diet to treat MS around 1950 and showed delayed disease progression in his patients. However, there is insufficient evidence to recommend this diet for MS and default dietary recommendations are the Dietary Guidelines for Americans (DGA). This study assessed the nutritional adequacy of seven-day menus developed by Swank and their compliance with the DGA; menus were modeled for comparison with the DGA Healthy US-Style Eating Pattern (HEP) for males and females 31–50 years. Swank recommended dietary supplements corrected menu shortfalls in vitamins D, E, calcium, folate and iron but not dietary fiber, potassium and choline. Healthy Eating Index-2015 score for Swank menus (93.2/100) indicated good compliance with the DGA. Nutritional adequacy of the Swank modeled diet was similar to HEP for 17 vitamins and minerals (Mean Adequacy Ratios ≥94%) with similar shortfall nutrients except magnesium (HEP males) and dietary fiber (Swank males). Alternate Healthy Eating Index-2010 scores for Swank male (90/110) and female (88/110) model diets were similar to HEP. Swank menus have similar nutritional adequacy as HEP. Inclusion of foods high in dietary fiber, potassium and choline may be advised as well as selection of foods to reduce sodium below the Tolerable Upper Intake Level.

1. Introduction

Multiple sclerosis (MS) is an incurable immune-mediated, inflammatory disease that attacks the central nervous system. Persons with MS (pwMS) may experience visual disturbances, cognitive and emotional changes, movement and balance difficulties, bowel and bladder dysfunction, pain and fatigue. The symptoms can wax and wane over time as myelin and axons are damaged and then partially repaired. As the disease progresses, the accumulated damage may lead to greater disability, but the disease course is unpredictable [1,2]. Symptoms consistent with MS were reported as early as the 1300 or 1400s but it was not until the pathology was associated with the symptoms in the 1800s [3,4] that MS as a distinct condition, separate from diseases such as Parkinson’s disease, emerged [3,5]. Eventually diagnostic methods and access to trained neurologists improved [3]. By 1950 MS was the most common neurological disease in the United States (US) [5] but there were no effective treatments [4].
Beginning in 1948 neurologist Roy Swank, MD, PhD began investigating the epidemiology of MS and proposed a low saturated fat dietary treatment [6] based on data suggesting that a higher intake of saturated animal fats were associated with higher incidence of MS [7,8]. Swank placed his patients on this diet and followed them for 50 years [9], publishing a series of reports [10,11,12,13,14,15,16,17,18,19]. His main findings were a reduction in the frequency and severity of relapses when patients consumed ≤20 g saturated fat/day [9,10,11,12,13,14]. These patients exhibited less disability and lower mortality [17] especially when the diet was started early in the disease course [10,11,15,17]. However, his study has been criticized for comparing good versus poor diet adherents which biases the data towards positive results, for lacking a control group, blinded assessors, brain imaging data [20,21] and standardized dietary intake assessment and for missing data that is not missing at random [22].
Swank did not believe fat caused MS but that a high intake might contribute to a more rapid onset of the disease progression in susceptible individuals [7,23]. He thought this may be the result of the obstruction of small blood vessels due to increased clustering of chylomicrons after consumption of a high fat meal [10,23,24,25,26,27]. Various vessel-based theories of MS have been suggested since 1863 and continue today with the chronic cerebrospinal venous insufficiency theory [28] and hypotheses of cholesterol and disordered lipid metabolism [29,30]. Total cholesterol [31] and low density lipoproteins [32] have been positively associated with disability. Lipids were not associated with risk of relapse in 141 Australian pwMS [33] but energy intake from fat and saturated fat were associated with relapse in a pediatric MS study [34,35].
Swank published a book that summarized his findings and provided practical advice, recipes and seven-day menus to assist pwMS in following his diet [36]. He died in 2008 [6] but his diet continues to be promoted by the Swank MS Foundation [37]. PwMS are still following this diet today [38,39,40,41]. Dietary guidelines for the Swank diet are shown in Table 1.
In the 70 years since Swank developed his diet, various other dietary regimens have been proposed to treat MS including the plant-based low-fat McDougall [42], Mediterranean [43,44], ketogenic [45], energy restricted/fasting [46,47,48] and modified Paleolithic (Paleo) Wahls™ [49,50,51,52,53]. However, more research and better designed studies are needed to determine the benefits and risks of the Swank or any other diet for pwMS [54,55]. To help address this research gap, dietary intervention studies are underway that investigate intermittent fasting (NCT03539094), dietary salt and immune function (NCT02282878), ketogenic (NCT03718247) and low fat (<20% energy) diets (NCT03322982), ketogenic versus intermittent fasting versus vegetarian diets (NCT03508414), activity and balanced eating (NCT03808545), a low glycemic load diet administered via internet coaching (NCT03372187) and the effect of a gluten-free diet on blood brain barrier permeability (NCT03451955). Until there is sufficient scientific evidence to determine which diet(s) are beneficial for MS, the National MS Society (NMSS) [56,57] encourages pwMS to follow healthy eating recommendations such as the Dietary Guidelines for Americans (DGA) [58] and those promoted by the American Heart Association [59] and American Cancer Society [60].
One clinical trial currently underway is investigating the effect of the Swank diet on MS-related fatigue [61,62] but there are no reports of the Swank diet’s nutritional adequacy or compliance with the DGA. Swank considered his diet to be ‘healthy’ because of the reduction in fat and ‘junk’ food [36]. The NMSS [56] does not believe the Swank diet would cause nutrient deficiencies but one study found a low intake of vitamins A, C, E and folate in the 24 h recalls of two pwMS following the diet [39]. In addition, individuals consuming diets low in fat may be at risk for low intake of some nutrients [63] such as vitamin E and linoleic acid [64].
Therefore, the purpose of this report is to assess the nutritional adequacy of the Swank diet by comparing nutrient levels to the Dietary Reference Intakes (DRI) [65,66] for adult men and women. The diet’s adherence to the DGA, the current default dietary guidance, will be assessed using the Healthy Eating Index 2015 (HEI-2015) [67]. Scores for the Alternate Healthy Eating Index 2010 (AHEI-2010), which have been associated with risk of chronic diseases such as coronary heart disease and diabetes [68], will also be calculated. The Swank diet’s nutritional adequacy, HEI-2015 and AHEI-2010 scores will be compared to those for the Healthy US-Style Eating Pattern (HEP) [69] recommended by the DGA.

2. Materials and Methods

2.1. Study Overview

This study was considered exempt by the University of Iowa Institutional Review Board. It reports the calculated nutrient composition, nutritional adequacy, and HEI-2015 scores of seven-day menus developed by Roy Swank [36]. Nutritional adequacy and HEI-2015 scores for the HEP were obtained from published data [70,71]; AHEI-2010 scores were calculated using publicly available food and nutrient data used to develop the HEP [69,70,72]. Nutrient composition of the Swank seven-day menus was modeled using United States Department of Agriculture (USDA) nutrient profiles to allow for comparison with the nutritional adequacy of the 2015–2020 DGA HEP and calculation of the AHEI-2010.

2.2. Nutritional Adequacy of Seven-Day Swank Menus

Seven-day Swank menus and associated recipes were used as published in The Multiple Sclerosis Diet Book [36] except that refined grains (i.e., rice, crackers, bread, pasta and waffles) were replaced with whole grain versions to be consistent with current Swank MS Foundation guidelines that encourage use of whole grains [37]. Swank menus are described in Supplementary Table S1.
Nutrient composition of Swank menus was calculated by a Registered Dietitian using Nutrition Data System for Research (NDSR) software version 2017 (Nutrition Coordinating Center (NCC), University of Minnesota, Minneapolis, MN, USA) [73]. To ensure consistent entry of ambiguous recipe and menu details, these data entry rules were followed. 1. When amounts were listed as a range, the average was used (e.g., 11 nuts were entered for “10–12 peanuts, almonds, cashews” for Sunday snack). 2. When multiple ingredients were listed as an option, all items were used in equal proportions (e.g., 1/3 each peanuts, almonds and cashews entered for Sunday snack) except for Swank day 4 dinner when a full serving of rice was selected instead of a half serving each of rice and potato because rice is a more typical side dish for the oriental entrée at this meal. 3. When nuts were an optional ingredient in a recipe, half the recommended amount was used so as to provide an average of the two options for zero nuts or the full amount. 4. No salt was added in cooking unless specified in the recipe; one dash per serving was used when directions specified salting to taste. The NDSR salt default was used for commercial foods. 5. Frozen fruit was assumed to be unsweetened. 6. Skin was assumed to be retained on fruits and vegetables unless recipe or menu stated otherwise. 7. When food details or amounts were not specified, they were determined using a. Nutrition software data-entry rules (e.g., ½ cup milk per 1 cup cereal used for amount of milk in “cold cereal and skim milk” for Wednesday breakfast) or defaults (e.g., Wednesday breakfast “cold cereal” entered as cereal, ready-to-eat, unknown type which defaults to Cheerios®) b. Amounts for 1 cup-equivalent fruit or vegetable (e.g., unknown amount of “juice” on Sunday breakfast entered as 1 cup) or 1 grain-equivalent (e.g., unknown amount of “rice” on Sunday dinner entered as ½ cup cooked) c. Based on representative foods consumed in the US [72] (e.g., oil, fresh fruit and fruit juice types not specified) d. Professional judgment (e.g., selection of NDSR pan fried entry for “fried fish” on Wednesday dinner and NDSR option for green salad with tomatoes and/or carrots and mixed greens for Tuesday dinner “assorted green salad”). 8. The optional unsweetened coffee and tea on the menus were not entered.
Nutrient contribution of dietary supplements was calculated separately from the menus. The NDSR default multivitamin/mineral for the appropriate sex and age was selected for the Swank multivitamin based on the DRI age and sex category being evaluated.
Food group servings were assigned using the NCC Food Group Serving Count System. Recipe food group servings were assigned based on recipe ingredients. Changes were manually made to food group assignment and serving counts for green leaf lettuce to match current guidelines [74].
Individuals use menus and meal patterns to plan their food intake, therefore, mean nutrient composition of the seven-day menus was compared to the Recommended Dietary Allowance (RDA) or Adequate Intake (AI) instead of the Estimated Average Requirement [66,75]. Nutritional adequacy of menus with and without dietary supplements was evaluated using appropriate RDA, AI and Tolerable Upper Intake Levels (UL) for males and females aged 19 to 70+ years [65] by computing the menu average as percentages of the RDA, AI or UL. Prior to this calculation, menu nutrient values were proportionately increased or decreased to produce menus with energy levels appropriate for the varying needs of adult males and females [76].
The average percent RDA for 17 vitamins and minerals (vitamins A, C, D, E, B1, B2, B3, B6, folate and B12, calcium, copper, iron, magnesium, phosphorus, selenium and zinc) was calculated for each age/sex group. A Mean Adequacy Ratio (MAR) [77] (1) was computed using these percentages to provide a score summarizing the overall adequacy of the menus; RDA percentages were truncated at 100% so an excess of one nutrient would not obscure the deficiency of another.
Mean Adequacy Ratio (MAR), % = ∑percent RDA truncated at 100%/number of nutrients.

2.3. Nutritional Adequacy of Swank Diet and HEP Using Food Pattern Modeling

The Healthy US-Style Eating Pattern (HEP) [69] included in the DGA [58] consists of a recommended number of servings of food groups (e.g., fruits, vegetables, protein foods, grains, dairy, oils) to create nutritionally adequate diets at various energy levels. The USDA modeled the nutritional adequacy of the HEP [70] using food composition data obtained from the USDA Food Group nutrient profiles [78,79]. The USDA Food Group nutrient profiles [79] were calculated using foods reported in the 2009–10 National Health and Nutrition Examination Survey (NHANES) [72] and nutrient composition for forms of the foods that were low in fat, added sodium and sugar [78,80]. Folate values for the nutrient profiles were not publicly reported but the authors requested them from the USDA [81] for use in this investigation. This report examines the nutritional adequacy of the 1800 and 2200 kcal (7531 and 9205 kJ, respectively) HEP diets which are suitable for females and males 31–50 years, respectively.
Swank menus were modeled similar to the HEP by using the average food group servings from the seven-day Swank menus and the nutrient composition of the USDA Food Group nutrient profiles [79]. Because Swank only provided one set of seven-day menus which did not match the target 1800 and 2200 kcals (7531 and 9205 kJ, respectively), the nutrient composition was proportionately increased to these energy levels prior to comparing to the DRI for males and females 31–50 years. Using the USDA Food Group nutrient profiles to calculate the nutrient composition of the Swank diet allowed for direct comparison with the nutritional adequacy of the DGA HEP which was modeled using these same nutrient profiles [78]. Using the Food Group nutrient profiles also provided an estimate of the nutritional adequacy for the Swank diet as if typical foods consumed in the US had been used to create the menus rather than the foods selected by Swank.

2.4. Healthy Eating Index-2015 (HEI-2015) and Alternate Healthy Eating Index-2010 (AHEI-2010)

The Healthy Eating Index-2015 (HEI-2015) [67] is a validated [71] scoring system developed to assess adherence to the 2015–2020 DGA. It is comprised of 13 key food (e.g., total fruit, whole fruit) or nutrient goals (e.g., sodium, added sugar, saturated fat). Four components are to be consumed in moderation and nine for adequacy. The score for each component ranges from zero to five or 10 points. Points are assigned based on the percent energy for that nutrient (e.g., added sugar, saturated fat), the amount of nutrient or food group per 1000 kcals (4184 kilojoules (kJ)) (e.g., mg sodium, cups total fruit) or a nutrient ratio (e.g., fatty acids). Moderation components are scored so that lower amounts receive higher scores. Scores for each component are summed to create a total score indicating overall adherence to the DGA [67]. The maximum score is 100 points indicating perfect adherence.
HEI-2015 total and component scores were calculated for Swank menus using the population ratio method [82]. The scoring system was applied to the ratio of the population’s mean food group (or nutrient) intake to the population’s mean energy intake. HEI-2015 scores for a seven-day 2000 kcal (8368 kJ) sample HEP menu were reported in the literature [71].
The AHEI was developed in 2002 [83,84] to create a score that would predict health outcomes more robustly than the HEI [85,86]. To assess the predictive value of the AHEI scores, it was compared to the HEI scores to determine the strength of risk for development of chronic diseases; however, the HEI was developed to assess adherence to the Food Guide Pyramid, the US dietary guidance that was current in 1992 [87], not to predict disease risk. The AHEI was based on dietary components identified by nutrition researchers as being associated with lower risk of some chronic diseases and was shown to provide stronger protective estimates of disease risk, especially cardiovascular disease, compared to the HEI [83,84]. The AHEI was revised in 2012 (AHEI-2010) after a review of the scientific literature and discussion with other researchers [68]. Lower AHEI-2010 scores have been associated with mortality (all-cause, cardiovascular and cancer) in a cohort of British men and women [88] and predicted inflammation (IL-6) in 126 overweight or obese African American females with osteoarthritis [89].
The AHEI-2010 consists of 11 components (food and nutrients) each scored from zero (worst) to ten (best) points. Six components are for adequacy and five for moderation. Similar to HEI-2015, components that are to be limited in the diet are reverse scored (i.e., higher intakes receive lower scores). Total AHEI-2010 score is calculated by summing scores for each component with total scores ranging from zero to 110 points (best). Scores were calculated using menu modeling data for 1800 kcal (7531 kJ) female and 2200 kcal (9205 kJ) male Swank and HEP diets. Minimum and maximum scores for the sodium component were to be assigned based on the dataset’s lowest and highest decile of sodium intake for males and females but the menu modeling did not provide a sodium distribution; therefore, sodium values for the 10th and 90th percentiles for 20+ year old males and females from the 2007-2008 NHANES were used instead [90,91].
Table S2 compares the HEI-2015 and AHEI-2010 components. Both scoring systems address vegetable, fruit, grain and fat consumption albeit in different ways. However, HEI-2015 considers dairy intake while the AHEI-2010 does not and AHEI-2010 considers alcohol consumption while HEI-2015 does not include it as a separate component. Unlike the HEI-2015 which assess all food and nutrients as % energy, per 1000 kcals or as a nutrient ratio, only two of the 11 AHEI-2010 components are assessed this way (polyunsaturated fatty acids, trans-fat); however, three components have sex-specific criteria for assigning minimum and maximum points which would take into consideration differences in number of servings or quantities of nutrients generally associated with greater food intake by adult males (whole grains, sodium, alcohol). A systematic review and meta-analysis of the HEI (HEI, HEI-2005, HEI-2010) and AHEI (AHEI, AHEI-2010) concluded that higher scores on both were associated with reduced risk of all-cause mortality, cardiovascular disease and cancer incidence or mortality, type 2 diabetes and neurodegenerative diseases and with cancer and all-cause mortality in cancer survivors [92].
AHEI-2010 scores for Swank and HEP were calculated using nutrient values from menu modeling. Amounts of fruit, vegetable and protein subgroups for HEP were based on data used to generate the food group nutrient profiles [72]; food subgroup servings for Swank were obtained from NDSR. One ounce-equivalent of whole grains was assumed to provide 16 g whole grain. Although alcohol is permitted on both diets in amounts that are within each diet’s guidelines, the model menus did not include alcoholic beverages.

2.5. Data Analysis

HEI-2015 and AHEI-2010 calculations and descriptive statistics were performed by the statistician using SAS 9.4 [93] and Microsoft Excel 2010 [94]. Food group servings and nutrients per 1000 kcals (4184 kJ) were computed from the average of all seven menu days. A radar graph which is recommended for displaying HEI-2015 component scores [67] was prepared to illustrate the dietary patterns. No hypothesis testing was conducted.

3. Results

3.1. Swank Menu Composition

Food group data in Table 2 are consistent with Swank diet guidelines, although amounts are on average slightly more than the minimum recommended servings of vegetables (2 cups), grains (4 servings) and dairy (2 cups) [37]. The oil quantity (oil and salad dressing) is on the low end of the range Swank recommended and is an amount suitable for sedentary individuals (Table 1) but this amount does not include fat from nuts and fatty fish which are also counted as part of the oil allotment on the Swank diet. Mean saturated fat content (Table 3) for 1719 kcal (7192 kJ) was about half the maximum 15 g allotted (range 5.8 g–11.0 g). The menus have a low to moderate glycemic index, one point above the cutoff for low glycemic [95].

3.2. Nutritional Adequacy

3.2.1. Swank Menus

The Swank MAR score was ≥94% for females and ≥97% for males 19 years and older, indicating nearly all the RDAs were met (Table 4). For females, vitamin D and E were below the RDA at all ages examined. Folate and calcium were less than the RDA for females 51–70 and >70 years likely due to the lower energy intake at these ages and greater calcium requirement. Iron was below the RDA for females 19–50 years due to the higher iron requirement for these ages. No nutrients were below the RDA for males 19–30 years, likely a result of the higher energy level. Shortfall nutrients were Vitamin E for males 31–50 and vitamins D and E for males 51–70 and >70 years.
Swank menus met the AI for the nutrients examined except the following: choline for females and males 31 years and older; potassium for females 19 years and older and males for ages 31 years and older. Dietary fiber was low for males 31–50 years, likely due to the reduced energy level at that age compared to 19–30 years. No nutrients were below the AI for males 19–30 years, likely due to the higher energy level.
Swank menus exceeded the sodium UL for women 19–50 years and men at all ages. Sodium levels were below the UL for females 51–70 and >70 years, likely due to the lower 1600 kcal (6694 kJ) energy level for these ages.
Menus were within the Acceptable Macronutrient Distribution (AMDR) [96] percentages for protein, fat and carbohydrate (Table 3) with total fat at the lower end of the range (20–35% energy). Menus provided <10% energy from added sugars and <10% energy from saturated fat [58] as recommended by the DGA and <7% energy from saturated fat recommended by the National Lipid Association for reducing serum cholesterol [97] and <5–6% energy recommended by the American Heart Association for individuals who need to reduce their low density lipoprotein cholesterol level [59]. Average saturated fat at all energy levels examined was ≤15.0 g (Table 4), the maximum amount recommended on the Swank diet, but menus would exceed 15.0 g at ≥ 3205 kcal (13410 kJ).

3.2.2. Swank Menus plus Dietary Supplements

Nutrient contribution of dietary supplements is shown in Supplementary Table S3. When the nutrients from supplements were added to the menus, vitamins D, E and folate plus calcium and iron met or exceeded the DRI. The following nutrients remained below the RDA/AI at various age/sex categories: dietary fiber, choline and potassium. Menus did not exceed any additional ULs when supplements were included.

3.2.3. Food Pattern Modeling

The Swank modeled menu macronutrient composition was slightly lower in fat and higher in carbohydrate than HEP (Table 5). Nutritional adequacy of the HEP and Swank model diets were similar with MAR scores ≥94% (Table 5). Nutrients below the RDA in the HEP were identical to Swank except for magnesium which was low in the male HEP but not Swank and dietary fiber which was low in the male Swank model diet but not the HEP. Swank and HEP modeled diets were low in choline and potassium for males and females 31–50 years.
Macronutrient composition of the modeled Swank diet (Table 5) was similar to the Swank menus (Table 3 and Table 4). Nutrients below the RDA for the Swank model diet were similar to the Swank menus except vitamin D was below the male RDA on the model diets (Table 5) but not the menus (Table 4). Swank model diet MAR scores were 1–2 percentage points lower than their menus. AI shortfall nutrients on the Swank model diet were identical to the menus. Sodium did not exceed the UL for the model diet as it did for the menus. The addition of Swank diet-prescribed dietary supplements would meet all RDAs and AIs except for dietary fiber (males), choline and potassium.

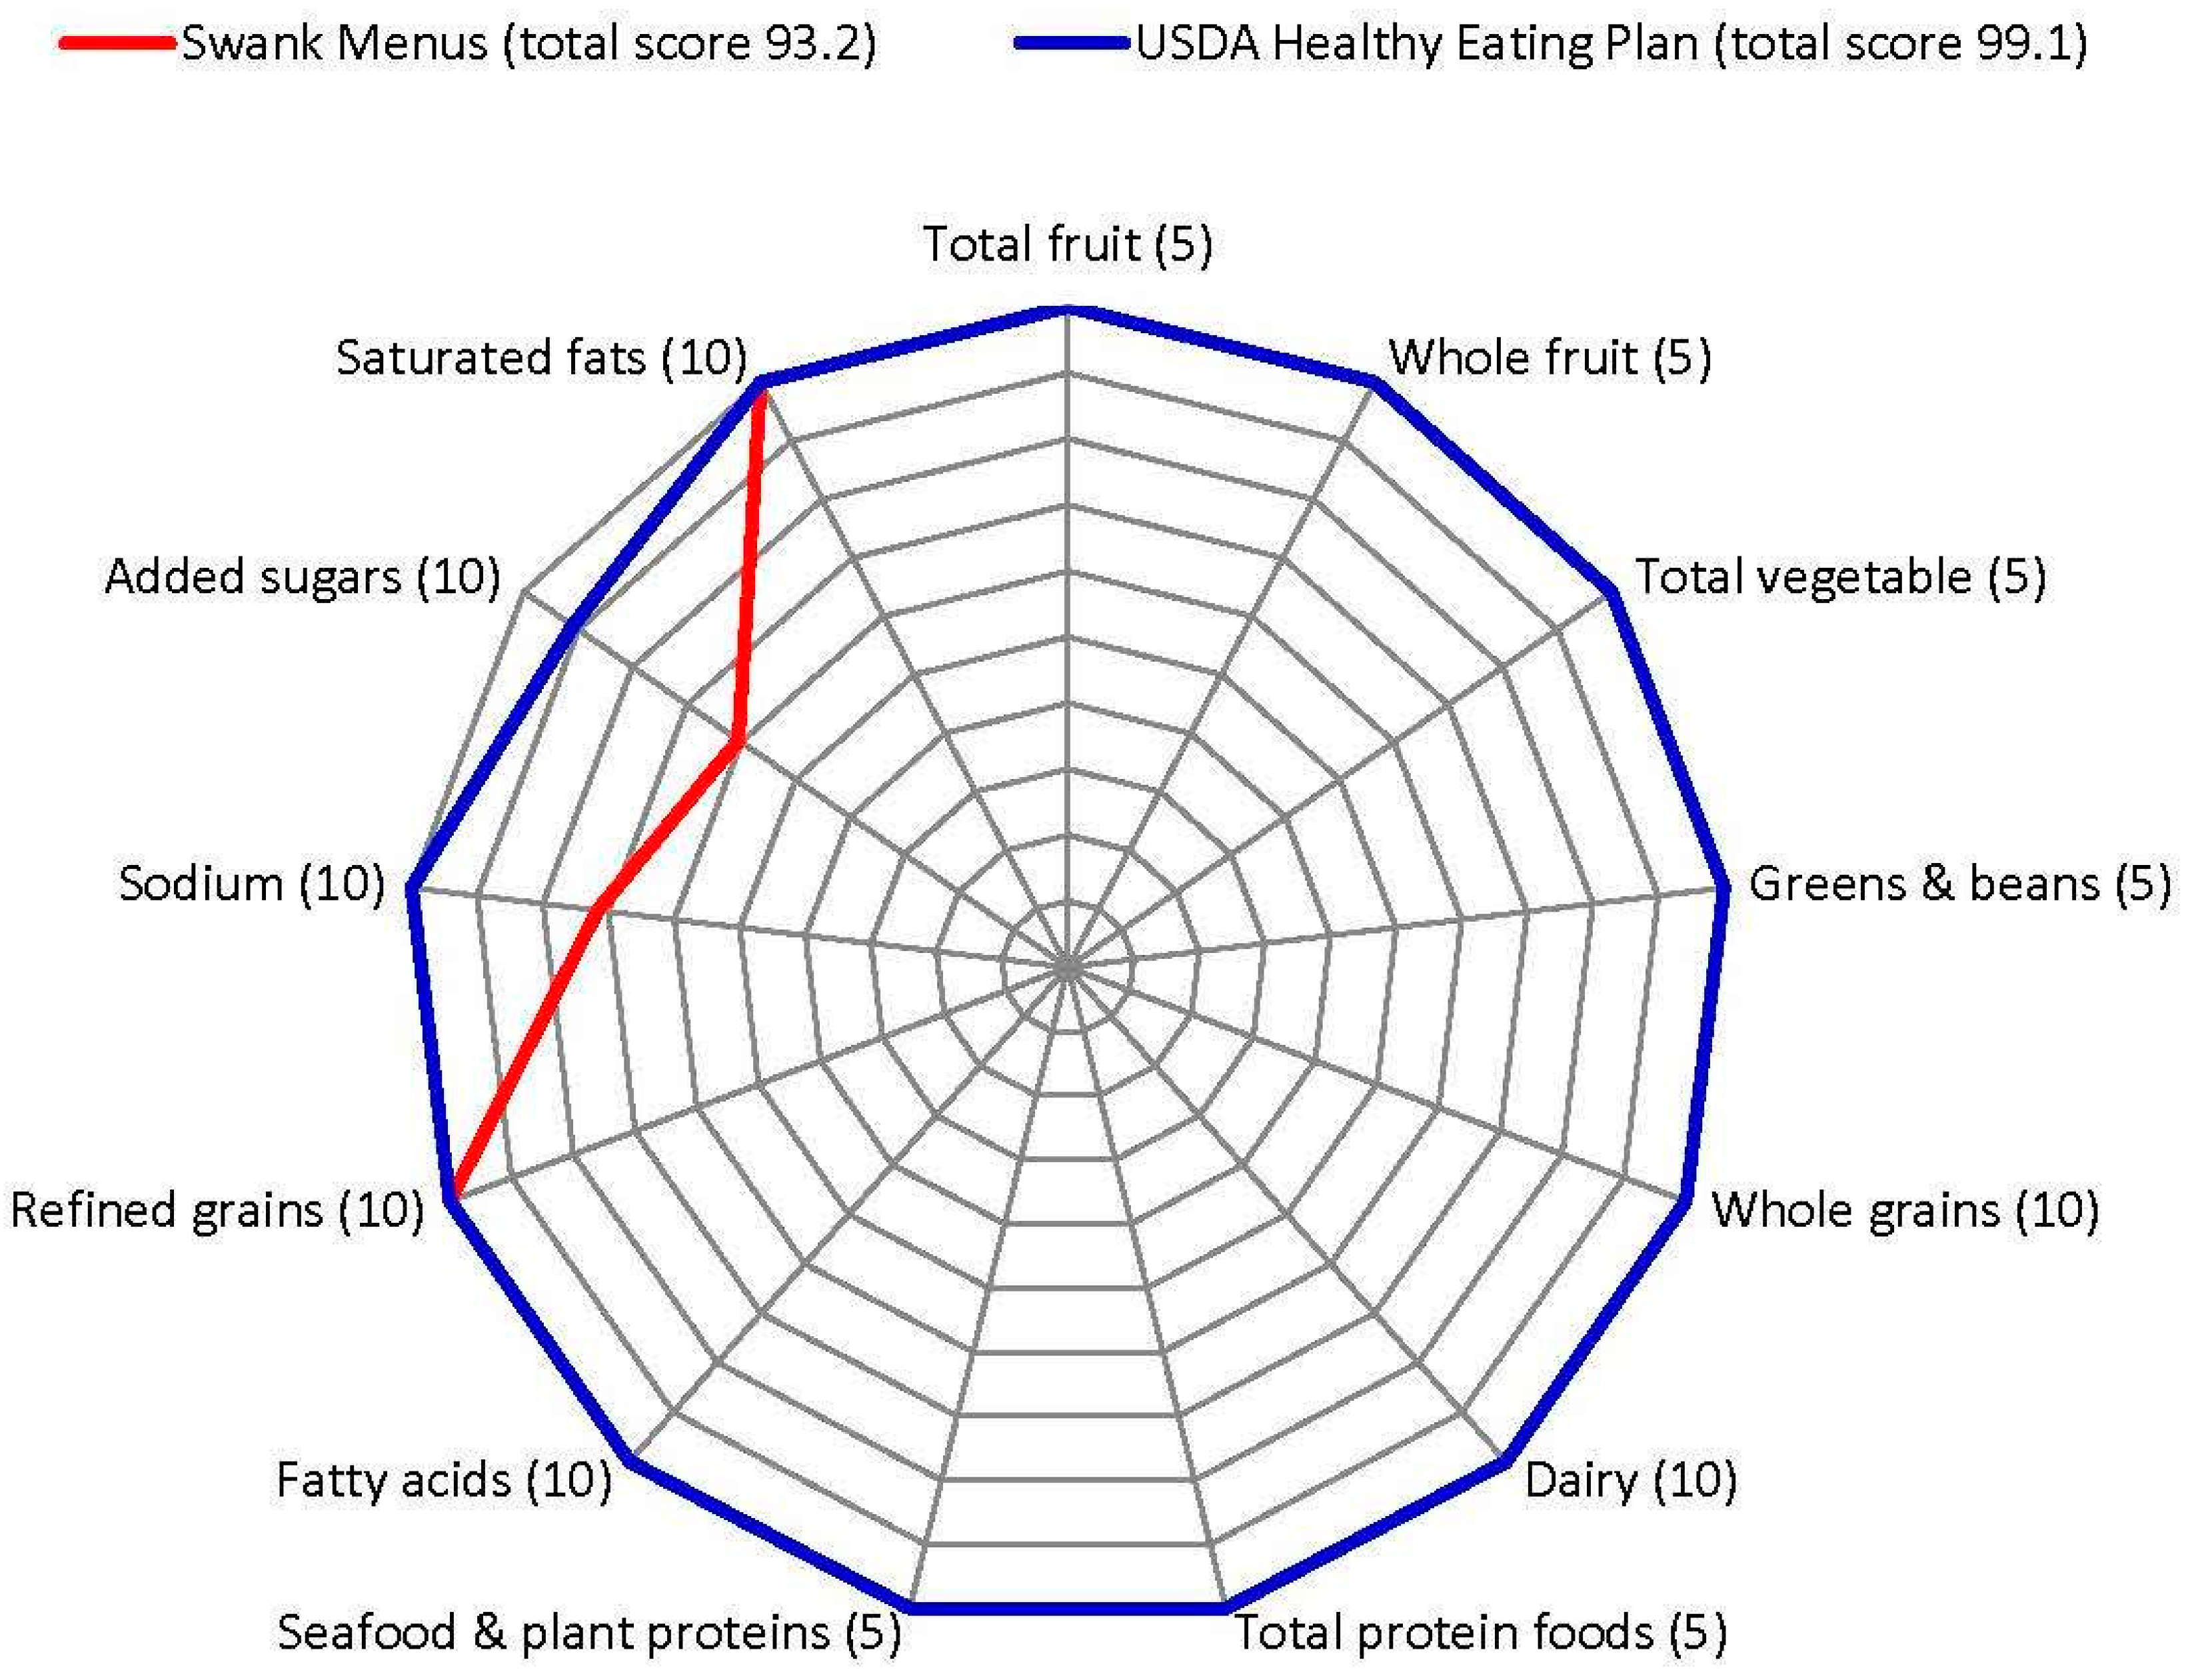
3.3. HEI-2015 and AHEI-2010

Swank and HEP menus received identical maximum scores for 11/13 HEI-2015 components (Figure 1). However, Swank menus underperformed the HEP for sodium (7.2 versus 10 points, respectively) and added sugars (6.1 versus 9.1 points, respectively). Swank total HEI-2015 score was 5.9 points lower than HEP.
AHEI-2010 scores for Swank 1800 kcal (7531 kJ) female and 2200 kcal (9205 kJ) male diets were 9.1 and 8.8 points higher than HEP, respectively (Table S4). The Swank diet scored higher than HEP for fruit, whole grains, red/processed meat and long chain omega-3 fatty acids (females only). HEP scored higher than Swank for vegetables. Swank and HEP scores for the remaining components differed by ≤1.0 points. The largest difference between Swank and HEP component scores was seen for red/processed meat (5.1 and 6.2 points for female and male, respectively); Swank received a perfect score for this component due to the elimination of red meat as a strategy to reduce saturated fat.

4. Discussion

4.1. Menu Composition

The Swank menus conformed to the HEP food group recommendations [69] except for differing vegetable and protein subgroup amounts (greater amounts of dark-green vegetables, fish and shellfish, and nuts and seeds, and smaller amounts of red/orange vegetables, beans and peas), fewer dairy servings and slightly more fruit. Nutrition experts generally agree that the inclusion of fruits and vegetables (F/V) are necessary for a healthy diet [98]. Increased vegetable intake has been associated with reduced risk of MS relapse [34] but the potential benefits and harms of grains, dairy and animal/fish protein and fat intake for pwMS are more controversial. An international study of 2087 pwMS found that a ‘healthy’ F/V and fat (e.g., fish, unsaturated oil) intake was associated with better physical and mental health and less disability with fat having the biggest impact. Higher physical and mental health scores were seen when meat or dairy were excluded from the diet but results were not conclusive; grain intake was not assessed [99]. In another study, pwMS consuming higher quality diets defined as high in F/V, whole grains and legumes and low in added sugar and red and processed meat, were associated with less disability and depression; higher intake of whole grains alone was also associated with less disability [100]. Participants in a multimodal healthy lifestyle intervention reported increases in physical and mental health one and three years after diet initiation compared to baseline; the intervention diet included fish, grains and F/V but not meat and dairy, was low in saturated fat (<20 g/day) and included dietary supplements [101]. A 12 month randomized trial investigating a vegetarian (no meat, fish, eggs, dairy or vegetable oils) low (14%) fat diet compared to a usual diet (~40% fat) found improvements in fatigue, weight and blood lipids but no change in disease activity [42].

4.2. Nutritional Adequacy

The Swank diet was expected to meet all nutrient requirements [56] but the menus and model diet were low in eight nutrients: vitamins D and E, choline and potassium for most age/sex groups, iron (females 19–50 years), folate (marginally, females ≥51 years), calcium (females ≥51 years) and dietary fiber (males 31–50 years). The low levels of vitamins E and folate were consistent with the low intake of two pwMS following the Swank diet reported in one study [39]. Diet-prescribed supplementation with vitamin C (Table 1) is not needed to meet the RDA but the cod liver oil, multivitamin/mineral and vitamin E supplements would meet all diet shortfalls except for choline, potassium and dietary fiber. Choline is a phospholipid precursor and required for generation of cell membranes and myelin [102,103,104]. It is also involved in the synthesis of acetylcholine, a neurotransmitter [105]. Choline has been identified as a key nutrient which if in insufficient supply would increase the risk of accelerated aging and neurodegeneration [106,107]. Eggs are a top choline source, but only limited amounts can be consumed on the Swank diet due to their high saturated fat content. Additional choline sources include chicken liver, beans/peas, dark-green vegetables or soy products [79] as well as meat, fish, poultry, dairy and peanuts [108]. Potassium is a nutrient of public health concern [58] so individuals following this diet may be advised to select foods high in this nutrient, such as sources in the DGA Appendix 10 [58]. Potassium is important in MS because it may block the potentially adverse effects of sodium [109,110,111].
The dietary fiber intake based on the Swank menus and model diet was slightly lower than HEP and did not meet the AI for males 31–50 years. There is increased recognition that microbes in the gut influence immune cell function in MS and that diet, especially fiber, impacts the gut microbiome [112,113,114]. As specific foodstuffs are digested, the gut microbiome will create metabolites which may be absorbed into the blood stream and favorably impact both systemic and central nervous system (CNS) inflammation [115,116]. Studies are needed to identify the impact of dietary components on gut microbiome and MS clinical course. One trial [61,62] is evaluating changes in gut microbiome, fatigue and quality of life among pwMS randomized to the Swank diet. In addition, dietary fiber is a nutrient of public health concern [58] so ensuring adequate intake is advised.
The Swank diet recommends sufficient energy to achieve and maintain a healthy body weight. Menus used in this report were adjusted to provide appropriate energy levels for sedentary individuals. Swank reported individuals following his diet lost weight because of low energy intake [15] and then stabilized at 5–10% below normal average weight [13]. The energy density of foods and energy-providing beverages on the Swank menus (1.0 kcal/g, 4.2 kJ/g) was lower than the average US diet (1.52 kcal/g, 6.36 kJ/g) [117] which might produce weight loss [118,119]. Increased body mass index (BMI) is a possible risk factor for MS [120] and has been associated with reduced quality of life [121] and increased disability and risk of relapse [122]. Any weight reduction associated with the Swank diet could be beneficial for overweight and obese pwMS but may be contraindicated for individuals with underweight BMI who may be at risk for malnutrition [123]. To assist pwMS who are following the Swank diet in adjusting their energy intake to maintain, lose or gain weight as clinically appropriate, additional guidance on the number of food group servings at various energy levels is needed.
Hyperlipidemia and hypertension are two common comorbidities in pwMS [124]. Swank menu fat composition is consistent with dietary recommendations to reduce saturated fat and increase unsaturated fat [59,97], however, the level and types of unsaturated fat will vary with the quantity and types of oil consumed within the Swank diet guidelines. The DGA recommend the reduction of dietary sodium to < 2300 mg based on data associating increased sodium intake with higher blood pressure [58]. Sodium level of the menus but not the modeled diet exceeded the UL. Modeled diets were lower in sodium because foods without added sodium were used to develop food group nutrient profiles. Top sodium sources on the Swank menus were salt, whole grains, condiments (e.g., mustard, soy sauce, relish) and milk. Reduction in use of added salt and selection of lower sodium condiments could reduce the sodium level of the menus. The Swank diet is also generally consistent with the Dietary Approaches to Stop Hypertension (DASH) guidelines that encourage fruits, vegetables, whole grains, low fat dairy products and sodium < 2300 mg [125].

4.3. HEI-2015 and AHEI-2010

Swank menus achieved a high HEI-2015 score of 93.2/100 which is considered a “good” [126] or “A” [67] diet that adheres closely to the DGA. The score is similar to the 87.8–100 scores of exemplary menus used to validate the HEI-2015 [71]. Compared to scores for the US population collected during NHANES 2011–2012 [71], Swank and HEP ranked at the 99th percentile, indicating the menus adhered more closely to the DGA than diets of all but 1% of Americans.
The developers of the AHEI-2010 did not establish cut points to identify “healthy” or “good” diets. However, Swank and HEP diets earned AHEI-2010 scores that fell within the 5th (healthiest) quintile reported by the developers of the AHEI-2010 (AHEI-2010 score > 57.8, median 62.7, for females and > 62.3, median 67.6, for males) [68]. Swank and HEP scores also compared favorably to the AHEI-2010 scores for the third (healthiest) tertile (median, range 64, 59–89) from a study of 7627 British men and women that found associations between lower AHEI-2010 scores and all cause, cardiovascular and cancer mortality [88].
The AHEI-2010 is designed to predict future chronic disease based on current diets of healthy adults. Since pwMS have already been diagnosed with a chronic disease, they be may be taking MS or other medications or have changed their diet. These potential therapeutic changes could affect the predictive ability of AHEI-2010 recommendations in this population. Lower (or worse) AHEI-2010 scores may not be predictive of future chronic disease because current medical advice, medications and diet change could conflict with the recommended quantities for scoring the AHEI-2010 diet.

4.4. Limitations

Swank provided only one set of seven-day menus so nutrient amounts were factored to create menus at energy levels appropriate for different adult sex/age groups. These created menus produced uniform differences in nutrient composition, likely a minor limitation. Only one set of menus was assessed so nutrient composition could vary depending on foods selected; however, the modeled diet showed similar nutritional adequacy as menus except for vitamin D which was low on the male model diet but not the menus. Nutritional adequacy of the menus was not assessed for children and pregnant or lactating women. Foods selected by free-living individuals attempting to follow the Swank diet will differ from the menus and may also deviate from the diet guidelines possibly resulting in lower nutritional adequacy. Thus, studies investigating the nutritional adequacy of foods selected by pwMS who are following the Swank diet are warranted. Given the limitations of the study conducted by Swank, randomized controlled studies are needed to investigate the impact of this diet on MS disease course. The clinical trial comparing the effect of the Swank and modified Paleolithic diets [61,62] on fatigue and quality of life will begin to answer some of these questions.

5. Conclusions

The Swank diet is one among several dietary regimens promoted for pwMS that are currently under investigation. Swank menus had similar levels of nutritional adequacy for 17 vitamins and minerals as the HEP and had similar high adherence to the DGA. AHEI-2010 scores for Swank and HEP modeled diets for males and females 31-50 years were similar. Swank diet-prescribed supplementation with vitamin E, cod liver oil and a multivitamin/mineral corrected shortfalls in vitamins D and E, folate, calcium and iron but not dietary fiber (males 31–50 years), potassium or choline. Careful selection of foods may be required to meet dietary fiber, potassium and choline requirements and keep sodium intake below the UL. Additional research is needed to assess how well pwMS adhere to this diet pattern, examine the nutritional adequacy of their food selections, and determine impact of the diet on MS disease course.

Supplementary Materials

The following are available online at https://www.mdpi.com/2072-6643/11/3/616/s1, Table S1. Food descriptions and amounts used to calculate the nutrient composition of the seven-day low saturated fat Swank menus. Table S2. Healthy Eating Index-2015 (HEI-2015) and Alternate Healthy Eating Index-2010 (AHEI-2010) components. Table S3. Nutrient composition of dietary supplements prescribed for low saturated fat Swank diet. Table S4. Alternate Healthy Eating Index-2010 (AHEI-2010) component and total score for 1800 kcal (7531 kJ) female and 2200 kcal (9205 kJ) male Swank low saturated fat and Healthy US-Style Pattern (HEP) diets.

Author Contributions

Conceptualization, T.L.W.; Methodology and Investigation, C.A.C.; Statistical Analysis, L.M.R..; Writing—Original Draft Preparation, C.A.C.; Writing—Review & Editing, T.L.W., L.M.R., L.G.S., C.A.C.; Funding Acquisition, T.L.W. All authors read and approved the final manuscript.

Funding

This research received no external funding.

Acknowledgments

This study and open access publication were funded by private donations to the University of Iowa Foundation for the Terry Wahls Research Fund. The authors thank the donors for their generous support. They also thank Tatiana Delima, BA for assisting with Swank menu data entry.

Conflicts of Interest

T.L.W. strongly advocates for a modified Paleolithic style diet in academic and business settings and follows variations of the Wahls Elimination diet and the various diet plans described in the Wahls Protocol® books and programs. She has copyrights for The Wahls Protocol Cooking for Life, The Wahls Protocol and Minding My Mitochondria, 2nd Edition and trademarked Wahls™ Diet, Wahls Paleo™ Diet and Wahls Paleo Plus™ Diet. She has not trademarked Wahls Elimination Diet. T.L.W. has financial relationships with BioCeuticals; Genova Diagnostics; Institute for Health and Healing; Integrative Medicine for Mental Health; MCG Health Inc.; NCURA; Penguin Random House Inc.; Suttler Pacific and an equity interest in Terry Wahls, LLC; TZ Press, LLC; The Wahls Institute, PLC; and www.terrywahls.com. T.L.W. received funding from the National Multiple Sclerosis Society to conduct a randomized clinical trial comparing the effect of the Wahls Elimination and Swank diets on multiple sclerosis-related fatigue. The University of Iowa prepared a conflict of interest management plan for this clinical trial that T.L.W. follows to mitigate conflicts of interest. L.M.R. was assigned to independently review the clinical trial data collection, analysis and study results as part of T.L.W.’s conflict of interest management plan. L.M.R. has been a paid statistical consultant for T.L.W. since 2013; she does not follow a special diet. L.G.S. is a co-investigator on the clinical trial comparing Swank and Wahls Elimination diets and reports no other conflicts of interest; she does not follow a special diet. C.A.C. has been employed by T.L.W. since 2013, was paid to calculate the nutrient composition of the menus in The Wahls Protocol and was paid for the preparation of this manuscript; she does not follow any special diet. The funding sponsors had no role in the design of the study; in the collection, analyses or interpretation of data; in the writing of the manuscript and in the decision to publish the results.

References

  1. Compston, A.; Coles, A. Multiple sclerosis. Lancet 2008, 372, 1502–1517. [Google Scholar] [CrossRef]
  2. Capriotti, T.; Noel, J.; Brissenden, S. Multiple Sclerosis: An Update for Home Healthcare Clinicians. Home Healthc. Now 2018, 36, 169–180. [Google Scholar] [CrossRef] [PubMed]
  3. Ganesh, A.; Stahnisch, F.W. A history of multiple sclerosis investigations in Canada between 1850 and 1950. Can. J. Neurol. Sci. 2014, 41, 320–332. [Google Scholar] [CrossRef] [PubMed]
  4. Murray, T.J. The history of multiple sclerosis: The changing frame of the disease over the centuries. J. Neurol. Sci. 2009, 277 (Suppl. 1), S3–S8. [Google Scholar] [CrossRef]
  5. Talley, C.L. The emergence of multiple sclerosis, 1870–1950: A puzzle of historical epidemiology. Perspect. Biol. Med. 2005, 48, 383–395. [Google Scholar] [CrossRef] [PubMed]
  6. Bourdette, D. Roy Laver Swank, MD, PhD (1909–2008). Neurology 2009, 72, 1120. [Google Scholar] [CrossRef]
  7. Swank, R.L. Multiple sclerosis; A correlation of its incidence with dietary fat. Am. J. Med. Sci. 1950, 220, 421–430. [Google Scholar] [CrossRef] [PubMed]
  8. Swank, R.L.; Lerstad, O.; Strom, A.; Backer, J. Multiple sclerosis in rural Norway its geographic and occupational incidence in relation to nutrition. N. Engl. J. Med. 1952, 246, 722–728. [Google Scholar] [CrossRef]
  9. Swank, R.L.; Goodwin, J. Review of MS patient survival on a Swank low saturated fat diet. Nutrition 2003, 19, 161–162. [Google Scholar] [CrossRef]
  10. Swank, R.L. Treatment of multiple sclerosis with low-fat diet. AMA Arch. Neurol. Psychiatry 1953, 69, 91–103. [Google Scholar] [CrossRef]
  11. Swank, R.L. Treatment of multiple sclerosis with low-fat diet; results of five and one-half years’ experience. AMA Arch. Neurol. Psychiatry 1955, 73, 631–644. [Google Scholar] [CrossRef]
  12. Swank, R.L. Treatment of multiple sclerosis with low-fat diet: Result of seven years’ experience. Ann. Intern. Med. 1956, 45, 812–824. [Google Scholar] [PubMed]
  13. Swank, R.L. Treatment of multiple sclerosis with a low-fat diet. J. Am. Diet. Assoc. 1960, 36, 322–325. [Google Scholar]
  14. Swank, R.L.; Bourdillon, R.B. Multiple sclerosis: Assessment of treatment with a modified low-fat diet. J. Nerv. Ment. Dis. 1960, 131, 468–488. [Google Scholar] [CrossRef]
  15. Swank, R.L. Multiple sclerosis: Twenty years on low fat diet. Arch. Neurol. 1970, 23, 460–474. [Google Scholar] [CrossRef]
  16. Swank, R.L.; Grimsgaard, A. Multiple sclerosis: The lipid relationship. Am. J. Clin. Nutr. 1988, 48, 1387–1393. [Google Scholar] [CrossRef]
  17. Swank, R.L.; Dugan, B.B. Effect of low satured fat diet in early and late cases of multiple sclerosis. Lancet 1990, 336, 37–39. [Google Scholar] [CrossRef]
  18. Swank, R.L. Multiple sclerosis: Fat-oil relationship. Nutrition 1991, 7, 368–376. [Google Scholar]
  19. Swank, R.L.; Goodwin, J.W. How saturated fats may be a causative factor in multiple sclerosis and other diseases. Nutrition 2003, 19, 478. [Google Scholar] [CrossRef]
  20. [Editorial]. Lipids and multiple sclerosis. Lancet 1990, 336, 25–26. [Google Scholar] [CrossRef]
  21. Ben-Shlomo, Y.; Smith, G.D.; Marmot, M.G. Dietary fat in the epidemiology of multiple sclerosis: Has the situation been adequately assessed? Neuroepidemiology 1992, 11, 214–225. [Google Scholar] [CrossRef] [PubMed]
  22. Wahls, T.L.; Chenard, C.A.; Snetselaar, L.G. Review of Two Popular Eating Plans within the Multiple Sclerosis Community: Low Saturated Fat and Modified Paleolithic. Nutrients 2019, 11, 352. [Google Scholar] [CrossRef]
  23. Wilmot, V.A.; Swank, R.L. The influence of low-fat diet on blood lipid levels in health and in multiple sclerosis. Am. J. Med. Sci. 1952, 223, 25–34. [Google Scholar] [CrossRef] [PubMed]
  24. Swank, R.L.; Grimsgaard, A. Changes in blood produced by a fat meal and by intravenous heparin. Am. J. Physiol. 1951, 164, 798–811. [Google Scholar] [CrossRef] [PubMed]
  25. Swank, R.L.; Franklin, A.E.; Quastel, J.H. Effects of fat meals and heparin on blood plasma composition as shown by paper chromatography. Proc. Soc. Exp. Biol. Med. 1950, 75, 850–854. [Google Scholar] [CrossRef] [PubMed]
  26. Swank, R.L.; Franklin, A.E.; Quastel, J.H. Paper chromatography of blood plasmas in multiple sclerosis. Proc. Soc. Exp. Biol. Med. 1951, 76, 183–189. [Google Scholar] [CrossRef] [PubMed]
  27. Swank, R.L.; Wilmot, V. Chylomicra: their composition and their fate after intravenous injection of small amounts of heparin. Am. J. Physiol. 1951, 167, 403–412. [Google Scholar] [CrossRef]
  28. Ganesh, A.; Stahnisch, F.W. On the historical succession of vessel-based therapies in the treatment of multiple sclerosis. Eur. Neurol. 2013, 70, 48–58. [Google Scholar] [CrossRef]
  29. Corthals, A.P. Multiple sclerosis is not a disease of the immune system. Q. Rev. Biol. 2011, 86, 287–321. [Google Scholar] [CrossRef]
  30. Zhornitsky, S.; McKay, K.A.; Metz, L.M.; Teunissen, C.E.; Rangachari, M. Cholesterol and markers of cholesterol turnover in multiple sclerosis: Relationship with disease outcomes. Mult. Scler. Relat. Disord. 2016, 5, 53–65. [Google Scholar] [CrossRef]
  31. Tettey, P.; Simpson, S., Jr.; Taylor, B.; Blizzard, L.; Ponsonby, A.L.; Dwyer, T.; Kostner, K.; van der Mei, I. An adverse lipid profile is associated with disability and progression in disability, in people with MS. Mult. Scler. 2014, 20, 1737–1744. [Google Scholar] [CrossRef]
  32. Weinstock-Guttman, B.; Zivadinov, R.; Mahfooz, N.; Carl, E.; Drake, A.; Schneider, J.; Teter, B.; Hussein, S.; Mehta, B.; Weiskopf, M.; et al. Serum lipid profiles are associated with disability and MRI outcomes in multiple sclerosis. J. Neuroinflamm. 2011, 8, 127. [Google Scholar] [CrossRef] [PubMed]
  33. Tettey, P.; Simpson, S., Jr.; Taylor, B.; Blizzard, L.; Ponsonby, A.L.; Dwyer, T.; Kostner, K.; van der Mei, I. Adverse lipid profile is not associated with relapse risk in MS: Results from an observational cohort study. J. Neurol. Sci. 2014, 340, 230–232. [Google Scholar] [CrossRef] [PubMed]
  34. Azary, S.; Schreiner, T.; Graves, J.; Waldman, A.; Belman, A.; Guttman, B.W.; Aaen, G.; Tillema, J.M.; Mar, S.; Hart, J.; et al. Contribution of dietary intake to relapse rate in early paediatric multiple sclerosis. J. Neurol. Neurosurg. Psychiatry 2018, 89, 28–33. [Google Scholar] [CrossRef] [PubMed]
  35. Fitzgerald, K. Diet and disease modification in multiple sclerosis: A nutritional epidemiology perspective. J. Neurol. Neurosurg. Psychiatry 2018, 89, 3. [Google Scholar] [CrossRef]
  36. Swank, R.L.; Dugan, B.B. The Multiple Sclerosis Diet Book. A Low-Fat Diet for the Treatment of MS; Doubleday: New York, NY, USA, 1987. [Google Scholar]
  37. Swank MS Foundation. The Swank Low-Fat Diet for the Treatment of MS. Available online: http://www.swankmsdiet.org/the-diet/ (accessed on 17 October 2017).
  38. Nayak, S.; Matheis, R.J.; Schoenberger, N.E.; Shiflett, S.C. Use of unconventional therapies by individuals with multiple sclerosis. Clin. Rehabil. 2003, 17, 181–191. [Google Scholar] [CrossRef]
  39. Masullo, L.; Papas, M.A.; Cotugna, N.; Baker, S.; Mahoney, L.; Trabulsi, J. Complementary and alternative medicine use and nutrient intake among individuals with multiple sclerosis in the United States. J. Community Health 2015, 40, 153–160. [Google Scholar] [CrossRef]
  40. Leong, E.M.; Semple, S.J.; Angley, M.; Siebert, W.; Petkov, J.; McKinnon, R.A. Complementary and alternative medicines and dietary interventions in multiple sclerosis: What is being used in South Australia and why? Complement. Ther. Med. 2009, 17, 216–223. [Google Scholar] [CrossRef]
  41. Fitzgerald, K.C.; Tyry, T.; Salter, A.; Cofield, S.S.; Cutter, G.; Fox, R.J.; Marrie, R.A. A survey of dietary characteristics in a large population of people with multiple sclerosis. Mult. Scler. Relat. Disord. 2018, 22, 12–18. [Google Scholar] [CrossRef]
  42. Yadav, V.; Marracci, G.; Kim, E.; Spain, R.; Cameron, M.; Overs, S.; Riddehough, A.; Li, D.K.B.; McDougall, J.; Lovera, J.; et al. Low-fat, plant-based diet in multiple sclerosis: A randomized controlled trial. Mult. Scler. Relat. Disord. 2016, 9, 80–90. [Google Scholar] [CrossRef]
  43. Sedaghat, F.; Jessri, M.; Behrooz, M.; Mirghotbi, M.; Rashidkhani, B. Mediterranean diet adherence and risk of multiple sclerosis: A case-control study. Asia Pac. J. Clin. Nutr. 2016, 25, 377–384. [Google Scholar]
  44. Katz Sand, I. The Role of Diet in Multiple Sclerosis: Mechanistic Connections and Current Evidence. Curr. Nutr. Rep. 2018, 7, 150–160. [Google Scholar] [CrossRef]
  45. Storoni, M.; Plant, G.T. The Therapeutic Potential of the Ketogenic Diet in Treating Progressive Multiple Sclerosis. Mult. Scler. Int. 2015, 2015, 681289. [Google Scholar] [CrossRef]
  46. Fitzgerald, K.C.; Vizthum, D.; Henry-Barron, B.; Schweitzer, A.; Cassard, S.D.; Kossoff, E.; Hartman, A.L.; Kapogiannis, D.; Sullivan, P.; Baer, D.J.; et al. Effect of intermittent vs. daily calorie restriction on changes in weight and patient-reported outcomes in people with multiple sclerosis. Mult. Scler. Relat. Disord. 2018, 23, 33–39. [Google Scholar] [CrossRef]
  47. Cignarella, F.; Cantoni, C.; Ghezzi, L.; Salter, A.; Dorsett, Y.; Chen, L.; Phillips, D.; Weinstock, G.M.; Fontana, L.; Cross, A.H.; et al. Intermittent Fasting Confers Protection in CNS Autoimmunity by Altering the Gut Microbiota. Cell Metab. 2018, 27, 1222–1235. [Google Scholar] [CrossRef]
  48. Saadatnia, M.; Etemadifar, M.; Fatehi, F.; Ashtari, F.; Shaygannejad, V.; Chitsaz, A.; Maghzi, A.H. Short-term effects of prolonged fasting on multiple sclerosis. Eur. Neurol. 2009, 61, 230. [Google Scholar] [CrossRef]
  49. Bisht, B.; Darling, W.G.; Grossmann, R.E.; Shivapour, E.T.; Lutgendorf, S.K.; Snetselaar, L.G.; Hall, M.J.; Zimmerman, M.B.; Wahls, T.L. A multimodal intervention for patients with secondary progressive multiple sclerosis: Feasibility and effect on fatigue. J. Altern. Complement. Med. 2014, 20, 347–355. [Google Scholar] [CrossRef]
  50. Bisht, B.; Darling, W.G.; Shivapour, E.T.; Lutgendorf, S.K.; Snetselaar, L.G.; Chenard, C.A.; Wahls, T.L. Multimodal intervention improves fatigue and quality of life in subjects with progressive multiple sclerosis: A pilot study. Degener. Neurol. Neuromuscul. Dis. 2015, 5, 19–35. [Google Scholar]
  51. Irish, A.K.; Erickson, C.M.; Wahls, T.L.; Snetselaar, L.G.; Darling, W.G. Randomized control trial evaluation of a modified Paleolithic dietary intervention in the treatment of relapsing-remitting multiple sclerosis: A pilot study. Degener. Neurol. Neuromuscul. Dis. 2017, 7, 1–18. [Google Scholar] [CrossRef]
  52. Lee, J.E.; Bisht, B.; Hall, M.J.; Rubenstein, L.M.; Louison, R.; Klein, D.T.; Wahls, T.L. A Multimodal, Nonpharmacologic Intervention Improves Mood and Cognitive Function in People with Multiple Sclerosis. J. Am. Coll. Nutr. 2017, 36, 150–168. [Google Scholar] [CrossRef]
  53. Bisht, B.; Darling, W.G.; White, E.C.; White, K.A.; Shivapour, E.T.; Zimmerman, M.B.; Wahls, T.L. Effects of a multimodal intervention on gait and balance of subjects with progressive multiple sclerosis: A prospective longitudinal pilot study. Degener. Neurol. Neuromuscul. Dis. 2017, 7, 79–93. [Google Scholar] [CrossRef]
  54. Farinotti, M.; Vacchi, L.; Simi, S.; Di Pietrantonj, C.; Brait, L.; Filippini, G. Dietary interventions for multiple sclerosis. Cochrane Database Syst. Rev. 2012, 12, Cd004192. [Google Scholar] [CrossRef]
  55. Venasse, M.; Edwards, T.; Pilutti, L.A. Exploring Wellness Interventions in Progressive Multiple Sclerosis: An Evidence-Based Review. Curr. Treat. Options Neurol. 2018, 20, 13. [Google Scholar] [CrossRef]
  56. Bhargava, P. Diet and Multiple Sclerosis. Available online: http://www.nationalmssociety.org/NationalMSSociety/media/MSNationalFiles/Documents/Diet-and-Multiple-Sclerosis-Bhargava-06-26-15.pdf (accessed on 25 June 2015).
  57. Diet & Nutrition. Available online: https://www.nationalmssociety.org/Living-Well-With-MS/Diet-Exercise-Healthy-Behaviors/Diet-Nutrition#section-0 (accessed on 16 October 2017).
  58. U.S. Department of Health and Human Services and U.S. Department of Agriculture. 2015–2020 Dietary Guidelines for Americans; Skyhorse Publishing Inc.: Washington, DC, USA, 2015.
  59. Eckel, R.H.; Jakicic, J.M.; Ard, J.D.; de Jesus, J.M.; Miller, N.H.; Hubbard, V.S.; Lee, I.M.; Lichtenstein, A.H.; Loria, C.M.; Millen, B.E.; et al. 2013 AHA/ACC Guideline on Lifestyle Management to Reduce Cardiovascular Risk. Circulation 2014, 129, S76–S99. [Google Scholar] [CrossRef]
  60. Kushi, L.H.; Doyle, C.; McCullough, M.; Rock, C.L.; Demark-Wahnefried, W.; Bandera, E.V.; Gapstur, S.; Patel, A.V.; Andrews, K.; Gansler, T. American Cancer Society Guidelines on nutrition and physical activity for cancer prevention: Reducing the risk of cancer with healthy food choices and physical activity. CA Cancer J. Clin. 2012, 62, 30–67. [Google Scholar] [CrossRef]
  61. Wahls, T.; Scott, M.O.; Alshare, Z.; Rubenstein, L.; Darling, W.; Carr, L.; Smith, K.; Chenard, C.A.; LaRocca, N.; Snetselaar, L. Dietary approaches to treat MS-related fatigue: Comparing the modified Paleolithic (Wahls Elimination) and low saturated fat (Swank) diets on perceived fatigue in persons with relapsing-remitting multiple sclerosis: Study protocol for a randomized controlled trial. Trials 2018, 19, 309. [Google Scholar]
  62. Wahls, T.L. Dietary Approaches to Treat Multiple Sclerosis-Related Fatigue Study. Available online: https://clinicaltrials.gov/ct2/show/NCT02914964 (accessed on 15 June 2018).
  63. Lichtenstein, A.H.; Van Horn, L. Very Low Fat Diets. Circulation 1998, 98, 935–939. [Google Scholar] [CrossRef]
  64. Mueller-Cunningham, W.M.; Quintana, R.; Kasim-Karakas, S.E. An ad libitum, very low-fat diet results in weight loss and changes in nutrient intakes in postmenopausal women. J. Am. Diet. Assoc. 2003, 103, 1600–1606. [Google Scholar] [CrossRef]
  65. Institute of Medicine. Dietary Reference Intakes: EAR, RDA, AI, Acceptable Macronutrient Distribution Ranges, and UL. Available online: http://www.nationalacademies.org/hmd/~/media/Files/Activity%20Files/Nutrition/DRI-Tables/5Summary%20TableTables%2014.pdf?la=en (accessed on 16 June 2018).
  66. Institute of Medicine. Dietary Reference Intakes: Applications in Dietary Planning; The National Academies Press: Washington, DC, USA, 2003. [Google Scholar]
  67. Krebs-Smith, S.M.; Pannucci, T.E.; Subar, A.F.; Kirkpatrick, S.I.; Lerman, J.L.; Tooze, J.A.; Wilson, M.M.; Reedy, J. Update of the Healthy Eating Index: HEI-2015. J. Acad. Nutr. Diet. 2018, 118, 1591–1602. [Google Scholar] [CrossRef]
  68. Chiuve, S.E.; Fung, T.T.; Rimm, E.B.; Hu, F.B.; McCullough, M.L.; Wang, M.; Stampfer, M.J.; Willett, W.C. Alternative dietary indices both strongly predict risk of chronic disease. J. Nutr. 2012, 142, 1009–1018. [Google Scholar] [CrossRef]
  69. Center for Nutrition Policy and Promotion. Healthy US-Style Pattern: Recommended Intake Amounts. Available online: https://www.cnpp.usda.gov/sites/default/files/usda_food_patterns/HealthyUS-StylePattern-RecommendedIntakeAmounts.pdf (accessed on 19 September 2017).
  70. U.S. Department of Health and Human Services and U.S. Department of Agriculture. Nutrients in Healthy US-Style Food Pattern: Nutrients in the Pattern at Each Calorie Level and Comparison of Nutrient Content to the Nutritional Goals for That Pattern. Available online: https://www.cnpp.usda.gov/sites/default/files/usda_food_patterns/NutrientsInHealthyUS-StyleFoodPattern.pdf (accessed on 22 September 2017).
  71. Reedy, J.; Lerman, J.L.; Krebs-Smith, S.M.; Kirkpatrick, S.I.; Pannucci, T.E.; Wilson, M.M.; Subar, A.F.; Kahle, L.L.; Tooze, J.A. Evaluation of the Healthy Eating Index-2015. J. Acad. Nutr. Diet. 2018, 118, 1622–1633. [Google Scholar] [CrossRef]
  72. U.S. Department of Agriculture, ARS Item Clusters, Percent of Consumption, and Representative Foods for USDA Food Pattern Food Groups and Subgroups. Available online: https://www.cnpp.usda.gov/sites/default/files/usda_food_patterns/ItemClustersPercentOfConsumptionAndRepresentativeFoodsCorrected5-16-17.pdf (accessed on 22 September 2017).
  73. Nutrition Coordinating Center (NCC). Nutrition Data System for Research (NDSR) Software; University of Minnesota: Minneapolis, MN, USA, 2017. [Google Scholar]
  74. Bowman, S.A.; Clemens, J.C.; Shimizu, M.; Friday, J.E.; Alanna, J.; Moshfegh, A.J. Food Patterns Equivalents Database 2015–2016: Methodology and User Guide. Available online: https://www.ars.usda.gov/ARSUserFiles/80400530/pdf/fped/FPED_1516.pdf (accessed on 27 September 2018).
  75. Murphy, S.P. Using DRIs as the basis for dietary guidelines. Asia Pac. J. Clin. Nutr. 2008, 17 (Suppl. 1), 52–54. [Google Scholar]
  76. U.S. Department of Health and Human Services and U.S. Department of Agriculture. Estimated Calorie Needs per Day—Energy Levels Used for Assignment of Individuals to USDA Food Patterns. Available online: https://www.cnpp.usda.gov/sites/default/files/usda_food_patterns/EstimatedCalorieNeedsPerDay.pdf (accessed on 19 September 2017).
  77. Krebs-Smith, S.M.; Clark, L.D. Validation of a nutrient adequacy score for use with women and children. J. Am. Diet. Assoc. 1989, 89, 775–783. [Google Scholar]
  78. Dietary Guidelines Advisory Committee. Scientific Report of the 2015 Dietary Guidelines Advisory Committee Appendix E-3.1: Adequacy of USDA Food Patterns. Available online: https://health.gov/dietaryguidelines/2015-scientific-report/PDFs/Appendix-E-3.1.pdf (accessed on 5 July 2018).
  79. U.S. Department of Health and Human Services and U.S. Department of Agriculture. Nutrient Profiles for Food Groups and Subgroups in the 2015 USDA Food Patterns. Available online: https://www.cnpp.usda.gov/sites/default/files/usda_food_patterns/NutrientProfiles.pdf (accessed on 22 September 2017).
  80. Britten, P.; Cleveland, L.E.; Koegel, K.L.; Kuczynski, K.J.; Nickols-Richardson, S.M. Updated US Department of Agriculture Food Patterns meet goals of the 2010 dietary guidelines. J. Acad. Nutr. Diet. 2012, 112, 1648–1655. [Google Scholar] [CrossRef]
  81. Pannucci, T.; USDA, Alexandria, VA, USA. Personal communication, 2018.
  82. National Cancer Institute. The Healthy Eating Index—Population Ratio Method. Available online: https://epi.grants.cancer.gov/hei/population-ratio-method.html (accessed on 25 October 2017).
  83. McCullough, M.L.; Willett, W.C. Evaluating adherence to recommended diets in adults: The Alternate Healthy Eating Index. Public Health Nutr. 2006, 9, 152–157. [Google Scholar] [CrossRef]
  84. McCullough, M.L.; Feskanich, D.; Stampfer, M.J.; Giovannucci, E.L.; Rimm, E.B.; Hu, F.B.; Spiegelman, D.; Hunter, D.J.; Colditz, G.A.; Willett, W.C. Diet quality and major chronic disease risk in men and women: Moving toward improved dietary guidance. Am. J. Clin. Nutr. 2002, 76, 1261–1271. [Google Scholar] [CrossRef]
  85. McCullough, M.L.; Feskanich, D.; Rimm, E.B.; Giovannucci, E.L.; Ascherio, A.; Variyam, J.N.; Spiegelman, D.; Stampfer, M.J.; Willett, W.C. Adherence to the Dietary Guidelines for Americans and risk of major chronic disease in men. Am. J. Clin. Nutr. 2000, 72, 1223–1231. [Google Scholar] [CrossRef]
  86. McCullough, M.L.; Feskanich, D.; Stampfer, M.J.; Rosner, B.A.; Hu, F.B.; Hunter, D.J.; Variyam, J.N.; Colditz, G.A.; Willett, W.C. Adherence to the Dietary Guidelines for Americans and risk of major chronic disease in women. Am. J. Clin. Nutr. 2000, 72, 1214–1222. [Google Scholar] [CrossRef]
  87. Kennedy, E.T.; Ohls, J.; Carlson, S.; Fleming, K. The Healthy Eating Index: Design and Applications. J. Am. Diet. Assoc. 1995, 95, 1103. [Google Scholar] [CrossRef]
  88. Shivappa, N.; Hebert, J.R.; Kivimaki, M.; Akbaraly, T. Alternate Healthy Eating Index 2010, Dietary Inflammatory Index and risk of mortality: Results from the Whitehall II cohort study and meta-analysis of previous Dietary Inflammatory Index and mortality studies. Br. J. Nutr. 2017, 118, 210–221. [Google Scholar] [CrossRef]
  89. Mears, M.; Tussing-Humphreys, L.; Cerwinske, L.; Tangney, C.; Hughes, S.L.; Fitzgibbons, M.; Gomez-Perez, S. Associations between Alternate Healthy Eating Index-2010, Body Composition, Osteoarthritis Severity, and Interleukin-6 in Older Overweight and Obese African American Females with Self-Reported Osteoarthritis. Nutrients 2018, 11, 26. [Google Scholar] [CrossRef]
  90. McCullough, M.L.; American Cancer Society, Inc., Atlanta, GA, USA. Personal communication, 2019.
  91. Hoy, M.K.; Goldman, J.D.; Murayi, T.; Rhodes, D.G.; Moshfegh, A.J. Sodium Intake of the U.S. Population: What We Eat In America, NHANES 2007-2008. Food Surveys Research Group Dietary Data Brief No. 8. October 2011. Available online: http://ars usda gov/Services/docs htm?docid=19476 (accessed on 5 March 2019).
  92. Schwingshackl, L.; Bogensberger, B.; Hoffmann, G. Diet Quality as Assessed by the Healthy Eating Index, Alternate Healthy Eating Index, Dietary Approaches to Stop Hypertension Score, and Health Outcomes: An Updated Systematic Review and Meta-Analysis of Cohort Studies. J. Acad. Nutr. Diet. 2018, 118, 74–100. [Google Scholar] [CrossRef]
  93. SAS Institute Inc. SAS 9.4; SAS Institute Inc.: Cary, NC, USA, 2015. [Google Scholar]
  94. Microsoft Corporation. Microsoft Excel, 14.0.7208.5000 (32-bit); Microsoft Corporation: Albuquerque, NM, USA, 2010. [Google Scholar]
  95. Brand-Miller, J.C.; Stockmann, K.; Atkinson, F.; Petocz, P.; Denyer, G. Glycemic index, postprandial glycemia, and the shape of the curve in healthy subjects: Analysis of a database of more than 1000 foods. Am. J. Clin. Nutr. 2009, 89, 97–105. [Google Scholar] [CrossRef]
  96. Institute of Medicine. Dietary Reference Intakes: Macronutrients. Available online: http://www.nationalacademies.org/hmd/~/media/Files/Activity%20Files/Nutrition/DRI-Tables/8_Macronutrient%20Summary.pdf?la=en (accessed on 16 June 2018).
  97. Jacobson, T.A.; Maki, K.C.; Orringer, C.E.; Jones, P.H.; Kris-Etherton, P.; Sikand, G.; La Forge, R.; Daniels, S.R.; Wilson, D.P.; Morris, P.B.; et al. National Lipid Association Recommendations for Patient-Centered Management of Dyslipidemia: Part 2. J. Clin. Lipidol. 2015, 9, S1–S122. [Google Scholar] [CrossRef]
  98. Slavin, J.L.; Lloyd, B. Health benefits of fruits and vegetables. Adv. Nutr. 2012, 3, 506–516. [Google Scholar] [CrossRef]
  99. Hadgkiss, E.J.; Jelinek, G.A.; Weiland, T.J.; Pereira, N.G.; Marck, C.H.; van der Meer, D.M. The association of diet with quality of life, disability, and relapse rate in an international sample of people with multiple sclerosis. Nutr. Neurosci. 2015, 18, 125–136. [Google Scholar] [CrossRef]
  100. Fitzgerald, K.C.; Tyry, T.; Salter, A.; Cofield, S.S.; Cutter, G.; Fox, R.; Marrie, R.A. Diet quality is associated with disability and symptom severity in multiple sclerosis. Neurology 2018, 90, e1–e11. [Google Scholar] [CrossRef]
  101. Marck, C.H.; De Livera, A.M.; Brown, C.R.; Neate, S.L.; Taylor, K.L.; Weiland, T.J.; Hadgkiss, E.J.; Jelinek, G.A. Health outcomes and adherence to a healthy lifestyle after a multimodal intervention in people with multiple sclerosis: Three year follow-up. PLoS ONE 2018, 13, e0197759. [Google Scholar] [CrossRef]
  102. Thau-Zuchman, O.; Gomes, R.N.; Dyall, S.C.; Davies, M.; Priestley, J.V.; Groenendijk, M.; De Wilde, M.C.; Tremoleda, J.L.; Michael-Titus, A.T. Brain Phospholipid Precursors Administered Post-Injury Reduce Tissue Damage and Improve Neurological Outcome in Experimental Traumatic Brain Injury. J. Neurotrauma 2019, 36, 25–42. [Google Scholar] [CrossRef]
  103. Skripuletz, T.; Manzel, A.; Gropengiesser, K.; Schafer, N.; Gudi, V.; Singh, V.; Salinas Tejedor, L.; Jorg, S.; Hammer, A.; Voss, E.; et al. Pivotal role of choline metabolites in remyelination. Brain 2015, 138, 398–413. [Google Scholar] [CrossRef]
  104. Skripuletz, T.; Linker, R.A.; Stangel, M. The choline pathway as a strategy to promote central nervous system (CNS) remyelination. Neural Regener. Res. 2015, 10, 1369–1370. [Google Scholar]
  105. Hollenbeck, C.B. An introduction to the nutrition and metabolism of choline. Cent. Nerv. Syst. Agents Med. Chem. 2012, 12, 100–113. [Google Scholar] [CrossRef] [PubMed]
  106. Ames, B.N. Low micronutrient intake may accelerate the degenerative diseases of aging through allocation of scarce micronutrients by triage. Proc. Natl. Acad. Sci. USA 2006, 103, 17589–17594. [Google Scholar] [CrossRef] [PubMed]
  107. Ames, B.N. Optimal micronutrients delay mitochondrial decay and age-associated diseases. Mech. Ageing Dev. 2010, 131, 473–479. [Google Scholar] [CrossRef] [PubMed]
  108. NIH Office of Dietary Supplements. Choline Fact Sheet for Health Professionals. Available online: https://ods.od.nih.gov/factsheets/Choline-HealthProfessional/#en11 (accessed on 25 September 2018).
  109. Wen, W.; Wan, Z.; Ren, K.; Zhou, D.; Gao, Q.; Wu, Y.; Wang, L.; Yuan, Z.; Zhou, J. Potassium supplementation inhibits IL-17A production induced by salt loading in human T lymphocytes via p38/MAPK-SGK1 pathway. Exp. Mol. Pathol. 2016, 100, 370–377. [Google Scholar] [CrossRef]
  110. Gijsbers, L.; Dower, J.I.; Schalkwijk, C.G.; Kusters, Y.H.; Bakker, S.J.; Hollman, P.C.; Geleijnse, J.M. Effects of sodium and potassium supplementation on endothelial function: A fully controlled dietary intervention study. Br. J. Nutr. 2015, 114, 1419–1426. [Google Scholar] [CrossRef]
  111. Khalili, H.; Malik, S.; Ananthakrishnan, A.N.; Garber, J.J.; Higuchi, L.M.; Joshi, A.; Peloquin, J.; Richter, J.M.; Stewart, K.O.; Curhan, G.C.; et al. Identification and Characterization of a Novel Association between Dietary Potassium and Risk of Crohn’s Disease and Ulcerative Colitis. Front. Immunol. 2016, 7, 554. [Google Scholar] [CrossRef] [PubMed]
  112. Miyake, S.; Yamamura, T. Gut environmental factors and multiple sclerosis. J. Neuroimmunol. 2018. [Google Scholar] [CrossRef]
  113. Berer, K.; Martinez, I.; Walker, A.; Kunkel, B.; Schmitt-Kopplin, P.; Walter, J.; Krishnamoorthy, G. Dietary non-fermentable fiber prevents autoimmune neurological disease by changing gut metabolic and immune status. Sci. Rep. 2018, 8, 10431. [Google Scholar] [CrossRef]
  114. Lombardi, V.C.; De Meirleir, K.L.; Subramanian, K.; Nourani, S.M.; Dagda, R.K.; Delaney, S.L.; Palotás, A. Nutritional modulation of the intestinal microbiota: Future opportunities for the prevention and treatment of neuroimmune and neuroinflammatory disease. J. Nutr. Biochem. 2018, 61, 1–16. [Google Scholar] [CrossRef]
  115. Shahi, S.K.; Freedman, S.N.; Mangalam, A.K. Gut microbiome in multiple sclerosis: The players involved and the roles they play. Gut Microbes 2017, 8, 607–615. [Google Scholar] [CrossRef]
  116. Freedman, S.N.; Shahi, S.K.; Mangalam, A.K. The “Gut Feeling”: Breaking Down the Role of Gut Microbiome in Multiple Sclerosis. Neurotherapeutics 2018, 15, 109–125. [Google Scholar] [CrossRef]
  117. Ledikwe, J.H.; Blanck, H.M.; Khan, L.K.; Serdula, M.K.; Seymour, J.D.; Tohill, B.C.; Rolls, B.J. Dietary energy density determined by eight calculation methods in a nationally representative United States population. J. Nutr. 2005, 135, 273–278. [Google Scholar] [CrossRef]
  118. Pérez-Escamilla, R.; Obbagy, J.E.; Altman, J.M.; Essery, E.V.; McGrane, M.M.; Wong, Y.P.; Spahn, J.M.; Williams, C.L. Dietary Energy Density and Body Weight in Adults and Children: A Systematic Review. J. Acad. Nutr. Diet. 2012, 112, 671–684. [Google Scholar] [CrossRef]
  119. Vernarelli, J.A.; Mitchell, D.C.; Rolls, B.J.; Hartman, T.J. Dietary energy density and obesity: How consumption patterns differ by body weight status. Eur. J. Nutr. 2018, 57, 351–361. [Google Scholar] [CrossRef]
  120. Mokry, L.E.; Ross, S.; Timpson, N.J.; Sawcer, S.; Davey Smith, G.; Richards, J.B. Obesity and Multiple Sclerosis: A Mendelian Randomization Study. PLoS Med. 2016, 13, e1002053. [Google Scholar] [CrossRef]
  121. Marck, C.H.; Neate, S.L.; Taylor, K.L.; Weiland, T.J.; Jelinek, G.A. Prevalence of Comorbidities, Overweight and Obesity in an International Sample of People with Multiple Sclerosis and Associations with Modifiable Lifestyle Factors. PLoS ONE 2016, 11, e0148573. [Google Scholar] [CrossRef]
  122. Tettey, P.; Simpson, S.; Taylor, B.; Ponsonby, A.L.; Lucas, R.M.; Dwyer, T.; Kostner, K.; van der Mei, I.A. An adverse lipid profile and increased levels of adiposity significantly predict clinical course after a first demyelinating event. J. Neurol. Neurosurg. Psychiatry 2017, 88, 395–401. [Google Scholar] [CrossRef]
  123. Pasquinelli, S.; Solaro, C. Nutritional assessment and malnutrition in multiple sclerosis. Neurol.Sci. 2008, 29 (Suppl. 4), S367. [Google Scholar] [CrossRef]
  124. Edwards, N.C.; Munsell, M.; Menzin, J.; Phillips, A.L. Comorbidity in US patients with multiple sclerosis. Patient Relat. Outcome Meas. 2018, 9, 97–102. [Google Scholar] [CrossRef]
  125. National Heart, Lung, and Blood Institute. DASH Eating Plan. Available online: https://www.nhlbi.nih.gov/health-topics/dash-eating-plan (accessed on 28 February 2019).
  126. USDA Center for Nutrition Policy and Promotion. Report Card on the Quality of Americans’ Diets. Available online: http://origin.www.cnpp.usda.gov/Publications/NutritionInsights/Insight28.pdf (accessed on 1 September 2018).
Figure 1. Healthy Eating Index-2015 component scores for seven-day low saturated fat Swank and seven-day USDA Healthy US-Style Eating Pattern menus [71] calculated using the population ratio method. Values in parentheses indicate maximum score for each component. Component scores are plotted on each axis as a percentage of the maximum score and connected with lines. The outermost ring represents a perfect score.
Nutrients 11 00616 g001
Table 1. Low saturated fat Swank [36,37] diet guidelines.
Saturated Fat≤15 g
Foods Recommended2+ cup-eq 1 (~45–250 g) fruit per day, fresh preferred 2
2+ cup-eq (~20–250 g) vegetables 2 per day
4 servings grains per day, whole preferred 2
2 cups (~490 g) dairy products with <1% fat per day
Protein foods, daily
 Egg whites
 Poultry, white meat, no skin
 White fish and shellfish
 Nuts and seeds 3
4 to 10 teaspoons (20–50 g) oil 4 per day
Foods LimitedFatty fish ≤ 50 g (1.75 ounce) per day 3
Whole eggs ≤ 1 per day, ≤ 3 per week
Caffeinated beverages ≤ 3 cups (237–246 g) per day
Alcoholic beverages, maximum one drink per day
Foods Not RecommendedBeef, pork, dark meat poultry 5
Processed food containing saturated fat
Butter, animal fats
High fat dairy productsHigh-sugar products
Coconut oil, palm oil, margarine, lard, shortening, hydrogenated oil
Coconut, chocolate, cocoa butter
Supplements1 teaspoon (5 g) cod liver oil
1 multivitamin/mineral
1000 mg vitamin C 2
400 IU vitamin E 2
1 Cup-equivalents = 2 cups raw leafy (~30–140 g), 1 cup raw or cooked (~35–250 g), 1 cup juice (~245–250 g), ½ cup dried (~20–90 g); 2 Swank MS Foundation [37] updated these guidelines after The Multiple Sclerosis Diet Book [36] was published; 3 Unsaturated fat in nuts and seeds and fatty fish are counted as part of the oil allowance; 4 2–4 teaspoons (10–20 g) for weight reduction, 4 teaspoons (20 g) for sedentary individuals, 8–10 teaspoons (40–50 g) for weight gain [36]; 5 After one year individuals may consume up to 3 ounces (85 g) per week.
Table 2. Mean food group servings of 1719 kcal (7192 kJ) seven-day low saturated fat Swank menus.
Food GroupMean Servings
Fruits and Vegetables, Total (cup-equivalents 1)4.2
Fruits, Total (cup-equivalents 1)1.9
  Juice0.4
  Whole Fruit1.4
Vegetables, Total (cup-equivalents 1)2.3
  Dark-green Vegetables1.0
  Deep-yellow Vegetables0.2
  Tomato0.3
  White Potatoes0.5
  Other Starchy Vegetables0.1
  Other Vegetables0.5
Grains, Total (servings 2)5.8
 Whole Grain4.0
 Some Whole Grain0.0
 Refined Grain1.8
Meat/Fish/Eggs/Nuts/Seeds, Total (servings 3)5.5
 Beef/Pork/Lamb0.0
 Poultry1.4
 Fish and Shellfish2.1
 Cold Cuts and Sausage0.0
 Organ Meats0.0
 Eggs0.6
 Nuts and Seeds including Butters1.4
Dairy and Nondairy, Total (cup-equivalents)2.3
 Milk, dairy, low fat and fat free2.3
 Yogurt, dairy, fat free0.1
 Milk, non-dairy0.0
Fats, Total (servings 4)4.2
 Oil 53.5
 Butter and Other Animal Fats0.0
 Salad Dressing0.8
Sweets, Total (servings 6)6.7
1 Serving = 2 cups raw green leafy (~30–140 g), 1 cup raw or cooked fruit/vegetable/juice (~35–250 g), ½ cup (~20–90 g) dried fruit/vegetable; 2 Serving = 1 slice bread, ½ cup cooked pasta (70 g), rice (79 g); 3 Serving = 1 ounce (28 g) cooked meat/fish/poultry, 1 large whole egg, 2 large egg whites, 1 tablespoon (16 g) peanut butter, ½ ounce (14 g) nuts/seeds; 4 Serving = 1 teaspoon (5 g) oil/butter, 15 g mayonnaise; 5 does not include unsaturated fat from fatty fish and nuts/seeds; 6 Serving = 4 g sugar, ¼ cup (79 g) syrup, 1 tablespoon (20 g) jam.
Table 3. Calculated energy, macronutrient and related components 1 for seven-day low saturated fat Swank menus without dietary supplements.
NutrientMeanSD 2
Energy (kcal)1719234
Energy (kJ)7192979
Total Protein (g)79.812.9
Total Carbohydrate (g)256.638.6
 Total Dietary Fiber (g)25.83.5
  Soluble Dietary Fiber (g)5.70.8
  Insoluble Dietary Fiber (g)20.02.9
 Total Sugars (g)124.823.5
  Added Sugars (by Total Sugars) (g)51.225.7
 Gluten (g)11.43.4
Glycemic Index (glucose reference)56.03.6
Glycemic Load (glucose reference)128.920.2
Total Fat (g)47.710.4
 Total Saturated Fatty Acids (SFA) (g)8.12.0
  Total Trans-Fatty Acids (TRANS) (g)0.20.1
 Total Monounsaturated Fatty Acids (MUFA) (g)16.63.6
 Total Polyunsaturated Fatty Acids (PUFA) (g)18.85.1
  Total Conjugated Linoleic Acid (CLA 18:2) (g)0.00.0
  PUFA 18:2 (linoleic acid) (g)16.14.6
  PUFA 18:3 n-3 (alpha-linolenic acid [ALA]) (g)2.00.6
  Omega 6 Fatty Acids (g) 316.34.6
  Omega-3 Fatty Acids (g)2.51.0
  Omega 6:3 ratio6.91.7
  PUFA 20:5 (eicosapentaenoic acid [EPA]) (g)0.10.2
  PUFA 22:5 (docosapentaenoic acid [DPA]) (g)0.10.1
  PUFA 22:6 (docosahexaenoic acid [DHA]) (g)0.40.7
Cholesterol (mg)196141
% Calories from Protein18.42.3
% Calories from Fat24.13.2
 % Calories from SFA4.10.7
  % Calories from TRANS0.10.0
 % Calories from MUFA8.31.2
 % Calories from PUFA9.51.8
  % Calories from 18:2 linoleic acid 48.11.7
  % Calories from 18:3n3 alpha-linolenic acid 41.00.2
% Calories from Carbohydrate57.54.8
 % Calories from added sugar 49.74.5
Total Grams (g)1766217
Kcal/Gram1.00.1
kJ/Gram4.20.4
Water (g)1370168
sodium:potassium ratio0.700.29
calcium:phosphorus ratio0.720.19
calcium:magnesium ratio2.910.86
Phytic Acid (mg/1000 kcal)577186
Oxalic Acid (mg/1000 kcal)20094
Pantothenic Acid (mg/1000 kcal)40
Betaine (mg/1000 kcal)11138
1 Calculations were made using multiple decimal places but results are rounded for display purposes; 2 SD = standard deviation; 3 Omega-6 Fatty Acids = [PUFA 18:2 (linoleic acid) + PUFA 18:3 (linolenic acid)] − PUFA 18:3 n3 (alpha-linolenic acid) + PUFA 20:4 (arachidonic acid); 4 denominator kcals = (grams protein × 4) + (grams carbohydrate × 4) + (grams fat × 9) + (grams alcohol × 7).
Table 4. Percent Recommended Dietary Allowance, Adequate Intake and Tolerable Upper Intake Levels of selected nutrients calculated for the average seven-day Swank low saturated fat menus without dietary supplements.
SexFemalesMales
Age, Years19–3031–5051–70>7019–3031–5051–70>70
Energy, kcal 120001800160016002600220020002000
Energy, kJ836875316694669410,878920583688368
Protein, grams 2938474741211029393
Carbohydrate, grams 3299269239239388328299299
Fat, grams 45550444472615555
Saturated Fat, grams 59888121099
Percent Recommended Dietary Allowance (RDA)
Vitamin A, %RDA161145129129162137125125
Vitamin C, %RDA186167148148201170155155
Vitamin D, %RDA91 68273551191009168
Vitamin E, %RDA78716363102867878
Vitamin B1, %RDA165149132132197167152152
Vitamin B2, %RDA247224202202247228209209
Vitamin B3, %RDA313282251251356301274274
Vitamin B6, %RDA184165127127239202140140
Folate, %RDA1201089696156132120120
Vitamin B12, %RDA226204181181294249226226
Calcium, %RDA1311188787170144131109
Copper, %RDA178160142142231196178178
Iron, %RDA7971143143232196178178
Magnesium, %RDA144126112112145117106106
Phosphorus, %RDA255230204204332281255255
Selenium, %RDA264237211211343290264264
Zinc, %RDA139125112112132112101101
Average % RDA174157142141215183164161
MAR, % 797969594100999897
Percent Adequate Intake (AI)
Dietary Fiber, %AI12810811411410387100100
Linoleic Acid, %AI156141136136143121134134
α-Linolenic Acid, %AI207186165165185156142142
Vitamin K, %AI309278248248302255232232
Manganese, %AI338304271271344291265265
Choline, %AI107928181102867979
Potassium, %AI87787070113968787
Percent Tolerable Upper Intake Level (UL)
Sodium, %UL1181069494153130118118
1 Energy levels were selected from those reported for the Healthy US-Style Eating Pattern [70] and were typically for sedentary individuals [76]; 2 For comparison, the protein RDA is 46 g for adult non-pregnant, non-lactating females and 56 g for adult males based on 0.8 g protein per kg of body weight for the reference body weight [65]; 3 For comparison, the carbohydrate RDA is 130 g for adult males and adult non-pregnant, non-lactating females [65]; 4 For comparison, the Acceptable Macronutrient Distribution Ranges for total fat are 20%–35% energy [65], which is equivalent to 36–62 g, 40–70 g, 44–78 g, 49–86 g and 58–101 g for 1600, 1800, 2000, 2200 and 2600 kcals, respectively; 5 The Swank diet recommends ≤ 15 g saturated fat per day. For comparison, the 2015–2020 Dietary Guidelines for Americans [58] recommend < 10% energy from saturated fat which is equivalent to < 18 g, < 20 g, < 22 g, < 24 g and < 29 g for 1600, 1800, 2000, 2200 and 2600 kcals, respectively. The American Heart Association recommends 5–6% energy from saturated fat for individuals who should reduce their low density lipoprotein cholesterol level [59] which is equivalent to 9–11 g, 10–12 g, 11–13 g, 12–15 g and 14–17 g for 1600, 1800, 2000, 2200 and 2600 kcals, respectively; 6 Bolded values are below Recommended Dietary Allowance or Adequate Intake or above the Tolerable Upper Intake Level; 7 MAR = mean adequacy ratio.
Table 5. Nutrient composition and nutritional adequacy of Swank and US-Style Healthy Eating Pattern [70] for males and females 31–50 years modeled using the United States Department of Agriculture Food Group nutrient profiles.
CategoryFemales 31–50 YearsMales 31–50 Years
SwankHEP 1SwankHEP
Energy, kcal1800179722002198
Energy, kJ7531751992059196
Protein, grams808797100
Protein, %kcal18191818
Fat, grams56616878
Fat, %kcal28312832
 Saturated Fat, grams11151320
 Saturated Fat, %kcal5858
EPA 2, grams0.10.10.10.1
DHA 3, grams0.20.20.20.2
Carbohydrate, grams254233311286
Carbohydrate, %kcal57525752
Dietary Fiber, grams26293235
Percent Recommended Dietary Allowance (RDA)
Vitamin A, %RDA145125138109
Vitamin C, %RDA195133198141
Vitamin D, %RDA42 4455247
Vitamin E, %RDA74619074
Vitamin B1, %RDA142153160165
Vitamin B2, %RDA179185185175
Vitamin B3, %RDA162160173166
Vitamin B6, %RDA178274218201
Folate, %RDA161143197172
Vitamin B12, %RDA288274352304
Calcium, %RDA115126140134
Copper, %RDA145146177173
Iron, %RDA9591261242
Magnesium, %RDA12010511294
Phosphorus, %RDA228239279266
Selenium, %RDA195193238221
Zinc, %RDA169171150143
Average %RDA155154183166
MAR, % 595949795
Percent Adequate Intake (AI)
Dietary Fiber, %AI10311483114
Linoleic Acid, %AI150143129125
α-Linolenic Acid, %AI195185164157
Vitamin K, %AI388147356142
Manganese, %AI266213254199
Choline, %AI81777769
Potassium, %AI67678279
Percent Tolerable Upper Intake Level (UL)
Sodium, %UL66758084
1 US-Style Healthy Eating Pattern; 2 Eicosapentaenoic acid; 3 Docosahexaenoic acid; 4 bolded values are below the RDA or AI; 5 MAR = mean adequacy ratio.

