Association between Ready-to-Eat Cereal Consumption and Nutrient Intake, Nutritional Adequacy, and Diet Quality in Adults in the National Health and Nutrition Examination Survey 2015–2016

Abstract
1. Introduction
2. Materials and Methods
2.1. Data Source and Population
2.2. RTE Cereal Consumption
2.3. Outcome Variables
2.3.1. Macro- and Micro-Nutrients
2.3.2. Percent Contribution of RTE Cereal to Daily Nutrient Intake
2.3.3. Percent of the Population Below Estimated Average Requirement
2.3.4. Food Group Intake
2.3.5. Healthy Eating Index 2015
2.4. Covariates
2.5. Sensitivity Analyses
2.6. Statistical Analysis
3. Results
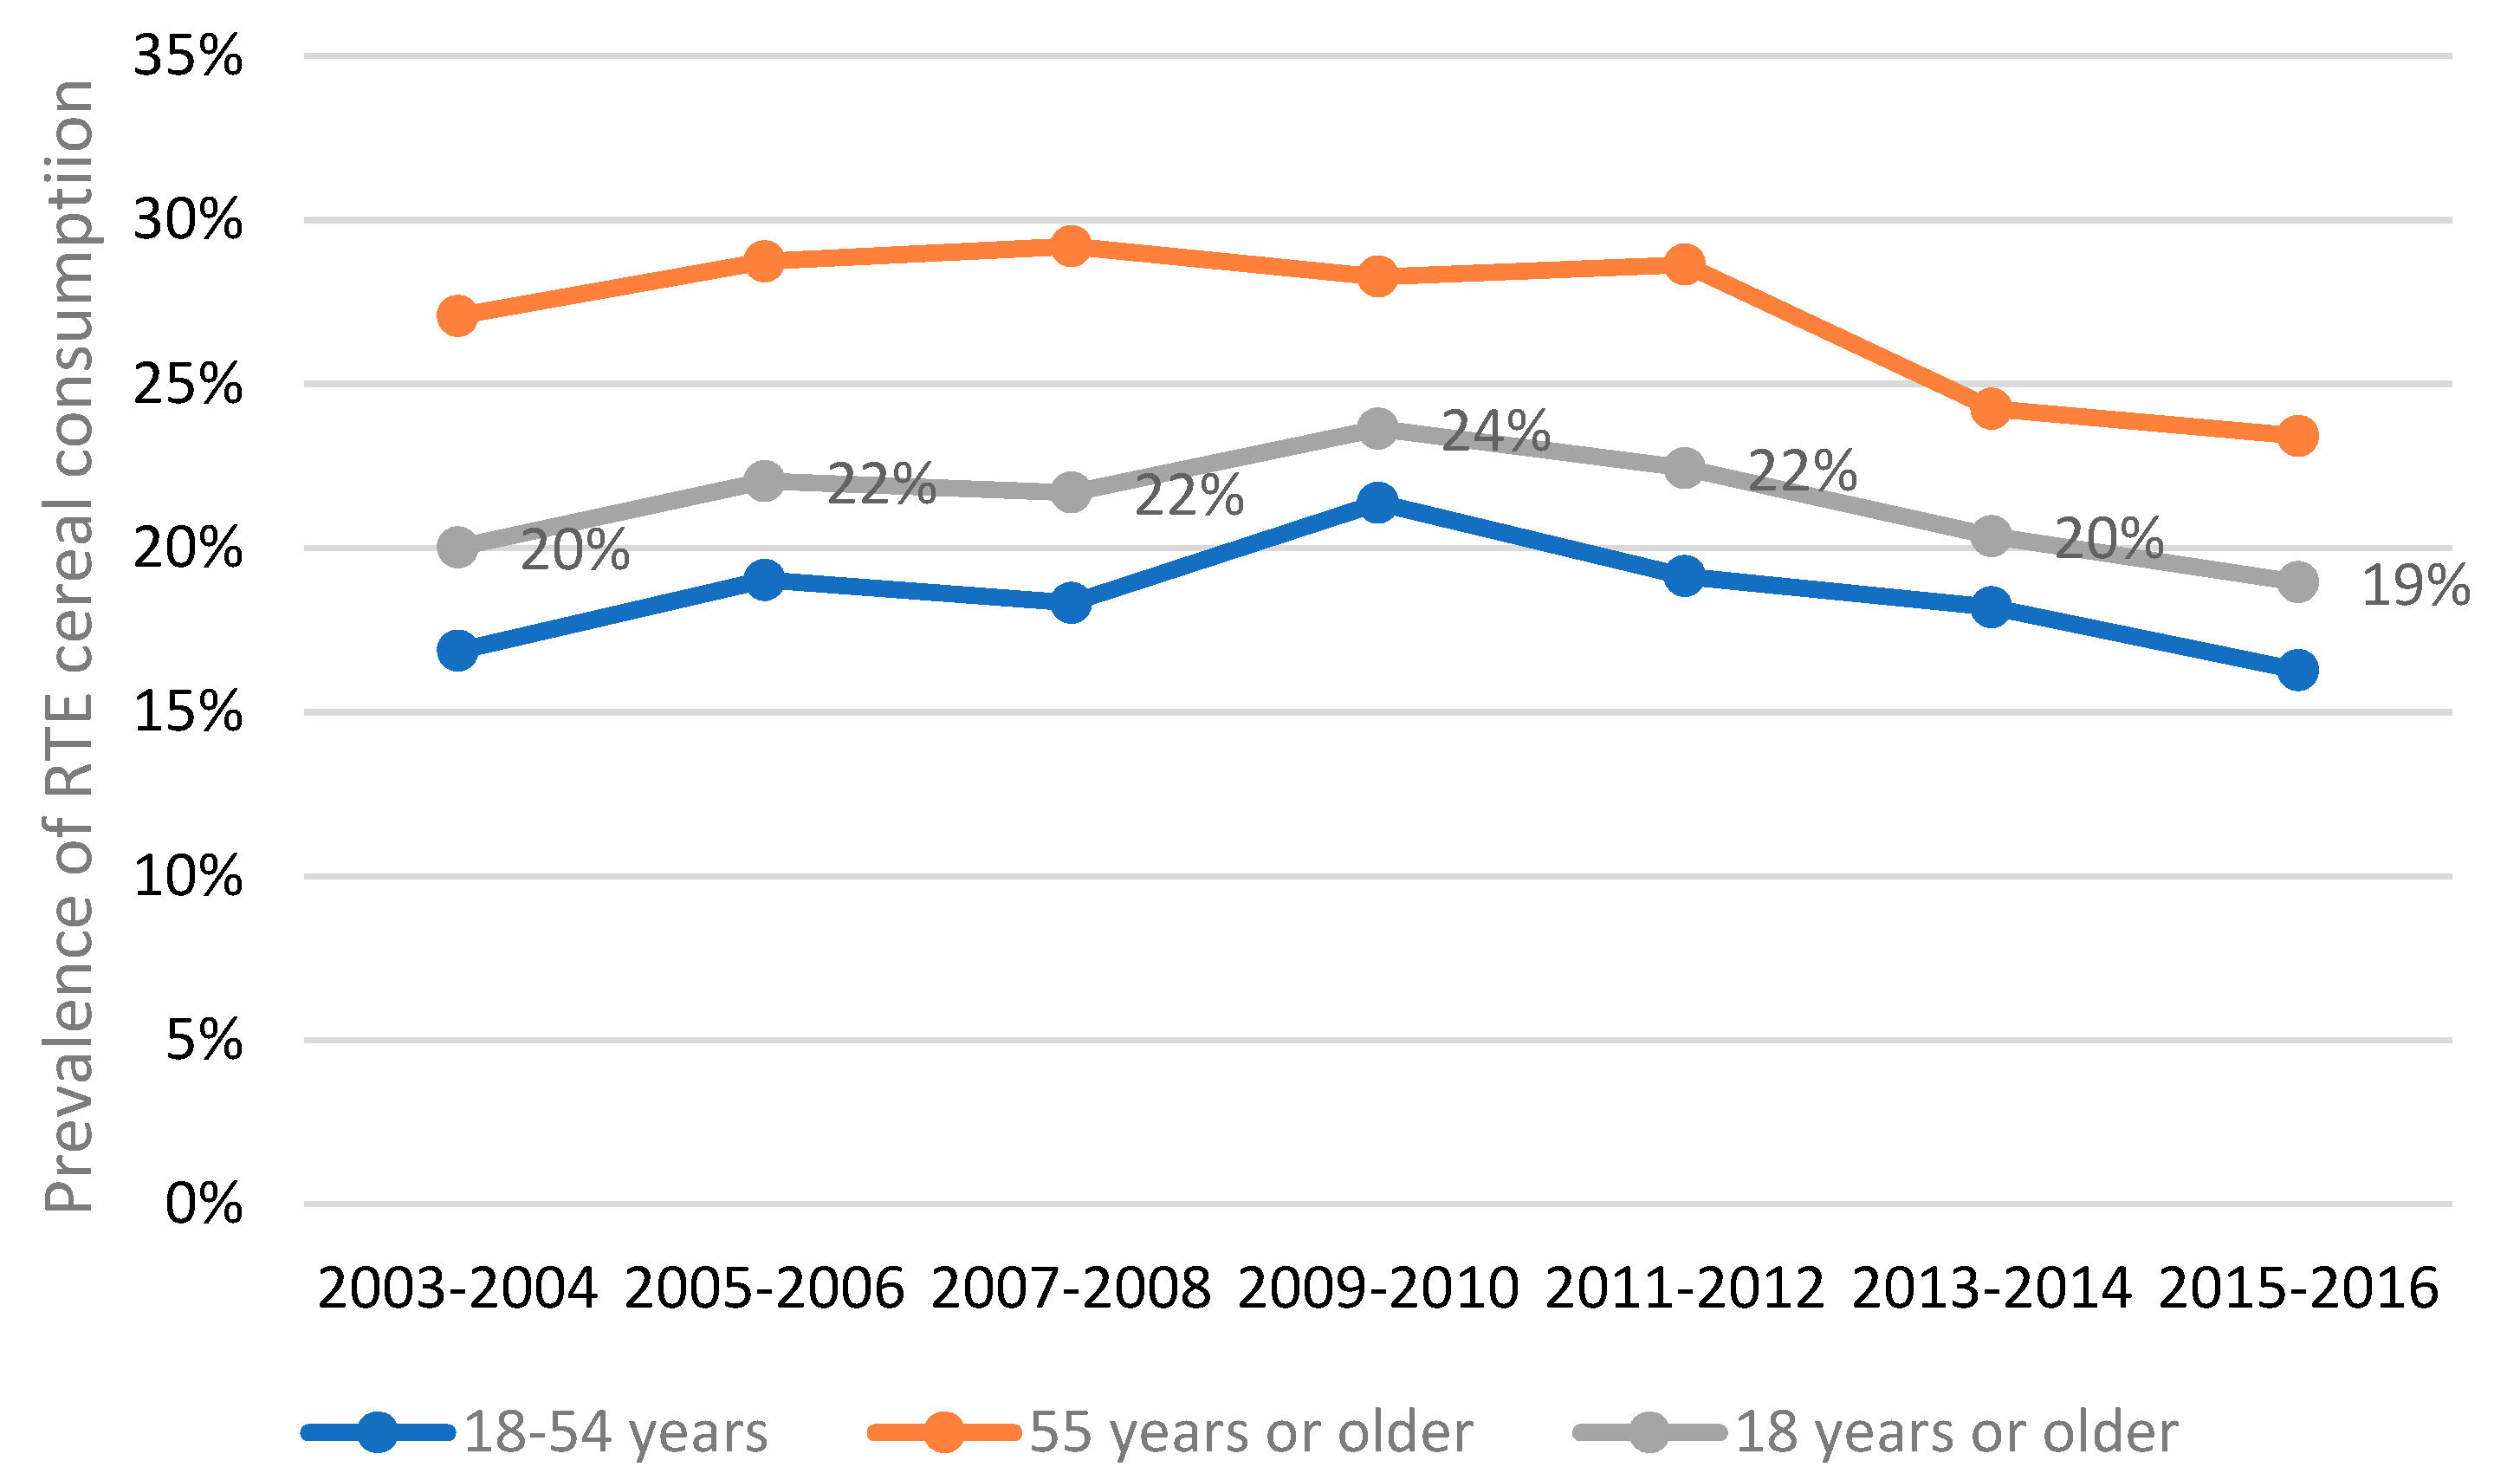
3.1. Prevalence of RTE Cereal Consumption over Time
3.2. Demographics of Participants in NHANES 2015–2016
3.3. Difference in Energy and Nutrient Intakes between RTE Cereal Eaters and Non-Eaters
3.4. Percentage of the Population below the Estimated Average Requirement for Nutrients
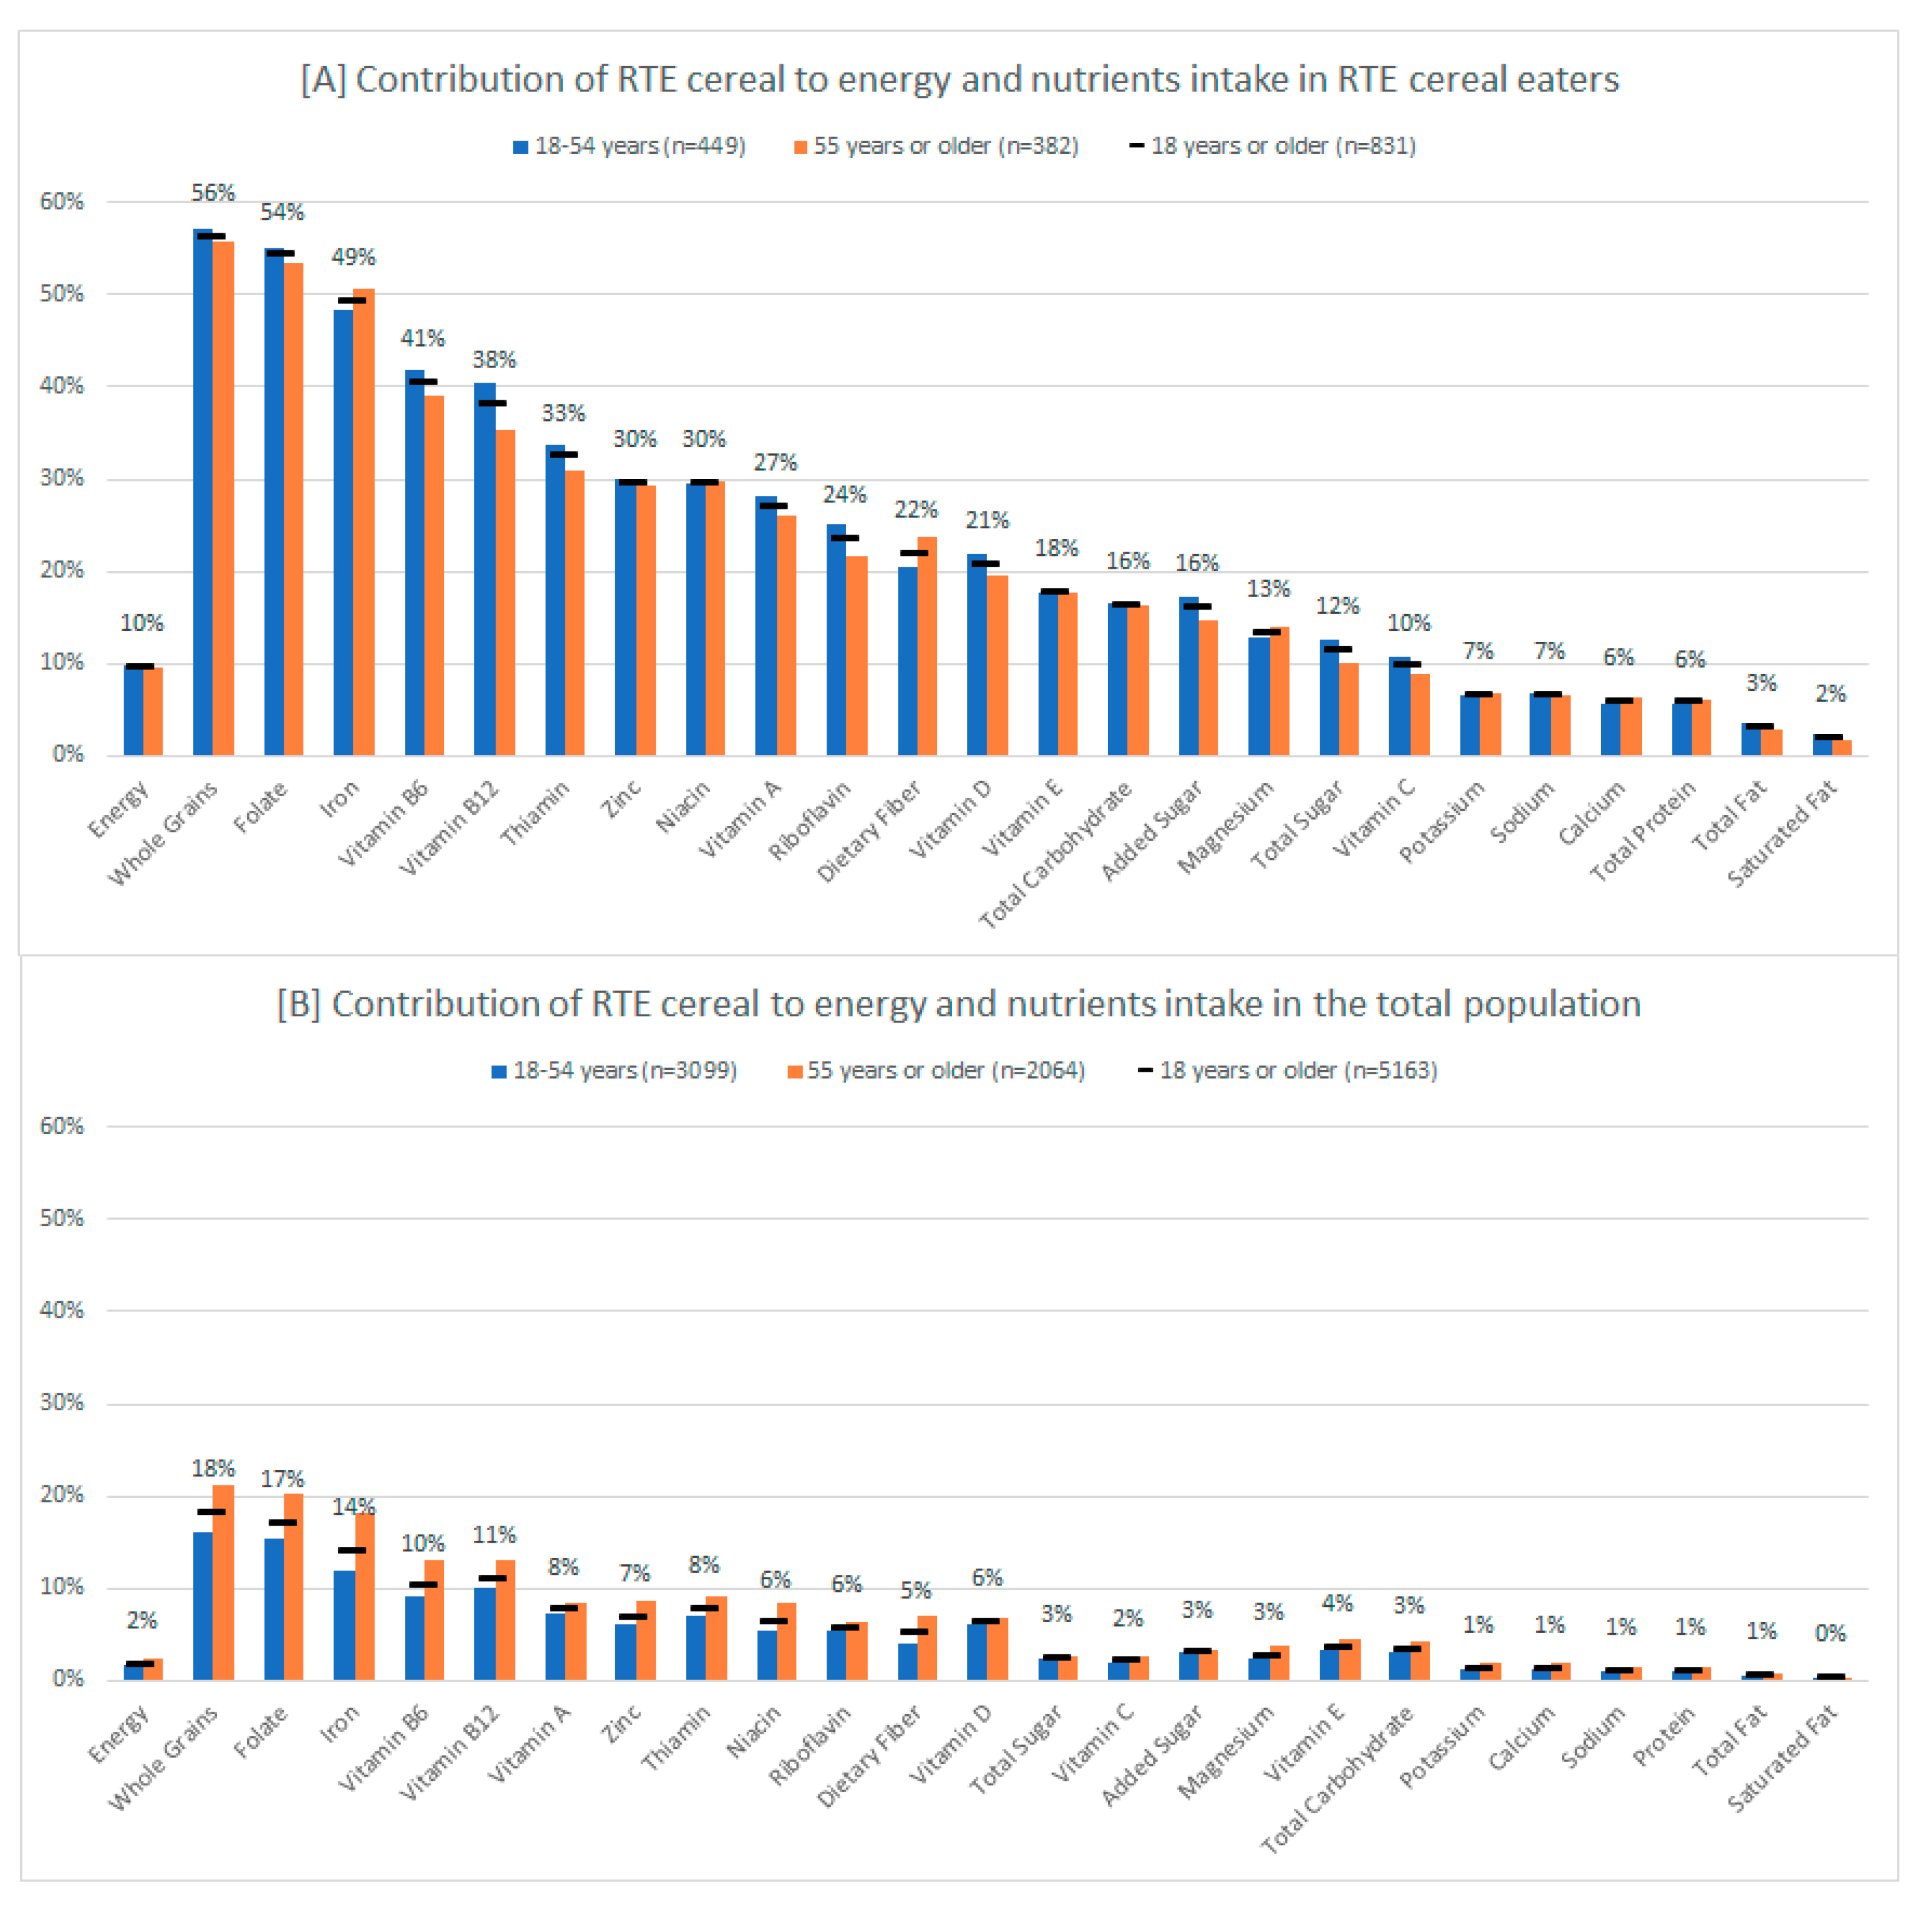
3.5. Contribution of RTE Cereal to Daily Energy and Nutrients Intake in RTE Cereal Eaters and in the Total Population
3.6. Food Group Intake in RTE Cereal Eaters and Non-Eaters
3.7. Diet Quality in RTE Cereal Eaters and Non-Eaters
4. Discussion
5. Conclusions
Supplementary Materials
Author Contributions
Funding
Acknowledgments
Conflicts of Interest
References
- Deshmukh-Taskar, P.R.; Radcliffe, J.D.; Liu, Y.; Nicklas, T.A. Do breakfast skipping and breakfast type affect energy intake, nutrient intake, nutrient adequacy, and diet quality in young adults? NHANES 1999–2002. J. Am. Coll. Nutr. 2010, 29, 407–418. [Google Scholar] [CrossRef]
- Nicklas, T.A.; O’Neil, C.E.; Berenson, G.S. Nutrient contribution of breakfast, secular trends, and the role of ready-to-eat cereals: A review of data from the Bogalusa Heart Study. J. Am. Clin. Nutr. 1998, 67, 757S–763S. [Google Scholar] [CrossRef]
- Albertson, A.M.; Wold, A.C.; Joshi, N. Ready-to-eat cereal consumption patterns: The relationship to nutrient intake, whole grain intake, and body mass index in an older American population. J. Aging Res. 2012, 2012, 631310. [Google Scholar] [CrossRef]
- Wengreen, H.; Nelson, C.; Munger, R.G.; Corcoran, C. Prospective study of ready-to-eat breakfast cereal consumption and cognitive decline among elderly men and women. J. Nutr. Health Aging 2011, 15, 202–207. [Google Scholar] [CrossRef] [PubMed]
- Song, W.O.; Chun, O.K.; Obayashi, S.; Cho, S.; Chung, C.E. Is consumption of breakfast associated with body mass index in US adults? J. Am. Diet. Assoc. 2005, 105, 1373–1382. [Google Scholar] [CrossRef] [PubMed]
- Barr, S.I.; DiFrancesco, L.; Fulgoni, V.L., 3rd. Consumption of breakfast and the type of breakfast consumed are positively associated with nutrient intakes and adequacy of Canadian adults. J. Nutr. 2013, 143, 86–92. [Google Scholar] [CrossRef] [PubMed]
- Bertrais, S.; Polo Luque, M.L.; Preziosi, P.; Fieux, B.; Torra De Flot, M.; Galan, P.; Hercberg, S. Contribution of ready-to-eat cereals to nutrition intakes in French adults and relations with corpulence. Ann. Nutr. Metab. 2000, 44, 249–255. [Google Scholar] [CrossRef]
- Preziosi, P.; Galan, P.; Deheeger, M.; Yacoub, N.; Drewnowski, A.; Hercberg, S. Breakfast type, daily nutrient intakes and vitamin and mineral status of French children, adolescents, and adults. J. Am. Coll. Nutr. 1999, 18, 171–178. [Google Scholar] [CrossRef]
- Galvin, M.A.; Kiely, M.; Flynn, A. Impact of ready-to-eat breakfast cereal (RTEBC) consumption on adequacy of micronutrient intakes and compliance with dietary recommendations in Irish adults. Public Health Nutr. 2003, 6, 351–363. [Google Scholar] [CrossRef]
- Smith, J.; Garcia-Bailo, B.; Vanage, V.; Shiery, L. Patterns of ready-to-eat cereal consumption and nutrient intakes among ready-to-eat cereal eaters: Results from NHANES 2013–2014. FASEB J. 2017, 31, 648.18. [Google Scholar]
- United States Department of Health and Human Services and United States Department of Agriculture. 2015–2020 Dietary Guidelines for Americans, 8th ed.; 2015. Available online: http://health.gov/dietaryguidelines/2015/guidelines/ (accessed on 30 May 2019).
- Smith, J.D.; Zhu, Y.; Vanage, V.; Jain, N.; Holschuh, N.; Agler, A.H. Association between ready-to-eat cereal consumption and nutrient intake, nutritional adequacy, and diet quality among infants, toddlers, and children in the National Health and Nutrition Examination Survey 2015–2016. Nutrients 2019, 11, 1989. [Google Scholar] [CrossRef]
- Centers for Disease Control and Prevention. NHANES 2015–2016. Available online: https://wwwn.cdc.gov/nchs/nhanes/continuousnhanes/default.aspx?BeginYear=2015 (accessed on 30 May 2019).
- Centers for Disease Control and Prevention. NHANES Response Rates and Population Totals. Available online: https://wwwn.cdc.gov/nchs/nhanes/ResponseRates.aspx (accessed on 11 October 2019).
- Blanton, C.A.; Moshfegh, A.J.; Baer, D.J.; Kretsch, M.J. The USDA Automated Multiple-Pass Method accurately estimates group total energy and nutrient intake. J. Nutr. 2006, 136, 2594–2599. [Google Scholar] [CrossRef] [PubMed]
- Moshfegh, A.J.; Rhodes, D.G.; Baer, D.J.; Murayi, T.; Clemens, J.C.; Rumpler, W.V.; Paul, D.R.; Sebastian, R.S.; Kuczynski, K.J.; Ingwersen, L.A.; et al. The US Department of Agriculture Automated Multiple-Pass Method reduces bias in the collection of energy intakes. Am. J. Clin. Nutr. 2008, 88, 324–332. [Google Scholar] [CrossRef]
- United States Department of Agriculture. Food and Nutrient Database for Dietary Studies 2015–2016. Available online: https://www.ars.usda.gov/northeast-area/beltsville-md-bhnrc/beltsville-human-nutrition-research-center/food-surveys-research-group/docs/fndds-download-databases/ (accessed on 30 May 2019).
- Rhodes, D.G.; Morton, S.; Martin, C.L.; Adler, M.E.; Hymes, M.A.; Garceau, A.O.; Kovalchik, A.; Sattgast, L.H.; Steinfeldt, L.C.; Clemens, J.C.; et al. 2015–2016 Food and Nutrient Database for Dietary Studies Documentation. Available online: https://www.ars.usda.gov/ARSUserFiles/80400530/pdf/fndds/2015_2016_FNDDS_Doc.pdf (accessed on 11 October 2019).
- United States Department of Agriculture. Food Patterns Equivalents Database 2015–2016. Available online: https://www.ars.usda.gov/northeast-area/beltsville-md-bhnrc/beltsville-human-nutrition-research-center/food-surveys-research-group/docs/fped-databases/ (accessed on 30 May 2019).
- Sattgast, L.H.; Gallo, S.; Frankenfeld, C.L.; Moshfegh, A.J.; Slavin, M. Nutritional intake and bone health among adults with probable undiagnosed, untreated Celiac disease: What We Eat in America and NHANES 2009–2014. J. Am. Coll. Nutr. 2019. [Google Scholar] [CrossRef]
- Hoy, M.K.; Sebastian, R.S.; Goldman, J.D.; Wilkinson, E.C.; Moshfegh, A.J. Consuming vegetable-based salad is associated with higher nutrient intakes and diet quality among US adults, What We Eat in America, National Health and Nutrition Examination Survey 2011–2014. J. Acad. Nutr. Diet. 2019, 119, 2085–2092. [Google Scholar] [CrossRef] [PubMed]
- Papanikolaou, Y.; Fulgoni, V.L., 3rd. Egg consumption in U.S. children is associated with greater daily nutrient intakes, including protein, lutein + zeaxanthin, choline, alpha-linolenic acid, and docosahexanoic acid. Nutrients 2019, 11, 1137. [Google Scholar] [CrossRef] [PubMed]
- Conrad, Z.; Raatz, S.; Jahns, L. Greater vegetable variety and amount are associated with lower prevalence of coronary heart disease: National Health and Nutrition Examination Survey, 1999–2014. Nutr. J. 2018, 17, 67. [Google Scholar] [CrossRef] [PubMed]
- Maillot, M.; Rehm, C.D.; Vieux, F.; Rose, C.M.; Drewnowski, A. Beverage consumption patterns among 4–19 y old children in 2009-14 NHANES show that the milk and 100% juice pattern is associated with better diets. Nutr. J. 2018, 17, 54. [Google Scholar] [CrossRef]
- Ahluwalia, N.; Dwyer, J.; Terry, A.; Moshfegh, A.; Johnson, C. Update on NHANES dietary data: Focus on collection, release, analytical considerations, and uses to inform public policy. Adv. Nutr. 2016, 7, 121–134. [Google Scholar] [CrossRef]
- National Cancer Institute. Usual Dietary Intakes: The NCI Method. Available online: https://epi.grants.cancer.gov/diet/usualintakes/method.html?&url=/diet/usualintakes/method.html (accessed on 30 May 2019).
- Dodd, K.W.; Guenther, P.M.; Freedman, L.S.; Subar, A.F.; Kipnis, V.; Midthune, D.; Tooze, J.A.; Krebs-Smith, S.M. Statistical methods for estimating usual intake of nutrients and foods: A review of the theory. J. Am. Diet. Assoc. 2006, 106, 1640–1650. [Google Scholar] [CrossRef]
- Newman, J.C.; Malek, A.M.; Hunt, K.J.; Marriott, B.P. Nutrients in the US diet: Naturally occurring or enriched/fortified food and beverage sources, plus dietary supplements: NHANES 2009–2012. J. Nutr. 2019, 149, 1404–1412. [Google Scholar] [CrossRef] [PubMed]
- Krebs-Smith, S.M.; Pannucci, T.E.; Subar, A.F.; Kirkpatrick, S.I.; Lerman, J.L.; Tooze, J.A.; Wilson, M.M.; Reedy, J. Update of the Healthy Eating Index: HEI-2015. J. Acad. Nutr. Diet. 2018, 118, 1591–1602. [Google Scholar] [CrossRef] [PubMed]
- Zhu, Y.; Hollis, J.H. Associations between eating frequency and energy intake, energy density, diet quality and body weight status in adults from the USA. Br. J. Nutr. 2016, 115, 2138–2144. [Google Scholar] [CrossRef] [PubMed]
- Agarwal, S.; Reider, C.; Brooks, J.R.; Fulgoni, V.L., 3rd. Comparison of prevalence of inadequate nutrient intake based on body weight status of adults in the United States: An analysis of NHANES 2001–2008. J. Am. Coll. Nutr. 2015, 34, 126–134. [Google Scholar] [CrossRef]
- Priebe, M.G.; McMonagle, J.R. Effects of ready-to-eat-cereals on key nutritional and health outcomes: A systematic review. PLoS ONE 2016, 11, e0164931. [Google Scholar] [CrossRef]
- Papanikolaou, Y.; Fulgoni, V.L. Grain foods are contributors of nutrient density for American adults and help close nutrient recommendation gaps: Data from the National Health and Nutrition Examination Survey, 2009–2012. Nutrients 2017, 9, 873. [Google Scholar] [CrossRef]
- Rehm, C.D.; Drewnowski, A. Replacing American breakfast foods with ready-to-eat (RTE) cereals increases consumption of key food groups and nutrients among US children and adults: Results of an NHANES modeling study. Nutrients 2017, 9, 1010. [Google Scholar] [CrossRef]
- GBD 2017 Diet Collaborators. Health effects of dietary risks in 195 countries, 1990–2017: A systematic analysis for the Global Burden of Disease Study 2017. Lancet 2019, 393, 1958–1972. [Google Scholar] [CrossRef]
- O’Neil, C.E.; Nicklas, T.A.; Fulgoni, V.L., 3rd. Nutrient intake, diet quality, and weight/adiposity parameters in breakfast patterns compared with no breakfast in adults: National Health and Nutrition Examination Survey 2001–2008. J. Acad. Nutr. Diet. 2014, 114, S27–S43. [Google Scholar] [CrossRef]
- van den Boom, A.; Serra-Majem, L.; Ribas, L.; Ngo, J.; Perez-Rodrigo, C.; Aranceta, J.; Fletcher, R. The contribution of ready-to-eat cereals to daily nutrient intake and breakfast quality in a Mediterranean setting. J. Am. Coll. Nutr. 2006, 25, 135–143. [Google Scholar] [CrossRef]
- Grosse, S.D.; Berry, R.J.; Tilford, J.M.; Kucik, J.E.; Waitzman, N.J. Retrospective assessment of cost savings from prevention: Folic acid fortification and spina bifida in the U.S. Am. J. Prev. Med. 2016, 50, S74–S80. [Google Scholar] [CrossRef]
- Monteiro, C.A.; Cannon, G.; Moubarac, J.C.; Levy, R.B.; Louzada, M.L.C.; Jaime, P.C. The UN Decade of Nutrition, the NOVA food classification and the trouble with ultra-processing. Public Health Nutr. 2018, 21, 5–17. [Google Scholar] [CrossRef]
- Gibney, M.J.; Forde, C.G.; Mullally, D.; Gibney, E.R. Ultra-processed foods in human health: A critical appraisal. Am. J. Clin. Nutr. 2017, 106, 717–724. [Google Scholar] [CrossRef] [PubMed]
- Hajishafiee, M.; Saneei, P.; Benisi-Kohansal, S.; Esmaillzadeh, A. Cereal fibre intake and risk of mortality from all causes, CVD, cancer and inflammatory diseases: A systematic review and meta-analysis of prospective cohort studies. Br. J. Nutr. 2016, 116, 343–352. [Google Scholar] [CrossRef] [PubMed]
- Wang, Y.; Duan, Y.; Zhu, L.; Fang, Z.; He, L.; Ai, D.; Jin, Y. Whole grain and cereal fiber intake and the risk of type 2 diabetes: A meta-analysis. Int. J. Mol. Epidemiol. Genet 2019, 10, 38–46. [Google Scholar] [PubMed]
- Zong, G.; Gao, A.; Hu, F.B.; Sun, Q. Whole grain intake and mortality from all aauses, cardiovascular disease, and cancer: A meta-analysis of prospective cohort studies. Circulation 2016, 133, 2370–2380. [Google Scholar] [CrossRef] [PubMed]
- Xu, M.; Huang, T.; Lee, A.W.; Qi, L.; Cho, S. Ready-to-eat cereal consumption with total and cause-specific mortality: Prospective analysis of 367,442 individuals. J. Am. Coll. Nutr. 2016, 35, 217–223. [Google Scholar] [CrossRef] [PubMed]


| 18–54 Years | ≥55 Years | ≥18 Years | |||||||
|---|---|---|---|---|---|---|---|---|---|
| RTE Cereal Eaters (n = 449) | RTE Cereal Non-Eaters (n = 2650) | p2 | RTE Cereal Eaters (n = 382) | RTE Cereal Non-Eaters (n = 1682) | p2 | RTE Cereal Eaters (n = 831) | RTE Cereal Non-Eaters (n = 4332) | p2 | |
| Age (years) | 37.3 ± 1.2 | 36.1 ± 0.2 | 0.30 | 68.4 ± 0.6 | 66.2 ± 0.4 | 0.003 | 51.7 ± 1.5 | 46.8 ± 0.7 | 0.11 |
| Gender | 0.37 | 0.74 | 0.57 | ||||||
| Male | 209 (47%) | 1309 (51%) | 195 (48%) | 830 (47%) | 404 (48%) | 2139 (50%) | |||
| Female | 240 (53%) | 1341 (49%) | 187 (52%) | 852 (53%) | 427 (52%) | 2193 (50%) | |||
| Race/Ethnicity | 0.06 | <0.0001 | <0.0001 | ||||||
| Non-Hispanic White | 154 (63%) | 758 (56%) | 206 (84%) | 614 (73%) | 360 (73%) | 1372 (62%) | |||
| Non-Hispanic Black | 106 (13%) | 593 (13%) | 50 (5%) | 357 (10%) | 156 (9%) | 950 (12%) | |||
| Mexican American | 82 (11%) | 486 (12%) | 51 (4%) | 296 (5%) | 133 (8%) | 782 (10%) | |||
| Other Hispanic | 44 (5%) | 343 (8%) | 45 (2%) | 246 (4%) | 89 (4%) | 589 (7%) | |||
| Other Race | 63 (8%) | 470 (11%) | 30 (6%) | 169 (8%) | 93 (7%) | 639 (10%) | |||
| Ratio of family income to poverty | 0.03 | 0.91 | 0.15 | ||||||
| ≤1.85 | 220 (36%) | 1357 (41%) | 193 (37%) | 920 (35%) | 413 (36%) | 2277 (39%) | |||
| 1.86–3.49 | 100 (18%) | 610 (23%) | 90 (23%) | 372 (24%) | 190 (20%) | 982 (23%) | |||
| ≥3.50 | 129 (47%) | 683 (36%) | 99 (40%) | 390 (40%) | 228 (44%) | 1073 (38%) | |||
| Education 3 | 0.24 | 0.28 | 0.13 | ||||||
| ≤High school | 181 (29%) | 1187 (37%) | 172 (35%) | 877 (38%) | 353 (32%) | 2064 (37%) | |||
| Associate degree | 144 (36%) | 802 (33%) | 104 (29%) | 463 (34%) | 248 (33%) | 1265 (33%) | |||
| ≥College graduate | 124 (35%) | 661 (31%) | 106 (36%) | 340 (28%) | 230 (35%) | 1001 (30%) | |||
| Smoking status 4 | 0.01 | 0.03 | 0.001 | ||||||
| Current smokers | 62 (12%) | 568 (21%) | 39 (9%) | 287 (17%) | 101 (10%) | 855 (20%) | |||
| Former smokers | 71 (22%) | 371 (17%) | 144 (38%) | 585 (37%) | 215 (29%) | 956 (24%) | |||
| Non-smokers | 316 (67%) | 1708 (61%) | 199 (53%) | 804 (46%) | 515 (60%) | 2512 (56%) | |||
| Missing | 0 (0%) | 3 (0%) | 0 (0%) | 6 (0%) | 0 (0%) | 9 (0%) | |||
| Breakfast consumption 5 | <0.0001 | <0.0001 | <0.0001 | ||||||
| Yes | 413 (91%) | 1919 (74%) | 371 (98%) | 1381 (82%) | 784 (94%) | 3300 (77%) | |||
| No | 36 (9%) | 731 (26%) | 11 (2%) | 301 (18%) | 47 (6%) | 1032 (23%) | |||
| 18–54 Years | ≥55 Years | ≥18 Years | ||||||||||
|---|---|---|---|---|---|---|---|---|---|---|---|---|
| Model 1 2 | Model 2 3 | Model 12 | Model 2 3 | Model 1 2 | Model 2 3 | |||||||
| % Difference | p4 | % Difference | p4 | % Difference | p4 | % Difference | p4 | % Difference | p4 | % Difference | p4 | |
| Energy | 3.5 | 0.12 | N/A | N/A | 5.9 | 0.05 | N/A | N/A | 4.0 | 0.02 | N/A | N/A |
| Total carbohydrate | 16.3 | 0.0004 | 12.9 | 0.0001 | 19.2 | <0.0001 | 12.9 | <0.0001 | 16.9 | <0.0001 | 13.1 | <0.0001 |
| Total sugar | 24.3 | 0.0008 | 20.6 | 0.0005 | 21.9 | 0.003 | 14.4 | 0.005 | 22.5 | <0.0001 | 18.2 | <0.0001 |
| Added sugar | 10.4 | 0.20 | 6.3 | 0.35 | −2.6 | 0.78 | −10.8 | 0.17 | 4.4 | 0.37 | −0.3 | 0.93 |
| Dietary fiber | 27.4 | <0.0001 | 24.5 | <0.0001 | 36.9 | <0.0001 | 31.7 | <0.0001 | 30.9 | <0.0001 | 27.7 | <0.0001 |
| Total fat | −4.7 | 0.10 | −8.5 | 0.002 | −3.6 | 0.27 | −9.9 | <0.0001 | −4.7 | 0.02 | −8.9 | <0.0001 |
| Saturated fat | −1.3 | 0.69 | −5.3 | 0.09 | −0.3 | 0.94 | −6.9 | 0.002 | −1.3 | 0.59 | −5.7 | 0.01 |
| Protein | −0.8 | 0.72 | −3.6 | 0.08 | 5.2 | 0.34 | 0.4 | 0.92 | 1.1 | 0.72 | −2.1 | 0.32 |
| Calcium | 31.8 | <0.0001 | 28.7 | <0.0001 | 38.3 | <0.0001 | 32.2 | <0.0001 | 33.4 | <0.0001 | 29.9 | <0.0001 |
| Iron | 66.7 | <0.0001 | 63.5 | <0.0001 | 81.2 | <0.0001 | 74.3 | <0.0001 | 72 | <0.0001 | 68.4 | <0.0001 |
| Magnesium | 13.5 | 0.0006 | 10.9 | 0.0002 | 20.6 | 0.0002 | 15.5 | 0.0004 | 15.9 | <0.0001 | 12.8 | 0.0001 |
| Potassium | 12.6 | 0.0006 | 9.8 | 0.002 | 21.3 | <0.0001 | 16.3 | <0.0001 | 15.7 | <0.0001 | 12.6 | <0.0001 |
| Sodium | −6 | 0.02 | −8.9 | 0.002 | −0.3 | 0.95 | −5 | 0.12 | −4.2 | 0.14 | −7.5 | 0.001 |
| Zinc | 33.9 | <0.0001 | 30.8 | <0.0001 | 38.4 | <0.0001 | 32.6 | <0.0001 | 34.6 | <0.0001 | 31.1 | <0.0001 |
| Vitamin A | 85.6 | <0.0001 | 82.6 | <0.0001 | 55.9 | 0.0009 | 49.7 | 0.0003 | 72.7 | <0.0001 | 69.4 | <0.0001 |
| Thiamin | 38.6 | <0.0001 | 35.1 | <0.0001 | 39 | <0.0001 | 32.4 | <0.0001 | 38.1 | <0.0001 | 34.7 | <0.0001 |
| Riboflavin | 40.4 | <0.0001 | 37.2 | <0.0001 | 40.2 | <0.0001 | 33.9 | <0.0001 | 39.3 | <0.0001 | 35.4 | <0.0001 |
| Niacin | 17.2 | 0.0001 | 14.3 | 0.0002 | 29.3 | <0.0001 | 24.5 | <0.0001 | 21.4 | <0.0001 | 18.2 | <0.0001 |
| Vitamin B6 | 44.1 | <0.0001 | 41 | <0.0001 | 62.1 | <0.0001 | 57 | <0.0001 | 50.3 | <0.0001 | 47.7 | <0.0001 |
| Folate | 100.3 | <0.0001 | 96.6 | <0.0001 | 96.8 | <0.0001 | 90.1 | <0.0001 | 98.5 | <0.0001 | 94.7 | <0.0001 |
| Vitamin B12 | 73.6 | <0.0001 | 70.2 | <0.0001 | 99.2 | 0.003 | 88.3 | 0.001 | 81.1 | <0.0001 | 77 | <0.0001 |
| Vitamin C | 15.3 | 0.08 | 12.9 | 0.10 | 33.6 | 0.001 | 30.9 | 0.003 | 23.9 | 0.0003 | 21.6 | 0.001 |
| Vitamin D | 100.8 | <0.0001 | 97.3 | <0.0001 | 76.5 | <0.0001 | 68.1 | <0.0001 | 90.6 | <0.0001 | 86.3 | <0.0001 |
| Vitamin E | 19.2 | 0.06 | 15.6 | 0.12 | 13.9 | 0.03 | 7.9 | 0.12 | 16.5 | 0.02 | 12.6 | 0.07 |
| 18–54 Years | 55 Years or Older | 18 Years or Older | |||||||
|---|---|---|---|---|---|---|---|---|---|
| RTE Cereal Eaters (n = 449) | RTE Cereal Non-Eaters (n = 2650) | p2 | RTE Cereal Eaters (n = 382) | RTE Cereal Non-Eaters (n = 1682) | p2 | RTE Cereal Eaters (n = 831) | RTE Cereal Non-Eaters (n = 4332) | p2 | |
| Vitamin A | 5 ± 3% | 56 ± 3% | <0.0001 | 16 ± 4% | 55 ± 4% | <0.0001 | 9 ± 4% | 56 ± 0% | 0.002 |
| Thiamin | 0 ± 0% | 9 ± 2% | 0.0004 | 1 ± 1% | 15 ± 2% | <0.0001 | 0 ± 0% | 11 ± 1% | 0.0001 |
| Riboflavin | 0 ± 0% | 5 ± 1% | <0.0001 | 0 ± 0% | 4 ± 1% | <0.0001 | 0 ± 0% | 5 ± 1% | 0.0002 |
| Niacin | 0 ± 0% | 2 ± 0% | 0.003 | 0 ± 0% | 5 ± 2% | 0.007 | 0 ± 0% | 3 ± 1% | <0.0001 |
| Vitamin B6 | 0 ± 1% | 11 ± 1% | <0.0001 | 2 ± 2% | 34 ± 3% | <0.0001 | 1 ± 0% | 19 ± 2% | <0.0001 |
| Folate | 0 ± 0% | 17 ± 2% | <0.0001 | 0 ± 0% | 29 ± 3% | <0.0001 | 0 ± 3% | 21 ± 2% | <0.0001 |
| Vitamin B12 | 0 ± 0% | 7 ± 1% | <0.0001 | 0 ± 0% | 10 ± 3% | 0.004 | 0 ± 0% | 8 ± 1% | <0.0001 |
| Vitamin C | 40 ± 5% | 47 ± 3% | 0.21 | 32 ± 7% | 56 ± 3% | 0.005 | 35 ± 4% | 50 ± 2% | 0.003 |
| Vitamin D | 78 ± 11% | 98 ± 0% | 0.08 | 84 ± 4% | 98 ± 1% | 0.005 | 83 ± 0% | 98 ± 2% | <0.0001 |
| Calcium | 16 ± 4% | 39 ± 3% | 0.0001 | 41 ± 3% | 70 ± 3% | <0.0001 | 27 ± 3% | 50 ± 3% | <0.0001 |
| Iron | 0 ± 0% | 8 ± 2% | 0.0004 | 0 ± 0% | 2 ± 1% | 0.03 | 0 ± 1% | 5 ± 2% | <0.0001 |
| Zinc | 1 ± 1% | 17 ± 2% | <0.0001 | 8 ± 3% | 29 ± 3% | 0.0002 | 3 ± 1% | 21 ± 1% | <0.0001 |
| 18–54 Years | ≥55 Years | ≥18 Years | |||||||
|---|---|---|---|---|---|---|---|---|---|
| RTE Cereal Eaters (n = 449) | RTE Cereal Non-Eaters (n = 2650) | p2 | RTE Cereal Eaters (n = 382) | RTE Cereal Non-Eaters (n = 1682) | p2 | RTE Cereal Eaters (n = 831) | RTE Cereal Non-Eaters (n = 4332) | p2 | |
| Total dairy (cup eq.) | 2.06 ± 0.16 | 1.34 ± 0.13 | <0.0001 | 1.59 ± 0.13 | 1.02 ± 0.14 | <0.0001 | 1.86 ± 0.11 | 1.20 ± 0.09 | <0.0001 |
| Fluid milk (cup eq.) | 1.25 ± 0.09 | 0.47 ± 0.07 | <0.0001 | 1.10 ± 0.11 | 0.50 ± 0.16 | <0.0001 | 1.19 ± 0.04 | 0.48 ± 0.05 | <0.0001 |
| Total fruits (cup eq.) | 1.26 ± 0.15 | 0.89 ± 0.10 | 0.01 | 1.51 ± 0.14 | 0.97 ± 0.09 | 0.0003 | 1.35 ± 0.12 | 0.90 ± 0.07 | 0.0001 |
| Fruit juices (cup eq.) | 0.31 ± 0.07 | 0.27 ± 0.05 | 0.38 | 0.33 ± 0.06 | 0.24 ± 0.03 | 0.04 | 0.32 ± 0.04 | 0.25 ± 0.04 | 0.03 |
| Whole Fruit (cup eq.) | 0.95 ± 0.14 | 0.61 ± 0.07 | 0.02 | 1.18 ± 0.15 | 0.73 ± 0.08 | 0.003 | 1.03 ± 0.11 | 0.65 ± 0.06 | 0.0007 |
| Total vegetables 3 (cup eq.) | 1.38 ± 0.10 | 1.56 ± 0.12 | 0.08 | 1.52 ± 0.15 | 1.53 ± 0.13 | 0.91 | 1.43 ± 0.11 | 1.55 ± 0.11 | 0.11 |
| Total Protein Foods 3 (oz. eq.) | 6.36 ± 0.29 | 7.56 ± 0.15 | 0.0017 | 5.81 ± 0.19 | 6.62 ± 0.14 | 0.006 | 6.14 ± 0.21 | 7.19 ± 0.11 | 0.0008 |
| Total grains (oz. eq.) | 7.38 ± 0.22 | 6.91 ± 0.10 | 0.09 | 6.54 ± 0.21 | 6.13 ± 0.12 | 0.10 | 7.03 ± 0.26 | 6.57 ± 0.19 | 0.03 |
| Whole grains (oz. eq.) | 1.40 ± 0.15 | 0.70 ± 0.10 | <0.0001 | 1.60 ± 0.16 | 0.81 ± 0.15 | <0.0001 | 1.48 ± 0.11 | 0.74 ± 0.11 | <0.0001 |
| Refined grains (oz. eq.) | 5.97 ± 0.20 | 6.21 ± 0.11 | 0.27 | 4.94 ± 0.27 | 5.32 ± 0.14 | 0.25 | 5.55 ± 0.24 | 5.83 ± 0.21 | 0.19 |
| 18–54 Years | ≥55 Years | ≥18 Years | ||||||||
|---|---|---|---|---|---|---|---|---|---|---|
| Maximum Score | RTE Cereal Eaters (n = 449) | RTE Cereal Non-Eaters (n = 2650) | p2 | RTE Cereal Eaters (n = 382) | RTE Cereal Non-Eaters (n = 1682) | p2 | RTE Cereal Eaters (n = 831) | RTE Cereal Non-Eaters (n = 4332) | p2 | |
| Total vegetables | 5 | 2.8 ± 0.1 | 3.1 ± 0.1 | 0.05 | 3.3 ± 0.1 | 3.3 ± 0.1 | 0.87 | 3.0 ± 0.1 | 3.2 ± 0.0 | 0.10 |
| Greens and beans | 5 | 1.9 ± 0.1 | 1.8 ± 0.1 | 0.40 | 2.1 ± 0.2 | 1.8 ± 0.1 | 0.15 | 1.9 ± 0.1 | 1.8 ± 0.1 | 0.21 |
| Total fruits | 5 | 2.6 ± 0.1 | 1.9 ± 0.1 | 0.0001 | 3.2 ± 0.2 | 2.3 ± 0.1 | <0.0001 | 2.9 ± 0.1 | 2.0 ± 0.1 | <0.0001 |
| Whole fruit | 5 | 2.7 ± 0.2 | 1.6 ± 0.1 | 0.0001 | 3.3 ± 0.2 | 2.5 ± 0.1 | 0.001 | 2.9 ± 0.1 | 2.1 ± 0.1 | <0.0001 |
| Whole grains | 10 | 4.0 ± 0.2 | 1.9 ± 0.1 | <0.0001 | 4.9 ± 0.3 | 2.5 ± 0.1 | <0.0001 | 4.4 ± 0.1 | 2.1 ± 0.1 | <0.0001 |
| Dairy | 10 | 6.4 ± 0.2 | 4.3 ± 0.1 | <0.0001 | 5.9 ± 0.3 | 3.8 ± 0.1 | <0.0001 | 6.2 ± 0.2 | 4.1 ± 0.1 | <0.0001 |
| Total protein food | 5 | 4.0 ± 0.1 | 4.4 ± 0.0 | 0.02 | 4.3 ± 0.1 | 4.4 ± 0.1 | 0.52 | 4.1 ± 0.1 | 4.4 ± 0.0 | 0.05 |
| Seafood and plant proteins | 5 | 2.6 ± 0.1 | 2.3 ± 0.1 | 0.04 | 2.8 ± 0.1 | 2.6 ± 0.1 | 0.21 | 2.7 ± 0.1 | 2.4 ± 0.0 | 0.02 |
| Fatty acids | 10 | 4.5 ± 0.3 | 5.3 ± 0.1 | 0.03 | 5.0 ± 0.3 | 5.7 ± 0.2 | 0.02 | 4.7 ± 0.2 | 5.4 ± 0.1 | 0.004 |
| Sodium | 10 | 5.0 ± 0.3 | 3.9 ± 0.1 | 0.003 | 4.9 ± 0.2 | 4.1 ± 0.1 | 0.009 | 5.0 ± 0.2 | 4.0 ± 0.1 | 0.0004 |
| Refined grains | 10 | 6.2 ± 0.2 | 5.6 ± 0.1 | 0.04 | 6.5 ± 0.3 | 5.8 ± 0.2 | 0.05 | 6.4 ± 0.2 | 5.7 ± 0.1 | 0.02 |
| Saturated fat | 10 | 6.4 ± 0.3 | 5.8 ± 0.1 | 0.08 | 6.8 ± 0.3 | 6.1 ± 0.2 | 0.005 | 6.5 ± 0.2 | 5.9 ± 0.1 | 0.007 |
| Added sugar | 10 | 6.7 ± 0.3 | 6.9 ± 0.1 | 0.33 | 7.5 ± 0.3 | 7.4 ± 0.1 | 0.73 | 7.0 ± 0.2 | 7.1 ± 0.1 | 0.64 |
| Total HEI-2015 | 100 | 55.9 ± 1.0 | 49.1 ± 0.5 | <0.0001 | 60.6 ± 1.2 | 52.2 ± 0.7 | <0.0001 | 57.6 ± 0.9 | 50.1 ± 0.4 | <0.0001 |
© 2019 by the authors. Licensee MDPI, Basel, Switzerland. This article is an open access article distributed under the terms and conditions of the Creative Commons Attribution (CC BY) license (http://creativecommons.org/licenses/by/4.0/).
Share and Cite
Zhu, Y.; Jain, N.; Vanage, V.; Holschuh, N.; Agler, A.H.; Smith, J.D. Association between Ready-to-Eat Cereal Consumption and Nutrient Intake, Nutritional Adequacy, and Diet Quality in Adults in the National Health and Nutrition Examination Survey 2015–2016. Nutrients 2019, 11, 2952. https://doi.org/10.3390/nu11122952
Zhu Y, Jain N, Vanage V, Holschuh N, Agler AH, Smith JD. Association between Ready-to-Eat Cereal Consumption and Nutrient Intake, Nutritional Adequacy, and Diet Quality in Adults in the National Health and Nutrition Examination Survey 2015–2016. Nutrients. 2019; 11(12):2952. https://doi.org/10.3390/nu11122952
Chicago/Turabian StyleZhu, Yong, Neha Jain, Vipra Vanage, Norton Holschuh, Anne Hermetet Agler, and Jessica D. Smith. 2019. "Association between Ready-to-Eat Cereal Consumption and Nutrient Intake, Nutritional Adequacy, and Diet Quality in Adults in the National Health and Nutrition Examination Survey 2015–2016" Nutrients 11, no. 12: 2952. https://doi.org/10.3390/nu11122952
APA StyleZhu, Y., Jain, N., Vanage, V., Holschuh, N., Agler, A. H., & Smith, J. D. (2019). Association between Ready-to-Eat Cereal Consumption and Nutrient Intake, Nutritional Adequacy, and Diet Quality in Adults in the National Health and Nutrition Examination Survey 2015–2016. Nutrients, 11(12), 2952. https://doi.org/10.3390/nu11122952