Oxaliplatin-Fluoropyrimidine Combination (XELOX) Therapy Does Not Affect Plasma Amino Acid Levels and Plasma Markers of Oxidative Stress in Colorectal Cancer Surgery Patients: A Pilot Study


Abstract
1. Introduction
2. Materials and Methods
2.1. Population
2.2. Procedures
2.2.1. Amino Acids
2.2.2. Oxidative Stress Markers
- (a)
- 8-hydroxy-2’-deoxyguanosine. 8-OHdG is a ubiquitous marker of oxidative stress: it is a product of oxidatively damaged DNA formed by hydroxy radical, singlet oxygen and direct photodynamic action [24,25].Plasma levels of 8-OHdG were measured using the “Highly Sensitive 8-OHdG Check ELISA kit” (Japan Institute for the Control of Aging 710-1 Haruoka, Fukuroi City, Shizuoka Pref., 437-0122 Japan) according to the manufacturer’s instructions (normal value: 0.1–0.3 ng/mL). To assay properly, pre-treatment of plasma samples is needed for 8-OHdG detection: 8-OHdG ELISA kits may be affected by high-molecular weight substances (>10 kDa) such as protein. To separate these interfering substances, filtration of plasma using an ultrafilter (cut off molecular weight 10 kDa) is necessary (performed with “Microcon-10 kDa Centrifugal Filter Unit”; Merck Millipore, Darmstadt, Germany).
- (b)
- Malondialdehyde. MDA is a naturally occurring product of lipid peroxidation, a biomarker of oxidative stress; therefore, MDA is used as an indicator of oxidative stress. High plasma MDA levels indicate elevated oxidative stress, generally regarded as a pathological condition [26].Plasma levels of MDA were measured using the “Cayman’s TBARS Assay Kit” (Cayman Chemical Company, Ann Arbor, MI, USA) according to the manufacturer’s instructions (normal value: 1.86–3.94 µM).
2.3. Statistical Analysis
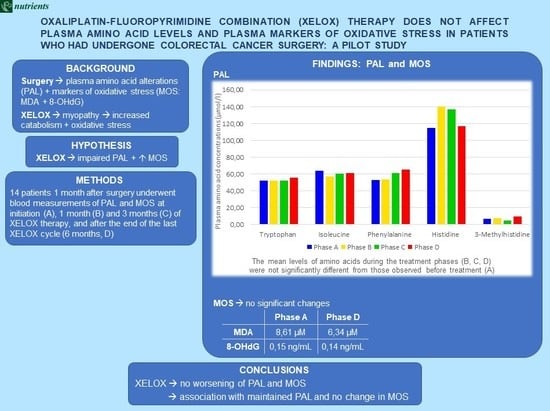
3. Results
3.1. PAL and MOS during XELOX Therapy
3.2. Correlations Between Circulating AAs and Markers of Oxidative Stress
4. Discussion
4.1. Plasma Amino Acids and Markers of Oxidative Stress during the XELOX Therapy Cycle
4.2. Correlations Between PAL and MOS
4.3. Potential Advantages for Patients of Maintenance of Plasma AAs during and after Chemotherapy
- Maintenance of overall anabolic activity and body composition, especially in muscle tissue, mainly in subjects with muscle depletion and physical deconditioning. These aspects reduce the risk of developing sarcopenia/cachexia;
- Maintenance of the proliferation and function of immune cells;
- Acceleration of wound healing processes;
- Limitation of the cellular formation of free radicals;
- Increased pain threshold due to a reduction in patients’ perception of pain: this effect is mainly related to the branched chain amino acids (BCAAs) leucine, valine and isoleucine. BCAAs activate the serotoninergic and histaminergic cerebral pathways whose precursors are the plasma AAs tryptophan and histidine, respectively [53].
5. Limitations and Future Studies
6. Conclusions
7. Some Useful Information for Nutritional Practice
- XELOX therapy did not seem to threaten the metabolism of AAs or to exalt oxidative stress unless patients reduce their nutritional intake. This means that chemotherapy per se did not cause malnutrition.
- Therefore, patients’ nutritional intake, particularly protein, should be monitored. Any loss of appetite and/or digestive troubles arising after surgery or during chemotherapy should be corrected/limited immediately.
- After surgery, patients awaiting chemotherapy should be informed about the importance of a diet with adequate protein-calories and antioxidant substances. Future studies will establish the usefulness of supplemented antioxidant substances.
Author Contributions
Funding
Acknowledgments
Conflicts of Interest
References
- World Health Organization. Cancer Today (powered by GLOBOCAN 2018). Available online: http://publications.iarc.fr/577 (accessed on 5 September 2019).
- Arnold, M.; Sierra, M.S.; Laversanne, M.; Soerjomataram, I.; Jemal, A.; Bray, F. Global patterns and trends in colorectal cancer incidence and mortality. Gut 2017, 66, 683–691. [Google Scholar] [CrossRef] [PubMed]
- Tokodai, K.; Narimatsu, H.; Nishida, A.; Takaya, K.; Hara, Y.; Kawagishi, N.; Hashizume, E.; Ohuchi, N. Risk factors for recurrence in stage II/III colorectal cancer patients treated with curative surgery: The impact of postoperative tumor markers and an infiltrative growth pattern. J. Surg. Oncol. 2016, 114, 368–374. [Google Scholar] [CrossRef] [PubMed]
- Watanabe, T.; Itabashi, M.; Shimada, Y.; Tanaka, S.; Ito, Y.; Ajioka, Y.; Hamaguchi, T.; Hyodo, I.; Igarashi, M.; Ishida, H.; et al. Japanese Society for Cancer of the Colon and Rectum. Japanese Society for Cancer of the Colon and Rectum (JSCCR) guidelines 2014 for treatment of colorectal cancer. Int. J. Clin. Oncol. 2015, 20, 207–239. [Google Scholar] [CrossRef]
- Xiao, Y.; Freeman, G.J. The microsatellite instable subset of colorectal cancer is a particularly good candidate for checkpoint blockade immunotherapy. Cancer Discov. 2015, 5, 16–18. [Google Scholar] [CrossRef]
- Gu, Y.; Chen, T.; Fu, S.; Sun, X.; Wang, L.; Wang, J.; Lu, Y.; Ding, S.; Ruan, G.; Teng, L.; et al. Perioperative dynamics and significance of amino acid profiles in patients with cancer. J. Transl. Med. 2015, 13, 35. [Google Scholar] [CrossRef]
- Ma, H.; Hasim, A.; Mamtimin, B.; Kong, B.; Zhang, H.P.; Sheyhidin, I. Plasma free amino acid profiling of esophageal cancer using high-performance liquid chromatography spectroscopy. World J. Gastroenterol. 2014, 20, 8653–8659. [Google Scholar] [CrossRef]
- Bener, A.; Dogan, M.; Abou Azab, I.; Rashed, A.; Siddiqui, M. Amino acid profiles among colorectal cancer patients. Biomed. Res. 2006, 17, 149–154. [Google Scholar]
- Leichtle, A.B.; Nuoffer, J.M.; Ceglarek, U.; Kase, J.; Conrad, T.; Witzigmann, H.; Thiery, J.; Fiedler, G.M. Serum amino acid profiles and their alterations in colorectal cancer. Metabolomics 2012, 8, 643–653. [Google Scholar] [CrossRef]
- Lee, H.O.; Uzzo, R.G.; Kister, D.; Kruger, W.D. Combination of serum histidine and plasma tryptophan as a potential biomarker to detect clear cell renal cell carcinoma. J. Transl. Med. 2017, 15, 72. [Google Scholar] [CrossRef]
- Katayama, K.; Higuchi, A.; Yamamoto, H.; Ikeda, A.; Kikuchi, S.; Shiozawa, M. Perioperative dynamics and significance of plasma-free amino acid profiles in colorectal cancer. BMC Surg. 2018, 18, 11. [Google Scholar] [CrossRef]
- Miyagi, Y.; Higashiyama, M.; Gochi, A.; Akaike, M.; Ishikawa, T.; Miura, T.; Saruki, N.; Bando, E.; Kimura, H.; Imamura, F.; et al. Plasma free amino acid profiling of five types of cancer patients and its application for early detection. PLoS ONE 2011, 6, e24143. [Google Scholar] [CrossRef]
- Ma, Y.L.; Liu, W.J.; Peng, J.Y.; Zhang, P.; Chen, H.Q.; Qin, H.L. Study on specific metabonomic profiling of serum from colorectal cancer patients by gas chromatography-mass spectrometry. Chin. J. Gastrointest. Surg. 2009, 12, 386–390. [Google Scholar]
- Okamoto, N.; Miyagi, Y.; Chiba, A.; Akaike, M.; Shiozawa, M.; Imaizumi, A.; Yamamoto, H.; Ando, T.; Yamakado, M. Diagnostic modeling with differences in plasma amino acid profiles between non-cachectic colorectal/breast cancer patients and healthy individuals. Int. J. Med. Med. Sci. 2009, 1, 1–8. [Google Scholar]
- Qiu, Y.; Cai, G.; Su, M.; Chen, T.; Zheng, X.; Xu, Y.; Ni, Y.; Zhao, A.; Xu, L.X.; Cai, S.; et al. Serum metabolite profiling of human colorectal cancer using GC-TOFMS and UPLC-QTOFMS. J. Proteome Res. 2009, 8, 4844–4850. [Google Scholar] [CrossRef]
- Sorensen, J.C.; Petersen, A.C.; Timpani, C.A.; Campelj, D.G.; Cook, J.; Trewin, A.J.; Stojanovska, V.; Stewart, M.; Hayes, A.; Rybalka, E. BGP-15 protects against oxaliplatin-induced skeletal myopathy and mitochondrial reactive oxygen species production in mice. Front. Pharmacol. 2017, 8, 137. [Google Scholar] [CrossRef]
- Feather, C.E.; Lees, J.G.; Makker, P.G.S.; Goldstein, D.; Kwok, J.B.; Moalem-Taylor, G.; Polly, P. Oxaliplatin induces muscle loss and muscle-specific molecular changes in mice. Muscle Nerve 2018, 57, 650–658. [Google Scholar] [CrossRef]
- Gilliam, L.A.; St Clair, D.K. Chemotherapy-induced weakness and fatigue in skeletal muscle: The role of oxidative stress. Antioxid. Redox Signal. 2011, 15, 2543–2563. [Google Scholar] [CrossRef]
- Cheregi, B.; Timpani, C.; Nurgali, K.; Hayes, A.; Rybalka, E. Chemotherapy-induced mitochondrial respiratory dysfunction, oxidant production and death in healthy skeletal muscle C2C12 myoblast and myotube models. Neuromuscul. Disord. 2015, 25, S202. [Google Scholar] [CrossRef]
- Stojanovska, V.; McQuade, R.M.; Stewart, M.; Timpani, C.A.; Sorensen, J.; Orbell, J.; Rybalka, E.; Nurgali, K. Platinum accumulation and changes in mitochondrial function of the longitudinal muscle & myenteric plexus following oxaliplatin administration. In Proceedings of the Event APS Annual Conference of the Australian Psychology Society, Hobart, Australia, 29 November–2 December 2015; pp. 46–91. [Google Scholar]
- McQuade, R.M.; Carbone, S.E.; Stojanovska, V.; Rahman, A.; Gwynne, R.M.; Robinson, A.M.; Goodman, C.A.; Bornstein, J.C.; Nurgali, K. Role of oxidative stress in oxaliplatin-induced enteric neuropathy and colonic dysmotility in mice. Br. J. Pharmacol. 2016, 173, 3502–3521. [Google Scholar] [CrossRef]
- Edge, S.B.; Compton, C.C. The American Joint Committee on Cancer: The 7th edition of the AJCC cancer staging manual and the future of TNM. Ann. Surg. Oncol. 2010, 17, 1471–1474. [Google Scholar] [CrossRef]
- Aquilani, R.; La Rovere, M.T.; Corbellini, D.; Pasini, E.; Verri, M.; Barbieri, A.; Condino, A.M.; Boschi, F. Plasma amino acid abnormalities in chronic heart failure. Mechanisms, potential risks and targets in human myocardium metabolism. Nutrients 2017, 9, 1251. [Google Scholar] [CrossRef]
- Hsieh, Y.W.; Lin, K.C.; Korivi, M.; Lee, T.H.; Wu, C.Y.; Wu, K.Y. The reliability and predictive ability of a biomarker of oxidative DNA damage on functional outcomes after stroke rehabilitation. Int. J. Mol. Sci. 2014, 15, 6504–6516. [Google Scholar] [CrossRef]
- Dąbrowska, N.; Wiczkowski, A. Analytics of oxidative stress markers in the early diagnosis of oxygen DNA damage. Adv. Clin. Exp. Med. 2017, 26, 155–166. [Google Scholar] [CrossRef]
- Tsikas, D. Assessment of lipid peroxidation by measuring malondialdehyde (MDA) and relatives in biological samples: Analytical and biological challenges. Anal. Biochem. 2017, 524, 13–30. [Google Scholar] [CrossRef]
- Yeh, D.D.; Johnson, E.; Harrison, T.; Kaafarani, H.M.A.; Lee, J.; Fagenholz, P.; Saillant, N.; Chang, Y.; Velmahos, G. Serum levels of albumin and prealbumin do not correlate with nutrient delivery in surgical intensive care unit patients. Nutr. Clin. Pract. 2018, 33, 419–425. [Google Scholar] [CrossRef]
- Hou, Y.; Yin, M.; Sun, F.; Zhang, T.; Zhou, X.; Li, H.; Zheng, J.; Chen, X.; Li, C.; Ning, X.; et al. metabolomics approach for predicting the response to neoadjuvant chemotherapy in cervical cancer patients. Mol. Biosyst. 2014, 10, 2126–2133. [Google Scholar] [CrossRef]
- Blommaart, E.F.; Luiken, J.J.; Meijer, A.J. Autophagic proteolysis: Control and specificity. Histochem. J. 1997, 29, 365–385. [Google Scholar] [CrossRef]
- Bhattacharjee, S.; Nandi, S. Choices have consequences: The nexus between DNA repair pathways and genomic instability in cancer. Clin. Transl. Med. 2016, 5, 45. [Google Scholar] [CrossRef]
- Bhattacharjee, S.; Nandi, S. DNA damage response and cancer therapeutics through the lens of the Fanconi Anemia DNA repair pathway. Cell Commun. Signal. 2017, 15, 41. [Google Scholar] [CrossRef]
- Bhattacharjee, S.; Nandi, S. Synthetic lethality in DNA repair network: A novel avenue in targeted cancer therapy and combination therapeutics. IUBMB Life 2017, 69, 929–937. [Google Scholar] [CrossRef]
- Ghosh, D.; Nandi, S.; Bhattacharjee, S. Combination therapy to checkmate glioblastoma: Clinical challenges and advances. Clin. Transl. Med. 2018, 7, 33. [Google Scholar] [CrossRef]
- Bhattacharjee, S.; Nandi, S. Rare genetic diseases with defects in DNA repair: Opportunities and challenges in orphan drug development for targeted cancer therapy. Cancers 2018, 10, 298. [Google Scholar] [CrossRef]
- Mantovani, G.; Macciò, A.; Madeddu, C.; Massa, E. Cancer-related cachexia and oxidative stress: Beyond current therapeutic options. Expert Rev. Anticancer Ther. 2003, 3, 381–392. [Google Scholar] [CrossRef]
- Reid, M.B. Invited Review: Redox modulation of skeletal muscle contraction: What we know and what we don’t. J. Appl. Physiol. 2001, 90, 724–731. [Google Scholar] [CrossRef]
- Jackson, M.J.; Pye, D.; Palomero, J. The production of reactive oxygen and nitrogen species by skeletal muscle. J. Appl. Physiol. 2007, 102, 1664–1670. [Google Scholar] [CrossRef]
- Weimann, A.; Braga, M.; Carli, F.; Higashiguchi, T.; Hübner, M.; Klek, S.; Laviano, A.; Ljungqvist, O.; Lobo, D.N.; Martindale, R.; et al. ESPEN guideline: Clinical nutrition in surgery. Clin. Nutr. 2017, 36, 623–650. [Google Scholar] [CrossRef]
- Lee, H.T.; Lin, C.S.; Lee, C.S.; Tsai, C.Y.; Wei, Y.H. Increased 8-hydroxy-2’-deoxyguanosine in plasma and decreased mRNA expression of human 8-oxoguanine DNA glycosylase 1, anti-oxidant enzymes, mitochondrial biogenesis-related proteins and glycolytic enzymes in leucocytes in patients with systemic lupus erythematosus. Clin. Exp. Immunol. 2014, 176, 66–77. [Google Scholar] [CrossRef]
- Kasai, H. Chemistry-based studies on oxidative DNA damage: Formation, repair, and mutagenesis. Free Radic. Biol. Med. 2002, 33, 450–456. [Google Scholar] [CrossRef]
- Preston, T.J.; Henderson, J.T.; McCallum, G.P.; Wells, P.G. Base excision repair of reactive oxygen species-initiated 7,8-dihydro-8-oxo-2′-deoxyguanosine inhibits the cytotoxicity of platinum anticancer drugs. Mol. Cancer Ther. 2009, 8, 2015–2026. [Google Scholar] [CrossRef]
- Sorensen, J.C.; Cheregi, B.D.; Timpani, C.A.; Nurgali, K.; Hayes, A.; Rybalka, E. Mitochondria: Inadvertent targets in chemotherapy-induced skeletal muscle toxicity and wasting? Cancer Chemother. Pharmacol. 2016, 78, 673–683. [Google Scholar] [CrossRef]
- Botsen, D.; Ordan, M.A.; Barbe, C.; Mazza, C.; Perrier, M.; Moreau, J.; Brasseur, M.; Renard, Y.; Taillière, B.; Slimano, F.; et al. Dynapenia could predict chemotherapy-induced dose-limiting neurotoxicity in digestive cancer patients. BMC Cancer 2018, 18, 955. [Google Scholar] [CrossRef] [PubMed]
- Tabata, A.; Kanai, M.; Horimatsu, T.; Tsuboyama, T.; Matsushima, K.; Kato, T. Changes in upper extremity function, ADL, and HRQoL in colorectal cancer patients after the first chemotherapy cycle with oxaliplatin: A prospective single-center observational study. Support. Care Cancer 2018, 26, 2397–2405. [Google Scholar] [CrossRef] [PubMed]
- Luo, Y.; Yoneda, J.; Ohmori, H.; Sasaki, T.; Shimbo, K.; Eto, S.; Kato, Y.; Miyano, H.; Kobayashi, T.; Sasahira, T.; et al. Cancer usurps skeletal muscle as an energy repository. Cancer Res. 2014, 74, 330–340. [Google Scholar] [CrossRef] [PubMed]
- Morifuji, M.; Ishizaka, M.; Baba, S.; Fukuda, K.; Matsumoto, H.; Koga, J.; Kanegae, M.; Higuchi, M. Comparison of different sources and degrees of hydrolysis of dietary protein: Effect on plasma amino acids, dipeptides, and insulin responses in human subjects. J. Agric. Food Chem. 2010, 58, 8788–8797. [Google Scholar] [CrossRef] [PubMed]
- Hammer, J.A., 3rd; Rannels, D.E. Protein turnover in pulmonary macrophages. Utilization of amino acids derived from protein degradation. Biochem. J. 1981, 198, 53–65. [Google Scholar] [CrossRef]
- Cucca, A.; Mazzucco, S.; Bursomanno, A.; Antonutti, L.; Di Girolamo, F.G.; Pizzolato, G.; Koscica, N.; Gigli, G.L.; Catalan, M.; Biolo, G. Amino acid supplementation in l-dopa treated Parkinson’s disease patients. Clin. Nutr. 2015, 34, 1189–1194. [Google Scholar] [CrossRef]
- Kaplan, P.; Matejovicova, M.; Herijgers, P.; Flameng, W. Effect of free radical scavengers on myocardial function and Na+, K+-ATPase activity in stunned rabbit myocardium. Scand. Cardiovasc. J. 2005, 39, 213–219. [Google Scholar] [CrossRef]
- Vincenzi, B.; Daniele, S.; Frezza, A.M.; Berti, P.; Vespasiani, U.; Picardi, A.; Tonini, G. The role of S-adenosylmethionine in preventing oxaliplatin-induced liver toxicity: A retrospective analysis in metastatic colorectal cancer patients treated with bevacizumab plus oxaliplatin-based regimen. Support. Care Cancer 2012, 20, 135–139. [Google Scholar] [CrossRef]
- Gamelin, L.; Capitain, O.; Morel, A.; Dumont, A.; Traore, S.; le Anne, B.; Gilles, S.; Boisdron-Celle, M.; Gamelin, E. Predictive factors of oxaliplatin neurotoxicity: The involvement of the oxalate outcome pathway. Clin. Cancer Res. 2007, 13, 6359–6368. [Google Scholar] [CrossRef]
- Milano, G.; Etienne-Grimaldi, M.C.; Mari, M.; Lassalle, S.; Formento, J.L.; Francoual, M.; Lacour, J.P.; Hofman, P. Candidate mechanisms for capecitabine-related hand-foot syndrome. Br. J. Clin. Pharmacol. 2008, 66, 88–95. [Google Scholar] [CrossRef]
- García-Espinosa, M.A.; Wallin, R.; Hutson, S.M.; Sweatt, A.J. Widespread neuronal expression of branched-chain aminotransferase in the CNS: Implications for leucine/glutamate metabolism and for signaling by amino acids. J. Neurochem. 2007, 100, 1458–1468. [Google Scholar] [CrossRef] [PubMed]
- Young, V.R.; Marchini, J.S. Mechanisms and nutritional significance of metabolic responses to altered intakes of protein and amino acids, with reference to nutritional adaptation in humans. Am. J. Clin. Nutr. 1990, 51, 270–289. [Google Scholar] [CrossRef] [PubMed]
- Barnes, T.; Bell, K.; DiSebastiano, K.M.; Vance, V.; Hanning, R.; Russell, C.; Dubin, J.A.; Bahl, M.; Califaretti, N.; Campbell, C.; et al. Plasma amino acid profiles of breast cancer patients early in the trajectory of the disease differ from healthy comparison groups. Appl. Physiol. Nutr. Metab. 2014, 39, 740–744. [Google Scholar] [CrossRef] [PubMed]
- Rothschild, M.A.; Oratz, M.; Mongelli, J.; Fishman, L.; Schreiber, S.S. Amino acid regulation of albumin synthesis. J. Nutr. 1969, 98, 395–403. [Google Scholar] [CrossRef] [PubMed]
- Aquilani, R.; Maestri, R.; Boselli, M.; Achilli, M.P.; Arrigoni, N.; Bruni, M.; Dossena, M.; Verri, M.; Buonocore, D.; Pasini, E.; et al. The relationship between plasma amino acids and circulating albumin and haemoglobin in postabsorptive stroke patients. PLoS ONE 2019, 14, e0219756. [Google Scholar] [CrossRef] [PubMed]
- Cusick, P.K.; Koehler, K.M.; Ferrier, B.; Haskell, B.E. The neurotoxicity of valine deficiency in rats. J. Nutr. 1978, 108, 1200–1206. [Google Scholar] [CrossRef] [PubMed]
- Cederholm, T.; Bosaeus, I.; Barazzoni, R.; Bauer, J.; Van Gossum, A.; Klek, S.; Muscaritoli, M.; Nyulasi, I.; Ockenga, J.; Schneider, S.M.; et al. Diagnostic criteria for malnutrition—An ESPEN Consensus Statement. Clin. Nutr. 2015, 34, 335–340. [Google Scholar] [CrossRef]
- Arends, J.; Bachmann, P.; Baracos, V.; Barthelemy, N.; Bertz, H.; Bozzetti, F.; Fearon, K.; Hütterer, E.; Isenring, E.; Kaasa, S.; et al. ESPEN guidelines on nutrition in cancer patients. Clin. Nutr. 2017, 36, 11–48. [Google Scholar] [CrossRef]
- Arends, J.; Baracos, V.; Bertz, H.; Bozzetti, F.; Calder, P.C.; Deutz, N.E.P.; Erickson, N.; Laviano, A.; Lisanti, M.P.; Lobo, D.N.; et al. ESPEN expert group recommendations for action against cancer-related malnutrition. Clin. Nutr. 2017, 36, 1187–1196. [Google Scholar] [CrossRef]

| Patients (n = 14) | Differentiation Grades | MAC/TNM Staging Classification [22] |
|---|---|---|
| 1 | G2 | C2/pT3pN1a |
| 2 | G3 | C2/pT4apN2b |
| 3 | G2/G3 | C2/pT4apN1b |
| 4 | G3 | C2/pTapN2b |
| 5 | G2/G3 | C2/pT2pN1b |
| 6 | G3 | C2/pT4apN2b |
| 7 | G3 | C2/pT4apN0 |
| 8 | G3 | C3/pT4bpN2b |
| 9 | G2 | C2/pT2pN2a |
| 10 | G2 | B2/pT4apN0 |
| 11 | G2 | C2/pT3N1b |
| 12 | G2 | C2/pT3pN1b |
| 13 | G2 and G3 in some areas | B2/pT4apN0 |
| 14 | G2 | C2/pT4pN1A |
| Variable | Patients Phase A (n = 14) | Patients Phase B (n = 14) | Patients Phase C (n = 14) | Patients Phase D (n = 14) | FDR Adjusted p |
|---|---|---|---|---|---|
| Age (years) | 58.69 ± 9.50 | - | - | - | - |
| Male/female | 11/3 | - | - | - | - |
| Body weight (kg) | 68.13 ± 11.36 | 68.33 ± 11.68 | 69.27 ± 11.84 | 69.50 ± 10.80 | 0.17 |
| Body mass index (kg/m2) | 22.82 ± 3.93 | 22.87 ± 3.98 | 23.19 ± 4.07 | 23.30 ± 4.10 | 0.17 |
| Albumin (NV 3500–5200 mg/dL) | 3042.89 ± 1713.92 | 2897.37 ± 1563.60 | 2885.35 ± 1595.51 | 3200.00 ± 800.00 | 0.73 |
| Creatinine (NV: M 0.73–1.18 mg/dL; F 0.55–1.02 mg/dL) | 0.84 ± 0.25 | 0.82 ± 0.23 | 0.83 ± 0.22 | 0.85 ± 0.21 | 0.90 |
| Hemoglobin (NV: M 13.2–17.3 g/dL; F 11.7–15.5 g/dL) | 12.36 ± 1.51 | 12.40 ± 1.10 | 12.76 ± 0.96 | 12.60 ± 0.94 | 0.73 |
| Red blood cell count (NV: M 4.30–5.70 × 10⁶/μL; F 3.80–5.20 × 10⁶/μL) | 4.38 ± 0.44 | 4.02 ± 0.32 | 3.99 ± 0.41 | 3.85 ± 0.61 | 0.11 |
| Hematocrit (NV: M 39.0%–49.0%; F 35.0%–45.0%) | 37.64 ± 3.65 | 37.27 ± 2.74 | 38.54 ± 3.29 | 37.20 ± 3.10 | 0.73 |
| Mean corpuscular volume (NV 82.0–98.0 fL) | 86.16 ± 7.10 | 92.90 ± 5.69 | 97.14 ± 7.48 | 104.00 ± 8.50 | 0.007 |
| Mean hemoglobin content (NV 27.0–32.0 pg) | 28.27± 2.98 | 30.89 ± 2.09 | 32.20 ± 2.87 | 31.90 ± 2.50 | 0.009 |
| White blood cell count (NV 4.00–10.00 × 10³/μL) | 6.50 ± 1.24 | 4.74 ± 0.94 | 5.23 ± 1.63 | 5.70 ± 2.00 | 0.009 |
| Neutrophil count (NV 2.0–8.0 × 10³/μL) | 4.26 ± 0.85 | 2.43 ± 0.60 | 2.88 ± 1.42 | 2.75 ± 1.80 | 0.003 |
| Lymphocyte count (NV 1.5–4.0 × 10³/μL) | 1.44 ± 0.40 | 1.47 ± 0.42 | 1.44 ± 0.49 | 1.51 ± 0.51 | 0.97 |
| Monocyte count (NV 0.1–1.0 × 10³/μL) | 0.57 ± 0.13 | 0.69 ± 0.15 | 0.71 ± 0.11 | 0.68 ± 0.15 | 0.09 |
| Eosinophil count (NV 0.1–0.5 × 10³/μL) | 0.23 ± 0.10 | 0.18 ± 0.04 | 0.20 ± 0.09 | 0.22 ± 0.06 | 0.47 |
| Basophil count (NV 0.0–0.2 × 10³/μL) | 0.03 ± 0.05 | 0.03 ± 0.05 | 0.02 ± 0.04 | 0.02 ± 0.03 | 0.90 |
| Platelet count (NV 150–450 × 103/μL) | 319.86 ± 161.67 | 160.86 ± 43.83 | 147.71 ± 63.93 | 139.80 ± 66.10 | 0.018 |
| Total bilirubin (NV 0.20–1.10 mg/dL) | 0.43 ± 0.25 | 0.77 ± 0.45 | 0.74 ± 0.24 | 0.77 ± 0.31 | 0.08 |
| γ-glutamyl transpeptidase (NV 11–53 mU/mL) | 39.00 ± 20.99 | 61.29 ± 57.79 | 79.43 ± 77.32 | 81.70 ± 64.91 | 0.17 |
| Alanine transaminase (NV 11–34 mU/mL) | 19.14 ± 9.86 | 34.71 ± 30.60 | 23.57 ± 11.12 | 25.64 ± 10.80 | 0.20 |
| Aspartate transaminase (NV 11–39 mU/mL) | 18.40 ± 11.59 | 31.40 ± 19.81 | 29.40 ± 17.53 | 28.90 ± 15.81 | 0.18 |
| Amino Acids (µmol/L) | Patients Phase A (n = 14) | Patients Phase B (n = 14) | Patients Phase C (n = 14) | Patients Phase D (n = 14) | FDR Adjusted p |
|---|---|---|---|---|---|
| Aspartic acid | 8.53 ± 3.34 | 7.55 ± 3.72 | 7.65 ± 3.95 | 12.78 ± 16.31 | 0.94 |
| Glutamic acid | 142.43 ± 28.75 | 149.85 ± 30.14 | 142.25 ± 42.79 | 184.17 ± 144.07 | 0.94 |
| Asparagine | 52.73 ± 19.59 | 47.69 ± 13.58 | 51.88 ± 21.85 | 50.55 ± 24.38 | 0.94 |
| Serine | 43.79 ± 11.52 | 41.68 ± 13.39 | 40.78 ± 13.23 | 49.85 ± 41.59 | 0.94 |
| Glutamine | 292.37 ± 123.43 | 326.82 ± 159.97 | 326.04 ± 156.35 | 245.50 ± 97.45 | 0.94 |
| Histidine | 114.56 ± 37.87 | 140.30 ± 48.48 | 136.76 ± 44.46 | 117.03 ± 48.34 | 0.94 |
| Glycine | 127.95 ± 52.00 | 148.58 ± 42.82 | 144.60 ± 45.52 | 163.99 ± 112.55 | 0.94 |
| Threonine | 84.88 ± 25.60 | 86.84 ± 25.22 | 82.90 ± 23.02 | 83.01 ± 28.20 | 0.94 |
| Alanine | 343.67 ± 95.03 | 357.68 ± 120.91 | 360.62 ± 181.10 | 270.43 ± 87.53 | 0.94 |
| Arginine | 62.83 ± 17.91 | 58.67 ± 21.86 | 45.01 ± 16.65 | 55.75 ± 15.38 | 0.90 |
| Tyrosine | 58.50 ± 15.80 | 51.34 ± 16.16 | 59.99 ± 28.36 | 55.92 ± 15.34 | 0.94 |
| Tryptophan | 52.06 ± 13.23 | 51.77 ± 16.24 | 51.86 ± 17.44 | 55.22 ± 22.02 | 0.94 |
| Phenylalanine | 52.54 ± 11.16 | 53.31 ± 9.54 | 60.86 ± 23.55 | 65.41 ± 31.39 | 0.94 |
| Isoleucine | 63.74 ± 15.03 | 56.63 ± 18.68 | 60.54 ± 27.46 | 60.79 ± 22.63 | 0.94 |
| Leucine | 103.52 ± 28.66 | 84.32 ± 32.38 | 87.35 ± 48.30 | 78.09 ± 34.62 | 0.94 |
| Lysine | 118.78 ± 37.44 | 126.95 ± 58.45 | 115.35 ± 65.11 | 120.83 ± 51.83 | 0.94 |
| 3-methyl-histidine | 6.82 ± 5.88 | 7.49 ± 3.60 | 4.69 ± 1.95 | 9.55 ± 10.03 | 0.94 |
| Valine | 193.67 ± 48.69 | 169.30 ± 58.48 | 173.26 ± 87.61 | 241.16 ± 244.45 | 0.94 |
| Cystine | 187.18 ± 72.12 | 195.89 ± 46.64 | 189.64 ± 58.93 | 453.50 ± 866.46 | 0.94 |
| Methionine | 26.96 ± 7.88 | 26.70 ± 8.41 | 30.03 ± 12.68 | 62.15 ± 110.12 | 0.94 |
| EAAs | 696.14 ± 159.57 | 655.81 ± 197.81 | 662.15 ± 281.50 | 766.66 ± 450.02 | 0.94 |
| BCAAs | 360.93 ± 90.40 | 310.24 ± 107.67 | 321.15 ± 162.01 | 380.04 ± 245.80 | 0.94 |
| BCAAs/EAAs | 51.73 ± 3.32 | 46.68 ± 6.20 | 47.43 ± 4.41 | 48.62 ± 3.55 | 0.017 |
| TAAs | 2254.17 ± 492.07 | 2187.87 ± 578.23 | 2171.13 ± 723.92 | 2433.77 ± 1538.81 | 0.94 |
| Amino Acids | AA % TAAs Patients - Phase A (n = 14) | AA % TAAs Patients - Phase B (n = 14) | AA % TAAs Patients - Phase C (n = 14) | AA % TAAs Patients - Phase D (n = 14) | FDR Adjusted p |
|---|---|---|---|---|---|
| Aspartic acid | 0.41 ± 0.18 | 0.34 ± 0.17 | 0.34 ± 0.13 | 0.44 ± 0.18 | 0.34 |
| Glutamic acid | 6.82 ± 1.42 | 7.02 ± 1.16 | 6.80 ± 1.81 | 7.35 ± 1.61 | 0.53 |
| Asparagine | 2.50 ± 0.90 | 2.20 ± 0.40 | 2.41 ± 0.71 | 2.17 ± 0.47 | 0.47 |
| Serine | 2.06 ± 0.38 | 1.91 ± 0.33 | 1.90 ± 0.35 | 1.94 ± 0.40 | 0.20 |
| Glutamine | 13.40 ± 3.95 | 14.43 ± 4.59 | 14.68 ± 4.40 | 11.93 ± 4.86 | 0.34 |
| Histidine | 5.38 ± 1.47 | 6.51 ± 1.86 | 6.56 ± 1.94 | 5.86 ± 2.46 | 0.20 |
| Glycine | 5.92 ± 1.54 | 6.87 ± 1.64 | 6.85 ± 1.99 | 6.59 ± 1.34 | 0.20 |
| Threonine | 3.96 ± 0.81 | 4.00 ± 0.91 | 3.97 ± 0.92 | 3.95 ± 1.44 | 1.00 |
| Alanine | 16.01 ± 1.96 | 16.22 ± 2.16 | 16.08 ± 2.78 | 13.69 ± 5.02 | 0.34 |
| Arginine | 3.02 ± 0.94 | 2.69 ± 0.68 | 2.16 ± 0.86 | 2.66 ± 1.12 | 0.028 |
| Tyrosine | 2.78 ± 0.65 | 2.35 ± 0.51 | 2.70 ± 0.65 | 2.63 ± 0.89 | 0.47 |
| Tryptophan | 2.47 ± 0.54 | 2.36 ± 0.37 | 2.40 ± 0.29 | 2.42 ± 0.40 | 1.00 |
| Phenylalanine | 2.49 ± 0.36 | 2.49 ± 0.37 | 2.80 ± 0.42 | 2.81 ± 0.47 | 0.062 |
| Isoleucine | 2.99 ± 0.32 | 2.59 ± 0.58 | 2.74 ± 0.50 | 2.69 ± 0.53 | 0.34 |
| Leucine | 4.85 ± 0.80 | 3.83 ± 1.07 | 3.89 ± 1.01 | 3.96 ± 1.70 | 0.20 |
| Lysine | 5.60 ± 1.49 | 5.75 ± 1.78 | 5.20 ± 1.67 | 5.36 ± 1.65 | 0.47 |
| 3-methyl-histidine | 0.31 ± 0.29 | 0.34 ± 0.17 | 0.22 ± 0.12 | 0.33 ± 0.14 | 0.48 |
| Valine | 9.13 ± 1.48 | 7.71 ± 1.76 | 7.78 ± 1.54 | 8.98 ± 2.40 | 0.20 |
| Cystine | 8.67 ± 2.09 | 9.23 ± 2.57 | 9.17 ± 3.10 | 12.49 ± 11.20 | 0.50 |
| Methionine | 1.27 ± 0.30 | 1.22 ± 0.24 | 1.38 ± 0.27 | 1.82 ± 1.35 | 0.34 |
| EAAs | 32.76 ± 3.99 | 29.95 ± 4.49 | 30.16 ± 3.98 | 31.99 ± 4.61 | 0.21 |
| BCAAs | 16.97 ± 2.46 | 14.13 ± 3.28 | 14.41 ± 2.90 | 15.63 ± 2.99 | 0.028 |
| Patients Phase A (n = 14) | Patients Phase B (n = 14) | Patients Phase C (n = 14) | Patients Phase D (n = 14) | FDR Adjusted p | |
|---|---|---|---|---|---|
| MDA (NV 1.86–3.94 µM) | 8.61 ± 3.03 | 7.68 ± 2.67 | 7.32 ± 2.40 | 6.34 ± 1.62 | 0.21 |
| 8-OHdG (NV 0.1–0.3 ng/mL) | 0.15 ± 0.03 | 0.16 ± 0.02 | 0.14 ± 0.03 | 0.14 ± 0.01 | 0.41 |
| Amino Acids | vs. MDA | |
|---|---|---|
| r | p | |
| Aspartic acid | −0.53 | 0.044 |
| Glutamic acid | −0.47 | 0.08 |
| Asparagine | −0.23 | 0.41 |
| Serine | −0.49 | 0.061 |
| Glutamine | 0.07 | 0.79 |
| Histidine | 0.67 | 0.006 |
| Glycine | −0.33 | 0.23 |
| Threonine | −0.05 | 0.86 |
| Alanine | 0.46 | 0.09 |
| Arginine | −0.08 | 0.78 |
| Tyrosine | 0.11 | 0.69 |
| Tryptophan | −0.15 | 0.58 |
| Phenylalanine | −0.49 | 0.064 |
| Isoleucine | −0.40 | 0.14 |
| Leucine | 0.31 | 0.26 |
| Lysine | −0.31 | 0.26 |
| 3-methyl-histidine | −0.50 | 0.08 |
| Valine | −0.53 | 0.041 |
| Cystine | −0.52 | 0.046 |
| Methionine | −0.52 | 0.048 |
| EAAs | 0.49 | 0.066 |
| BCAAs | 0.26 | 0.34 |
| NEAAs | 0.46 | 0.08 |
| TAAs | 0.18 | 0.52 |
| Amino acids | vs. MDA | |
|---|---|---|
| r | p | |
| Aspartic acid | −0.07 | 0.81 |
| Glutamic acid | −0.01 | 0.98 |
| Asparagine | −0.03 | 0.90 |
| Serine | −0.15 | 0.58 |
| Glutamine | −0.44 | 0.09 |
| Histidine | −0.14 | 0.61 |
| Glycine | −0.11 | 0.68 |
| Threonine | −0.48 | 0.062 |
| Alanine | −0.30 | 0.26 |
| Arginine | −0.40 | 0.13 |
| Tyrosine | −0.42 | 0.11 |
| Tryptophan | −0.40 | 0.13 |
| Phenylalanine | −0.21 | 0.43 |
| Isoleucine | −0.38 | 0.15 |
| Leucine | −0.28 | 0.29 |
| Lysine | −0.35 | 0.18 |
| 3-methyl-histidine | −0.16 | 0.59 |
| Valine | −0.13 | 0.64 |
| Cystine | −0.02 | 0.94 |
| Methionine | −0.04 | 0.89 |
| EAAs | −0.29 | 0.28 |
| BCAAs | −0.34 | 0.20 |
| NEAAs | −0.31 | 0.25 |
| TAAs | −0.58 | 0.020 |
© 2019 by the authors. Licensee MDPI, Basel, Switzerland. This article is an open access article distributed under the terms and conditions of the Creative Commons Attribution (CC BY) license (http://creativecommons.org/licenses/by/4.0/).
Share and Cite
Aquilani, R.; Brugnatelli, S.; Dossena, M.; Maestri, R.; Delfanti, S.; Buonocore, D.; Boschi, F.; Simeti, E.; Condino, A.M.; Verri, M. Oxaliplatin-Fluoropyrimidine Combination (XELOX) Therapy Does Not Affect Plasma Amino Acid Levels and Plasma Markers of Oxidative Stress in Colorectal Cancer Surgery Patients: A Pilot Study. Nutrients 2019, 11, 2667. https://doi.org/10.3390/nu11112667
Aquilani R, Brugnatelli S, Dossena M, Maestri R, Delfanti S, Buonocore D, Boschi F, Simeti E, Condino AM, Verri M. Oxaliplatin-Fluoropyrimidine Combination (XELOX) Therapy Does Not Affect Plasma Amino Acid Levels and Plasma Markers of Oxidative Stress in Colorectal Cancer Surgery Patients: A Pilot Study. Nutrients. 2019; 11(11):2667. https://doi.org/10.3390/nu11112667
Chicago/Turabian StyleAquilani, Roberto, Silvia Brugnatelli, Maurizia Dossena, Roberto Maestri, Sara Delfanti, Daniela Buonocore, Federica Boschi, Elena Simeti, Anna Maria Condino, and Manuela Verri. 2019. "Oxaliplatin-Fluoropyrimidine Combination (XELOX) Therapy Does Not Affect Plasma Amino Acid Levels and Plasma Markers of Oxidative Stress in Colorectal Cancer Surgery Patients: A Pilot Study" Nutrients 11, no. 11: 2667. https://doi.org/10.3390/nu11112667
APA StyleAquilani, R., Brugnatelli, S., Dossena, M., Maestri, R., Delfanti, S., Buonocore, D., Boschi, F., Simeti, E., Condino, A. M., & Verri, M. (2019). Oxaliplatin-Fluoropyrimidine Combination (XELOX) Therapy Does Not Affect Plasma Amino Acid Levels and Plasma Markers of Oxidative Stress in Colorectal Cancer Surgery Patients: A Pilot Study. Nutrients, 11(11), 2667. https://doi.org/10.3390/nu11112667