Article

Metagenomic Insights into the Effects of Fructooligosaccharides (FOS) on the Composition of Luminal and Mucosal Microbiota in C57BL/6J Mice, Especially the Bifidobacterium Composition

1
State Key Laboratory of Food Science and Technology, Jiangnan University, Wuxi 214122, China
2
School of Food Science and Technology, Jiangnan University, Wuxi 214122, China
3
National Engineering Research Center for Functional Food, Jiangnan University, Wuxi 214122, China
4
Beijing Innovation Center of Food Nutrition and Human Health, Beijing Technology and Business University (BTBU), Beijing 100048, China
*
Author to whom correspondence should be addressed.
Nutrients 2019, 11(10), 2431; https://doi.org/10.3390/nu11102431
Submission received: 30 August 2019 / Revised: 8 October 2019 / Accepted: 9 October 2019 / Published: 12 October 2019

Abstract

:
Fructooligosaccharides (FOS) are considered prebiotics and have been proven to selectively promote the growth of Bifidobacterium in the gut. This study aimed to clarify the effects of FOS intake on the composition of luminal and mucosal microbiota in mice. Briefly, mice were fed a 0% or 25% FOS (w/w)-supplemented diet for four weeks, and the composition of luminal and mucosal microbiota, especially the Bifidobacterium, was analyzed by sequencing the V3–V4 region of 16S rRNA and groEL gene, respectively. After FOS intervention, there were significant increases in the total and wall weights of the cecum and the amount of total short-chain fatty acids (SCFAs) in the cecal contents of the mice. At the phylum level, the results showed a significant increase in the relative abundance of Actinobacteria in the contents and mucosa from the cecum to the distal colon in the FOS group. Besides Bifidobacterium, a significant increase was observed in the relative abundance of Coprococcus in all samples at the genus level, which may be partially related to the increase in butyric acid levels in the luminal contents. Furthermore, groEL sequencing revealed that Bifidobacterium pseudolongum was almost the sole bifidobacterial species in the luminal contents (>98%) and mucosa (>89%). These results indicated that FOS can selectively promote B. pseudolongum proliferation in the intestine, either in the lumen or the mucosa from the cecum to the distal colon. Further studies are required to reveal the competitive advantage of B. pseudolongum over other FOS-metabolizing bacteria and the response mechanisms of B. pseudolongum to FOS.

1. Introduction

The human gastrointestinal tract is an open microbial ecosystem with trillions of bacteria [1,2], including the beneficial and harmful bacteria that together form the normal intestinal microflora. The cecum and colon are denser and more diverse bacterial habitats than the stomach and small intestine. The intestinal bacteria are mainly distributed in the intestinal lumen and in the mucus secreted by the epithelial cells (the mucosa) [3,4]. Because of the differences in physiological structures and the gradients in available nutrients along the small intestine and colon, the composition of the bacterial community changes longitudinally [5,6]. In addition, the luminal microbiota differ from the mucosal microbiota within the same segment [7]. Most studies on intestinal microbiota have focused on feces rather than luminal and mucosal samples because feces are readily available [8,9]. However, luminal and mucosal samples of the cecum and colon should be investigated to understand the distribution, composition, and gradual changes of gut microbiota along the gastrointestinal tract.
In the cecum and colon, commensal bacteria produce short-chain fatty acids (SCFAs) from the carbohydrates that pass undigested from the upper gastrointestinal tract. Some undigested carbohydrates are considered prebiotics because they stimulate the growth of beneficial bacteria and exert physiological effects on the host [10,11]. Fructooligosaccharides (FOS) are considered prebiotics and have been proven to modulate the composition of intestinal microbiota by preferentially increasing the abundance of Bifidobacterium in vitro and in vivo [12,13,14]. It is well known that FOS selectively stimulate the growth of Bifidobacterium in the gut [7,12]. Notably, we performed high-throughput sequencing of the groEL gene in our previous study to investigate the composition of Bifidobacterium at the species level and found that FOS selectively stimulated the growth of Bifidobacterium pseudolongum in mice feces [15].
Although several other genera, including Lactobacillus, Coprococcus, and Enterococcus, are also capable of utilizing FOS [7,16,17], Bifidobacterium has been found to show a competitive advantage over other genera in the gut after FOS intervention. Few studies have investigated the response mechanism of Bifidobacterium to FOS in the gut. To understand the interactions between FOS and intestinal microbiota, it is necessary to investigate the composition of mucosal and luminal microbiota in the gut, especially that of Bifidobacterium at the species level.
Therefore, in this study, we fed mice a FOS-supplemented diet for four weeks and analyzed the composition of luminal and mucosal microbiota, in particular Bifidobacterium composition in the cecum and colon using MiSeq sequencing to clarify the relationships between FOS and the composition and distribution of intestinal microbiota.

2. Materials and Methods

2.1. Chemicals and Reagents

FOS (GFn, HPLC purity 95.93%) containing 1F-fructofuranosylnystose (2.88%), nistose (32.45%), and 1-kestose (60.60%) were purchased from Bao Lingbao Biotechnology Co., Ltd. (Shandong, China).
The DNA extraction, polymerase chain reaction (PCR) amplification, quantification and sequencing kits, including FastDNA Spin Kit for Soil, QIAquick Gel Extraction Kit, Quanta iTico PicoGreen dsDNA Assay Kit, KAPA Biosystems Library Quantification Kit, QubitTM dsDNA BR Assay Kit, TruSeq DNA LT Sample Preparation Kit and MiSeq Reagent Kit, were used as described in our previous study [15].

2.2. Animals and Sample Collection

C57BL/6J mice (7 weeks, male) were purchased from Shanghai Experimental Animal Center (Shanghai, China). The 14 mice were allocated to two groups of 7 mice each. All mice were housed in an independent ventilation system in the Laboratory Animal Center of Jiangnan University. A 12-h light/dark cycle was maintained and the ambient temperature was controlled at 22 °C. The mice were allowed ad libitum access to food and water. All of the experiments in this study were approved by the ethics committee of Jiangnan University (JN No. 20160927-20161105 (67)) and were performed in line with the EU guidelines for experimental animals (Directive 2010/63/EU).
After 1-week adaptation, the mice were fed a diet supplemented with 0% or 25% FOS (w/w) for 4 weeks (control and FOS groups, respectively). A FOS diet was prepared by adding FOS to the control diet, partially replacing the glucose component. The diet formulas are shown in Table S1. At the end of the experiment, the luminal contents and mucosa of the cecum and colon were collected and weighed [9]. The amount of SCFAs in the contents was determined, and the microbiota composition in all samples was analyzed using the MiSeq platform (Illumina, Inc., San Diego, CA, USA). All samples were stored at −80 °C until analysis.

2.3. Determination of the Weight of Cecum

The cecum and colon of the mice were collected and weighed together to obtain the total weight. The luminal contents were collected and weighed separately to obtain the content weight, and the remains were then weighed to obtain the wall weight. The colon was divided into three segments- the proximal, middle, and distal colon, depending on their distance from the cecum.

2.4. Determination of the pH and SCFAs Level of the Intestinal Content

A certain amount of the cecal and colonic contents was mixed with deionized water to obtain a 15 g/mL solution, which was centrifuged at 13,000× g for 2 min. The pH of the supernatant was determined using InLab Ultra-Micro-ISM electrode (Mettler Toledo International Inc., Columbus, OH, USA).
The amount of SCFAs, including acetic acid, propionic acid, butyric acid, isobutyric acid, valeric acid, and isovaleric acid, was determined using the method described by Mao et al. [9]. Briefly, the contents were suspended in saturated NaCl solution and acidified by sulfuric acid. SCFAs were then extracted by diethyl ether. The concentrations of SCFAs were analyzed by gas chromatography-mass spectrometry (GC-MS) and calculated by external standard method. The concentration was expressed as μmol/g of contents and the content was computed as μmol.

2.5. DNA Extraction and PCR Amplification of the V3–V4 Region and the groEL Gene

Bacterial genomes were extracted from the luminal contents and mucosa following the manufacturer’s instructions. The V3–V4 region of the 16S rRNA and the groEL gene were amplified by PCR. The primers and PCR programs were as described in our previous study [15].

2.6. Quantification, Sequencing, and Bioinformatic Analysis

The PCR products were quantified using the QubitTM dsDNA BR Assay Kit following the manufacturer’s instructions. Libraries were constructed using the TruSeq DNA LT Sample Preparation Kit and sequenced on the MiSeq platform (600 cycles-PE).
The sequence reads were processed and screened according to the standards described previously [18]. Bioinformatic analyses, including sequence screening, reads assembly, operational taxonomic unit (OTU) establishment, OTU taxonomy, principal coordinate analysis (PCoA) analysis, α-diversity and β-diversity analysis, were performed using the QIIME package as described in our previous study [15].The linear discriminant analysis effect size (LEfSe) analysis [19] was performed to identify the most biologically informative features differentiating any two groups.

2.7. Data Statistics and Analysis

Differences between three groups were evaluated using analysis of variance, and those between two groups were assessed using the t-test (SPSS 16.0). A p value of less than 0.05 was considered to indicate statistical significance.

3. Results

3.1. Cecal Weights in Different Groups

Compared with the control mice, the FOS-supplemented mice showed significantly increased cecal wall weight (p < 0.05) (Table 1) and three times higher cecal content weight (p < 0.01) (Table 1). The cecum of the FOS-supplemented mice was also bigger than that of the control mice.

3.2. pH and SCFAs Levels of the Cecal and Colonic Contents

The pH of the luminal contents from the cecum to the distal colon was greater than 7 in the control group, whereas that of the contents of cecum, proximal colon, middle colon, and distal colon was significantly lower (6.13, 5.93, 6.12, and 6.43, respectively) in the FOS group (p < 0.05) (Table 2). Notably, no significant difference was observed between the pH of the four parts of the intestine in the FOS group.
The decrease in the pH of luminal contents of the intestine may be attributable to the production of SCFAs [1], by colonic bacteria via the fermentation of FOS passed undigested from the upper gastrointestinal tract. GC-MS revealed that the total SCFAs content of the cecum significantly increased after FOS intervention (p < 0.01, Table 3), consistent with the pH decrease in the cecum and colon. Acetic acid was found to be the most abundant SCFAs, followed by isovaleric acid, propionic acid, butyric acid, isovaleric acid and valeric acid. The amounts of SCFAs were calculated from the concentrations of SCFAs (Table S2) and the weight of cecal contents. No significant difference was observed in the concentrations of various SCFAs in the cecum between the control and FOS groups (Table S2, p > 0.05).

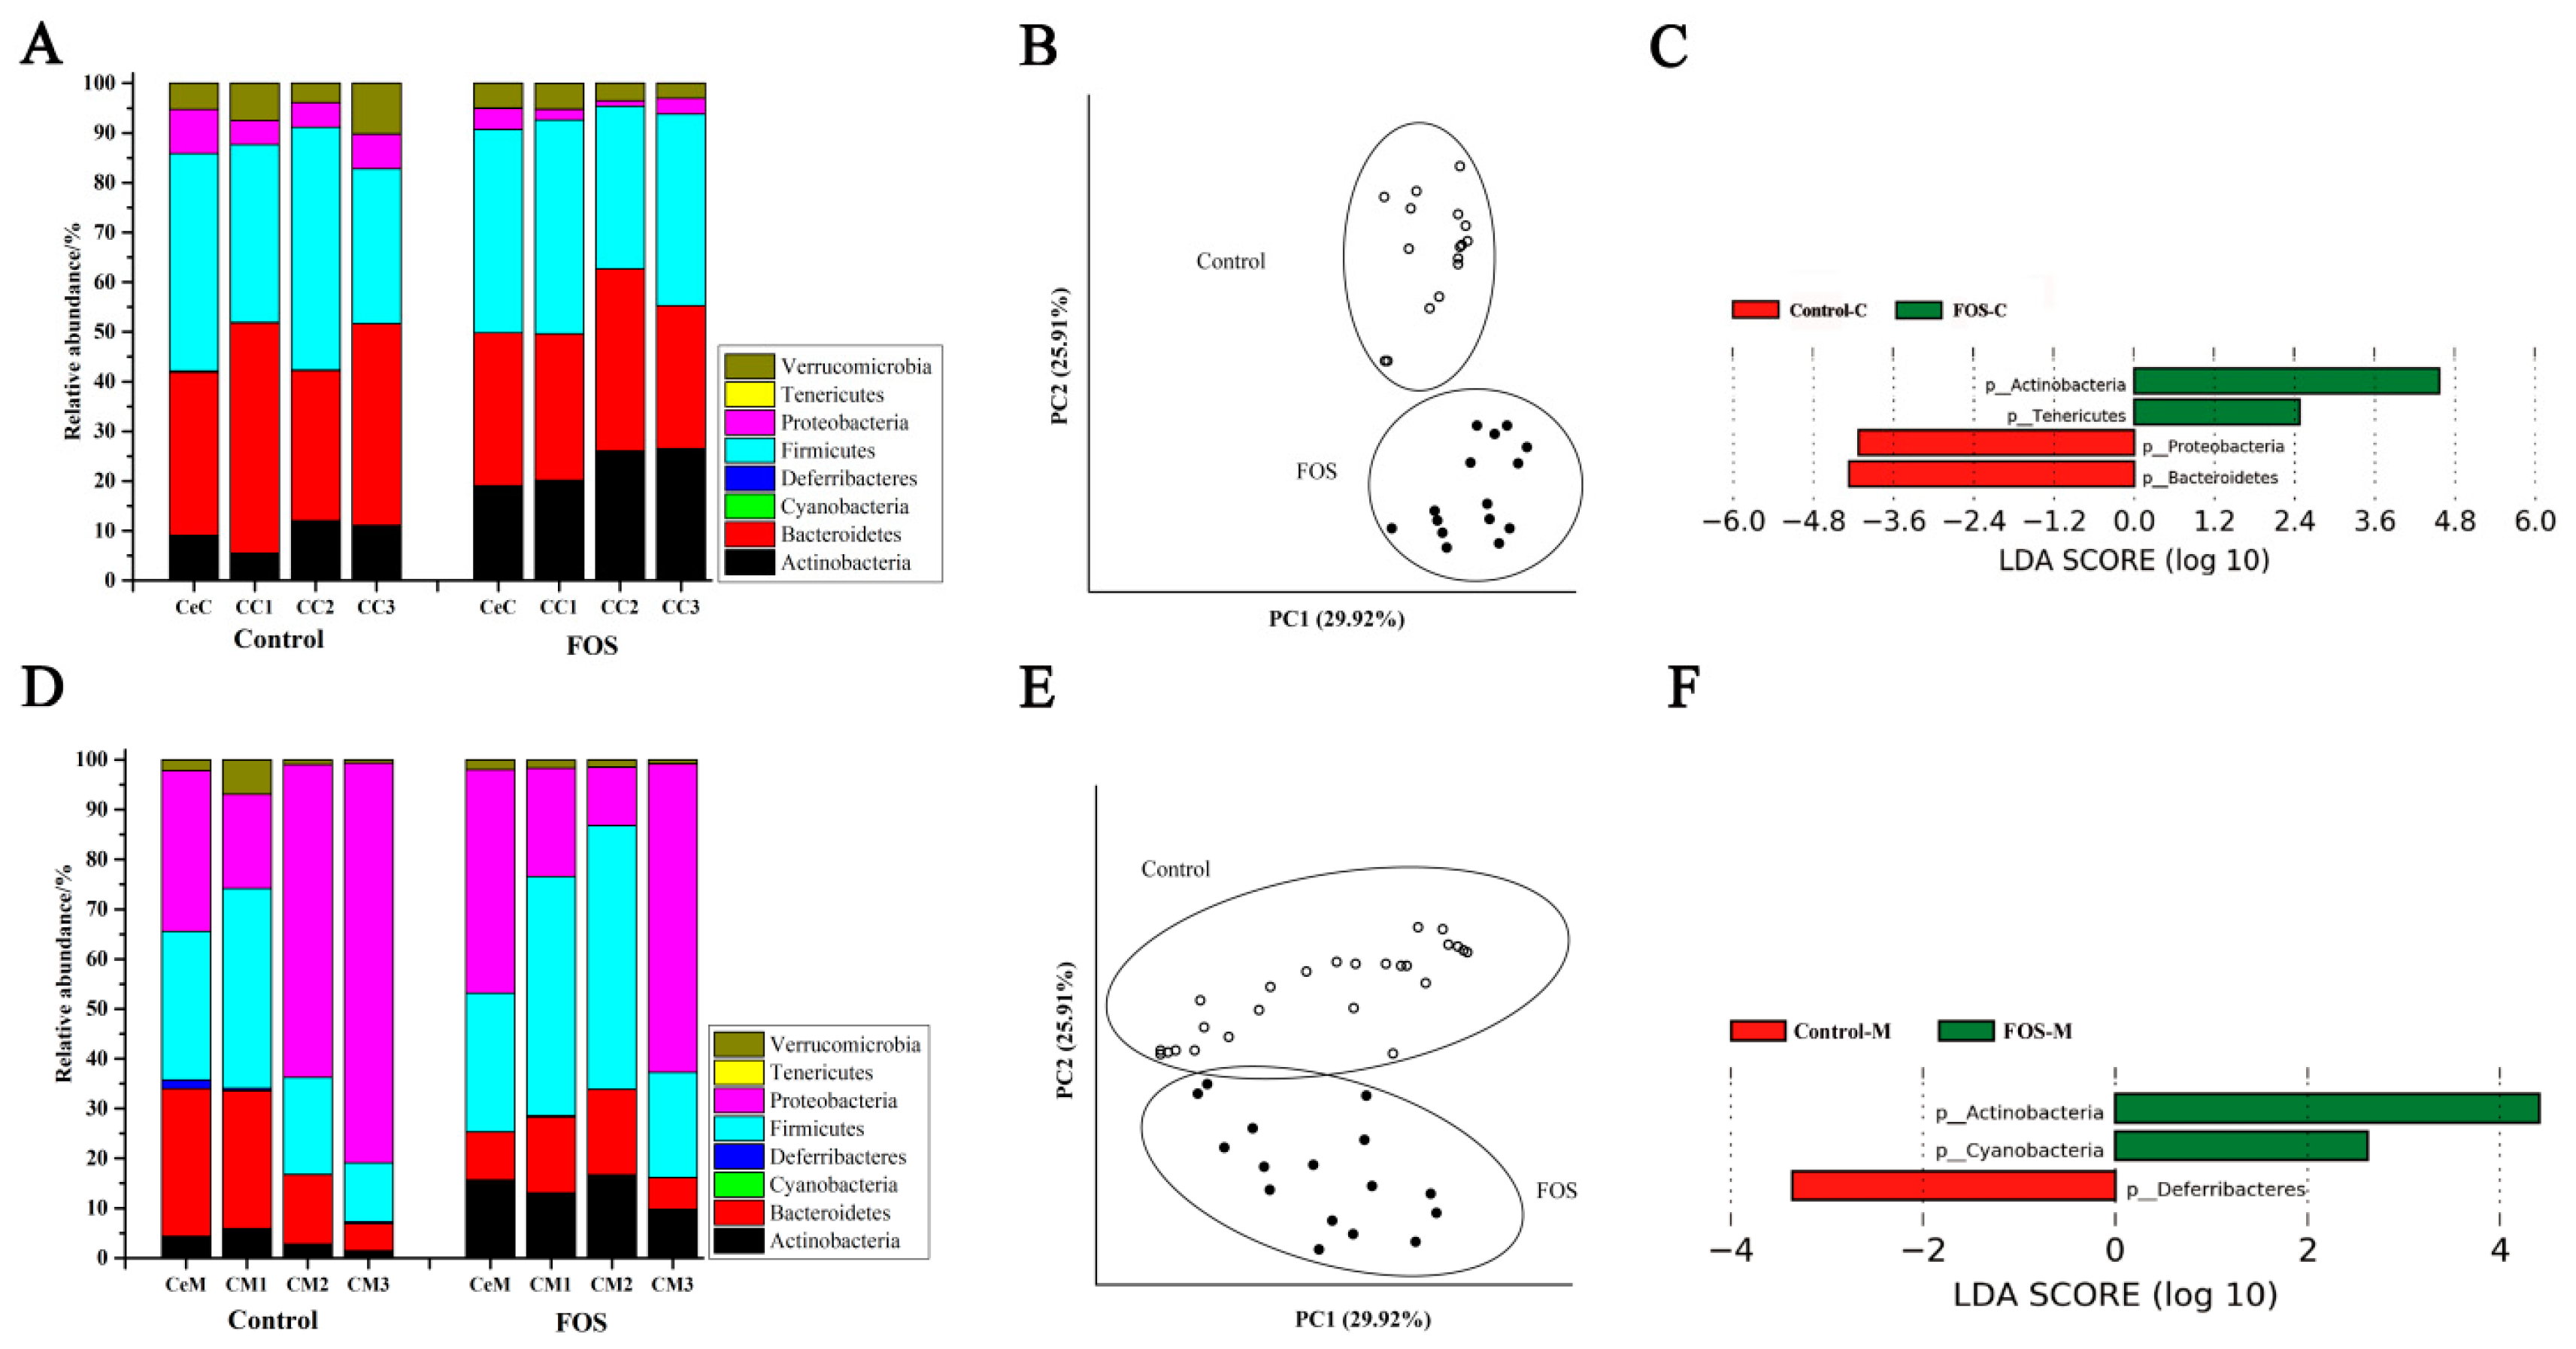
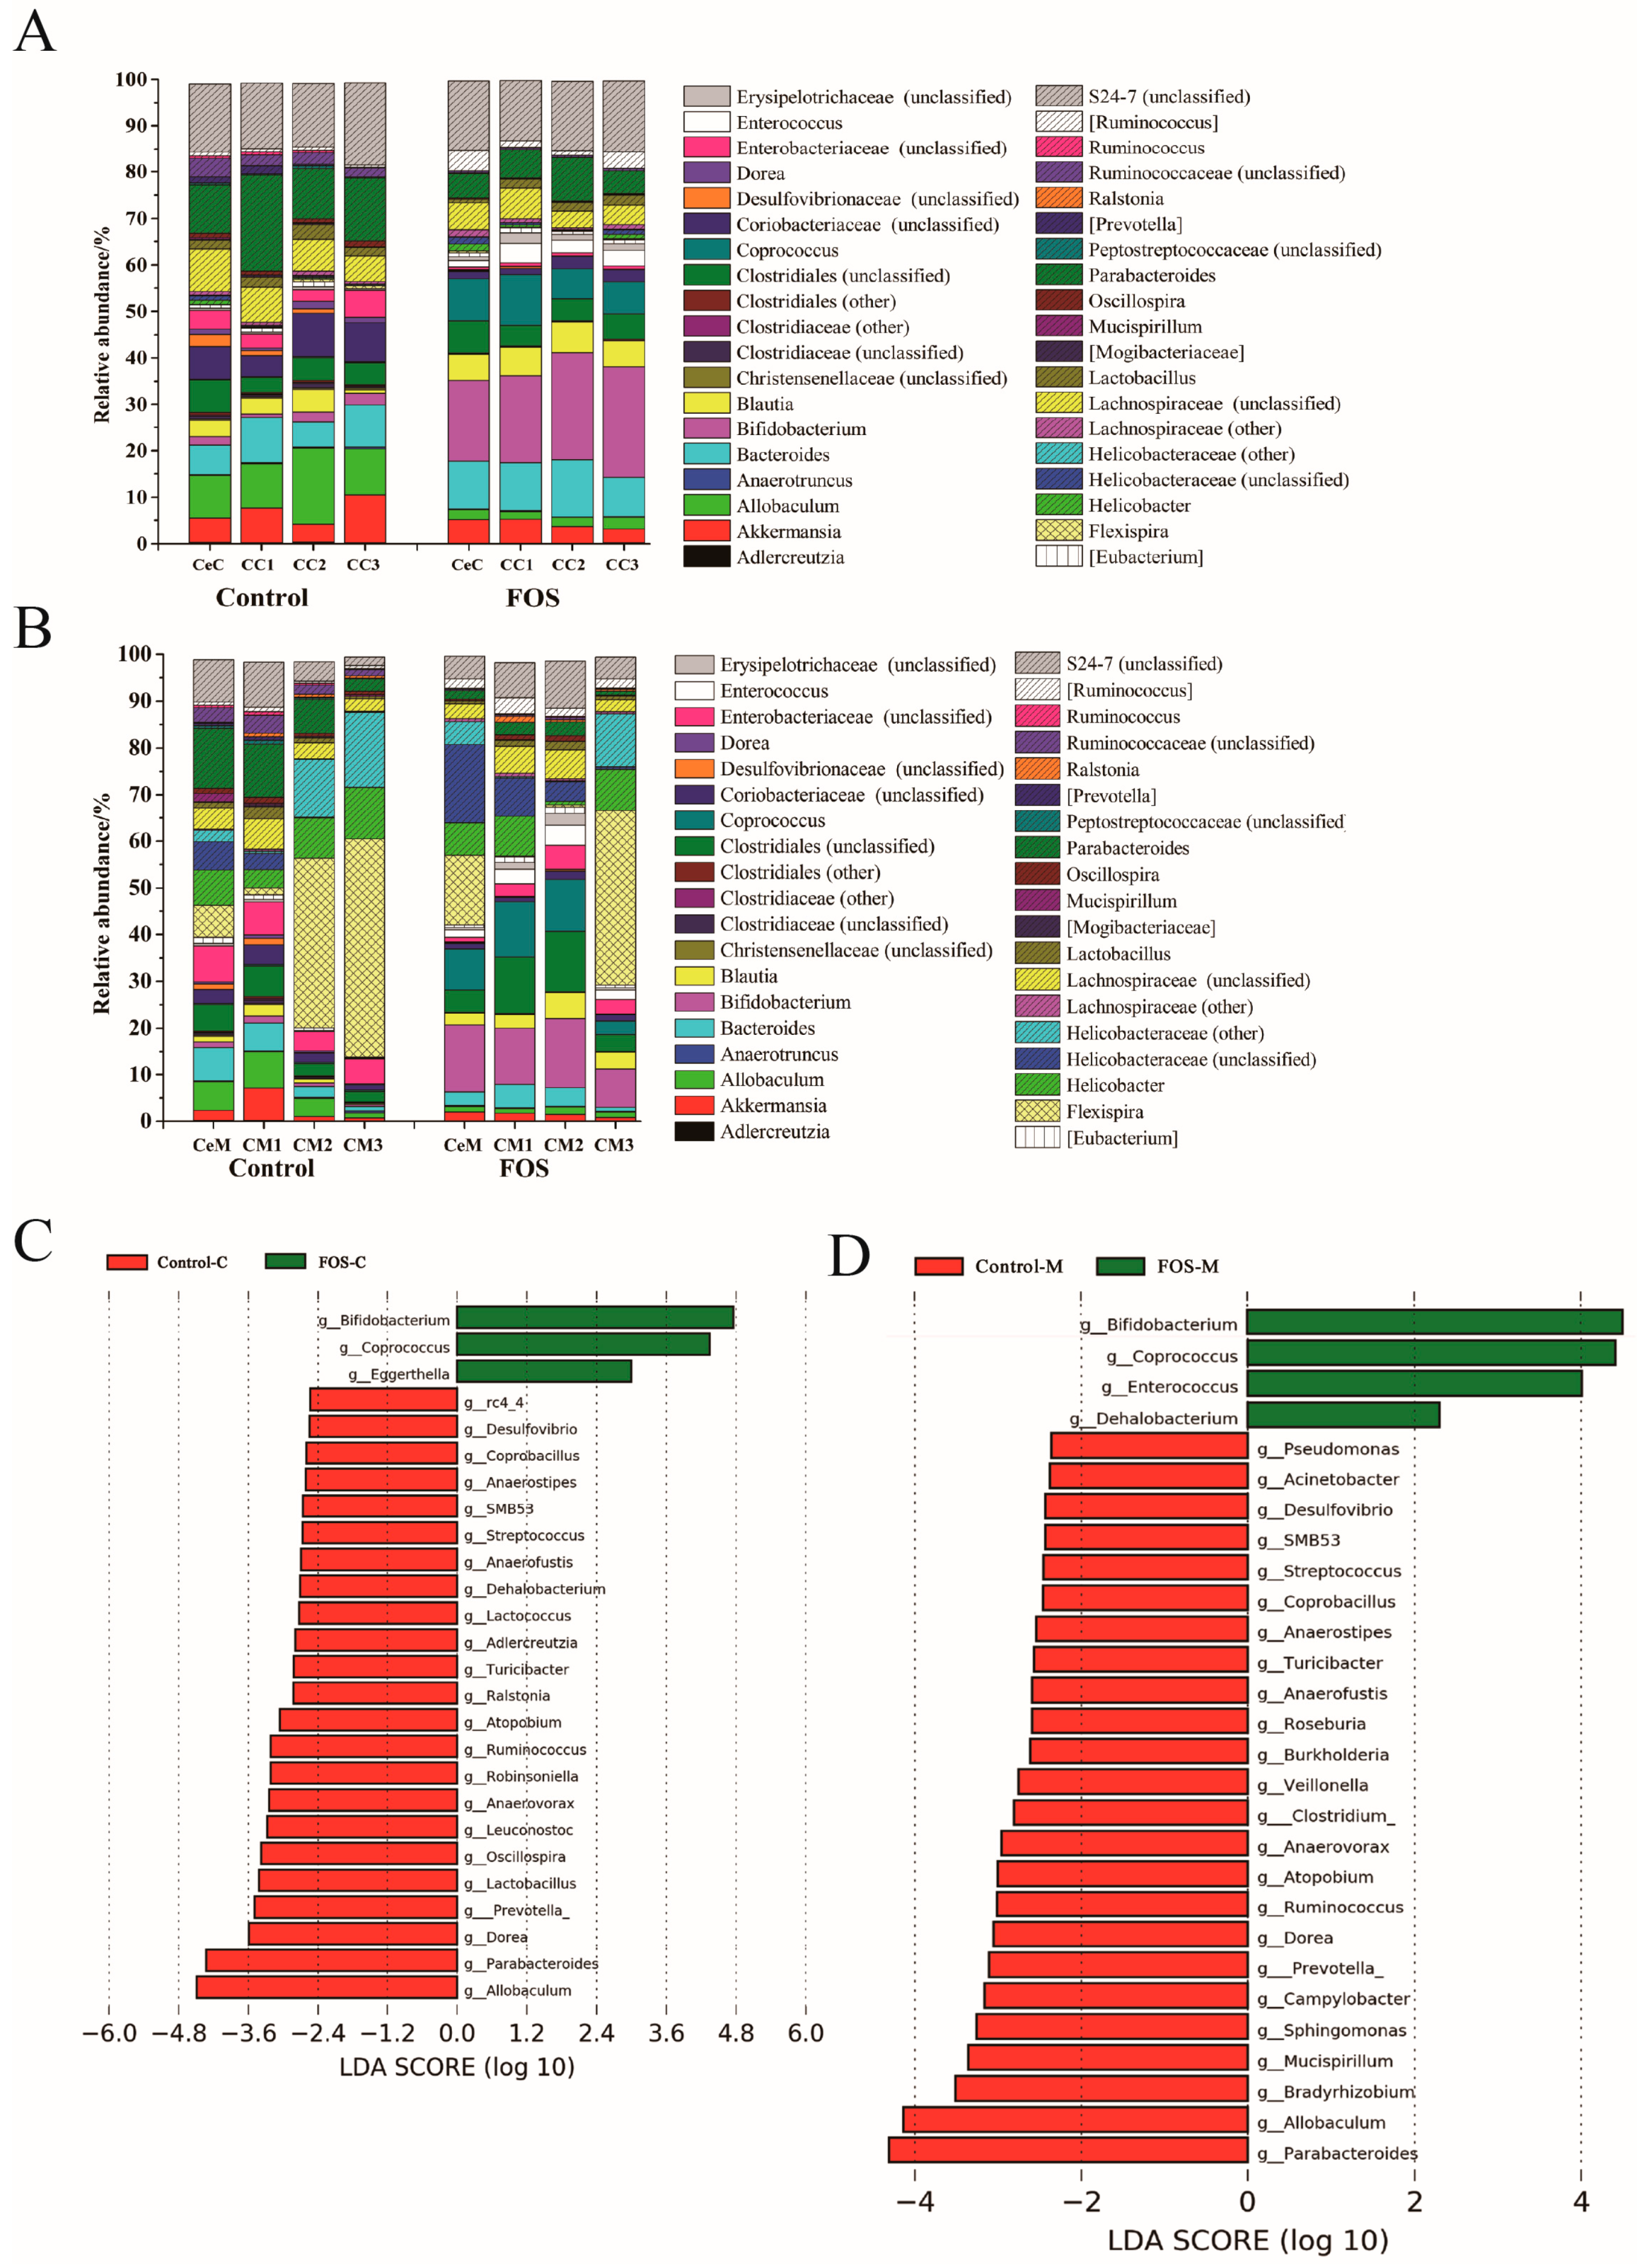
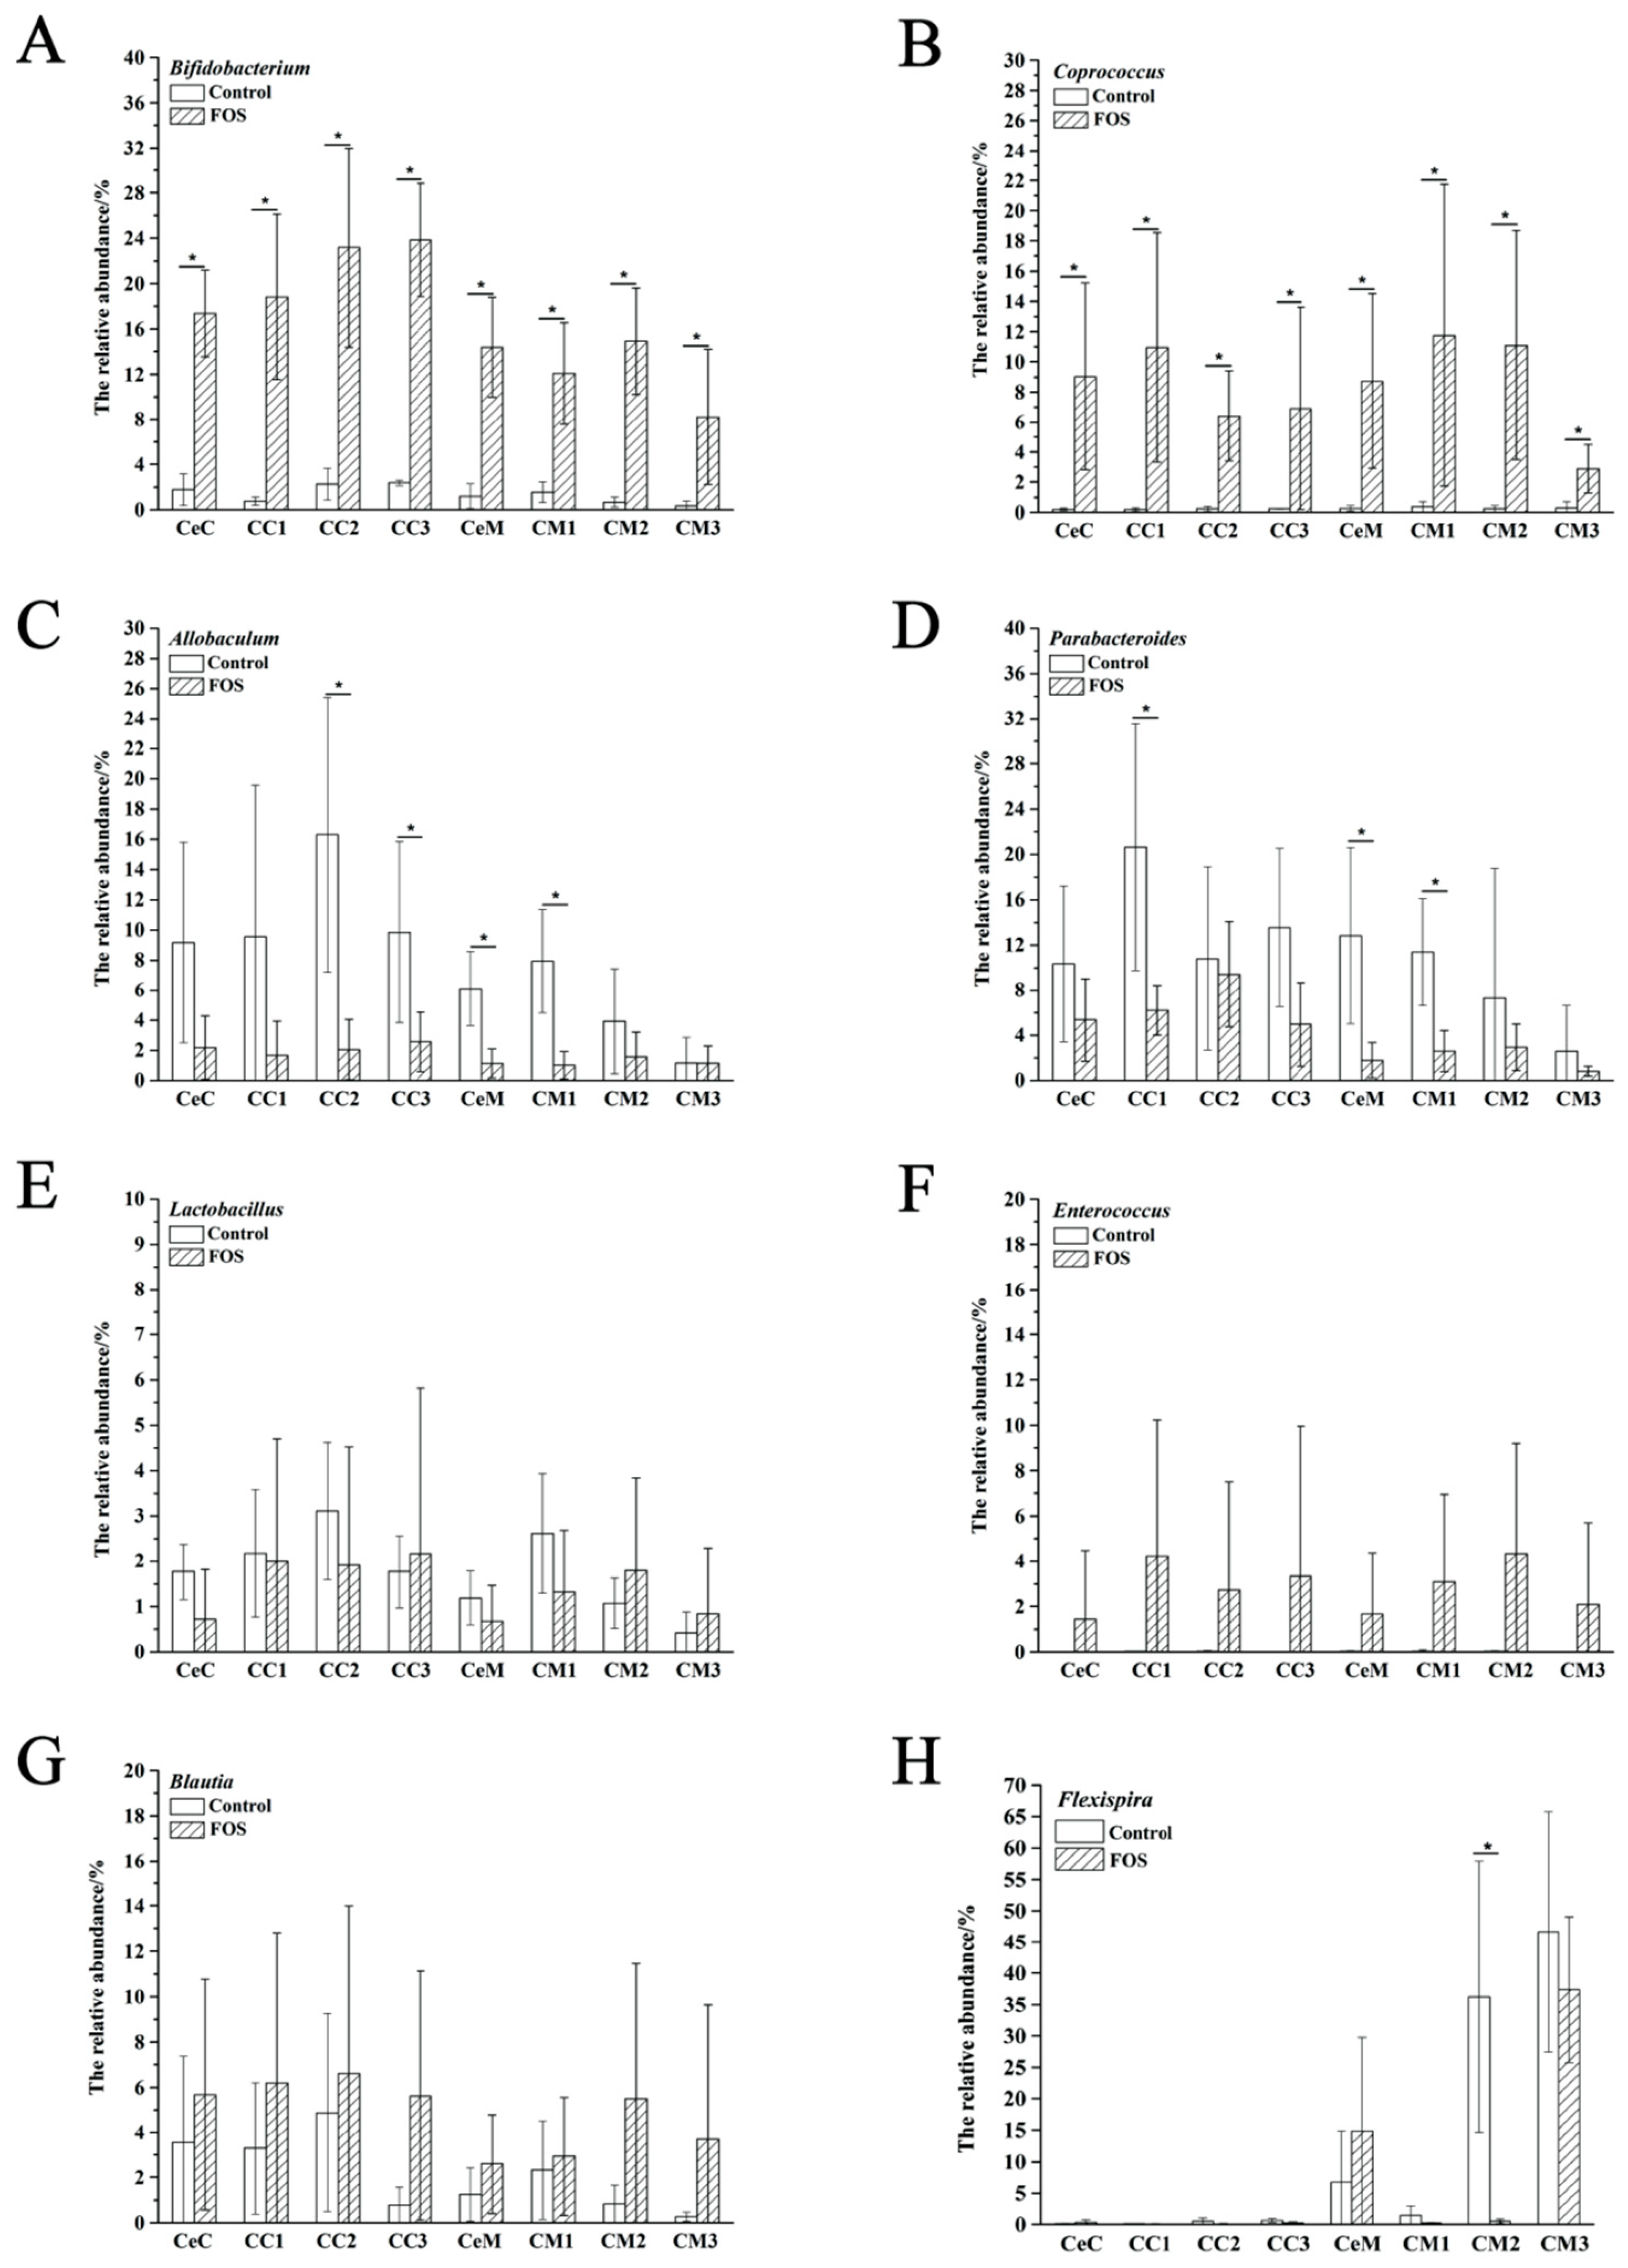
3.3. Effects of FOS on the Composition of Luminal and Mucosal Microbiota in Cecum and Colon

Bacteroidetes and Firmicutes were the most abundant phyla among the luminal microbiota of the cecum and colon, and the luminal microbiota showed similar composition from the cecum to the distal colon (Figure 1A). After FOS intervention, the relative abundance of Actinobacteria significantly increased in the luminal microbiota, whereas that of Bacteroidetes and Proteobacteria significantly reduced (Figure 1C). The PCoA results showed that the composition of luminal microbiota was well differentiated between the control and FOS group (Figure 1B). Among the mucosal microbiota, Bacteroidetes, Firmicutes, and Proteobacteria were the most abundant phyla, and the composition of mucosal microbiota varied from the cecum to the distal colon (Figure 1D). The relative abundance of Actinobacteria also significantly increased in the mucosal microbiota of the cecum and colon after FOS intervention (Figure 1F), indicating that FOS could increase the abundance of Actinobacteria in both the luminal contents and mucosa of the whole intestine.
In total, 288 genera were found in the luminal and mucosal samples, 38 of which showed a relative abundance of greater than 0.1% and accounted for >98% of the microbiota (Figure 2A,B). The data were analyzed using LEfSe to identify the key phylum and genus responsible for the differences in microbiota composition between the control and FOS groups. The abundances of 26 genera showed significant differences between the control and FOS groups (Figure 2C). Among the luminal microbiota, Bifidobacterium and Coprococcus showed significant increases in the relative abundances after FOS interventions, whereas Allobaculum and Parabacteroides showed significant reductions in their relative abundances (Figure 2C). The composition of mucosal microbiota varied from the cecum to the distal colon (Figure 2B), and also differed from that of the luminal microbiota (Figure S1). Flexispira and Helicobacter were the two major distinguishing genera between the luminal and mucosal microbiota (Figure S1); Flexispira accounted for 46.61% of the mucosal microbiota of the distal colon (Figure 2B). Consistent with the changes in luminal microbiota, mucosal microbiota showed significant increases in the relative abundances of Bifidobacterium and Coprococcus and significant decreases in the relative abundances of Parabacteroides and Allobaculum after FOS intervention (Figure 2D).
The relative abundances of Bifidobacterium and Coprococcus were significantly increased from the cecum to the distal colon in both the luminal contents and mucosa (Figure 3A,B). However, the relative abundances of Allobaculum and Parabacteroides significantly reduced in the CC2, CC3, CeM, and CM1, (Figure 3C) and CC1, CeM, and CM1 (Figure 3D), respectively, and significant differences were found between the luminal and mucosal samples (Figure 2C,D). Reportedly, some Lactobacillus and Enterococcus species can metabolize FOS [7]. However, in our study, their relative abundances were not significantly increased in the luminal or mucosal samples after FOS intervention. The abundance of Blautia was previously reported to be significantly increased in mice feces after FOS intervention [15]. However, no significant increases were observed in its abundance in the luminal contents and mucosa from the cecum to the distal colon after FOS intervention in our study (Figure 3G), although its abundance varied greatly between mice.

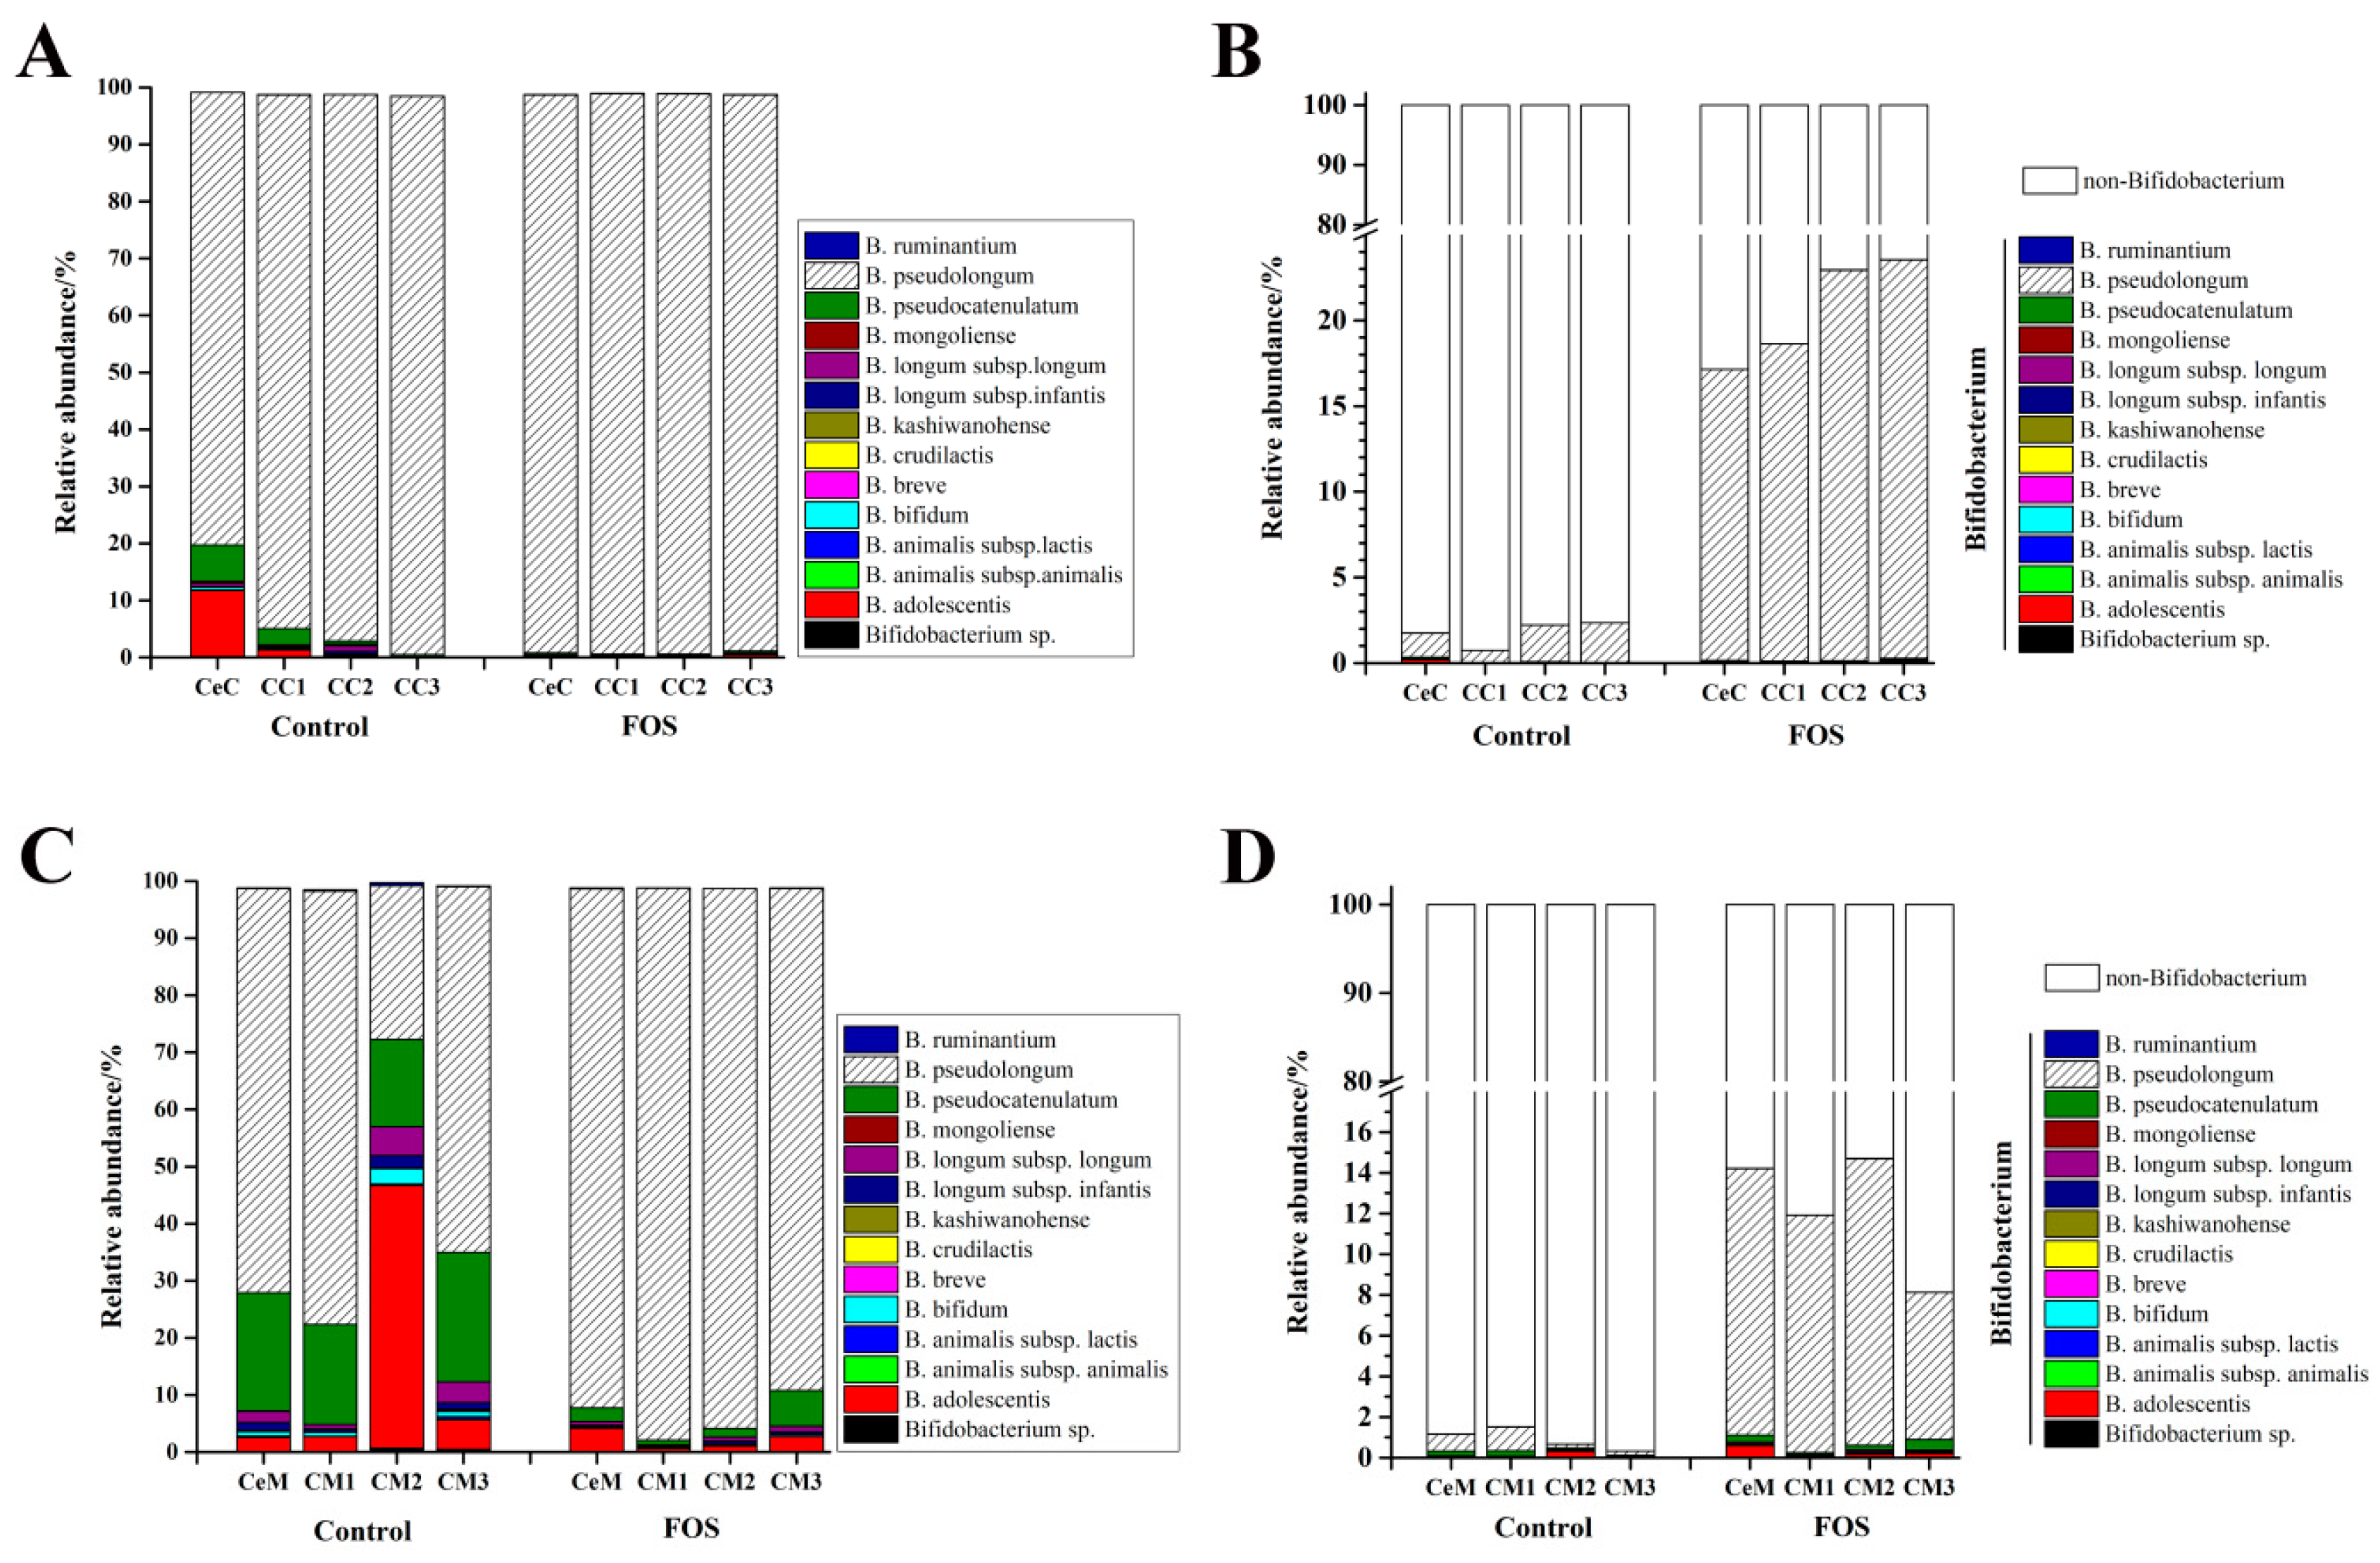
3.4. Effects of FOS on the Composition of Bifidobacterium in the Luminal Contents and Mucosa

14 species/subspecies in Bifidobacterium were detected in the contents and mucosa of the cecum and colon, and B. pseudolongum was the most abundant Bifidobacterium species (Figure 4A,B). The average relative abundance of B. pseudolongum was 91.7% and 59.3% in the luminal contents and mucosa, respectively. After FOS intervention, B. pseudolongum almost became the sole Bifidobacterium species with an average abundance of 98.0% in the luminal contents. As shown in Figure 4C, the composition of Bifidobacterium in the mucosa was different from that in the luminal contents. Following B. pseudolongum, B. pseudocatenulatum showed a high abundance of an average of 19.1% in the mucosa. The relative abundance of B. adolescentis was 45.9% in CM2. However, the relative abundance of B. pseudolongum reached an average of 92.5% throughout the large intestinal mucosa after FOS intervention. The relative abundance of B. pseudolongum reached an average of 20.4% and 11.5% in the luminal and mucosal microbiota, respectively. These results indicated that FOS significantly stimulated the growth of B. pseudolongum in both the luminal contents and mucosa from the cecum to the distal colon.

4. Discussion

Compared with the mice in the control group, significant enlargement of the cecum and softening of the luminal contents was observed in this study, which might be explained by the results showing that oligosaccharides supplementation increased the water content of the feces [20]. The total weight and wall weight of the cecum of mice in the FOS group were significantly higher than those of the control mice (Table 1), indicating that the cecal wall thickness did not decrease with the increase in the cecal size (data not shown) and this finding may be related to the production of SCFAs in the cecum [21]. The cecum is the main fermentation site for carbohydrates in mice, and the amounts of SCFAs, including acetic acid, propionic acid, butyric acid, isobutyric acid, valeric acid and isovaleric acid in the cecal contents significantly increased after FOS intervention, (Table 2). SCFAs provide energy for cell differentiation and proliferation, thereby increasing the crypt depth and cell density in the cecum [21], and consequently increasing the wall weight. Similar results for the changes in cecal weight were also obtained in rats fed different doses of lactose [22]. In addition to SCFAs, lactate and succinate might be produced after FOS fermentation. The gut permeability and inflammatory responses might be impacted due to stasis of the acidic environment [23].
The effects of FOS on the composition of the luminal and mucosal microbiota of mice were investigated via high-throughput MiSeq sequencing. Significant differences were observed in the composition of luminal and mucosal microbiota, consistent with our previous reports [9]. In addition, the composition of the luminal and mucosal microbiota also differed from that of the fecal microbiota. In most studies on intestinal microbiota, fecal samples are commonly used because of their easy availability. However, it is necessary to evaluate the luminal and mucosal samples to elucidate the changes in microbiota composition along the intestinal tract. FOS can only modulate the bacteria already existing in the gut; thus, FOS exerted different regulatory effects on the luminal and mucosal microbiota (Figure 2) depending on the differences between the original luminal and mucosal microbiota [9].
The LEfSe results indicated a significant increase in the relative abundance of Actinobacteria in both the luminal contents and mucosa from the cecum to the distal colon after FOS intervention (Figure 1), and Bifidobacterium contributed the most to this increase (Figure 2). This increase was consistent with the study of FOS ingestion in humans [24]. In addition, the relative abundance of Coprococcus was also significantly increased in the luminal and mucosal microbiota (Figure 3B), consistent with the previous results in feces [19]. Coprococcus is a genus of anaerobic cocci comprising three major species, of which C. comes and C. eutactus are capable of utilizing short-chain FOS [25]. As reported in the Bergey’s Manual of Systematic Bacteriology, the major products of carbohydrates fermentation by Coprococcus are butyric acid and acetic acid, followed by formic acid or propionic acid. Therefore, increases in the butyric acid content may be partially related to the increase in the abundance of Coprococcus [26].
Microbial distribution along the gastrointestinal tract is irregular and heterogeneous. As shown in Figure S1, large differences were found in the relative abundances of many genera between the luminal contents and mucosa, which may be related to the availability of various carbon sources. For example, the relative abundance of Helicobacter was higher in the mucosa than in the luminal contents, most likely because Helicobacter can use mucin as its carbon source [27], which is the main component of the intestinal mucosal barrier [28]. Flexispira was very similar to Helicobacter in taxonomy [29] and some members can cause gastrointestinal diseases and chronic diarrhea in animals [30]. After a four-week FOS intake, the relative abundance of Flexispira did not change significantly in the cecum (Figure 3H). In contrast, Bifidobacterium can metabolize several types of carbohydrates from diets [31], which allows it to survive extensively throughout the gut luminal contents and mucosa. No clear boundaries were observed for the bacteria distribution longitudinally along the intestine, although differences in the relative abundance were observed from the cecum to the distal colon. This finding is consistent with that of Welch et al. [32]. They established a model 15-member human gut microbiota in gnotobiotic mice and characterized the spatial distribution of the bacteria by in situ hybridization and spectral imaging analysis. They reported the luminal contents and mucosa of the proximal colon as an incompletely mixed bioreactor but not stratified compartments.
In our previous study, we identified 14 species in mice feces by high-throughput sequencing of the groEL gene, of which B. pseudolongum was the most abundant [15]. The Bifidobacterium composition of the luminal contents and mucosa was found to differ from that of feces. In addition to B. pseudolongum, B. pseudocatenulatum and B. adolescentis showed high relative abundances in the mucosa, and their relative abundances varied from cecum to the distal colon (Figure 4). FOS showed great effects on the composition of intestinal microbiota, especially of Bifidobacterium. After FOS intervention, B. pseudolongum became almost the sole Bifidobacterium species present in both the luminal contents and in the mucosa. Although B. pseudocatenulatum and B. adolescentis have been found to metabolize FOS in vitro [33], B. pseudolongum exerted a competitive advantage over the other Bifidobacterium species. Thus, the increase in the relative abundance of Bifidobacterium was almost entirely contributed by B. pseudolongum after FOS intervention after the short period of FOS intake.
It has been reported that the microbiota may return to baseline levels after discontinuation of short-term prebiotics intake [24,34]. Mao et al. revealed that the levels of Bifidobacterium and Olsenella both notably increased after a FOS diet (25%) and the microbiota tended to revert to initial structure two weeks after FOS treatment ceased [18]. This study only reported the effects of short-term ingestion, and the long-term ‘functional’ effects of FOS should be studied. Therefore, further studies are required to determine microbial activities and bifidobacterial composition in mice that would compare short (four week), medium (eight weeks), and long (24–27 weeks) periods of FOS intake.
The analysis of luminal and mucosal microbiota confirmed that FOS can selectively promote B. pseudolongum proliferation in the intestine, independent of the position of B. pseudolongum in the longitudinal and horizontal intestine. However, the mechanism of selective promotion remains unclear. Further studies should elucidate the competitive advantage of B. pseudolongum over other intestinal bacteria in the use of FOS and the reason for the proliferation allowed by the host gut. This would be helpful in clarifying the response mechanism of B. pseudolongum to FOS and the relationships between prebiotics and gut microbiota.

Supplementary Materials

The following supporting materials are available online at https://www.mdpi.com/2072-6643/11/10/2431/s1. Table S1: Dietary formula. Table S2: The SCFAs concentrations of the cecal content in the Control and FOS groups. Figure S1: LEfSe analysis on the differences of luminal and mucosal microbiota at the genus level in the Control group.

Author Contributions

Conceptualization, B.M. and H.Z.; methodology, B.M.; formal analysis, J.G. and X.L.; investigation, J.G. and X.L.; data curation, J.G.; writing—original draft preparation, J.G. and B.M.; writing—review and editing, B.M., J.Z. and W.C.; supervision, H.Z., W.C.; project administration, J.Z. and S.C.; funding acquisition, B.M. and S.C.

Funding

This work was supported by National Natural Science Foundation of China (Grant No. 31972086, 31601453, 31801530), National First-Class Discipline Program of Food Science and Technology (JUFSTR20180102) and Collaborative Innovation Center of Food Safety and Quality Control in Jiangsu Province.

Acknowledgments

The authors would like to thank Mingluo Pan (Shisheng Shi’an Biotech. Ltd., Wuxi, China) for his help with the data analysis.

Conflicts of Interest

The authors declare no conflict of interest.

References

  1. Derrien, M.; Vlieg, V.H.; Johan, E.T. Fate, activity, and impact of ingested bacteria within the human gut microbiota. Trends Microbiol. 2015, 23, 354–366. [Google Scholar] [CrossRef] [PubMed] [Green Version]
  2. Rakoff-Nahoum, S.; Coyne, M.J.; Comstock, L.E. An ecological network of polysaccharide utilization among human intestinal symbionts. Curr. Biol. 2014, 24, 40–49. [Google Scholar] [CrossRef] [PubMed]
  3. Faith, J.J.; Guruge, J.L.; Charbonneau, M.; Subramanian, S.; Seedorf, H.; Goodman, A.L.; Clemente, J.C.; Knight, R.; Heath, A.C.; Leibel, R.L. The Long-Term Stability of the Human Gut Microbiota. Science 2013, 341, 1237439. [Google Scholar] [CrossRef] [PubMed]
  4. Donaldson, G.P.; Lee, S.M.; Mazmanian, S.K. Gut biogeography of the bacterial microbiota. Nat. Rev. Microbiol. 2015, 14, 20–32. [Google Scholar] [CrossRef] [Green Version]
  5. Dubos, R.; Schaedler, R.W.; Costello, R.; Hoet, P. Indigenous, Indigenous, normal, and autochthonous flora of the gastrointestinal tract. J. Exp. Med. 1965, 122, 67–76. [Google Scholar] [CrossRef]
  6. Albenberg, L.; Esipova, T.V.; Judge, C.P.; Bittinger, K.; Chen, J.; Laughlin, A.; Grunberg, S.; Baldassano, R.N.; Lewis, J.D.; Li, H. Correlation between intraluminal oxygen gradient and radial partitioning of intestinal microbiota. Gastroenterology 2014, 147, 1055–1063. [Google Scholar] [CrossRef]
  7. Mao, B.Y.; Li, D.Y.; Zhao, J.X.; Liu, X.M.; Gu, Z.N.; Chen, Y.Q.; Zhang, H.; Chen, W. In vitro fermentation of fructooligosaccharides with human gut bacteria. Food Funct. 2015, 6, 947–954. [Google Scholar] [CrossRef]
  8. Eckburg, P.B.; Bik, E.M.; Bernstein, C.N.; Purdom, E.; Dethlefsen, L.; Sargent, M.; Gill, S.R.; Nelson, K.E.; Relman, D.A. Diversity of the Human Intestinal Microbial Flora. Science 2005, 308, 1635–1638. [Google Scholar] [CrossRef] [Green Version]
  9. Mao, B.Y.; Li, D.Y.; Zhao, J.X.; Ai, C.Q.; Zhang, H.; Chen, W. Lactulose differently modulates the composition of luminal and mucosal microbiota in C57BL/6J mice. J. Agric. Food Chem. 2016, 64, 6240–6247. [Google Scholar] [CrossRef]
  10. Besten, G.D.; Eunen, V.K.; Groen, A.K.; Venema, K.; Reijingoud, D.J.; Bakker, B.M. The role of short-chain fatty acids in the interplay between diet, gut microbiota, and host energy metabolism. J. Lipid Res. 2013, 54, 2325–2340. [Google Scholar] [CrossRef] [Green Version]
  11. Giese, E.C.; Hirosi, T.; Silva, R.D.; Aneli, D.M.B. Produção, propriedades e aplicações de oligossacarídeos. Semin. Cienc. Agrar. 2011, 32, 683–700. [Google Scholar] [CrossRef]
  12. Gibson, G.R.; Beatty, E.R.; Wang, X.; Cummings, J.H. Selective stimulation of bifidobacteria in the human colon by oligofructose and inulin. Gastroenterology 1995, 108, 975–982. [Google Scholar] [CrossRef]
  13. Wang, X.; Gibson, G.R. Effects of the in vitro fermentation of oligofructose and inulin by bacteria growing in the human large intestine. J. Appl. Bacteriol. 1993, 75, 373–380. [Google Scholar] [CrossRef] [PubMed]
  14. Endo, H.; Tamura, K.; Fukasawa, T.; Kanegae, M.; Koga, J. Comparison of fructooligosaccharide utilization by Lactobacillus and Bacteroides species. Biosci. Biotech. Bioch. 2012, 76, 176–179. [Google Scholar] [CrossRef]
  15. Mao, B.Y.; Gu, J.Y.; Li, D.Y.; Cui, S.M.; Zhao, J.X.; Zhang, H.; Chen, W. Effects of Different Doses of Fructooligosaccharides (FOS) on the Composition of Mice Fecal Microbiota, Especially the Bifidobacterium Composition. Nutrients 2018, 10, 1105. [Google Scholar] [CrossRef]
  16. Hidaka, T.; Eida, T.; Takizawa, T.; Tokunaga, T.; Tashiro, Y. Effects of fructooligosaccharides on intestinal flora and human health. Biosci. Microflora 1986, 5, 37–50. [Google Scholar] [CrossRef]
  17. Pokusaeva, K.; Fitzgerald, G.F.; Sinderen, D.V. Carbohydrate metabolism in Bifidobacteria. Genes Nutri. 2011, 6, 285–306. [Google Scholar] [CrossRef]
  18. Mao, B.Y.; Li, D.Y.; Zhao, J.X.; Liu, X.M.; Gu, Z.N.; Chen, Y.Q.; Zhang, H.; Chen, W. Metagenomic insights into the effects of fructo-oligosaccharides (FOS) on the composition of fecal microbiota in mice. J. Agric. Food Chem. 2015, 63, 856–863. [Google Scholar] [CrossRef]
  19. Segata, N.; Izard, J.; Waldron, L.; Gevers, D.; Miropolsky, L.; Garrett, W.S.; Huttenhower, C. Metagenomic biomarker discovery and explanation. Genome Biol. 2011, 12, R60. [Google Scholar] [CrossRef]
  20. Wang, L.; Hu, L.; Yan, S.; Jiang, T.; Fang, S.; Wang, G.; Zhao, J.; Zhang, H.; Chen, W. Effects of different oligosaccharides at various dosages on the composition of gut microbiota and short-chain fatty acids in mice with constipation. Food Funct. 2017, 8, 1966–1978. [Google Scholar] [CrossRef]
  21. Pan, X.D.; Chen, F.Q.; Tian-Xing, W.U.; Tang, H.G.; Zhao, Z.Y. Prebiotic oligosaccharides change the concentrations of short-chain fatty acids and the microbial population of mouse bowel. J. Zhejiang Univ. Sci. B 2009, 10, 258–263. [Google Scholar] [CrossRef] [PubMed] [Green Version]
  22. Collares, E.F.; Rossi, M.A.; Macedo, A.S. Experimental dilatation of the cecum and colon in rats. II. Reversion after induction by the continuous administration of lactose. Arq. Gastroenterol. 1985, 22, 192–195. [Google Scholar] [CrossRef] [PubMed]
  23. Genda, T.; Kondo, T.; Hino, S.; Sugiura, S.; Nishimura, N.; Morita, T. The Impact of Fructo-Oligosaccharides on Gut Permeability and Inflammatory Responses in the Cecal Mucosa Quite Differs between Rats Fed Semi-Purified and Non-Purified Diets. J. Nutr. Sci. Vitaminol. 2018, 64, 357–366. [Google Scholar] [CrossRef] [PubMed] [Green Version]
  24. Tandon, D.; Haque, M.M.; Gote, M.; Jain, M.; Bhaduri, A.; Dubey, A.K.; Mande, S.S. A prospective randomized, double-blind, placebo-controlled, dose-response relationship study to investigate efficacy of fructo-oligosaccharides (FOS) on human gut microflora. Sci. Rep. 2019, 9, 5473. [Google Scholar] [CrossRef]
  25. Scott, K.P.; Martin, J.C.; Duncan, S.H.; Flint, H.J. Prebiotic stimulation of human colonic butyrate-producing bacteria and bifidobacteria, in vitro. FEMS Microbiol. Ecol. 2014, 87, 30–40. [Google Scholar] [CrossRef]
  26. Rivière, A.; Selak, M.; Lantin, D.; Leroy, F.; Vuyst, L.D. Bifidobacteria and Butyrate-Producing Colon Bacteria: Importance and Strategies for Their Stimulation in the Human Gut. Front. Microbiol. 2016, 7, 979. [Google Scholar] [CrossRef]
  27. Derrien, M.; Passel, M.W.V.; Bovenkamp, J.H.V.D.; Schipper, R.G.; Vos, W.M.D.; Dekker, J. Mucin-bacterial interactions in the human oral cavity and digestive tract. Gut Microbes 2010, 1, 254–268. [Google Scholar] [CrossRef] [Green Version]
  28. Linden, S.K.; Sutton, P.; Karlsson, N.G.; Korolik, V.; Mcguckin, M.A. Mucins in the mucosal barrier to infection. Mucosal Immunol. 2008, 1, 183–197. [Google Scholar] [CrossRef] [Green Version]
  29. Schauer, D.B.; Ghori, N.; Falkow, S. Isolation and characterization of “Flexispira rappini” from laboratory mice. J. Clin. Microbiol. 1993, 31, 2709–2714. [Google Scholar] [CrossRef]
  30. Romero, S.; Archer, J.R.; Hamacher, M.E.; Bologna, S.M.; Schell, R.F. Case report of an unclassified microaerophilic bacterium associated with gastroenteritis. J. Clin. Microbiol. 1988, 26, 142–143. [Google Scholar] [Green Version]
  31. Yoshioka, H.; Fujita, K.; Sakata, H.; Murono, K.; Iseki, K.I. Development of the Normal Intestinal Flora and Clinical Significance in Infants and Children. Bifidobact. Microflora 1991, 10, 11–17. [Google Scholar] [CrossRef] [Green Version]
  32. Welch, J.L.M.; Hasegawa, Y.; Mcnulty, N.P.; Gordon, J.I.; Borisy, G.G. Spatial organization of a model 15-member human gut microbiota established in gnotobiotic mice. Proc. Natl. Acad. Sci. USA 2017, 114, E9105. [Google Scholar] [CrossRef] [PubMed]
  33. Marx, S.P.; Winkler, S.; Hartmeier, W. Metabolization of β-(2,6)-linked fructose-oligosaccharides by different bifidobacteria. FEMS Microbiol. Lett. 2000, 182, 163–169. [Google Scholar] [CrossRef]
  34. Blay, L.; Michel, C.G.; Hervé, M.B.; Cherbut, C. Prolonged Intake of Fructo-Oligosaccharides Induces a Short-Term Elevation of Lactic Acid-Producing Bacteria and a Persistent Increase in Cecal Butyrate in Rats. J. Nutr. 1999, 129, 2231–2235. [Google Scholar] [CrossRef]
Figure 1. Changes in the composition of luminal (A) and mucosal (D) microbiota at the phylum level in the Control and FOS groups. Principal coordinate analysis (PCoA) score of luminal (B) and mucosal (E) microbiota based on the weighted UniFrac metrics. Linear discriminant analysis effect size (LEfSe) analysis of the differences between luminal (C) and mucosal (F) microbiota at the phylum level. CeC, CC1, CC2, and CC3 represent the contents of the cecum, proximal colon, middle colon and distal colon, respectively. CeM, CM1, CM2, and CM3 represent the mucosa of the cecum, proximal colon, middle colon and distal colon, respectively.
Nutrients 11 02431 g001
Figure 2. Changes in the composition of luminal (A) and mucosal (B) microbiota at the genus level in the control and FOS groups. LEfSe analysis of the differences between luminal (C) and mucosal (D) microbiota at the genus level. CeC, CC1, CC2 and CC3 reprsent the contents of the cecum, proximal colon, middle colon and distal colon, respectively. CeM, CM1, CM2 and CM3 represent the mucosa of the cecum, proximal colon, middle colon and distal colon, respectively.
Nutrients 11 02431 g002
Figure 3. Changes in the relative abundance of specific genera, including Bifidobacterium (A), Coprococcus (B), Allobaculum (C), Parabacteroides (D), Lactobacillus (E), Enterococcus (F), Blautia (G), Flexispira (H). Significant differences (p < 0.05) are indicated with an asterisk (*).
Nutrients 11 02431 g003
Figure 4. Effects of FOS on the relative abundance of Bifidobacterium species within the Bifidobacterium genus (A,C) and in the microbiota (B,D). A, and B indicate the contents and C, and D indicate the mucosa. “0” represents before FOS intervention, and “1” represents after FOS intervention.
Nutrients 11 02431 g004
Table 1. Cecal weights (g) in the control and fructooligosaccharides (FOS) groups.
ItemControl GroupFOS Groupp1
Total weight0.28 ± 0.04 b0.87 ± 0.16 a<0.01
Wall weight0.10 ± 0.03 b0.26 ± 0.05 a<0.05
Content weight0.18 ± 0.03 b0.61 ± 0.07 a<0.01
1 Significant differences between the control and FOS groups are indicated by different letters (a, b), and significance was accepted at p < 0.05.
Table 2. pH of the luminal contents of the cecum and proximal, middle, and distal colon in the control and FOS groups.
ItempHp1
Control GroupFOS Group
Cecum8.03 ± 0.12 a6.13 ± 0.06 b<0.001
ColonProximal7.46 ± 0.15 a5.93 ± 0.66 b<0.05
Middle7.62 ± 0.26 a6.12 ± 0.29 b<0.001
Distal7.11 ± 0.42 a6.43 ± 0.26 b<0.05
1 Significant differences between the control and FOS groups are indicated by different letters (a, b), and significance was accepted at p < 0.05.
Table 3. Short-chain fatty acids (SCFAs) contents (μmol) of the cecum in the control and FOS groups (μmol) 1.
SCFAsControl GroupFOS Groupp2
Acetic acid7.41 ± 2.60 b31.17 ± 11.08 a<0.001
Propionic acid3.23 ± 0.81 b10.17 ± 4.71 a<0.01
Butyric acid1.55 ± 0.36 b3.58 ± 0.88 a<0.01
Isobutyric acid3.04 ± 0.73 b14.60 ± 7.15 a<0.01
Valeric acid0.77 ± 0.23 b1.82 ± 0.44 a<0.01
Isovaleric acid1.12 ± 0.28 b2.59 ± 0.64 a<0.01
Total17.12 ± 4.10 b63.93 ± 15.74 a<0.01
1 The SCFA contents were calculated from the concentrations of SCFAs (Table S2) and the weight of cecal contents. 2 Significant differences between the control and FOS groups were indicated by different letters (a, b). Significance was accepted at p < 0.05.

