Association between Different Animal Protein Sources and Liver Status in Obese Subjects with Non-Alcoholic Fatty Liver Disease: Fatty Liver in Obesity (FLiO) Study

 , , ,
, , ,  , , and
Abstract
1. Introduction
2. Materials and Methods
2.1. Study Participants
2.2. Anthropometric, Body Composition, and Biochemical Measurements
2.3. Lifestyle Assessment: Dietary and Physical Activity
2.4. Liver Status Assessment
2.5. Statistical Analyses
3. Results
4. Discussion
5. Conclusions
Author Contributions
Funding
Acknowledgments
Conflicts of Interest
References
- Tenorio-Jiménez, C.; Martínez-Ramírez, M.J.; Tercero-Lozano, M.; Arraiza-Irigoyen, C.; Del Castillo-Codes, I.; Olza, J.; Plaza-Díaz, J.; Fontana, L.; Migueles, J.H.; Olivares, M.; et al. Evaluation of the effect of Lactobacillus reuteri V3401 on biomarkers of inflammation, cardiovascular risk and liver steatosis in obese adults with metabolic syndrome: A randomized clinical trial (PROSIR). BMC Complement. Altern. Med. 2018, 18, 1–8. [Google Scholar] [CrossRef] [PubMed]
- Vallianou, N.; Stratigou, T.; Christodoulatos, G.S.; Dalamaga, M. Understanding the Role of the Gut Microbiome and Microbial Metabolites in Obesity and Obesity-Associated Metabolic Disorders: Current Evidence and Perspectives. Curr. Obes. Rep. 2019, 8, 1–16. [Google Scholar] [CrossRef] [PubMed]
- Cantero, I.; Abete, I.; Del Bas, J.M.; Caimari, A.; Arola, L.; Zulet, M.A.; Martinez, J.A. Changes in lysophospholipids and liver status after weight loss: The RESMENA study. Nutr. Metab. 2018, 15, 1–11. [Google Scholar] [CrossRef]
- Bessone, F.; Razori, M.V.; Roma, M.G. Molecular pathways of nonalcoholic fatty liver disease development and progression. Cell. Mol. Life Sci. 2019, 76, 99–128. [Google Scholar] [CrossRef] [PubMed]
- Perdomo, C.M.; Frühbeck, G.; Escalada, J. Impact of Nutritional Changes on Nonalcoholic Fatty Liver Disease. Nutrients 2019, 11, 677. [Google Scholar] [CrossRef]
- Cantero, I.; Elorz, M.; Abete, I.; Marin, B.A.; Herrero, J.I.; Monreal, J.I.; Benito, A.; Quiroga, J.; Martínez, A.; Huarte, M.P.; et al. Ultrasound/elastography techniques, lipidomic and blood markers compared to magnetic resonance imaging in non-alcoholic fatty liver disease adults. Int. J. Med. Sci. 2019, 16, 75–83. [Google Scholar] [CrossRef] [PubMed]
- Svegliati-Baroni, G.; Pierantonelli, I.; Torquato, P.; Marinelli, R.; Ferreri, C.; Chatgilialoglu, C.; Bartolini, D.; Galli, F. Lipidomic biomarkers and mechanisms of lipotoxicity in non-alcoholic fatty liver disease. Free Radic. Biol. Med. 2019, 1–16. [Google Scholar] [CrossRef]
- Marin-Alejandre, B.A.; Abete, I.; Cantero, I.; Riezu-Boj, J.I.; Milagro, F.I.; Monreal, J.I.; Elorz, M.; Herrero, J.I.; Benito-Boillos, A.; Quiroga, J.; et al. Association between sleep disturbances and liver status in obese subjects with nonalcoholic fatty liver disease: A comparison with healthy controls. Nutrients 2019, 11, 322. [Google Scholar] [CrossRef]
- Zelber-Sagi, S.; Ivancovsky-Wajcman, D.; Fliss, N.; Orenstein, D.; Shibolet, O.; Kariv, R. High red and processed meat consumption is associated with non-alcoholic fatty liver disease and insulin resistance. J. Hepatol. 2018, 68, 1239–1246. [Google Scholar] [CrossRef]
- Liu, X.; Peng, Y.; Chen, S.; Sun, Q. An observational study on the association between major dietary patterns and non-alcoholic fatty liver disease in Chinese adolescents. Medicine 2018, 97, 1–7. [Google Scholar] [CrossRef]
- Soleimani, D.; Rezvani, R.; Goshayeshi, L.; Nematy, M. Dietary patterns in relation to hepatic fibrosis among patients with nonalcoholic fatty liver disease. Diabetes Metab. Syndr. Obes. Targets Ther. 2019, 12, 315–324. [Google Scholar] [CrossRef]
- Shi, L.; Brunius, C.; Johansson, I.; Bergdahl, I.A.; Lindahl, B.; Hanhineva, K.; Landberg, R. Plasma metabolites associated with healthy Nordic dietary indexes and risk of type 2 diabetes—A nested case-control study in a Swedish population. Am. J. Clin. Nutr. 2018, 108, 564–575. [Google Scholar] [CrossRef] [PubMed]
- Luan, D.; Wang, D.; Campos, H.; Baylin, A. Red meat consumption and metabolic syndrome in the Costa Rica Heart Study. Eur. J. Nutr. 2019, 1–9. [Google Scholar] [CrossRef] [PubMed]
- Kim, Y.; Je, Y. Meat consumption and risk of metabolic syndrome: Results from the Korean population and a meta-analysis of observational studies. Nutrients 2018, 10, 390. [Google Scholar] [CrossRef] [PubMed]
- McKay, A.; Wilman, H.R.; Dennis, A.; Kelly, M.; Gyngell, M.L.; Neubauer, S.; Bell, J.D.; Banerjee, R.; Thomas, E.L. Measurement of liver iron by magnetic resonance imaging in the UK Biobank population. PLoS ONE 2018, 13, e0209340. [Google Scholar] [CrossRef] [PubMed]
- Arendt, B.M.; Teterina, A.; Pettinelli, P.; Comelli, E.M.; Ma, D.W.L.; Fung, S.K.; McGilvray, I.D.; Fischer, S.E.; Allard, J.P. Cancer-related gene expression is associated with disease severity and modifiable lifestyle factors in non-alcoholic fatty liver disease. Nutrition 2019, 62, 100–107. [Google Scholar] [CrossRef]
- De La Iglesia, R.; Lopez-Legarrea, P.; Abete, I.; Bondia-Pons, I.; Navas-Carretero, S.; Forga, L.; Martinez, J.A.; Zulet, M.A. A new dietary strategy for long-term treatment of the metabolic syndrome is compared with the American heart association (AHA) guidelines: The MEtabolic Syndrome REduction in NAvarra (RESMENA) project. Br. J. Nutr. 2014, 111, 643–652. [Google Scholar] [CrossRef]
- Fernández-Ballart, J.D.; Piñol, J.L.; Zazpe, I.; Corella, D.; Carrasco, P.; Toledo, E.; Perez-Bauer, M.; Martínez-González, M.Á.; Salas-Salvadó, J.; Martn-Moreno, J.M. Relative validity of a semi-quantitative food-frequency questionnaire in an elderly Mediterranean population of Spain. Br. J. Nutr. 2010, 103, 1808–1816. [Google Scholar] [CrossRef]
- Moreiras, O.; Carvajal, A.; Cabrera, L. Tablas de Composición de Alimentos Españoles (Spanish Food Composition Tables); Pirámide: Madrid, Spain, 2009. [Google Scholar]
- Wang, D.; Campos, H.; Baylin, A. Red meat intake is positively associated with non-fatal acute myocardial infarction in the Costa Rica Heart Study. Br. J. Nutr. 2017, 118, 303–311. [Google Scholar] [CrossRef][Green Version]
- Colom, A.; Fiol, M.; Ruiz, M.; Compa, M.; Morey, M.; Moñino, M.; Romaguera, D. Association between access to public open spaces and physical activity in a mediterranean population at high cardiovascular risk. Int. J. Environ. Res. Public Health 2018, 15, 1285. [Google Scholar] [CrossRef]
- Cassinotto, C.; Boursier, J.; de Lédinghen, V.; Lebigot, J.; Lapuyade, B.; Cales, P.; Hiriart, J.B.; Michalak, S.; Bail, B.L.; Cartier, V.; et al. Liver stiffness in nonalcoholic fatty liver disease: A comparison of supersonic shear imaging, FibroScan, and ARFI with liver biopsy. Hepatology 2016, 63, 1817–1827. [Google Scholar] [CrossRef] [PubMed]
- Zelber-Sagi, S.; Salomone, F.; Mlynarsky, L. The Mediterranean dietary pattern as the diet of choice for non-alcoholic fatty liver disease: Evidence and plausible mechanisms. Liver Int. 2017, 37, 936–949. [Google Scholar] [CrossRef] [PubMed]
- Fakhoury-Sayegh, N.; Younes, H.; Heraoui, G.N.H.A.; Sayegh, R. Nutritional profile and dietary patterns of lebanese non-alcoholic fatty liver disease patients: A case-control study. Nutrients 2017, 9, 1245. [Google Scholar] [CrossRef] [PubMed]
- Kim, S.R.; Kim, K.; Lee, S.A.; Kwon, S.O.; Lee, J.K.; Keum, N.; Park, S.M. Effect of red, processed, and white meat consumption on the risk of gastric cancer: An overall and dose-response meta-analysis. Nutrients 2019, 11, 826. [Google Scholar] [CrossRef]
- Alshahrani, S.M.; Fraser, G.E.; Sabaté, J.; Knutsen, R.; Shavlik, D.; Mashchak, A.; Lloren, J.I.; Orlich, M.J. Red and processed meat and mortality in a low meat intake population. Nutrients 2019, 11, 622. [Google Scholar] [CrossRef] [PubMed]
- Zhu, Z.; Wu, F.; Lu, Y.; Wu, C.; Wang, Z.; Zang, J.; Guo, C.; Jia, X.; Yao, J.; Peng, H.; et al. Total and nonheme dietary iron intake is associated with metabolic syndrome and its components in Chinese men and women. Nutrients 2018, 10, 1663. [Google Scholar] [CrossRef] [PubMed]
- Zhou, J.H.; She, Z.G.; Li, H.L.; Cai, J.J. Noninvasive evaluation of nonalcoholic fatty liver disease: Current evidence and practice. World J. Gastroenterol. 2019, 25, 1307–1326. [Google Scholar] [CrossRef]
- Miyanishi, K.; Tanaka, S.; Sakamoto, H.; Kato, J. The role of iron in hepatic inflammation and hepatocellular carcinoma. Free Radic. Biol. Med. 2019, 133, 200–205. [Google Scholar] [CrossRef]
- Jung, J.Y.; Shim, J.J.; Park, S.K.; Ryoo, J.H.; Choi, J.M.; Oh, I.H.; Jung, K.W.; Cho, H.; Ki, M.; Won, Y.J.; et al. Serum ferritin level is associated with liver steatosis and fibrosis in Korean general population. Hepatol. Int. 2019, 13, 222–233. [Google Scholar] [CrossRef]
- Willmann, C.; Heni, M.; Linder, K.; Wagner, R.; Stefan, N.; Machann, J.; Schulze, M.B.; Joost, H.G.; Häring, H.U.; Fritsche, A. Potential effects of reduced red meat compared with increased fiber intake on glucose metabolism and liver fat content: A randomized and controlled dietary intervention study. Am. J. Clin. Nutr. 2019, 109, 288–296. [Google Scholar] [CrossRef]
- El Nakeeb, N.; Saleh, S.A.; Massoud, Y.M.; Hussein, A.; Hamed, R. Serum ferritin as a non-invasive marker in the prediction of hepatic fibrosis among Egyptian patients with non-alcoholic fatty liver disease. JGH Open 2017, 1, 112–119. [Google Scholar] [CrossRef] [PubMed]
- Shah, R.A.; Kowdley, K.V. Serum ferritin as a biomarker for NAFLD: Ready for prime time? Hepatol. Int. 2019, 13, 110–112. [Google Scholar] [CrossRef] [PubMed]
- Nogueira, M.A.; Oliveira, C.P.; Ferreira Alves, V.A.; Stefano, J.T.; dos Reis Rodrigues, L.S.; Torrinhas, R.S.; Cogliati, B.; Barbeiro, H.; Carrilho, F.J.; Waitzberg, D.L. Omega-3 polyunsaturated fatty acids in treating non-alcoholic steatohepatitis: A randomized, double-blind, placebo-controlled trial. Clin. Nutr. 2016, 35, 578–586. [Google Scholar] [CrossRef] [PubMed]
- Pan, X.; Chen, B.; Liu, W.; Li, Y.; Hu, Z.; Lin, X.; Xu, S.; Peng, X.E. Circulating Iron Levels Interaction with Central Obesity on the Risk of Nonalcoholic Fatty Liver Disease: A Case-Control Study in Southeast China. Ann. Nutr. Metab. 2019, 74, 207–214. [Google Scholar] [CrossRef]
- Modares Mousavi, S.R.; Geramizadeh, B.; Anushiravani, A.; Ejtehadi, F.; Anbardar, M.H.; Moini, M. Correlation between Serum Ferritin Level and Histopathological Disease Severity in Non-alcoholic Fatty Liver Disease. Middle East J. Dig. Dis. 2018, 10, 90–95. [Google Scholar] [CrossRef] [PubMed]
- Buzzetti, E.; Petta, S.; Manuguerra, R.; Luong, T.V.; Cabibi, D.; Corradini, E.; Craxì, A.; Pinzani, M.; Tsochatzis, E.; Pietrangelo, A. Evaluating the association of serum ferritin and hepatic iron with disease severity in non-alcoholic fatty liver disease. Liver Int. 2019, 39, 1325–1334. [Google Scholar] [CrossRef]
- Tutino, V.; De Nunzio, V.; Caruso, M.G.; Bonfiglio, C.; Franco, I.; Mirizzi, A.; De Leonardis, G.; Cozzolongo, R.; Giannuzzi, V.; Giannelli, G.; et al. Aerobic physical activity and a low glycemic diet reduce the AA/EPA ratio in red blood cell membranes of patients with NAFLD. Nutrients 2018, 10, 1299. [Google Scholar] [CrossRef] [PubMed]
- Ryan, J.D.; Armitage, A.E.; Cobbold, J.F.; Banerjee, R.; Borsani, O.; Dongiovanni, P.; Neubauer, S.; Morovat, R.; Wang, L.M.; Pasricha, S.R.; et al. Hepatic iron is the major determinant of serum ferritin in NAFLD patients. Liver Int. 2018, 38, 164–173. [Google Scholar] [CrossRef]
- Sabrina, N.; Bai, C.H.; Chang, C.C.; Chien, Y.W.; Chen, J.R.; Chang, J.S. Serum iron:Ferritin ratio predicts healthy body composition and reduced risk of severe fatty liver in young adult women. Nutrients 2017, 9, 833. [Google Scholar] [CrossRef]
- Britton, L.; Bridle, K.; Reiling, J.; Santrampurwala, N.; Wockner, L.; Ching, H.; Stuart, K.; Subramaniam, V.N.; Jeffrey, G.; St. Pierre, T.; et al. Hepatic iron concentration correlates with insulin sensitivity in nonalcoholic fatty liver disease. Hepatol. Commun. 2018, 2, 644–653. [Google Scholar] [CrossRef]
- Peng, X.E.; Xu, S.H.; Liu, W.; Hu, Z.; Lin, Z.; Lin, X. Independent and combined effects of dietary iron composition and selected risk factors on the risk of NAFLD in a Chinese population. Sci. Rep. 2019, 9, 1–8. [Google Scholar] [CrossRef] [PubMed]
- Freedman, N.D.; Cross, A.J.; McGlynn, K.A.; Abnet, C.C.; Park, Y.; Hollenbeck, A.R.; Schatzkin, A.; Everhart, J.E.; Sinha, R. Association of meat and fat intake with liver disease and hepatocellular carcinoma in the NIH-AARP cohort. J. Natl. Cancer Inst. 2010, 102, 1354–1365. [Google Scholar] [CrossRef] [PubMed]
- Wong, V.W.S.; Adams, L.A.; de Lédinghen, V.; Wong, G.L.H.; Sookoian, S. Noninvasive biomarkers in NAFLD and NASH—Current progress and future promise. Nat. Rev. Gastroenterol. Hepatol. 2018, 15, 461–478. [Google Scholar] [CrossRef] [PubMed]
- Katsagoni, C.N.; Papatheodoridis, G.V.; Ioannidou, P.; Deutsch, M.; Alexopoulou, A.; Papadopoulos, N.; Papageorgiou, M.V.; Fragopoulou, E.; Kontogianni, M.D. Improvements in clinical characteristics of patients with non-alcoholic fatty liver disease, after an intervention based on the Mediterranean lifestyle: A randomised controlled clinical trial. Br. J. Nutr. 2018, 120, 164–175. [Google Scholar] [CrossRef] [PubMed]
- Stål, P. Liver fibrosis in non-alcoholic fatty liver disease—Diagnostic challenge with prognostic significance. World J. Gastroenterol. 2015, 21, 11077–11087. [Google Scholar] [CrossRef] [PubMed]
- Alferink, L.J.M.; Trajanoska, K.; Erler, N.S.; Schoufour, J.D.; Knegt, R.J.; Ikram, M.A.; Janssen, H.L.A.; Franco, O.H.; Metselaar, H.J.; Rivadeneira, F.; et al. Nonalcoholic Fatty Liver Disease in The Rotterdam Study: About Muscle Mass, Sarcopenia, Fat Mass, and Fat Distribution. J. Bone Miner. Res. 2019, 1–10. [Google Scholar] [CrossRef]


| n = 112 | Red Meat (g/day) | Processed Meat (g/day) | White Meat (g/day) | Fish (g/day) | ||||
|---|---|---|---|---|---|---|---|---|
| <53.7 | ≥53.7 | <42.5 | ≥42.5 | <73.05 | ≥73.05 | <88.5 | ≥88.5 | |
| Body composition | ||||||||
| BMI (kg/m2) | 33.9 (4) | 33.5 (3) | 33.5 (3) | 33.9 (4) | 34.1 (4) | 33.1 (3) | 33.2 (4) | 34.1 (4) |
| WC (cm) | 110.0 (10) | 109.5 (9) | 109.8 (10) | 109.8 (9) | 111.2 (10) | 107.9 (9) | 108.1 (9) | 111.4 (11) |
| Fat Mass (kg) | 40.6 (9) | 38.3 (8) | 38.6 (7) | 40.2 (10) | 40.4 (8) | 38.2 (9) | 38.2 (8) | 40.8 (9) |
| Lean Mass (kg) | 51.9 (8) | 54.2 (10) | 53.0 (10) | 53.0 (8) | 54.4 (10) | 51.3 (9) | 52.9 (9) | 53.1 (10) |
| CMRF | ||||||||
| Glucose (mg/dL) | 110.0 (29) | 107.9 (34) | 108.0 (26) | 109.9 (37) | 112.0 (38) | 104.9 (14) | 109.3 (36) | 108.6 (26) |
| TG (mg/dL) | 129.3 (88) | 146.3 (70) * | 128.7 (75) | 146.6 (83) | 138.5 (78) | 136.8 (82) | 141.3 (74) | 134.2 (85) |
| SPB (mmHg) | 129.0 (16) | 133.5 (12) | 131.2 (16) | 131.4 (12) | 133.5 (15) | 128.4 (12) | 129.5 (13) | 133.1 (15) |
| DBP (mmHg) | 86.3 (11) | 87.5 (6) | 87.2 (10) | 86.1 (7) | 87.2 (9) | 86.5 (8) | 86.3 (8) | 87.5 (9) |
| HDL-c (mg/dL) | 54.6 (13) | 49.5 (14) * | 54.4 (14) | 49.8 (14) * | 52.3 (14) | 51.7 (13) | 51.5 (14) | 52.6 (14) |
| LDL-c (mg/dL) | 113.9 (31) | 121.3 (38) | 110.8 (38) | 124.1 (31) * | 120.2 (32) | 114.3 (38) | 116.2 (35) | 119.1 (35) |
| TC (mg/dL) | 193.6 (36) | 200.2 (42) | 190.3 (42) | 203.3 (36) | 199.6 (36) | 193.3 (43) | 196.1 (38) | 197.8 (41) |
| HOMA-IR | 5.5 (4.6) | 4.9 (5.0) | 5.1 (3.4) | 5.3 (5.9) | 5.5 (5.3) | 4.8 (4.0) | 5.2 (5.2) | 5.2 (4.4) |
| HbA1c (%) | 5.9 (1.0) | 5.8 (1.0) | 5.9 (0.9) | 5.9 (1.2) | 6.1 (1.3) | 5.6 (0.3) | 5.8 (1.1) | 5.9 (1.0) |
| Insulin (U/mL) | 19.2 (13) | 17.2 (8) | 18.3 (10) | 18.2 (12) | 18.4 (10) | 18.0 (12) | 18.1 (10) | 18.4 (12) |
| Liver Status | ||||||||
| ALT (IU/L) | 29.6 (15) | 36.7 (20) * | 34.6 (21) | 31.7 (14) | 34.2 (18) | 31.8 (18) | 35.7 (19) | 30.6 (16) |
| AST (IU/L) | 23.8 (11) | 25.1 (8) | 25.8 (12) | 23.2 (7) | 24.8 (10) | 23.9 (9) | 26.2 (12) | 22.7 (7) |
| GGT (IU/L) | 34.9 (24) | 40.1 (27) | 36.3 (24) | 38.7 (27) | 36.7 (26) | 38.6 (24) | 40.4 (27) | 34.7 (24) |
| Ferritin (ng/mL) | 119.2 (116) | 181.0 (137) * | 135.4 (119) | 164.3 (139) | 144.3 (116) | 157.8 (146) | 178.7 (147) | 121.5 (104) |
| Liver Fat (%) | 9.6 (11.1) | 8.7 (7.8) | 9.7 (9.6) | 8.6 (9.7) | 9.6 (10.4) | 8.7 (8.6) | 8.9 (9.8) | 9.4 (9.5) |
| Liver Iron (%) | 34.1 (11) | 36.9 (11) | 34.1 (12) | 37.1 (10) * | 36.8 (12) | 33.9 (9) | 35.6 (11) | 35.4 (12) |
| MRI H.V (mL) | 1799 (552) | 1855 (444) | 1749(461) | 1906 (528) | 1887 (575) | 1752 (376) | 1784 (436) | 1870 (557) |
| LSF (kPa) | 4.6 (1.8) | 5.4 (2.2) | 5.5 (2.2) | 4.5 (1.8) * | 5.2 (2.1) | 4.8 (1.9) | 4.7 (1.8) | 5.3 (2.2) |
| ARFI (m/s) | 1.9 (0.8) | 1.7 (0.7) | 1.8 (0.7) | 1.9 (0.8) | 1.8 (0.8) | 1.9 (0.7) | 1.8 (0.8) | 1.8 (0.7) |
| Steatosis Degree | ||||||||
| Grade 1 (n) (%) | 30 (53.5%) | 32 (57.1%) | 27 (49.1%) | 35 (61.4%) | 34 (53.1%) | 28 (58.3%) | 30 (53.5%) | 32 (57.1%) |
| Grade 2 (n) (%) | 19 (33.9%) | 19 (33.9%) | 23 (41.8%) | 15 (26.3%) | 21 (32.8%) | 17 (35.4%) | 20 (35.7%) | 18 (32.1%) |
| Grade 3 (n) (%) | 7 (12.5%) | 5 (8.9%) | 5 (9.1%) | 7 (12.2%) | 9 (14.1%) | 3 (6.2%) | 6 (10.7%) | 6 (10.7%) |
| Model 1 | Model 2 | |||||||
|---|---|---|---|---|---|---|---|---|
| β | (95% CI) | p-Value | β | (95% CI) | p-Value | |||
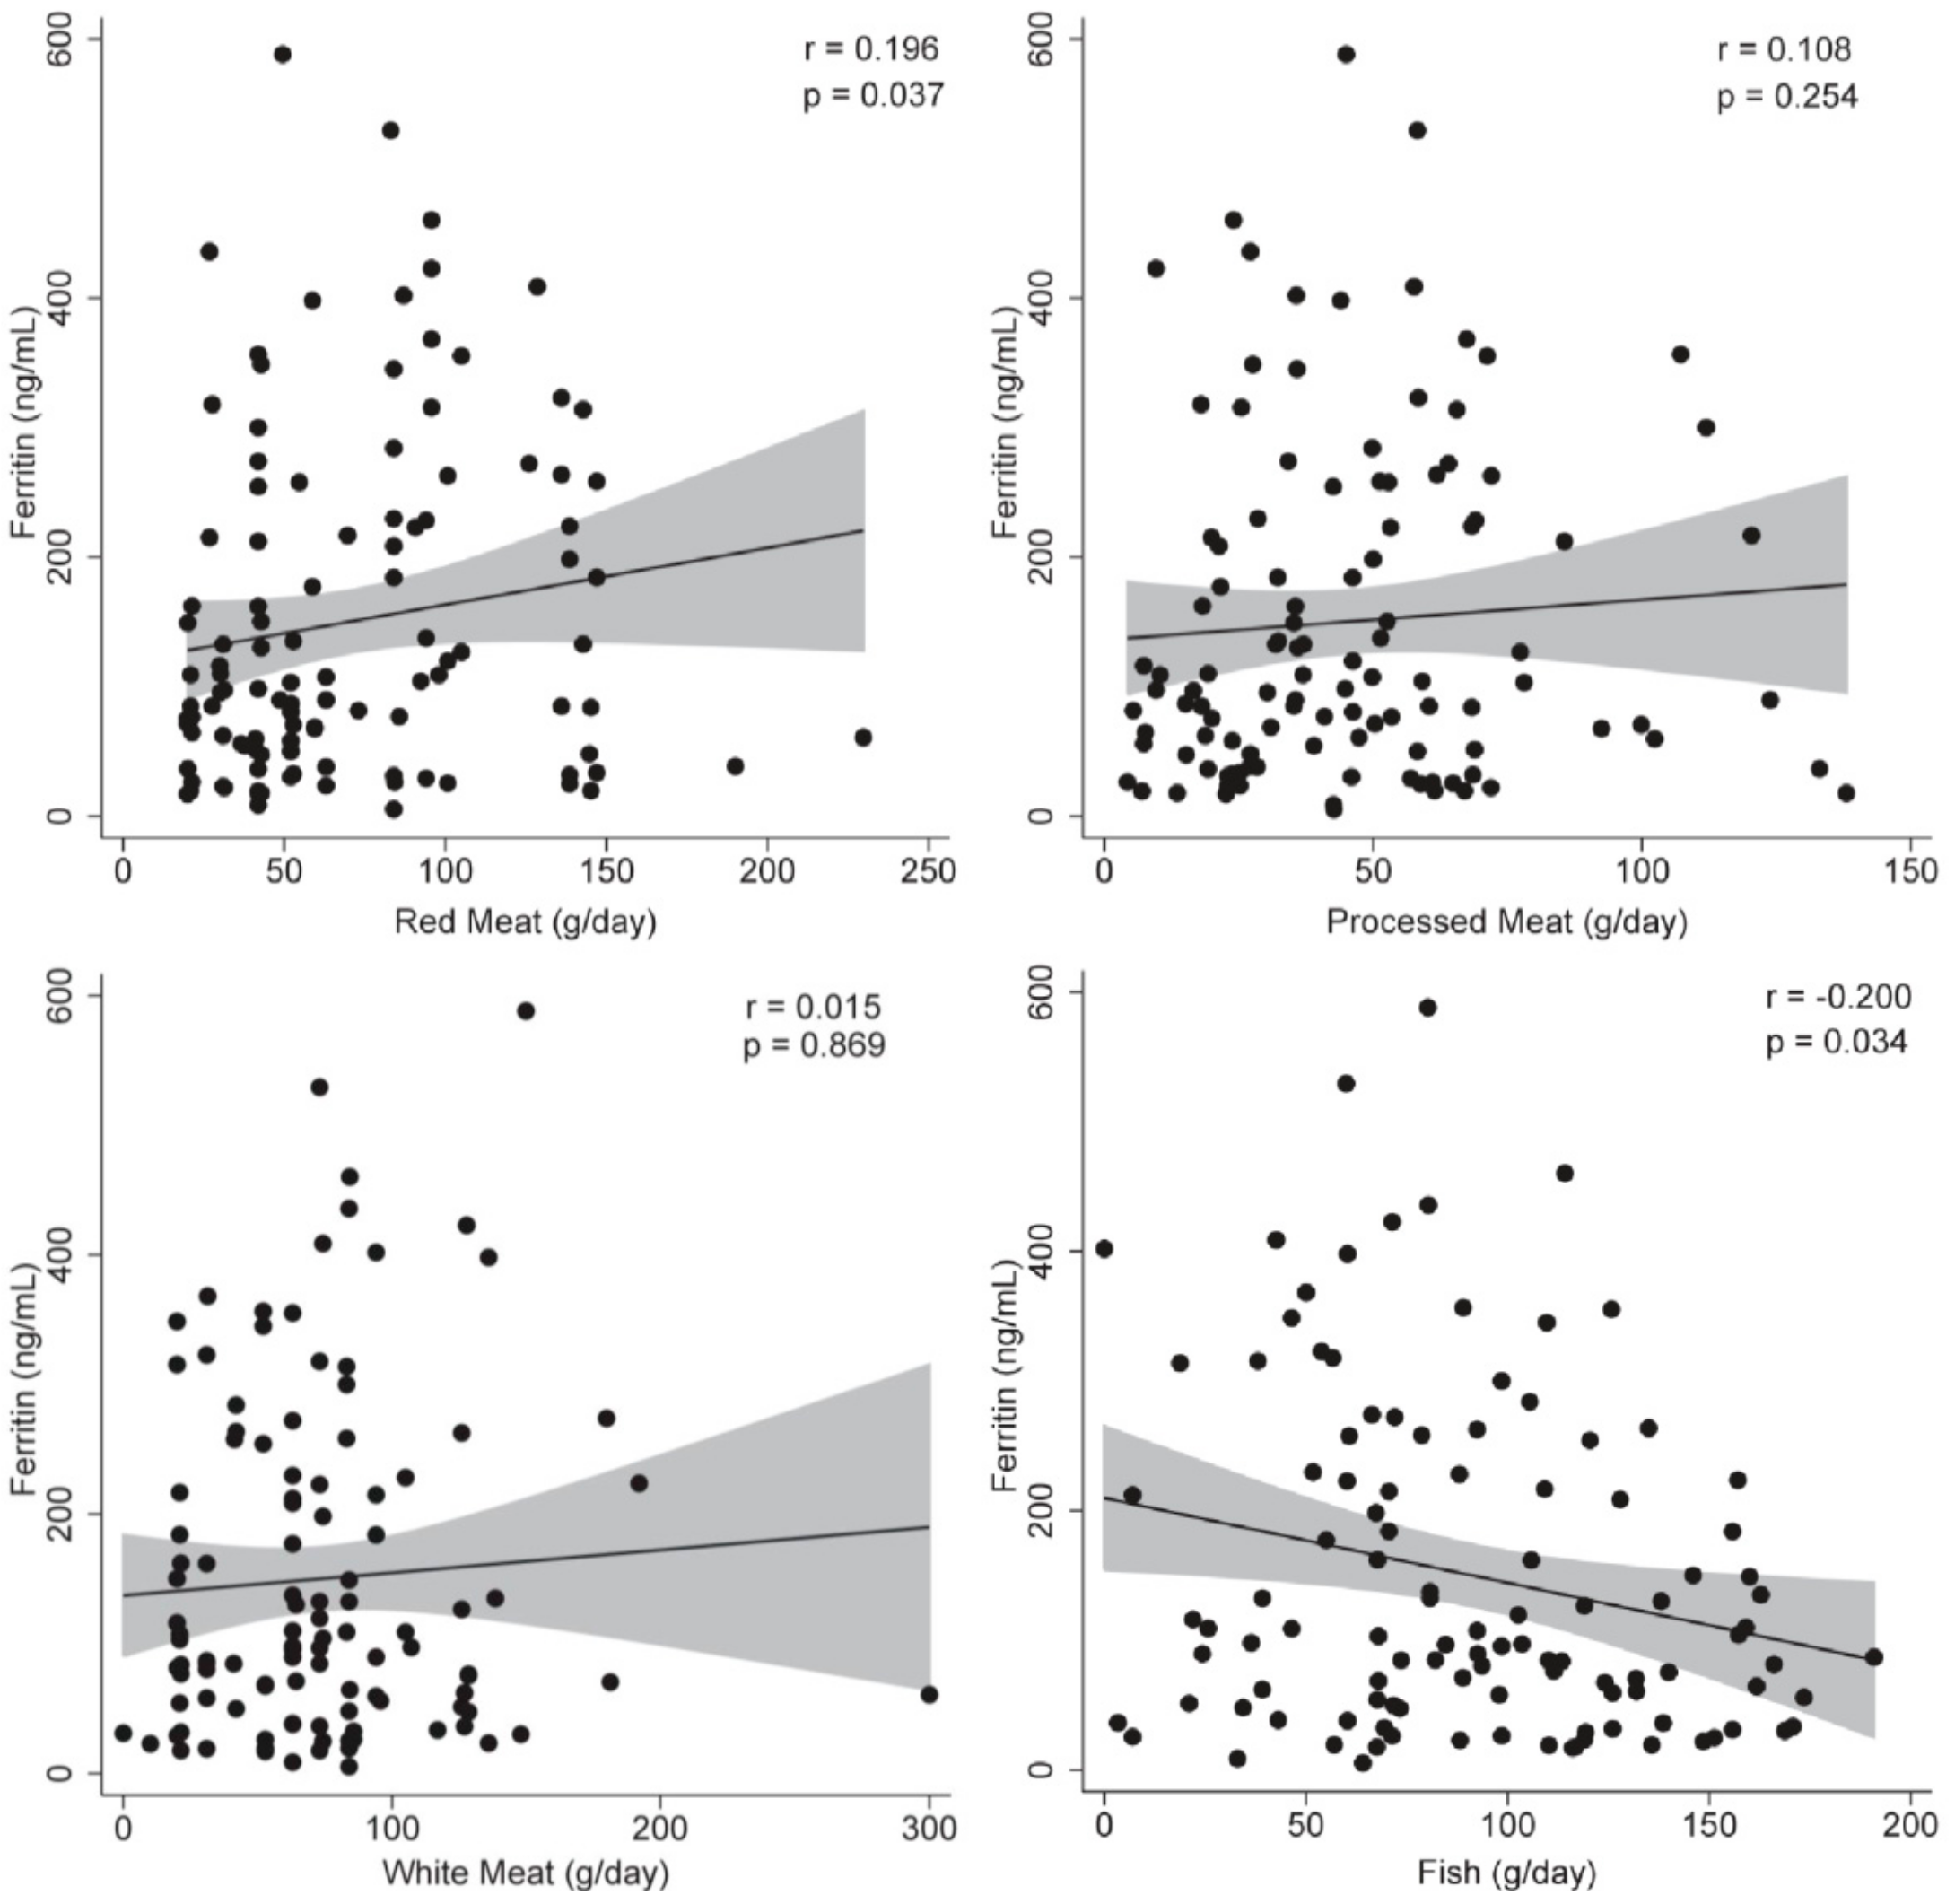
| Red Meat | 0.349 | (−0.271 | 0.970) | 0.267 | 0.281 | (−0.507 | 1.071) | 0.481 |
| Processed Meat | 0.230 | (−0.762 | 1.222) | 0.647 | 0.694 | (−0.593 | 1.981) | 0.287 |
| White Meat | 0.046 | (−0.598 | 0.690) | 0.888 | −0.208 | (−0.917 | 0.499) | 0.560 |
| Fish | −0.490 | (−1.106 | 0.126) | 0.118 | −0.720 | (−1.383 | −0.058) | 0.033 |
| Model 1 | Model 2 | |||||||
|---|---|---|---|---|---|---|---|---|
| β | (95% CI) | p-Value | β | (95% CI) | p-Value | |||
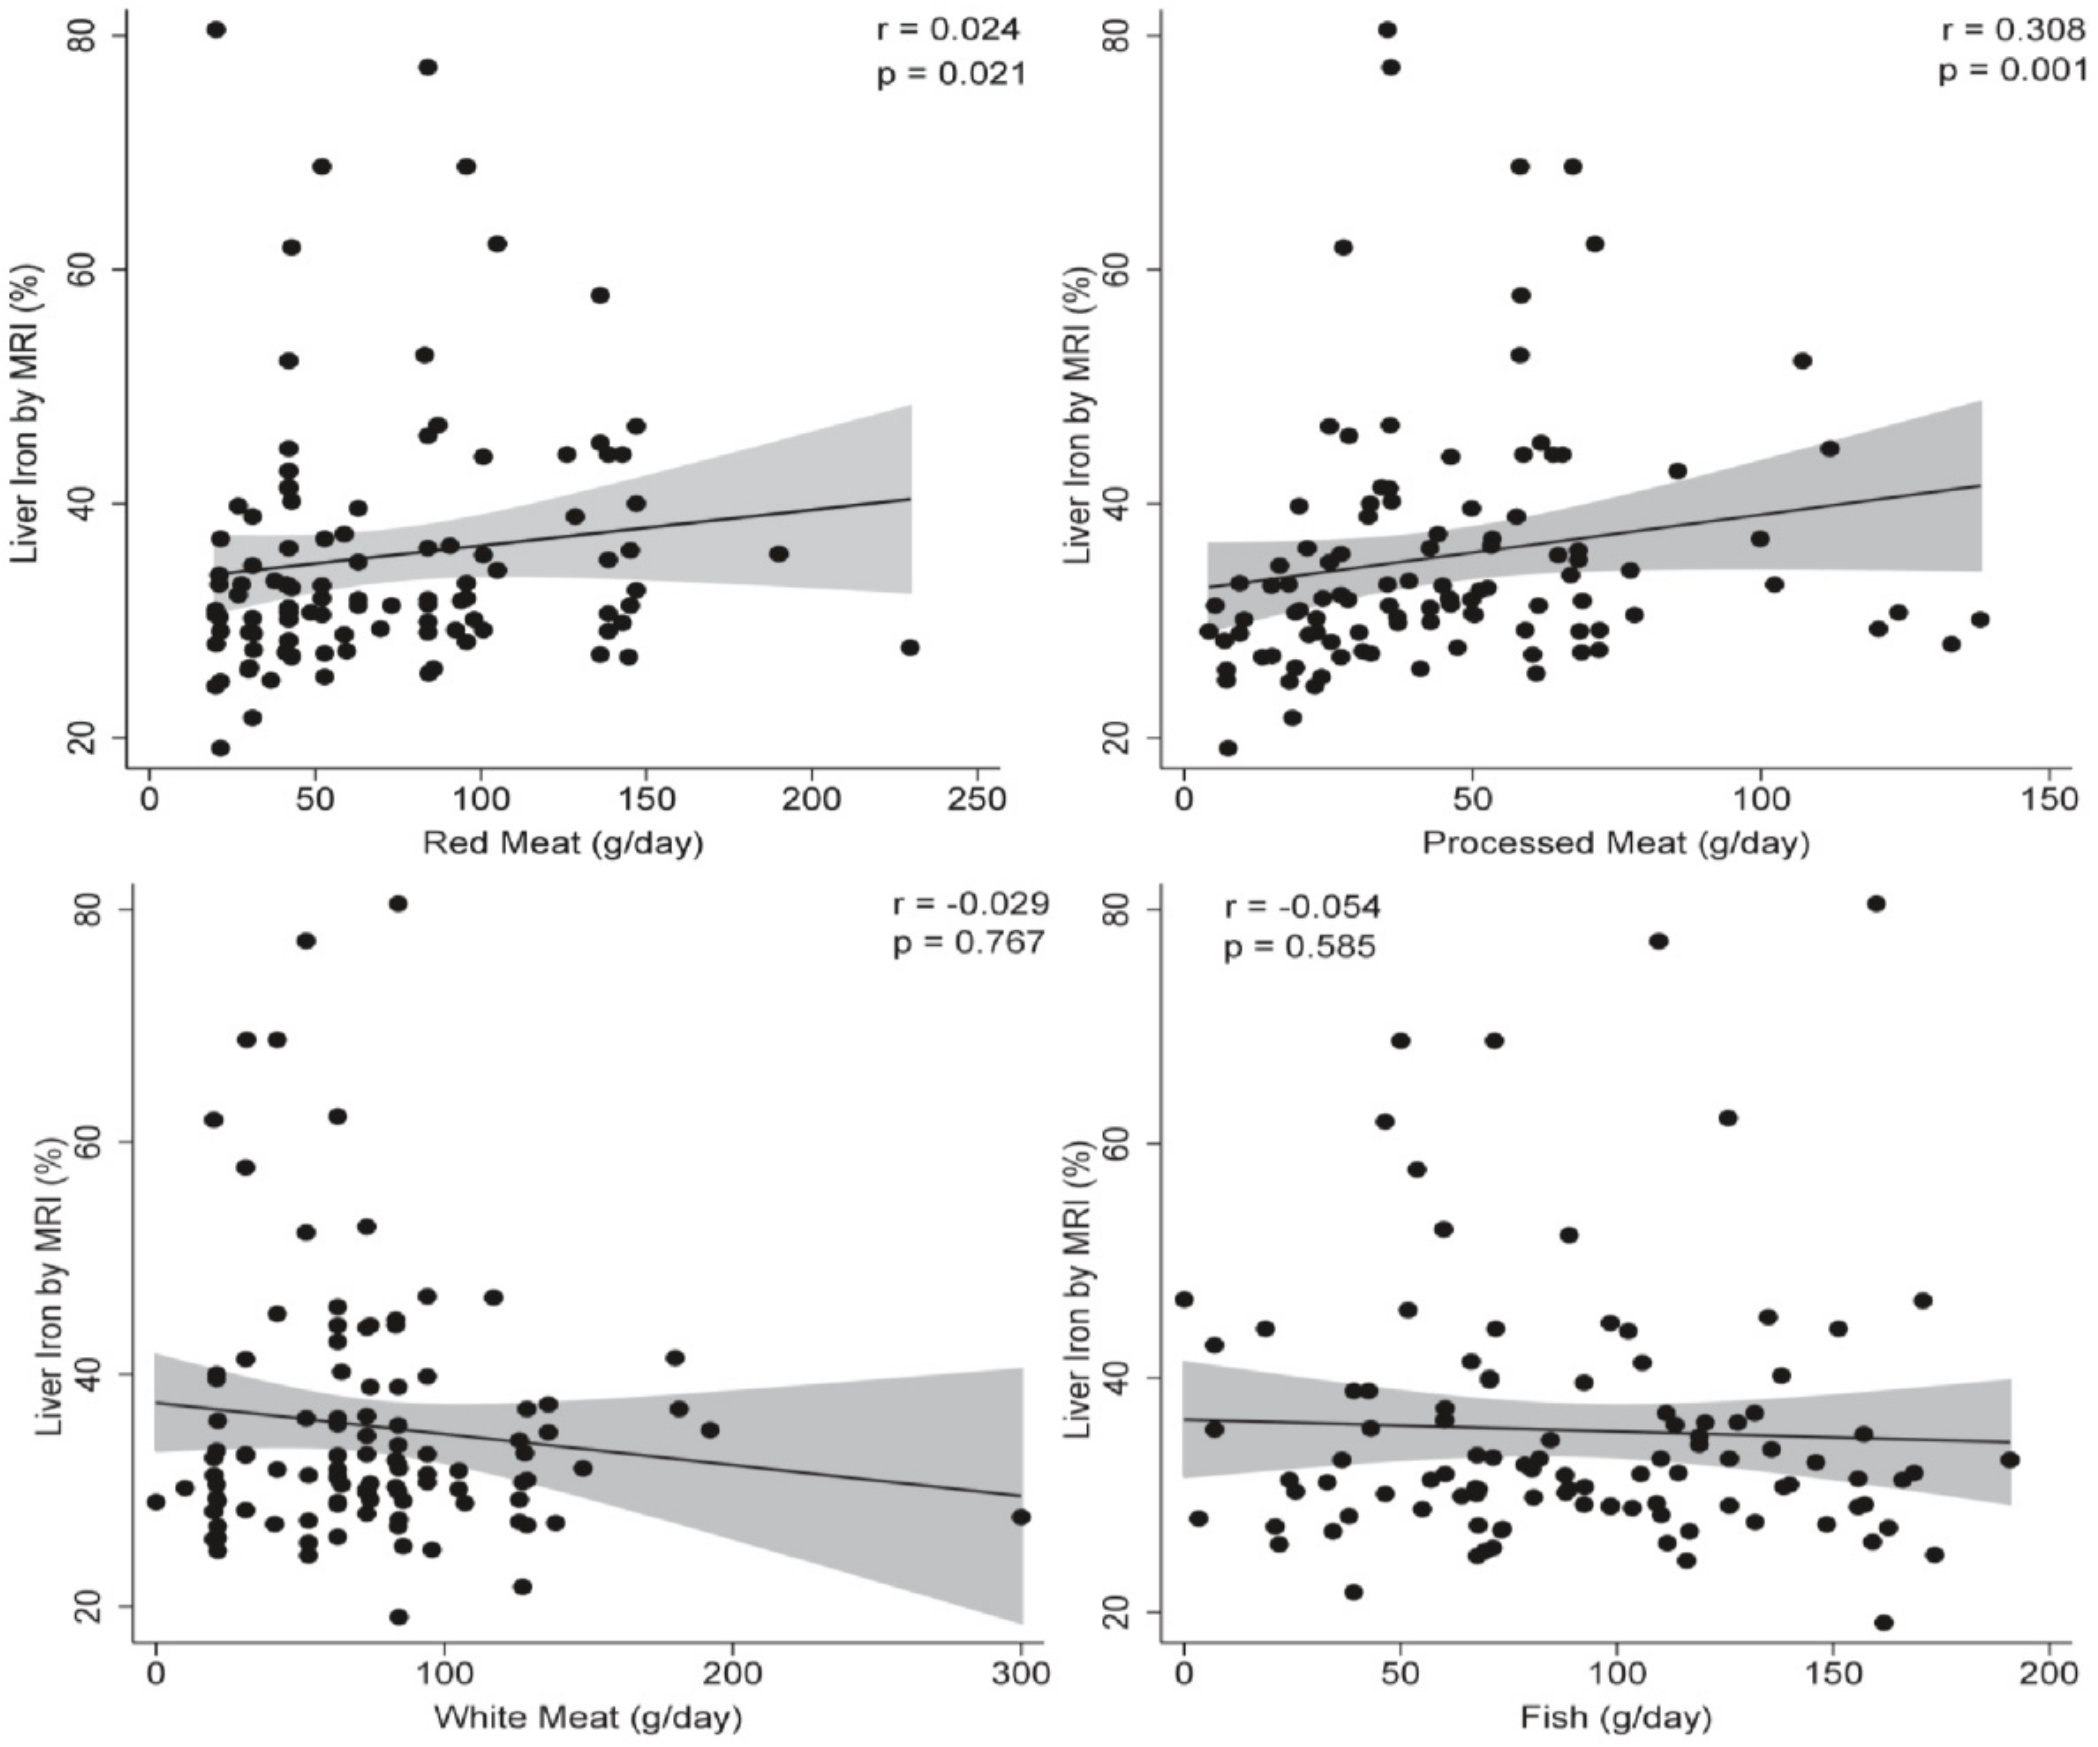
| Red Meat | 0.028 | (−0.013 | 0.070) | 0.176 | −0.007 | (−0.052 | 0.038) | 0.753 |
| Processed Meat | 0.048 | (−0.020 | 0.117) | 0.162 | 0.079 | (0.008 | 0.150) | 0.028 |
| White Meat | 0.002 | (−0.034 | 0.039) | 0.882 | −0.012 | (−0.055 | 0.030) | 0.570 |
| Fish | −0.019 | (−0.057 | 0.018) | 0.315 | −0.017 | (−0.059 | 0.023) | 0.395 |
© 2019 by the authors. Licensee MDPI, Basel, Switzerland. This article is an open access article distributed under the terms and conditions of the Creative Commons Attribution (CC BY) license (http://creativecommons.org/licenses/by/4.0/).
Share and Cite
Recaredo, G.; Marin-Alejandre, B.A.; Cantero, I.; Monreal, J.I.; Herrero, J.I.; Benito-Boillos, A.; Elorz, M.; Tur, J.A.; Martínez, J.A.; Zulet, M.A.; et al. Association between Different Animal Protein Sources and Liver Status in Obese Subjects with Non-Alcoholic Fatty Liver Disease: Fatty Liver in Obesity (FLiO) Study. Nutrients 2019, 11, 2359. https://doi.org/10.3390/nu11102359
Recaredo G, Marin-Alejandre BA, Cantero I, Monreal JI, Herrero JI, Benito-Boillos A, Elorz M, Tur JA, Martínez JA, Zulet MA, et al. Association between Different Animal Protein Sources and Liver Status in Obese Subjects with Non-Alcoholic Fatty Liver Disease: Fatty Liver in Obesity (FLiO) Study. Nutrients. 2019; 11(10):2359. https://doi.org/10.3390/nu11102359
Chicago/Turabian StyleRecaredo, Gregorio, Bertha Araceli Marin-Alejandre, Irene Cantero, J. Ignacio Monreal, José Ignacio Herrero, Alberto Benito-Boillos, Mariana Elorz, Josep A. Tur, J. Alfredo Martínez, M. Angeles Zulet, and et al. 2019. "Association between Different Animal Protein Sources and Liver Status in Obese Subjects with Non-Alcoholic Fatty Liver Disease: Fatty Liver in Obesity (FLiO) Study" Nutrients 11, no. 10: 2359. https://doi.org/10.3390/nu11102359
APA StyleRecaredo, G., Marin-Alejandre, B. A., Cantero, I., Monreal, J. I., Herrero, J. I., Benito-Boillos, A., Elorz, M., Tur, J. A., Martínez, J. A., Zulet, M. A., & Abete, I. (2019). Association between Different Animal Protein Sources and Liver Status in Obese Subjects with Non-Alcoholic Fatty Liver Disease: Fatty Liver in Obesity (FLiO) Study. Nutrients, 11(10), 2359. https://doi.org/10.3390/nu11102359