Daily Nutritional Supplementation with Vitamin D3 and Phenylbutyrate to Treatment-Naïve HIV Patients Tested in a Randomized Placebo-Controlled Trial

 , , ,
, , , 
Abstract
1. Introduction
2. Materials and Methods
2.1. Study Design
2.2. Patients
2.3. Interventions
2.4. Randomization and Masking
2.5. Outcome Measures
2.6. Procedures
2.7. Statistical Analysis
3. Results
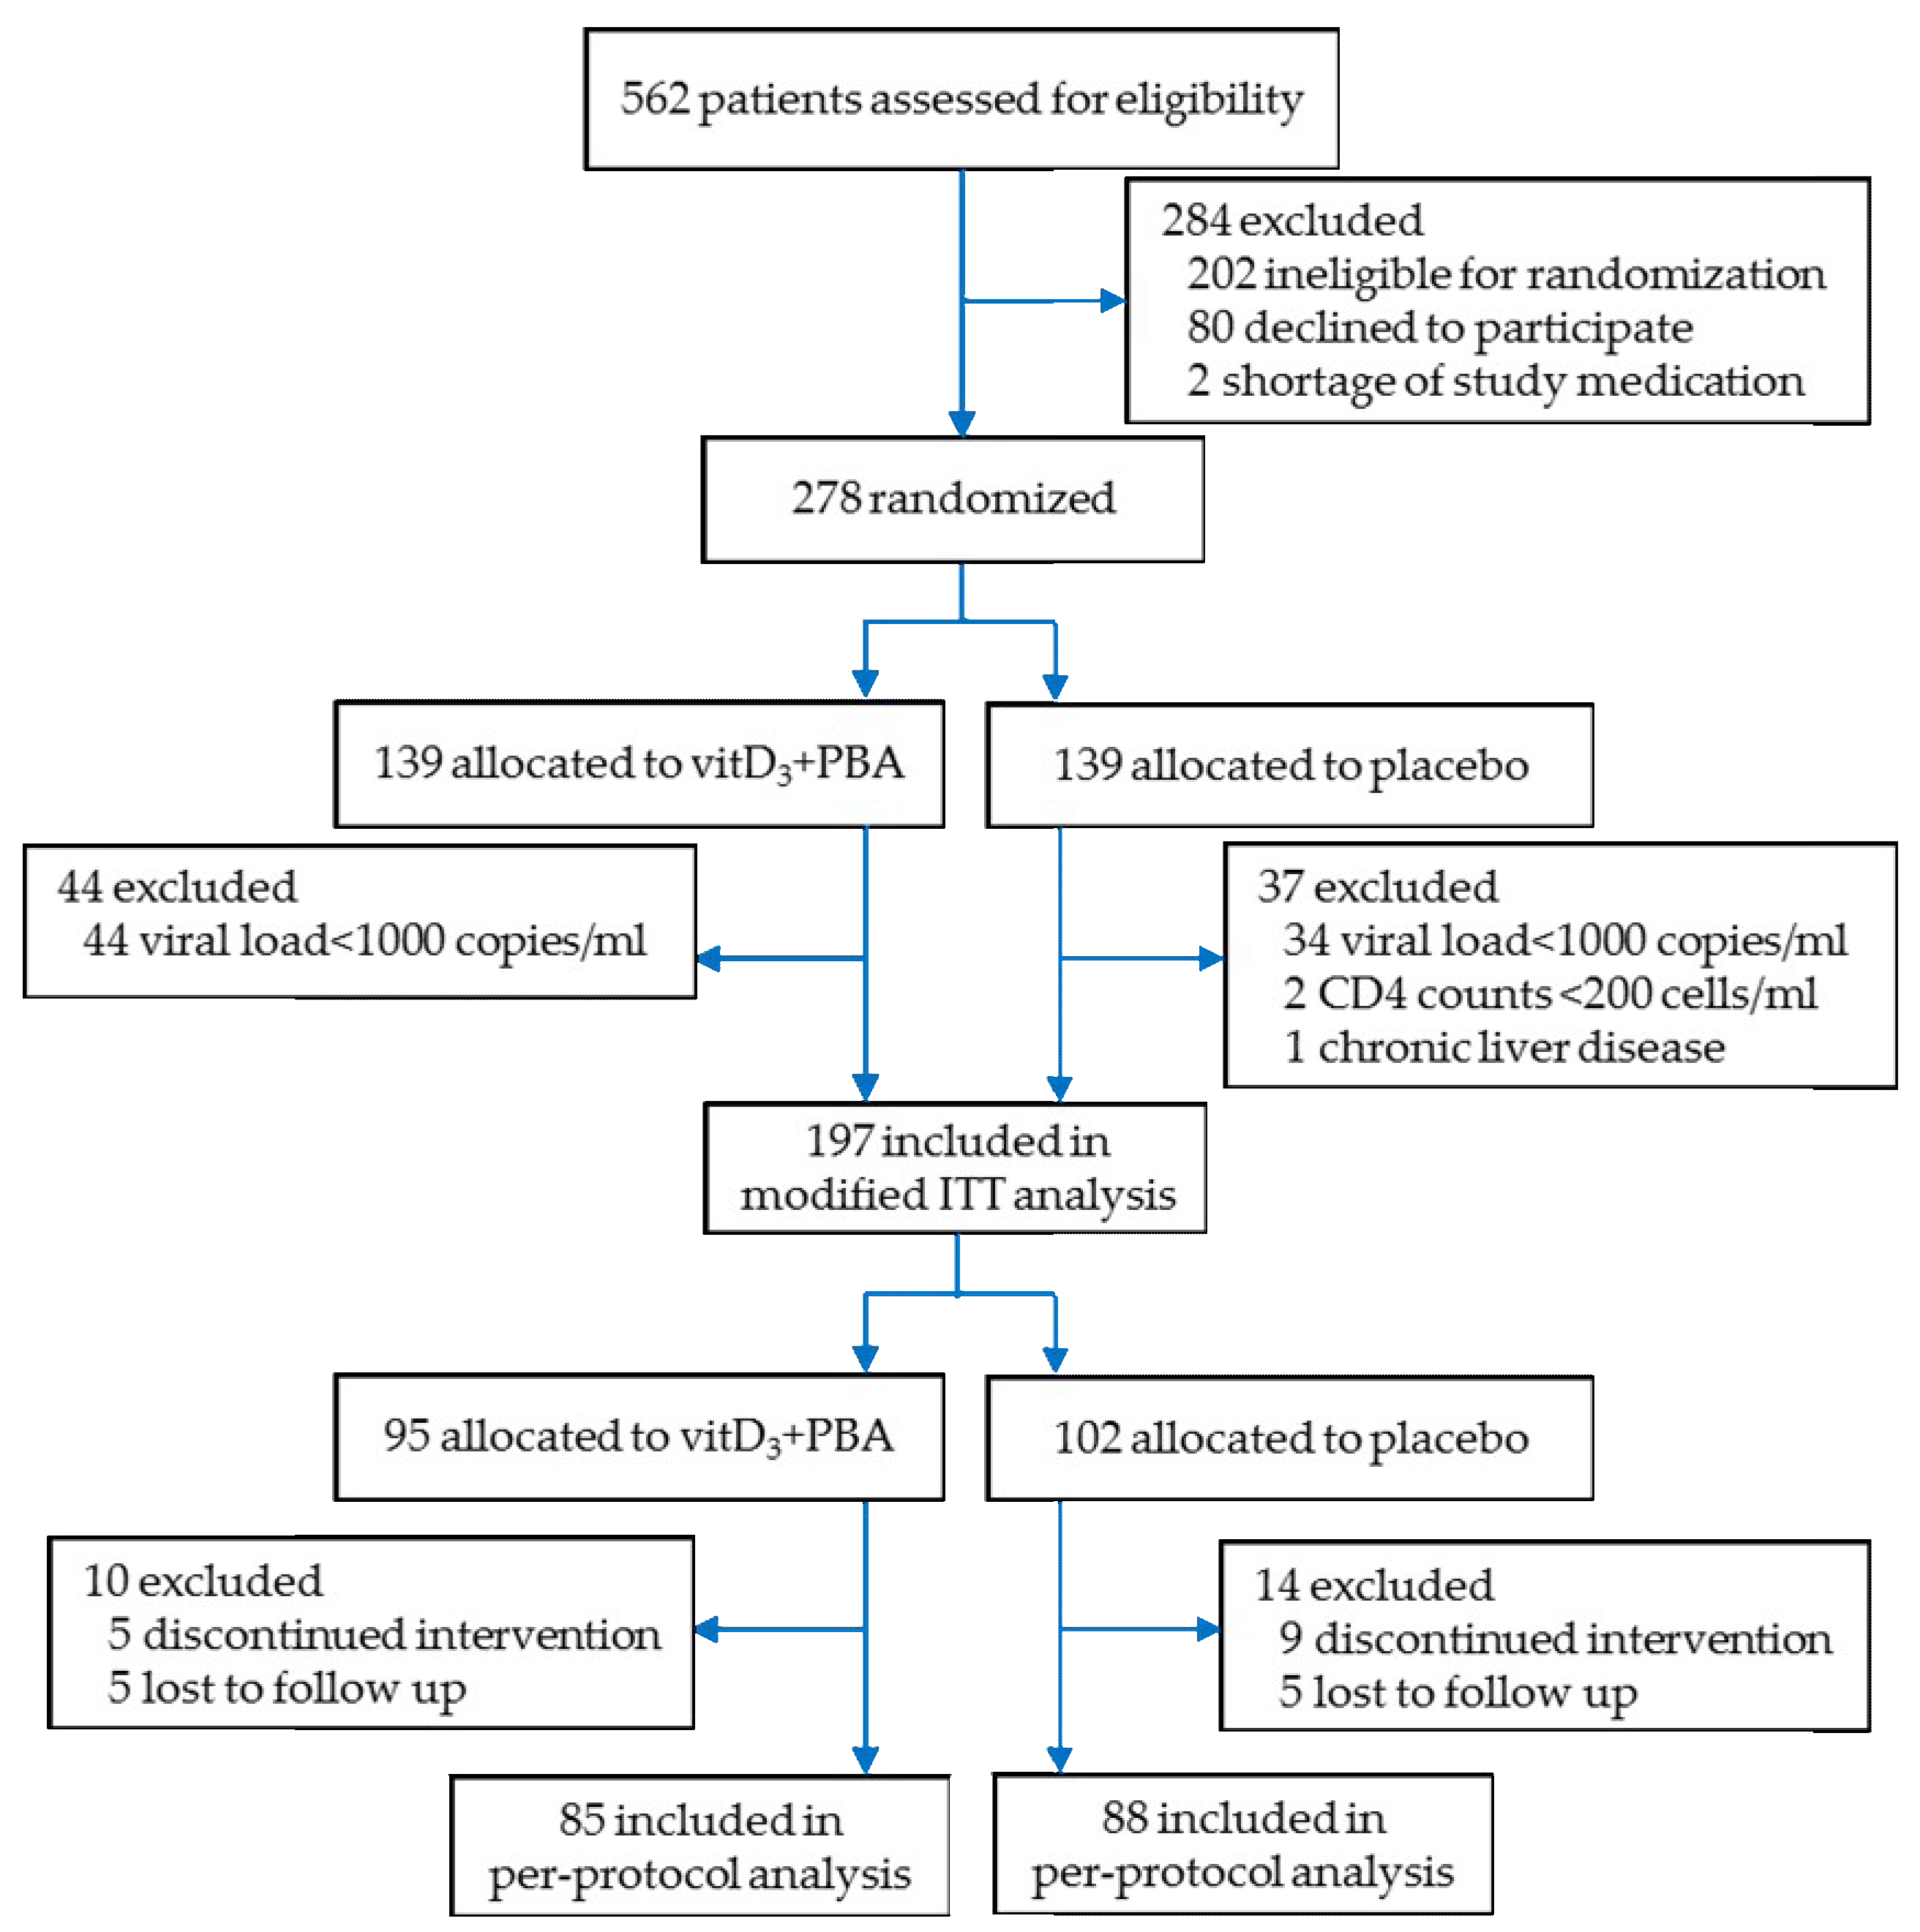
3.1. Enrolment
3.2. Baseline Characteristics
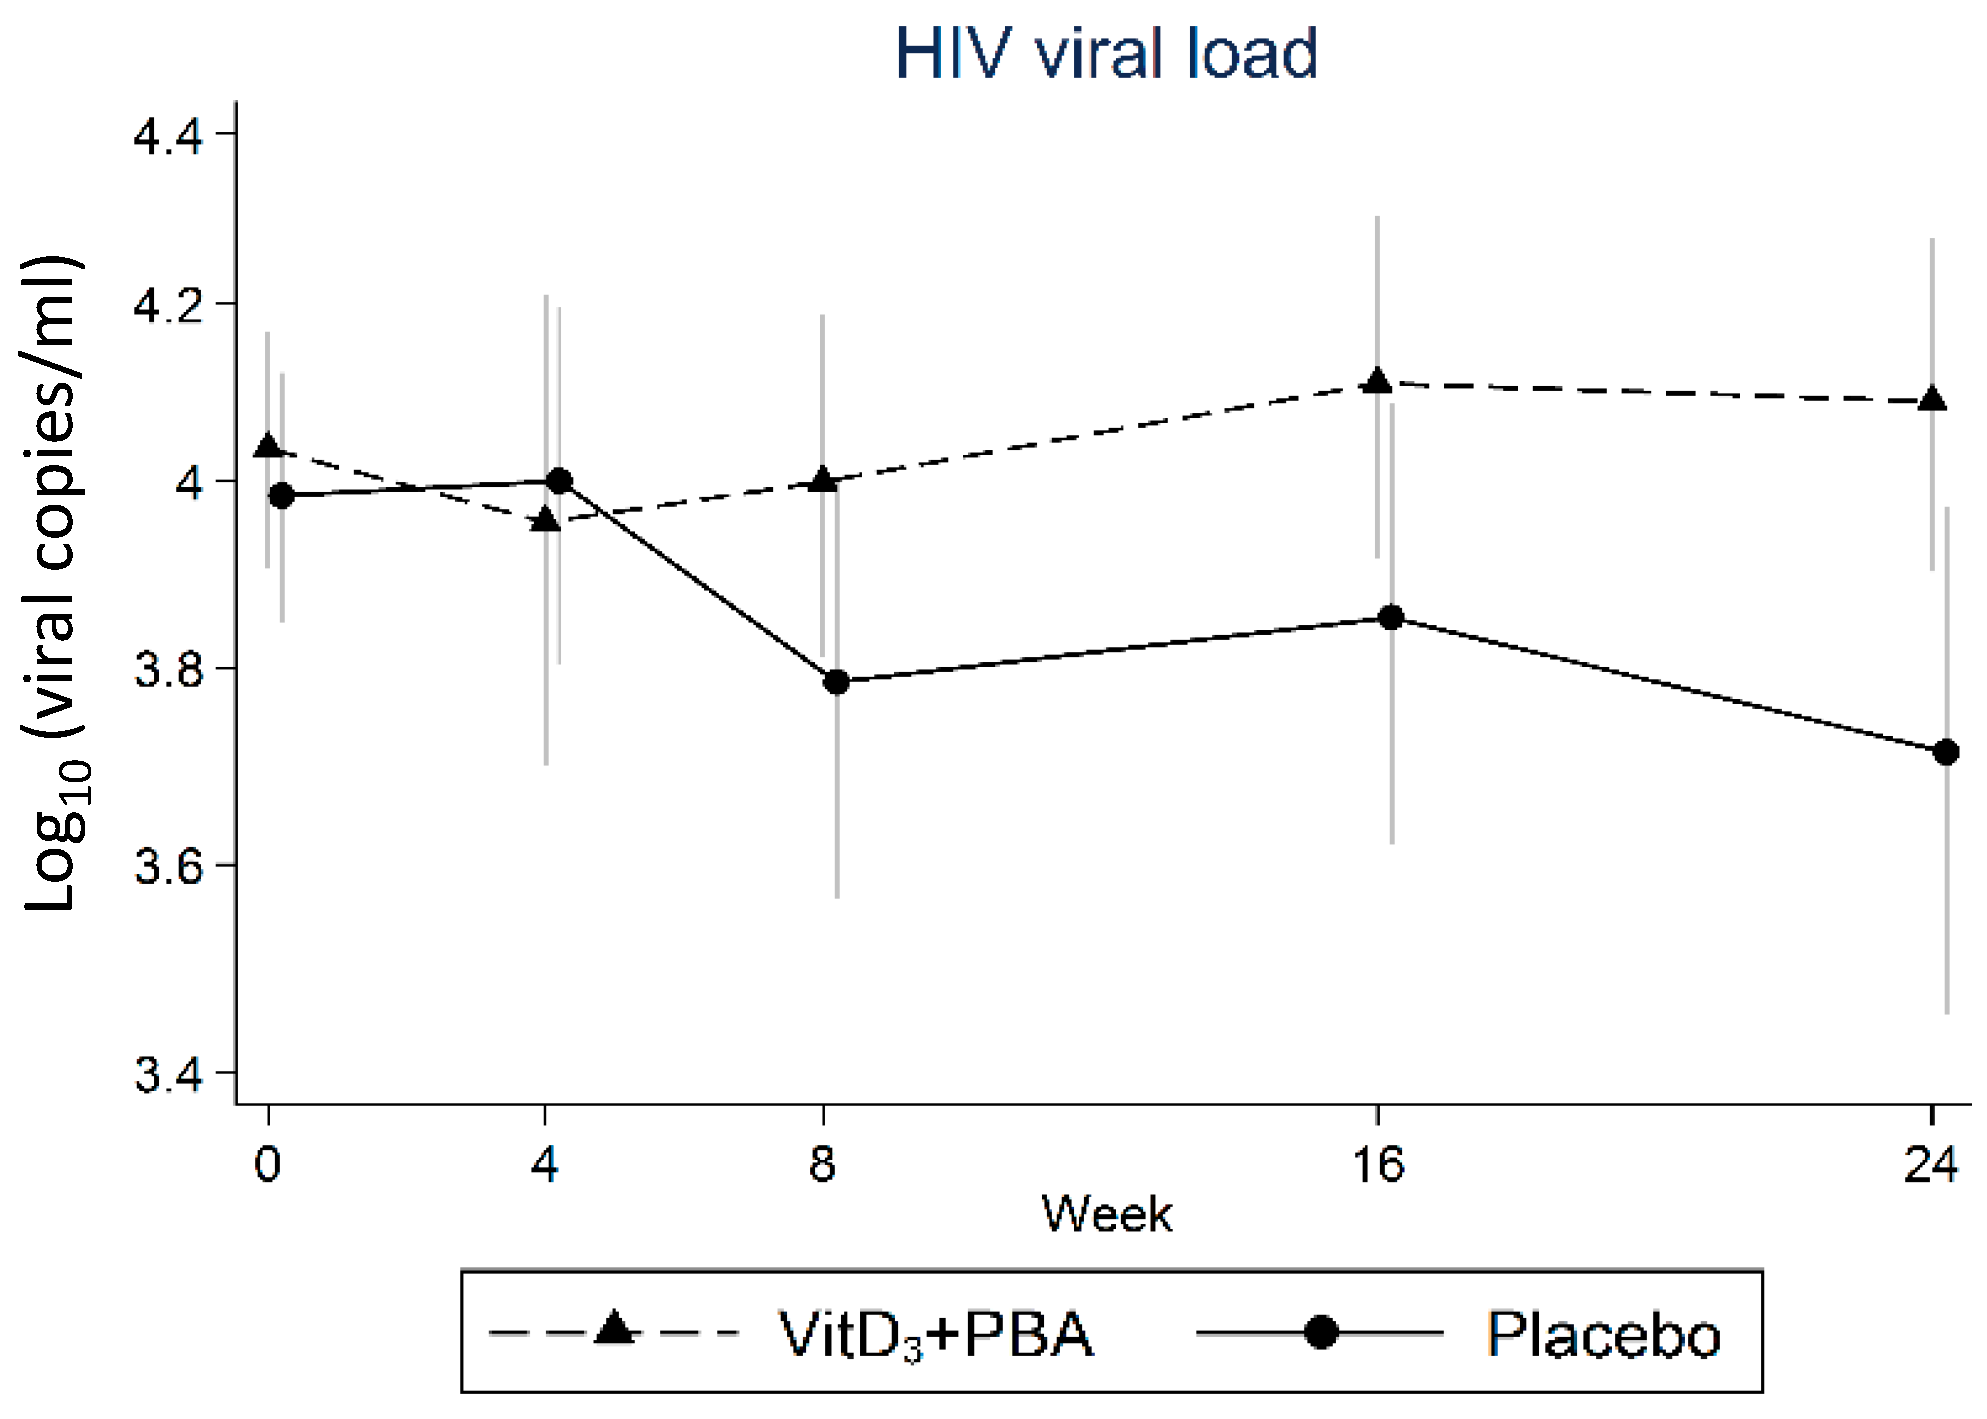
3.3. Primary Endpoint: HIV Viral Load
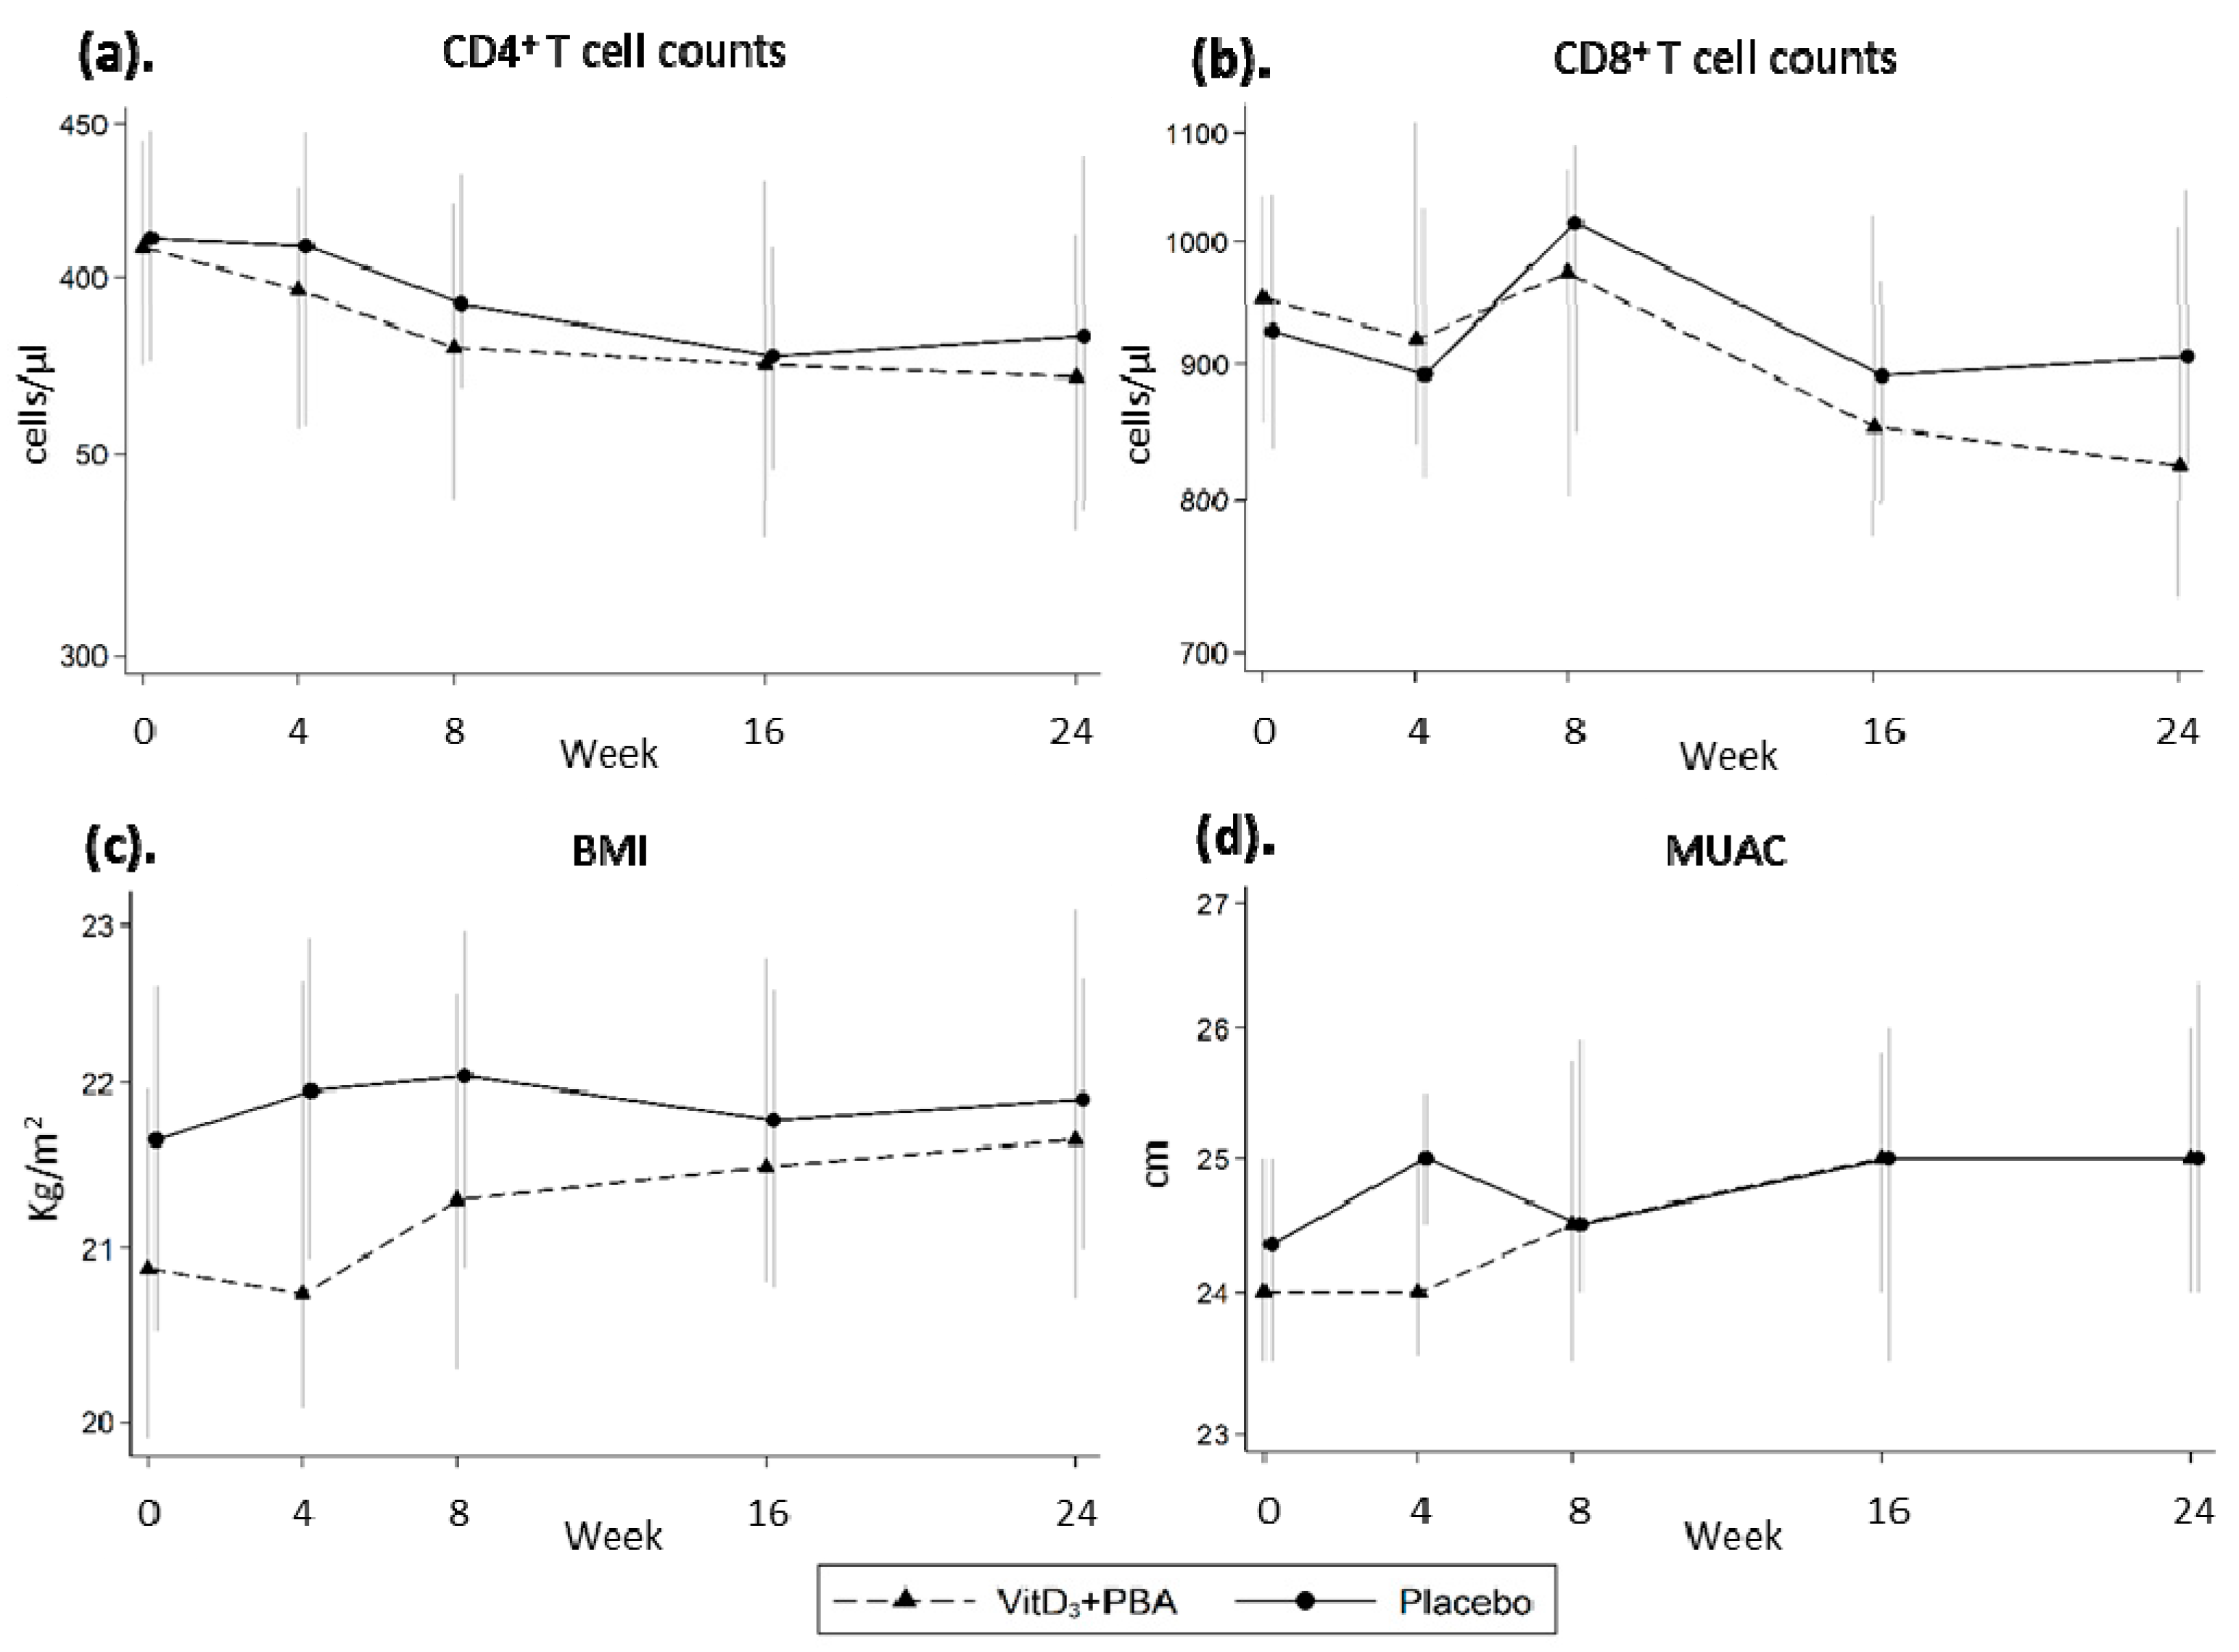
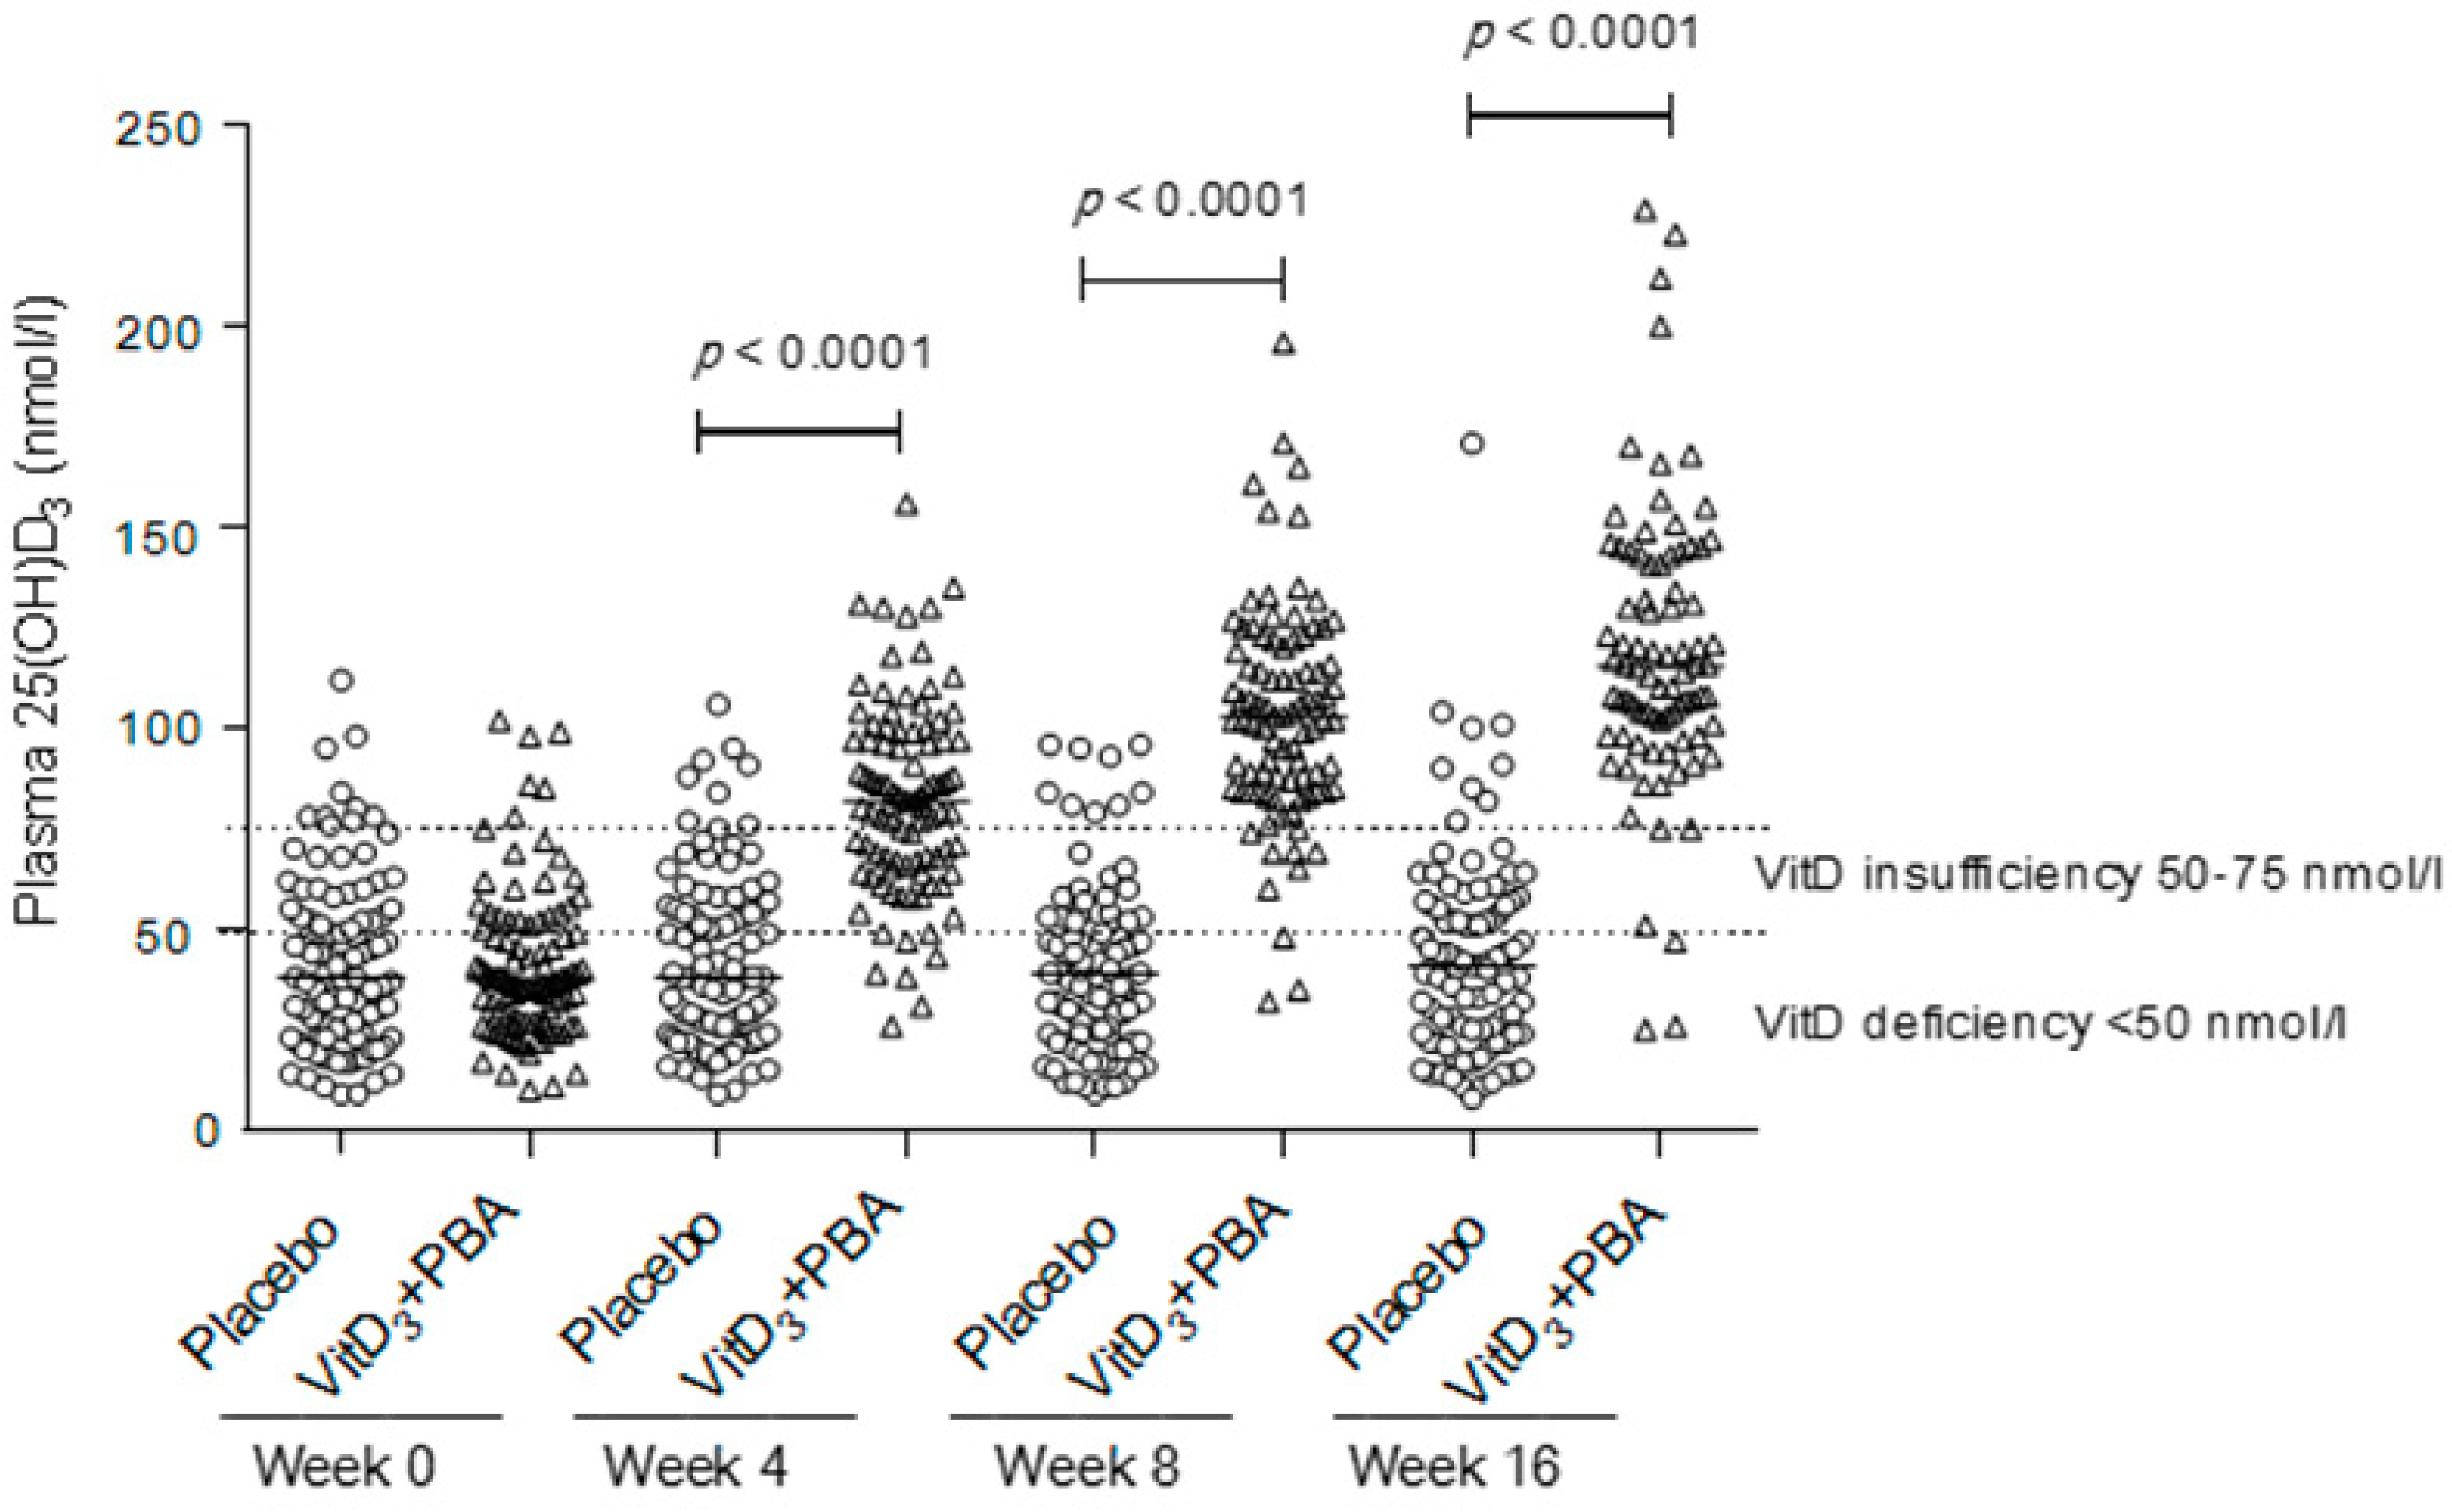
3.4. Secondary Endpoints: CD4+ and CD8+ T Cell Counts, BMI, MUAC, and vitD3 Status
3.5. Adverse Events
4. Discussion
5. Conclusions
Supplementary Materials
Author Contributions
Funding
Acknowledgments
Conflicts of Interest
References
- Langford, S.E.; Ananworanich, J.; Cooper, D.A. Predictors of disease progression in HIV infection: A review. AIDS Res. Ther. 2007, 4, 11. [Google Scholar] [CrossRef] [PubMed]
- Pantaleo, G.; Fauci, A.S. Immunopathogenesis of HIV infection. Annu. Rev. Microbiol. 1996, 50, 825–854. [Google Scholar] [CrossRef] [PubMed][Green Version]
- Sabin, C.A.; Lundgren, J.D. The natural history of HIV infection. Curr. Opin HIV AIDS 2013, 8, 311–317. [Google Scholar] [CrossRef] [PubMed]
- Smith, C.L.; Stein, G.E. Viral load as a surrogate end point in HIV disease. Ann. Pharmacother. 2002, 36, 280–287. [Google Scholar] [CrossRef] [PubMed]
- Poropatich, K.; Sullivan, D.J., Jr. Human immunodeficiency virus type 1 long-term non-progressors: The viral, genetic and immunological basis for disease non-progression. J. Gen. Virol. 2011, 92, 247–268. [Google Scholar] [CrossRef] [PubMed]
- Veazey, R.S.; DeMaria, M.; Chalifoux, L.V.; Shvetz, D.E.; Pauley, D.R.; Knight, H.L.; Rosenzweig, M.; Johnson, R.P.; Desrosiers, R.C.; Lackner, A.A. Gastrointestinal tract as a major site of CD4+ T cell depletion and viral replication in SIV infection. Science 1998, 280, 427–431. [Google Scholar] [CrossRef]
- Jung, A.C.; Paauw, D.S. Diagnosing HIV-related disease: Using the CD4 count as a guide. J. Gen. Intern. Med. 1998, 13, 131–136. [Google Scholar] [CrossRef]
- WHO. Guideline on When to Start Antiretroviral Therapy and on Pre-Exposure Prophylaxis for HIV; WHO: Geneva, Switzerland, September 2015. [Google Scholar]
- Fidler, S.; Porter, K.; Ewings, F.; Frater, J.; Ramjee, G.; Cooper, D.; Rees, H.; Fisher, M.; Schechter, M.; Kaleebu, P.; et al. Short-course antiretroviral therapy in primary HIV infection. N. Engl. J. Med. 2013, 368, 207–217. [Google Scholar] [CrossRef]
- Le, T.; Wright, E.J.; Smith, D.M.; He, W.; Catano, G.; Okulicz, J.F.; Young, J.A.; Clark, R.A.; Richman, D.D.; Little, S.J.; et al. Enhanced CD4+ T-cell recovery with earlier HIV-1 antiretroviral therapy. N. Engl. J. Med. 2013, 368, 218–230. [Google Scholar] [CrossRef]
- Colecraft, E. HIV/AIDS: Nutritional implications and impact on human development. Proc. Nutr. Soc. 2008, 67, 109–113. [Google Scholar] [CrossRef]
- Brighenti, S.; Bergman, P.; Martineau, A.R. Vitamin D and tuberculosis: Where next? J. Intern. Med. 2018. [Google Scholar] [CrossRef] [PubMed]
- Holick, M.F. The vitamin D deficiency pandemic: Approaches for diagnosis, treatment and prevention. Rev. Endocr. Metab. Disord. 2017, 18, 153–165. [Google Scholar] [CrossRef] [PubMed]
- Kim, S.W.; Hooker, J.M.; Otto, N.; Win, K.; Muench, L.; Shea, C.; Carter, P.; King, P.; Reid, A.E.; Volkow, N.D.; et al. Whole-body pharmacokinetics of HDAC inhibitor drugs, butyric acid, valproic acid and 4-phenylbutyric acid measured with carbon-11 labeled analogs by PET. Nucl. Med. Biol 2013, 40, 912–918. [Google Scholar] [CrossRef] [PubMed]
- Vandamme, D.; Landuyt, B.; Luyten, W.; Schoofs, L. A comprehensive summary of LL-37, the factotum human cathelicidin peptide. Cell. Immunol. 2012, 280, 22–35. [Google Scholar] [CrossRef] [PubMed]
- Beard, J.A.; Bearden, A.; Striker, R. Vitamin D and the anti-viral state. J. Clin. Virol. 2011, 50, 194–200. [Google Scholar] [CrossRef] [PubMed]
- Rekha, R.S.; Rao Muvva, S.S.; Wan, M.; Raqib, R.; Bergman, P.; Brighenti, S.; Gudmundsson, G.H.; Agerberth, B. Phenylbutyrate induces LL-37-dependent autophagy and intracellular killing of Mycobacterium tuberculosis in human macrophages. Autophagy 2015, 11, 1688–1699. [Google Scholar] [CrossRef] [PubMed]
- Campbell, G.R.; Spector, S.A. Autophagy induction by vitamin D inhibits both Mycobacterium tuberculosis and human immunodeficiency virus type 1. Autophagy 2012, 8, 1523–1525. [Google Scholar] [CrossRef] [PubMed]
- Nardacci, R.; Ciccosanti, F.; Marsella, C.; Ippolito, G.; Piacentini, M.; Fimia, G.M. Role of autophagy in HIV infection and pathogenesis. J. Intern. Med. 2017, 281, 422–432. [Google Scholar] [CrossRef]
- Campbell, G.R.; Spector, S.A. Toll-like receptor 8 ligands activate a vitamin D mediated autophagic response that inhibits human immunodeficiency virus type 1. PLoS Pathog. 2012, 8, e1003017. [Google Scholar] [CrossRef]
- Campbell, G.R.; Spector, S.A. Vitamin D inhibits human immunodeficiency virus type 1 and Mycobacterium tuberculosis infection in macrophages through the induction of autophagy. PLoS Pathog. 2012, 8, e1002689. [Google Scholar] [CrossRef]
- Iversen, A.K.; Attermann, J.; Gerstoft, J.; Fugger, L.; Mullins, J.I.; Skinhoj, P. Longitudinal and cross-sectional studies of HIV-1 RNA and DNA loads in blood and the female genital tract. Eur. J. Obstet. Gynecol. Reprod. Biol. 2004, 117, 227–235. [Google Scholar] [CrossRef] [PubMed]
- Pocock, S.J.; Assmann, S.E.; Enos, L.E.; Kasten, L.E. Subgroup analysis, covariate adjustment and baseline comparisons in clinical trial reporting: Current practice and problems. Stat. Med. 2002, 21, 2917–2930. [Google Scholar] [CrossRef]
- Legeai, C.; Vigouroux, C.; Souberbielle, J.C.; Bouchaud, O.; Boufassa, F.; Bastard, J.P.; Carlier, R.; Capeau, J.; Goujard, C.; Meyer, L.; et al. Associations between 25-hydroxyvitamin D and immunologic, metabolic, inflammatory markers in treatment-naive HIV-infected persons: The ANRS CO9 <<COPANA>> cohort study. PLoS ONE 2013, 8, e74868. [Google Scholar] [CrossRef] [PubMed]
- Mueller, N.J.; Fux, C.A.; Ledergerber, B.; Elzi, L.; Schmid, P.; Dang, T.; Magenta, L.; Calmy, A.; Vergopoulos, A.; Bischoff-Ferrari, H.A. High prevalence of severe vitamin D deficiency in combined antiretroviral therapy-naive and successfully treated Swiss HIV patients. AIDS 2010, 24, 1127–1134. [Google Scholar] [CrossRef] [PubMed]
- Allavena, C.; Delpierre, C.; Cuzin, L.; Rey, D.; Viget, N.; Bernard, J.; Guillot, P.; Duvivier, C.; Billaud, E.; Raffi, F. High frequency of vitamin D deficiency in HIV-infected patients: Effects of HIV-related factors and antiretroviral drugs. J. Antimicrob. Chemother. 2012, 67, 2222–2230. [Google Scholar] [CrossRef] [PubMed]
- Dao, C.N.; Patel, P.; Overton, E.T.; Rhame, F.; Pals, S.L.; Johnson, C.; Bush, T.; Brooks, J.T. Low vitamin D among HIV-infected adults: Prevalence of and risk factors for low vitamin D Levels in a cohort of HIV-infected adults and comparison to prevalence among adults in the US general population. Clin. Infect. Dis. 2011, 52, 396–405. [Google Scholar] [CrossRef] [PubMed]
- Sherwood, J.E.; Mesner, O.C.; Weintrob, A.C.; Hadigan, C.M.; Wilkins, K.J.; Crum-Cianflone, N.F.; Aronson, N.E. Vitamin D deficiency and its association with low bone mineral density, HIV-related factors, hospitalization, and death in a predominantly black HIV-infected cohort. Clin. Infect. Dis. 2012, 55, 1727–1736. [Google Scholar] [CrossRef]
- Mansueto, P.; Seidita, A.; Vitale, G.; Gangemi, S.; Iaria, C.; Cascio, A. Vitamin D Deficiency in HIV Infection: Not Only a Bone Disorder. Biomed. Res. Int. 2015, 2015, 735615. [Google Scholar] [CrossRef]
- Erlandson, K.M.; Gudza, I.; Fiorillo, S.; Ndemera, B.; Schooley, R.T.; Gwanzura, L.; Borok, M.; Campbell, T.B. Relationship of vitamin D insufficiency to AIDS-associated Kaposi’s sarcoma outcomes: Retrospective analysis of a prospective clinical trial in Zimbabwe. Int. J. Infect. Dis. 2014, 24, 6–10. [Google Scholar] [CrossRef]
- Coussens, A.K.; Naude, C.E.; Goliath, R.; Chaplin, G.; Wilkinson, R.J.; Jablonski, N.G. High-dose vitamin D3 reduces deficiency caused by low UVB exposure and limits HIV-1 replication in urban Southern Africans. Proc. Natl. Acad. Sci. USA 2015, 112, 8052–8057. [Google Scholar] [CrossRef]
- Mehta, S.; Giovannucci, E.; Mugusi, F.M.; Spiegelman, D.; Aboud, S.; Hertzmark, E.; Msamanga, G.I.; Hunter, D.; Fawzi, W.W. Vitamin D status of HIV-infected women and its association with HIV disease progression, anemia, and mortality. PLoS ONE 2010, 5, e8770. [Google Scholar] [CrossRef] [PubMed]
- Mehta, S.; Mugusi, F.M.; Spiegelman, D.; Villamor, E.; Finkelstein, J.L.; Hertzmark, E.; Giovannucci, E.L.; Msamanga, G.I.; Fawzi, W.W. Vitamin D status and its association with morbidity including wasting and opportunistic illnesses in HIV-infected women in Tanzania. AIDS Patient Care STDS 2011, 25, 579–585. [Google Scholar] [CrossRef] [PubMed]
- Abraham, A.G.; Zhang, L.; Calkins, K.; Tin, A.; Hoofnagle, A.; Palella, F.J., Jr.; Estrella, M.M.; Jacobson, L.P.; Witt, M.D.; Kingsley, L.A.; et al. Vitamin D status and immune function reconstitution in HIV-infected men initiating therapy. AIDS 2018, 32, 1069–1076. [Google Scholar] [CrossRef] [PubMed]
- Welz, T.; Childs, K.; Ibrahim, F.; Poulton, M.; Taylor, C.B.; Moniz, C.F.; Post, F.A. Efavirenz is associated with severe vitamin D deficiency and increased alkaline phosphatase. AIDS 2010, 24, 1923–1928. [Google Scholar] [CrossRef] [PubMed]
- Hsieh, E.; Fraenkel, L.; Han, Y.; Xia, W.; Insogna, K.L.; Yin, M.T.; Zhu, T.; Cheng, X.; Li, T. Longitudinal increase in vitamin D binding protein levels after initiation of tenofovir/lamivudine/efavirenz among individuals with HIV. AIDS 2016, 30, 1935–1942. [Google Scholar] [CrossRef] [PubMed]
- Manion, M.; Hullsiek, K.H.; Wilson, E.M.P.; Rhame, F.; Kojic, E.; Gibson, D.; Hammer, J.; Patel, P.; Brooks, J.T.; Baker, J.V.; et al. Vitamin D deficiency is associated with IL-6 levels and monocyte activation in HIV-infected persons. PLoS ONE 2017, 12, e0175517. [Google Scholar] [CrossRef] [PubMed]
- Ezeamama, A.E.; Guwatudde, D.; Wang, M.; Bagenda, D.; Kyeyune, R.; Sudfeld, C.; Manabe, Y.C.; Fawzi, W.W. Vitamin-D deficiency impairs CD4+T-cell count recovery rate in HIV-positive adults on highly active antiretroviral therapy: A longitudinal study. Clin. Nutr. 2016, 35, 1110–1117. [Google Scholar] [CrossRef] [PubMed]
- Jimenez-Sousa, M.A.; Martinez, I.; Medrano, L.M.; Fernandez-Rodriguez, A.; Resino, S. Vitamin D in Human Immunodeficiency Virus Infection: Influence on Immunity and Disease. Front. Immunol. 2018, 9, 458. [Google Scholar] [CrossRef]
- Hollis, B.W.; Wagner, C.L. Clinical review: The role of the parent compound vitamin D with respect to metabolism and function: Why clinical dose intervals can affect clinical outcomes. J. Clin. Endocrinol. Metab. 2013, 98, 4619–4628. [Google Scholar] [CrossRef]
- Vieth, R. How to optimize vitamin D supplementation to prevent cancer, based on cellular adaptation and hydroxylase enzymology. Anticancer Res. 2009, 29, 3675–3684. [Google Scholar]
- Bekele, A.; Gebreselassie, N.; Ashenafi, S.; Kassa, E.; Aseffa, G.; Amogne, W.; Getachew, M.; Aseffa, A.; Worku, A.; Raqib, R.; et al. Daily adjunctive therapy with vitamin D3 and phenylbutyrate supports clinical recovery from pulmonary tuberculosis: A randomized controlled trial in Ethiopia. J. Intern. Med. 2018. [Google Scholar] [CrossRef] [PubMed]
- Sanghera, D.K.; Sapkota, B.R.; Aston, C.E.; Blackett, P.R. Vitamin D Status, Gender Differences, and Cardiometabolic Health Disparities. Ann. Nutr. Metab. 2017, 70, 79–87. [Google Scholar] [CrossRef] [PubMed]
- El Kharroubi, A.; Piras, G.; Zensen, R.; Martin, M.A. Transcriptional activation of the integrated chromatin-associated human immunodeficiency virus type 1 promoter. Mol. Cell. Biol. 1998, 18, 2535–2544. [Google Scholar] [CrossRef] [PubMed]
- Archin, N.M.; Liberty, A.L.; Kashuba, A.D.; Choudhary, S.K.; Kuruc, J.D.; Crooks, A.M.; Parker, D.C.; Anderson, E.M.; Kearney, M.F.; Strain, M.C.; et al. Administration of vorinostat disrupts HIV-1 latency in patients on antiretroviral therapy. Nature 2012, 487, 482–485. [Google Scholar] [CrossRef] [PubMed]
- Wei, D.G.; Chiang, V.; Fyne, E.; Balakrishnan, M.; Barnes, T.; Graupe, M.; Hesselgesser, J.; Irrinki, A.; Murry, J.P.; Stepan, G.; et al. Histone deacetylase inhibitor romidepsin induces HIV expression in CD4 T cells from patients on suppressive antiretroviral therapy at concentrations achieved by clinical dosing. PLoS Pathog. 2014, 10, e1004071. [Google Scholar] [CrossRef]
- Stallings, V.A.; Schall, J.I.; Hediger, M.L.; Zemel, B.S.; Tuluc, F.; Dougherty, K.A.; Samuel, J.L.; Rutstein, R.M. High-dose vitamin D3 supplementation in children and young adults with HIV: A randomized, placebo-controlled trial. Pediatr. Infect. Dis. J. 2015, 34, e32–e40. [Google Scholar] [CrossRef]
- Coelho, L.; Cardoso, S.W.; Luz, P.M.; Hoffman, R.M.; Mendonca, L.; Veloso, V.G.; Currier, J.S.; Grinsztejn, B.; Lake, J.E. Vitamin D3 supplementation in HIV infection: Effectiveness and associations with antiretroviral therapy. Nutr. J. 2015, 14, 81. [Google Scholar] [CrossRef]
- Lachmann, R.; Bevan, M.A.; Kim, S.; Patel, N.; Hawrylowicz, C.; Vyakarnam, A.; Peters, B.S. A comparative phase 1 clinical trial to identify anti-infective mechanisms of vitamin D in people with HIV infection. AIDS 2015, 29, 1127–1135. [Google Scholar] [CrossRef]
- Giacomet, V.; Vigano, A.; Manfredini, V.; Cerini, C.; Bedogni, G.; Mora, S.; Borelli, M.; Trabattoni, D.; Zuccotti, G.V. Cholecalciferol supplementation in HIV-infected youth with vitamin D insufficiency: Effects on vitamin D status and T-cell phenotype: A randomized controlled trial. HIV Clin. Trials 2013, 14, 51–60. [Google Scholar] [CrossRef]
- Aziz, M.; Livak, B.; Burke-Miller, J.; French, A.L.; Glesby, M.J.; Sharma, A.; Young, M.; Villacres, M.C.; Tien, P.C.; Golub, E.T.; et al. Vitamin D insufficiency may impair CD4 recovery among Women’s Interagency HIV Study participants with advanced disease on HAART. AIDS 2013, 27, 573–578. [Google Scholar] [CrossRef]
- Arpadi, S.M.; McMahon, D.; Abrams, E.J.; Bamji, M.; Purswani, M.; Engelson, E.S.; Horlick, M.; Shane, E. Effect of bimonthly supplementation with oral cholecalciferol on serum 25-hydroxyvitamin D concentrations in HIV-infected children and adolescents. Pediatrics 2009, 123, e121–126. [Google Scholar] [CrossRef] [PubMed]
- Kakalia, S.; Sochett, E.B.; Stephens, D.; Assor, E.; Read, S.E.; Bitnun, A. Vitamin D supplementation and CD4 count in children infected with human immunodeficiency virus. J. Pediatr. 2011, 159, 951–957. [Google Scholar] [CrossRef] [PubMed]
- Chun, R.F.; Liu, N.Q.; Lee, T.; Schall, J.I.; Denburg, M.R.; Rutstein, R.M.; Adams, J.S.; Zemel, B.S.; Stallings, V.A.; Hewison, M. Vitamin D supplementation and antibacterial immune responses in adolescents and young adults with HIV/AIDS. J. Steroid Biochem. Mol. Biol. 2015, 148, 290–297. [Google Scholar] [CrossRef] [PubMed]
- Havens, P.L.; Stephensen, C.B.; Van Loan, M.D.; Schuster, G.U.; Woodhouse, L.R.; Flynn, P.M.; Gordon, C.M.; Pan, C.G.; Rutledge, B.; Harris, D.R.; et al. Vitamin D3 Supplementation Increases Spine Bone Mineral Density in Adolescents and Young Adults With Human Immunodeficiency Virus Infection Being Treated With Tenofovir Disoproxil Fumarate: A Randomized, Placebo-Controlled Trial. Clin. Infect. Dis. 2018, 66, 220–228. [Google Scholar] [CrossRef] [PubMed]
- Overton, E.T.; Chan, E.S.; Brown, T.T.; Tebas, P.; McComsey, G.A.; Melbourne, K.M.; Napoli, A.; Hardin, W.R.; Ribaudo, H.J.; Yin, M.T. Vitamin D and Calcium Attenuate Bone Loss With Antiretroviral Therapy Initiation: A Randomized Trial. Ann. Intern. Med. 2015, 162, 815–824. [Google Scholar] [CrossRef] [PubMed]
- Bang, U.C.; Kolte, L.; Hitz, M.; Schierbeck, L.L.; Nielsen, S.D.; Benfield, T.; Jensen, J.E. The effect of cholecalciferol and calcitriol on biochemical bone markers in HIV type 1-infected males: Results of a clinical trial. AIDS Res. Hum. Retrovir. 2013, 29, 658–664. [Google Scholar] [CrossRef]
- Brown, J.C.; Schall, J.I.; Rutstein, R.M.; Leonard, M.B.; Zemel, B.S.; Stallings, V.A. The impact of vitamin D3 supplementation on muscle function among HIV-infected children and young adults: A randomized controlled trial. J. Musculoskelet. Neuronal Interact. 2015, 15, 145–153. [Google Scholar]


| Variables 1 (mITT, n = 197) | HIV-pos Patients (n = 197) | HIV-neg Controls 2 (n = 52) | p-Value 3 |
|---|---|---|---|
| Gender (M/F) (no/%) | 40 (20)/157 (80) | 33 (63)/19 (37) | <0.001 |
| Age (years) | 30 (26, 38) | 36 (26, 46) | 0.037 |
| HIV viral load (copies/mL) | 7897 (3116, 27,792) | - | - |
| HIV viral load < 10.000 (no/%) | 102 (51.8) | ||
| HIV viral load 10.000–100.000 | 76 (38.6) | ||
| HIV viral load > 100.000 | 19 (9.6) | ||
| CD4 T cell counts (cells/µL) | 410 (324, 510) | 593 (495, 767) | <0.001 |
| CD8 T cell counts (cells/µL) | 930 (691, 1253) | 500 (350, 668) | <0.001 |
| CD4/CD8 ratio | 0.44 | 1.19 | <0.001 |
| Weight (kg) | 54 (50, 64) | 68 (59, 78) | <0.001 |
| Weight loss (no/%) | 58 (29%) | - | - |
| BMI (kg/m2) | 21.1 (19.1, 23.9) | 23.0 (19.5, 24.3) | 0.260 |
| MUAC (cm) | 24.2 (23.0, 26.5) | 25.8 (24.0, 28.0) | 0.022 |
| Pulse rate/min | 78 (76, 82) | 78 (73, 88) | 0.250 |
| Respiratory rate/min | 18 (17, 19) | 18 (16, 20) | 0.770 |
| 25(OH)D3 nmol/L | 38 (26, 52) | 28 (19, 44.5) | 0.003 |
| Deficiency < 50 nmol/L (no/%) | 137 (69.5) | 45 (86.5) | 0.029 |
| Insufficiency 50–75 nmol/L | 42 (21.3) | 7 (13.5) | |
| Sufficiency > 75 nmol/L | 16 (8.2) | 0 (0) |
| Variables (mITT, n = 197) | Placebo (n = 102) | VitD3 + PBA (n = 95) |
|---|---|---|
| Gender (M/F) (no/%) | 23 (23)/79 (77) | 17 (18)/78 (82) |
| Age (years) | 30 (27, 38) | 30 (25, 39) |
| HIV viral load (copies/mL) | 7008 (2630, 23,267) | 10,037 (3443, 32,445) |
| HIV viral load >100.000 (no/%) | 11 (10.8) | 8 (8.4) |
| HIV viral load < 10.000 (no/%) | 57 (55.9) | 45 (47.4) |
| CD4 T cell counts (cells/µL) | 412 (340, 505) | 409 (320, 517) |
| CD8 T cell counts (cells/µL) | 927 (661, 1265) | 952 (733, 1207) |
| CD4/CD8 ratio | 0.44 | 0.43 |
| Weight (kg) | 56 (50, 66) | 53 (50, 62) |
| Weight loss (no/%) | 31 (30%) | 27 (28%) |
| BMI (kg/m2) | 21.6 (19, 24.6) | 20.9 (19.1, 23.6) |
| MUAC (cm) | 24.3 (23.0, 27.0) | 24.0 (23.0, 26.0) |
| Pulse rate/min | 78 (75, 82) | 78 (76, 82) |
| Respiratory rate/min | 17 (16, 18) | 18 (17, 20) |
| WBC (SI units) | 5.2 (4.1, 6.4) | 5.5 (4.3, 6.7) |
| ESR (mm/h) | 31 (18, 42) | 34 (20, 48) |
| Hemoglobin (g/L) | 14 (12, 15) | 14 (12, 15) |
| Calcium (g/L) | 9 (8.4, 9.5) | 8.8 (8.3, 9.4) |
| Albumin (mg/dl) | 4 (3.7, 4.2) | 4 (3.6, 4.2) |
| 25(OH)D3 nmol/L | 38 (24, 53) | 37.5 (27, 52) |
| Deficiency < 50 nmol/L (no/%) | 69 (68.3) | 69 (73.4) |
| Insufficiency 50–75 nmol/L | 22 (21.8) | 19 (20.2) |
| Sufficient >75 nmol/L | 10 (9.9) | 6 (6.4) |
| Crude | Adjusted 1 | |||||||
|---|---|---|---|---|---|---|---|---|
| Endpoint | Week | n | Difference | 95% CI | p-Value | Difference | 95% CI | p-Value |
| All patients (mITT) | ||||||||
| HIV viral load | 4 | 197 | −0.14 | (−0.42 to 0.13) | 0.298 | −0.12 | (−0.39 to 0.15) | 0.385 |
| 8 | 197 | 0.14 | (−0.10 to 0.38) | 0.254 | 0.15 | (−0.09 to 0.39) | 0.214 | |
| 16 | 197 | 0.16 | (−0.10 to 0.42) | 0.234 | 0.17 | (−0.09 to 0.42) | 0.205 | |
| 24 | 197 | 0.23 | (−0.07 to 0.52) | 0.134 | 0.28 | (−0.01 to 0.56) | 0.056 | |
| Patients (per-protocol) | ||||||||
| HIV viral load | 4 | 180 | −0.15 | (−0.44 to 0.13) | 0.288 | −0.11 | (−0.39 to 0.18) | 0.459 |
| 8 | 178 | 0.17 | (−0.09 to 0.42) | 0.201 | 0.18 | (−0.07 to 0.44) | 0.164 | |
| 16 | 173 | 0.19 | (−0.08 to 0.46) | 0.174 | 0.21 | (−0.07 to 0.48) | 0.137 | |
| 24 | 153 | 0.26 | (−0.07 to 0.59) | 0.115 | 0.35 | (−0.03 to 0.67) | 0.031 | |
| Manifestation (no) | Placebo (n = 39) | VitD3 + PBA (n = 35) |
|---|---|---|
| URTI | 3 | 2 |
| Acute bronchitis | 1 | 1 |
| Pneumonia | 1 | 1 |
| UTI | 4 | 6 |
| Otitis media | 2 | 0 |
| Tonsillitis | 0 | 2 |
| Lymphadenitis | 1 | 1 |
| Vaginal candidiasis | 1 | 1 |
| Herpes zoster | 0 | 2 |
| Skin infection | 0 | 2 |
| Dental caries | 3 | 0 |
| Oral rash | 0 | 1 |
| Carbuncle | 3 | 3 |
| Acute febrile illness | 2 | 2 |
| Sweating | 0 | 1 |
| Fatigue | 1 | 1 |
| Cough | 6 | 3 |
| Loss of appetite | 2 | 1 |
| Skin itching | 0 | 1 |
| Asthma | 0 | 1 |
| Arthralgia | 3 | 2 |
| Neuralgia | 0 | 1 |
| Anxiety disorder | 1 | 0 |
| Headache | 0 | 2 |
| Insomnia | 0 | 1 |
| Diarrhea | 5 | 2 |
| Constipation | 1 | 0 |
| Abdominal cramp | 4 | 2 |
| Dyspepsia | 5 | 4 |
| Numbness | 0 | 1 |
| Allergic conjunctivitis | 1 | 0 |
| Allergic dermatitis | 1 | 0 |
| Amenorrhea | 1 | 0 |
| Vaginal discharge | 1 | 1 |
| Total AEs | 53 | 48 |
© 2019 by the authors. Licensee MDPI, Basel, Switzerland. This article is an open access article distributed under the terms and conditions of the Creative Commons Attribution (CC BY) license (http://creativecommons.org/licenses/by/4.0/).
Share and Cite
Ashenafi, S.; Amogne, W.; Kassa, E.; Gebreselassie, N.; Bekele, A.; Aseffa, G.; Getachew, M.; Aseffa, A.; Worku, A.; Hammar, U.; et al. Daily Nutritional Supplementation with Vitamin D3 and Phenylbutyrate to Treatment-Naïve HIV Patients Tested in a Randomized Placebo-Controlled Trial. Nutrients 2019, 11, 133. https://doi.org/10.3390/nu11010133
Ashenafi S, Amogne W, Kassa E, Gebreselassie N, Bekele A, Aseffa G, Getachew M, Aseffa A, Worku A, Hammar U, et al. Daily Nutritional Supplementation with Vitamin D3 and Phenylbutyrate to Treatment-Naïve HIV Patients Tested in a Randomized Placebo-Controlled Trial. Nutrients. 2019; 11(1):133. https://doi.org/10.3390/nu11010133
Chicago/Turabian StyleAshenafi, Senait, Wondwossen Amogne, Endale Kassa, Nebiat Gebreselassie, Amsalu Bekele, Getachew Aseffa, Meron Getachew, Abraham Aseffa, Alemayehu Worku, Ulf Hammar, and et al. 2019. "Daily Nutritional Supplementation with Vitamin D3 and Phenylbutyrate to Treatment-Naïve HIV Patients Tested in a Randomized Placebo-Controlled Trial" Nutrients 11, no. 1: 133. https://doi.org/10.3390/nu11010133
APA StyleAshenafi, S., Amogne, W., Kassa, E., Gebreselassie, N., Bekele, A., Aseffa, G., Getachew, M., Aseffa, A., Worku, A., Hammar, U., Bergman, P., Aderaye, G., Andersson, J., & Brighenti, S. (2019). Daily Nutritional Supplementation with Vitamin D3 and Phenylbutyrate to Treatment-Naïve HIV Patients Tested in a Randomized Placebo-Controlled Trial. Nutrients, 11(1), 133. https://doi.org/10.3390/nu11010133