Aerobic Physical Activity and a Low Glycemic Diet Reduce the AA/EPA Ratio in Red Blood Cell Membranes of Patients with NAFLD


Abstract
1. Introduction
2. Methods
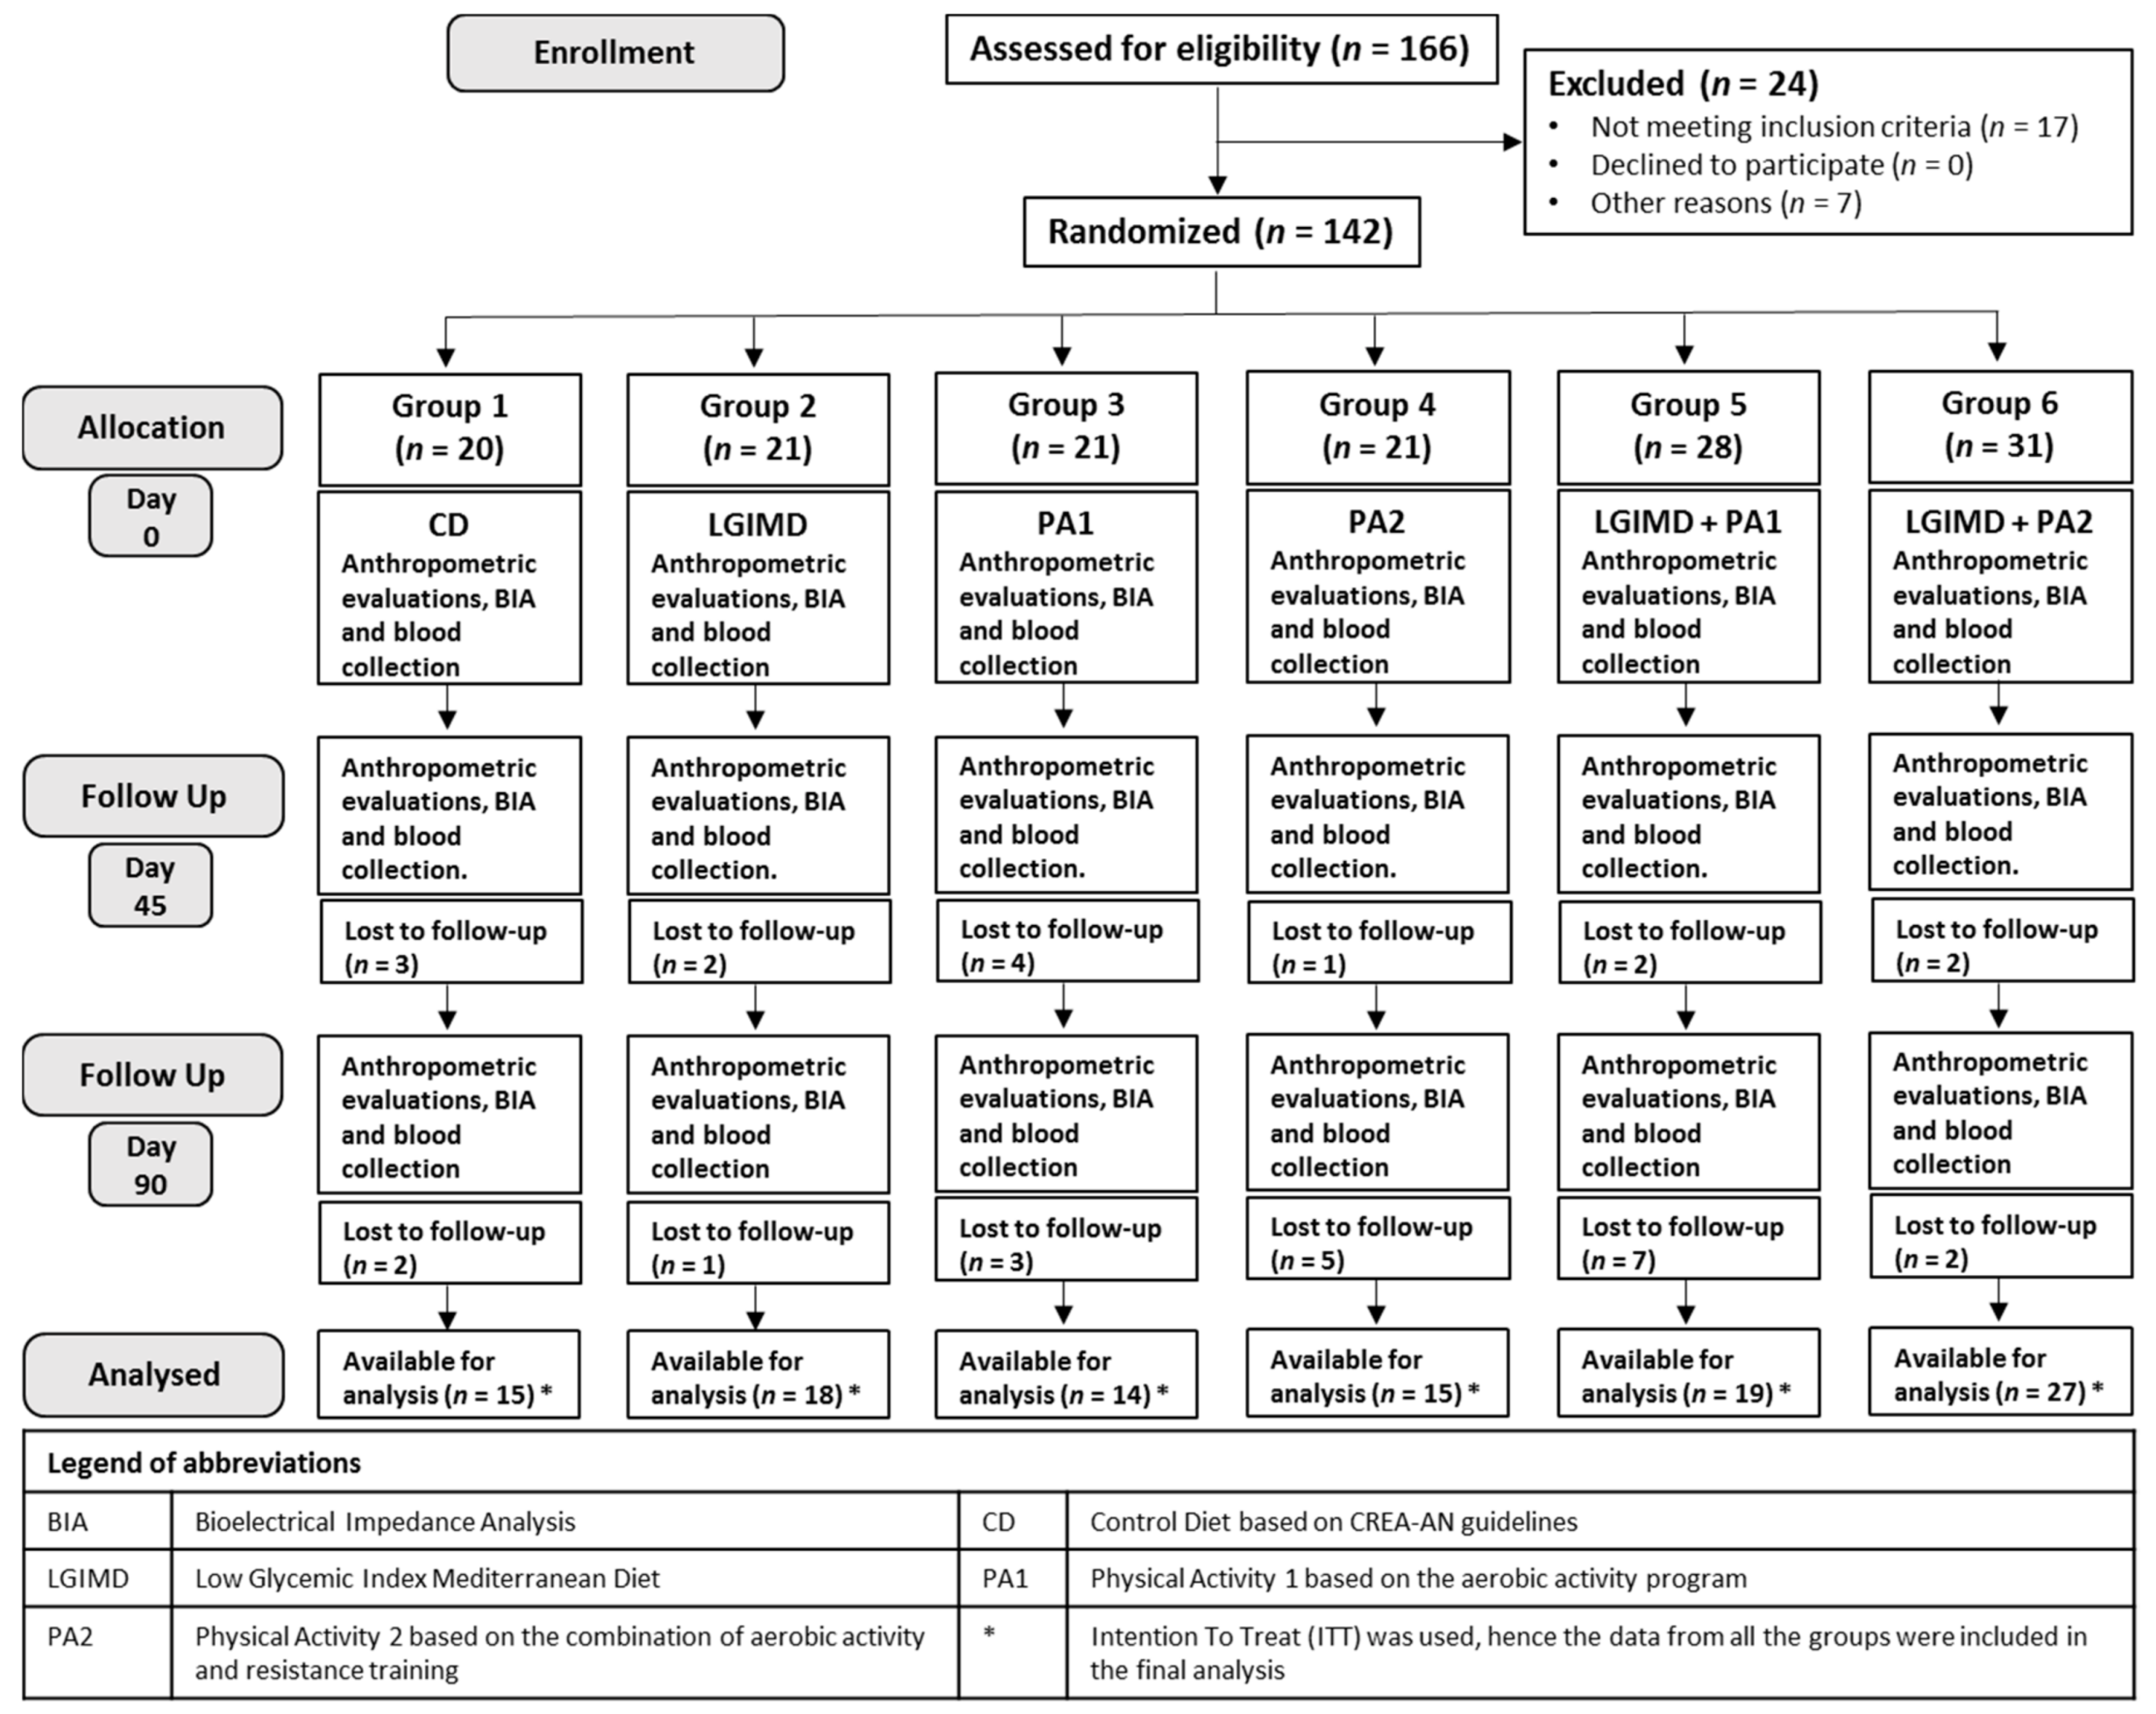
2.1. Participants
2.2. Study Design
2.3. Sample Size
2.4. Data Collection
2.5. Randomization and Masking
2.6. Anthropometric and Body Composition Measurements
2.6.1. Blood Sample Analysis
2.6.2. AA/EPA Ratio Assay
2.6.3. Diet Interventions
2.6.4. Physical Activity Interventions
2.6.5. Measurement of NAFLD
2.7. Statistical Analysis
3. Results
4. Discussion
5. Conclusions
Author Contributions
Funding
Conflicts of Interest
References
- Saini, R.K.; Keum, Y.S. Omega-3 and omega-6 polyunsaturated fatty acids: Dietary sources, metabolism, and significance—A review. Life Sci. 2018, 203, 255–267. [Google Scholar] [CrossRef] [PubMed]
- Simopoulos, A.P. Evolutionary aspects of diet, the omega-6/omega-3 ratio and genetic variation: Nutritional implications for chronic diseases. Biomed. Pharmacother. 2006, 60, 502–507. [Google Scholar] [CrossRef] [PubMed]
- Simopoulos, A.P. The importance of the omega-6/omega-3 fatty acid ratio in cardiovascular disease and other chronic diseases. Exp. Biol. Med. 2008, 233, 674–688. [Google Scholar] [CrossRef] [PubMed]
- Innes, J.K.; Calder, P.C. Omega-6 fatty acids and inflammation. Prostaglandins Leukot. Essent. Fat. Acid. 2018, 132, 41–48. [Google Scholar] [CrossRef] [PubMed]
- Rizzo, A.M.; Montorfano, G.; Negroni, M.; Adorni, L.; Berselli, P.; Corsetto, P.; Wahle, K.; Berra, B. A rapid method for determining arachidonic: Eicosapentaenoic acid ratios in whole blood lipids: Correlation with erythrocyte membrane ratios and validation in a large Italian population of various ages and pathologies. Lipids Health Dis. 2010, 9, 7. [Google Scholar] [CrossRef] [PubMed]
- Han, X.; Eggett, D.L.; Parker, T.L. Evaluation of the health benefits of a multivitamin, multimineral, herbal, essential oil-infused supplement: A pilot trial. J. Diet. Suppl. 2018, 15, 153–160. [Google Scholar] [CrossRef] [PubMed]
- Rizzo, A.M.; Corsetto, P.A.; Montorfano, G.; Opizzi, A.; Faliva, M.; Giacosa, A.; Ricevuti, G.; Pelucchi, C.; Berra, B.; Rondanelli, M. Comparison between the AA/EPA ratio in depressed and non depressed elderly females: Omega-3 fatty acid supplementation correlates with improved symptoms but does not change immunological parameters. Nutr. J. 2012, 11, 82. [Google Scholar] [CrossRef] [PubMed]
- Simopoulos, A.P.; DiNicolantonio, J.J. The importance of a balanced omega-6 to omega-3 ratio in the prevention and management of obesity. Open Heart 2016, 3, e000385. [Google Scholar] [CrossRef] [PubMed]
- Juarez-Hernandez, E.; Chavez-Tapia, N.C.; Uribe, M.; Barbero-Becerra, V.J. Role of bioactive fatty acids in nonalcoholic fatty liver disease. Nutr. J. 2016, 15, 72. [Google Scholar] [CrossRef] [PubMed]
- Simopoulos, A.P. An increase in the omega-6/omega-3 fatty acid ratio increases the risk for obesity. Nutrients 2016, 8, 128. [Google Scholar] [CrossRef] [PubMed]
- Monteiro, J.; Leslie, M.; Moghadasian, M.H.; Arendt, B.M.; Allard, J.P.; Ma, D.W. The role of n-6 and n-3 polyunsaturated fatty acids in the manifestation of the metabolic syndrome in cardiovascular disease and non-alcoholic fatty liver disease. Food Funct. 2014, 5, 426–435. [Google Scholar] [CrossRef] [PubMed]
- Simopoulos, A.P. Omega-3 fatty acids in inflammation and autoimmune diseases. J. Am. Coll. Nutr. 2002, 21, 495–505. [Google Scholar] [CrossRef] [PubMed]
- Puri, P.; Baillie, R.A.; Wiest, M.M.; Mirshahi, F.; Choudhury, J.; Cheung, O.; Sargeant, C.; Contos, M.J.; Sanyal, A.J. A lipidomic analysis of nonalcoholic fatty liver disease. Hepatology 2007, 46, 1081–1090. [Google Scholar] [CrossRef] [PubMed]
- Notarnicola, M.; Caruso, M.G.; Tutino, V.; Bonfiglio, C.; Cozzolongo, R.; Giannuzzi, V.; De Nunzio, V.; De Leonardis, G.; Abbrescia, D.I.; Franco, I.; et al. Significant decrease of saturation index in erythrocytes membrane from subjects with non-alcoholic fatty liver disease (NAFLD). Lipids Health Dis. 2017, 16, 160. [Google Scholar] [CrossRef] [PubMed]
- Chiloiro, M.; Caruso, M.G.; Cisternino, A.M.; Inguaggiato, R.; Reddavide, R.; Bonfiglio, C.; Guerra, V.; Notarnicola, M.; De Michele, G.; Correale, M.; et al. Ultrasound evaluation and correlates of fatty liver disease: A population study in a Mediterranean area. Metab. Syndr. Relat. Disord. 2013, 11, 349–358. [Google Scholar] [CrossRef] [PubMed]
- Skinner, H.A.; Sheu, W.J. Reliability of alcohol use indices. The lifetime drinking history and the mast. J. Stud. Alcohol 1982, 43, 1157–1170. [Google Scholar] [CrossRef] [PubMed]
- Craig, C.L.; Marshall, A.L.; Sjostrom, M.; Bauman, A.E.; Booth, M.L.; Ainsworth, B.E.; Pratt, M.; Ekelund, U.; Yngve, A.; Sallis, J.F.; et al. International physical activity questionnaire: 12-country reliability and validity. Med. Sci. Sports Exerc. 2003, 35, 1381–1395. [Google Scholar] [CrossRef] [PubMed]
- Riboli, E.; Hunt, K.J.; Slimani, N.; Ferrari, P.; Norat, T.; Fahey, M.; Charrondiere, U.R.; Hemon, B.; Casagrande, C.; Vignat, J.; et al. European prospective investigation into cancer and nutrition (epic): Study populations and data collection. Public Heal. Nutr. 2002, 5, 1113–1124. [Google Scholar] [CrossRef] [PubMed]
- Kyle, U.G.; Bosaeus, I.; De Lorenzo, A.D.; Deurenberg, P.; Elia, M.; Manuel Gomez, J.; Lilienthal Heitmann, B.; Kent-Smith, L.; Melchior, J.C.; Pirlich, M.; et al. Bioelectrical impedance analysis-part ii: Utilization in clinical practice. Clin. Nutr. 2004, 23, 1430–1453. [Google Scholar] [CrossRef] [PubMed]
- Moilanen, T.; Nikkari, T. The effect of storage on the fatty acid composition of human serum. Clin. Chim. Acta Int. J. Clin. Chem. 1981, 114, 111–116. [Google Scholar] [CrossRef]
- Folch, J.; Lees, M.; Sloane Stanley, G.H. A simple method for the isolation and purification of total lipides from animal tissues. J. Biol. Chem. 1957, 226, 497–509. [Google Scholar] [PubMed]
- Cialfa, E.; D’Amicis, A.; Leclercq, C.; Quaglia, G.B.; Sette, S.; Ticca, M.; Tomassi, G. Coordination and Editorial Committee of Istituto Nazionale di Ricerca per gli Alimenti e la Nutrizione (INRAN); Linee Guida Per Una Sana Alimentazione Italiana: Roma, Italy, 2003. [Google Scholar]
- Misciagna, G.; Del Pilar Diaz, M.; Caramia, D.V.; Bonfiglio, C.; Franco, I.; Noviello, M.R.; Chiloiro, M.; Abbrescia, D.I.; Mirizzi, A.; Tanzi, M.; et al. Effect of a low glycemic index Mediterranean diet on non-alcoholic fatty liver disease. A randomized controlled clinici trial. J. Nutr. Heal. Aging 2017, 21, 404–412. [Google Scholar] [CrossRef] [PubMed]
- Alberti-Fidanza, A.; Fidanza, F. Mediterranean adequacy index of italian diets. Public Heal. Nutr. 2004, 7, 937–941. [Google Scholar] [CrossRef]
- Welk, G. Physical Activity Assessments for Health-Related Research; Human Kinetics: Leeds, UK, 2002. [Google Scholar]
- Thompson, W.; Gordon, N.; Pescatello, L. American College of Sport Medicine. Acsm’s Guidelines for Exercise Testing and Prescription; 8. Painos. Lippincott Williams Wilkins: Philadelphia, PA, USA, 2009. [Google Scholar]
- Berzigotti, A. Non-invasive assessment of non-alcoholic fatty liver disease: Ultrasound and transient elastography. Rev. Recent Clin. Trials 2014, 9, 170–177. [Google Scholar] [CrossRef] [PubMed]
- Berzigotti, A. Getting closer to a point-of-care diagnostic assessment in patients with chronic liver disease: Controlled attenuation parameter for steatosis. J. Hepatol. 2014, 60, 910–912. [Google Scholar] [CrossRef] [PubMed]
- Mansara, P.P.; Deshpande, R.A.; Vaidya, M.M.; Kaul-Ghanekar, R. Differential ratios of omega fatty acids (AA/EPA+DHA) modulate growth, lipid peroxidation and expression of tumor regulatory MARBPs in breast cancer cell lines mcf7 and mda-mb-231. PLoS ONE 2015, 10, e0136542. [Google Scholar] [CrossRef] [PubMed]
- Pahlavani, M.; Razafimanjato, F.; Ramalingam, L.; Kalupahana, N.S.; Moussa, H.; Scoggin, S.; Moustaid-Moussa, N. Eicosapentaenoic acid regulates brown adipose tissue metabolism in high-fat-fed mice and in clonal brown adipocytes. J. Nutr. Biochem. 2017, 39, 101–109. [Google Scholar] [CrossRef] [PubMed]
- Coviello, G.; Tutino, V.; Notarnicola, M.; Caruso, M.G. Erythrocyte membrane fatty acids profile in colorectal cancer patients: A preliminary study. Anticancer Res. 2014, 34, 4775–4779. [Google Scholar] [PubMed]
- Street, S.J.; Parletta, N.; Milte, C.; Sullivan, K.; Hills, A.P.; Buckley, J.; Howe, P. Interaction of erythrocyte eicosapentaenoic acid and physical activity predicts reduced risk of mild cognitive impairment. Aging Mental Health 2015, 19, 885–891. [Google Scholar] [CrossRef] [PubMed]
- Osotchuk, S.S.; Martsinkevitch, A.F. The lipid composition of membranes of erythrocytes in athletes of cyclic types of sport. Klinicheskaia Laboratornaia Diagnostika 2014, 5, 17–20. [Google Scholar]


| Physical Activity Groups | ||
|---|---|---|
| PA1 | PA2 | |
| N. of weekly sessions | 4 a | 3 b |
| Type of Exercise: Aerobic | 45–60 min of moderate-intensity treadmill walking or cycling (60–75% VO2 max obtained from HRM). | 45 min of moderate-intensity treadmill walking or cycling (60–75% VO2 max obtained from HRM). |
| Type of Exercise: Resistance | 2 sets of 12 exercises, each to volitional fatigue: leg press; adductor/abductor; buttocks; bicep curls, tricep extensions, three different abdominal exercises, leg machine, low row, shoulder flexion.Approximate duration of each session 45 min. | |
| Total Weekly Exercise | 180–240 min | 270 min |
| Variables * | Group 1 CD | Group 2 LGIMD | Group 3 PA1 | Group 4 PA2 | Group 5 LGIMD + PA1 | Group 6 LGIMD + PA2 |
|---|---|---|---|---|---|---|
| AA/EPA, % | 18.5 ± 10.1 | 18.2 ± 8.11 | 16.3 ± 7.01 | 16.4 ± 6.79 | 18.0 ± 8.87 | 14.6 ± 4.52 |
| Age, years | 52.1 ± 9.52 | 55.5 ± 10.4 | 50.8 ± 9.62 | 45.9 ± 9.09 | 49.5 ± 9.27 | 46.3 ± 11.1 |
| PhA, degrees | 6.06 ± 0.89 | 6.16 ± 1.01 | 6.19 ± 0.85 | 6.44 ± 0.73 | 6.12 ± 0.90 | 6.11 ± 0.87 |
| FM, kg | 34.2 ± 12.2 | 30.9 ± 10.4 | 31.1 ± 10.5 | 28.1 ± 7.13 | 31.0 ± 7.64 | 37.0 ± 12.1 |
| Hydration, % | 73.9 ± 1.76 | 73.9 ± 2.32 | 73.6 ± 1.23 | 73.4 ± 0.48 | 73.8 ± 1.45 | 74.2 ± 2.10 |
| BMI, kg/m2 | 34.1 ± 4.97 | 32.8 ± 4.22 | 32.7 ± 5.24 | 30.8 ± 3.16 | 33.1 ± 4.20 | 35.4 ± 5.34 |
| Waist Circumference, cm | 105.9 ± 11.9 | 102.1 ± 11.4 | 104.1 ± 8.49 | 99.7 ± 8.10 | 103.5 ± 11.9 | 106.4 ± 13.7 |
| Cholesterol, mg/dL | 199.1 ± 40.8 | 199.1 ± 53.8 | 193.1 ± 31.1 | 205.4 ± 35.9 | 202.9 ± 42.5 | 199.4 ± 38.6 |
| CAP, dB/m | 297.9 ± 77.2 | 324.9 ± 42.5 | 313.0 ± 46.5 | 316.4 ± 41.5 | 307.8 ± 38.7 | 303.0 ± 36.4 |
| HDL, mg/dL | 47.5 ± 13.1 | 47.1 ± 15.1 | 43.4 ± 10.2 | 44.9 ± 11.6 | 44.1 ± 8.38 | 43.2 ± 10.5 |
| Triglycerides, mg/dL | 106.5 ± 53.4 | 142.1 ± 104.4 | 125.0 ± 86.3 | 123.1 ± 58.3 | 144.6 ± 93.5 | 141.0 ± 82.4 |
| HOMA-IR, mg/dL | 2.90 ± 1.65 | 2.74 ± 1.29 | 2.95 ± 1.67 | 2.51 ± 1.59 | 3.23 ± 1.76 | 3.59 ± 2.70 |
| Hemoglobin, g/L | 14.5 ± 1.42 | 14.6 ± 1.11 | 14.7 ± 1.00 | 15.0 ± 1.16 | 14.4 ± 1.57 | 14.3 ± 1.59 |
| Hematocrit, % | 42.8 ± 3.84 | 43.4 ± 2.64 | 42.9 ± 2.41 | 43.7 ± 3.18 | 42.6 ± 3.48 | 42.3 ± 3.77 |
| Neutrophils, 103/µL | 3.26 ± 0.81 | 3.94 ± 1.65 | 3.87 ± 1.39 | 3.47 ± 1.30 | 3.87 ± 1.11 | 4.05 ± 1.31 |
| SFAs, % | 54.2 ± 9.10 | 51.83 ± 6.79 | 52.46 ± 8.67 | 53.55 ± 10.94 | 52.40 ± 8.21 | 51.86 ± 7.10 |
| MUFAs, % | 21.25 ± 7.41 | 21.1 ± 3.96 | 22.32 ± 6.08 | 21.79 ± 5.47 | 23.26 ± 5.46 | 22.70 ± 4.82 |
| PUFAs, % | 24.5 ± 4.90 | 26.1 ± 5.49 | 24.6 ± 5.45 | 24.9 ± 5.89 | 24.2 ± 5.23 | 24.6 ± 4.85 |
| Palmitic acid, % | 29.37 ± 5.16 | 28.28 ± 3.04 | 28.26 ± 5.13 | 28.06 ± 4.31 | 27.99 ± 3.93 | 27.13 ± 4.69 |
| Stearic acid, % | 20.09 ± 4.60 | 18.78 ± 4.34 | 18.75 ± 4.29 | 20.11 ± 8.17 | 20.16 ± 5.64 | 18.39 ± 3.36 |
| Oleic acid, % | 15.79 ± 6.86 | 13.18 ± 2.76 | 15.67 ± 4.79 | 14.64 ± 5.06 | 14.28 ± 4.74 | 15.88 ± 3.70 |
| DGLA, % | 1.34 ± 0.36 | 1.55 ± 0.47 | 1.40 ± 0.26 | 1.31 ± 0.52 | 1.43 ± 0.32 | 1.50 ± 0.63 |
| DHA, % | 2.44 ± 0.67 | 2.99 ± 0.88 | 3.07 ± 0.78 | 2.51 ± 0.79 | 2.75 ± 0.92 | 3.04 ± 0.55 |
| AA, % | 12.6 ± 6.38 | 13.16 ± 6.99 | 10.9 ± 4.97 | 10.5 ± 4.31 | 11.7 ± 3.94 | 11.7 ± 3.77 |
| EPA, % | 0.72 ± 0.21 | 0.74 ± 0.21 | 0.72 ± 0.26 | 0.70 ± 0.22 | 0.72 ± 0.25 | 0.85 ± 0.26 |
| Variables * | Group 1 % (SD%) | Group 2 % (SD%) | Group 3 % (SD%) | Group 4 % (SD%) | Group 5 % (SD%) | Group 6 % (SD%) | ||||||
|---|---|---|---|---|---|---|---|---|---|---|---|---|
| Gender | ||||||||||||
| Female | 10 | (17.9) | 8 | (12.5) | 8 | (16.1) | 8 | (10.7) | 8 | (16.1) | 15 | (26.8) |
| Male | 10 | (10.7) | 13 | (15.5) | 13 | (16.7) | 13 | (16.7) | 20 | (19.0) | 16 | (21.4) |
| Smoking status | ||||||||||||
| Never smoked | 12 | (16.4) | 7 | (9.6) | 10 | (13.7) | 10 | (13.7) | 16 | (21.9) | 18 | (24.7) |
| Former smoker | 4 | (12.9) | 7 | (22.6) | 5 | (16.1) | 4 | (12.9) | 4 | (12.9) | 7 | (22.6) |
| Current smoker | 0 | (0.0) | 4 | (17.4) | 5 | (21.7) | 4 | (17.4) | 3 | (13.0) | 7 | (30.4) |
| Level of Physical activity | ||||||||||||
| Low | 0 | (0.0) | 0 | (0.0) | 1 | (11.1) | 3 | (33.3) | 1 | (11.1) | 4 | (44.4) |
| Moderate | 4 | (13.8) | 5 | (17.2) | 3 | (10.3) | 4 | (13.8) | 4 | (13.8) | 9 | (31.0) |
| High | 12 | (14.1) | 13 | (15.3) | 14 | (16.5) | 11 | (12.9) | 17 | (20.0) | 18 | (21.2) |
| Status | ||||||||||||
| Single | 1 | (7.7) | 1 | (7.7) | 1 | (7.7) | 3 | (23.1) | 2 | (15.4) | 5 | (38.5) |
| Married | 14 | (14.6) | 15 | (15.6) | 17 | (17.7) | 11 | (11.5) | 17 | (17.7) | 22 | (22.9) |
| Divorced | 0 | (0.0) | 0 | (0.0) | 1 | (25.0) | 0 | (0.0) | 1 | (25.0) | 2 | (50.0) |
| Widowed | 0 | (0.0) | 0 | (0.0) | 0 | (0.0) | 2 | (100.0) | 0 | (0.0) | 0 | (0.0) |
| Study level | ||||||||||||
| Elementary | 1 | (25.0) | 1 | (25.0) | 0 | (0.0) | 0 | (0.0) | 1 | (25.0) | 1 | (25.0) |
| Secondary School | 8 | (21.6) | 6 | (16.2) | 8 | (21.6) | 3 | (8.1) | 4 | (10.8) | 8 | (21.6) |
| High School | 5 | (9.3) | 8 | (14.8) | 8 | (14.8) | 9 | (16.7) | 7 | (13.0) | 17 | (31.5) |
| Diploma college | 1 | (50.0) | 1 | (50.0) | 0 | (0.0) | 0 | (0.0) | 0 | (0.0) | 0 | (0.0) |
| University degree | 0 | (0.0) | 1 | (4.8) | 3 | (14.3) | 5 | (23.8) | 8 | (38.1) | 4 | (19.0) |
| NAFLD | ||||||||||||
| Moderate | 5 | (11.1) | 5 | (11.1) | 6 | (13.3) | 7 | (15.6) | 9 | (20.0) | 13 | (28.9) |
| Severe | 14 | (14.7) | 15 | (15.8) | 17 | (17.9) | 13 | (13.7) | 16 | (16.8) | 20 | (21.1) |
| Diabetes | ||||||||||||
| No | 16 | (14.3) | 15 | (13.4) | 21 | (18.8) | 18 | (16.1) | 15 | (13.4) | 27 | (24.1) |
| Yes | 1 | (11.1) | 3 | (33.3) | 1 | (11.1) | 0 | (0.0) | 3 | (33.3) | 1 | (11.1) |
| Hypertension | ||||||||||||
| No | 10 | (12.7) | 9 | (11.4) | 14 | (17.7) | 13 | (16.5) | 12 | (15.2) | 21 | (26.6) |
| Yes | 7 | (15.9) | 9 | (20.5) | 8 | (18.2) | 5 | (11.4) | 8 | (18.2) | 7 | (15.9) |
| Cancer | ||||||||||||
| No | 14 | (12.4) | 16 | (14.2) | 19 | (16.8) | 18 | (15.9) | 20 | (17.7) | 26 | (23.0) |
| Yes | 3 | (37.5) | 1 | (12.5) | 2 | (25.0) | 0 | (0.0) | 0 | (0.0) | 2 | (25.0) |
| Week | Group 3 | Group 4 | Group 5 | Group 6 | |||||
|---|---|---|---|---|---|---|---|---|---|
| Male | Female | Male | Female | Male | Female | Male | Female | ||
| % (SE%) | % (SE%) | % (SE%) | % (SE%) | % (SE%) | % (SE%) | % (SE%) | % (SE%) | ||
| 3rd | Time | 91.4 ± 17.1 | 100 ± 0.00 | 100 ± 0.00 | 100 ± 0.00 | 98.1 ± 25.9 | 99.9 ± 23.5 | 100 ± 0.00 | 100 ± 0.00 |
| Intensity | 99.3 ± 3.72 | 100 ± 0.00 | 100 ± 0.00 | 100 ± 0.00 | 100 ± 0.00 | 100 ± 0.00 | 100 ± 0.00 | 100 ± 0.00 | |
| Load | N/A | N/A | 100 ± 0.00 | 100 ± 0.00 | N/A | N/A | 100 ± 0.00 | 100 ± 0.00 | |
| 4th | Time | 98.0 ± 40.1 | 125 ± 41.8 | 100 ± 0.00 | 100 ± 0.00 | 92.0 ± 15.6 | 86.3 ± 16.5 | 100 ± 0.00 | 100 ± 0.00 |
| Intensity | 99.0 ± 3.33 | 100 ± 0.00 | 100 ± 0.00 | 100 ± 0.00 | 100 ± 0.00 | 100 ± 0.00 | 100 ± 0.00 | 100 ± 0.00 | |
| Load | N/A | N/A | 100 ± 0.00 | 100 ± 0.00 | N/A | N/A | 100 ± 0.00 | 100 ± 0.00 | |
| 5th | Time | 88.4 ± 15.7 | 97.3 ± 31.0 | 104.2 ± 14.4 | 108.3 ± 20.4 | 90.0 ± 18.5 | 91.0 ± 17.2 | 100 ± 0.00 | 100 ± 0.00 |
| Intensity | 99.3 ± 2.13 | 100 ± 0.00 | 100 ± 0.00 | 100 ± 0.00 | 100 ± 0.00 | 100 ± 0.00 | 100 ± 0.00 | 100 ± 0.00 | |
| Load | N/A | N/A | 100 ± 0.00 | 100 ± 0.00 | N/A | N/A | 100 ± 0.00 | 100 ± 0.00 | |
| 6th | Time | 96.1 ± 20.4 | 90.0 ± 16.4 | 104.2 ± 14.4 | 108.3 ± 20.4 | 87.0 ± 19.0 | 93.0 ± 14.0 | 100 ± 0.00 | 100 ± 0.00 |
| Intensity | 99.9 ± 3.19 | 100 ± 0.00 | 100 ± 0.00 | 100 ± 0.00 | 100 ± 0.00 | 100 ± 0.00 | 100 ± 0.00 | 100 ± 0.00 | |
| Load | N/A | N/A | 100 ± 0.00 | 100 ± 0.00 | N/A | N/A | 100 ± 0.00 | 100 ± 0.00 | |
| 7th | Time | 89.0 ± 19.2 | 129.5 ± 72.2 | 108.3 ± 19.5 | 108.3 ± 20.4 | 93.1 ± 29.1 | 116.0 ± 69.5 | 100 ± 0.00 | 100 ± 0.00 |
| Intensity | 99.7 ± 0.83 | 100 ± 0.00 | 100 ± 0.00 | 100 ± 0.00 | 100 ± 0.00 | 100 ± 0.00 | 100 ± 0.00 | 100 ± 0.00 | |
| Load | N/A | N/A | 100 ± 0.00 | 100 ± 0.00 | N/A | N/A | 100 ± 0.00 | 100 ± 0.00 | |
| 8th | Time | 112.2 ± 47.2 | 112.5 ± 30.6 | 100 ± 0.00 | 100 ± 0.00 | 80.0 ± 21.9 | 121.1 ± 77.3 | 100 ± 0.00 | 100 ± 0.00 |
| Intensity | 99.9 ± 1.07 | 100 ± 0.00 | 100 ± 0.00 | 100 ± 0.00 | 100 ± 0.00 | 100 ± 0.00 | 100 ± 0.00 | 100 ± 0.00 | |
| Load | N/A | N/A | 100 ± 0.00 | 100 ± 0.00 | N/A | N/A | 100 ± 0.00 | 100 ± 0.00 | |
| 9th | Time | 103.4 ± 39.5 | 110.0 ± 20.0 | 109.1 ± 20.2 | 112.5 ± 25.0 | 88.3 ± 36.0 | 102.2 ± 33.5 | 103.5 ± 13.4 | 100 ± 0.00 |
| Intensity | 100.5 ± 1.39 | 100 ± 0.00 | 100 ± 0.00 | 100 ± 0.00 | 100 ± 0.00 | 100 ± 0.00 | 100 ± 0.00 | 100 ± 0.00 | |
| Load | N/A | N/A | 100 ± 0.00 | 100 ± 0.00 | N/A | N/A | 100 ± 0.00 | 100 ± 0.00 | |
| 10th | Time | 93.4 ± 15.5 | 134.3 ± 32.5 | 109.1 ± 20.2 | 112.5 ± 25.0 | 88.3 ± 36.0 | 96.1 ± 27.5 | 103.6 ± 13.4 | 100 ± 0.00 |
| Intensity | 100.5 ± 1.39 | 100 ± 0.00 | 100 ± 0.00 | 100 ± 0.00 | 100 ± 0.00 | 100 ± 0.00 | 100 ± 0.00 | 100 ± 0.00 | |
| Load | N/A | N/A | 100 ± 0.00 | 100 ± 0.00 | N/A | N/A | 100 ± 0.00 | 100 ± 0.00 | |
| Age Classes (Years) | Test | Men | Women | ||
|---|---|---|---|---|---|
| Baseline | 3rd Month | Baseline | 3rd Month | ||
| Mean ± SD | Mean ± SD | Mean ± SD | Mean ± SD | ||
| 30–39 | Walking (s) * | 1105.5 ± 76.1 | 1020.5 ± 64.2 | 1283.7 ± 116.3 | 1150.0 ± 142.0 |
| Push-up * | 12.1 ± 3.89 | 18.9 ± 4.73 | 9.67 ± 10.6 | 26.6 ± 10.8 | |
| Sit and Reach | −9.41 ± 7.24 | −6.87 ± 6.22 | −5.83 ± 4.87 | −2.60 ± 6.11 | |
| 40–49 | Walking (s) * | 1102.2 ± 96.9 | 1033.7 ± 94.4 | 1264.6 ± 211.8 | 1115.4 ± 124.5 |
| Push-up * | 10.8 ± 7.37 | 15.7 ± 7.47 | 10.8 ± 8.96 | 16.3 ± 9.76 | |
| Sit and Reach | −11.9 ± 9.64 | −7.25 ± 11.5 | −6.20 ± 9.18 | −6.82 ± 10.4 | |
| 50–59 | Walking (s) * | 1106.6 ± 167.6 | 1035.8 ± 81.8 | 1367.7 ± 165.7 | 1195.4 ± 66.5 |
| Push-up * | 10.3 ± 7.39 | 17.3 ± 8.72 | 6.54 ± 5.54 | 18.8 ± 7.93 | |
| Sit and Reach | −9.55 ± 6.78 | −6.12 ± 8.70 | −9.54 ± 10.7 | −6.22 ± 8.84 | |
| ≥60 | Walking (s) * | 1173.2 ± 102.4 | 1103.5 ± 84.5 | 1311.3 ± 78.6 | 1235.4 ± 96.5 |
| Push-up * | 5.29 ± 3.80 | 10.00 ± 7.65 | 5.83 ± 5.25 | 11.8 ± 4.52 | |
| Sit and Reach | −14.1 ± 9.53 | −14.7 ± 7.28 | −7.75 ±7.87 | −6.67 ± 7.52 | |
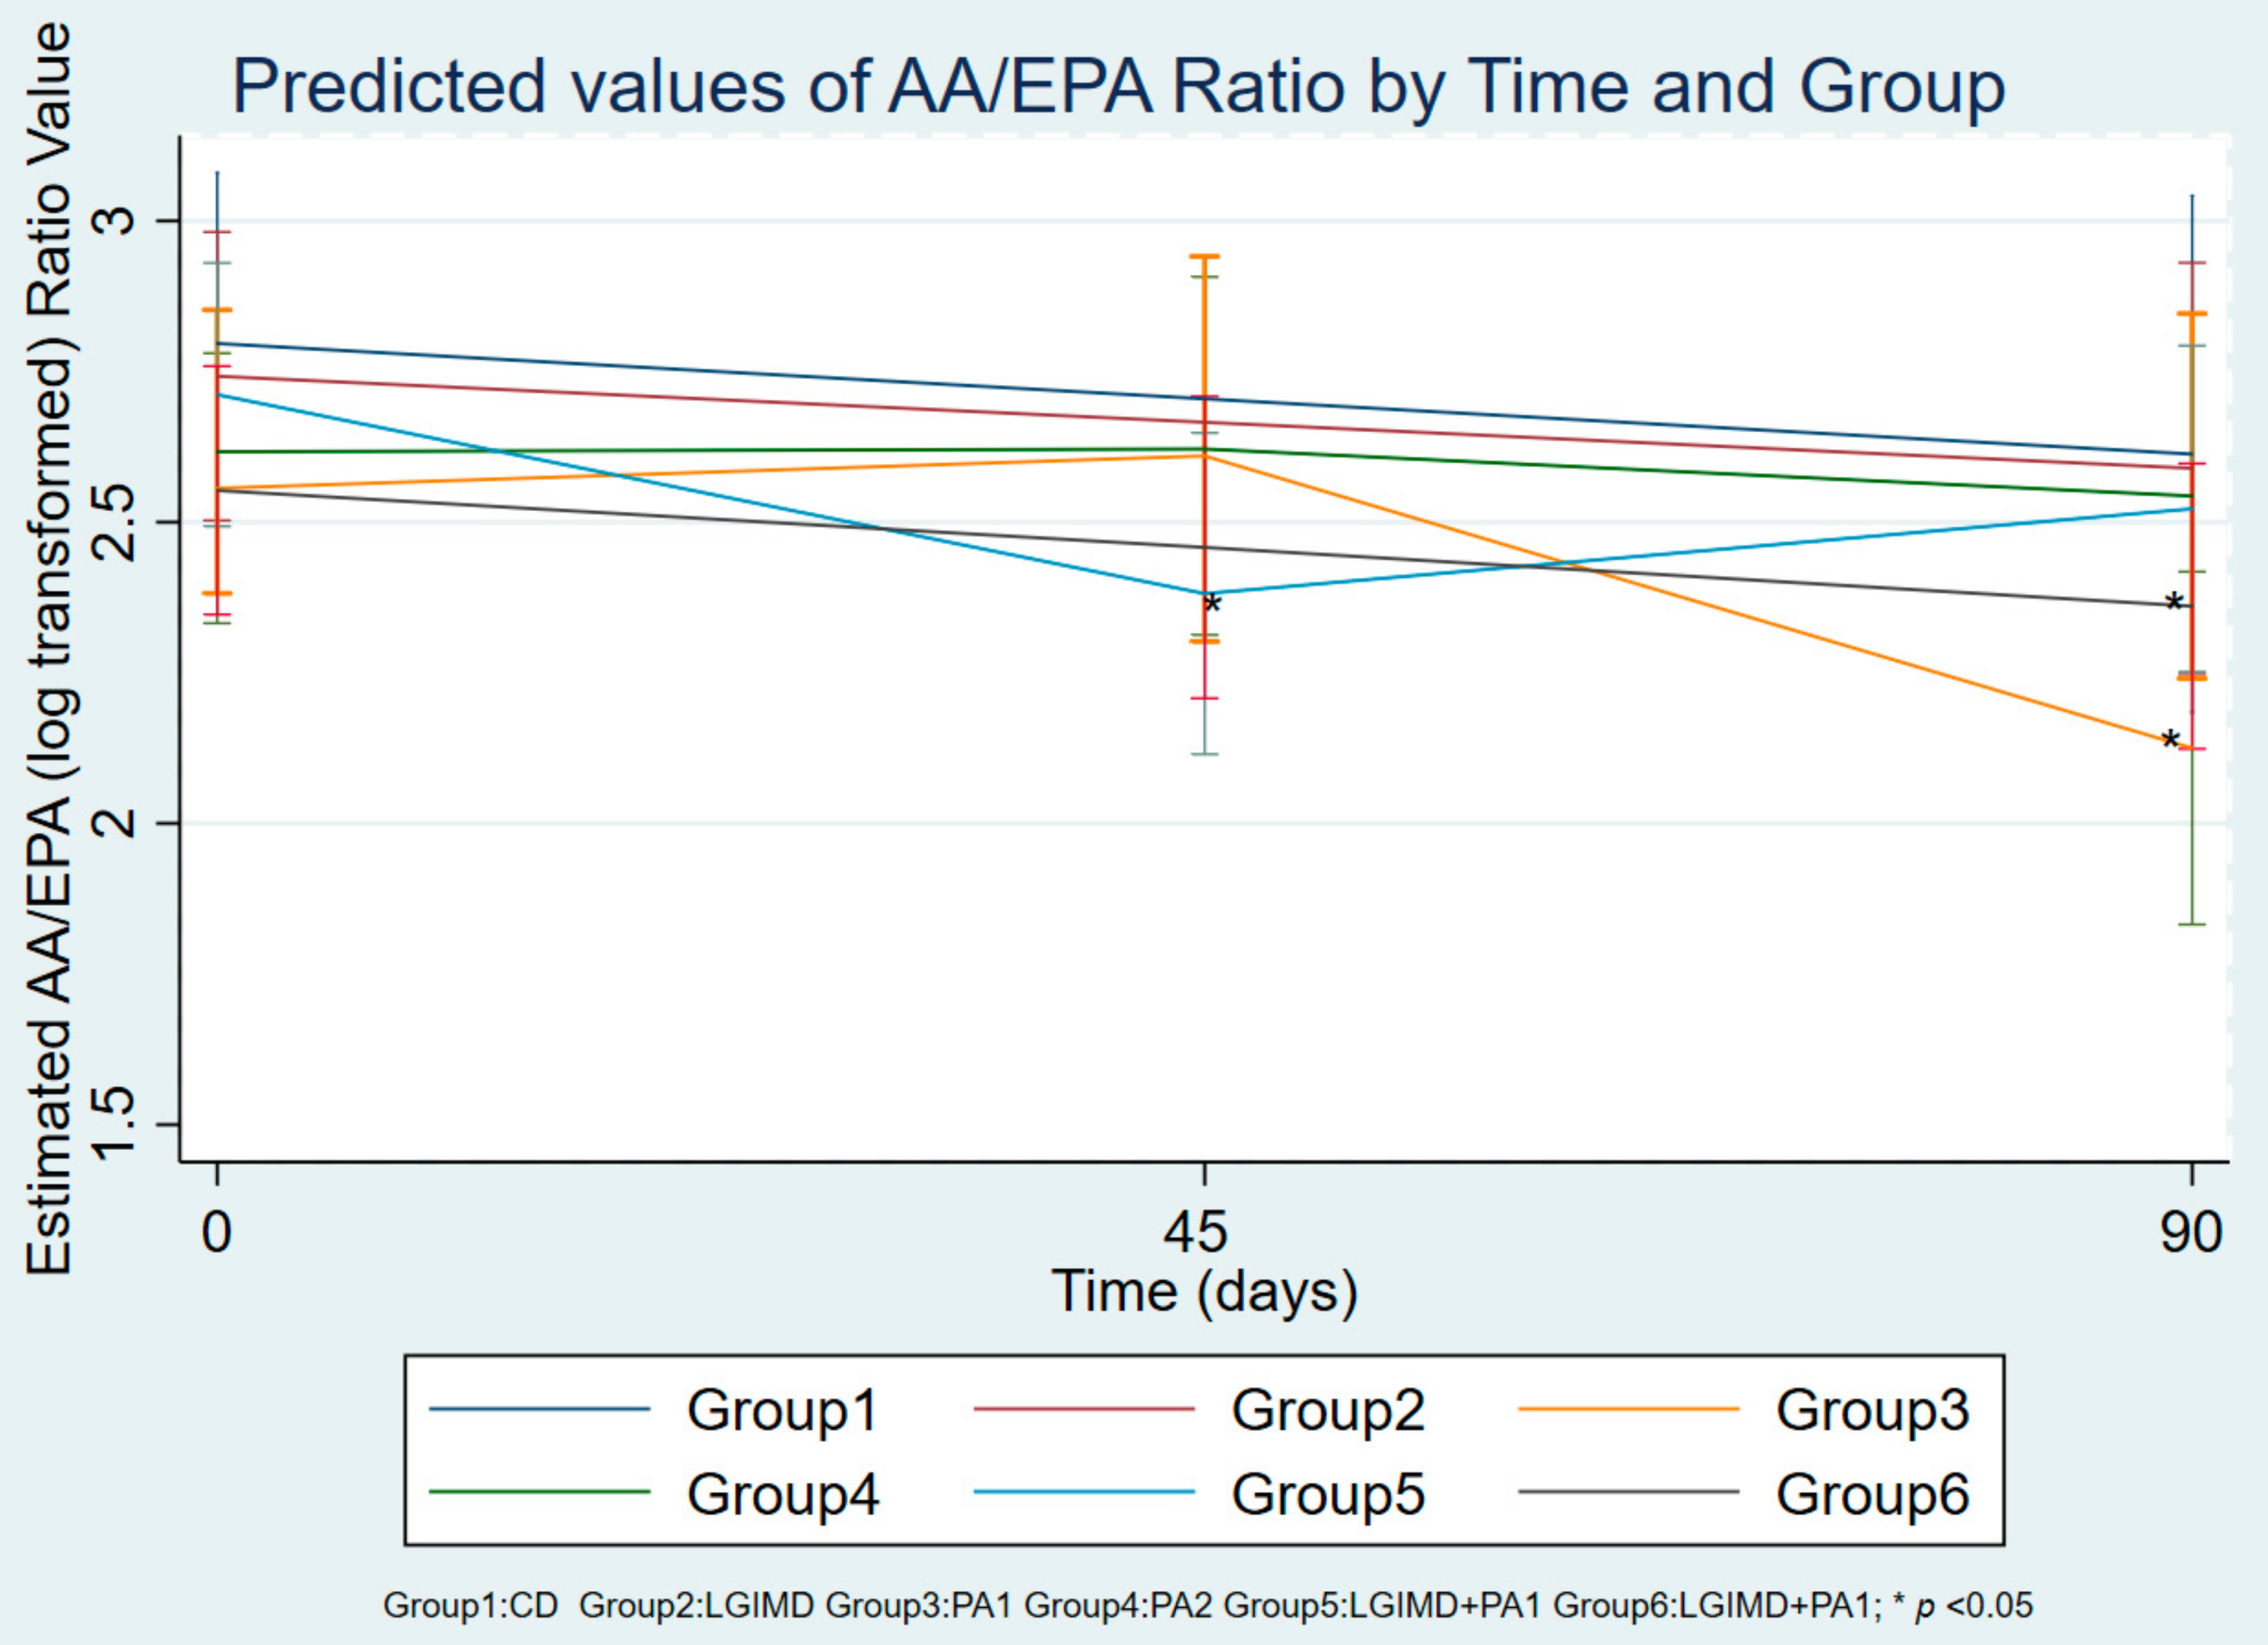
| Fatty Acids | Time | Group 1 CD | Group 2 LGIMD | Group 3 PA1 | Group 4 PA2 | Group 5 LGIMD + PA1 | Group 6 LGIMD + PA2 |
|---|---|---|---|---|---|---|---|
| AA/EPA, % | Day 0 | 18.5 ± 10.1 | 18.2 ± 8.11 | 16.3 ± 7.01 | 16.4 ± 6.79 | 18.0 ± 8.87 | 14.6 ± 4.52 |
| Day 45 | 14.4 ± 5.34 | 14.7 ± 8.14 | 13.0 ± 7.08 | 13.5 ± 5.95 | 10.4 ± 5.10 * | 12.8 ± 7.00 | |
| Days 90 | 17.8 ± 6.60 | 17.2 ± 8.46 | 11.3 ± 6.90 * | 15.9 ± 7.20 | 12.5 ± 4.80 * | 11.1 ± 4.70 * | |
| AA, % | Day 0 | 12.6 ± 6.38 | 13.1 ± 6.99 | 10.9 ± 4.97 | 10.5 ± 4.31 | 11.7 ± 3.94 | 11.7 ± 3.77 |
| Day 45 | 13.8 ± 1.90 | 12.9 ± 3.35 | 13.1 ± 3.52 | 12.8 ± 3.68 | 14.0 ± 2.80 * | 10.9 ± 3.50 | |
| Days 90 | 13.3 ± 3.16 | 12.4 ± 3.28 | 12.4 ± 3.20 | 13.8 ± 3.60 * | 13.8 ± 2.60 * | 10.3 ± 2.70 | |
| EPA, % | Day 0 | 0.7 ± 0.21 | 0.7 ± 0.21 | 0.7 ± 0.26 | 0.7 ± 0.22 | 0.7 ± 0.25 | 0.8 ± 0.26 |
| Day 45 | 1.1 ± 0.44 | 1.1 ± 0.57 * | 1.2 ± 0.68 * | 1.1 ± 0.47 * | 1.5 ± 0.50 * | 1.3 ± 1.30 | |
| Days 90 | 0.9 ± 0.76 | 0.8 ± 0.41 | 1.5 ± 0.98 * | 1.0 ± 0.40 * | 1.2 ± 0.40 * | 1.2 ± 0.90 | |
| Palmitic acid, % | Day 0 | 29.3 ± 5.16 | 28.2 ± 3.04 | 28.2 ± 5.13 | 28.0 ± 4.31 | 27.9 ± 3.93 | 27.1 ± 4.69 |
| Day 45 | 22.9 ± 1.53 * | 25.4 ± 3.17 * | 23.5 ± 1.97 | 25.5 ± 3.24 | 25.6 ± 4.17 | 22.1 ± 2.22 * | |
| Days 90 | 27.5 ± 1.69 | 29.0 ± 2.77 | 26.4 ± 3.52 | 27.1 ± 3.73 | 26.2 ± 3.44 | 26.0 ± 4.13 | |
| Stearic acid, % | Day 0 | 20.1 ± 4.60 | 18.7 ± 4.34 | 18.7 ± 4.29 | 20.1 ± 8.17 | 20.1 ± 5.64 | 18.3 ± 3.36 |
| Day 45 | 15.5 ± 4.56 * | 16.9 ± 4.13 | 17.8 ± 2.25 | 18.8 ± 5.60 | 18.6 ± 5.83 | 16.3 ± 2.36 * | |
| Days 90 | 16.6 ± 1.19 * | 18.9 ± 4.17 | 16.3 ± 1.28 | 19.4 ± 5.88 | 18.4 ± 4.75 | 18.2 ± 2.48 | |
| Oleic acid, % | Day 0 | 15.8 ± 6.86 | 13.1 ± 2.76 | 15.6 ± 4.79 | 14.6 ± 5.06 | 14.2 ± 4.74 | 15.8 ± 3.70 |
| Day 45 | 15.6 ± 4.47 | 16.2 ± 3.46 * | 14.9 ± 2.59 | 14.5 ± 3.81 | 13.9 ± 3.00 | 16.1 ± 3.22 | |
| Days 90 | 15.8 ± 3.18 | 13.5 ± 2.34 | 15.3 ± 3.39 | 13.9 ± 3.13 | 14.5 ± 4.37 | 16.6 ± 3.49 | |
| DGLA, % | Day 0 | 1.3 ± 0.36 | 1.5 ± 0.47 | 1.4 ± 0.26 | 1.3 ± 0.52 | 1.4 ± 0.32 | 1.5 ± 0.63 |
| Day 45 | 2.0 ± 0.95 * | 1.1 ± 0.32 | 1.9 ± 0.54 * | 1.2 ± 0.40 | 1.4 ± 0.62 | 1.6 ± 0.73 | |
| Days 90 | 1.5 ± 0.59 | 1.3 ± 0.42 | 1.3 ± 0.31 | 1.5 ± 0.60 | 1.5 ± 0.68 | 1.5 ± 0.46 | |
| DHA, % | Day 0 | 2.4 ± 0.67 | 2.9 ± 0.88 | 3.0 ± 0.78 | 2.5 ± 0.79 | 2.7 ± 0.92 | 3.0 ± 0.55 |
| Day 45 | 3.9 ± 0.47 * | 3.5 ± 0.71 * | 3.7 ± 1.04 * | 3.4 ± 0.54 * | 3.9 ± 1.27 * | 4.1 ± 1.00 * | |
| Days 90 | 3.0 ± 0.60 * | 3.0 ± 0.68 | 3.5 ± 0.84 | 3.0 ± 0.88 | 3.5 ± 1.34 | 3.5 ± 0.93 * | |
| SFAs, % | Day 0 | 54.2 ± 9.10 | 51.8 ± 6.79 | 52.4 ± 8.67 | 53.5 ± 10.94 | 52.4 ± 8.21 | 51.8 ± 7.10 |
| Day 45 | 44.2 ± 4.55 * | 47.6 ± 5.95 * | 47.5 ± 3.27 * | 50.1 ± 7.42 | 49.5 ± 8.78 | 44.8 ± 3.91 * | |
| Days 90 | 49.4 ± 2.93 * | 52.6 ± 6.01 | 49.2 ± 5.14 | 52.3 ± 7.90 | 49.6 ± 6.80 | 49.4 ± 4.60 | |
| MUFAs, % | Day 0 | 21.2 ± 7.41 | 21.1 ± 3.96 | 22.3 ± 6.08 | 21.7 ± 5.47 | 23.2 ± 5.46 | 22.7 ± 4.82 |
| Day 45 | 26.2 ± 5.28 * | 25.2 ± 4.75 | 26.3 ± 3.58 | 23.9 ± 4.80 | 24.4 ± 4.33 | 27.6 ± 3.72 * | |
| Days 90 | 22.5 ± 3.18 | 20.2 ± 2.69 | 23.9 ± 4.98 | 21.9 ± 4.73 | 24.6 ± 5.35 | 24.7 ± 5.34 | |
| PUFAs, % | Day 0 | 24.5 ± 4.90 | 26.1 ± 5.49 | 24.6 ± 5.45 | 24.9 ± 5.89 | 24.2 ± 5.23 | 24.6 ± 4.85 |
| Day 45 | 29.4 ± 2.35 * | 27.0 ± 2.68 | 26.2 ± 2 .73 | 25.9 ± 3.93 | 26.0 ± 5.18 | 27.6 ± 3.72 * | |
| Days 90 | 28.0 ±1.91 * | 27.0 ± 4.03 | 27.1 ± 2.00 | 25.7 ± 5.33 | 25.7 ± 3.67 | 25.8 ± 2.90 |
| AA/EPA Ratio (log) | β | SE | p Value | (95% Conf. Interval) | |
|---|---|---|---|---|---|
| AA/EPA ratio Group 5 45 days | −0.45 | 0.20 | 0.033 | −0.83 | −0.06 |
| AA/EPA ratio Group 6 45 days | −0.32 | 0.19 | 0.090 | −0.70 | 0.05 |
| AA/EPA ratio Group 3 90 days | −0.67 | 0.20 | 0.001 | −1.06 | −0.28 |
| AA/EPA ratio Group 6 90 days | −0.44 | 0.19 | 0.019 | −0.81 | −0.07 |
| Triglycerides, mg/dL | 0.001 | 0.000 | 0.05 | 0.00 | 0.002 |
| Cholesterol, mg/dL | 0.000 | 0.001 | 0.681 | −0.003 | 0.002 |
| HOMA-IR, mg/dL | 0.004 | 0.013 | 0.744 | −0.02 | 0.03 |
| HDL, mg/dL | 0.000 | 0.004 | 0.953 | −0.01 | 0.01 |
| Hemoglobin, g/L | 0.011 | 0.051 | 0.028 | 0.01 | 0.22 |
| Hematocrit, % | −0.06 | 0.032 | 0.041 | −0.12 | −0.002 |
| Neutrophils, 103/µL | 0.08 | 0.035 | 0.031 | 0.01 | 0.14 |
| CAP, dB/m | 0.002 | 0.00 | 0.05 | 0.001 | 0.003 |
| BMI, kg/m2 | 0.04 | 0.019 | 0.033 | −0.08 | −0.003 |
| FM, kg | 0.019 | 0.010 | 0.072 | 0.00 | 0.04 |
| Waist Circumference, cm | 0.000 | 0.007 | 0.988 | −0.01 | 0.01 |
| Time # Group * | Margin | SE | p-Value | (95% Conf. Interval) | |
|---|---|---|---|---|---|
| 1 # 1 | 2.80 | 0.14 | 0.00 | 2.53 | 3.08 |
| 1 # 2 | 2.74 | 0.12 | 0.00 | 2.51 | 2.97 |
| 1 # 3 | 2.53 | 0.11 | 0.00 | 2.31 | 2.75 |
| 1 # 4 | 2.65 | 0.12 | 0.00 | 2.42 | 2.89 |
| 1 # 5 | 2.70 | 0.11 | 0.00 | 2.48 | 2.91 |
| 1 # 6 | 2.53 | 0.10 | 0.00 | 2.33 | 2.73 |
| 2 # 1 | Not estimable | ||||
| 2 # 2 | Not estimable | ||||
| 2 # 3 | 2.63 | 0.15 | 0.00 | 2.34 | 2.92 |
| 2 # 4 | 2.62 | 0.16 | 0.00 | 2.30 | 2.93 |
| 2 # 5 | 2.35 | 0.13 | 0.00 | 2.09 | 2.62 |
| 2 # 6 | 2.48 | 0.13 | 0.00 | 2.23 | 2.72 |
| 3 # 1 | 2.63 | 0.22 | 0.00 | 2.20 | 3.05 |
| 3 # 2 | 2.58 | 0.17 | 0.00 | 2.24 | 2.91 |
| 3 # 3 | 2.13 | 0.15 | 0.00 | 1.83 | 2.42 |
| 3 # 4 | 2.54 | 0.15 | 0.00 | 2.24 | 2.84 |
| 3 # 5 | 2.52 | 0.13 | 0.00 | 2.26 | 2.78 |
| 3 # 6 | 2.36 | 0.12 | 0.00 | 2.13 | 2.59 |
© 2018 by the authors. Licensee MDPI, Basel, Switzerland. This article is an open access article distributed under the terms and conditions of the Creative Commons Attribution (CC BY) license (http://creativecommons.org/licenses/by/4.0/).
Share and Cite
Tutino, V.; De Nunzio, V.; Caruso, M.G.; Bonfiglio, C.; Franco, I.; Mirizzi, A.; De Leonardis, G.; Cozzolongo, R.; Giannuzzi, V.; Giannelli, G.; et al. Aerobic Physical Activity and a Low Glycemic Diet Reduce the AA/EPA Ratio in Red Blood Cell Membranes of Patients with NAFLD. Nutrients 2018, 10, 1299. https://doi.org/10.3390/nu10091299
Tutino V, De Nunzio V, Caruso MG, Bonfiglio C, Franco I, Mirizzi A, De Leonardis G, Cozzolongo R, Giannuzzi V, Giannelli G, et al. Aerobic Physical Activity and a Low Glycemic Diet Reduce the AA/EPA Ratio in Red Blood Cell Membranes of Patients with NAFLD. Nutrients. 2018; 10(9):1299. https://doi.org/10.3390/nu10091299
Chicago/Turabian StyleTutino, Valeria, Valentina De Nunzio, Maria Gabriella Caruso, Caterina Bonfiglio, Isabella Franco, Antonella Mirizzi, Giampiero De Leonardis, Raffaele Cozzolongo, Vito Giannuzzi, Gianluigi Giannelli, and et al. 2018. "Aerobic Physical Activity and a Low Glycemic Diet Reduce the AA/EPA Ratio in Red Blood Cell Membranes of Patients with NAFLD" Nutrients 10, no. 9: 1299. https://doi.org/10.3390/nu10091299
APA StyleTutino, V., De Nunzio, V., Caruso, M. G., Bonfiglio, C., Franco, I., Mirizzi, A., De Leonardis, G., Cozzolongo, R., Giannuzzi, V., Giannelli, G., Notarnicola, M., & Osella, A. R. (2018). Aerobic Physical Activity and a Low Glycemic Diet Reduce the AA/EPA Ratio in Red Blood Cell Membranes of Patients with NAFLD. Nutrients, 10(9), 1299. https://doi.org/10.3390/nu10091299