Determining the Glycaemic Index of Standard and High-Sugar Rodent Diets in C57BL/6 Mice


Abstract
1. Introduction
2. Materials and Methods
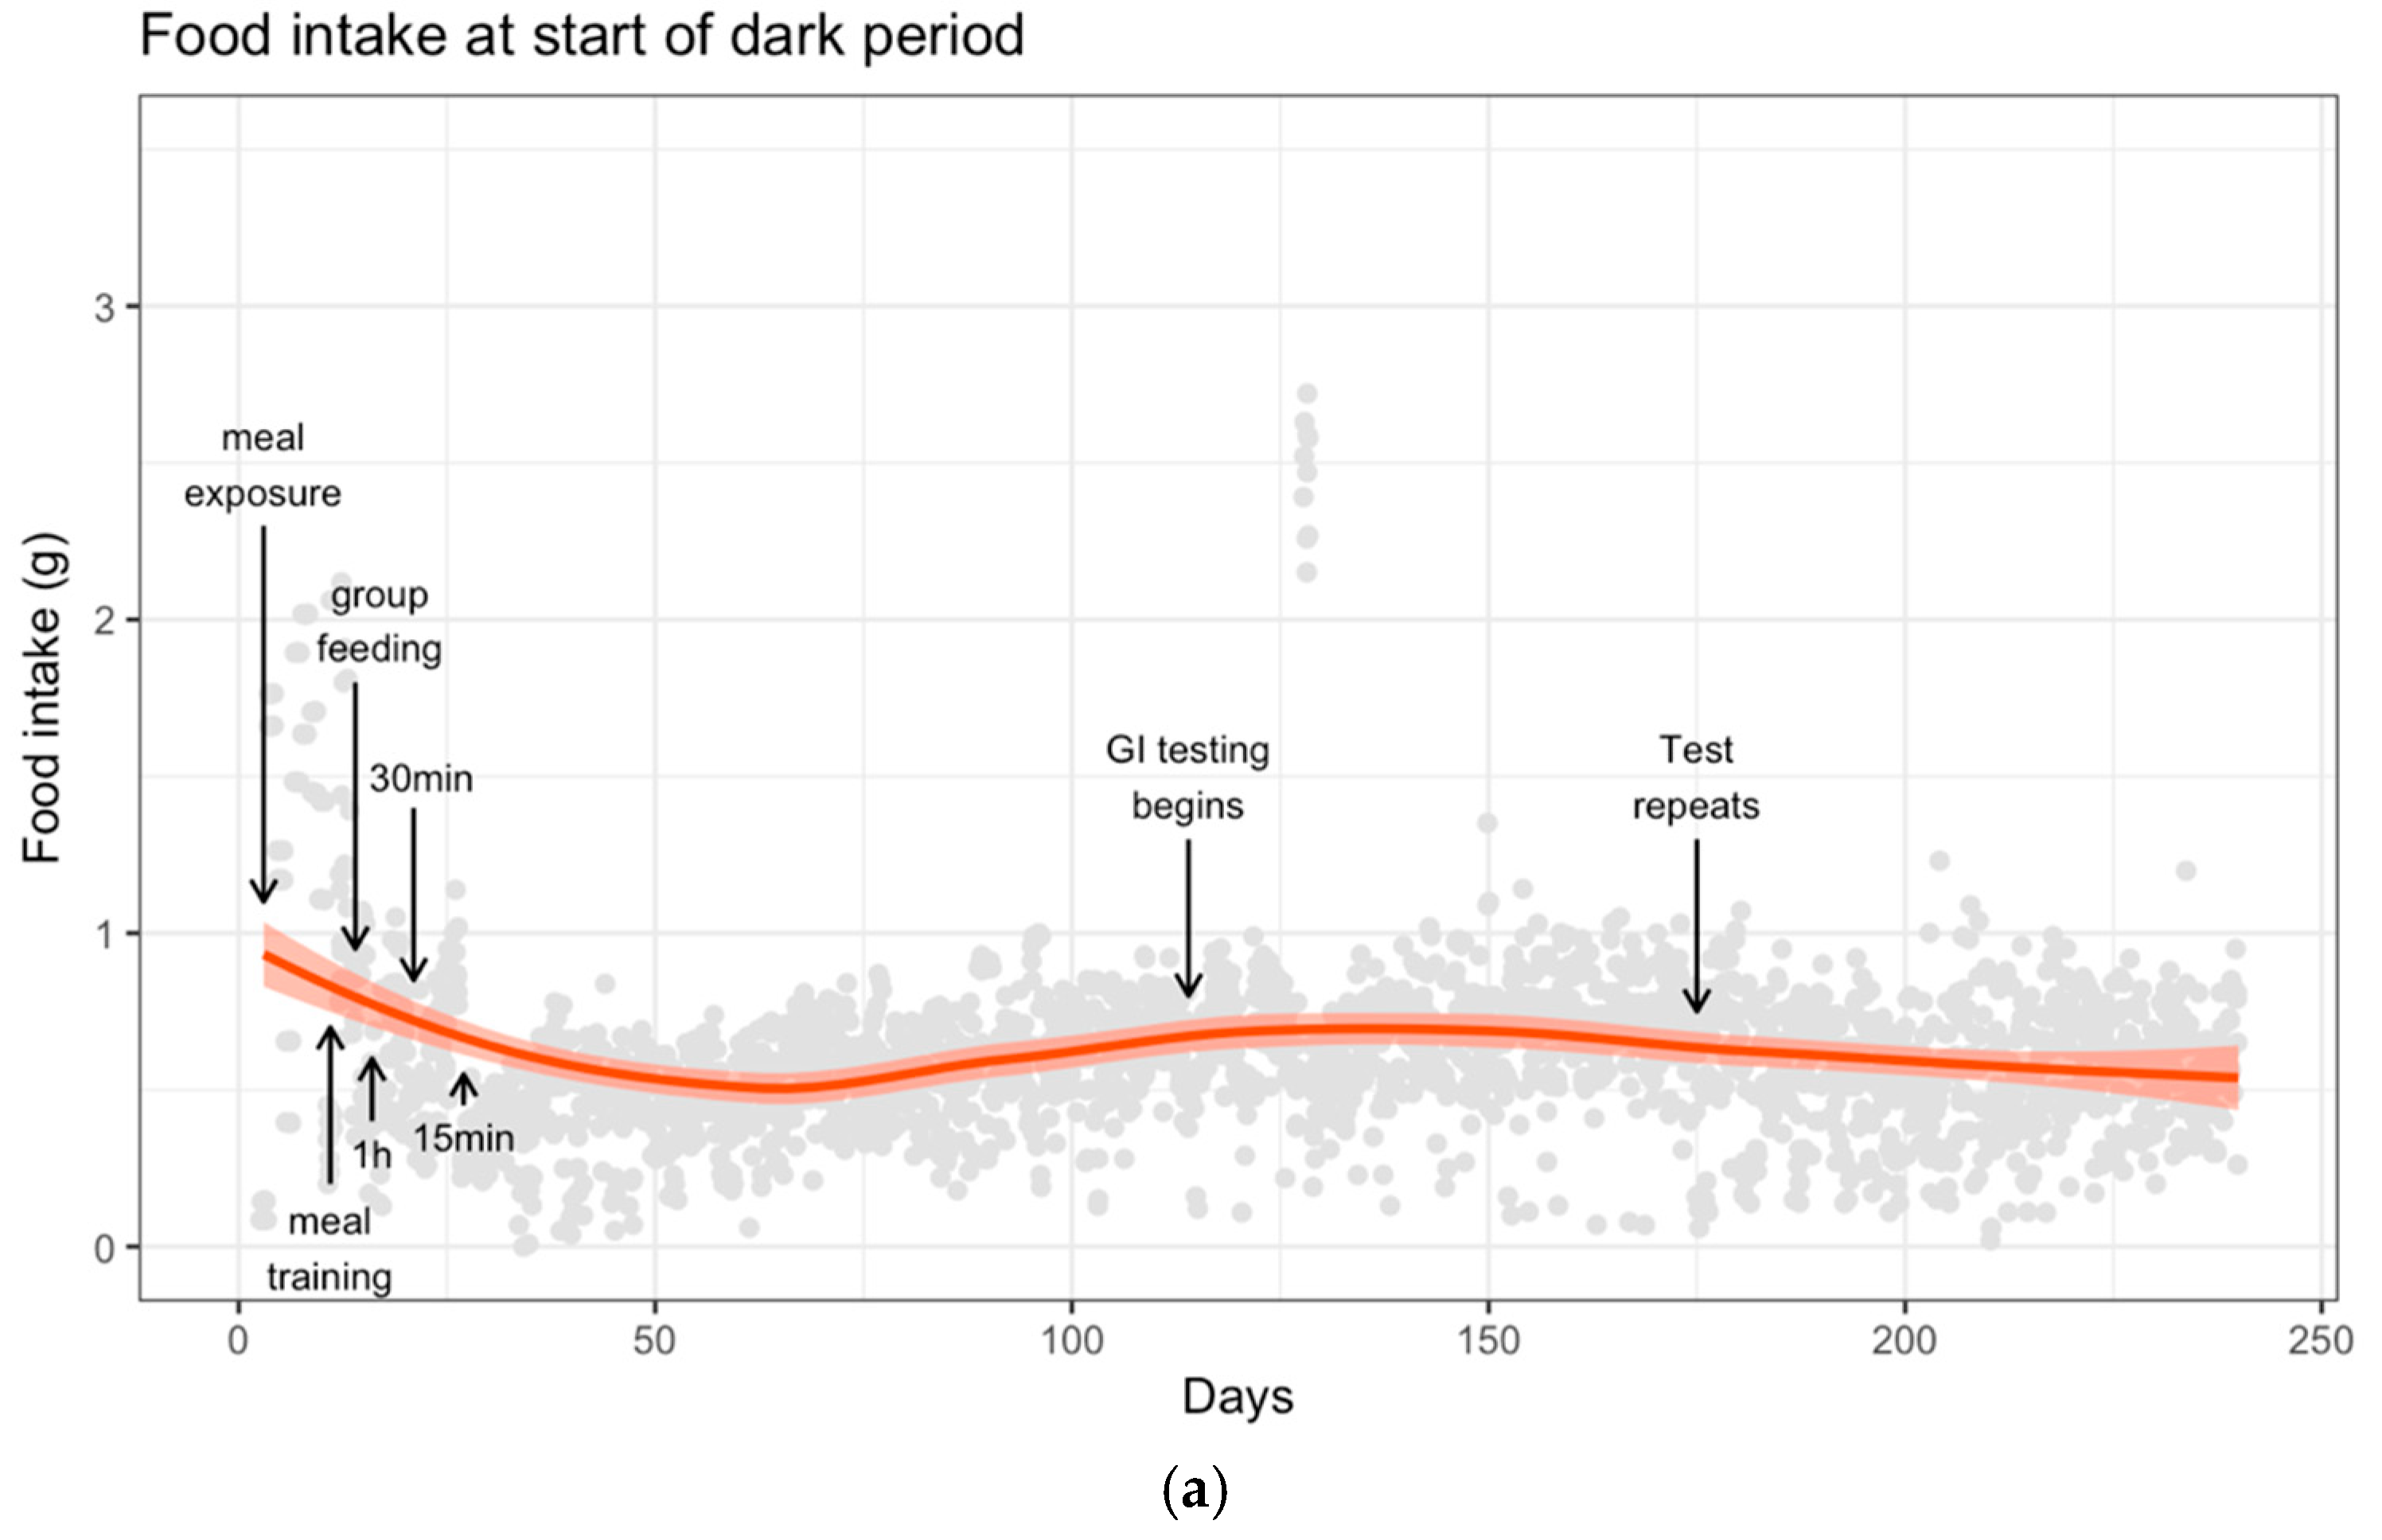
2.1. Meal Training
2.2. GI Testing
2.3. Meal Composition
2.4. Statistics
3. Results
3.1. Body Weight
3.2. Food Intake
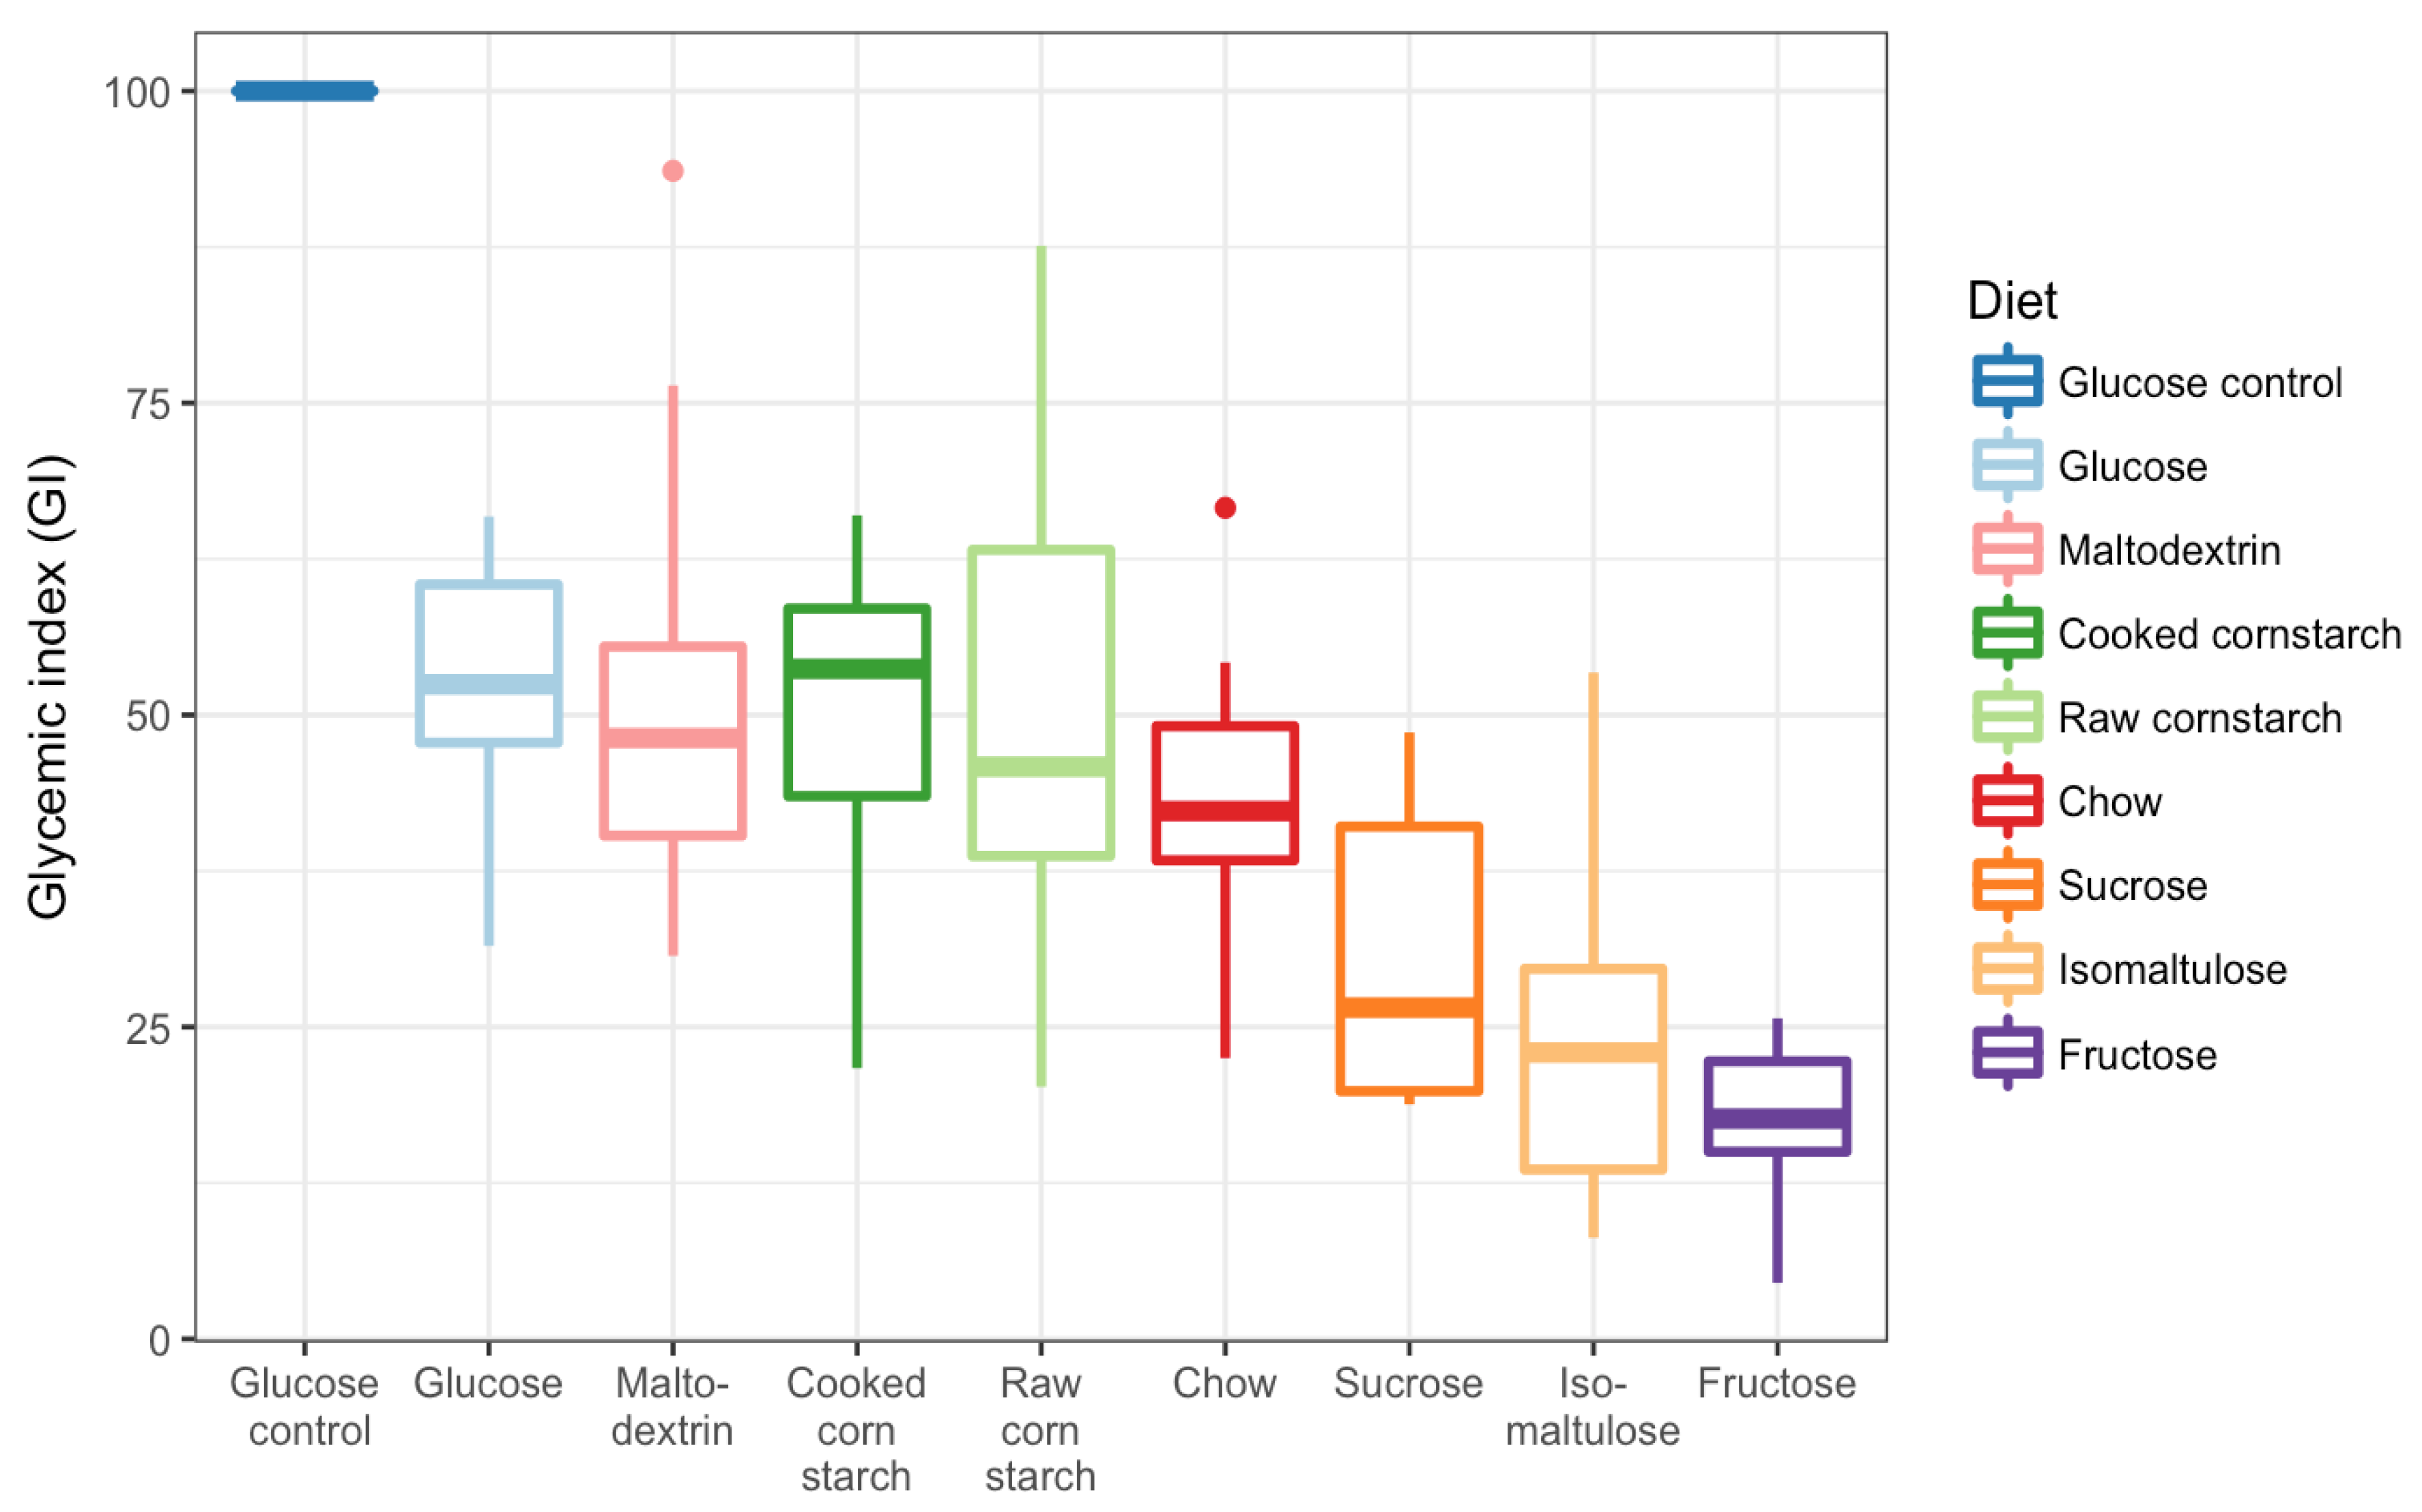
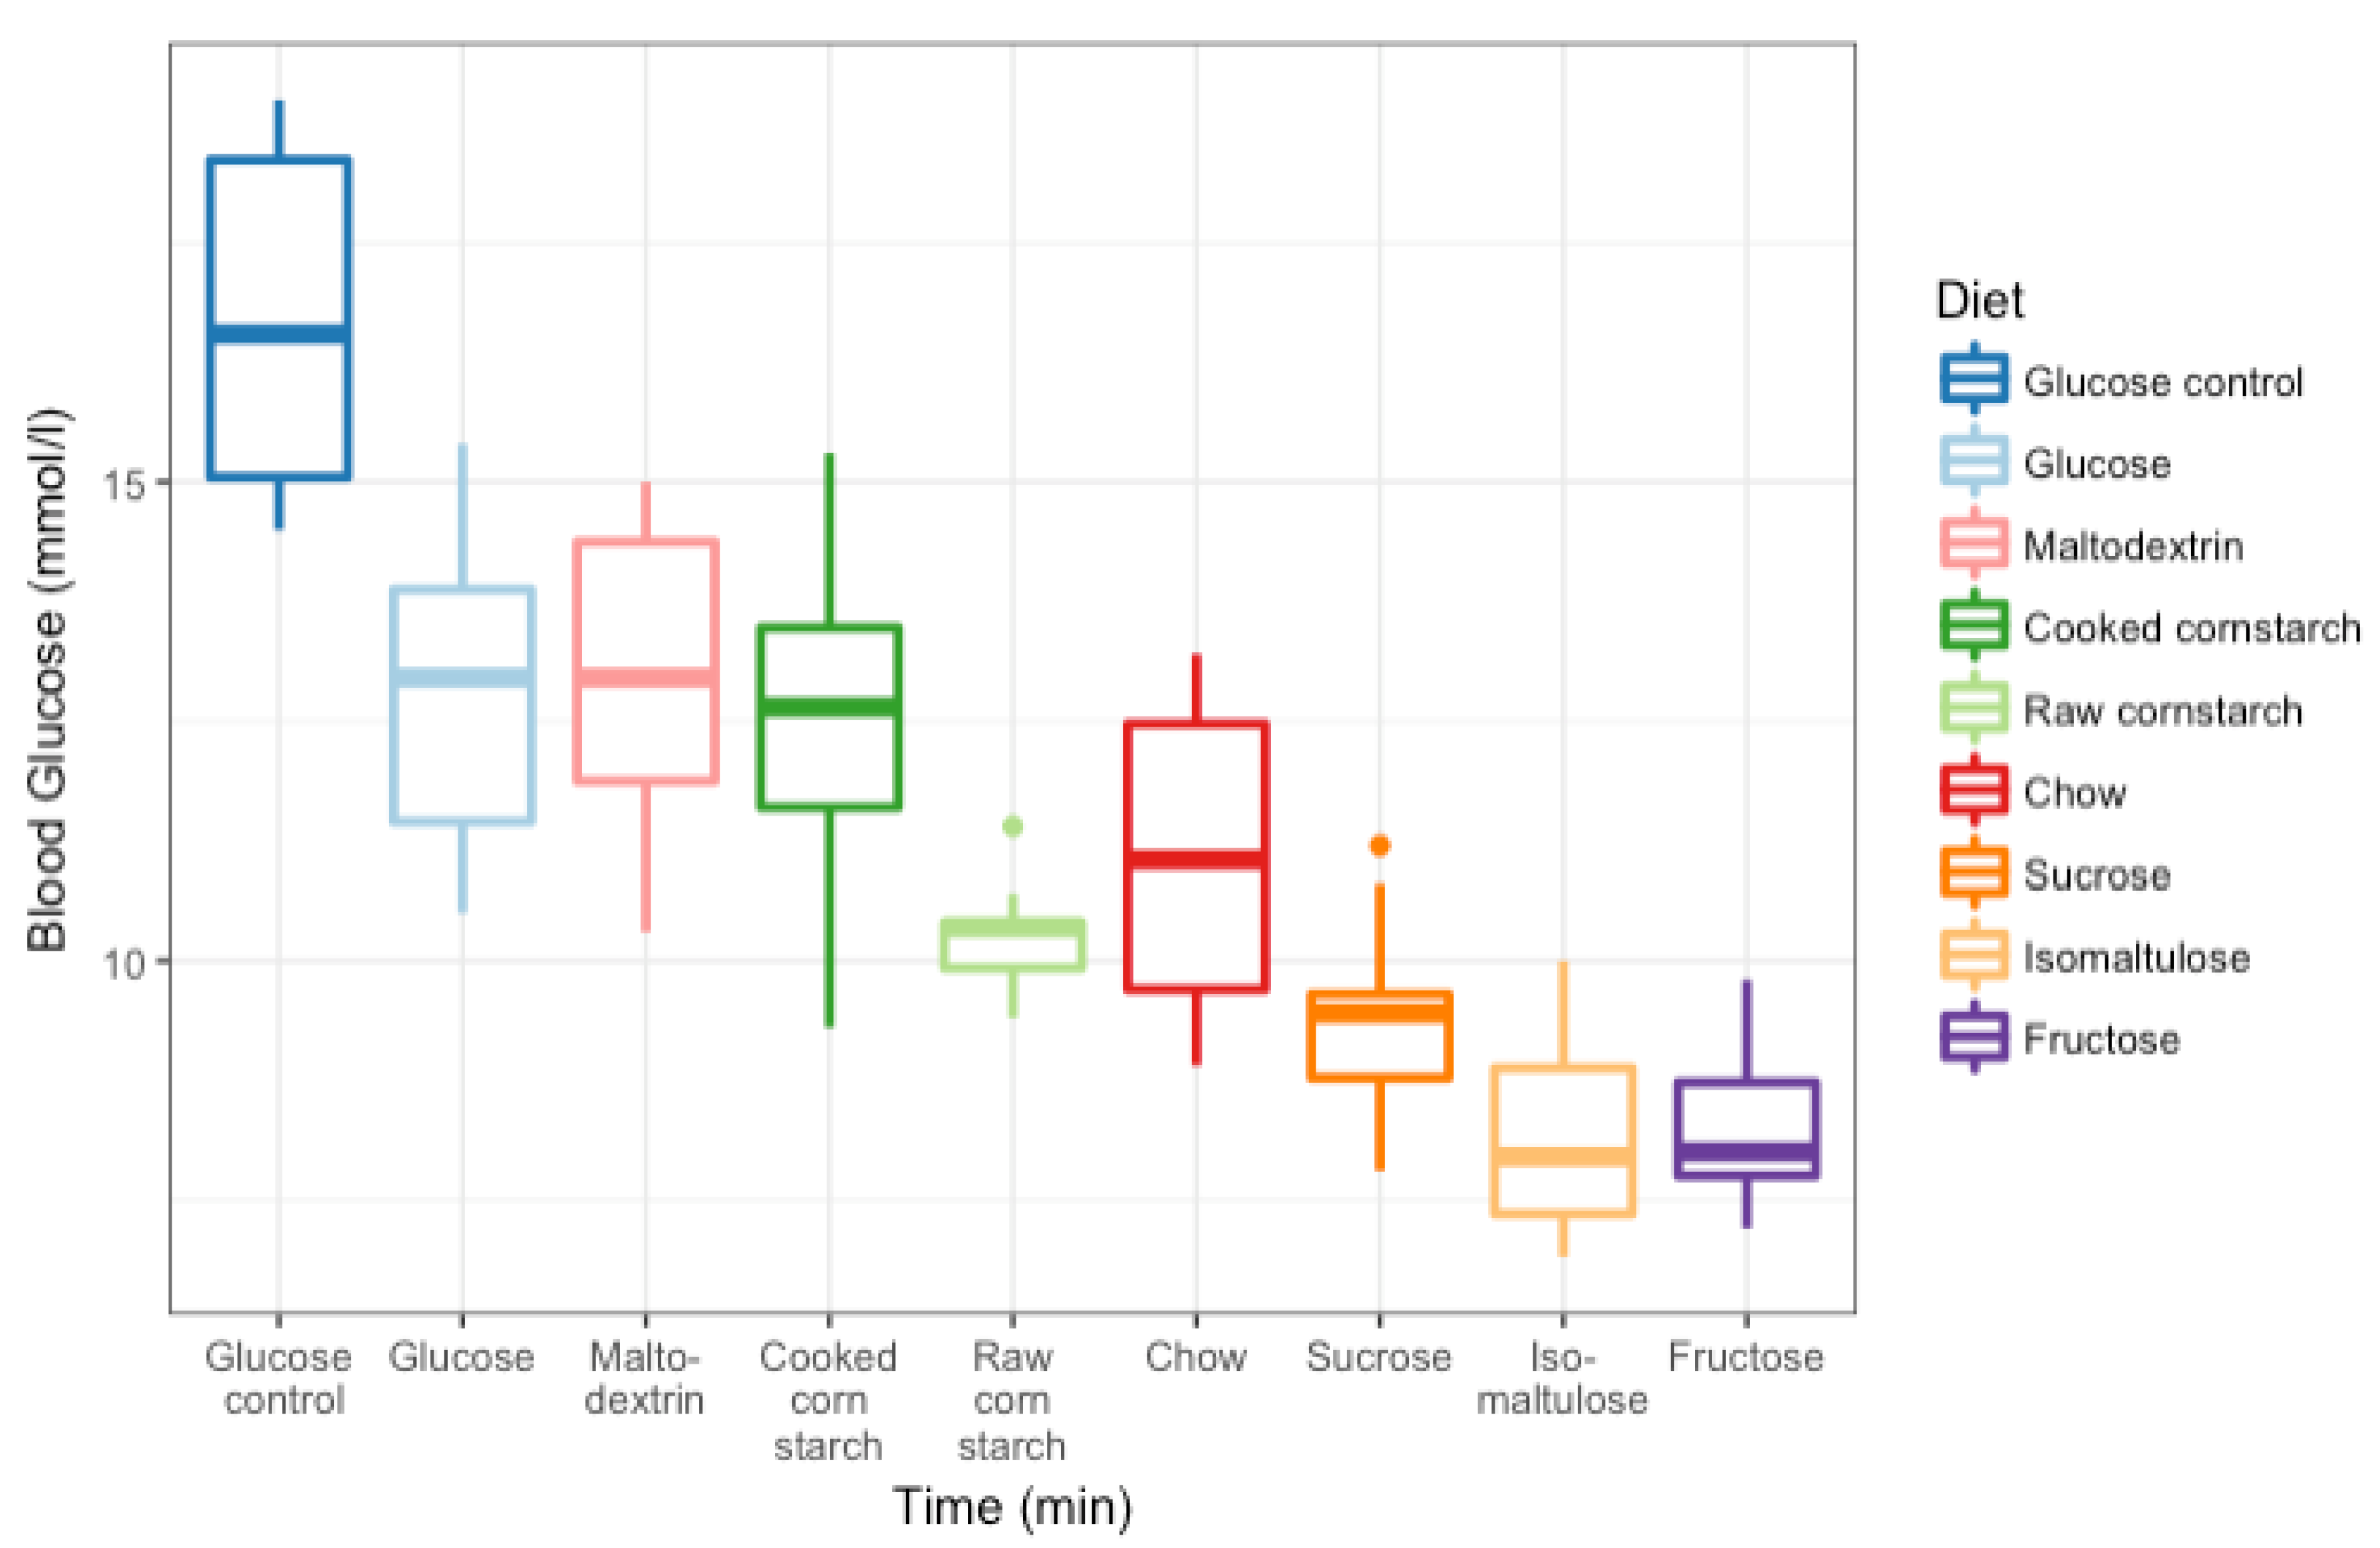
3.3. GI Tests
4. Discussion
5. Conclusions
Author Contributions
Funding
Acknowledgments
Conflicts of Interest
Abbreviations
| AIN | American Institute of Nutrition |
| CC | cooked cornstarch |
| GI | glycaemic index |
| iAUC | incremental area under the curve |
| RC | raw cornstarch |
References
- James, W.P. Who recognition of the global obesity epidemic. Int. J. Obes. 2008, 32, S120–S126. [Google Scholar] [CrossRef] [PubMed]
- World Health Organization. Overweight and Obesity; WHO Press: Global Health Observatory, Geneva, Switzerland, 2013. [Google Scholar]
- Carden, T.J.; Carr, T.P. Food availability of glucose and fat, but not fructose, increased in the U.S. between 1970 and 2009: Analysis of the usda food availability data system. Nutr. J. 2013, 12, 130. [Google Scholar] [CrossRef] [PubMed]
- Jenkins, D.J.A.; Kendall, C.W.C.; Augustin, L.S.A.; Franceschi, S.; Hamidi, M.; Marchie, A.; Jenkins, A.L.; Axelsen, M. Glycemic index: Overview of implications in health and disease. Am. J. Clin. Nutr. 2002, 76, S266–S273. [Google Scholar] [CrossRef]
- Jenkins, D.J.A.; Wolever, T.M.S.; Taylor, R.H. Glycemic index of foods: A physiological basis for carbohydrate exchange. Am. J. Clin. Nutr. 1981, 34, 362–366. [Google Scholar] [CrossRef] [PubMed]
- Blaak, E.E.; Antoine, J.M.; Benton, D.; Bjorck, I.; Bozzetto, L.; Brouns, F.; Diamant, M.; Dye, L.; Hulshof, T.; Holst, J.J.; et al. Impact of postprandial glycaemia on health and prevention of disease. Obes. Rev. Off. J. Int. Assoc. Study Obes. 2012, 13, 923–984. [Google Scholar] [CrossRef] [PubMed]
- Brand-Miller, J.; Hayne, S.; Petocz, P.; Colagiuri, S. Low-glycemic index diets in the management of diabetes: A meta-analysis of randomized controlled trials. Diabetes Care 2003, 26, 2261–2267. [Google Scholar] [CrossRef] [PubMed]
- Wolever, T.M.S.; Jenkins, D.J.A.; Vuksan, V.; Jenkins, A.L.; Buckley, G.C.; Wong, G.S.; Josse, R.G. Beneficial effect of a low glycaemic index diet in type 2 diabetes. Diabet. Med. 1992, 9, 451–458. [Google Scholar] [CrossRef] [PubMed]
- Ojo, O.; Ojo, O.O.; Adebowale, F.; Wang, X.H. The effect of dietary glycaemic index on glycaemia in patients with type 2 diabetes: A systematic review and meta-analysis of randomized controlled trials. Nutrients 2018, 10, E373. [Google Scholar] [CrossRef] [PubMed]
- Schwingshackl, L.; Chaimani, A.; Hoffmann, G.; Schwedhelm, C.; Boeing, H. A network meta-analysis on the comparative efficacy of different dietary approaches on glycaemic control in patients with type 2 diabetes mellitus. Eur. J. Epidemiol. 2018, 33, 157–170. [Google Scholar] [CrossRef] [PubMed]
- Archundia Herrera, M.C.; Subhan, F.B.; Chan, C.B. Dietary patterns and cardiovascular disease risk in people with type 2 diabetes. Curr. Obes. Rep. 2017, 6, 405–413. [Google Scholar] [CrossRef] [PubMed]
- Mackowiak, K.; Torlinska-Walkowiak, N.; Torlinska, B. Dietary fibre as an important constituent of the diet. Postep. Hig. Med. Doswiadczalnej Online 2016, 70, 104–109. [Google Scholar] [CrossRef] [PubMed]
- Marriott, B.P.; Cole, N.; Lee, E. National estimates of dietary fructose intake increased from 1977 to 2004 in the united states. J. Nutr. 2009, 139, 1228S–1235S. [Google Scholar] [CrossRef] [PubMed]
- Hannou, S.A.; Haslam, D.E.; McKeown, N.M.; Herman, M.A. Fructose metabolism and metabolic disease. J. Clin. Investig. 2018, 128, 545–555. [Google Scholar] [CrossRef] [PubMed]
- Campbell, G.J.; Senior, A.M.; Bell-Anderson, K.S. Metabolic effects of high glycaemic index diets: A systematic review and meta-analysis of feeding studies in mice and rats. Nutrients 2017, 9, E646. [Google Scholar] [CrossRef] [PubMed]
- Suga, A.; Hirano, T.; Kageyama, H.; Osaka, T.; Namba, Y.; Tsuji, M.; Miura, M.; Adachi, M.; Inoue, S. Effects of fructose and glucose on plasma leptin, insulin, and insulin resistance in lean and vmh-lesioned obese rats. Am. J. Physiol. Endocrinol. Metab. 2000, 278, E677–E683. [Google Scholar] [CrossRef] [PubMed]
- Wolever, T.M.; Jenkins, D.J.; Jenkins, A.L.; Josse, R.G. The glycemic index: Methodology and clinical implications. Am. J. Clin. Nutr. 1991, 54, 846–854. [Google Scholar] [CrossRef] [PubMed]
- The Glycemic Index Foundation. Gi and Sugar. Available online: https://www.gisymbol.com/gi-sugar/ (accessed on 12 April 2018).
- Stevenson, E.J.; Watson, A.; Theis, S.; Holz, A.; Harper, L.D.; Russell, M. A comparison of isomaltulose versus maltodextrin ingestion during soccer-specific exercise. Eur. J. Appl. Physiol. 2017, 117, 2321–2333. [Google Scholar] [CrossRef] [PubMed]
- Reeves, P.G.; Nielsen, F.H.; Fahey, G.C., Jr. Ain-93 purified diets for laboratory rodents: Final report of the american institute of nutrition ad hoc writing committee on the reformulation of the ain-76a rodent diet. J. Nutr. 1993, 123, 1939–1951. [Google Scholar] [CrossRef] [PubMed]
- Wolever, T.M.S. Effect of blood sampling schedule and method of calculating the area under the curve on validity and precision of glycaemic index values. Br. J. Nutr. 2004, 91, 295–300. [Google Scholar] [CrossRef] [PubMed]
- R Core Team. R: A Language and Environment for Statistical Computing; R Foundation for Statistical Computing: Vienna, Austria, 2016. [Google Scholar]
- Wickham, H. Ggplot2: Elegant Graphics for Data Analysis; Springer: New York, NY, USA, 2009. [Google Scholar]
- Wickham, H.; Francois, R.; Henry, L.; Müller, K. Dplyr: A Grammar of Data Manipulation; R Foundation for Statistical Computing: Vienna, Austria, 2017. [Google Scholar]
- Crapo, P.A.; Reaven, G.; Olefsky, J. Plasma glucose and insulin responses to orally administered simple and complex carbohydrates. Diabetes 1976, 25, 741–747. [Google Scholar] [CrossRef] [PubMed]
- Lee, B.M.; Wolever, T.M. Effect of glucose, sucrose and fructose on plasma glucose and insulin responses in normal humans: Comparison with white bread. Eur. J. Clin. Nutr. 1998, 52, 924–928. [Google Scholar] [CrossRef] [PubMed]
- O’Donnell, K.; Kearsley, M.W. Sweeteners and Sugar Alternatives in Food Technology, 2nd ed.; John Wiley & Sons, Ltd.: West Sussex, UK, 2012. [Google Scholar]
- Salmeron, J.; Manson, J.E.; Stampfer, M.J.; Colditz, G.A.; Wing, A.L.; Willett, W.C. Dietary fiber, glycemic load, and risk of non-insulin-dependent diabetes mellitus in women. JAMA 1997, 277, 472–477. [Google Scholar] [CrossRef] [PubMed]
- Cui, H.; Yang, Y.; Bian, L.; He, M. Effect of food composition of mixed food on glycemic index. Wei Sheng Yan Jiu 1999, 28, 356–358. [Google Scholar] [PubMed]
- Fardet, A.; Leenhardt, F.; Lioger, D.; Scalbert, A.; Remesy, C. Parameters controlling the glycaemic response to breads. Nutr. Res. Rev. 2006, 19, 18–25. [Google Scholar] [CrossRef] [PubMed]
- Collings, P.; Williams, C.; MacDonald, I. Effects of cooking on serum glucose and insulin responses to starch. Br. Med. J. Clin. Res. Ed. 1981, 282, 1032. [Google Scholar] [CrossRef] [PubMed]
- Ratnayake, W.S.; Jackson, D.S. Gelatinization and solubility of corn starch during heating in excess water: New insights. J. Agric. Food Chem. 2006, 54, 3712–3716. [Google Scholar] [CrossRef] [PubMed]
- Lina, B.A.; Jonker, D.; Kozianowski, G. Isomaltulose (palatinose): A review of biological and toxicological studies. Food Chem. Toxicol. 2002, 40, 1375–1381. [Google Scholar] [CrossRef]
- Belobrajdic, D.P.; Wei, J.; Bird, A.R. A rat model for determining the postprandial response to foods. J. Sci. Food Agric. 2017, 97, 1529–1532. [Google Scholar] [CrossRef] [PubMed]
- Hedrington, M.S.; Davis, S.N. Sexual dimorphism in glucose and lipid metabolism during fasting, hypoglycemia, and exercise. Front. Endocrinol. 2015, 6, 61. [Google Scholar] [CrossRef] [PubMed]
- Ter Horst, K.W.; Gilijamse, P.W.; de Weijer, B.A.; Kilicarslan, M.; Ackermans, M.T.; Nederveen, A.J.; Nieuwdorp, M.; Romijn, J.A.; Serlie, M.J. Sexual dimorphism in hepatic, adipose tissue, and peripheral tissue insulin sensitivity in obese humans. Front. Endocrinol. 2015, 6, 182. [Google Scholar] [CrossRef] [PubMed]


| INGREDIENTS (G/KG) | RC | CC | MALTODEXTRIN | GLUCOSE | SUCROSE | ISOMALTULOSE | FRUCTOSE |
|---|---|---|---|---|---|---|---|
| CORNSTARCH | 600 | 600 | - | - | - | - | - |
| MALTODEXTRIN | - | - | 600 | 120 | 120 | 120 | 120 |
| GLUCOSE | - | - | - | 480 | - | - | - |
| SUCROSE | - | - | - | - | 480 | - | - |
| ISOMALTULOSE | - | - | - | - | - | 480 | - |
| FRUCTOSE | - | - | - | - | - | - | 480 |
| CALCIUM CASEINATE | 200 | 200 | 200 | 200 | 200 | 200 | 200 |
| SAFFLOWER OIL | 70 | 70 | 70 | 70 | 70 | 70 | 70 |
| WHEAT BRAN | 50 | 50 | 50 | 50 | 50 | 50 | 50 |
| AIN-93M MINERAL MIX | 45 | 45 | 45 | 45 | 45 | 45 | 45 |
| GELATINE | 15 | 15 | 15 | 15 | 15 | 15 | 15 |
| AIN-93 VITAMIN MIX | 13 | 13 | 13 | 13 | 13 | 13 | 13 |
| CHOLINE BITARTRATE | 4 | 4 | 4 | 4 | 4 | 4 | 4 |
| DL-METHIONINE | 3 | 3 | 3 | 3 | 3 | 3 | 3 |
| CARBOHYDRATE (%) A | 55 | 55 | 59.2 | 62.1 | 62.1 | 59.5 | 62.1 |
| WATER: DIET (G) | 7:10 | 9:5 | 3:20 | 1:5 | 3:20 | 1:5 | 1:10 |
© 2018 by the authors. Licensee MDPI, Basel, Switzerland. This article is an open access article distributed under the terms and conditions of the Creative Commons Attribution (CC BY) license (http://creativecommons.org/licenses/by/4.0/).
Share and Cite
Campbell, G.J.; Belobrajdic, D.P.; Bell-Anderson, K.S. Determining the Glycaemic Index of Standard and High-Sugar Rodent Diets in C57BL/6 Mice. Nutrients 2018, 10, 856. https://doi.org/10.3390/nu10070856
Campbell GJ, Belobrajdic DP, Bell-Anderson KS. Determining the Glycaemic Index of Standard and High-Sugar Rodent Diets in C57BL/6 Mice. Nutrients. 2018; 10(7):856. https://doi.org/10.3390/nu10070856
Chicago/Turabian StyleCampbell, Grace J., Damien P. Belobrajdic, and Kim S. Bell-Anderson. 2018. "Determining the Glycaemic Index of Standard and High-Sugar Rodent Diets in C57BL/6 Mice" Nutrients 10, no. 7: 856. https://doi.org/10.3390/nu10070856
APA StyleCampbell, G. J., Belobrajdic, D. P., & Bell-Anderson, K. S. (2018). Determining the Glycaemic Index of Standard and High-Sugar Rodent Diets in C57BL/6 Mice. Nutrients, 10(7), 856. https://doi.org/10.3390/nu10070856