Efficacy of a Moderately Low Carbohydrate Diet in a 36-Month Observational Study of Japanese Patients with Type 2 Diabetes

 ,
, 
Abstract
:1. Introduction
2. Materials and Methods
3. Results
4. Discussion
Acknowledgments
Author Contributions
Conflicts of Interest
References
- Evert, A.B.; Boucher, J.L.; Cypress, M.; Dunbar, S.A.; Franz, M.J.; Mayer-Davis, E.J.; Neumiller, J.J.; Nwankwo, R.; Verdi, C.L.; Urbanski, P.; et al. Nutrition therapy recommendations for the management of adults with diabetes. Diabetes Care 2013, 36, 3821–3842. [Google Scholar] [CrossRef] [PubMed]
- Ley, S.H.; Hamdy, O.; Mohan, V.; Hu, F.B. Prevention and management of type 2 diabetes: Dietary components and nutritional strategies. Lancet 2014, 383, 1999–2007. [Google Scholar] [CrossRef]
- Tajima, N.; Noda, M.; Origasa, H.; Noto, H.; Yabe, D.; Fujita, Y.; Goto, A.; Fujimoto, K.; Sakamoto, M.; Haneda, M. Evidence-based practice guideline for the treatment for diabetes in Japan 2013. Diabetol. Int. 2015, 6, 151–187. [Google Scholar] [CrossRef]
- Yamada, Y.; Uchida, J.; Izumi, H.; Tsukamoto, Y.; Inoue, G.; Watanabe, Y.; Irie, J.; Yamada, S. A non-calorie-restricted low-carbohydrate diet is effective as an alternative therapy for patients with type 2 diabetes. Intern. Med. 2014, 53, 13–19. [Google Scholar] [CrossRef] [PubMed]
- Banasik, J.L.; Walker, M.K.; Randall, J.M.; Netjes, R.B.; Foutz, M.S. Low-calorie diet induced weight loss may alter regulatory hormones and contribute to rebound visceral adiposity in obese persons with a family history of type-2 diabetes. J. Am. Assoc. Nurse Pract. 2013, 25, 440–448. [Google Scholar] [CrossRef] [PubMed]
- American Diabetes Association. Lifestyle management: Standards of medical care in diabetes-2018. Diabetes Care 2018, 41, S38–S50. [Google Scholar] [CrossRef]
- Looker, H.C.; Knowler, W.C.; Hanson, R.L. Changes in BMI and weight before and after the development of type 2 diabetes. Diabetes Care 2001, 24, 1917–1922. [Google Scholar] [CrossRef] [PubMed]
- De Fine Olivarius, N.; Richelsen, B.; Siersma, V.; Andreasen, A.H.; Beck-Nielsen, H. Weight history of patients with newly diagnosed Type 2 diabetes. Diabet. Med. 2008, 25, 933–941. [Google Scholar] [CrossRef] [PubMed]
- Heianza, Y.; Arase, Y.; Kodama, S.; Tsuji, H.; Saito, K.; Hara, S.; Sone, H. Trajectory of body mass index before the development of type 2 diabetes in Japanese men: Toranomon Hospital Health Management Center Study 15. J. Diabetes Investig. 2015, 6, 289–294. [Google Scholar] [CrossRef] [PubMed]
- Villareal, D.T.; Fontana, L.; Das, S.K.; Redman, L.; Smith, S.R.; Saltzman, E.; Bales, C.; Rochon, J.; Pieper, C.; Huang, M.; et al. Effect of two-year caloric restriction on bone metabolism and bone mineral density in non-obese younger adults: A randomized clinical trial. J. Bone Miner. Res. 2016, 31, 40–51. [Google Scholar] [CrossRef] [PubMed]
- Das, S.K.; Roberts, S.B.; Bhapkar, M.V.; Villareal, D.T.; Fontana, L.; Martin, C.K.; Racette, S.B.; Fuss, P.J.; Kraus, W.E.; Wong, W.W.; et al. Body-composition changes in the Comprehensive Assessment of Long-term Effects of Reducing Intake of Energy (CALERIE)-2 study: A 2-y randomized controlled trial of calorie restriction in nonobese humans. Am. J. Clin. Nutr. 2017, 105, 913–927. [Google Scholar] [CrossRef] [PubMed]
- American Diabetes Association; Bantle, J.P.; Wylie-Rosett, J.; Albright, A.L.; Apovian, C.M.; Clark, N.G.; Franz, M.J.; Hoogwerf, B.J.; Lichtenstein, A.H.; Mayer-Davis, E.; et al. Nutrition recommendations and interventions for diabetes: A position statement of the American Diabetes Association. Diabetes Care 2008, 31, S61–S78. [Google Scholar] [CrossRef] [PubMed]
- Araki, S.; Haneda, M.; Koya, D.; Isshiki, K.; Kume, S.; Sugimoto, T.; Kawai, H.; Nishio, Y.; Kashiwagi, A.; Uzu, T. Association between urinary type IV collagen level and deterioration of renal function in type 2 diabetic patients without overt proteinuria. Diabetes Care 2010, 33, 1805–1810. [Google Scholar] [CrossRef] [PubMed]
- Araki, S.; Haneda, M.; Koya, D.; Sugaya, T.; Isshiki, K.; Kume, S.; Kashiwagi, A.; Uzu, T.; Maegawa, H. Predictive effects of urinary liver-type fatty acid-binding protein for deteriorating renal function and incidence of cardiovascular disease in type 2 diabetic patients without advanced nephropathy. Diabetes Care 2013, 36, 1248–1253. [Google Scholar] [CrossRef] [PubMed]
- Feinman, R.D.; Pogozelski, W.K.; Astrup, A.; Bernstein, R.K.; Fine, E.J.; Westman, E.C.; Accurso, A.; Frassetto, L.; Gower, B.A.; McFarlane, S.I.; et al. Dietary carbohydrate restriction as the first approach in diabetes management. Nutrition 2015, 31, 1–13. [Google Scholar] [CrossRef] [PubMed]
- Clifton, P.M.; Condo, D.; Keogh, J.B. Long term weight maintenance after advice to consume low carbohydrate, higher protein diets. Nutr. Metab. Cardiovasc. Dis. 2014, 24, 224–235. [Google Scholar] [CrossRef] [PubMed]


| All Participants | Retained | Lost to Follow-Up | |
|---|---|---|---|
| n | 200 | 157 | 43 |
| Female/Male | 71/129 | 51/106 | 20/23 |
| Age | 59.7 ± 12.9 | 59.5 ± 12.4 | 60.5 ± 13.9 |
| BMI (kg/m2) | 26.4 ± 4.9 | 26.6 ± 4.7 | 25.4 ± 5.1 |
| FPG (mg/dL) | 151 ± 57 | 153 ± 58 | 145 ± 50 |
| HbA1c (%) | 8.0 ± 1.5 | 8.0 ± 1.5 | 8.0 ± 1.5 |
| TG (mg/dL) | 147 ± 120 | 147 ± 121 | 144 ± 106 |
| LDL-C (mg/dL) | 116 ± 33 | 116 ± 33 | 121 ± 45 |
| HDL-C (mg/dL) | 60 ± 17 | 59 ± 16 | 62 ± 21 |
| BP (mmHg) | 128 ± 15/76 ± 12 | 128 ± 15/77 ± 12 | 127 ± 16/72 ± 12 |
| Pre-Intervention | 12 Months | 24 Months | 36 Months | p Value | ||
|---|---|---|---|---|---|---|
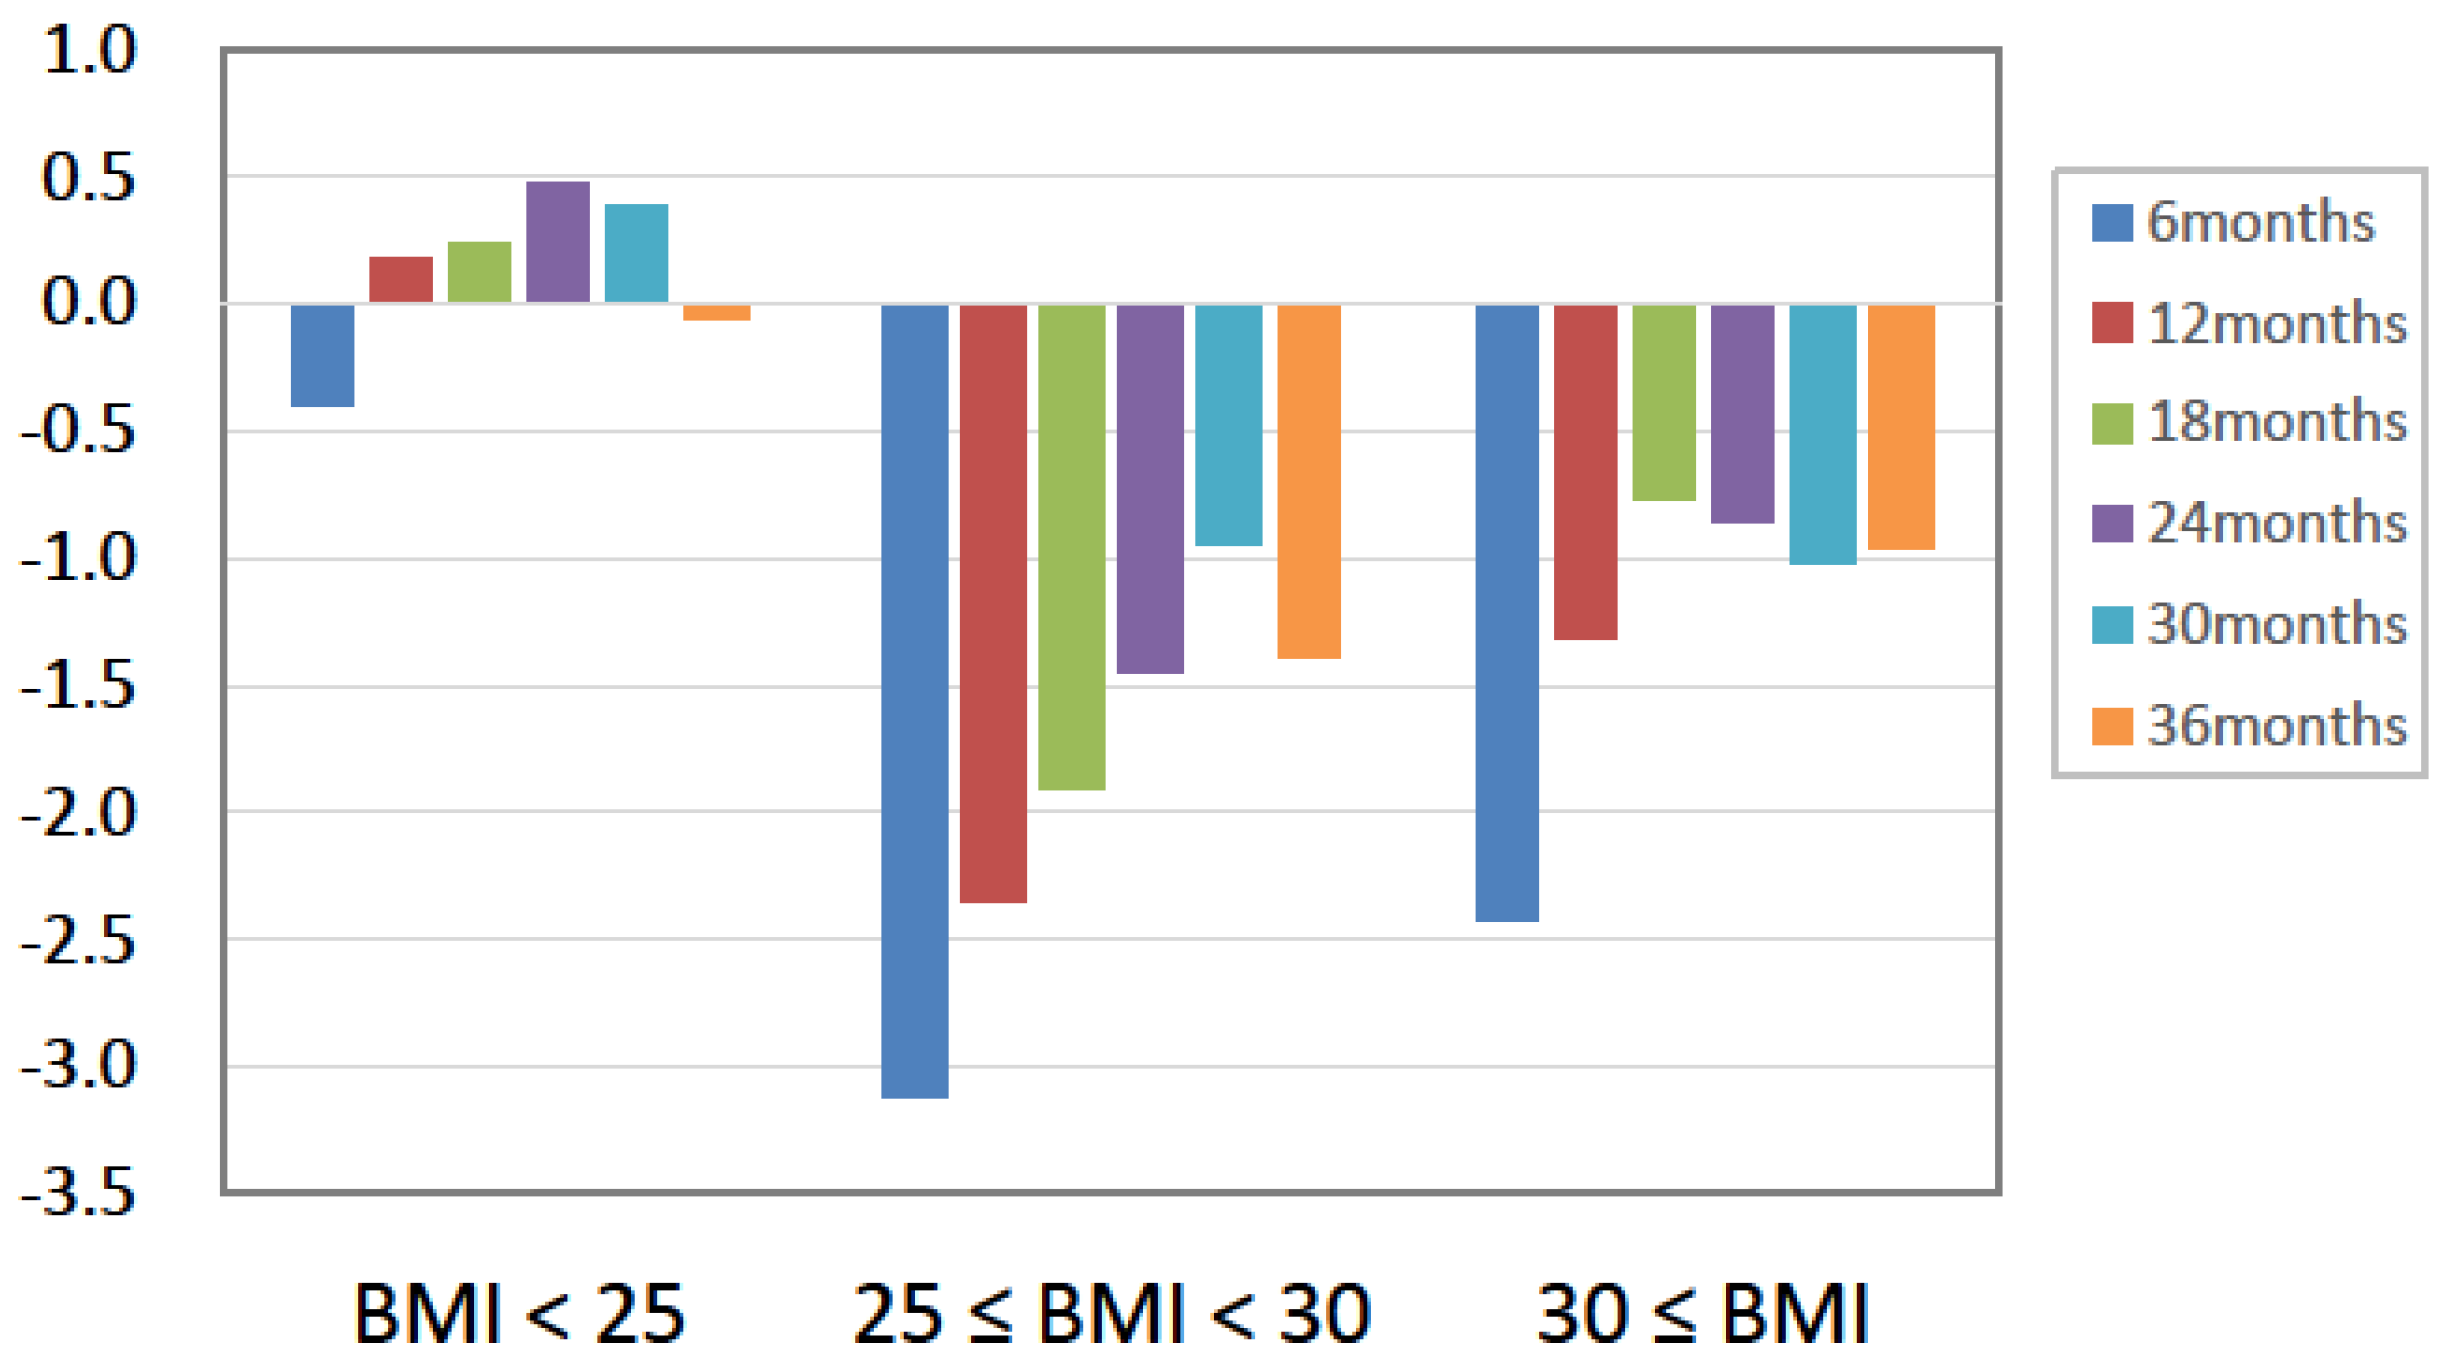
| Body weight (kg) | 72.5 ± 15.2 | 71.6 ± 14.9 | 72.0 ± 15.0 | 71.9 ± 15.1 | n.s. | |
| FBS (mg) | 153.1 ± 58.0 | 143.3 ± 47.2 | 144.4 ± 48.6 | 140.6 ± 43.5 | n.s. | |
| SBP (mmHg) | 127.7 ± 15.4 | 125.8 ± 13.3 | 127.1 ± 13.1 | 125.0 ± 13.1 | n.s. | |
| DBP (mmHg) | 76.8 ± 11.8 | 74.8 ± 10.9 | 75.4 ± 9.5 | 74.5 ± 10.6 | 0.029 | |
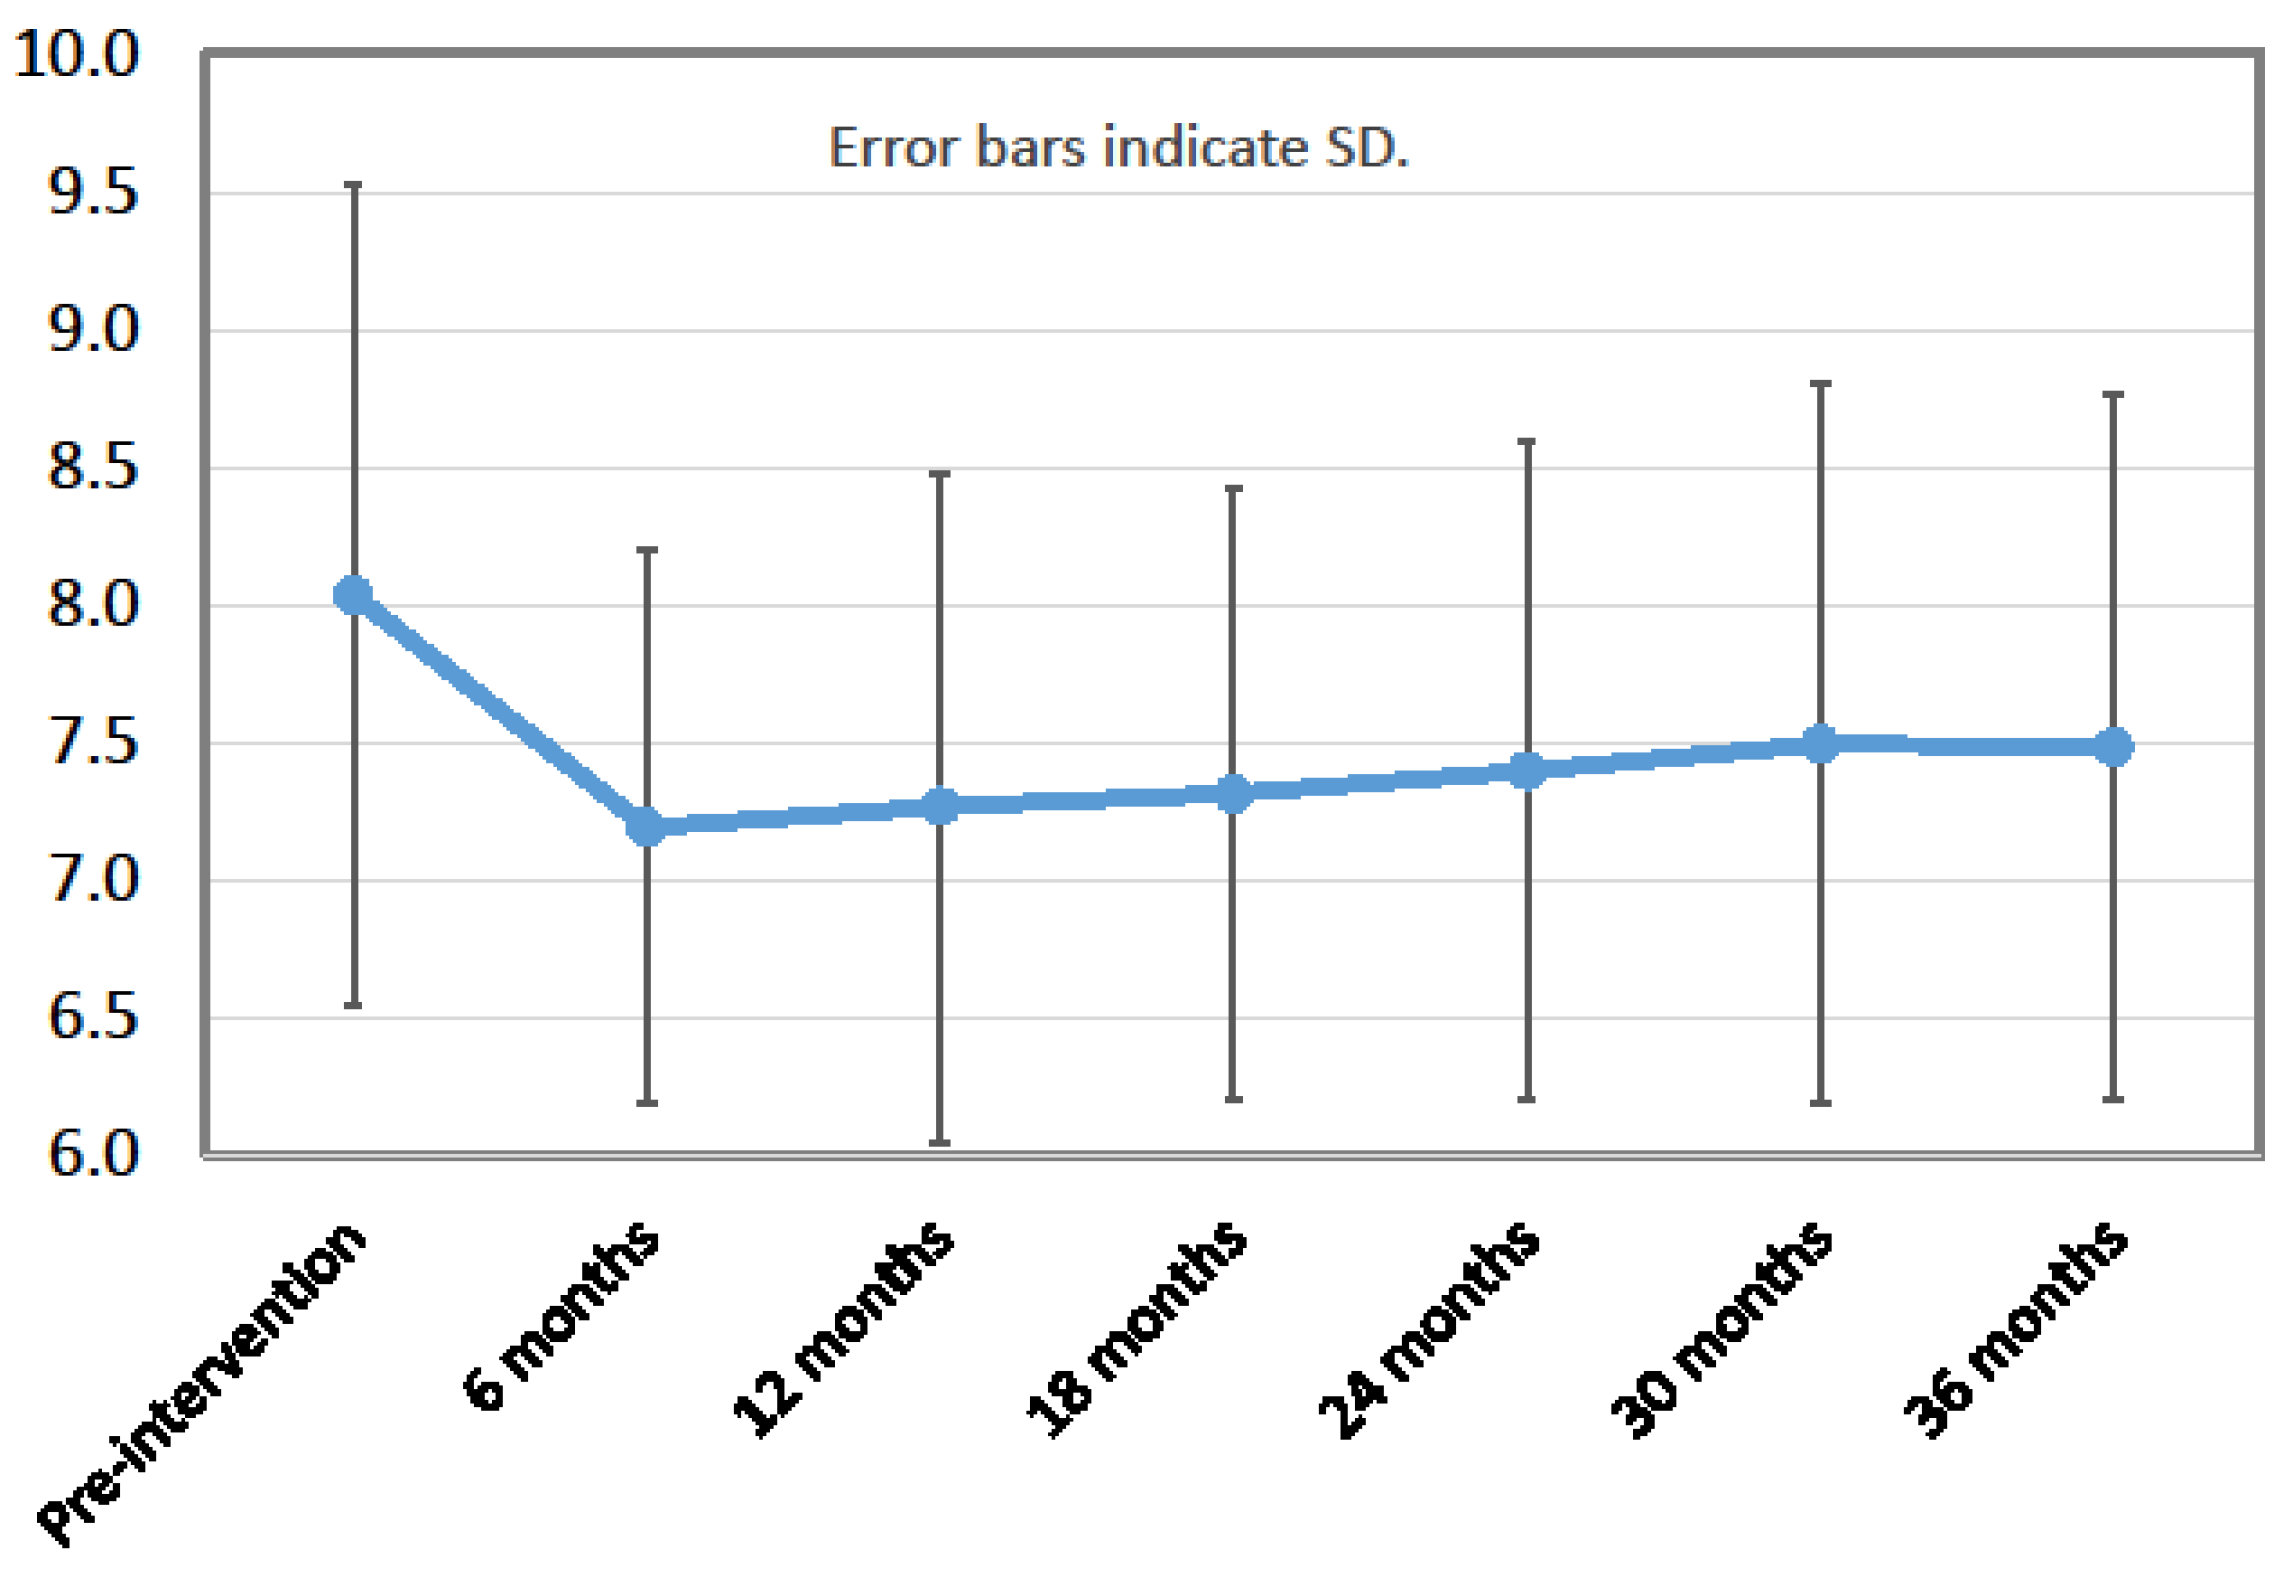
| HbA1c (%) | 8.0 ± 1.5 | 7.3 ± 1.2 | 7.4 ± 1.2 | 7.5 ± 1.3 | <0.0001 | |
| TC (mg/dL) | 200.7 ± 44.1 | 194.0 ± 39.0 | 192.8 ± 32.9 | 189.9 ± 33.3 | 0.003 | |
| LDL-C (mg/dL) | 116.1 ± 33.0 | 107.2 ± 28.2 | 108.1 ± 26.7 | 106.7 ± 26.9 | <0.0001 | |
| HDL-C (mg/dL) | 59.0 ± 15.9 | 61.7 ± 16.7 | 61.2 ± 16.9 | 59.8 ± 18.3 | n.s. | |
| TG (mg/dL) | 146.6 ± 120.7 | 142.7 ± 137.4 | 141.2 ± 102.9 | 152.5 ± 122.2 | n.s. | |
| LOCF TC (mg/dL) | 200.8 ± 44.1 | 196.2 ± 40.3 | 196.2 ± 35.9 | 189.9 ± 33.3 | 0.0007 | |
| LOCF LDL-C (mg/dL) | 116.1 ± 33.0 | 109.0 ± 29.7 | 110.6 ± 29.7 | 106.7 ± 26.9 | n.s. | |
| LOCF HDL-C (mg/dL) | 59.1 ± 15.9 | 61.4 ± 16.4 | 61.3 ± 16.7 | 59.8 ± 18.3 | n.s. | |
| LOCF TG (mg/dL) | 146.5 ± 120.7 | 147.7 ± 139.6 | 144.7 ± 113.6 | 152.5 ± 122.2 | 0.02 | |
| AST (IU/L) | 26.6 ± 13.3 | 24.2 ± 10.8 | 25.1 ± 11.7 | 26.4 ± 13.6 | n.s. | |
| ALT (IU/L) | 29.9 ± 23.6 | 23.4 ± 15.3 | 25.1 ± 18.5 | 26.2 ± 18.4 | 0.009 | |
| Cr (mg/dL) | 0.8 ± 0.2 | 0.8 ± 0.2 | 0.8 ± 0.2 | 0.8 ± 0.2 | 0.046 | |
| eGFR (mL/(min·1.73 m2)) | 74.4 ± 18.8 | 73.6 ± 19.2 | 73.1 ± 19.0 | 72.1 ± 20.8 | 0.007 | |
| UA (mg/dL) | 5.8 ± 1.4 | 5.9 ± 1.4 | 5.9 ± 1.4 | 6.0 ± 1.7 | n.s. | |
| UN (mg/dL) | 15.8 ± 5.0 | 17.5 ± 6.2 | 16.8 ± 5.0 | 17.0 ± 5.5 | 0.002 | |
| ACR (mg/g Cr) | 196.6 ± 828.0 | 123.6 ± 517.1 | 166.4 ± 515.1 | 123.3 ± 287.4 | n.s. | |
| Urinary protein | (−)* | 91 (58%) | 102 (65%) | 92 (59%) | 99 (63%) | n.s. † |
| (+/−)* | 38 (24%) | 38 (24%) | 40 (25%) | 31 (20%) | ||
| (1+) * | 20 (13%) | 14 (9%) | 17 (11%) | 23 (15%) | ||
| (2+) * | 8 (5%) | 3 (2%) | 8 (5%) | 4 (2%) | ||
| 2-Month Pre-Intervention Period | 1 to 2 Months | 3 to 4 Months | 5 to 6 Months | 7 to 8 Months | 9 to 10 Months | 11 to 12 Months |
|---|---|---|---|---|---|---|
| 31/2121 (1.46%) | 73/3010 (2.43%) | 60/2887 (2.08%) | 39/2387 (1.63%) | 49/2709 (1.81%) | 53/2367 (2.24%) | 17/2098 (0.81%) |
| 13 to 14 months | 15 to 16 months | 17 to 18 months | 19 to 20 months | 21 to 22 months | 23 to 24 months | |
| 44/2698 (1.63%) | 26/2634 (0.99%) | 26/2544 (1.02%) | 12/2347 (0.51%) | 30/2430 (1.23%) | 20/2562 (0.78%) | |
| 25 to 26 months | 27 to 28 months | 29 to 30 months | 31 to 32 months | 33 to 34 months | 35 to 36 months | |
| 19/2361 (0.80%) | 26/2657 (0.98%) | 23/2609 (0.88%) | 33/2711 (1.22%) | 44/2748 (1.60%) | 31/3066 (1.01%) |
| Characteristic | All (n = 157) | Responders (n = 109) | Non-Responders | |
|---|---|---|---|---|
| Worsened (n = 41) | Unchanged (n = 7) | |||
| Age (years) | 59.5 | 57.7 | 63.8 | 62.6 |
| BMI (kg/m2) | 26.6 | 26.9 | 26.2 | 25.3 |
| FPG (mg/dL) | 153 | 159 | 144 | 116 |
| HbA1c (%) | 8.0 | 8.3 | 7.4 | 7.0 |
| TG (mg/dL) | 147 | 159 | 119 | 112 |
| LDL-C (mg/dL) | 116 | 118 | 112 | 115 |
| HDL-C (mg/dL) | 59.0 | 56.9 | 61.8 | 76.6 |
| BP (mmHg) | 128/77 | 128/78 | 128/74 | 122/72 |
| Dietary education sessions | 2.2 | 2.3 | 2.2 | 2.1 |
| Disease duration (years) | 10.0 | 9.7 | 10.6 | 11.3 |
© 2018 by the authors. Licensee MDPI, Basel, Switzerland. This article is an open access article distributed under the terms and conditions of the Creative Commons Attribution (CC BY) license (http://creativecommons.org/licenses/by/4.0/).
Share and Cite
Sanada, M.; Kabe, C.; Hata, H.; Uchida, J.; Inoue, G.; Tsukamoto, Y.; Yamada, Y.; Irie, J.; Tabata, S.; Tabata, M.; et al. Efficacy of a Moderately Low Carbohydrate Diet in a 36-Month Observational Study of Japanese Patients with Type 2 Diabetes. Nutrients 2018, 10, 528. https://doi.org/10.3390/nu10050528
Sanada M, Kabe C, Hata H, Uchida J, Inoue G, Tsukamoto Y, Yamada Y, Irie J, Tabata S, Tabata M, et al. Efficacy of a Moderately Low Carbohydrate Diet in a 36-Month Observational Study of Japanese Patients with Type 2 Diabetes. Nutrients. 2018; 10(5):528. https://doi.org/10.3390/nu10050528
Chicago/Turabian StyleSanada, Mariko, Chinatsu Kabe, Hisa Hata, Junichi Uchida, Gaku Inoue, Yoko Tsukamoto, Yoshifumi Yamada, Junichiro Irie, Shogo Tabata, Mitsuhisa Tabata, and et al. 2018. "Efficacy of a Moderately Low Carbohydrate Diet in a 36-Month Observational Study of Japanese Patients with Type 2 Diabetes" Nutrients 10, no. 5: 528. https://doi.org/10.3390/nu10050528
APA StyleSanada, M., Kabe, C., Hata, H., Uchida, J., Inoue, G., Tsukamoto, Y., Yamada, Y., Irie, J., Tabata, S., Tabata, M., & Yamada, S. (2018). Efficacy of a Moderately Low Carbohydrate Diet in a 36-Month Observational Study of Japanese Patients with Type 2 Diabetes. Nutrients, 10(5), 528. https://doi.org/10.3390/nu10050528