Dietary Inflammatory Index and Type 2 Diabetes Mellitus in Adults: The Diabetes Mellitus Survey of Mexico City

 , , and
Abstract
1. Introduction
2. Materials and Methods
2.1. Study Design
2.2. Dietary Assessment
2.3. Dietary Inflammatory Index (DII) Assessment
2.4. Biomarkers Assessment
2.5. Type 2 Diabetes Mellitus Definition
2.6. Anthropometric and Blood Pressure Assessment
2.7. Physical Activity Assessment
2.8. Socioeconomic Status and Education Assessment
2.9. Other Participant Characteristics
2.10. Statistical Analysis
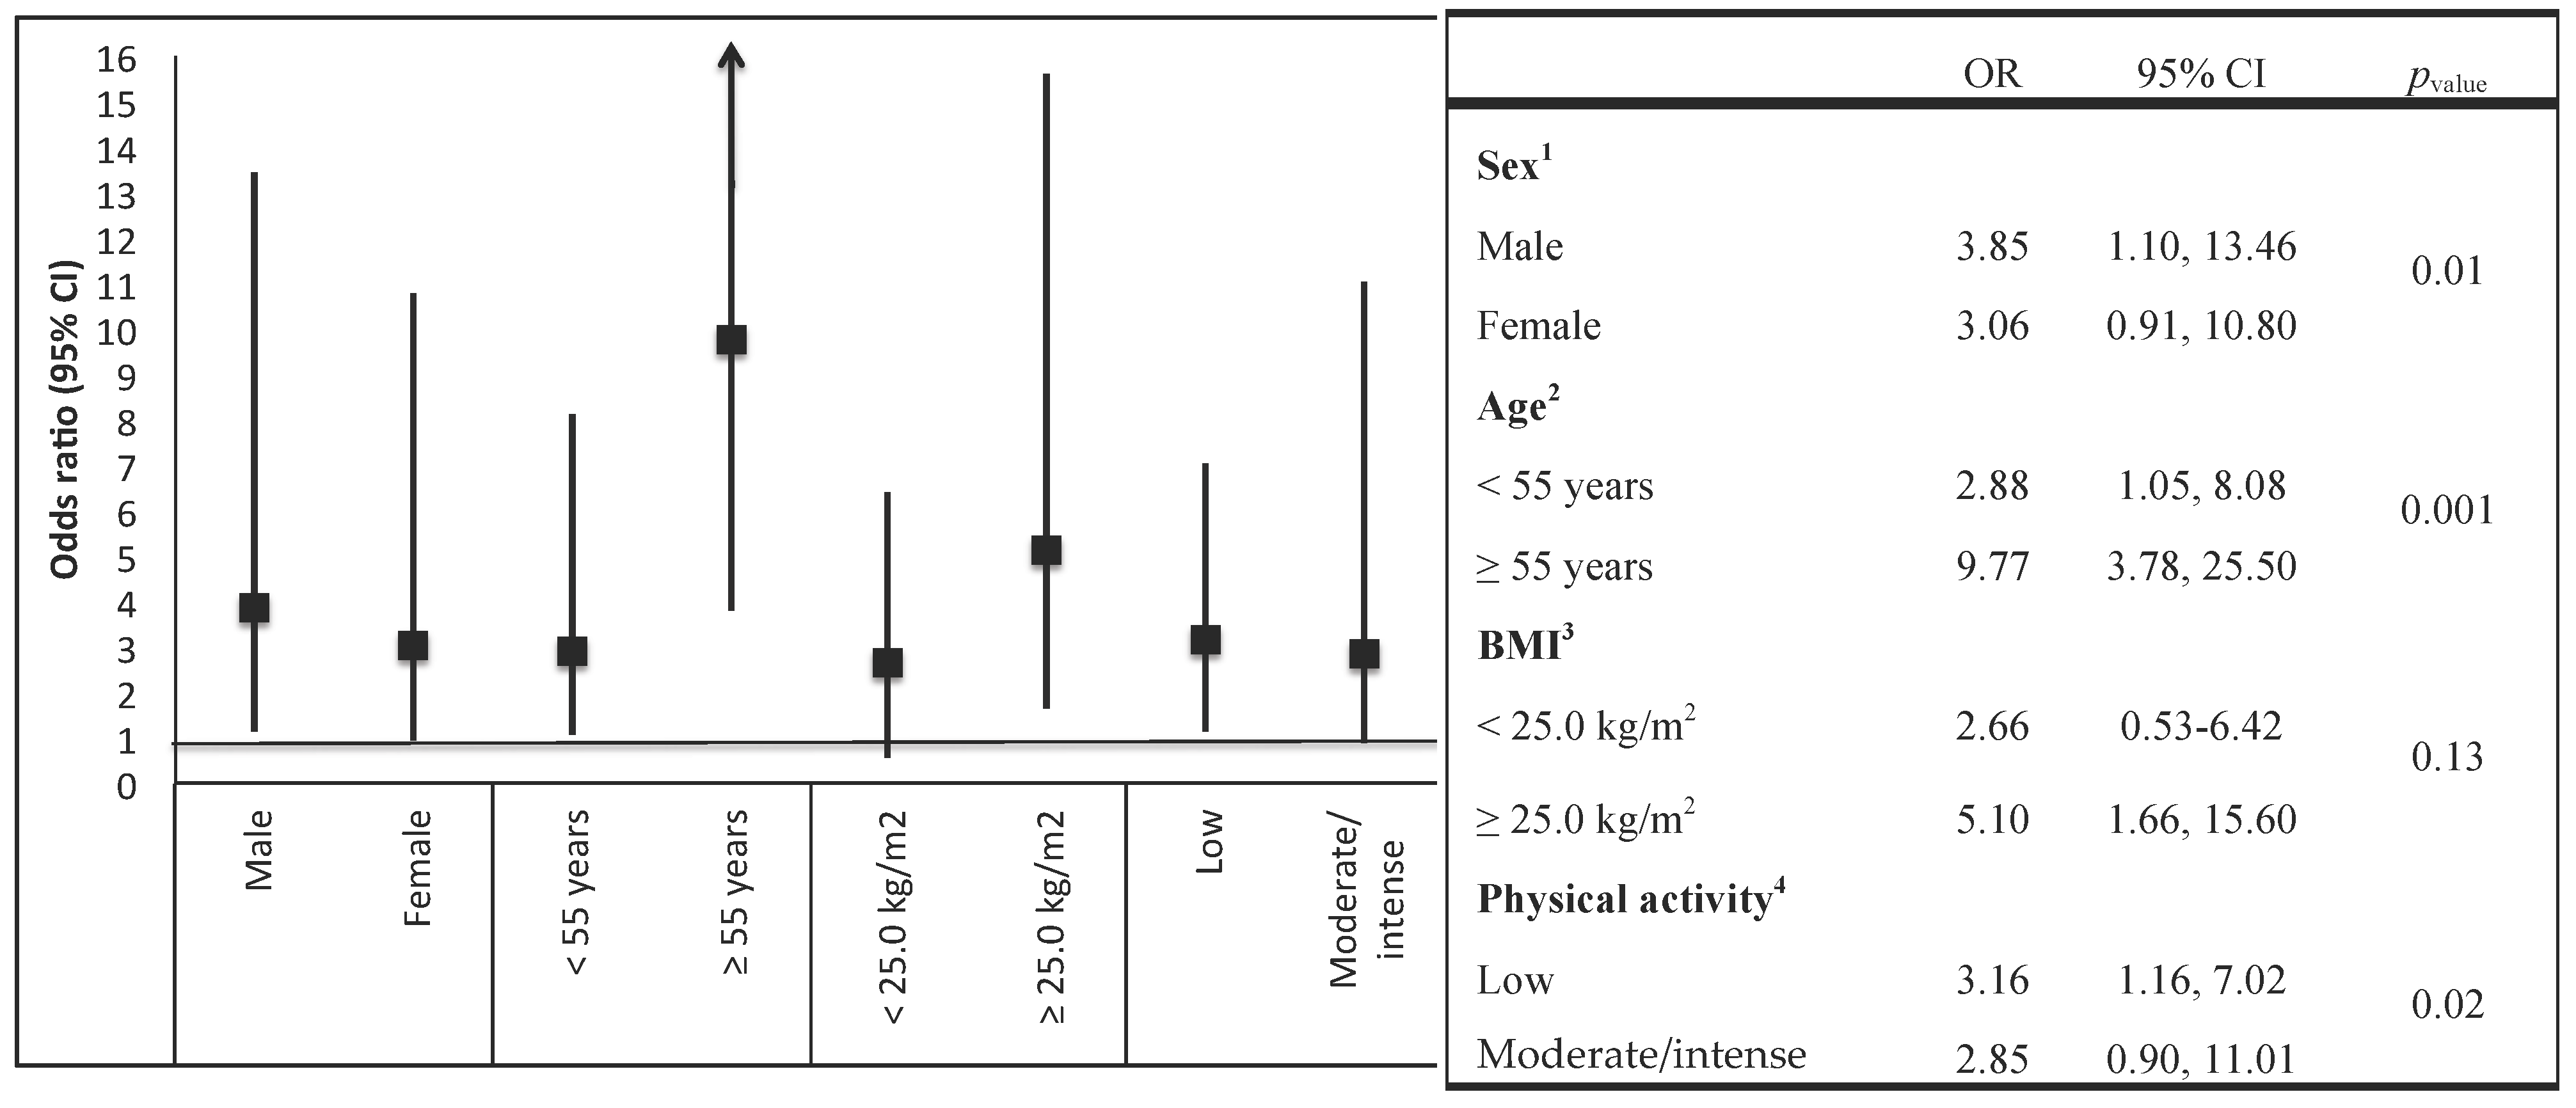
3. Results
4. Discussion
5. Conclusions
Supplementary Materials
Supplementary File 1Acknowledgments
Author Contributions
Conflicts of Interest
References
- Calder, P.C.; Albers, R.; Antoine, J.M.; Blum, S.; Bourdet-Sicard, R.; Ferns, G.A.; Folkerts, G.; Friedmann, P.S.; Frost, G.S.; Guarner, F.; et al. Inflammatory disease processes and interactions with nutrition. Br. J. Nutr. 2009, 101, S1–S45. [Google Scholar] [CrossRef] [PubMed]
- Fung, T.T.; McCullough, M.L.; Newby, P.K.; Manson, J.E.; Meigs, J.B.; Rifai, N.; Willett, W.C.; Hu, F.B. Diet-quality scores and plasma concentrations of markers of inflammation and endotelial dysfunction. Am. J. Clin. Nutr. 2005, 82, 163–173. [Google Scholar] [CrossRef] [PubMed]
- Zimmet, P.Z.; Magliano, D.J.; Herman, W.H.; Shaw, J.E. Diabetes: A 21st century challenge. Lancet Diabetes Endocrinol. 2014, 2, 56–64. [Google Scholar] [CrossRef]
- Kassebaum, N.J.; DALYs and GBD collaborators, 2015. Global, regional, and national disability-adjusted life-years (DALYs) for 315 diseases and injuries and healthy life expectancy (HALE), 1990–2015: A systematic analysis for the Global Burden of Disease Study 2015. Lancet 2016, 388, 1603–1658. [Google Scholar] [CrossRef]
- Guariguata, L.; Whiting, D.R.; Hambleton, I.; Beagley, J.; Linnenkamp, U.; Shaw, J.E. Global estimates of diabetes prevalence for 2013 and projections for 2035. Diabetes Res. Clin. Pract. 2014, 103, 137–149. [Google Scholar] [CrossRef] [PubMed]
- Gómez-Dantés, H.; Fullman, N.; Lamadrid-Figueroa, H.; Cahuana-Hurtado, L.; Darney, B.; Avila-Burgos, L.; Correa-Rotter, R.; Rivera, J.A.; Barquera, S.; González-Pier, E.; et al. Dissonant health transition in the states of Mexico, 1990–2013: A systematic analysis for the Global Burden of Disease Study 2013. Lancet 2016, 388, 2386–2402. [Google Scholar] [CrossRef]
- Visser, M.; Bouter, L.M.; McQuillan, G.M.; Wener, M.H.; Harris, T.B. Elevated C-reactive protein levels in overweight and obese adults. JAMA 1999, 282, 2131–2135. [Google Scholar] [CrossRef] [PubMed]
- Petersen, A.M.; Pedersen, B.K. The anti-inflammatory effect of exercise. J. Appl. Physiol. 2005, 98, 1154–1162. [Google Scholar] [CrossRef] [PubMed]
- Calder, P.C.; Ahluwalia, N.; Brouns, F.; Buetler, T.; Clement, K.; Cunningham, K.; Esposito, K.; Jönsson, L.S.; Kolb, H.; Lansink, M.; et al. Dietary factors and low-grade inflammation in relation to overweight and obesity. Br. J. Nutr. 2011, 106, S5–S78. [Google Scholar] [CrossRef] [PubMed]
- Schulze, M.B.; Hu, F.B. Primary prevention of diabetes: What can we done and how much can be prevented? Annu. Rev. Public Health 2005, 26, 445–467. [Google Scholar] [CrossRef] [PubMed]
- Fung, T.T.; Schulze, M.; Manson, J.E.; Willett, W.C.; Hu, F.B. Dietary patterns, meat intake, and the risk of type 2 diabetes in women. Arch. Intern. Med. 2004, 164, 2235–2240. [Google Scholar] [CrossRef] [PubMed]
- Shivappa, N.; Steck, S.E.; Hurley, T.G.; Hussey, J.R.; Hébert, J.R. Designing and developing a literature-derived, population-based dietary inflammatory index. Public Health Nutr. 2014, 17, 1689–1696. [Google Scholar] [CrossRef] [PubMed]
- Shivappa, N.; Steck, S.E.; Hurley, T.G.; Hussey, J.R.; Ma, Y.; Ockene, I.S.; Tabung, F.; Hébert, J.R. A population based dietary inflammatory index predicts levels of C-reactive protein in the seasonal variation of blood cholesterol study (SEASONS). Public Health Nutr. 2014, 17, 1825–1833. [Google Scholar] [CrossRef] [PubMed]
- Shivappa, N.; Hébert, J.R.; Rietzschel, E.R.; De Buyzere, M.L.; Langlois, M.; Debruyne, E.; Marcos, A.; Huybrechts, I. Associations between dietary inflammatory index and inflammatory markers in the Asklepios Study. Br. J. Nutr. 2015, 113, 665–671. [Google Scholar] [CrossRef] [PubMed]
- Alkerwi, A.; Shivappa, N.; Crichton, G.; Hébert, J.R. No significant independent relationships with cardiometabolic biomarkers were detected in the Observation of Cardiovascular Risk Factors in Luxemburgo Study population. Nutr. Res. 2014, 34, 1058–1065. [Google Scholar] [CrossRef] [PubMed]
- Shivappa, N.; Zucchetto, A.; Montella, M.; Serraino, D.; Steck, S.E.; La Vecchia, C.; Hébert, J.R. Inflammatory potential of diet and risk of colorectal cancer: A case-control study from Italy. Br. J. Nutr. 2015, 114, 152–158. [Google Scholar] [CrossRef] [PubMed]
- Neufcourt, L.; Assmann, K.E.; Fezeu, L.K.; Touvier, M.; Graffouillère, L.; Shivappa, N.; Hébert, J.R.; Wirth, M.D.; Hercberg, S.; Galan, P.; et al. Prospective association between the dietary inflammatory index and cardiovascular diseases in the SUpplémentation en VItamines et Minéraux AntioXydants (SU.VI.MAX) cohort. J. Am. Heart Assoc. 2016, 5, e002735. [Google Scholar] [CrossRef] [PubMed]
- Romero-Martínez, M.; Shamah-Levy, T.; Franco-Nuñez, A.; Villalpando, S.; Cuevas-Nasu, L.; Gutiérrez, J.P.; Rivera-Dommarco, J.Á. National Health and Nutrition Survey 2012: Design and coverage. Salud Publica Mex. 2013, 55, S332–S340. [Google Scholar] [CrossRef] [PubMed]
- Rosner, B.; Willett, W.C. Interval estimates for correlation coefficients corrected for within-person variation: Implications for study design and hypothesis testing. Am. J. Epidemiol. 1988, 127, 377–386. [Google Scholar] [CrossRef] [PubMed]
- Denova-Gutiérrez, E.; Ramírez-Silva, I.; Rodríguez-Ramírez, S.; Jiménez-Aguilar, A.; Shamah-Levy, T.; Rivera-Dommarco, J.A. Validity of a food frequency questionnaire to assess food intake in Mexican adolescent and adult population. Salud Publica Mex. 2016, 58, 617–628. [Google Scholar] [CrossRef] [PubMed]
- Hernández-Ávila, J.E.; González-Avilés, L.; Rosales-Mendoza, E. Manual de Usuario. SNUT Sistema de Evaluación de Hábitos Nutricionales y Consumo de Nutrimentos; Instituto Nacional de Salud Pública: Cuernavaca, México, 2003. (In Spanish) [Google Scholar]
- Hebert, J.R.; Ockene, I.S.; Hurley, T.G.; Luippold, R.; Well, A.D.; Harmatz, M.G. Development and testing of a seven-day dietary recall. J. Clin. Epidemiol. 1997, 50, 925–937. [Google Scholar] [CrossRef]
- Twetz, N. Textbook of Clinical Chemistry; WB Saunders: Philadelphia, PA, USA, 1999. [Google Scholar]
- American Diabetes Association. Standards of medical care in diabetes-2014. Diabetes Care 2014, 37, S14–S80. [Google Scholar] [CrossRef]
- Alberti, K.G.; Zimmet, P.; Shaw, J. The metabolic syndrome: A new worldwide definition. Lancet 2005, 366, 1059–1062. [Google Scholar] [CrossRef]
- Martinez, S.M.; Ainsworth, B.E.; Elder, J.P. A review of physical activity measures used among US Latinos: Guidelines for developing culturally appropriate measures. Ann. Behav. Med. 2008, 36, 195–207. [Google Scholar] [CrossRef] [PubMed]
- International Physical Activity Questionnaire. Guidelines for Data Processing and Analysis of the International Physical Activity Questionnaire (IPAQ)-Short and Long Forms. Available online: http://www.ipaq.ki.se/scoring.pdf (accessed on 30 May 2016).
- World Health Organization. Global Recommendations on Physical Activity for Health. Available online: http://whqlibdoc.who.int/publications/ 2010/9789243599977_spa.pdf (accessed on 29 May 2016).
- Ruiz-Canela, M.; Zazpe, I.; Shivappa, N.; Hébert, J.R.; Sánchez-Tainta, A.; Corella, D.; Salas-Salvadó, J.; Fitó, M.; Lamuela-Raventós, R.M.; Rekondo, J.; et al. Dietary inflammatory index and anthropometric measures of obesity in a population sample at high cardiovascular risk from the PREDIMED (PREvención con DIeta MEDiterránea) trial. Br. J. Nutr. 2015, 113, 984–995. [Google Scholar] [CrossRef] [PubMed]
- Ramallal, R.; Toledo, E.; Martínez-González, M.A.; Hernández-Hernández, A.; García-Arellano, A.; Shivappa, N.; Hébert, J.R.; Ruiz-Canela, M. Dietary inflammatory index and incidence of cardiovascular disease in the SUN Cohort. PLoS ONE 2015, 10, e0135221. [Google Scholar] [CrossRef] [PubMed]
- Liese, A.D.; Weis, K.E.; Schulz, M.; Tooze, J.A. Food intake patterns associated with incident type 2 diabetes. Diabetes Care 2009, 32, 263–268. [Google Scholar] [CrossRef] [PubMed]
- Schulze, M.B.; Hoffmann, K.; Manson, J.E.; Willett, W.C.; Meigs, J.B.; Weikert, C.; Heidemann, C.; Colditz, G.A.; Hu, F.B. Dietary pattern, inflammation, and incidence of type 2 diabetes in women. Am. J. Clin. Nutr. 2005, 82, 675–684. [Google Scholar] [CrossRef] [PubMed]
- Casas, R.; Sacanella, E.; Urpí-Sardà, M.; Chiva-Blanch, G.; Ros, E.; Martínez-González, M.A.; Covas, M.I.; Lamuela-Raventos, R.M.; Salas-Salvadó, J.; Fiol, M.; et al. The effects of the Mediterranean diet on biomarkers of vascular wall inflammation and plaque vulnerability in subjects with high risk for cardiovascular disease. A randomize trial. PLoS ONE 2014, 9, e100084. [Google Scholar] [CrossRef] [PubMed]
- Mozaffarian, D.; Marfisi, R.; Levantesi, G.; Silletta, M.G.; Tavazzi, L.; Tognoni, G.; Valagussa, F.; Marchioli, R. Incidence of new-onset diabetes and impaired fasting glucose in patients with recent myocardial infarction and the effect of clinical and lifestyle risk factors. Lancet 2007, 370, 667–675. [Google Scholar] [CrossRef]
- Vahid, F.; Shivappa, N.; Karamati, M.; Naeini, A.J.; Hebert, J.R.; Davoodi, S.H. Association between Dietary Inflammatory Index (DII) and risk of prediabetes: A case-control study. Appl. Physiol. Nutr. Metab. 2017, 42, 399–404. [Google Scholar] [CrossRef] [PubMed]
- Schulze, M.B.; Manson, J.E.; Ludwig, D.S.; Colditz, G.A.; Stampfer, M.J.; Willett, W.C.; Hu, F.B. Sugar-sweetend beverages, weight gain, and incidence of type 2 diabetes in young and middle-aged women. JAMA 2004, 292, 927–934. [Google Scholar] [CrossRef] [PubMed]
- Whincup, P.H.; Donin, A.S. Cereal fibre and type 2 diabetes: Time now for randomised control trials? Diabetologia 2015, 58, 1383–1385. [Google Scholar] [CrossRef] [PubMed]
- Erber, E.; Hopping, B.N.; Grandinetti, A.; Park, S.Y.; Kolonel, L.N.; Maskarinec, G. Dietary pattern and risk for diabetes. The multiethnic cohort. Diabetes Care 2010, 33, 532–538. [Google Scholar] [CrossRef] [PubMed]
- Festa, A.; D’Agostino, R., Jr.; Howard, G.; Mykkänen, L.; Tracy, R.P.; Haffner, S.M. Chronic subclinical inflammation as part of the insulin resistance syndrome: The Insulin ResistanceAtherosclerosis Study (IRAS). Circulation 2000, 102, 42–47. [Google Scholar] [CrossRef] [PubMed]
- Gearing, A.J.; Newman, W. Circulating adhesion molecules in disease. Immunol. Today 1993, 14, 506–512. [Google Scholar] [CrossRef]


| Variables | Overall Study | Non-T2DM Subjects | T2DM Subjects | p-Value a |
|---|---|---|---|---|
| (n = 1174) | (n = 973) | (n = 201) | ||
| Sex, % | ||||
| Men | 48.5 | 48.4 | 48.7 | 0.17 |
| Women | 51.5 | 51.6 | 51.3 | |
| Age (years) b | 39.9 (0.48) | 38.0 (0.46) | 52.3 (0.83) | <0.001 |
| Socioeconomic status, % | ||||
| Low | 21.9 | 20.2 | 33.5 | <0.001 |
| Medium | 36.4 | 36.1 | 37.4 | |
| High | 41.7 | 43.7 | 29.1 | |
| Education, % | ||||
| Elementary and secondary education | 19.3 | 16.5 | 37.4 | <0.001 |
| High school | 27.2 | 26.5 | 32.0 | |
| Bachelor’s degree or higher | 53.5 | 57.0 | 30.6 | |
| Smoking status, % | ||||
| Current | 45.6 | 45.2 | 48.8 | 0.41 |
| Past | 11.6 | 12.1 | 7.8 | |
| Never | 42.8 | 42.7 | 43.4 | |
| Physical activity, % | ||||
| Inactive | 23.0 | 22.8 | 24.4 | 0.17 |
| Active/highly active | 77.0 | 77.2 | 75.6 | |
| Family history of DM2, % | 41.9 | 38.2 | 66.5 | <0.001 |
| Hypertension, (%) | 15.9 | 11.5 | 44.1 | <0.001 |
| Body mass index (kg/m2) b | 28.8 (0.22) | 28.2 (0.23) | 31.2 (0.48) | <0.001 |
| Body mass index, % | ||||
| Normal (<25.0 kg/m2) | 25.5 | 28.2 | 9.1 | <0.001 |
| Overweight (≥25.0 to <30.0 kg/m2) | 40.2 | 39.9 | 41.8 | |
| Obesity (≥30.0 kg/m2) | 34.3 | 31.9 | 49.1 | |
| Abdominal obesity, % | 43.1 | 38.9 | 70.2 | <0.001 |
| Glucose (mg/dL) b | 107.7 (2.0) | 91.3 (0.53) | 213.8 (7.7) | <0.001 |
| Glycated hemoglobin (HbA1c %) b | 5.9 (0.07) | 5.3 (0.02) | 9.8 (0.23) | <0.001 |
| Triglycerides (mg/dL) b | 205.6 (6.3) | 189.8 (6.3) | 307.3 (15.1) | <0.001 |
| Total cholesterol (mg/dL) b | 189.1 (1.5) | 186.2 (1.5) | 207.8 (4.0) | <0.001 |
| High density lipoprotein (mg/dL) b | 42.3 (0.41) | 42.8 (0.49) | 39.9 (0.68) | 0.39 |
| Low density lipoprotein (mg/dL) b | 84.0 (2.1) | 80.9 (2.0) | 87.6 (4.9) | <0.001 |
| Dietary variables | ||||
| Energy intake (kcal/day) c | 2224 (2106–2342) | 2329 (2196–2462) | 1801 (1673–1927) | <0.001 |
| Carbohydrates (% energy) c | 55.4 (54.7–56.1) | 55.1 (54.3–55.9) | 56.8 (55.4–58.1) | 0.06 |
| Total fats (% energy) c | 31.1 (30.5–31.7) | 31.3 (30.6–31.9) | 30.2 (29.3–31.2) | 0.03 |
| Saturated fats (% energy) c | 11.6 (11.3–11.9) | 11.8 (11.5–12.0) | 11.2 (10.7–11.6) | 0.001 |
| Monounsaturated fatty acids (% energy) c | 10.9 (10.7–11.1) | 11.0 (10.7–11.2) | 10.4 (10.0–10.8) | 0.03 |
| Polyunsaturated fatty acids (% energy) c | 7.0 (6.8–7.2) | 7.0 (6.8–7.2) | 7.0 (6.8–7.3) | 0.61 |
| Fiber (g/day) c | 27.7 (25.9–29.6) | 28.3 (26.3–30.3) | 25.6 (23.8–27.4) | <0.001 |
| Alcohol intake (g/day) c | 9.4 (7.4–11.3) | 10.4 (8.2–12.6) | 5.0 (2.5–7.5) | 0.003 |
| Magnesium (mg/day) c | 409.7 (386.5–432.9) | 417.7 (392.3–443.1) | 377.3 (351.4–403.2) | <0.001 |
| Dietary Inflammatory Index | ||||||
|---|---|---|---|---|---|---|
| Quintile 1: Most Anti-Inflammatory | Quintile 2 | Quintile 3 | Quintile 4 | Quintile 5: Most Pro-Inflammatory | p-Value a | |
| (n = 235) | (n = 235) | (n = 235) | (n = 235) | (n = 234) | ||
| Mean DII-density | −3.05 | −1.85 | −0.81 | 0.24 | 1.79 | <0.001 |
| Sex, % | ||||||
| Men | 24.7 | 37.5 | 38.9 | 40.1 | 48.9 | <0.001 |
| Women | 75.3 | 62.5 | 61.1 | 59.9 | 51.1 | |
| Age (years) b | 39.9 (0.91) | 42.9 (1.2) | 45.5 (1.11) | 46.2 (1.08) | 48.5 (1.05) | 0.001 |
| Socioeconomic status, % | ||||||
| Low | 21.5 | 22.8 | 21.5 | 22.3 | 34.8 | <0.001 |
| Medium | 32.2 | 39.0 | 38.5 | 41.0 | 34.3 | |
| High | 46.3 | 38.2 | 40.0 | 36.7 | 30.9 | |
| Education, % | ||||||
| Elementary and secondary education | 10.6 | 26.1 | 27.3 | 27.6 | 34.4 | <0.001 |
| High school | 24.5 | 21.3 | 27.2 | 29.8 | 31.7 | |
| Bachelor’s degree or higher | 59.9 | 52.6 | 45.5 | 42.6 | 33.9 | |
| Smoking status, % | ||||||
| Current | 52.9 | 51.8 | 47.8 | 39.5 | 31.7 | <0.001 |
| Past | 10.5 | 6.1 | 10.0 | 17.9 | 15.2 | |
| Never | 36.6 | 42.1 | 42.2 | 42.6 | 53.1 | |
| Physical activity, % | ||||||
| Inactive | 25.7 | 27.8 | 29.5 | 26.5 | 23.8 | 0.14 |
| Active/highly active | 74.3 | 72.2 | 70.5 | 73.5 | 76.2 | |
| Body mass index (kg/m2) b | 28.1 (0.38) | 28.3 (0.40) | 28.7 (0.47) | 28.9 (0.45) | 29.8 (0.48) | 0.007 |
| Body mass index, % | ||||||
| Normal (<25.0 kg/m2) | 29.2 | 25.3 | 23.5 | 25.4 | 20.8 | 0.005 |
| Overweight (≥25.0 to <30.0 kg/m2) | 38.5 | 38.8 | 41.4 | 38.6 | 36.2 | |
| Obesity (≥30.0 kg/m2) | 32.3 | 35.8 | 35.1 | 36.0 | 43.0 | |
| Abdominal obesity, % | ||||||
| Yes | 39.3 | 47.2 | 48.3 | 50.3 | 54.2 | <0.001 |
| Glucose (mg/dL) b | 100.9 (3.6) | 103.8 (2.8) | 108.8 (3.6) | 112.4 (3.9) | 117.2 (4.7) | <0.001 |
| Glycated hemoglobin (HbA1c %) b | 5.7 (0.10) | 5.8 (0.12) | 6.2 (0.14) | 6.2 (0.13) | 6.7 (0.11) | 0.006 |
| Triglycerides (mg/dL) b | 200.6 (10.8) | 188.3 (12.3) | 217.9 (13.0) | 203.1 (11.6) | 216.7 (13.1) | 0.96 |
| Total cholesterol (mg/dL) b | 187.7 (3.1) | 181.6 (3.0) | 192.4 (3.5) | 190.9 (3.2) | 196.4 (3.3) | 0.02 |
| High density lipoprotein (mg/dL) b | 42.8 (1.03) | 41.2 (0.81) | 42.1 (0.75) | 42.1 (0.76) | 41.7 (0.71) | 0.17 |
| Low density lipoprotein (mg/dL) b | 81.2 (4.4) | 85.2 (3.4) | 80.2 (4.7) | 88.7 (4.4) | 88.9 (4.8) | 0.79 |
| Type 2 Diabetes Mellitus, % | ||||||
| Yes | 6.4 | 11.1 | 13.3 | 16.2 | 22.8 | <0.001 |
| Variables | Dietary Inflammatory Index | p-Value a | |||||||||
|---|---|---|---|---|---|---|---|---|---|---|---|
| Quintile 1: Most Anti-Inflammatory | Quintile 2 | Quintile 3 | Quintile 4 | Quintile 5: Most Pro-Inflammatory | |||||||
| Mean | (95% CI) | Mean | (95% CI) | Mean | (95% CI) | Mean | (95% CI) | Mean | (95% CI) | ||
| Carbohydrates intake (% energy) b | 53.8 | (52.6, 55.1) | 55.0 | (53.7, 56.4) | 56.0 | (55.2, 58.4) | 56.1 | (54.7, 57.5) | 56.1 | (54.3, 57.8) | <0.001 |
| Protein intake (% energy) | 14.4 | (13.9, 14.8) | 13.9 | (13.4, 14.6) | 13.7 | (13.1, 14.0) | 13.0 | (12.6, 13.5) | 12.6 | (11.7, 13.7) | <0.001 |
| Total fat intake (% energy) | 31.8 | (30.9, 32.9) | 30.8 | (29.8, 31.6) | 30.3 | (29.2, 31.3) | 31.2 | (30.1, 32.3) | 31.3 | (29.9, 32.7) | 0.08 |
| Saturated fats (% energy) | 11.4 | (10.9, 11.9) | 11.7 | (11.2, 12.2) | 11.3 | (10.9, 11.8) | 11.3 | (10.8, 11.8) | 12.3 | (11.5, 13.2) | 0.51 |
| Monounsaturated fats (% energy) | 11.2 | (10.8, 11.6) | 10.8 | (10.4, 11.2) | 10.6 | (10.1, 11.1) | 10.9 | (10.4, 11.4) | 10.9 | (10.3, 11.4) | 0.20 |
| Polyunsaturated fats (% energy) | 7.6 | (7.3, 7.9) | 7.2 | (6.9, 7.5) | 6.9 | (6.6, 7.2) | 6.8 | (6.5, 7.1) | 6.7 | (6.5, 7.0) | <0.001 |
| Fiber (g/day) | 42.7 | (40.0, 45.4) | 31.5 | (27.8, 35.2) | 24.7 | (23.5, 25.9) | 24.2 | (22.6, 25.9) | 13.3 | (12.7, 14.0) | <0.001 |
| Alcohol consumption (g/day) | 15.2 | (9.4, 21.0) | 11.8 | (7.2, 16.4) | 6.6 | (2.2, 11.0) | 6.6 | (1.2, 13.2) | 2.5 | (1.2, 3.9) | <0.001 |
| Magnesium (mg/day) | 600.3 | (568.8, 631.8) | 453.5 | (402.1, 504.8) | 365.5 | (350.3, 380.7) | 355.9 | (333.7, 388.2) | 219.5 | (208.6, 230.5) | <0.001 |
| Vitamin C (mg/day) | 374.4 | (344.5, 404.2) | 288.0 | (258.2, 317.8) | 194.5 | (181.0, 208.2) | 160.6 | (141.4, 179.7) | 82.0 | (72.9, 91.2) | <0.001 |
| Vitamin A (μg/day) | 1900.2 | (1666.1, 2134.2) | 1219.9 | (1071.6, 1368.2) | 830.1 | (772.7, 887.6) | 701.5 | (635.1, 767.9) | 396.3 | (360.0, 432.6) | <0.001 |
| Vitamin E (mg/day) | 13.0 | (12.3, 13.6) | 8.9 | (7.6, 10.1) | 6.5 | (6.2, 6.8) | 6.5 | (6.2, 7.3) | 3.4 | (3.4, 3.9) | <0.001 |
| Vitamin D (μg/day) | 7.7 | (7.1, 8.3) | 5.1 | (4.4, 5.7) | 4.4 | (3.9, 4.9) | 3.8 | (3.4, 4.2) | 2.5 | (2.5, 3.1) | <0.001 |
| Vegetables (g/day) | 370.0 | (321.2, 418.8) | 245.5 | (212.8, 278.4) | 139.4 | (121.3, 157.5) | 112.2 | (95.9, 128.5) | 69.3 | (60.0, 78.6) | <0.001 |
| Fruits (g/day) | 327.6 | (293.3, 362.0) | 259.9 | (225.9, 294.0) | 178.8 | (162.2, 195.5) | 134.5 | (114.3, 154.6) | 74.2 | (64.4, 84.0) | <0.001 |
| Legumes (g/day) | 67.4 | (49.5, 85.3) | 51.0 | (29.2, 72.6) | 31.6 | (26.0, 37.2) | 33.7 | (26.6, 40.8) | 21.2 | (16.2, 26.1) | <0.001 |
| Fish and seafood (g/day) | 24.1 | (15.0, 33.1) | 13.9 | (4.7, 23.0) | 10.8 | (5.9, 15.7) | 10.4 | (5.1, 15.7) | 3.2 | (1.5, 4.9) | <0.001 |
| Dairy products (g/day) | 242.5 | (209.9, 275.1) | 225.8 | (188.9, 262.6) | 177.9 | (142.3, 213.5) | 172.5 | (134.3, 210.8) | 139.2 | (109.3, 169.1) | <0.001 |
| Red meat and processed meat (g/day) | 40.1 | (33.7, 46.5) | 46.9 | (41.3, 52.6) | 55.0 | (44.4, 65.5) | 55.3 | (41.8, 68.7) | 78.3 | (66.3, 90.2) | <0.001 |
| Eggs (g/day) | 28.9 | (23.8, 33.9) | 30.8 | (25.1, 36.5) | 32.2 | (25.2, 39.2) | 35.5 | (28.4, 42.6) | 34.3 | (26.6, 41.9) | <0.001 |
| Refined cereals (g/day) | 109.2 | (96.0, 122.5) | 145.0 | (129.8, 160.3) | 145.4 | (125.5, 165.3) | 158.2 | (122.7, 193.6) | 173.9 | (147.1, 200.6) | <0.001 |
| Potatoes (g/day) | 9.7 | (5.2, 14.2) | 11.8 | (7.7, 15.8) | 11.5 | (7.8, 15.3) | 8.3 | (4.9, 11.7) | 7.1 | (5.1, 9.2) | 0.87 |
| Soft drinks (mL/day) | 69.5 | (51.6, 87.4) | 146.9 | (109.6, 184.1) | 219.5 | (175.7, 263.3) | 262.4 | (202.2, 322.6) | 401.7 | (343.3, 460.1) | <0.001 |
| Dietary Inflammatory Index | p-Value | |||||||||
|---|---|---|---|---|---|---|---|---|---|---|
| Quintile 1: Most Anti-Inflammatory | Quintile 2 | Quintile 3 | Quintile 4 | Quintile 5: Most Pro-Inflammatory | ||||||
| OR | OR | (95% CI) | OR | (95% CI) | OR | (95% CI) | OR | (95% CI) | ||
| Model I | 1.0 | 1.55 | (0.86, 2.78) | 1.80 | (0.90, 3.56) | 1.78 | (0.93, 3.53) | 2.29 | (1.11, 4.75) | 0.01 |
| Model II | 1.0 | 1.73 | (0.94, 3.20) | 1.88 | (0.91, 3.89) | 1.97 | (1.06, 3.64) | 3.00 | (1.38, 6.55) | 0.005 |
| Model III | 1.0 | 1.80 | (0.95, 3.38) | 2.01 | (0.97, 4.13) | 2.10 | (1.07, 3.78) | 3.02 | (1.39, 6.58) | 0.005 |
© 2018 by the authors. Licensee MDPI, Basel, Switzerland. This article is an open access article distributed under the terms and conditions of the Creative Commons Attribution (CC BY) license (http://creativecommons.org/licenses/by/4.0/).
Share and Cite
Denova-Gutiérrez, E.; Muñoz-Aguirre, P.; Shivappa, N.; Hébert, J.R.; Tolentino-Mayo, L.; Batis, C.; Barquera, S. Dietary Inflammatory Index and Type 2 Diabetes Mellitus in Adults: The Diabetes Mellitus Survey of Mexico City. Nutrients 2018, 10, 385. https://doi.org/10.3390/nu10040385
Denova-Gutiérrez E, Muñoz-Aguirre P, Shivappa N, Hébert JR, Tolentino-Mayo L, Batis C, Barquera S. Dietary Inflammatory Index and Type 2 Diabetes Mellitus in Adults: The Diabetes Mellitus Survey of Mexico City. Nutrients. 2018; 10(4):385. https://doi.org/10.3390/nu10040385
Chicago/Turabian StyleDenova-Gutiérrez, Edgar, Paloma Muñoz-Aguirre, Nitin Shivappa, James R. Hébert, Lizbeth Tolentino-Mayo, Carolina Batis, and Simón Barquera. 2018. "Dietary Inflammatory Index and Type 2 Diabetes Mellitus in Adults: The Diabetes Mellitus Survey of Mexico City" Nutrients 10, no. 4: 385. https://doi.org/10.3390/nu10040385
APA StyleDenova-Gutiérrez, E., Muñoz-Aguirre, P., Shivappa, N., Hébert, J. R., Tolentino-Mayo, L., Batis, C., & Barquera, S. (2018). Dietary Inflammatory Index and Type 2 Diabetes Mellitus in Adults: The Diabetes Mellitus Survey of Mexico City. Nutrients, 10(4), 385. https://doi.org/10.3390/nu10040385