Testosterone-Associated Dietary Pattern Predicts Low Testosterone Levels and Hypogonadism

 ,
,  , , , and
Abstract
1. Introduction
2. Materials and Methods
2.1. Participants
2.2. Definitions
2.3. Questionnaires
2.4. Anthropometric Measurements
2.5. Laboratory Measurements
2.6. Statistical Analysis
3. Results
3.1. Total T Levels Are Positively Associated with TS and SMM and Negatively Associated with Age, Obesity-Related Cardiometabolic Diseases, and RBC Rheology
3.2. Relationship between Serum Total T and Potential Variables
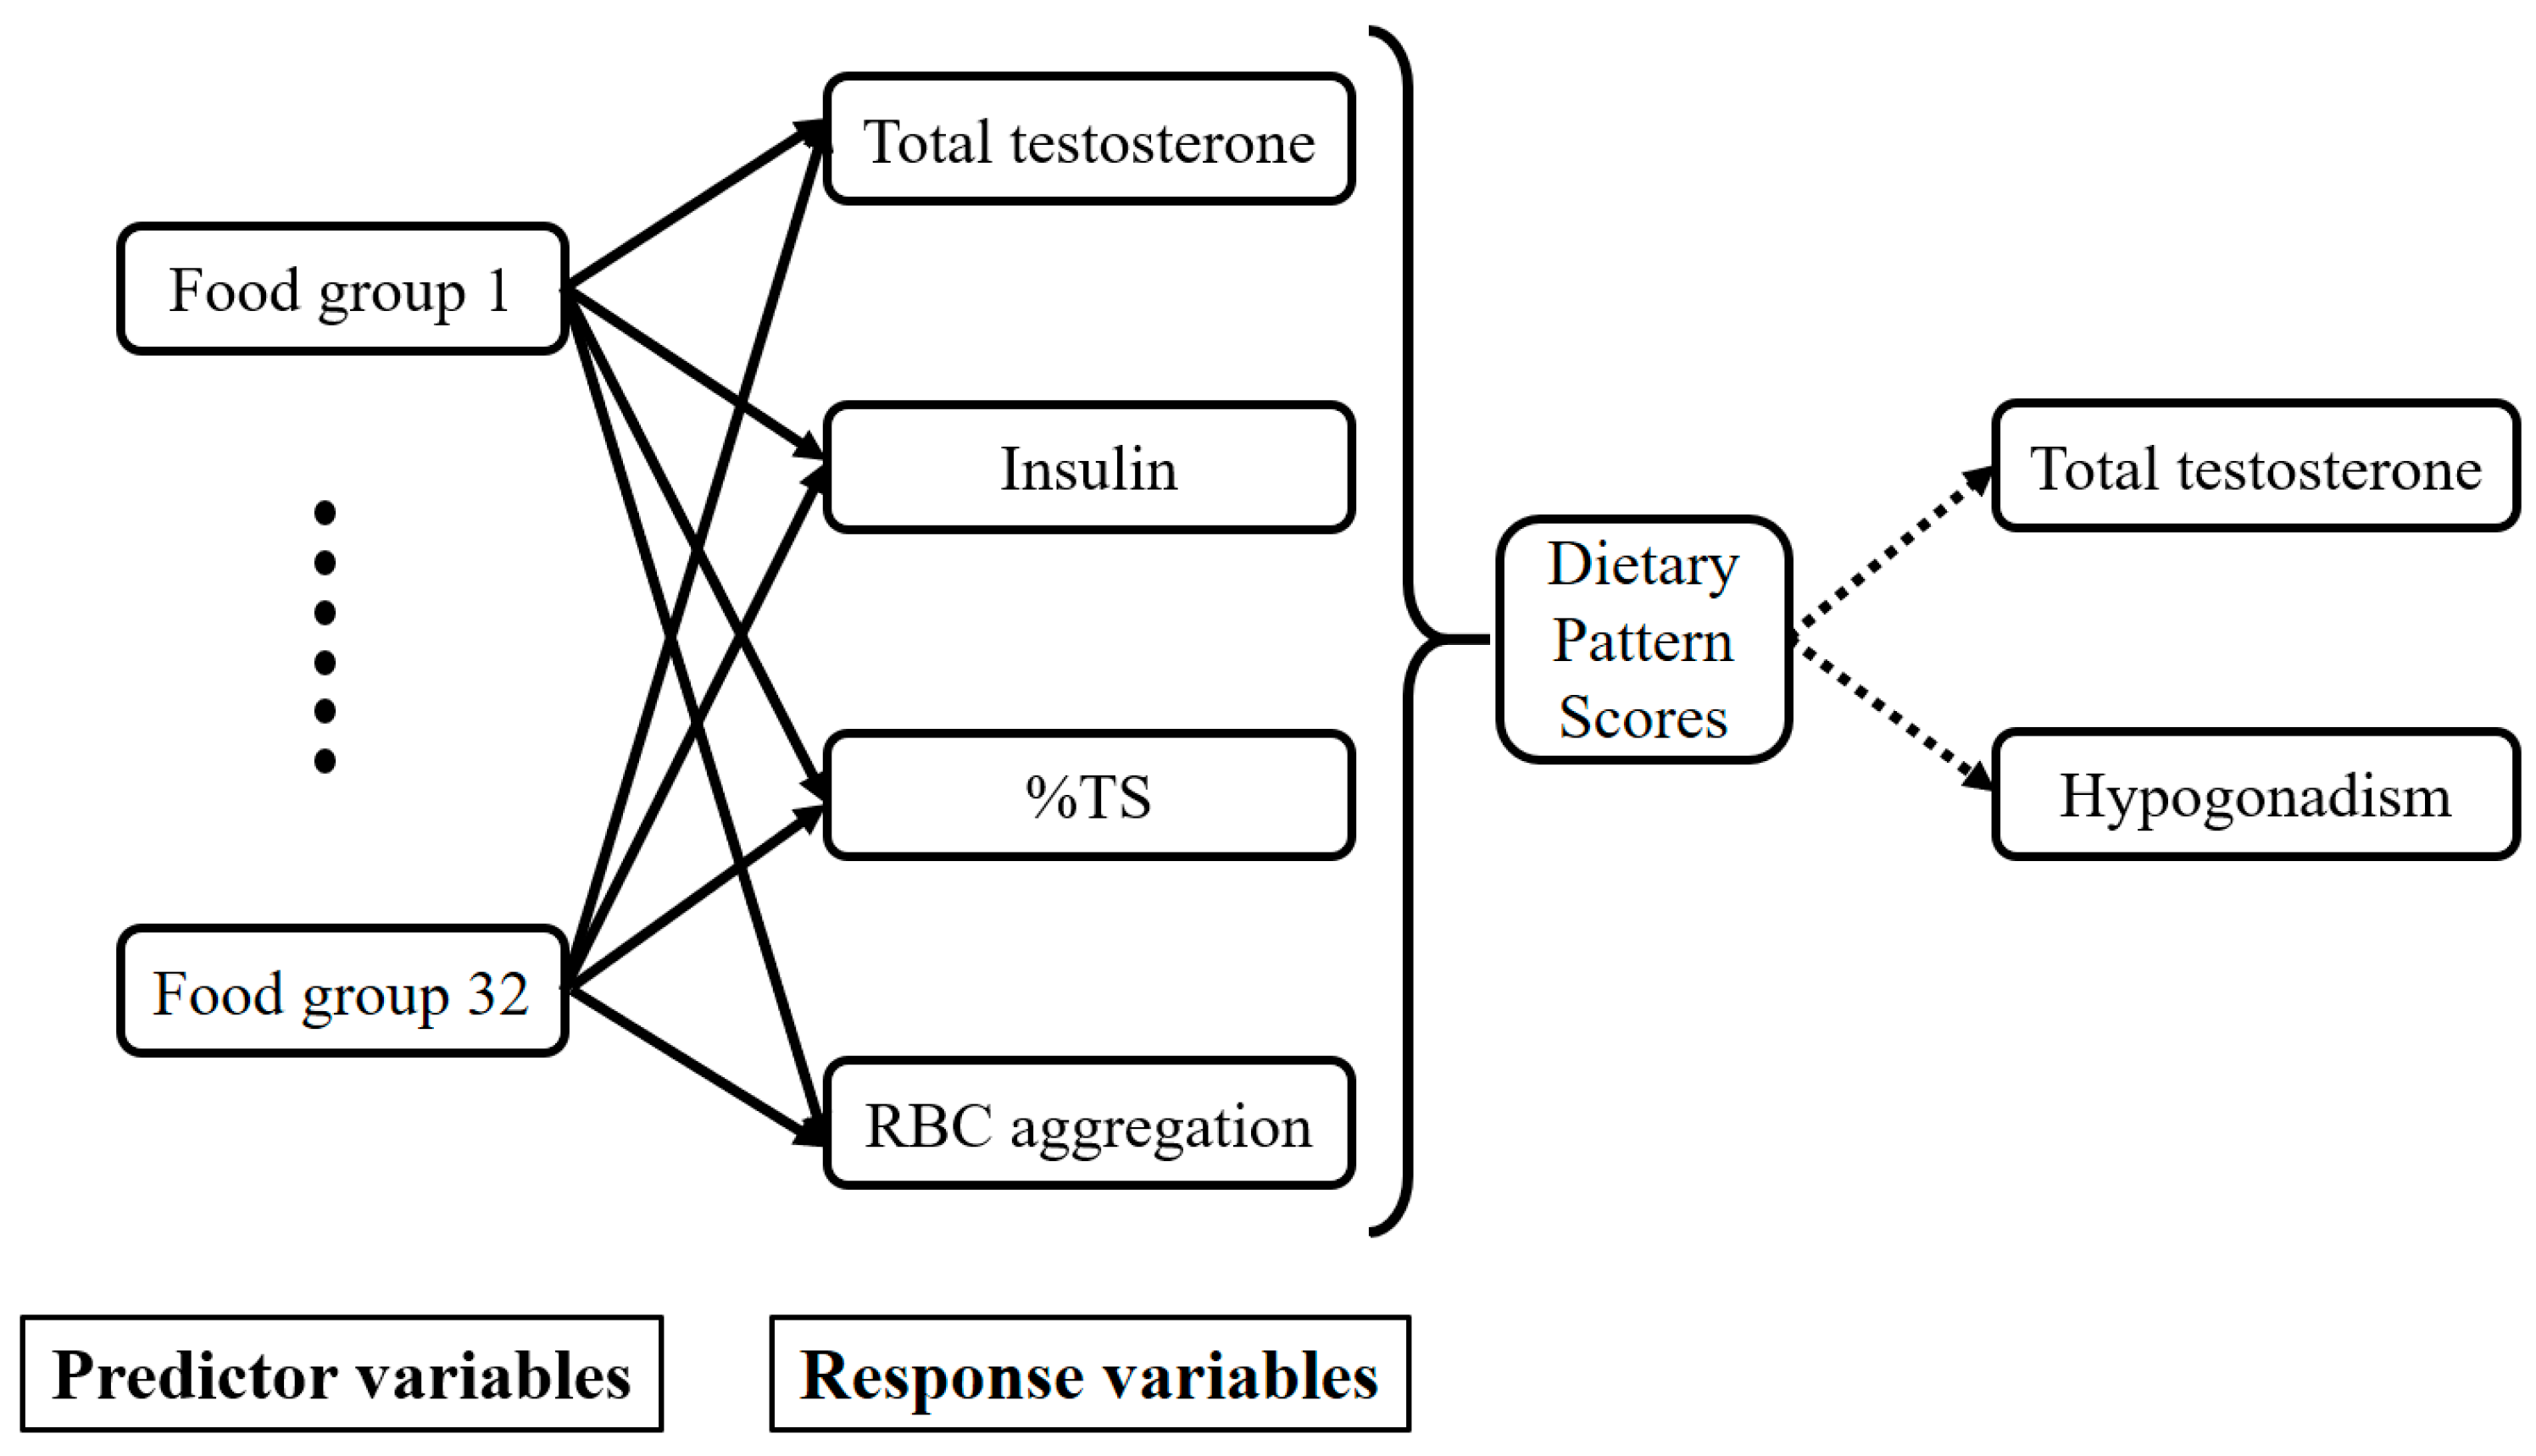
3.3. T-Associated Dietary Pattern Scores by the Reduced Rank Regression (RRR)
4. Discussion
5. Conclusions
Author Contributions
Funding
Acknowledgments
Conflicts of Interest
References
- Allen, N.E.; Key, T.J. The effects of diet on circulating sex hormone levels in men. Nutr. Res. Rev. 2000, 13, 159–184. [Google Scholar] [CrossRef] [PubMed]
- Mooradian, A.D.; Morley, J.E.; Korenman, S.G. Biological actions of androgens. Endocr. Rev. 1987, 8, 1–28. [Google Scholar] [CrossRef] [PubMed]
- Ghanim, H.; Dhindsa, S.; Abuaysheh, S.; Batra, M.; Kuhadiya, N.D.; Makdissi, A.; Chaudhuri, A.; Dandona, P. Diminished androgen and estrogen receptors and aromatase levels in hypogonadal diabetic men: Reversal with testosterone. Eur. J. Endocrinol. 2018, 178, 277–283. [Google Scholar] [CrossRef] [PubMed]
- Brand, J.S.; van der Schouw, Y.T. Testosterone, shbg and cardiovascular health in postmenopausal women. Int J. Impot. Res. 2010, 22, 91–104. [Google Scholar] [CrossRef] [PubMed]
- Allen, N.E.; Appleby, P.N.; Davey, G.K.; Key, T.J. Lifestyle and nutritional determinants of bioavailable androgens and related hormones in British men. Cancer Causes Control. 2002, 13, 353–363. [Google Scholar] [CrossRef] [PubMed]
- Fui, M.N.; Dupuis, P.; Grossmann, M. Lowered testosterone in male obesity: Mechanisms, morbidity and management. Asian J. Androl. 2014, 16, 223–231. [Google Scholar] [PubMed]
- Gapstur, S.M.; Gann, P.H.; Kopp, P.; Colangelo, L.; Longcope, C.; Liu, K. Serum androgen concentrations in young men: A longitudinal analysis of associations with age, obesity, and race. The cardia male hormone study. Cancer Epidemiol. Biomark. Prev. 2002, 11, 1041–1047. [Google Scholar]
- Jensen, T.K.; Andersson, A.M.; Jorgensen, N.; Andersen, A.G.; Carlsen, E.; Petersen, J.H.; Skakkebaek, N.E. Body mass index in relation to semen quality and reproductive hormones among 1,558 danish men. Fertil. Steril. 2004, 82, 863–870. [Google Scholar] [CrossRef] [PubMed]
- Pitteloud, N.; Mootha, V.K.; Dwyer, A.A.; Hardin, M.; Lee, H.; Eriksson, K.F.; Tripathy, D.; Yialamas, M.; Groop, L.; Elahi, D.; et al. Relationship between testosterone levels, insulin sensitivity, and mitochondrial function in men. Diabetes Care 2005, 28, 1636–1642. [Google Scholar] [CrossRef] [PubMed]
- Hagymasi, K.; Reismann, P.; Racz, K.; Tulassay, Z. Role of the endocrine system in the pathogenesis of non-alcoholic fatty liver disease. Orv. Hetil. 2009, 150, 2173–2181. [Google Scholar] [CrossRef] [PubMed]
- Haffner, S.M.; Shaten, J.; Stern, M.P.; Smith, G.D.; Kuller, L. Low levels of sex hormone-binding globulin and testosterone predict the development of non-insulin-dependent diabetes mellitus in men. Mrfit research group. Multiple risk factor intervention trial. Am. J. Epidemiol. 1996, 143, 889–897. [Google Scholar] [CrossRef] [PubMed]
- Selvin, E.; Feinleib, M.; Zhang, L.; Rohrmann, S.; Rifai, N.; Nelson, W.G.; Dobs, A.; Basaria, S.; Golden, S.H.; Platz, E.A. Androgens and diabetes in men: Results from the third national health and nutrition examination survey (nhanes iii). Diabetes Care 2007, 30, 234–238. [Google Scholar] [CrossRef] [PubMed]
- Traish, A.M.; Saad, F.; Guay, A. The dark side of testosterone deficiency: Ii. Type 2 diabetes and insulin resistance. J. Androl. 2009, 30, 23–32. [Google Scholar] [CrossRef] [PubMed]
- Araujo, A.B.; Dixon, J.M.; Suarez, E.A.; Murad, M.H.; Guey, L.T.; Wittert, G.A. Clinical review: Endogenous testosterone and mortality in men: A systematic review and meta-analysis. J. Clin. Endocrinol. Metab. 2011, 96, 3007–3019. [Google Scholar] [CrossRef] [PubMed]
- Grossmann, M. Hypogonadism and male obesity: Focus on unresolved questions. Clin. Endocrinol. (Oxf.) 2018, 89, 11–21. [Google Scholar] [CrossRef] [PubMed]
- Grossmann, M. Testosterone and glucose metabolism in men: Current concepts and controversies. J. Endocrinol. 2014, 220, R37–55. [Google Scholar] [CrossRef] [PubMed]
- Bjorntorp, P. Hormonal control of regional fat distribution. Hum. Reprod. 1997, 12 (Suppl. 1), 21–25. [Google Scholar] [CrossRef] [PubMed]
- Ding, E.L.; Song, Y.; Manson, J.E.; Hunter, D.J.; Lee, C.C.; Rifai, N.; Buring, J.E.; Gaziano, J.M.; Liu, S. Sex hormone-binding globulin and risk of type 2 diabetes in women and men. N. Engl. J. Med. 2009, 361, 1152–1163. [Google Scholar] [CrossRef] [PubMed]
- Bianchi, V.E.; Locatelli, V. Testosterone a key factor in gender related metabolic syndrome. Obes. Rev. 2018, 19, 557–575. [Google Scholar] [CrossRef] [PubMed]
- Saad, F.; Aversa, A.; Isidori, A.M.; Gooren, L.J. Testosterone as potential effective therapy in treatment of obesity in men with testosterone deficiency: A review. Curr. Diabetes Rev. 2012, 8, 131–143. [Google Scholar] [CrossRef] [PubMed]
- Casu, C.; Nemeth, E.; Rivella, S. Hepcidin agonists as therapeutic tools. Blood 2018, 131, 1790–1794. [Google Scholar] [CrossRef] [PubMed]
- Chao, K.C.; Chang, C.C.; Chiou, H.Y.; Chang, J.S. Serum ferritin is inversely correlated with testosterone in boys and young male adolescents: A cross-sectional study in taiwan. PLoS ONE 2015, 10, e0144238. [Google Scholar] [CrossRef] [PubMed]
- Gautier, A.; Laine, F.; Massart, C.; Sandret, L.; Piguel, X.; Brissot, P.; Balkau, B.; Deugnier, Y.; Bonnet, F. Liver iron overload is associated with elevated shbg concentration and moderate hypogonadotrophic hypogonadism in dysmetabolic men without genetic haemochromatosis. Eur. J. Endocrinol. 2011, 165, 339–343. [Google Scholar] [CrossRef] [PubMed]
- Liu, Z.; Ye, F.; Zhang, H.; Gao, Y.; Tan, A.; Zhang, S.; Xiao, Q.; Zhang, B.; Huang, L.; Ye, B. The association between the levels of serum ferritin and sex hormones in a large scale of Chinese male population. PLoS ONE 2013, 8, e75908. [Google Scholar] [CrossRef] [PubMed]
- Kyung, N.H.; Barkan, A.; Klibanski, A.; Badger, T.M.; McArthur, J.W.; Axelrod, L.; Beitins, I.Z. Effect of carbohydrate supplementation on reproductive hormones during fasting in men. J. Clin. Endocrinol. Metab. 1985, 60, 827–835. [Google Scholar] [CrossRef] [PubMed]
- Lado-Abeal, J.; Prieto, D.; Lorenzo, M.; Lojo, S.; Febrero, M.; Camarero, E.; Cabezas-Cerrato, J. Differences between men and women as regards the effects of protein-energy malnutrition on the hypothalamic-pituitary-gonadal axis. Nutrition 1999, 15, 351–358. [Google Scholar] [CrossRef]
- Santos, A.M.; Ferraz, M.R.; Teixeira, C.V.; Sampaio, F.J.; da Fonte Ramos, C. Effects of undernutrition on serum and testicular testosterone levels and sexual function in adult rats. Horm. Metab. Res. 2004, 36, 27–33. [Google Scholar] [PubMed]
- Nagata, C.; Takatsuka, N.; Kawakami, N.; Shimizu, H. Relationships between types of fat consumed and serum estrogen and androgen concentrations in japanese men. Nutr. Cancer 2000, 38, 163–167. [Google Scholar] [CrossRef] [PubMed]
- Lu Cui, Q.-B.G. Regulation of lipid metabolism in rat leydig cells testosterone synthesis and proliferation. Int. J. Clin. Exp. Med. 2016, 9, 8224–8229. [Google Scholar]
- Mínguez-Alarcón, L.; Chavarro, J.E.; Mendiola, J.; Roca, M.; Tanrikut, C.; Vioque, J.; Jorgensen, N.; Torres-Cantero, A.M. Fatty acid intake in relation to reproductive hormones and testicular volume among young healthy men. Asian J. Androl. 2017, 19, 184–190. [Google Scholar]
- Giltay, E.J.; Geleijnse, J.M.; Heijboer, A.C.; de Goede, J.; Oude Griep, L.M.; Blankenstein, M.A.; Kromhout, D. No effects of n-3 fatty acid supplementation on serum total testosterone levels in older men: The alpha omega trial. Int. J. Androl. 2012, 35, 680–687. [Google Scholar] [CrossRef] [PubMed]
- Langfort, J.L.; Zarzeczny, R.; Nazar, K.; Kaciuba-Uscilko, H. The effect of low-carbohydrate diet on the pattern of hormonal changes during incremental, graded exercise in young men. Int. J. Sport Nutr. Exerc. Metab. 2001, 11, 248–257. [Google Scholar] [CrossRef] [PubMed]
- Anderson, K.E.; Rosner, W.; Khan, M.S.; New, M.I.; Pang, S.Y.; Wissel, P.S.; Kappas, A. Diet-hormone interactions: Protein/carbohydrate ratio alters reciprocally the plasma levels of testosterone and cortisol and their respective binding globulins in man. Life Sci. 1987, 40, 1761–1768. [Google Scholar] [CrossRef]
- Mikulski, T.; Ziemba, A.; Nazar, K. Metabolic and hormonal responses to body carbohydrate store depletion followed by high or low carbohydrate meal in sedentary and physically active subjects. J. Physiol. Pharmacol. 2010, 61, 193–200. [Google Scholar] [PubMed]
- Huang, M.; Liu, J.; Lin, X.; Goto, A.; Song, Y.; Tinker, L.F.; Chan, K.K.; Liu, S. Relationship between dietary carbohydrates intake and circulating sex hormone-binding globulin levels in postmenopausal women. J. Diabetes 2018, 10, 467–477. [Google Scholar] [CrossRef] [PubMed]
- Sjaarda, L.A.; Schisterman, E.F.; Schliep, K.C.; Plowden, T.; Zarek, S.M.; Yeung, E.; Wactawski-Wende, J.; Mumford, S.L. Dietary carbohydrate intake does not impact insulin resistance or androgens in healthy, eumenorrheic women. J. Clin. Endocrinol. Metab. 2015, 100, 2979–2986. [Google Scholar] [CrossRef] [PubMed]
- Chang, J.S.; Lin, S.M.; Huang, T.C.; Chao, J.C.; Chen, Y.C.; Pan, W.H.; Bai, C.H. Serum ferritin and risk of the metabolic syndrome: A population-based study. Asia Pac. J. Clin. Nutr. 2013, 22, 400–407. [Google Scholar] [PubMed]
- World Health Organization. WHO Guidelines Approved by the guidelines Review Committee. In Use of Glycated Haemoglobin (hba1c) in the Diagnosis of Diabetes Mellitus: Abbreviated Report of a Who Consultation. World Health Organization. 2011. Available online: https://www.ncbi.nlm.nih.gov/pubmed/26158184 (accessed on 1 October 2018).
- Tan, C.-E.; Ma, S.; Wai, D.; Chew, S.-K.; Tai, E.-S. Can we apply the national cholesterol education program adult treatment panel definition of the metabolic syndrome to Asians? Diabetes Care 2004, 27, 1182–1186. [Google Scholar] [CrossRef] [PubMed]
- Paduch, D.A.; Brannigan, R.E.; Fuchs, E.F.; Kim, E.D.; Marmar, J.L.; Sandlow, J.I. The laboratory diagnosis of testosterone deficiency. Urology 2014, 83, 980–988. [Google Scholar] [CrossRef] [PubMed]
- Lee, M.-S.; Pen, W.-H.; Kai-Li, L.; Mei-Shu, Y. Reproducibility and validity of a Chinese food frequency questionnaire used in Taiwan. Asia Pac. J. Clin. Nutr. 2006, 15, 161. [Google Scholar] [PubMed]
- Ling, C.H.; de Craen, A.J.; Slagboom, P.E.; Gunn, D.A.; Stokkel, M.P.; Westendorp, R.G.; Maier, A.B. Accuracy of direct segmental multi-frequency bioimpedance analysis in the assessment of total body and segmental body composition in middle-aged adult population. Clin. Nutr. 2011, 30, 610–615. [Google Scholar] [CrossRef] [PubMed]
- Brambilla, D.J.; Matsumoto, A.M.; Araujo, A.B.; McKinlay, J.B. The effect of diurnal variation on clinical measurement of serum testosterone and other sex hormone levels in men. J. Clin. Endocrinol. Metab. 2009, 94, 907–913. [Google Scholar] [CrossRef] [PubMed]
- Lee, K.; Priezzhev, A.; Shin, S.; Yaya, F.; Meglinski, I. Characterization of shear stress preventing red blood cells aggregation at the individual cell level: The temperature dependence. Clin. Hemorheol. Microcirc. 2016, 64, 853–857. [Google Scholar] [CrossRef] [PubMed]
- Vermeulen, A.; Verdonck, L.; Kaufman, J.M. A critical evaluation of simple methods for the estimation of free testosterone in serum. J. Clin. Endocrinol. Metab. 1999, 84, 3666–3672. [Google Scholar] [CrossRef] [PubMed]
- Hoffmann, K.; Schulze, M.B.; Schienkiewitz, A.; Nöthlings, U.; Boeing, H. Application of a new statistical method to derive dietary patterns in nutritional epidemiology. Am. J. Epidemiol. 2004, 159, 935–944. [Google Scholar] [CrossRef] [PubMed]
- Marwitz, S.E.; Woodie, L.N.; Blythe, S.N. Western-style diet induces insulin insensitivity and hyperactivity in adolescent male rats. Physiol. Behav. 2015, 151, 147–154. [Google Scholar] [CrossRef] [PubMed]
- Eriksson, J.; Haring, R.; Grarup, N.; Vandenput, L.; Wallaschofski, H.; Lorentzen, E.; Hansen, T.; Mellstrom, D.; Pedersen, O.; Nauck, M.; et al. Causal relationship between obesity and serum testosterone status in men: A bi-directional mendelian randomization analysis. PLoS ONE 2017, 12, e0176277. [Google Scholar] [CrossRef] [PubMed]
- Varlamov, O. Western-style diet, sex steroids and metabolism. Biochim. Biophys. Acta Mol. Basis Dis. 2017, 1863, 1147–1155. [Google Scholar] [CrossRef] [PubMed]
- Lin, T.; Haskell, J.; Vinson, N.; Terracio, L. Characterization of insulin and insulin-like growth factor i receptors of purified leydig cells and their role in steroidogenesis in primary culture: A comparative study. Endocrinology 1986, 119, 1641–1647. [Google Scholar] [CrossRef] [PubMed]
- Pitteloud, N.; Hardin, M.; Dwyer, A.A.; Valassi, E.; Yialamas, M.; Elahi, D.; Hayes, F.J. Increasing insulin resistance is associated with a decrease in leydig cell testosterone secretion in men. J. Clin. Endocrinol. Metab. 2005, 90, 2636–2641. [Google Scholar] [CrossRef] [PubMed]
- Tena-Sempere, M.; Pinilla, L.; Gonzalez, L.C.; Dieguez, C.; Casanueva, F.F.; Aguilar, E. Leptin inhibits testosterone secretion from adult rat testis in vitro. J. Endocrinol. 1999, 161, 211–218. [Google Scholar] [CrossRef] [PubMed]
- Lin, P.; Chang, C.C.; Yuan, K.C.; Yeh, H.J.; Fang, S.U.; Cheng, T.; Teng, K.T.; Chao, K.C.; Tang, J.H.; Kao, W.Y.; et al. Red blood cell aggregation-associated dietary pattern predicts hyperlipidemia and metabolic syndrome. Nutrients 2018, 10. [Google Scholar] [CrossRef] [PubMed]
- Chang, T.Y.; Liu, K.L.; Chang, C.S.; Su, C.T.; Chen, S.H.; Lee, Y.C.; Chang, J.S. Ferric citrate supplementation reduces red-blood-cell aggregation and improves cd163+ macrophage-mediated hemoglobin metabolism in a rat model of high-fat-diet-induced obesity. Mol. Nutr. Food Res. 2018, 62. [Google Scholar] [CrossRef] [PubMed]
- Ziegler, O.; Guerci, B.; Muller, S.; Candiloros, H.; Mejean, L.; Donner, M.; Stoltz, J.F.; Drouin, P. Increased erythrocyte aggregation in insulin-dependent diabetes mellitus and its relationship to plasma factors: A multivariate analysis. Metabolism 1994, 43, 1182–1186. [Google Scholar] [CrossRef]
- Chong-Martinez, B.; Buchanan, T.A.; Wenby, R.B.; Meiselman, H.J. Decreased red blood cell aggregation subsequent to improved glycaemic control in type 2 diabetes mellitus. Diabet. Med. 2003, 20, 301–306. [Google Scholar] [CrossRef] [PubMed]
- Bachman, E.; Travison, T.G.; Basaria, S.; Davda, M.N.; Guo, W.; Li, M.; Connor Westfall, J.; Bae, H.; Gordeuk, V.; Bhasin, S. Testosterone induces erythrocytosis via increased erythropoietin and suppressed hepcidin: Evidence for a new erythropoietin/hemoglobin set point. J. Gerontol. A Biol. Sci. Med. Sci. 2014, 69, 725–735. [Google Scholar] [CrossRef] [PubMed]
- Rotker, K.L.; Alavian, M.; Nelson, B.; Baird, G.L.; Miner, M.M.; Sigman, M.; Hwang, K. Association of subcutaneous testosterone pellet therapy with developing secondary polycythemia. Asian J. Androl. 2018, 20, 195–199. [Google Scholar] [CrossRef] [PubMed]
- Kanias, T.; Sinchar, D.; Osei-Hwedieh, D.; Baust, J.J.; Jordan, A.; Zimring, J.C.; Waterman, H.R.; de Wolski, K.S.; Acker, J.P.; Gladwin, M.T. Testosterone-dependent sex differences in red blood cell hemolysis in storage, stress, and disease. Transfusion 2016, 56, 2571–2583. [Google Scholar] [CrossRef] [PubMed]


| Total Testosterone (ng/mL), Quartiles $ | p for Trend * | ||||
|---|---|---|---|---|---|
| Q1 (n = 32) | Q2 (n = 30) | Q3 (n = 32) | Q4 (n = 31) | ||
| Age (years) | 44.11 ± 9.89 | 42.85 ± 10.25 | 40.37 ± 12.79 | 37.27 ± 12.55 | 0.013 |
| Anemia (n, %) | 1 (3.1) | 1 (3.3) | 0 (0.0) | 1 (3.2) | 0.787 |
| TS <20% | 8 (25.0) | 6 (20.0) | 2 (6.3) | 1 (3.2) | 0.031 |
| Iron overload (n, %) | 8 (25.0) | 12 (40.0) | 7 (21.9) | 5 (16.1) | 0.174 |
| Central obesity (n, %) | 25 (78.1) | 15 (50.0) | 13 (40.6) | 8 (25.8) | <0.001 |
| Type 2 diabetes (n, %) | 4 (15.4) | 3 (13.6) | 2 (7.1) | 2 (6.9) | 0.653 |
| NAFLD (n, %) | 31 (96.9) | 29 (96.7) | 25 (78.1) | 16 (51.6) | <0.001 |
| MetS (n, %) | 12 (46.2) | 9 (42.9) | 1 (3.6) | 4 (13.8) | <0.001 |
| Hypogonadism (n, %) | 20 (62.5) | 0 (0.0) | 0 (0.0) | 0 (0.0) | <0.001 |
| Anthropometry | |||||
| W/H ratio | 0.93 ± 0.07 | 0.91 ± 0.04 | 0.89 ± 0.06 | 0.87 ± 0.06 | <0.001 |
| BMI (kg/m2) | 28.01 ± 4.10 | 26.55 ± 4.79 | 25.36 ± 3.62 | 23.03 ± 3.20 | <0.001 |
| Total body fat mass (%) | 27.34 ± 5.04 | 26.60 ± 4.48 | 24.94 ± 4.61 | 22.19 ± 4.82 | <0.001 |
| Skeleton muscle mass (%) | 66.91 ± 4.90 | 67.66 ± 4.43 | 69.32 ± 4.56 | 72.02 ± 4.78 | <0.001 |
| Visceral fat mass (%) | 4.40 ± 1.22 | 4.16 ± 1.23 | 3.76 ± 1.14 | 3.12 ± 1.00 | <0.001 |
| Glucose Biomarkers | |||||
| HOMA-IR | 3.09 ± 1.85 | 2.82 ± 1.68 | 1.60 ± 0.74 | 1.51 ± 0.62 | <0.001 |
| Fasting glucose (mg/dL) | 88.78 ± 12.95 | 96.60 ± 24.17 | 87.47 ± 8.53 | 87.52 ± 8.81 | 0.278 |
| HbA1c (%) | 5.89 ± 0.60 | 5.99 ± 0.97 | 5.73 ± 0.63 | 5.61 ± 0.49 | 0.048 |
| Insulin (µIU/mL) | 13.78 ± 6.96 | 11.58 ± 6.60 | 7.32 ± 3.13 | 6.93 ± 2.82 | <0.001 |
| Lipid Biomarkers | |||||
| Total cholesterol (mg/dL) | 192.69 ± 40.92 | 208.13 ± 39.75 | 201.22 ± 42.58 | 184.94 ± 26.41 | 0.322 |
| TG (mg/dL) | 173.47 ± 89.90 | 141.87 ± 56.90 | 133.22 ± 147.17 | 96.29 ± 60.22 | 0.002 |
| HDL-C (mg/dL) | 42.90 ± 7.44 | 48.51 ± 11.32 | 51.48 ± 13.49 | 54.93 ± 14.57 | <0.001 |
| LDL-C (mg/dL) | 119.97 ± 34.55 | 130.40 ± 36.94 | 122.03 ± 34.17 | 106.42 ± 26.84 | 0.068 |
| Iron-Related Biomarkers | |||||
| Hb (gm/dL) | 15.29 ± 1.76 | 15.48 ± 2.18 | 16.51 ± 2.68 | 15.54 ± 1.09 | 0.277 |
| Free Hb (µg/mL) | 173.59 ± 55.04 | 144.69 ± 59.00 | 157.40 ± 45.81 | 146.03 ± 41.47 | 0.129 |
| Fe (µg/dL) | 99.69 ± 38.27 | 109.83 ± 40.59 | 116.31 ± 32.65 | 115.90 ± 31.98 | 0.057 |
| Ferritin (ng/mL) | 226.75 ± 121.70 | 260.45 ± 192.24 | 219.12 ± 141.86 | 206.27 ± 160.15 | 0.409 |
| TS (%) | 28.76 ± 11.12 | 32.81 ± 13.21 | 35.26 ± 12.20 | 37.06 ± 10.35 | 0.004 |
| sCD163 (ng/mL) | 1050.01 ± 491.15 | 786.83 ± 338.61 | 805.03 ± 532.38 | 791.08 ± 533.29 | 0.090 |
| Hepcidin (ng/mL) | 188.13 ± 102.72 | 196.78 ± 103.90 | 198.31 ± 93.59 | 158.54 ± 84.68 | 0.286 |
| RBC deformability SS1/2 (Pa) | 2.28 ± 0.17 | 2.33 ± 0.19 | 2.17 ± 0.17 | 2.20 ± 0.17 | 0.014 |
| RBC aggregation CSS (mPa) | 312.26 ± 64.77 | 306.70 ± 64.13 | 260.40 ± 55.98 | 240.62 ± 44.06 | <0.001 |
| Sex Hormone Biomarkers | |||||
| Total T (ng/mL) | 2.57 ± 0.55 | 3.53 ± 0.19 | 4.44 ± 0.33 | 5.80 ± 0.81 | <0.001 |
| SHBG (nmol/L) | 23.55 ± 12.25 | 26.87 ± 7.76 | 34.49 ± 13.21 | 40.03 ± 14.42 | <0.001 |
| Bio-T (ng/mL) | 1.52 ± 0.44 | 1.93 ± 0.31 | 2.24 ± 0.52 | 2.80 ± 0.63 | <0.001 |
| Free-T (pg/mL) | 59.24 ± 16.64 | 79.10 ± 13.33 | 88.07 ± 18.31 | 109.85 ± 23.46 | <0.001 |
| Parameters | Univariate | Model 1 * | Model 2 # | Model 3 † | ||||
|---|---|---|---|---|---|---|---|---|
| β (95% CI) | p Value | β (95% CI) | p Value | β (95% CI) | p Value | β (95% CI) | p Value | |
| Log Age (years) | −1.463 (−2.201~−0.724) | <0.001 | −1.463 (−2.201~−0.724) | <0.001 | −1.098 (−1.903~−0.293) | 0.008 | −1.159 (−1.876~−0.442) | 0.002 |
| W/H ratio | −9.115 (−12.698~−5.531) | <0.001 | −7.623 (−11.519~−3.727) | <0.001 | −1.610 (−7.150~3.930) | 0.566 | ||
| Log BMI (kg/m2) | −3.789 (−5.057~−2.521) | <0.001 | −3.557 (−4.768~−2.346) | <0.001 | −3.557 (−4.768~−2.346) | <0.001 | −1.426 (−3.104~0.252) | 0.095 |
| Blood Biomarkers | ||||||||
| HOMA-IR | −0.403 (−0.552~−0.253) | <0.001 | −0.366 (−0.511~−0.222) | <0.001 | −0.188 (−0.360~−0.016) | 0.033 | ||
| Fasting glucose (mg/dL) | −0.006 (−0.020~0.007) | 0.366 | ||||||
| Log Insulin (µIU/mL) | −1.204 (−1.614~−0.794) | <0.001 | −1.156 (−1.543~−0.768) | <0.001 | −0.723 (−1.210~−0.235) | 0.004 | −0.713 (−1.259~−0.166) | 0.011 |
| Total cholesterol (mg/dL) | −0.003 (−0.009~0.003) | 0.311 | ||||||
| Log TG (mg/dL) | −0.882 (−1.249~−0.516) | <0.001 | −0.708 (−1.091~−0.324) | <0.001 | −0.345 (−0.732~0.041) | 0.080 | ||
| Log HDL (mg/dL) | 1.908 (0.998~2.817) | <0.001 | 1.736 (0.865~2.607) | <0.001 | 0.789 (−0.130~1.707) | 0.092 | ||
| LDL-C (mg/dL) | −0.006 (−0.013~0.001) | 0.059 | ||||||
| RBC (MIL/mm3) | 0.051 (−0.255~0.357) | 0.741 | ||||||
| Log Hb (gm/dL) | 1.350 (−0.412~3.111) | 0.132 | ||||||
| Free Hb (µg/mL) | −0.002 (−0.007~0.003) | 0.350 | ||||||
| Serum Fe (µg/dL) | 0.004 (−0.002~0.010) | 0.204 | ||||||
| Log Ferritin (ng/mL) | −0.259 (−0.597~0.079) | 0.132 | ||||||
| Log TS (%) | 0.820 (0.227~1.414) | 0.007 | 0.718 (0.151~1.286) | 0.014 | 0.577 (0.066~1.087) | 0.027 | 0.675 (0.076~1.274) | 0.048 |
| sCD163 (ng/mL) | −0.001 (−0.001~−0.000025) | 0.062 | ||||||
| Hepcidin (ng/mL) | −0.002 (−0.005~0.001) | 0.175 | ||||||
| Log RBC Deformability SS1/2 (Pa) | −3.137 (−6.300~0.025) | 0.052 | ||||||
| Log RBC Aggregation CSS (mPa) | −2.447 (−3.483~−1.411) | <0.001 | −2.223 (−3.239~−1.207) | <0.001 | −1.650 (−2.635~−0.665) | 0.001 | −1.025 (−2.043~−0.008) | 0.048 |
| Food Group | Explained Variation (%) | Factor Loading * |
|---|---|---|
| Bread and pastries | 13.62 | 0.35 |
| Dairy products | 7.37 | 0.26 |
| Desserts | 6.57 | 0.24 |
| Eating out | 6.30 | 0.24 |
| Homemade foods | 31.17 | −0.53 |
| Noodles | 10.53 | −0.31 |
| Dark green vegetables | 7.27 | −0.25 |
| Total explained variation (%): | 59.53 |
| Dietary Pattern Scores, Quartile $ | p for Trend * | ||||
|---|---|---|---|---|---|
| Q1 (n = 52) | Q2 (n = 53) | Q3 (n = 53) | Q4 (n = 53) | ||
| Age (years) | 37.59 ± 11.81 | 40.23 ± 11.46 | 41.78 ± 12.24 | 45.63 ± 11.24 | 0.014 |
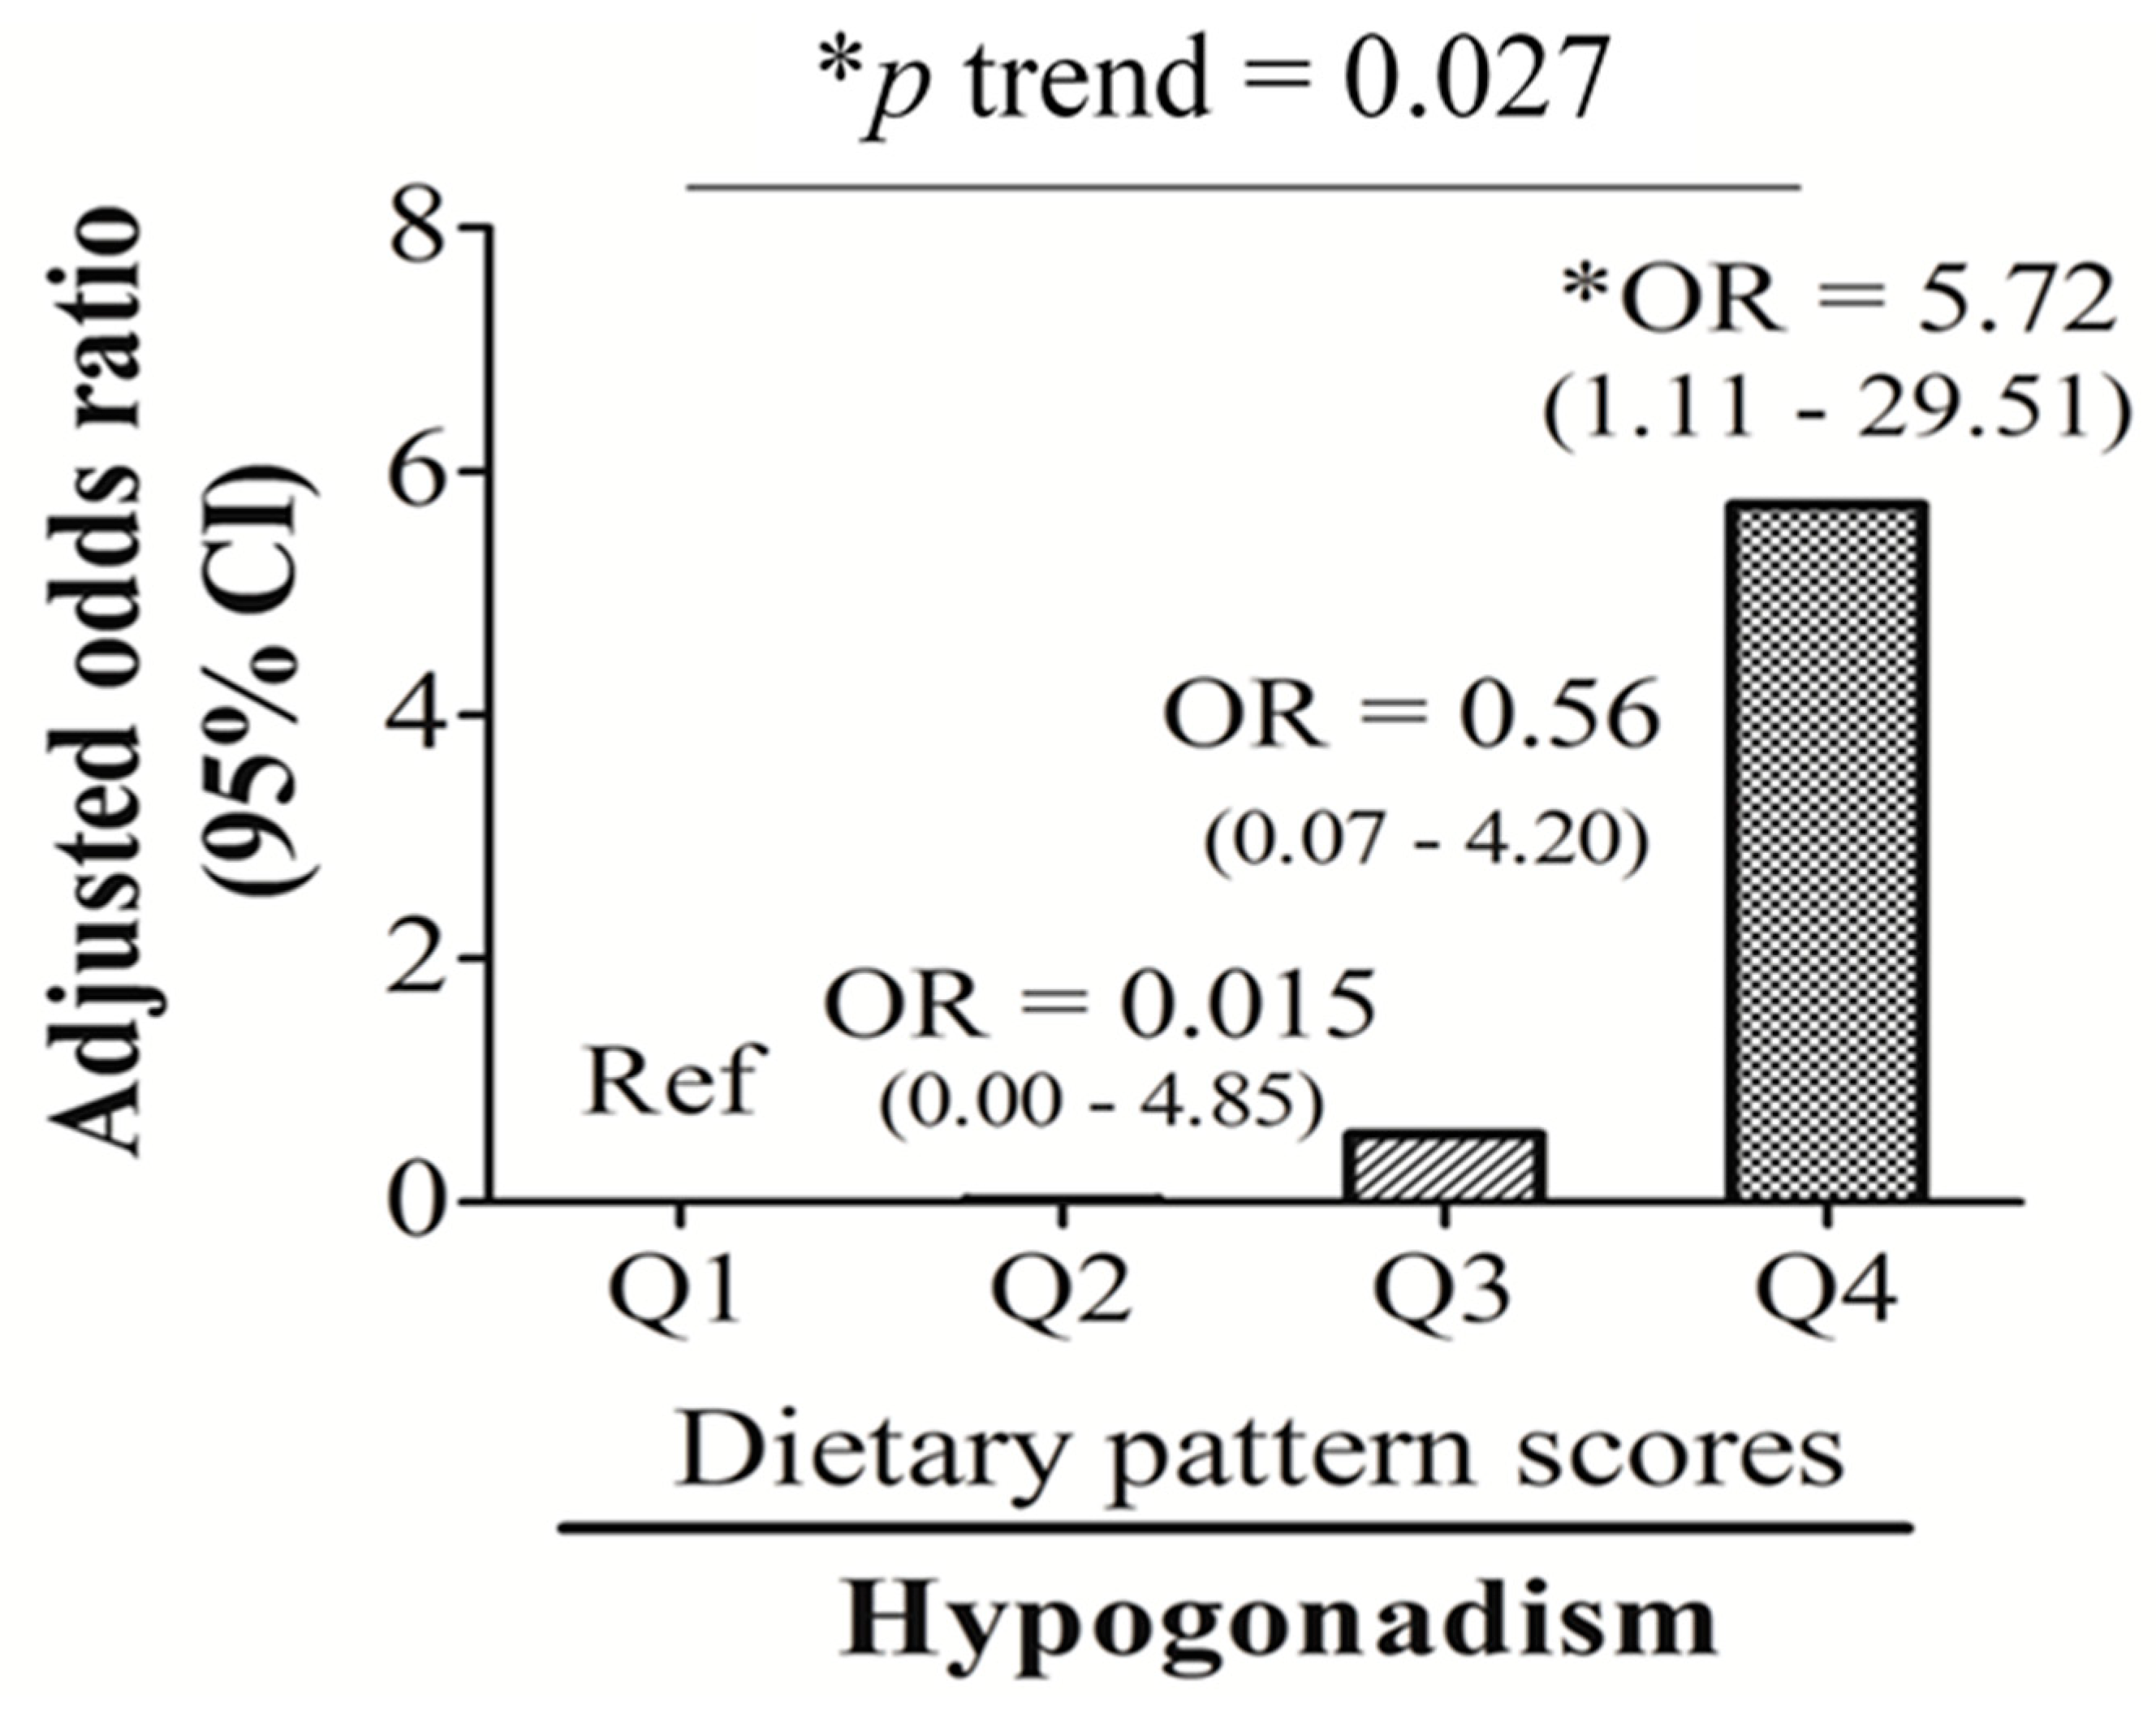
| Hypogonadism (n, %) | 3 (11.5) | 1 (3.7) | 4 (14.8) | 10 (38.5) | 0.006 |
| Iron overload (n, %) | 2 (8.0) | 7 (25.9) | 8 (29.6) | 7 (28.0) | 0.229 |
| NAFLD (n, %) | 17 (65.4) | 18 (66.7) | 26 (96.3) | 23 (88.5) | 0.008 |
| Type 2 diabetes (n, %) | 1 (3.8) | 1 (3.7) | 4 (14.8) | 4 (15.4) | 0.264 |
| MetS (n, %) | 2 (8.0) | 4 (14.8) | 9 (33.3) | 11 (44.0) | 0.011 |
| Anthropometry | |||||
| W/H ratio | 0.87 ± 0.05 | 0.90 ± 0.07 | 0.92 ± 0.05 | 0.91 ± 0.07 | 0.007 |
| BMI (kg/m2) | 23.41 ± 2.22 | 24.77 ± 4.58 | 26.65 ± 3.51 | 26.91 ± 5.22 | 0.001 |
| Total body fat mass (%) | 22.98 ± 4.13 | 23.72 ± 5.02 | 26.44 ± 4.28 | 26.95 ± 6.08 | 0.001 |
| Skeleton muscle mass (%) | 71.48 ± 4.40 | 70.51 ± 4.99 | 67.81 ± 4.13 | 67.32 ± 6.01 | 0.001 |
| Visceral fat mass (%) | 3.25 ± 0.88 | 3.52 ± 1.18 | 4.11 ± 0.99 | 4.35 ± 1.57 | <0.001 |
| Glucose Biomarkers | |||||
| Fasting glucose (mg/dL) | 86.64 ± 6.67 | 87.48 ± 6.71 | 94.93 ± 26.10 | 93.92 ± 15.58 | 0.043 |
| HbA1c (%) | 5.56 ± 0.44 | 5.69 ± 0.60 | 6.10 ± 1.03 | 5.98 ± 0.68 | 0.012 |
| Insulin (µIU/mL) | 7.28 ± 3.47 | 7.01 ± 2.84 | 11.12 ± 5.32 | 13.42 ± 7.86 | <0.001 |
| HOMA-IR | 1.54 ± 0.69 | 1.52 ± 0.65 | 2.53 ± 1.14 | 3.20 ± 2.16 | <0.001 |
| Lipid Biomarkers | |||||
| Total cholesterol (mg/dL) | 188.76 ± 26.96 | 203.96 ± 30.80 | 200.59 ± 48.19 | 192.88 ± 49.12 | 0.802 |
| TG (mg/dL) | 85.64 ± 40.81 | 113.33 ± 54.36 | 147.44 ± 59.33 | 160.84 ± 98.34 | <0.001 |
| HDL-C (mg/dL) | 52.60 ± 11.17 | 53.51 ± 12.62 | 47.40 ± 10.79 | 46.79 ± 15.43 | 0.038 |
| LDL-C (mg/dL) | 113.92 ± 29.42 | 127.07 ± 29.63 | 127.89 ± 41.56 | 115.20 ± 37.50 | 0.882 |
| Iron Biomarkers | |||||
| RBC (MIL/mm3) | 5.32 ± 0.80 | 5.25 ± 0.71 | 5.38 ± 0.80 | 5.23 ± 0.82 | 0.855 |
| Hb (gm/dL) | 15.76 ± 1.97 | 15.91 ± 2.22 | 16.04 ± 2.19 | 15.50 ± 2.33 | 0.736 |
| Free Hb (µg/mL) | 149.03 ± 47.10 | 147.82 ± 48.55 | 174.95 ± 53.21 | 161.42 ± 42.20 | 0.158 |
| Fe (µg/dL) | 108.92 ± 34.95 | 119.48 ± 29.80 | 109.00 ± 38.24 | 111.08 ± 33.85 | 0.896 |
| Ferritin (ng/mL) | 150.09 ± 81.65 | 248.26 ± 154.48 | 258.70 ± 191.44 | 237.62 ± 170.30 | 0.052 |
| TS (%) | 33.14 ± 10.75 | 36.46 ± 10.48 | 30.61 ± 12.41 | 32.64 ± 11.29 | 0.466 |
| sCD163 (ng/mL) | 822.54 ± 523.70 | 670.10 ± 239.59 | 940.25 ± 655.14 | 959.94 ± 437.00 | 0.144 |
| Hepcidin (ng/mL) | 154.22 ± 74.12 | 175.59 ± 84.87 | 218.43 ± 112.81 | 189.68 ± 102.76 | 0.081 |
| RBC deformability SS1/2 (Pa) | 2.19 ± 0.18 | 2.21 ± 0.16 | 2.25 ± 0.19 | 2.28 ± 0.19 | 0.079 |
| RBC aggregation CSS (mPa) | 246.59 ± 46.42 | 260.89 ± 52.52 | 298.89 ± 68.71 | 299.50 ± 70.07 | 0.001 |
| Sex Hormone Biomarkers | |||||
| Total T (ng/mL) | 4.83 ± 1.23 | 4.73 ± 1.20 | 3.56 ± 0.83 | 3.54 ± 1.36 | <0.001 |
| Free T (pg/mL) | 96.35 ± 21.27 | 91.31 ± 25.44 | 79.96 ± 20.97 | 67.13 ± 23.91 | <0.001 |
| SHBG (nmol/L) | 32.98 ± 12.64 | 36.68 ± 15.04 | 25.03 ± 6.73 | 35.22 ± 17.21 | 0.683 |
| Dietary Pattern Scores, Quartiles $ | p for Trend | |||||||
|---|---|---|---|---|---|---|---|---|
| Quartile 1 | Quartile 2 | p Value | Quartile 3 | p Value | Quartile 4 | p Value | ||
| Univariate | Ref | −0.105 (−0.784−0.573) | 0.756 | −1.276 (−1.857–−0.695) | <0.001 | −1.297 (−2.035–−0.558) | 0.001 | <0.001 |
| Model 1 * | Ref | −0.044 (−0.711−0.624) | 0.896 | −1.198 (−1.778–−0.619) | <0.001 | −1.192 (−1.979–−0.406) | 0.004 | <0.001 |
| Model 2 # | Ref | 0.155 (−0.464−0.773) | 0.618 | −0.852 (−1.500–−0.205) | 0.011 | −0.872 (−1.722–−0.023) | 0.044 | 0.004 |
| Dietary Pattern Scores $ | p for Trend | |||||||
|---|---|---|---|---|---|---|---|---|
| Q1 | Q2 | p Value | Q3 | p Value | Q4 | p Value | ||
| Univariate | ||||||||
| BFM (%) | Ref | 0.741 (−1.800~3.283) | 0.561 | 3.456 (1.136~5.776) | 0.004 | 3.969 (1.074~6.864) | 0.008 | 0.001 |
| SMM (%) | Ref | −0.973 (−3.573~1.626) | 0.456 | −3.673 (−6.027~−1.320) | 0.003 | −4.162 (−7.095~−1.228) | 0.006 | 0.001 |
| VFM (%) | Ref | 0.272 (−0.304~0.849) | 0.348 | 0.862 (0.339~1.384) | 0.002 | 1.098 (0.384~1.812) | 0.003 | <0.001 |
| SFM (%) | Ref | 0.477 (−1.496~2.450) | 0.630 | 2.685 (0.829~4.541) | 0.005 | 8.497 (−2.753~19.747) | 0.135 | 0.030 |
| Age adjusted | ||||||||
| BFM (%) | Ref | 0.540 (−1.996~3.077) | 0.671 | 3.475 (1.094~5.855) | 0.005 | 3.593 (0.504~6.681) | 0.024 | 0.002 |
| SMM (%) | Ref | −0.763 (−3.356~1.829) | 0.557 | −3.678 (−6.093~−1.262) | 0.004 | −3.756 (−6.883~−0.629) | 0.020 | 0.002 |
| VFM (%) | Ref | 0.211 (−0.356~0.778) | 0.457 | 0.841 (0.307~1.375) | 0.003 | 0.974 (0.214~1.734) | 0.013 | 0.001 |
| SFM (%) | Ref | 0.337 (−1.640~2.314) | 0.733 | 2.708 (0.810~4.607) | 0.006 | 8.637 (−3.453~20.727) | 0.157 | 0.035 |
© 2018 by the authors. Licensee MDPI, Basel, Switzerland. This article is an open access article distributed under the terms and conditions of the Creative Commons Attribution (CC BY) license (http://creativecommons.org/licenses/by/4.0/).
Share and Cite
Hu, T.-Y.; Chen, Y.C.; Lin, P.; Shih, C.-K.; Bai, C.-H.; Yuan, K.-C.; Lee, S.-Y.; Chang, J.-S. Testosterone-Associated Dietary Pattern Predicts Low Testosterone Levels and Hypogonadism. Nutrients 2018, 10, 1786. https://doi.org/10.3390/nu10111786
Hu T-Y, Chen YC, Lin P, Shih C-K, Bai C-H, Yuan K-C, Lee S-Y, Chang J-S. Testosterone-Associated Dietary Pattern Predicts Low Testosterone Levels and Hypogonadism. Nutrients. 2018; 10(11):1786. https://doi.org/10.3390/nu10111786
Chicago/Turabian StyleHu, Tzu-Yu, Yi Chun Chen, Pei Lin, Chun-Kuang Shih, Chyi-Huey Bai, Kuo-Ching Yuan, Shin-Yng Lee, and Jung-Su Chang. 2018. "Testosterone-Associated Dietary Pattern Predicts Low Testosterone Levels and Hypogonadism" Nutrients 10, no. 11: 1786. https://doi.org/10.3390/nu10111786
APA StyleHu, T.-Y., Chen, Y. C., Lin, P., Shih, C.-K., Bai, C.-H., Yuan, K.-C., Lee, S.-Y., & Chang, J.-S. (2018). Testosterone-Associated Dietary Pattern Predicts Low Testosterone Levels and Hypogonadism. Nutrients, 10(11), 1786. https://doi.org/10.3390/nu10111786