Examining Associations between Body Mass Index in 18–25 Year-Olds and Energy Intake from Alcohol: Findings from the Health Survey for England and the Scottish Health Survey

 ,
,
Abstract
:1. Introduction
2. Materials and Methods
2.1. Data
2.2. Measures
2.3. Statistical Analyses
3. Results
3.1. Sample Characteristics
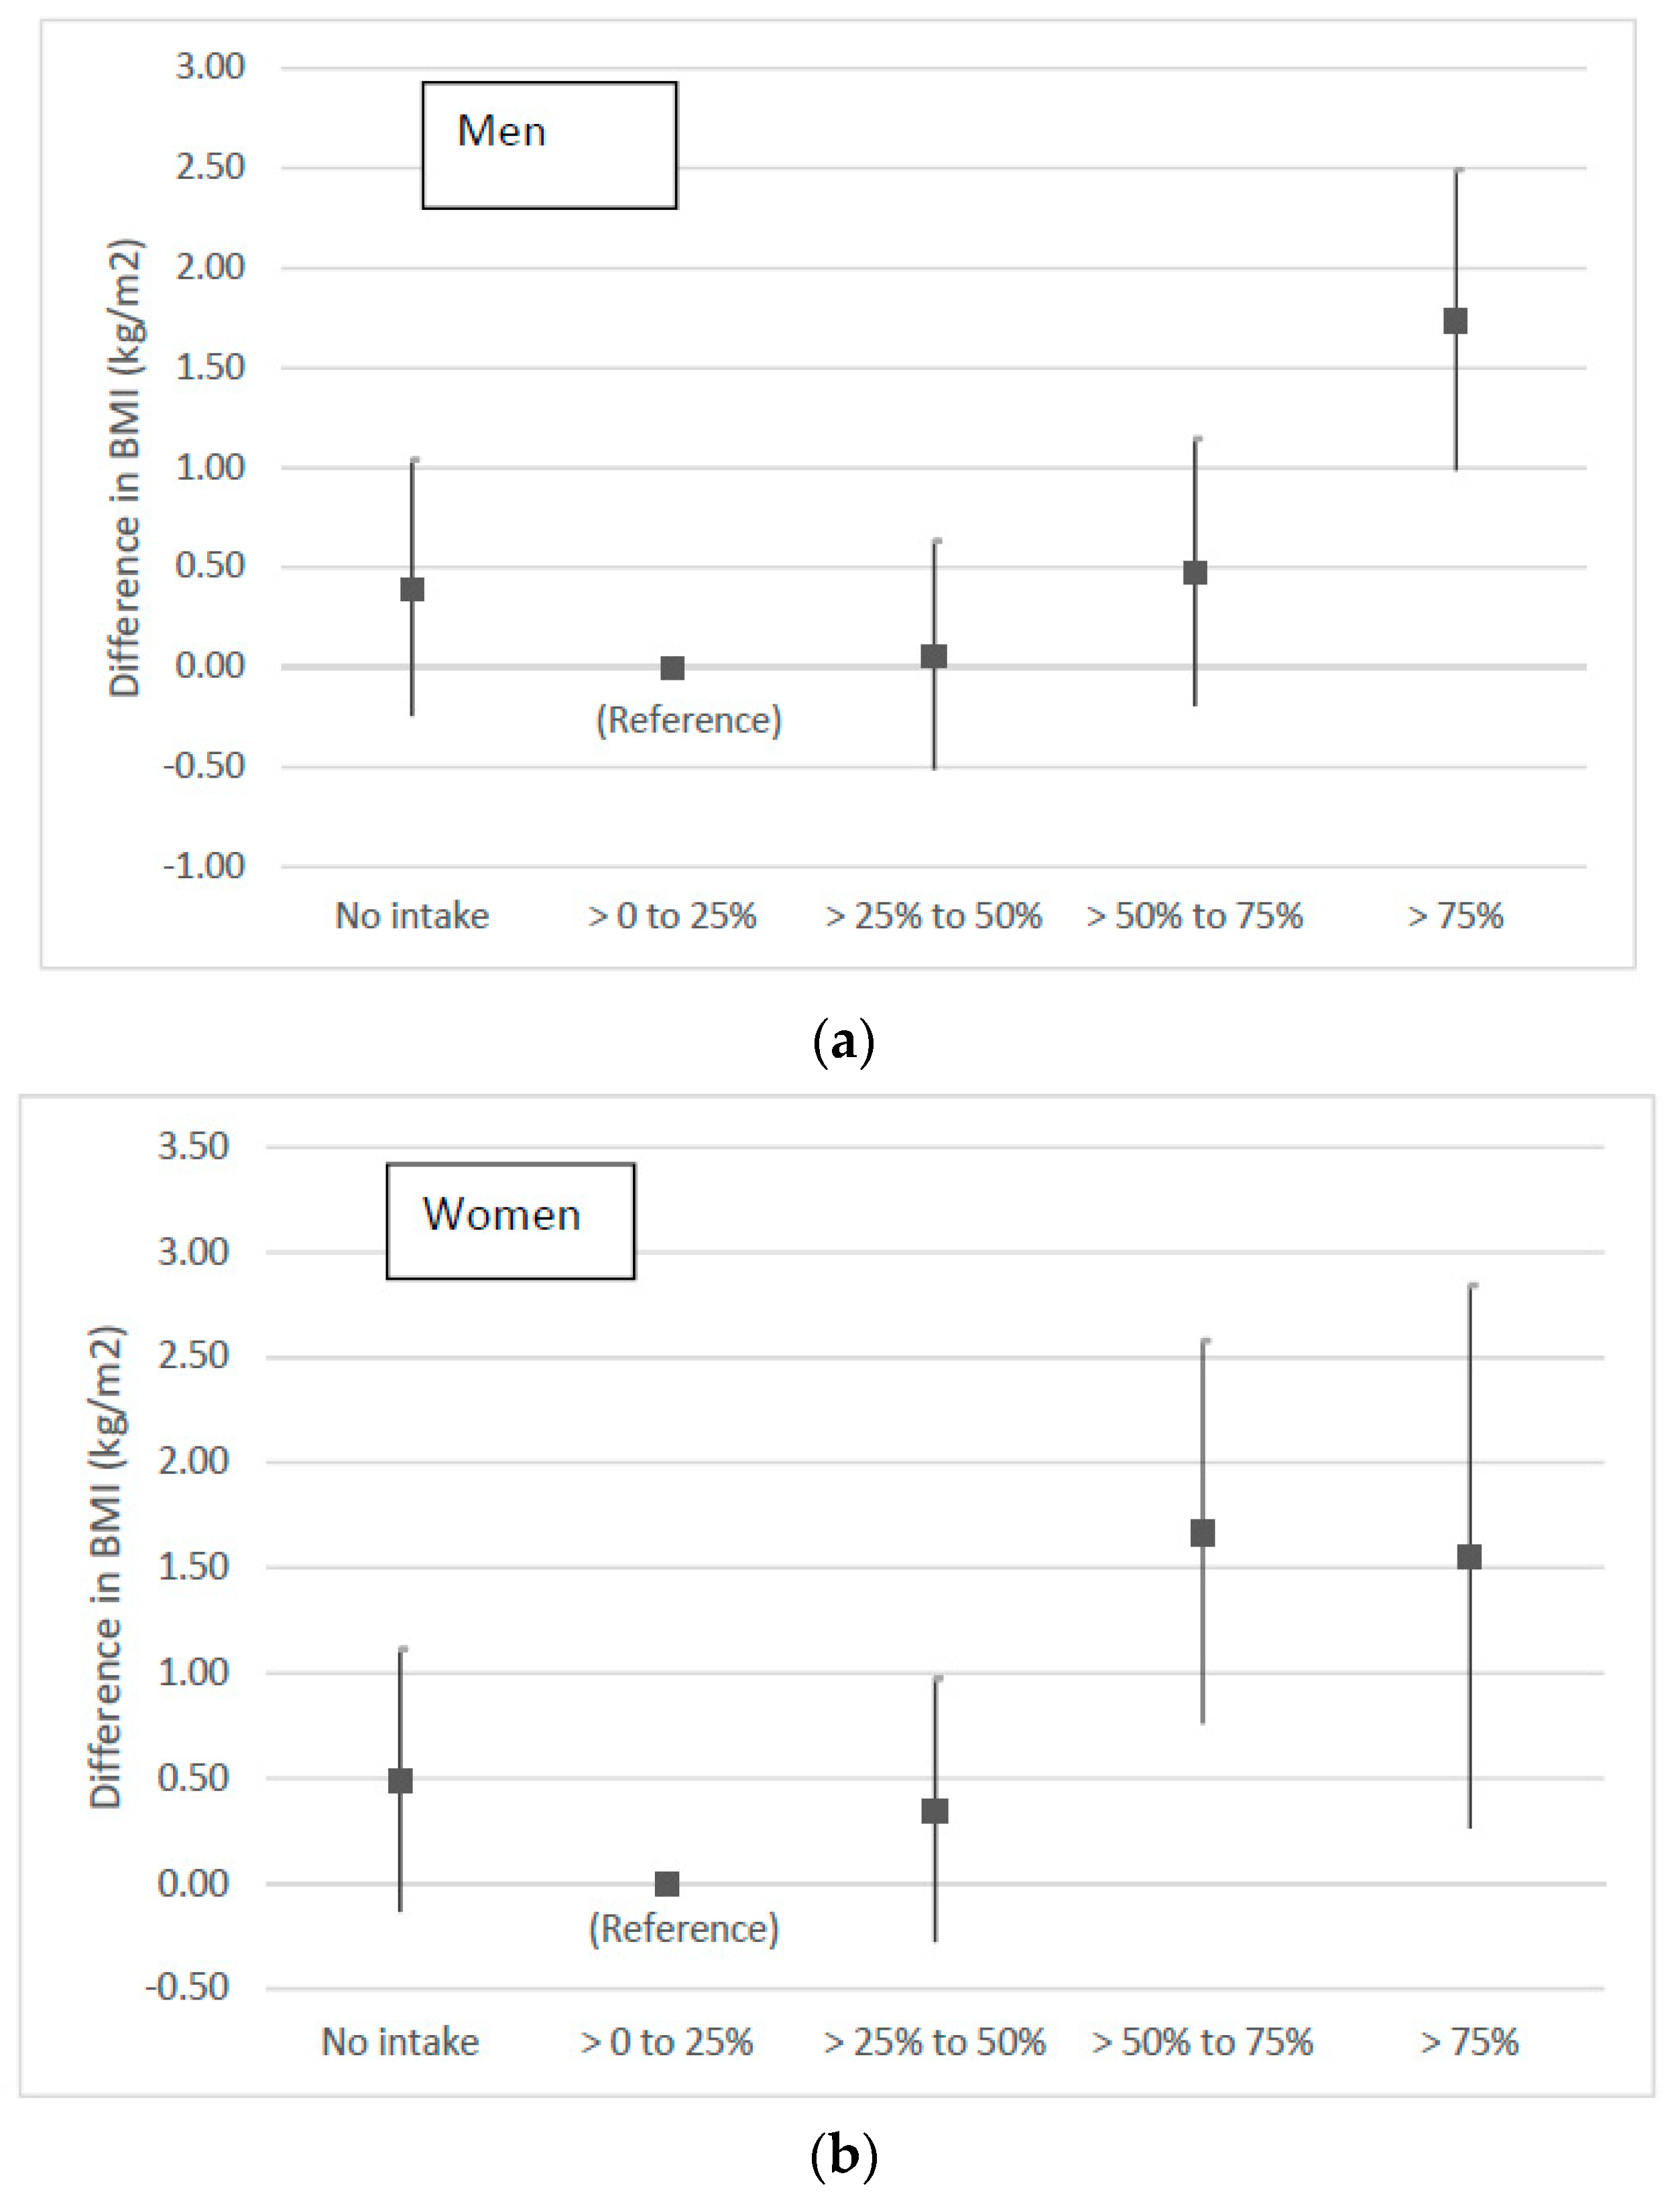
3.2. Relationship between Energy from Alcohol and BMI
4. Discussion
Supplementary Materials
Author Contributions
Funding
Acknowledgments
Conflicts of Interest
Abbreviations
| BMI | Body Mass Index |
| RDA | Recommended Daily Allowance |
| RTDs | Ready-to drink pre-mixed alcoholic beverage such as “alcopops” |
| HSE | Health Survey for England |
| SHeS | Scottish Health Survey |
| FFQ | Food Frequency Questionnaire |
| IQR | Interquartile range |
| SD | Standard Deviation |
| g/day | Grams per day |
| CI | Confidence Interval |
| Kcal | Kilocalories |
| % RDA Energy | Percentage of recommended daily allowance for energy from alcoholic beverages (excluding mixers) on the heaviest drinking day in the last seven days |
References
- NCD Risk Factor Collaboration (NCD-RisC). Worldwide trends in body-mass index, underweight, overweight, and obesity from 1975 to 2016: A pooled analysis of 2416 population-based measurement studies in 1289 million children, adolescents, and adults. Lancet 2017, 390, 2627–2642. [Google Scholar] [CrossRef]
- Guh, D.P.; Zhang, W.; Bansback, N.; Amarsi, Z.; Birmingham, C.L.; Anis, A.H. The incidence of co-morbidities related to obesity and overweight: A systematic review and meta-analysis. BMC Public Health 2009, 9. [Google Scholar] [CrossRef] [PubMed]
- Renehan, A.G.; Tyson, M.; Egger, M.; Heller, R.F.; Zwahlen, M. Body-mass index and incidence of cancer: A systematic review and meta-analysis of prospective observational studies. Lancet 2008, 371, 569–578. [Google Scholar] [CrossRef]
- Skinner, A.C.; Perrin, E.M.; Moss, L.A.; Skelton, J.A. Cardiometabolic risks and severity of obesity in children and young adults. N. Engl. J. Med. 2015, 373, 1307–1317. [Google Scholar] [CrossRef] [PubMed]
- Conolly, A.; Saunders, C. Adult overweight and obesity. In Health Survey for England 2016; Health and Social Care Information Centre, Ed.; National Statistics: London, UK, 2017. [Google Scholar]
- Allman-Farinelli, M.A.; Chey, T.; Bauman, A.E.; Gill, T.; James, W.P.T. Age, period and birth cohort effects on prevalence of overweight and obesity in Australian adults from 1990 to 2000. Eur. J. Clin. Nutr. 2007, 62, 898–907. [Google Scholar] [CrossRef] [PubMed] [Green Version]
- Gordon-Larsen, P.; The, N.S.; Adair, L.S. Longitudinal trends in obesity in the United States from adolescence to the third decade of life. Obesity 2010, 18, 1801–1804. [Google Scholar] [CrossRef] [PubMed]
- Alcácera, M.A.; Marques-Lopes, I.; Fajó-Pascual, M.; Puzo, J.; Blas Pérez, J.; Bes-Rastrollo, M.; Martínez-González, M.A. Lifestyle factors associated with BMI in a Spanish graduate population: The Sun study. Obes. Facts 2008, 1, 80–87. [Google Scholar] [PubMed]
- Suter, P.M.; Häsler, E.; Vetter, W. Effects of alcohol on energy metabolism and body weight regulation: Is alcohol a risk factor for obesity? Nutr. Rev. 1997, 55, 157–171. [Google Scholar] [CrossRef] [PubMed]
- Suter, P.M. Is alcohol consumption a risk factor for weight gain and obesity? Crit. Rev. Clin. Lab. Sci. 2005, 42, 197–227. [Google Scholar] [CrossRef] [PubMed]
- Yeomans, M.R. Alcohol, appetite and energy balance: Is alcohol intake a risk factor for obesity? Physiol. Behav. 2010, 100, 82–89. [Google Scholar] [CrossRef] [PubMed]
- Casbon, T.S.; Curtin, J.J.; Lang, A.; Patrick, C.J. Deleterious effects of alcohol intoxication: Diminished cognitive control and its behavioral consequences. J. Abnorm. Psychol. 2003, 112, 476–487. [Google Scholar] [CrossRef] [PubMed]
- Leibowitz, S.F. Overconsumption of dietary fat and alcohol: Mechanisms involving lipids and hypothalamic peptides. Physiol. Behav. 2007, 91, 513–521. [Google Scholar] [CrossRef] [PubMed] [Green Version]
- Molarius, A.; Seidell, J.C. Differences in the association between smoking and relative body weight by level of education. Int. J. Obes. 1997, 21, 189–196. [Google Scholar] [CrossRef] [Green Version]
- Breslow, R.A.; Smothers, B.A. Drinking patterns and body mass index in never smokers: National health interview survey, 1997–2001. Am. J. Epidemiol. 2005, 161, 368–376. [Google Scholar] [CrossRef] [PubMed]
- O’Donovan, G.; Stamatakis, E.; Hamer, M. Associations between alcohol and obesity in more than 100,000 adults in England and Scotland. Br. J. Nutr. 2018, 119, 222–227. [Google Scholar] [CrossRef] [PubMed]
- Rohrer, J.E.; Rohland, B.M.; Denison, A.; Way, A. Frequency of alcohol use and obesity in community medicine patients. BMC Fam. Pract. 2005, 6. [Google Scholar] [CrossRef] [PubMed] [Green Version]
- Sherwood, N.E.; Jeffery, R.W.; French, S.A.; Hannan, P.J.; Murray, D.M. Predictors of weight gain in the pound of prevention study. Int. J. Obes. 2000, 24, 395–403. [Google Scholar] [CrossRef]
- Traversy, G.; Chaput, J.P. Alcohol consumption and obesity: An update. Curr. Obes. Rep. 2015, 4, 122–130. [Google Scholar] [CrossRef] [PubMed]
- Lahti-Koski, M.; Pietinen, P.; Heliovaara, M.; Vartiainen, E. Associations of body mass index and obesity with physical activity, food choices, alcohol intake, and smoking in the 1982–1997 finrisk studies. Am. J. Clin. Nutr. 2002, 75, 809–817. [Google Scholar] [CrossRef] [PubMed]
- Lukasiewicz, E.; Mennen, L.I.; Bertrais, S.; Arnault, N.; Preziosi, P.; Galan, P.; Hercberg, S. Alcohol intake in relation to body mass index and waist-to-hip ratio: The importance of type of alcoholic beverage. Public Health Nutr. 2007, 8, 315–320. [Google Scholar] [CrossRef]
- Arif, A.A.; Rohrer, J.E. Patterns of alcohol drinking and its association with obesity: Data from the third national health and nutrition examination survey, 1988–1994. BMC Public Health 2005, 5. [Google Scholar] [CrossRef] [PubMed]
- Bendsen, N.T.; Christensen, R.; Bartels, E.M.; Kok, F.J.; Sierksma, A.; Raben, A.; Astrup, A. Is beer consumption related to measures of abdominal and general obesity? A systematic review and meta-analysis. Nutr. Rev. 2013, 71, 67–87. [Google Scholar] [CrossRef] [PubMed]
- Alcoholic Drinks Review UK. Available online: http://academic.mintel.com/display/882593/ (accessed on 14 March 2018).
- Chen, C.M.; Dufour, M.C.; Yi, H. Alcohol consumption among young adults ages 18–24 in the United States: Results from the 2001–2002 NESARC survey. Alcohol Res. Health 2004/2005, 28, 269–280. [Google Scholar]
- Department of Health and Human Services. 10th Special Report to the U.S. Congress on Alcohol and Health. Highlights from Current Research; Department of Health and Human Services: Washington, DC, USA, 2000.
- Craigie, A.M.; Matthews, J.N.; Rugg-Gunn, A.J.; Lake, A.A.; Mathers, J.C.; Adamson, A.J. Raised adolescent body mass index predicts the development of adiposity and a central distribution of body fat in adulthood: A longitudinal study. Obes. Facts 2009, 2, 150–156. [Google Scholar] [CrossRef] [PubMed]
- Rossow, I.; Kuntsche, E. Early onset of drinking and risk of heavy drinking in young adulthood—A 13-year prospective study. Alcohol. Clin. Exp. Res. 2013, 37. [Google Scholar] [CrossRef] [PubMed]
- Corbett, J.; Given, L.; Gray, L.; Leyland, A.; MacGregor, A.; Marryat, L.; Miller, M.; Reid, S. The Scottish Health Survey 2008. In The Scottish Health Survey 2008; Bromley, C., Bradshaw, P., Given, L., Eds.; Technical Report; The Scottish Government: Edinburgh, UK, 2009; Volume 2. [Google Scholar]
- Health Survey for England 2014. Methods and Documentation. Volume 2. Available online: https://files.digital.nhs.uk/publicationimport/pub19xxx/pub19295/hse2014-methods-and-docs.pdf (accessed on 25 July 2018).
- Christie, S.; Day, J.; Doig, M.; Hampson, A.; Hinchliffe, S.; Martin, S.; Rutherford, L. The Scottish Health Survey 2014. In The Scottish Health Survey 2014; Bromley, C., Campbell-Jack, D., Hinchliffe, S., Eds.; Technical Report; The Scottish Government: Edinburgh, UK, 2009; Volume 2. [Google Scholar]
- Alcoholic Drinks and Units. Available online: https://www.drinkaware.co.uk/alcohol-facts/alcoholic-drinks-units/ (accessed on 3 May 2017).
- Shelton, N.J.; Knott, C.S. Association between alcohol calorie intake and overweight and obesity in English adults. Am. J. Public Health 2014, 104, 629–631. [Google Scholar] [CrossRef] [PubMed]
- Understanding Calories. Available online: https://www.nhs.uk/live-well/healthy-weight/understanding-calories/ (accessed on 12 September 2018).
- HSCIC. Health Survey for England 2013. Trend Tables; Health and Social Care Information Centre: London, UK, 2014. [Google Scholar]
- Williamson, D.F.; Madans, J.; Anda, R.F.; Kleinman, J.C.; Giovino, G.A.; Byers, T. Smoking cessation and severity of weight gain in a national cohort. N. Engl. J. Med. 1991, 324, 739–745. [Google Scholar] [CrossRef] [PubMed]
- StataCorp. Stata Statistical Software: Release 15, StataCorp LLC: College Station, TX, USA, 2017.
- Männistö, S.; Uusitalo, K.; Roos, E.; Fogelholm, M.; Pietinen, P. Alcohol beverage drinking, diet and body mass index in a cross-sectional survey. Eur. J. Clin. Nutr. 1997, 51, 326–332. [Google Scholar] [CrossRef] [PubMed] [Green Version]
- Colditz, G.A.; Giovannucci, E.; Rimm, E.B.; Stampfer, M.J.; Rosner, B.; Speizer, F.E.; Gordis, E.; Willett, W.C. Alcohol intake in relation to diet and obesity in women and men. Am. J. Clin. Nutr. 1991, 54, 49–55. [Google Scholar] [CrossRef] [PubMed]
- Burke, V.; Puddey, I.B.; Beilin, L.J. Mortality associated with wines, beers, and spirits. Australian data suggest that choice of beverage relates to lifestyle and personality. Br. Med. J. 1995, 311, 1166. [Google Scholar] [CrossRef]
- Johansen, D.; Friis, K.; Skovenborg, E.; Grønbæk, M. Food buying habits of people who buy wine or beer: Cross sectional study. BMJ 2006, 332. [Google Scholar] [CrossRef] [PubMed] [Green Version]
- Ruidavets, J.-B.; Bataille, V.; Dallongeville, J.; Simon, C.; Bingham, A.; Amouyel, P.; Arveiler, D.; Ducimetière, P.; Ferrières, J. Alcohol intake and diet in france, the prominent role of lifestyle. Eur. Heart J. 2004, 25, 1153–1162. [Google Scholar] [CrossRef] [PubMed]
- Cederbaum, A.I. Alcohol metabolism. Clin. Liver Dis. 2012, 16, 667–685. [Google Scholar] [CrossRef] [PubMed]
- Meyer, R.; Suter, P.M.; Vetter, W. Alcohol—Risk factor for overweight. Praxis 1999, 88, 1555–1561. [Google Scholar] [PubMed]
- Livingston, M.; Callinan, S. Underreporting in alcohol surveys: Whose drinking is underestimated? J. Stud. Alcohol Drugs 2015, 76, 158–164. [Google Scholar] [CrossRef] [PubMed]
- Wannamethee, S.G.; Shaper, A.G. Alcohol, body weight, and weight gain in middle-aged men. Am. J. Clin. Nutr. 2003, 77, 1312–1317. [Google Scholar] [CrossRef] [PubMed]
- Dir, A.L.; Karyadi, K.; Cyders, M.A. The uniqueness of negative urgency as a common risk factor for self-harm behaviors, alcohol consumption, and eating problems. Addict. Behav. 2013, 38, 2158–2162. [Google Scholar] [CrossRef] [PubMed]


| Drink Type | Typical Volume (mL) in One Serving | Typical Kcal/mL | Typical Kcal in One Serving | % Contribution of One Serving to RDA Men | % Contribution of One Serving to RDA Women |
|---|---|---|---|---|---|
| Normal beer (≤5% alcohol) | |||||
| Half pints | 284 | 0.32 | 91 | 3.6 | 4.6 |
| Small cans/bottles | 440 | 0.32 | 141 | 5.6 | 7.1 |
| Large cans/bottles | 500 | 0.32 | 160 | 6.4 | 8.0 |
| Bottles | 330 | 0.32 | 106 | 4.2 | 5.3 |
| Strong beer (≥9% alcohol) | |||||
| Half pints | 284 | 0.74 | 210 | 8.4 | 10.5 |
| Small cans/bottles | 440 | 0.74 | 326 | 13.0 | 16.3 |
| Large cans/bottles | 500 | 0.74 | 370 | 14.8 | 18.5 |
| Bottles | 330 | 0.74 | 244 | 9.8 | 12.2 |
| Spirits | |||||
| Standard measure | 25 | 2.44 | 61 | 2.4 | 3.1 |
| Sherry | |||||
| Standard measure | 50 | 1.26 | 63 | 2.5 | 3.2 |
| Wine | |||||
| Small glass | 125 | 0.91 | 114 | 4.6 | 5.7 |
| Medium glass | 175 | 0.91 | 159 | 6.4 | 8.0 |
| Large glass | 250 | 0.91 | 228 | 9.1 | 11.4 |
| Alcopops | |||||
| Small cans/bottles | 275 | 0.62 | 171 | 6.8 | 8.6 |
| None (0%) | Low (>0–25%) | Medium (>25–50%) | High (>50–75%) | Very High (>75%) | Total | |
|---|---|---|---|---|---|---|
| N | 3795 | 2505 | 1397 | 635 | 473 | 8805 |
| Alcohol (%RDA Energy) | ||||||
| Mean (SD) | 0 (0) | 12.5 (6.5) | 36.4 (7.1) | 60.9 (7.3) | 108.5 (36) | 19.6 (29.4) |
| Median (IQR) | 0 (0) | 12.2 (7.0, 17.8)) | 35.8 (30.5, 42.6) | 60.1 (54.5, 67.9) | 97 (84.1, 121.2) | 6.4 (0, 29.6) |
| Sex | ||||||
| Males% (n) | 37 (1408) | 44 (1096) | 48 (667) | 58 (368) | 61 (299) | 44 (3838) |
| Females % (n) | 63 (2387) | 56 (1409) | 52 (730) | 42 (267) | 39 (174) | 56 (4967) |
| Males | ||||||
| Alcohol (%RDA Energy) | ||||||
| Mean (SD) | 0 (0) | 12.0 (6.5) | 36.4 (7.4) | 60.9 (7.5) | 110 (38) | 24.2 (33.6) |
| Median (IQR) | 0 (0) | 11.3 (6.4, 17.1) | 35.8 (29.1, 43.6) | 60.1 (54.0, 67.7) | 97 (84.1, 124) | 9.8 (0, 37.4) |
| Drinking status | ||||||
| Drinker | 70 (982) | 100 (1096) | 100 (667) | 100 (368) | 100 (299) | 89 (3412) |
| Stopped | 5 (69) | 0 (0) | 0 (0) | 0 (0) | 0 (0) | 2 (69) |
| Never drinker | 25 (357) | 0 (0) | 0 (0) | 0 (0) | 0 (0) | 9 (357) |
| Type of drink | ||||||
| Beer | 0 (0) | 70 (765) | 85 (564) | 93 (342) | 97 (290) | 51 (1961) |
| Wine | 0 (0) | 11 (126) | 16 (107) | 18 (67) | 21 (64) | 9 (364) |
| Spirits and RTDs | 0 (0) | 29 (317) | 49 (330) | 64 (234) | 76 (228) | 29 (1109) |
| Females | ||||||
| Alcohol (%RDA Energy) | ||||||
| Mean (SD) | 0 (0) | 12.9 (6.5) | 36.4 (6.7) | 60.8 (7.1) | 105 (32.0) | 16.0 (25.1) |
| Median (IQR) | 0 (0) | 12.2 (6.4, 18.2) | 34.1 (30.5, 42.2) | 60.3 (54.7, 68.2) | 95.3 (84.1, 117) | 4.5 (0, 24.3) |
| Drinking status: | ||||||
| Drinker | 72 (1707) | 100 (1409) | 100 (730) | 100 (267) | 100 (174) | 86 (4287) |
| Stopped | 8 (189) | 0 (0) | 0 (0) | 0 (0) | 0 (0) | 4 (189) |
| Never drinker | 21 (491) | 0 (0) | 0 (0) | 0 (0) | 0 (0) | 10 (491) |
| Type of drink | ||||||
| Beer | 0 (0) | 23 (323) | 27 (197) | 39 (104) | 58 (102) | 15 (725) |
| Wine | 0 (0) | 38 (534) | 46 (334) | 54 (145) | 59 (103) | 22 (1116) |
| Spirits and RTDs | 0 (0) | 49 (695) | 67 (487) | 79 (211) | 83 (144) | 31 (1537) |
| None | Low | Medium | High | Very High | ||
|---|---|---|---|---|---|---|
| 0% | >0–25% | >25–50% | >50–75% | >75% | Total | |
| Alcohol (%RDA Energy) | ||||||
| N | 1408 | 1096 | 667 | 368 | 299 | 3838 |
| BMI | ||||||
| Mean (SD) | 24.7 (5.1) | 24.6 (4.8) | 24.7 (4.7) | 24.9 (4.1) | 25.7 (4.7) | 24.8 (4.8) |
| Not obese | 85 (1047) | 90 (884) | 89 (540) | 91 (305) | 83 (258) | 88 (3034) |
| Obese | 15 (179) | 10 (99) | 11 (69) | 9 (29) | 17 (52) | 12 (428) |
| Age (years) | ||||||
| Mean (SD) | 21.3 (2.4) | 21.8 (2.3) | 21.6 (2.2) | 21.7 (2.2) | 21.1 (2.2) | 21.5 (2.3) |
| Physical activity level | ||||||
| Low MVPA | 24 (249) | 21 (177) | 16 (82) | 17 (50) | 17 (46) | 21 (604) |
| Medium MVPA | 23 (237) | 27 (222) | 22 (117) | 24 (69) | 19 (52) | 24 (697) |
| High MVPA | 53 (540) | 52 (432) | 62 (327) | 59 (169) | 64 (171) | 56 (1639) |
| Employment status | ||||||
| Employed | 50 (706) | 60 (661) | 61 (409) | 60 (220) | 59 (221) | 57 (2217) |
| Unemployed | 18 (249) | 15 (166) | 14 (93) | 12 (44) | 17 (65) | 16 (617) |
| Other inactive | 32 (445) | 24 (267) | 25 (164) | 28 (102) | 23 (86) | 27 (1064) |
| FV portions per day % (n) | ||||||
| Less than 5 | 84 (1070) | 83 (839) | 83 (506) | 87 (298) | 87 (312) | 84 (3025) |
| 5 or more | 16 (202) | 17 (176) | 17 (101) | 13 (44) | 13 (45) | 16 (568) |
| Quit smoking | ||||||
| No/Not applicable | 98 (1369) | 97 (1056) | 96 (642) | 96 (354) | 98 (298) | 97 (3719) |
| Yes | 2 (35) | 3 (38) | 4 (25) | 4 (13) | 2 (7) | 3 (118) |
| Longstanding illness: | ||||||
| No | 79 (1112) | 82 (899) | 83 (554) | 83 (306) | 80 (314) | 81 (3185) |
| Yes | 21 (296) | 18 (196) | 17 (113) | 17 (62) | 20 (79) | 19 (746) |
| Ethnicity: | ||||||
| White and Mixed White | 80 (1128) | 93 (1023) | 97 (646) | 99 (364) | 97 (362) | 90 (3523) |
| Asian, African, Arab and other | 20 (279) | 7 (72) | 3 (19) | 1 (4) | 3 (11) | 10 (385) |
| Parent: | ||||||
| No | 90 (1262) | 91 (993) | 92 (611) | 94 (346) | 93 (367) | 91 (3579) |
| Yes | 10 (146) | 9 (103) | 8 (56) | 6 (22) | 7 (27) | 9 (354) |
| Country: | ||||||
| England | 65 (921) | 63 (690) | 56 (373) | 59 (217) | 66 (261) | 63 (2462) |
| Scotland | 35 (487) | 37 (406) | 44 (294) | 41 (151) | 34 (133) | 37 (1471) |
| None | Low | Medium | High | Very High | ||
|---|---|---|---|---|---|---|
| 0% | >0–25% | >25–50% | >50–75% | >75% | Total | |
| N | 2387 | 1409 | 730 | 267 | 174 | 4967 |
| BMI: | ||||||
| Mean (SD) | 25.5 (6.1) | 25 (5.5) | 25 (5.4) | 25.9 (5.6) | 25.6 (6) | 25.3 (5.8) |
| Not obese | 80 (1526) | 85 (1059) | 86 (555) | 79 (190) | 81 (151) | 82 (3481) |
| Obese | 20 (377) | 15 (194) | 14 (89) | 21 (52) | 19 (36) | 18 (748) |
| Age (years): | ||||||
| Mean (SD) | 21.8 (2.3) | 21.8 (2.3) | 21.6 (2.3) | 21.4 (2.3) | 20.9 (2.4) | 21.7 (2.3) |
| Physical activity level | ||||||
| Low MVPA | 39 (694) | 30 (320) | 25 (143) | 31 (67) | 34 (59) | 33 (1283) |
| Medium MVPA | 28 (511) | 33 (363) | 34 (196) | 30 (66) | 25 (43) | 31 (1179) |
| High MVPA | 33 (595) | 37 (401) | 41 (234) | 39 (85) | 41 (70) | 36 (1385) |
| Employment status: | ||||||
| Employed | 45 (1071) | 57 (797) | 53 (386) | 52 (139) | 52 (124) | 50 (2517) |
| Unemployed | 13 (308) | 11 (152) | 11 (83) | 16 (42) | 16 (38) | 12 (623) |
| Other inactive | 42 (1002) | 32 (456) | 36 (260) | 32 (86) | 33 (78) | 37 (1882) |
| FV portions per day: | ||||||
| Less than 5 | 83 (1791) | 81 (1040) | 84 (570) | 85 (205) | 87 (195) | 83 (3801) |
| 5 or more | 17 (376) | 19 (247) | 16 (108) | 15 (37) | 13 (29) | 17 (797) |
| Quit smoking: | ||||||
| No/Not applicable | 97 (2304) | 97 (1358) | 97 (706) | 93 (248) | 96 (170) | 96 (4786) |
| Yes | 3 (79) | 3 (49) | 3 (22) | 7 (19) | 4 (7) | 4 (176) |
| Longstanding illness: | ||||||
| No | 75 (1786) | 77 (1083) | 79 (576) | 76 (203) | 78 (197) | 76 (3845) |
| Yes | 25 (599) | 23 (326) | 21 (154) | 24 (64) | 22 (57) | 24 (1200) |
| Ethnicity: | ||||||
| White and Mixed | 83 (1971) | 95 (1332) | 98 (715) | 97 (260) | 95 (227) | 90 (4505) |
| Asian, African, Arab and other | 17 (415) | 5 (76) | 2 (15) | 3 (7) | 5 (13) | 10 (526) |
| Parent: | ||||||
| No | 66 (1569) | 79 (1117) | 78 (567) | 82 (220) | 83 (212) | 73 (3685) |
| Yes | 34 (818) | 21 (292) | 22 (163) | 18 (47) | 17 (43) | 27 (1363) |
| Country: | ||||||
| England | 63 (1506) | 61 (861) | 55 (405) | 60 (160) | 65 (167) | 61 (3099) |
| Scotland | 37 (881) | 39 (548) | 45 (325) | 40 (107) | 35 (88) | 39 (1949) |
| Males | Females | |||||
|---|---|---|---|---|---|---|
| Coef. | p-Value | 95% CI | Coef. | p-Value | 95% CI | |
| Total alcohol intake | ||||||
| No intake | 0.40 | 0.23 | −0.25 | 0.49 | 0.126 | (−0.14, 1.12) |
| Low > 0 to 25% | (Reference) | (Reference) | ||||
| Medium > 25% to 50% | 0.06 | 0.839 | (−0.51, 0.63) | 0.35 | 0.278 | (−0.28, 0.97) |
| High > 50% to 75% | 0.48 | 0.164 | (−0.19, 1.15) | 1.67 | <0.001 | (0.76, 2.58) |
| Very High > 75% | 1.74 | <0.001 | (0.98, 2.49) | 1.55 | 0.018 | (0.26, 2.85) |
| Linear trend | 0.30 | 0.004 | (0.1, 0.51) | 0.33 | 0.016 | (0.06, 0.6) |
| Frequency (No. of drinks) | −0.04 | 0.708 | (−0.24, 0.16) | -0.15 | 0.159 | (−0.36, 0.06) |
| Beer intake | ||||||
| No intake | 0.25 | 0.41 | −0.34 | -0.40 | 0.236 | (−1.06, 0.26) |
| Low > 0 to 25% | (Reference) | (Reference) | ||||
| Medium > 25% to 50% | 0.26 | 0.371 | (−0.31, 0.83) | 1.78 | 0.051 | (−0.01, 3.57) |
| High > 50% to 75% | 1.11 | 0.008 | (0.29, 1.94) | 0.64 | 0.637 | (−2.02, 3.29) |
| Very High > 75% | 1.58 | 0.002 | (0.59, 2.56) | −0.54 | 0.592 | (−2.51, 1.43) |
| Linear trend | 0.27 | 0.012 | (0.06, 0.47) | 0.49 | 0.016 | (0.09, 0.88) |
| Frequency (No. of drinks) | −0.04 | 0.678 | (−0.24, 0.15) | −0.14 | 0.178 | (−0.33, 0.06) |
| Wine | ||||||
| No intake | 0.52 | 0.130 | (−0.15, 1.18) | 0.47 | 0.115 | (−0.11, 1.05) |
| Low > 0 to 25% | (Reference) | (Reference) | ||||
| Medium > 25% to 50% | 1.69 | 0.022 | (0.24, 3.14) | −0.22 | 0.601 | (−1.04, 0.6) |
| High and Very High > 50% | 1.62 | 0.138 | (−0.52, 3.76) | 1.80 | 0.024 | (0.24, 3.37) |
| Linear trend | 0.19 | 0.392 | (−0.25, 0.64) | −0.12 | 0.440 | (−0.43, 0.19) |
| Frequency (No. of drinks) | −0.03 | 0.767 | (−0.22, 0.16) | −0.15 | 0.129 | (−0.34, 0.04) |
| Spirits | ||||||
| No intake | 0.14 | 0.572 | (−0.35, 0.64) | 0.23 | 0.377 | (−0.28, 0.75) |
| Low > 0 to 25% | (Reference) | (Reference) | ||||
| Medium > 25% to 50% | 0.47 | 0.370 | (−0.56, 1.5) | 0.65 | 0.150 | (−0.24, 1.54) |
| High and Very High > 50% | 1.58 | 0.037 | (0.09, 3.06) | 1.58 | 0.017 | (0.29, 2.87) |
| Linear trend | 0.18 | 0.286 | (−0.15, 0.52) | 0.28 | 0.084 | (−0.04, 0.59) |
| Frequency (No. of drinks) | −0.03 | 0.776 | (−0.22, 0.17) | −0.15 | 0.124 | (−0.35, 0.04) |
© 2018 by the authors. Licensee MDPI, Basel, Switzerland. This article is an open access article distributed under the terms and conditions of the Creative Commons Attribution (CC BY) license (http://creativecommons.org/licenses/by/4.0/).
Share and Cite
Albani, V.; Bradley, J.; Wrieden, W.L.; Scott, S.; Muir, C.; Power, C.; Fitzgerald, N.; Stead, M.; Kaner, E.; Adamson, A.J. Examining Associations between Body Mass Index in 18–25 Year-Olds and Energy Intake from Alcohol: Findings from the Health Survey for England and the Scottish Health Survey. Nutrients 2018, 10, 1477. https://doi.org/10.3390/nu10101477
Albani V, Bradley J, Wrieden WL, Scott S, Muir C, Power C, Fitzgerald N, Stead M, Kaner E, Adamson AJ. Examining Associations between Body Mass Index in 18–25 Year-Olds and Energy Intake from Alcohol: Findings from the Health Survey for England and the Scottish Health Survey. Nutrients. 2018; 10(10):1477. https://doi.org/10.3390/nu10101477
Chicago/Turabian StyleAlbani, Viviana, Jennifer Bradley, Wendy L. Wrieden, Stephanie Scott, Cassey Muir, Christine Power, Niamh Fitzgerald, Martine Stead, Eileen Kaner, and Ashley J. Adamson. 2018. "Examining Associations between Body Mass Index in 18–25 Year-Olds and Energy Intake from Alcohol: Findings from the Health Survey for England and the Scottish Health Survey" Nutrients 10, no. 10: 1477. https://doi.org/10.3390/nu10101477
APA StyleAlbani, V., Bradley, J., Wrieden, W. L., Scott, S., Muir, C., Power, C., Fitzgerald, N., Stead, M., Kaner, E., & Adamson, A. J. (2018). Examining Associations between Body Mass Index in 18–25 Year-Olds and Energy Intake from Alcohol: Findings from the Health Survey for England and the Scottish Health Survey. Nutrients, 10(10), 1477. https://doi.org/10.3390/nu10101477