Dietary Calcium and Dairy Modulation of Oxidative Stress and Mortality in aP2-Agouti and Wild-type Mice

Abstract
:
1. Introduction
2. Materials and Methods
2.1. Animals and Diets

| Diet | |||
|---|---|---|---|
| Control (0.4%) | High Ca (1.2%) | NFDM (1.2%) | |
| Ingredient (gm) | |||
| Casein, 80 Mesh | 160 | 160 | 0 |
| DL-Methionine | 3 | 3 | 0 |
| Sucrose | 637.9 | 638.3 | 429.7 |
| Cellulose | 50 | 50 | 50 |
| Soybean oil | 100 | 100 | 41.8 |
| Lard | 10 | 10 | 65 |
| Mineral Mix S10022B | 7 | 7 | 7 |
| Calcium carbonate | 10 | 30 | 17.4 |
| Potassium phosphate, monobasic | 8 | 8 | 8 |
| Potassium Citrate, 1 H2O | 1.6 | 1.6 | 1.6 |
| Vitamin Mix V10037 | 10 | 10 | 10 |
| Choline Bitartrate | 2.5 | 2.5 | 2.5 |
| t-Butylhydroqinone | 0.014 | 0.014 | 0.014 |
| Milk, Nonfat, Dry | 0 | 0 | 400 |
| Total | 1000.014 | 1020.414 | 1033.014 |
| Macronutrients (g/kgdiet) | |||
| Protein | 143.8 | 143.8 | 144.8 |
| Carbohydrate | 647.9 | 648.3 | 647.7 |
| Fat | 110.0 | 110.0 | 110.0 |
| Fiber | 50 | 50 | 50 |
| Macronutrients (gm %) | |||
| Protein | 14.4 | 14.1 | 14.0 |
| Carbohydrate | 64.8 | 63.5 | 62.7 |
| Fat | 11.0 | 10.8 | 10.6 |
| Fiber | 5.0 | 4.9 | 4.8 |
| Macronutrients (kcal/kg diet) | |||
| Protein | 575 | 575 | 579 |
| Carbohydrate | 2592 | 2593 | 2591 |
| Fat | 990 | 990 | 990 |
| Total | 4157 | 4158 | 4160 |
| Macronutrients (kcal %) | |||
| Protein | 14 | 14 | 14 |
| Carbohydrate | 62 | 62 | 62 |
| Fat | 24 | 24 | 24 |
| Total | 100 | 100 | 100 |
| Calcium, gm | 4.03 | 12.03 | 12.03 |
| Phosphorus, gm | 3.1 | 3.1 | 5.7 |
| Potassium, gm | 3.61 | 3.61 | 10.81 |
2.2. Measurement of Blood Chemistry Markers
2.3. Measurement of Cortisol Release
2.4. Determination of Intracellular ROS Generation in White Adipose Tissue (Perirenal and Retro-peritoneal Fat Pads)
2.5. Measurement of Enzyme Activities in Liver
2.6. Measurement of mRNA Expression
Total RNA extraction:
Quantitative real time PCR:
2.7. Statistical Analysis
3. Results
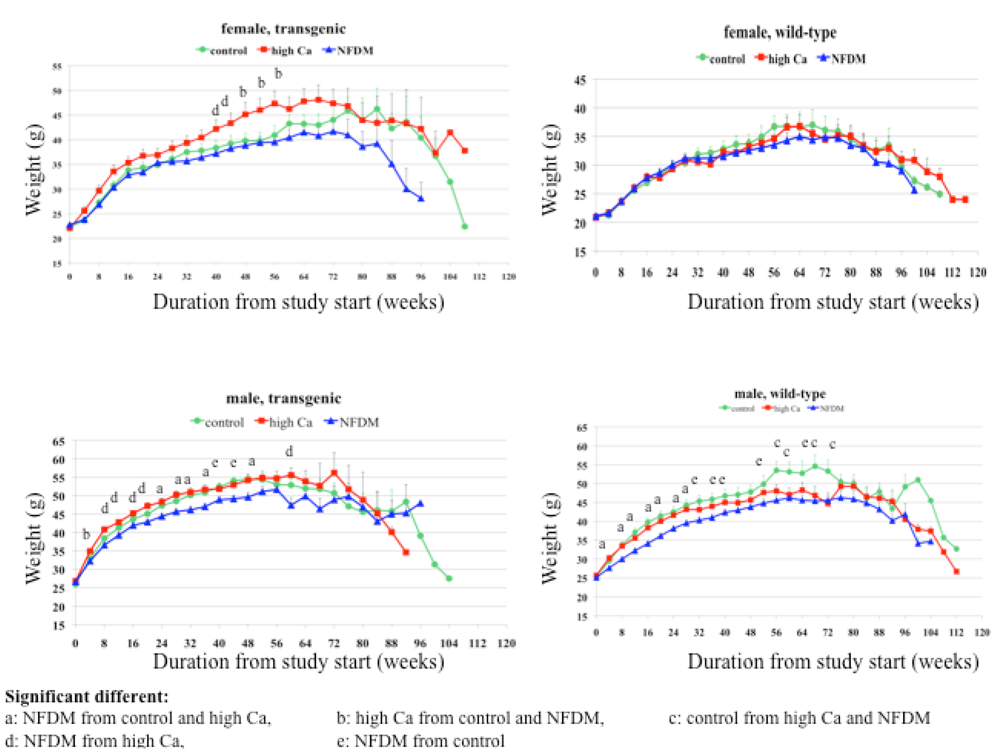
Body weight and composition
Males:

| Diet | ||||||||||||||
|---|---|---|---|---|---|---|---|---|---|---|---|---|---|---|
| control | high calcium | NFDM | ||||||||||||
| Gender | Genotype | Age | mean ± SE | n | mean ± SE | n | mean ± SE | n | ||||||
| female | wild | 28 wk | 6.53 | ± | 2.89 | 4 | 12.10 | ± | 1.57 | 4 | 9.24 | ± | 2.22 | 4 |
| 52 wk | 18.53 | ± | 2.18 | 4 | 14.37 | ± | 1.07 | 4 | 12.16 | ± | 3.07 | 4 | ||
| 78 wk | 19.42 | ± | 1.49 | 3 | 17.84 | ± | 3.73 | 4 | 12.98 | ± | 1.44 | 3 | ||
| all | 14.41 | ± | 2.26 | 11 | 14.77 | ± | 1.44 | 12 | 11.32 | ± | 1.39 | 11 | ||
| transgenic | 28 wk | 19.27 | ± | 1.69 | 4 | 16.90 | ± | 4.72 | 3 | 12.99 | ± | 0.65 | 4 | |
| 52 wk | 19.24 | ± | 4.39 | 4 | 22.13 | ± | 1.15 | 4 | 16.52 | ± | 1.20 | 4 | ||
| 78 wk | 23.07 | ± | 2.94 | 5 | 23.84 | ± | 4.61 | 3 | 18.62 | ± | 3.33 | 4 | ||
| all | 20.72 | ± | 1.76 | 13 | 21.07 | ± | 1.98 | 10 | 16.05 | ± | 1.29 | 12 | ||
| both | 17.83 | ± | 1.53 a | 24 | 17.64 | ± | 1.36 ab | 22 | 13.79 | ± | 1.05 b | 23 | ||
| male | wild | 28 wk | 12.43 | ± | 0.87 | 4 | 12.73 | ± | 0.66 | 4 | 10.08 | ± | 0.75 | 4 |
| 52 wk | 15.33 | ± | 1.84 | 4 | 15.06 | ± | 0.19 | 4 | 13.65 | ± | 0.36 | 4 | ||
| 78 wk | 17.47 | ± | 1.96 a | 4 | 11.46 | ± | 2.05 b | 4 | 13.44 | ± | 1.11 ab | 4 | ||
| all | 15.07 | ± | 1.05 a | 12 | 13.08 | ± | 0.79 ab | 12 | 12.39 | ± | 0.64 b | 12 | ||
| transgenic | 28 wk | 12.54 | ± | 1.11 | 4 | 12.38 | ± | 0.49 | 5 | 12.87 | ± | 0.94 | 4 | |
| 52 wk | 16.67 | ± | 1.25 a | 3 | 12.88 | ± | 1.08 b | 4 | 13.18 | ± | 0.51 b | 4 | ||
| 78 wk | 19.97 | ± | 0.73 | 3 | 13.98 | ± | 4.94 | 3 | 13.56 | ± | 0.92 | 4 | ||
| all | 16.00 | ± | 1.23 a | 10 | 12.94 | ± | 1.13 b | 12 | 13.20 | ± | 0.43 ab | 12 | ||
| both | 15.50 | ± | 0.79 a | 22 | 13.02 | ± | 0.68 ab | 24 | 12.79 | ± | 0.39 b | 24 | ||
| both | wild | 28 wk | 9.48 | ± | 1.79 | 8 | 12.42 | ± | 0.79 | 8 | 9.66 | ± | 1.09 | 8 |
| 52 wk | 16.93 | ± | 1.46 a | 8 | 14.72 | ± | 0.52 ab | 8 | 12.91 | ± | 1.46 b | 8 | ||
| 78 wk | 18.30 | ± | 1.25 a | 7 | 14.62 | ± | 2.30 ab | 8 | 13.24 | ± | 0.84 b | 7 | ||
| all | 14.76 | ± | 1.18 a | 23 | 13.93 | ± | 0.83 ab | 24 | 11.88 | ± | 0.74 b | 23 | ||
| transgenic | 28 wk | 15.90 | ± | 1.60 | 8 | 14.07 | ± | 1.78 | 8 | 12.93 | ± | 0.52 | 8 | |
| 52 wk | 18.14 | ± | 2.42 | 7 | 17.50 | ± | 1.89 | 8 | 14.85 | ± | 0.87 | 8 | ||
| 78 wk | 21.90 | ± | 1.92 | 8 | 18.91 | ± | 3.74 | 6 | 16.09 | ± | 1.86 | 8 | ||
| all | 18.67 | ± | 1.21 a | 23 | 16.64 | ± | 1.38 ab | 22 | 14.63 | ± | 0.73 b | 24 | ||
| both | 28 wk | 12.69 | ± | 1.42 | 16 | 13.24 | ± | 0.96 | 16 | 11.29 | ± | 0.72 | 16 | |
| 52 wk | 17.49 | ± | 1.32 a | 15 | 16.11 | ± | 1.01 ab | 16 | 13.88 | ± | 0.86 b | 16 | ||
| 78 wk | 20.22 | ± | 1.24 a | 15 | 16.47 | ± | 2.07 ab | 14 | 14.76 | ± | 1.09 b | 15 | ||
| all | 16.72 | ± | 0.88 a | 46 | 15.23 | ± | 0.81 ab | 46 | 13.28 | ± | 0.55 b | 47 | ||
| Diet | ||||||||||||||
|---|---|---|---|---|---|---|---|---|---|---|---|---|---|---|
| control | high calcium | NFDM | ||||||||||||
| Gender | Genotype | Age | mean ± SE | n | mean ± SE | n | mean ± SE | n | ||||||
| female | wild | 28 wk | 0.33 | ± | 0.05 | 4 | 0.40 | ± | 0.04 | 4 | 0.32 | ± | 0.04 | 4 |
| 52 wk | 0.25 | ± | 0.04 | 4 | 0.28 | ± | 0.02 | 4 | 0.41 | ± | 0.09 | 4 | ||
| 78 wk | 0.35 | ± | 0.06 | 3 | 0.32 | ± | 0.05 | 4 | 0.36 | ± | 0.03 | 3 | ||
| all | 0.31 | ± | 0.03 | 11 | 0.33 | ± | 0.02 | 12 | 0.36 | ± | 0.03 | 11 | ||
| transgenic | 28 wk | 0.28 | ± | 0.02 | 4 | 0.35 | ± | 0.10 | 3 | 0.38 | ± | 0.05 | 4 | |
| 52 wk | 0.22 | ± | 0.02 | 4 | 0.24 | ± | 0.04 | 4 | 0.30 | ± | 0.04 | 4 | ||
| 78 wk | 0.18 | ± | 0.02 | 5 | 0.27 | ± | 0.08 | 3 | 0.33 | ± | 0.08 | 4 | ||
| all | 0.22 | ± | 0.02 a | 13 | 0.28 | ± | 0.04 ab | 10 | 0.34 | ± | 0.33 b | 12 | ||
| both | 0.26 | ± | 0.02 a | 24 | 0.31 | ± | 0.02 ab | 22 | 0.35 | ± | 0.02 b | 23 | ||
| male | wild | 28 wk | 0.29 | ± | 0.05 | 4 | 0.28 | ± | 0.05 | 4 | 0.43 | ± | 0.06 | 4 |
| 52 wk | 0.13 | ± | 0.01 a | 4 | 0.22 | ± | 0.03 b | 4 | 0.25 | ± | 0.03 b | 4 | ||
| 78 wk | 0.15 | ± | 0.05 a | 4 | 0.19 | ± | 0.04 a | 4 | 0.42 | ± | 0.05 b | 4 | ||
| all | 0.19 | ± | 0.03 a | 12 | 0.23 | ± | 0.02 ab | 12 | 0.36 | ± | 0.04 b | 12 | ||
| transgenic | 28 wk | 0.23 | ± | 0.05 | 4 | 0.26 | ± | 0.02 | 5 | 0.23 | ± | 0.01 | 4 | |
| 52 wk | 0.15 | ± | 0.02 | 3 | 0.16 | ± | 0.03 | 4 | 0.24 | ± | 0.03 | 4 | ||
| 78 wk | 0.19 | ± | 0.005 | 3 | 0.29 | ± | 0.04 | 3 | 0.23 | ± | 0.08 | 4 | ||
| all | 0.19 | ± | 0.02 | 10 | 0.24 | ± | 0.02 | 12 | 0.24 | ± | 0.03 | 12 | ||
| both | 0.19 | ± | 0.02 a | 22 | 0.23 | ± | 0.02 ab | 24 | 0.30 | ± | 0.03 b | 24 | ||
| both | wild | 28 wk | 0.31 | ± | 0.03 | 8 | 0.34 | ± | 0.04 | 8 | 0.38 | ± | 0.04 | 8 |
| 52 wk | 0.19 | ± | 0.03 a | 8 | 0.25 | ± | 0.02 ab | 8 | 0.33 | ± | 0.05 b | 8 | ||
| 78 wk | 0.24 | ± | 0.05 a | 7 | 0.25 | ± | 0.04 a | 8 | 0.39 | ± | 0.03 b | 7 | ||
| all | 0.25 | ± | 0.024 a | 23 | 0.28 | ± | 0.02 ab | 24 | 0.36 | ± | 0.02 b | 23 | ||
| transgenic | 28 wk | 0.25 | ± | 0.02 | 8 | 0.29 | ± | 0.04 | 8 | 0.31 | ± | 0.04 | 8 | |
| 52 wk | 0.19 | ± | 0.02 a | 7 | 0.20 | ± | 0.03 ab | 8 | 0.27 | ± | 0.03 b | 8 | ||
| 78 wk | 0.18 | ± | 0.01 | 8 | 0.28 | ± | 0.04 | 6 | 0.29 | ± | 0.06 | 8 | ||
| all | 0.20 | ± | 0.01 a | 23 | 0.26 | ± | 0.02 ab | 22 | 0.29 | ± | 0.02 b | 24 | ||
| both | 28 wk | 0.28 | ± | 0.02 | 16 | 0.32 | ± | 0.03 | 16 | 0.34 | ± | 0.03 | 16 | |
| 52 wk | 0.19 | ± | 0.02 a | 15 | 0.23 | ± | 0.02 a | 16 | 0.30 | ± | 0.03 b | 16 | ||
| 78 wk | 0.20 | ± | 0.02 a | 15 | 0.27 | ± | 0.03 ab | 14 | 0.34 | ± | 0.04 b | 15 | ||
| all | 0.23 | ± | 0.01 a | 46 | 0.27 | ± | 0.01 ab | 46 | 0.33 | ± | 0.02 b | 47 | ||
Females:
Summary:
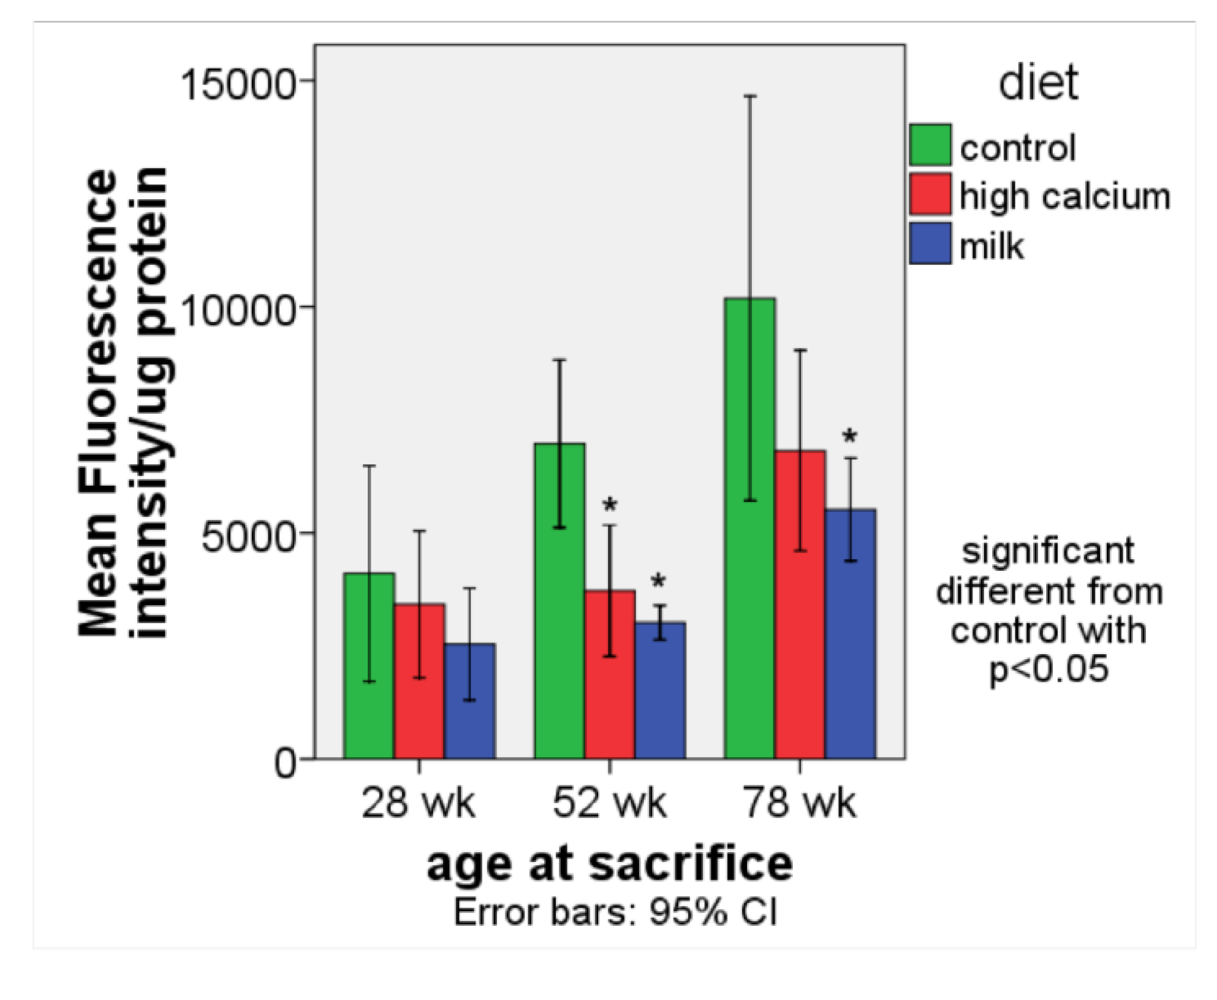
3.1. Oxidative stress

| Diet | ||||||||||||||
|---|---|---|---|---|---|---|---|---|---|---|---|---|---|---|
| control | high calcium | NFDM | ||||||||||||
| Gene expression | Gender | Genotype | mean ± SE | n | mean ± SE | n | mean ± SE | n | ||||||
| GPx soleus | female | wild | 0.77 | ± | 0.06 a | 12 | 0.93 | ± | 0.90 ab | 12 | 1.06 | ± | 0.09 b | 12 |
| transgenic | 0.81 | ± | 0.08 a | 12 | 0.84 | ± | 0.08 a | 11 | 1.20 | ± | 0.14 b | 12 | ||
| both | 0.79 | ± | 0.05 a | 24 | 0.89 | ± | 0.06 a | 23 | 1.14 | ± | 0.08 b | 24 | ||
| male | wild | 0.83 | ± | 0.07 | 11 | 0.74 | ± | 0.07 | 12 | 1.22 | ± | 0.20 | 12 | |
| transgenic | 0.83 | ± | 0.14 | 11 | 0.81 | ± | 0.10 | 13 | 0.82 | ± | 0.11 | 13 | ||
| both | 0.83 | ± | 0.07 | 22 | 0.77 | ± | 0.06 | 25 | 1.01 | ± | 0.12 | 25 | ||
| both | wild | 0.80 | ± | 0.05 a | 23 | 0.83 | ± | 0.06 a | 24 | 1.14 | ± | 0.10 b | 24 | |
| both | transgenic | 0.82 | ± | 0.08 | 23 | 0.83 | ± | 0.07 | 24 | 1.02 | ± | 0.10 | 25 | |
| both | both | 0.81 | ± | 0.04 a | 46 | 0.83 | ± | 0.05 a | 48 | 1.07 | ± | 0.07 b | 49 | |
| SOD 3 soleus | female | wild | 0.73 | ± | 0.09 a | 12 | 0.88 | ± | 0.12 a | 12 | 1.31 | ± | 0.19 b | 12 |
| transgenic | 0.81 | ± | 0.10 | 12 | 0.84 | ± | 0.13 | 11 | 0.88 | ± | 0.10 | 12 | ||
| both | 0.77 | ± | 0.07 a | 24 | 0.86 | ± | 0.09 ab | 23 | 1.09 | ± | 0.12 b | 24 | ||
| male | wild | 0.96 | ± | 0.08 | 11 | 0.90 | ± | 0.17 | 12 | 1.27 | ± | 0.26 | 12 | |
| transgenic | 0.80 | ± | 0.07 | 11 | 0.89 | ± | 0.09 | 13 | 0.85 | ± | 0.14 | 13 | ||
| both | 0.88 | ± | 0.06 | 22 | 0.90 | ± | 0.10 | 25 | 1.06 | ± | 0.15 | 25 | ||
| both | wild | 0.84 | ± | 0.07 a | 23 | 0.89 | ± | 0.11 ab | 24 | 1.30 | ± | 0.16 b | 24 | |
| both | transgenic | 0.81 | ± | 0.06 | 23 | 0.87 | ± | 0.08 | 24 | 0.87 | ± | 0.09 | 25 | |
| both | both | 0.82 | ± | 0.05 | 46 | 0.88 | ± | 0.07 | 48 | 1.07 | ± | 0.09 | 49 | |
| SOD 3 liver | female | wild | 0.48 | ± | 0.07 | 12 | 0.79 | ± | 0.22 | 12 | 0.86 | ± | 0.27 | 12 |
| transgenic | 0.62 | ± | 0.11 | 12 | 0.52 | ± | 0.13 | 11 | 0.78 | ± | 0.26 | 12 | ||
| both | 0.56 | ± | 0.07 | 24 | 0.66 | ± | 0.13 | 23 | 0.83 | ± | 0.19 | 24 | ||
| male | wild | 0.48 | ± | 0.10 | 11 | 0.50 | ± | 0.12 | 12 | 0.97 | ± | 0.52 | 11 | |
| transgenic | 0.52 | ± | 0.13 | 11 | 0.38 | ± | 0.06 | 12 | 0.41 | ± | 0.08 | 13 | ||
| both | 0.51 | ± | 0.08 | 22 | 0.44 | ± | 0.07 | 24 | 0.67 | ± | 0.25 | 24 | ||
| both | wild | 0.49 | ± | 0.06 | 23 | 0.65 | ± | 0.13 | 24 | 0.92 | ± | 0.28 | 23 | |
| both | transgenic | 0.58 | ± | 0.09 | 23 | 0.45 | ± | 0.07 | 23 | 0.59 | ± | 0.14 | 25 | |
| both | both | 0.53 | ± | 0.05 | 46 | 0.55 | ± | 0.08 | 47 | 0.75 | ± | 0.15 | 48 | |
| Enzyme activity | ||||||||||||||
| SOD liver | female | wild | 0.59 | ± | 0.07 ab | 12 | 0.35 | ± | 0.08 a | 12 | 0.83 | ± | 0.17 b | 12 |
| transgenic | 0.55 | ± | 0.16 | 12 | 0.65 | ± | 0.14 | 11 | 0.63 | ± | 0.12 | 12 | ||
| both | 0.57 | ± | 0.90 | 24 | 0.49 | ± | 0.08 | 23 | 0.73 | ± | 0.10 | 24 | ||
| male | wild | 0.54 | ± | 0.16 | 11 | 0.48 | ± | 0.10 | 12 | 0.76 | ± | 0.18 | 11 | |
| transgenic | 0.34 | ± | 0.08 | 11 | 0.37 | ± | 0.07 | 12 | 0.59 | ± | 0.14 | 13 | ||
| both | 0.44 | ± | 0.09 | 22 | 0.42 | ± | 0.06 | 24 | 0.68 | ± | 0.11 | 24 | ||
| both | wild | 0.56 | ± | 0.09 ab | 23 | 0.42 | ± | 0.06 a | 24 | 0.79 | ± | 0.12 b | 23 | |
| both | transgenic | 0.45 | ± | 0.09 | 23 | 0.50 | ± | 0.08 | 23 | 0.61 | ± | 0.09 | 25 | |
| both | both | 0.50 | ± | 0.06 a | 46 | 0.46 | ± | 0.05 a | 47 | 0.70 | ± | 0.07 b | 48 | |
Summary:
3.2. Inflammatory Stress
| Diet | ||||||||||||||
|---|---|---|---|---|---|---|---|---|---|---|---|---|---|---|
| control | high calcium | NFDM | ||||||||||||
| Gene expression | Gender | Genotype | mean ± SE | n | mean ± SE | n | mean ± SE | n | ||||||
| IL 6 | female | wild | 0.21 | ± | 0.04 | 8 | 0.40 | ± | 0.13 | 8 | 0.42 | ± | 0.16 | 9 |
| transgenic | 0.38 | ± | 0.08 | 11 | 0.38 | ± | 0.08 | 9 | 0.26 | ± | 0.32 | 8 | ||
| both | 0.31 | ± | 0.05 | 19 | 0.39 | ± | 0.07 | 17 | 0.35 | ± | 0.08 | 17 | ||
| male | wild | 1.45 | ± | 0.86 | 8 | 2.18 | ± | 0.67 | 10 | 0.57 | ± | 0.22 | 8 | |
| transgenic | 6.23 | ± | 2.12 | 8 | 2.87 | ± | 1.15 | 8 | 0.51 | ± | 0.07 | 9 | ||
| both | 3.84 | ± | 1.27 a | 16 | 2.49 | ± | 0.62 a | 18 | 0.53 | ± | 0.48 b | 17 | ||
| both | wild | 0.83 | ± | 0.44 | 16 | 1.39 | ± | 0.43 | 18 | 0.49 | ± | 0.13 | 17 | |
| both | transgenic | 2.85 | ± | 1.09 | 19 | 1.56 | ± | 0.61 | 17 | 0.39 | ± | 0.05 | 17 | |
| both | both | 1.93 | ± | 0.64 | 35 | 1.47 | ± | 0.36 | 35 | 0.44 | ± | 0.07 | 34 | |
| TNF α | female | wild | 0.33 | ± | 0.06 | 8 | 0.69 | ± | 0.30 | 8 | 0.24 | ± | 0.04 | 9 |
| transgenic | 0.47 | ± | 0.08 | 11 | 0.68 | ± | 0.16 | 9 | 0.50 | ± | 0.16 | 9 | ||
| both | 0.41 | ± | 0.05 | 19 | 0.69 | ± | 0.16 | 17 | 0.37 | ± | 0.08 | 18 | ||
| male | wild | 1.49 | ± | 0.47 | 8 | 2.39 | ± | 0.39 | 10 | 0.73 | ± | 0.13 | 9 | |
| transgenic | 3.83 | ± | 0.74 a | 6 | 2.53 | ± | 0.64 ab | 9 | 1.17 | ± | 0.20 b | 9 | ||
| both | 2.49 | ± | 0.51 a | 14 | 2.46 | ± | 0.35 a | 19 | 0.95 | ± | 0.13 b | 18 | ||
| both | wild | 0.91 | ± | 0.27 ab | 16 | 1.64 | ± | 0.32 a | 18 | 0.49 | ± | 0.09 b | 18 | |
| both | transgenic | 1.65 | ± | 0.47 | 17 | 1.60 | ± | 0.39 | 18 | 0.84 | ± | 0.15 | 18 | |
| both | both | 1.29 | ± | 0.28 | 33 | 1.62 | ± | 0.25 | 36 | 0.66 | ± | 0.09 | 36 | |
| IL 15 | female | wild | 0.43 | ± | 0.09 | 8 | 0.64 | ± | 0.14 | 8 | 0.69 | ± | 0.18 | 9 |
| transgenic | 0.84 | ± | 0.19 | 11 | 0.88 | ± | 0.26 | 9 | 0.93 | ± | 0.27 | 9 | ||
| both | 0.66 | ± | 0.13 | 19 | 0.77 | ± | 0.15 | 17 | 0.81 | ± | 0.16 | 18 | ||
| male | wild | 0.85 | ± | 0.22 a | 7 | 1.45 | ± | 0.22 b | 10 | 0.61 | ± | 0.09 a | 9 | |
| transgenic | 1.18 | ± | 0.26 | 8 | 1.26 | ± | 0.31 | 9 | 1.07 | ± | 0.21 | 9 | ||
| both | 1.02 | ± | 0.18 | 15 | 1.36 | ± | 0.18 | 19 | 0.84 | ± | 0.12 | 18 | ||
| total | wild | 0.62 | ± | 0.12 | 15 | 1.09 | ± | 0.16 | 18 | 0.65 | ± | 0.10 | 18 | |
| total | transgenic | 0.98 | ± | 0.16 | 19 | 1.07 | ± | 0.20 | 18 | 1.00 | ± | 0.17 | 18 | |
| total | total | 0.82 | ± | 0.11 | 34 | 1.08 | ± | 0.13 | 36 | 0.83 | ± | 0.10 | 36 | |
| NFкB | female | wild | 0.84 | ± | 0.25 | 8 | 0.85 | ± | 0.20 | 8 | 0.72 | ± | 0.17 | 9 |
| transgenic | 0.86 | ± | 0.17 | 11 | 0.96 | ± | 0.21 | 9 | 1.03 | ± | 0.23 | 9 | ||
| total | 0.85 | ± | 0.14 | 19 | 0.91 | ± | 0.14 | 17 | 0.88 | ± | 0.15 | 18 | ||
| male | wild | 1.27 | ± | 0.38 | 8 | 1.58 | ± | 0.22 | 10 | 0.83 | ± | 0.16 | 9 | |
| transgenic | 1.49 | ± | 0.47 | 7 | 1.09 | ± | 0.26 | 9 | 1.17 | ± | 0.22 | 9 | ||
| total | 1.38 | ± | 0.29 | 15 | 1.35 | ± | 0.17 | 19 | 1.01 | ± | 0.14 | 18 | ||
| both | wild | 1.05 | ± | 0.22 | 16 | 1.26 | ± | 0.17 | 18 | 0.77 | ± | 0.12 | 18 | |
| both | transgenic | 1.13 | ± | 0.23 | 18 | 1.03 | ± | 0.17 | 18 | 1.11 | ± | 0.16 | 18 | |
| both | both | 1.09 | ± | 0.16 | 34 | 1.14 | ± | 0.12 | 36 | 0.94 | ± | 0.10 | 36 | |
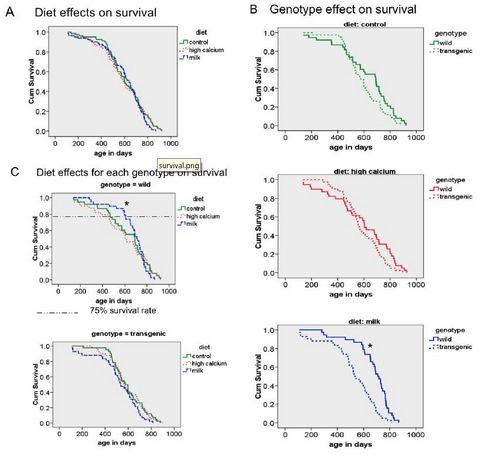
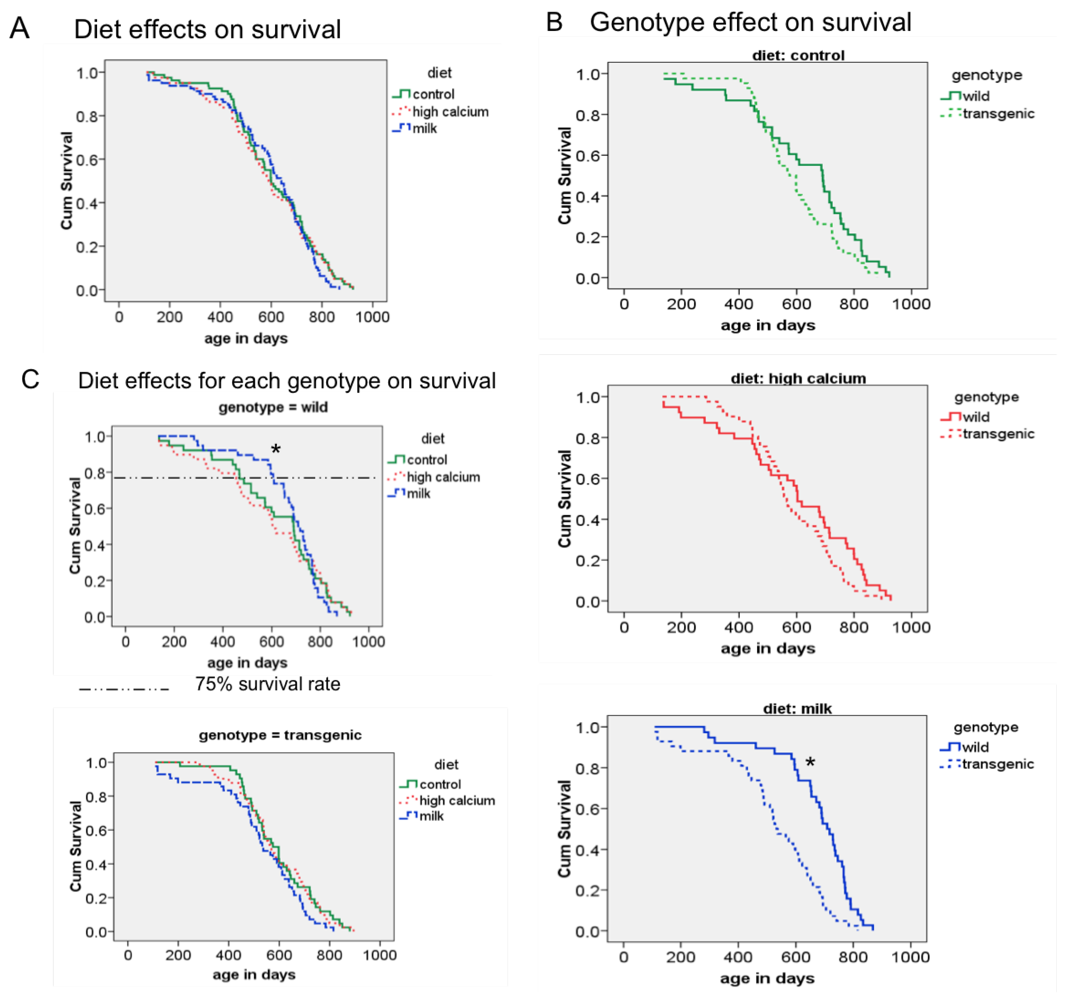
3.3. Survival
3.4. Additional Findings
| Diet | |||||||||||||||
|---|---|---|---|---|---|---|---|---|---|---|---|---|---|---|---|
| control | high calcium | NFDM | |||||||||||||
| Gene expression | Gender | Genotype | Age | mean ± SE | n | mean ± SE | n | mean ± SE | n | ||||||
| Sirt1 abdominal fat | female | wild | all | 0.88 | ± | 0.28 | 8 | 0.97 | ± | 0.17 | 8 | 0.82 | ± | 0.16 | 8 |
| transgenic | all | 0.12 | ± | 0.22 | 11 | 1.28 | ± | 0.25 | 9 | 0.91 | ± | 0.21 | 9 | ||
| both | all | 1.02 | ± | 0.17 | 19 | 1.13 | ± | 0.15 | 17 | 0.86 | ± | 0.13 | 17 | ||
| male | wild | all | 1.17 | ± | 0.38 a | 8 | 1.43 | ± | 0.16 b | 10 | 0.77 | ± | 0.12 a | 9 | |
| transgenic | all | 1.28 | ± | 0.24 | 8 | 1.02 | ± | 0.25 | 9 | 1.10 | ± | 0.22 | 9 | ||
| both | all | 1.23 | ± | 0.22 | 16 | 1.24 | ± | 0.15 | 19 | 0.94 | ± | 0.13 | 18 | ||
| both | wild | all | 1.03 | ± | 0.23 ab | 16 | 1.23 | ± | 0.13 b | 18 | 0.79 | ± | 0.09 a | 17 | |
| transgenic | all | 1.19 | ± | 0.16 | 19 | 1.15 | ± | 0.17 | 18 | 1.00 | ± | 0.15 | 18 | ||
| both | 28 wk | 0.53 | ± | 0.10 | 12 | 0.66 | ± | 0.13 | 12 | 0.69 | ± | 0.16 | 11 | ||
| 52 wk | 0.87 | ± | 0.12 ab | 12 | 1.09 | ± | 0.12 b | 12 | 0.56 | ± | 0.08 a | 12 | |||
| 78 wk | 2.02 | ± | 0.19 a | 11 | 1.81 | ± | 0.11 a | 12 | 1.43 | ± | 0.08 b | 12 | |||
| both | both | all | 1.12 | ± | 0.13 | 35 | 1.18 | ± | 0.11 | 36 | 0.90 | ± | 0.09 | 35 | |
| Sirt1 soleus | female | wild | all | 0.86 | ± | 0.12 | 11 | 1.02 | ± | 0.11 | 11 | 0.78 | ± | 0.08 | 12 |
| transgenic | all | 1.07 | ± | 0.08 a | 11 | 0.86 | ± | 0.08 ab | 11 | 0.82 | ± | 0.08 b | 12 | ||
| both | all | 0.97 | ± | 0.08 | 22 | 0.94 | ± | 0.07 | 22 | 0.80 | ± | 0.06 | 24 | ||
| male | wild | all | 0.96 | ± | 0.07 | 10 | 1.13 | ± | 0.10 | 11 | 0.98 | ± | 0.13 | 11 | |
| transgenic | all | 0.98 | ± | 0.11 | 11 | 1.01 | ± | 0.10 | 11 | 0.78 | ± | 0.08 | 12 | ||
| both | all | 0.97 | ± | 0.04 ab | 21 | 1.07 | ± | 0.07 b | 22 | 0.88 | ± | 0.08 a | 23 | ||
| both | wild | all | 0.91 | ± | 0.07 | 22 | 1.07 | ± | 0.07 | 22 | 0.88 | ± | 0.08 | 23 | |
| transgenic | all | 1.03 | ± | 0.05 a | 21 | 0.94 | ± | 0.06 ab | 22 | 0.80 | ± | 0.05 b | 24 | ||
| both | 28 wk | 0.79 | ± | 0.05 | 14 | 0.76 | ± | 0.05 | 15 | 0.69 | ± | 0.06 | 15 | ||
| 52 wk | 1.04 | ± | 0.09 ab | 15 | 1.20 | ± | 0.10 b | 13 | 0.88 | ± | 0.07 a | 16 | |||
| 78 wk | 1.07 | ± | 0.06 | 14 | 1.07 | ± | 0.07 | 16 | 0.93 | ± | 0.10 | 16 | |||
| both | both | all | 0.97 | ± | 0.04 a | 43 | 1.00 | ± | 0.05 a | 44 | 0.84 | ± | 0.05 b | 47 | |
| PPAR α liver | female | wild | all | 0.62 | ± | 0.11 | 12 | 0.65 | ± | 0.13 | 12 | 0.70 | ± | 0.10 | 12 |
| transgenic | all | 0.83 | ± | 0.14 a | 12 | 0.79 | ± | 0.14 a | 11 | 0.42 | ± | 0.07 b | 12 | ||
| both | all | 0.73 | ± | 0.09 | 24 | 0.72 | ± | 0.10 | 23 | 0.56 | ± | 0.07 | 24 | ||
| male | wild | all | 0.86 | ± | 0.18 | 11 | 0.40 | ± | 0.08 | 11 | 0.41 | ± | 0.08 | 11 | |
| transgenic | all | 0.86 | ± | 0.18 | 11 | 0.57 | ± | 0.11 | 12 | 0.56 | ± | 0.07 | 13 | ||
| both | all | 0.86 | ± | 0.12 a | 22 | 0.49 | ± | 0.07 b | 23 | 0.49 | ± | 0.05 b | 24 | ||
| both | wild | all | 0.74 | ± | 0.10 | 23 | 0.53 | ± | 0.08 | 23 | 0.56 | ± | 0.07 | 23 | |
| transgenic | all | 0.84 | ± | 0.11 a | 23 | 0.68 | ± | 0.09 ab | 23 | 0.49 | ± | 0.05 b | 25 | ||
| both | 28 wk | 0.88 | ± | 0.10 a | 15 | 0.57 | ± | 0.09 b | 16 | 0.56 | ± | 0.08 b | 17 | ||
| 52 wk | 0.47 | ± | 0.06 | 16 | 0.55 | ± | 0.11 | 15 | 0.45 | ± | 0.07 | 15 | |||
| 78 wk | 1.04 | ± | 0.17 a | 15 | 0.70 | ± | 0.12 ab | 15 | 0.56 | ± | 0.07 b | 16 | |||
| both | both | both | 0.79 | ± | 0.08 a | 46 | 0.61 | ± | 0.06 ab | 46 | 0.53 | ± | 0.04 b | 48 | |
4. Discussion
Conflict of Interest Disclosure
References
- Touyz, R.; Schiffrin, E. Reactive oxygen species in vascular biology: implications in hypertension. Histochem. Cell Biol. 2004, 122, 339–352. [Google Scholar] [CrossRef] [PubMed]
- Furukawa, S.; Fujita, T.; Shimabukuro, M.; Iwaki, M.; Yamada, Y.; Nakajima, Y.; Nakayama, O.; Makishima, M.; Matsuda, M.; Shimomura, I. Increased oxidative stress in obesity and its impact on metabolic syndrome. J. Clin. Invest. 2004, 114, 1752–1761. [Google Scholar] [PubMed]
- Rahimi, R.; Nikfar, S.; Larijani, B.; Abdollahi, M. A review on the role of antioxidants in the management of diabetes and its complications. Biomed. Pharmacother 2005, 59, 365–373. [Google Scholar] [CrossRef] [PubMed]
- Landis, G.; Tower, J. Superoxide dismutase evolution and life span regulation. Mech. Ageing Dev. 2005, 126, 365–379. [Google Scholar] [CrossRef] [PubMed]
- Harman, D. Aging: overview. Ann. N Y Acad. Sci. 2001, 928, 1–21. [Google Scholar] [CrossRef] [PubMed]
- Sun, X.; Zemel, M. Dietary calcium regulates ROS production in aP2-agouti transgenic mice on high-fat/high-sucrose diets. Int. J. Obes. (Lond) 2006, 30, 1341–1346. [Google Scholar] [CrossRef] [PubMed]
- Lee, H.C.; Wei, Y.H. Oxidative stress, mitochondrial DNA mutation, and apoptosis in aging. Exp. Biol. Med. (Maywood) 2007, 232, 592–606. [Google Scholar] [PubMed]
- Petrosillo, G.; Matera, M.; Moro, N.; Ruggiero, F.M.; Paradies, G. Mitochondrial complex I dysfunction in rat heart with aging: critical role of reactive oxygen species and cardiolipin. Free Radic. Biol. Med. 2009, 46, 88–94. [Google Scholar] [CrossRef] [PubMed]
- Ungvari, Z.; Labinskyy, N.; Gupte, S.; Chander, P.N.; Edwards, J.G.; Csiszar, A. Dysregulation of mitochondrial biogenesis in vascular endothelial and smooth muscle cells of aged rats. Am. J. Physiol. Heart Circ. Physiol. 2008, 294, H2121–H2128. [Google Scholar] [CrossRef] [PubMed]
- Choksi, K.B.; Nuss, J.E.; Deford, J.H.; Papaconstantinou, J. Age-related alterations in oxidatively damaged proteins of mouse skeletal muscle mitochondrial electron transport chain complexes. Free Radic. Biol. Med. 2008, 45, 826–838. [Google Scholar] [CrossRef] [PubMed]
- Sinitsyna, O.; Krysanova, Z.; Ishchenko, A.; Dikalova, A.E.; Stolyarov, S.; Kolosova, N.; Vasunina, E.; Nevinsky, G. Age-associated changes in oxidative damage and the activity of antioxidant enzymes in rats with inherited overgeneration of free radicals. J. Cell Mol. Med. 2006, 10, 206–215. [Google Scholar] [CrossRef] [PubMed]
- Csiszar, A.; Wang, M.; Lakatta, E.G.; Ungvari, Z. Inflammation and endothelial dysfunction during aging: role of NF-kappaB. J. Appl. Physiol. 2008, 105, 1333–1341. [Google Scholar] [CrossRef] [PubMed]
- Mariappan, N.; Soorappan, R.N.; Haque, M.; Sriramula, S.; Francis, J. TNF-alpha-induced mitochondrial oxidative stress and cardiac dysfunction: restoration by superoxide dismutase mimetic Tempol. Am. J. Physiol. Heart Circ. Physiol. 2007, 293, H2726–H2737. [Google Scholar] [CrossRef] [PubMed]
- Wei, Y.H.; Lee, H.C. Oxidative stress, mitochondrial DNA mutation, and impairment of antioxidant enzymes in aging. Exp. Biol. Med. (Maywood) 2002, 227, 671–682. [Google Scholar] [PubMed]
- Zemel, M.; Thompson, W.; Milstead, A.; Morris, K.; Campbell, P. Calcium and dairy acceleration of weight and fat loss during energy restriction in obese adults. Obes. Res. 2004, 12, 582–590. [Google Scholar] [CrossRef] [PubMed]
- Zemel, M. Regulation of adiposity and obesity risk by dietary calcium: mechanisms and implications. J. Am. Coll Nutr. 2002, 21, 146S–151S. [Google Scholar] [PubMed]
- Zemel, M. Role of calcium and dairy products in energy partitioning and weight management. Am. J. Clin. Nutr. 2004, 79, 907S–912S. [Google Scholar] [PubMed]
- Morris, K.; Zemel, M. 1,25-dihydroxyvitamin D3 modulation of adipocyte glucocorticoid function. Obes. Res. 2005, 13, 670–677. [Google Scholar] [CrossRef] [PubMed]
- Katagiri, H.; Yamada, T.; Oka, Y. Adiposity and cardiovascular disorders: disturbance of the regulatory system consisting of humoral and neuronal signals. Circ. Res. 2007, 101, 27–39. [Google Scholar] [CrossRef] [PubMed]
- Sun, X.; Zemel, M.B. Calcium and 1,25-dihydroxyvitamin D3 regulation of adipokine expression. Obesity (Silver Spring) 2007, 15, 340–348. [Google Scholar] [CrossRef] [PubMed]
- Sun, X.; Zemel, M.B. 1Alpha,25-dihydroxyvitamin D3 modulation of adipocyte reactive oxygen species production. Obesity (Silver Spring) 2007, 15, 1944–1953. [Google Scholar] [CrossRef] [PubMed]
- Sun, X.; Zemel, M. Leucine and calcium regulate fat metabolism and energy partitioning in murine adipocytes and muscle cells. Lipids 2007, 42, 297–305. [Google Scholar] [CrossRef] [PubMed]
- Zemel, M.B.; Sun, X. Dietary calcium and dairy products modulate oxidative and inflammatory stress in mice and humans. J. Nutr. 2008, 138, 1047–1052. [Google Scholar] [PubMed]
- Mynatt, R.; Miltenberger, R.; Klebig, M.; Zemel, M.; Wilkinson, J.; Wilkinson, W.; Woychik, R. Combined effects of insulin treatment and adipose tissue-specific agouti expression on the development of obesity. Proc. Natl. Acad. Sci. U S A 1997, 94, 919–922. [Google Scholar] [PubMed]
- Manea, A.; Constantinescu, E.; Popov, D.; Raicu, M. Changes in oxidative balance in rat pericytes exposed to diabetic conditions. J. Cell Mol. Med. 2004, 8, 117–126. [Google Scholar] [CrossRef] [PubMed]
- Sies, M. Oxygen Radicals in Biological Systems. In Methods in Enzymology; Packer, L., Ed.; Academic Press, Inc.: Burlington, MA, USA, 1984; Volume 105. [Google Scholar]
- Piva, E.; de Toni, S.; Caenazzo, A.; Pradella, M.; Pietrogrande, F.; Plebani, M. Neutrophil NADPH oxidase activity in chronic myeloproliferative and myelodysplastic diseases by microscopic and photometric assays. Acta Haematol. 1995, 94, 16–22. [Google Scholar] [CrossRef] [PubMed]
- Hardie, G.H. Stress Response: Methods and Protocols. In Methods in Molecular Biology; Keyse, S.M., Ed.; Humana Press Inc.: Totowa, NJ, USA, 1999; Volume 99. [Google Scholar]
- Zemel, M.; Richards, J.; Milstead, A.; Campbell, P. Effects of calcium and dairy on body composition and weight loss in African-American adults. Obes. Res. 2005, 13, 1218–1225. [Google Scholar] [CrossRef] [PubMed]
- Zemel, M.; Shi, H.; Greer, B.; Dirienzo, D.; Zemel, P. Regulation of adiposity by dietary calcium. FASEB J. 2000, 14, 1132–1138. [Google Scholar] [PubMed]
- Sun, X.; Zemel, M. Calcium and dairy products inhibit weight and fat regain during ad libitum consumption following energy restriction in Ap2-agouti transgenic mice. J. Nutr. 2004, 134, 3054–3060. [Google Scholar] [PubMed]
- Zemel, M.; Richards, J.; Mathis, S.; Milstead, A.; Gebhardt, L.; Silva, E. Dairy augmentation of total and central fat loss in obese subjects. Int. J. Obes. (Lond) 2005, 29, 391–397. [Google Scholar] [CrossRef] [PubMed]
- Rieu, I.; Balage, M.; Sornet, C.; Debras, E.; Ripes, S.; Rochon-Bonhomme, C.; Pouyet, C.; Grizard, J.; Dardevet, D. Increased availability of leucine with leucine-rich whey proteins improves postprandial muscle protein synthesis in aging rats. Nutrition 2007, 23, 323–331. [Google Scholar] [CrossRef] [PubMed]
- Kimball, S.R.; Jefferson, L.S. Signaling pathways and molecular mechanisms through which branched-chain amino acids mediate translational control of protein synthesis. J. Nutr. 2006, 136, 227S–231S. [Google Scholar] [PubMed]
- Fujita, S.; Volpi, E. Amino acids and muscle loss with aging. J. Nutr. 2006, 136, 277S–280S. [Google Scholar] [PubMed]
- Harman, D. Aging: a theory based on free radical and radiation chemistry. J. Gerontol. 1956, 11, 298–300. [Google Scholar] [PubMed]
- Linnane, A.W.; Marzuki, S.; Ozawa, T.; Tanaka, M. Mitochondrial DNA mutations as an important contributor to ageing and degenerative diseases. Lancet 1989, 1, 642–645. [Google Scholar] [PubMed]
- Chrissobolis, S.; Faraci, F.M. The role of oxidative stress and NADPH oxidase in cerebrovascular disease. Trends Mol. Med. 2008, 14, 495–502. [Google Scholar] [CrossRef] [PubMed]
- Gordeeva, A.V.; Zvyagilskaya, R.A.; Labas, Y.A. Cross-talk between reactive oxygen species and calcium in living cells. Biochemistry (Mosc) 2003, 68, 1077–1080. [Google Scholar] [CrossRef] [PubMed]
- Volk, T.; Hensel, M.; Kox, W.J. Transient Ca2+ changes in endothelial cells induced by low doses of reactive oxygen species: role of hydrogen peroxide. Mol. Cell Biochem. 1997, 171, 11–21. [Google Scholar] [CrossRef] [PubMed]
- Shi, H.; Norman, A.; Okamura, W.; Sen, A.; Zemel, M. 1alpha,25-dihydroxyvitamin D3 inhibits uncoupling protein 2 expression in human adipocytes. FASEB J. 2002, 16, 1808–1810. [Google Scholar] [PubMed]
- Hanna, I.R.; Taniyama, Y.; Szocs, K.; Rocic, P.; Griendling, K.K. NAD(P)H oxidase-derived reactive oxygen species as mediators of angiotensin II signaling. Antioxid. Redox Signal. 2002, 4, 899–914. [Google Scholar] [CrossRef] [PubMed]
- Seshiah, P.N.; Weber, D.S.; Rocic, P.; Valppu, L.; Taniyama, Y.; Griendling, K.K. Angiotensin II stimulation of NAD(P)H oxidase activity: upstream mediators. Circ. Res. 2002, 91, 406–413. [Google Scholar] [CrossRef] [PubMed]
- de Cavanagh, E.M.; Inserra, F.; Ferder, M.; Ferder, L. From mitochondria to disease: role of the renin-angiotensin system. Am. J. Nephrol. 2007, 27, 545–553. [Google Scholar] [CrossRef] [PubMed]
- Sandhu, S.K.; Kaur, G. Alterations in oxidative stress scavenger system in aging rat brain and lymphocytes. Biogerontology 2002, 3, 161–173. [Google Scholar] [CrossRef] [PubMed]
- Lin, Y.; Berg, A.H.; Iyengar, P.; Lam, T.K.; Giacca, A.; Combs, T.P.; Rajala, M.W.; Du, X.; Rollman, B.; Li, W.; Hawkins, M.; Barzilai, N.; Rhodes, C.J.; Fantus, I.G.; Brownlee, M.; Scherer, P.E. The hyperglycemia-induced inflammatory response in adipocytes: the role of reactive oxygen species. J. Biol. Chem. 2005, 280, 4617–4626. [Google Scholar] [PubMed]
- Ferrario, C.M.; Strawn, W.B. Role of the renin-angiotensin-aldosterone system and proinflammatory mediators in cardiovascular disease. Am. J. Cardiol. 2006, 98, 121–128. [Google Scholar] [CrossRef] [PubMed]
- Lundgren, M.; Buren, J.; Lindgren, P.; Myrnas, T.; Ruge, T.; Eriksson, J.W. Sex- and depot-specific lipolysis regulation in human adipocytes: interplay between adrenergic stimulation and Glucocorticoids. Horm. Metab. Res. 2008, 40, 854–860. [Google Scholar] [CrossRef] [PubMed]
- Hernandez-Morante, J.J.; Perez-de-Heredia, F.; Lujan, J.A.; Zamora, S.; Garaulet, M. Role of DHEA-S on body fat distribution: gender- and depot-specific stimulation of adipose tissue lipolysis. Steroids 2008, 73, 209–215. [Google Scholar] [CrossRef] [PubMed]
- Mattsson, C.; Olsson, T. Estrogens and glucocorticoid hormones in adipose tissue metabolism. Curr. Med. Chem. 2007, 14, 2918–2924. [Google Scholar] [CrossRef] [PubMed]
- Tchernof, A. Visceral adipocytes and the metabolic syndrome. Nutr. Rev. 2007, 65, S24–S29. [Google Scholar] [CrossRef] [PubMed]
- Hamdy, O.; Porramatikul, S.; Al-Ozairi, E. Metabolic obesity: the paradox between visceral and subcutaneous fat. Curr. Diabetes Rev. 2006, 2, 367–373. [Google Scholar] [PubMed]
- Rogers, A.; Eastell, R. The effect of 17beta-estradiol on production of cytokines in cultures of peripheral blood. Bone 2001, 29, 30–34. [Google Scholar] [CrossRef] [PubMed]
- Huang, H.; He, J.; Yuan, Y.; Aoyagi, E.; Takenaka, H.; Itagaki, T.; Sannomiya, K.; Tamaki, K.; Harada, N.; Shono, M.; Shimizu, I.; Takayama, T. Opposing effects of estradiol and progesterone on the oxidative stress-induced production of chemokine and proinflammatory cytokines in murine peritoneal macrophages. J. Med. Invest. 2008, 55, 133–141. [Google Scholar] [CrossRef] [PubMed]
- Kampkotter, A.; Timpel, C.; Zurawski, R.F.; Ruhl, S.; Chovolou, Y.; Proksch, P.; Watjen, W. Increase of stress resistance and lifespan of Caenorhabditis elegans by quercetin. Comp. Biochem. Physiol. B Biochem. Mol. Biol. 2008, 149, 314–323. [Google Scholar] [CrossRef] [PubMed]
- Parkes, T.L.; Elia, A.J.; Dickinson, D.; Hilliker, A.J.; Phillips, J.P.; Boulianne, G.L. Extension of Drosophila lifespan by overexpression of human SOD1 in motorneurons. Nat. Genet. 1998, 19, 171–174. [Google Scholar] [CrossRef] [PubMed]
- Larsen, P.L. Aging and resistance to oxidative damage in Caenorhabditis elegans. Proc. Natl. Acad. Sci. U S A 1993, 90, 8905–8909. [Google Scholar] [CrossRef] [PubMed]
- Okuma, Y.; Nomura, Y. Senescence-accelerated mouse (SAM) as an animal model of senile dementia: pharmacological, neurochemical and molecular biological approach. Jpn. J. Pharmacol. 1998, 78, 399–404. [Google Scholar] [CrossRef] [PubMed]
- Edamatsu, R.; Mori, A.; Packer, L. The spin-trap N-tert-alpha-phenyl-butylnitrone prolongs the life span of the senescence accelerated mouse. Biochem. Biophys. Res. Commun. 1995, 211, 847–849. [Google Scholar] [CrossRef] [PubMed]
- Schriner, S.E.; Linford, N.J.; Martin, G.M.; Treuting, P.; Ogburn, C.E.; Emond, M.; Coskun, P.E.; Ladiges, W.; Wolf, N.; Van Remmen, H.; Wallace, D.C.; Rabinovitch, P.S. Extension of murine life span by overexpression of catalase targeted to mitochondria. Science 2005, 308, 1909–1911. [Google Scholar] [PubMed]
- Wu, S.; Li, Q.; Du, M.; Li, S.Y.; Ren, J. Cardiac-specific overexpression of catalase prolongs lifespan and attenuates ageing-induced cardiomyocyte contractile dysfunction and protein damage. Clin. Exp. Pharmacol. Physiol. 2007, 34, 81–87. [Google Scholar] [CrossRef] [PubMed]
- van Remmen, H.; Ikeno, Y.; Hamilton, M.; Pahlavani, M.; Wolf, N.; Thorpe, S.R.; Alderson, N.L.; Baynes, J.W.; Epstein, C.J.; Huang, T.T.; Nelson, J.; Strong, R.; Richardson, A. Life-long reduction in MnSOD activity results in increased DNA damage and higher incidence of cancer but does not accelerate aging. Physiol. Genomics 2003, 16, 29–37. [Google Scholar] [CrossRef] [PubMed]
- Westphal, C.H.; Dipp, M.A.; Guarente, L. A therapeutic role for sirtuins in diseases of aging? Trends Biochem. Sci. 2007, 32, 555–560. [Google Scholar]
- Yang, H.; Yang, T.; Baur, J.A.; Perez, E.; Matsui, T.; Carmona, J.J.; Lamming, D.W.; Souza-Pinto, N.C.; Bohr, V.A.; Rosenzweig, A.; de Cabo, R.; Sauve, A.A.; Sinclair, D.A. Nutrient-sensitive mitochondrial NAD+ levels dictate cell survival. Cell 2007, 130, 1095–1107. [Google Scholar] [CrossRef] [PubMed]
- Guarente, L.; Picard, F. Calorie restriction--the SIR2 connection. Cell 2005, 120, 473–482. [Google Scholar] [CrossRef] [PubMed]
- Zandbergen, F.; Plutzky, J. PPARalpha in atherosclerosis and inflammation. Biochim. Biophys. Acta 2007, 1771, 972–982. [Google Scholar] [PubMed]
© 2009 by the authors; licensee Molecular Diversity Preservation International, Basel, Switzerland This article is an open-access article distributed under the terms and conditions of the Creative Commons Attribution license (http://creativecommons.org/licenses/by/3.0/).
Share and Cite
Bruckbauer, A.; Zemel, M.B. Dietary Calcium and Dairy Modulation of Oxidative Stress and Mortality in aP2-Agouti and Wild-type Mice. Nutrients 2009, 1, 50-70. https://doi.org/10.3390/nu1010050
Bruckbauer A, Zemel MB. Dietary Calcium and Dairy Modulation of Oxidative Stress and Mortality in aP2-Agouti and Wild-type Mice. Nutrients. 2009; 1(1):50-70. https://doi.org/10.3390/nu1010050
Chicago/Turabian StyleBruckbauer, Antje, and Michael B. Zemel. 2009. "Dietary Calcium and Dairy Modulation of Oxidative Stress and Mortality in aP2-Agouti and Wild-type Mice" Nutrients 1, no. 1: 50-70. https://doi.org/10.3390/nu1010050
APA StyleBruckbauer, A., & Zemel, M. B. (2009). Dietary Calcium and Dairy Modulation of Oxidative Stress and Mortality in aP2-Agouti and Wild-type Mice. Nutrients, 1(1), 50-70. https://doi.org/10.3390/nu1010050