Article

Short-Term Impacts of the Air Temperature on Greening and Senescence in Alaskan Arctic Plant Tundra Habitats

1
Department of Biological Sciences, Florida International University, 11200 SW 8th Str., Miami, FL 33199, USA
2
Institute of Crop Science and Resource Conservation, University of Bonn, Katzenburgweg 5, 53115 Bonn, Germany
3
Department of Biological Sciences, Grand Valley State University, 1 Campus Dr., Allendale, MI 49401, USA
4
Department of Biological Sciences, University of Texas at El Paso, 500 West University Ave., El Paso, TX 79968, USA
5
Ecology and Genetics Unit, University of Oulu, 90014 Oulu, Finland
6
Department of Biological Sciences, University of Alaska Anchorage, 3101 Science Circle, CPSB 101, Anchorage, AK 99508, USA
7
USDA Forest Service International Institute of Tropical Forestry, Rio Piedras 00926, Puerto Rico
*
Author to whom correspondence should be addressed.
Remote Sens. 2017, 9(12), 1338; https://doi.org/10.3390/rs9121338
Submission received: 31 October 2017 / Revised: 12 December 2017 / Accepted: 14 December 2017 / Published: 20 December 2017
(This article belongs to the Special Issue Remote Sensing of Arctic Tundra)

Abstract

:
Climate change is warming the temperatures and lengthening the Arctic growing season with potentially important effects on plant phenology. The ability of plant species to acclimate to changing climatic conditions will dictate the level to which their spatial coverage and habitat-type dominance is different in the future. While the effect of changes in temperature on phenology and species composition have been observed at the plot and at the regional scale, a systematic assessment at medium spatial scales using new noninvasive sensor techniques has not been performed yet. At four sites across the North Slope of Alaska, changes in the Normalized Difference Vegetation Index (NDVI) signal were observed by Mobile Instrumented Sensor Platforms (MISP) that are suspended over 50 m transects spanning local moisture gradients. The rates of greening (measured in June) and senescence (measured in August) in response to the air temperature was estimated by changes in NDVI measured as the difference between the NDVI on a specific date and three days later. In June, graminoid- and shrub-dominated habitats showed the greatest rates of NDVI increase in response to the high air temperatures, while forb- and lichen-dominated habitats were less responsive. In August, the NDVI was more responsive to variations in the daily average temperature than spring greening at all sites. For graminoid- and shrub-dominated habitats, we observed a delayed decrease of the NDVI, reflecting a prolonged growing season, in response to high August temperatures. Consequently, the annual C assimilation capacity of these habitats is increased, which in turn may be partially responsible for shrub expansion and further increases in net summer CO2 fixation. Strong interannual differences highlight that long-term and noninvasive measurements of such complex feedback mechanisms in arctic ecosystems are critical to fully articulate the net effects of climate variability and climate change on plant community and ecosystem processes.

1. Introduction

The recent climate warming has already had a significant impact on plant phenology and ecosystem processes, particularly in Arctic regions [1,2,3]. Adaptations to low temperatures and a short growing season require plants to respond to small changes in air temperature [4,5,6,7]. Therefore, changes in plant dominance and ecosystem function in the Arctic are largely driven by temperature, along with precipitation and growing season length [8,9,10,11,12]. Among the changes observed, most notable is that shrubs and graminoids are currently increasing in dominance [10,13,14,15,16,17]. Early studies from the International Tundra Experiment (ITEX) postulated that some of the major temperature-induced changes in Arctic plant growth, physiology, and ecosystem processes are either related to spring (earlier greening) or autumn (delayed senescence) temperatures [17,18].
Remote sensing (e.g., satellite, airborne, unpiloted aerial vehicles) of terrestrial vegetation habitats has been the method of choice for monitoring ecosystem changes in the Arctic because of its large spatial extent, harsh conditions, and remote locations which introduce logistical difficulties for in situ observations [19]. One of the most common indices for remotely monitoring the terrestrial vegetation community productivity is the Normalized Difference Vegetation Index (NDVI), which utilizes reflectances of red and near-infrared wavelengths from a vegetated surface [20]. Remotely sensed data have been used extensively for understanding ecosystem processes in the Arctic [21,22,23,24].
Rapid changes in the Arctic, such as shrub expansion, [13,14,15] accentuate the urgent need for long-term Arctic vegetation monitoring to fully understand the effects of climate change at high latitudes. Arctic plant habitats are characterized by high spatial heterogeneity, often at relatively small scales (submeter), in response to moisture gradients, limiting the ability to predict phenological changes detected by remote sensing at the landscape scales [25,26,27]. Although the vegetation in some regions of the Arctic is well studied, with many studies documenting shifts in habitat type, NDVI, productivity, and phenology in recent decades [17,21,23,28,29,30,31], most of these data were collected once, twice, or very rarely three times per week. As a result, few studies to date have investigated the role of daily air temperatures on the short-term progression of greening and senescence in tundra habitats. To the best of our knowledge, no study has conducted a systematic assessment of NDVI response to daily changes in air temperatures across an arctic temperature gradient, thus integrating various plant habitats adapted to different environmental conditions. Temperatures in the Arctic are highly variable at different spatial and temporal scales. Understanding the impacts of the air temperature on the length of the growing season and on the corresponding changes to greenness as observed by remote sensing techniques is of great importance for arctic ecosystem studies. Mobile instrumented sensor platform (MISP) observations provide extremely useful data for documenting phenological responses across a range of tundra habitats on fine spatial scales because of their ability to repeatedly, objectively, and nonintrusively collect a variety of measurements, including spectral reflectance, surface temperature, ambient radiation conditions [32]. Here, we present five years of spectral reflectance data from MISP observations and apply the derived NDVI values to investigate the rates and timing of greening and senescence of different Arctic plant habitats in response to air temperature events.

2. Methods

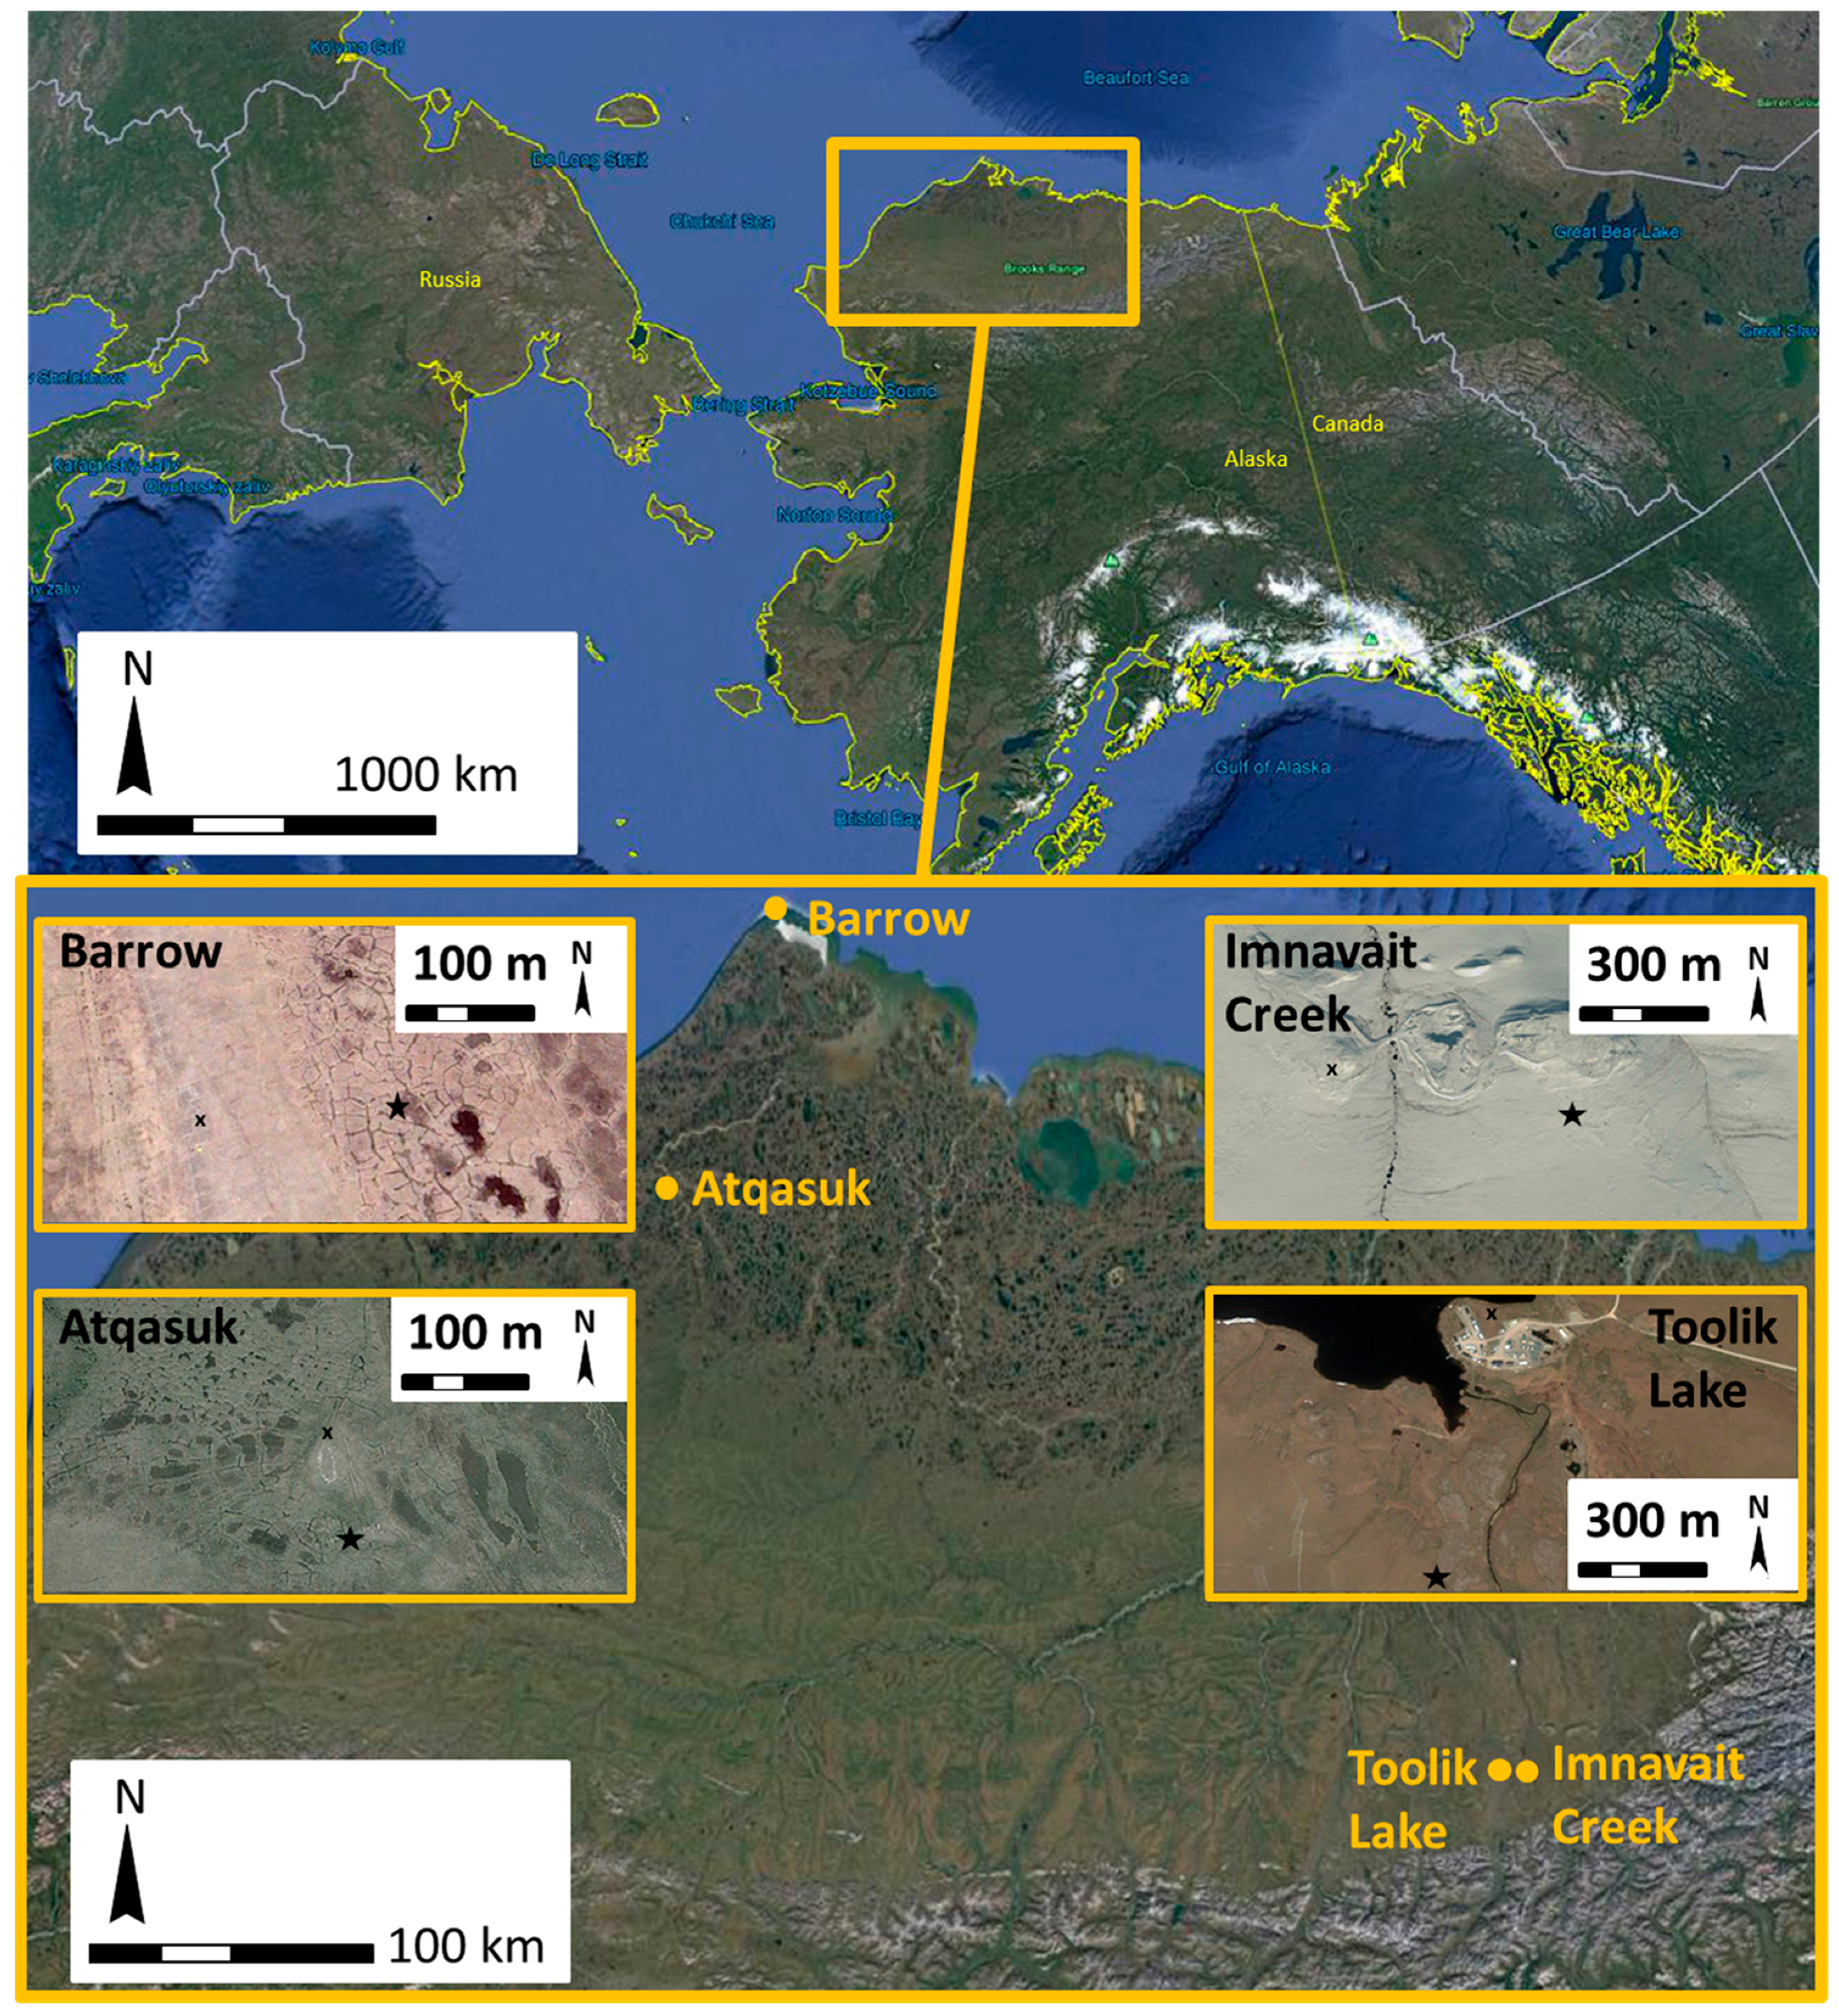
2.1. Site Description

Our study sites on the North Slope of Alaska, which spans a latitudinal gradient from High Arctic, Coastal Plain tundra to Low Arctic, foothill tundra, were established in 2010 (Figure 1). Each transect is located within a 1 km2 Arctic System Science Program (ARCSS) long-term monitoring grid and is adjacent to an International Tundra Experiment site (ITEX) [33]. Each transect is approximately 50 m in length and spans local moisture gradients and the associated vegetation habitat types. The Barrow site (71°18′N, 156°40′W, 7 m a.s.l.) experiences a marine High Arctic climate as it is located less than 3 km from the Arctic Ocean. The transect spans plant habitat types ranging from dry heath to wet meadow, sedge-dominated tundra. The Atqasuk transect experiences a continental climate and is located approximately 100 km south of Barrow (70°29′N, 157°25′W, 21 m a.s.l.). The transect spans plant habitat types ranging from dry heath to moist acidic tussock, to wet meadow sedge tundra. The two southernmost transects (Toolik Lake and Imnavait Creek) are located at approximately the same latitude in the foothills of the Brooks Range, but differ by almost 200 m in elevation. Imnavait Creek (68°37′N, 149°18′W, 927 m a.s.l.) spans plant habitat types ranging from dry heath to moist acidic tussock, to wet acidic tussock tundra, and Toolik Lake (68°37′N, 149°36′W, 736 m a.s.l.) spans dry heath to deciduous shrub-dominated, to moist acidic tussock tundra. The habitat type was determined using the dominant species present within a section of each transect (Table 1). Full details of the MISP systems are provided in Healey et al. [32].

2.2. Measurements

Data collection occurred during the snow-free growing season (i.e., late May-late August at Toolik Lake and Imnavait Creek, and early June-mid-late August at Barrow and Atqasuk) from 2012 to 2016. Daily sampling was conducted near solar noon. Data were not collected during high winds, rain, or snow, which accounted for the majority of the missing dates. The MISP systems support a variety of instrumentation designed for long-term baseline vegetation monitoring [32]. The MISP system moves along steel cables suspended 1–2 m above the ground surface and is propelled along the transect by a motor and pulley system at a speed of 3 cm s−1. The suite of instruments mounted on the MISP system measures a variety of variables (e.g., reflectance, temperature, etc.) every 1–3 s, allowing for fine-scale resolution measurements of tundra habitat-type properties. Here, we present NDVI measurements using a LED-illuminated GreenSeeker RT100 (Trimble Navigation Ltd., Sunnyvale, CA, USA) NDVI sensor, and data were stored on a Campbell Scientific CR3000 Data logger (Campbell Scientific: Logan, UT, USA). GreenSeeker NDVI measurements, that are the normalized difference between the reflectance of near-infrared (774 nm) and red (656) radiations (NDVI = (R774 − R656)/(R774 + R656)), were made every second and averaged to represent 45 cm segments along each transect. For a more detailed description of the MISP platform and corresponding measurement techniques we refer to Healey et al. [32].
Hourly air temperature measurements were obtained from weather stations located at <1 km from each transect and used to determine mean daily temperature values. Meteorological data for Barrow and Atqasuk were obtained from weather stations located at the nearby ITEX research sites (the maximum distance to each transect averages 250 m) [34]. Meteorological data for Imnavait Creek and Toolik Lake stations were provided by the Toolik Field Station Environmental Data Center [35].

2.3. Data Analysis

Hourly air temperatures collected from the weather stations near each transect were aggregated to daily values for the observation periods in June and August 2012–2016. Daily averaged temperatures were grouped into three categories (<5 °C, 5–10 °C, >10 °C) for each study day, selected for even spread of temperatures during June and August. NDVI values, indicative of changes in green biomass, were used to determine the average rates of habitat-type greening (measured in June) and senescence (measured in August and defined by a decrease in NDVI from the peak value). Temperature responses of NDVI were calculated as the difference between habitat-specific NDVI values and the NDVI values observed after a time lag of three days (NDVIresponse = NDVIday0 − NDVIday3). The three-day time period for NDVI changes was chosen on the basis of an analysis of the best relationship between the number of days for a change in temperature category and NDVI using a set of general linear models (Table A1).
NDVI responsiveness was compared among the three temperature categories relative to the average NDVI change for each month using repeated measures analysis of variance tests with Tukey’s post hoc analysis for significance among groups. All statistical tests were performed using the R Studio statistical environment [36].

3. Results

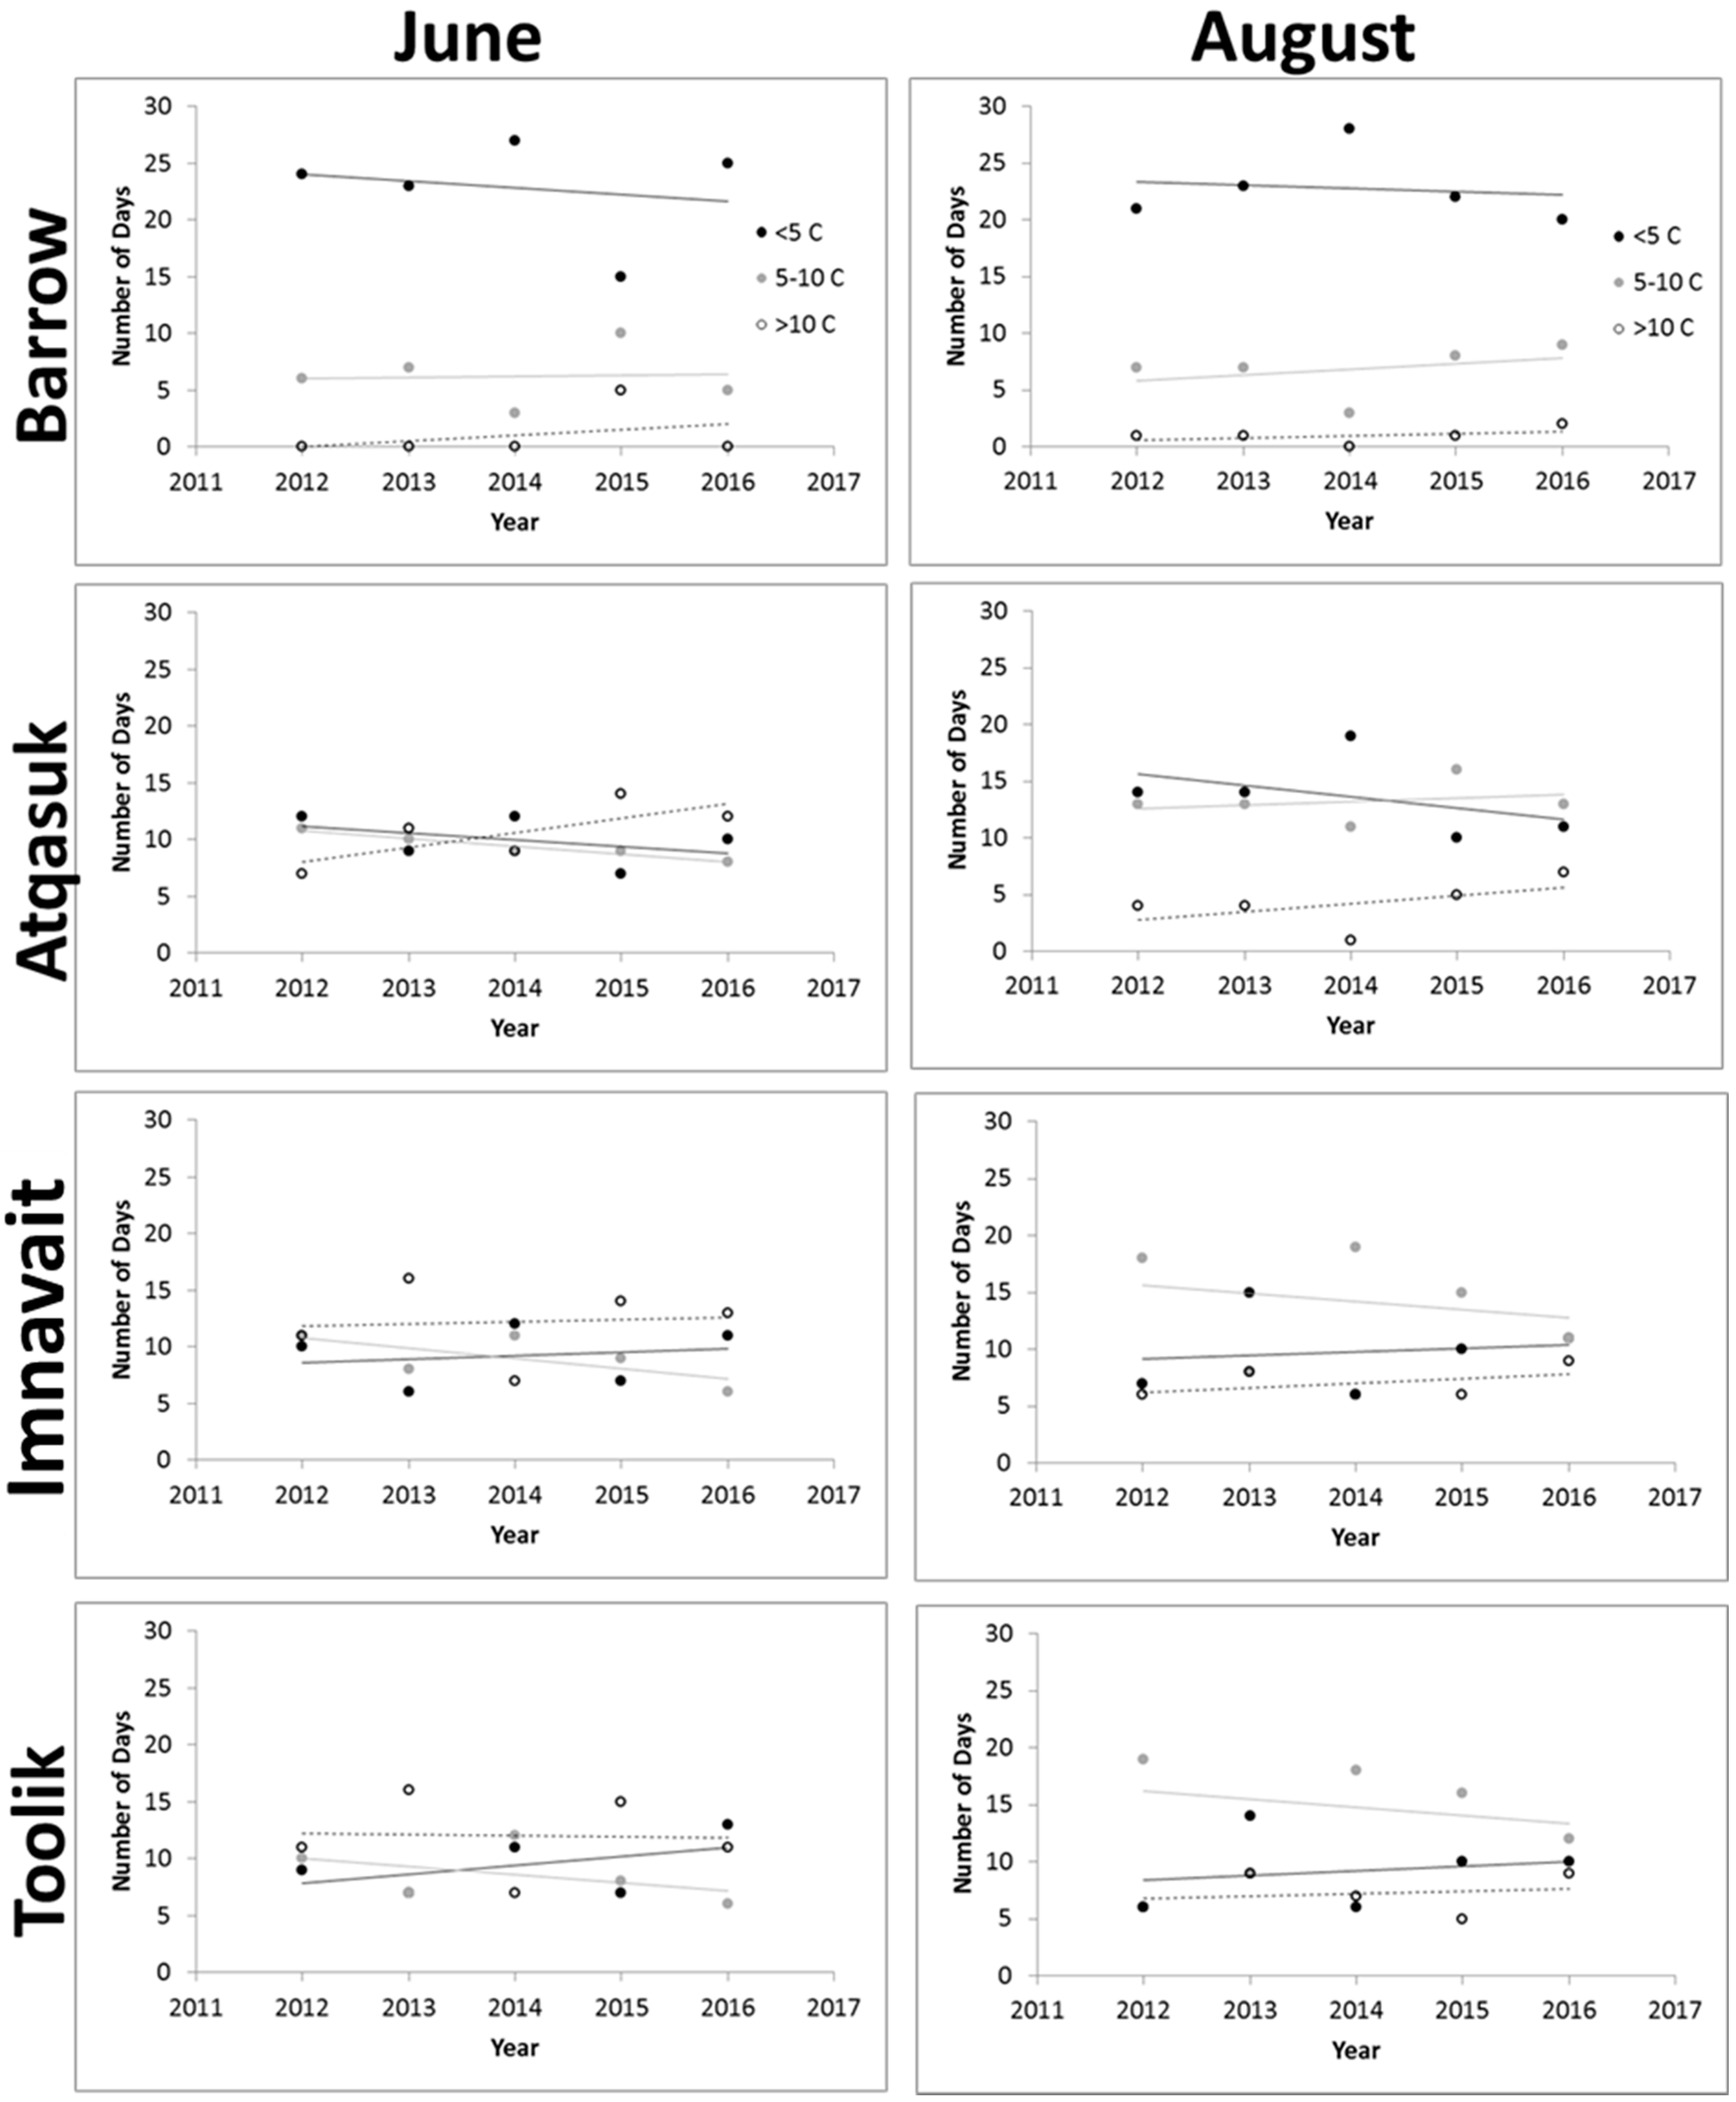
3.1. Site Temperature Patterns

June temperature data for 2012–2016 at the four MISP observation transects showed the expected temperature gradient, as indicated by a change in the frequency of temperature categories, between northerly sites and southern sites. At Barrow, more than 75% of the days were <5 °C with the remainder falling into the 5–10 °C category; in the five years of the study, no June dates averaged >10 °C. In contrast, average daily temperatures at Atqasuk were relatively evenly divided among the three categories. As might be expected given their relatively close proximity (Figure 1), the >10 °C was the most frequent category at Imnavait Creek and Toolik in three of the five years, with more than half of the days >10 °C in at least one year. June of 2014 was unusually cool for all sites but Toolik, and the most frequent temperature category was <5 °C for that month (Figure 2).
For August, more than 70% of days at Barrow were <5 °C, with most of the remainder in the 5–10 °C category (Figure 2). At least one occurrence of >10 °C occurred in four of the five years. At Atqasuk, most of the days were relatively evenly divided between the <5 and 5–10 °C categories, with an average of four days >10 °C. Over half of the dates at both Imnavait Creek and Toolik Lake were covered by the 5–10 °C category, with the remainder somewhat evenly divided among the <5 and >10 °C categories. The low temperatures in June of 2014 carried over into August at Barrow and Atqasuk, with the <5 °C category more frequent than in the other four years.

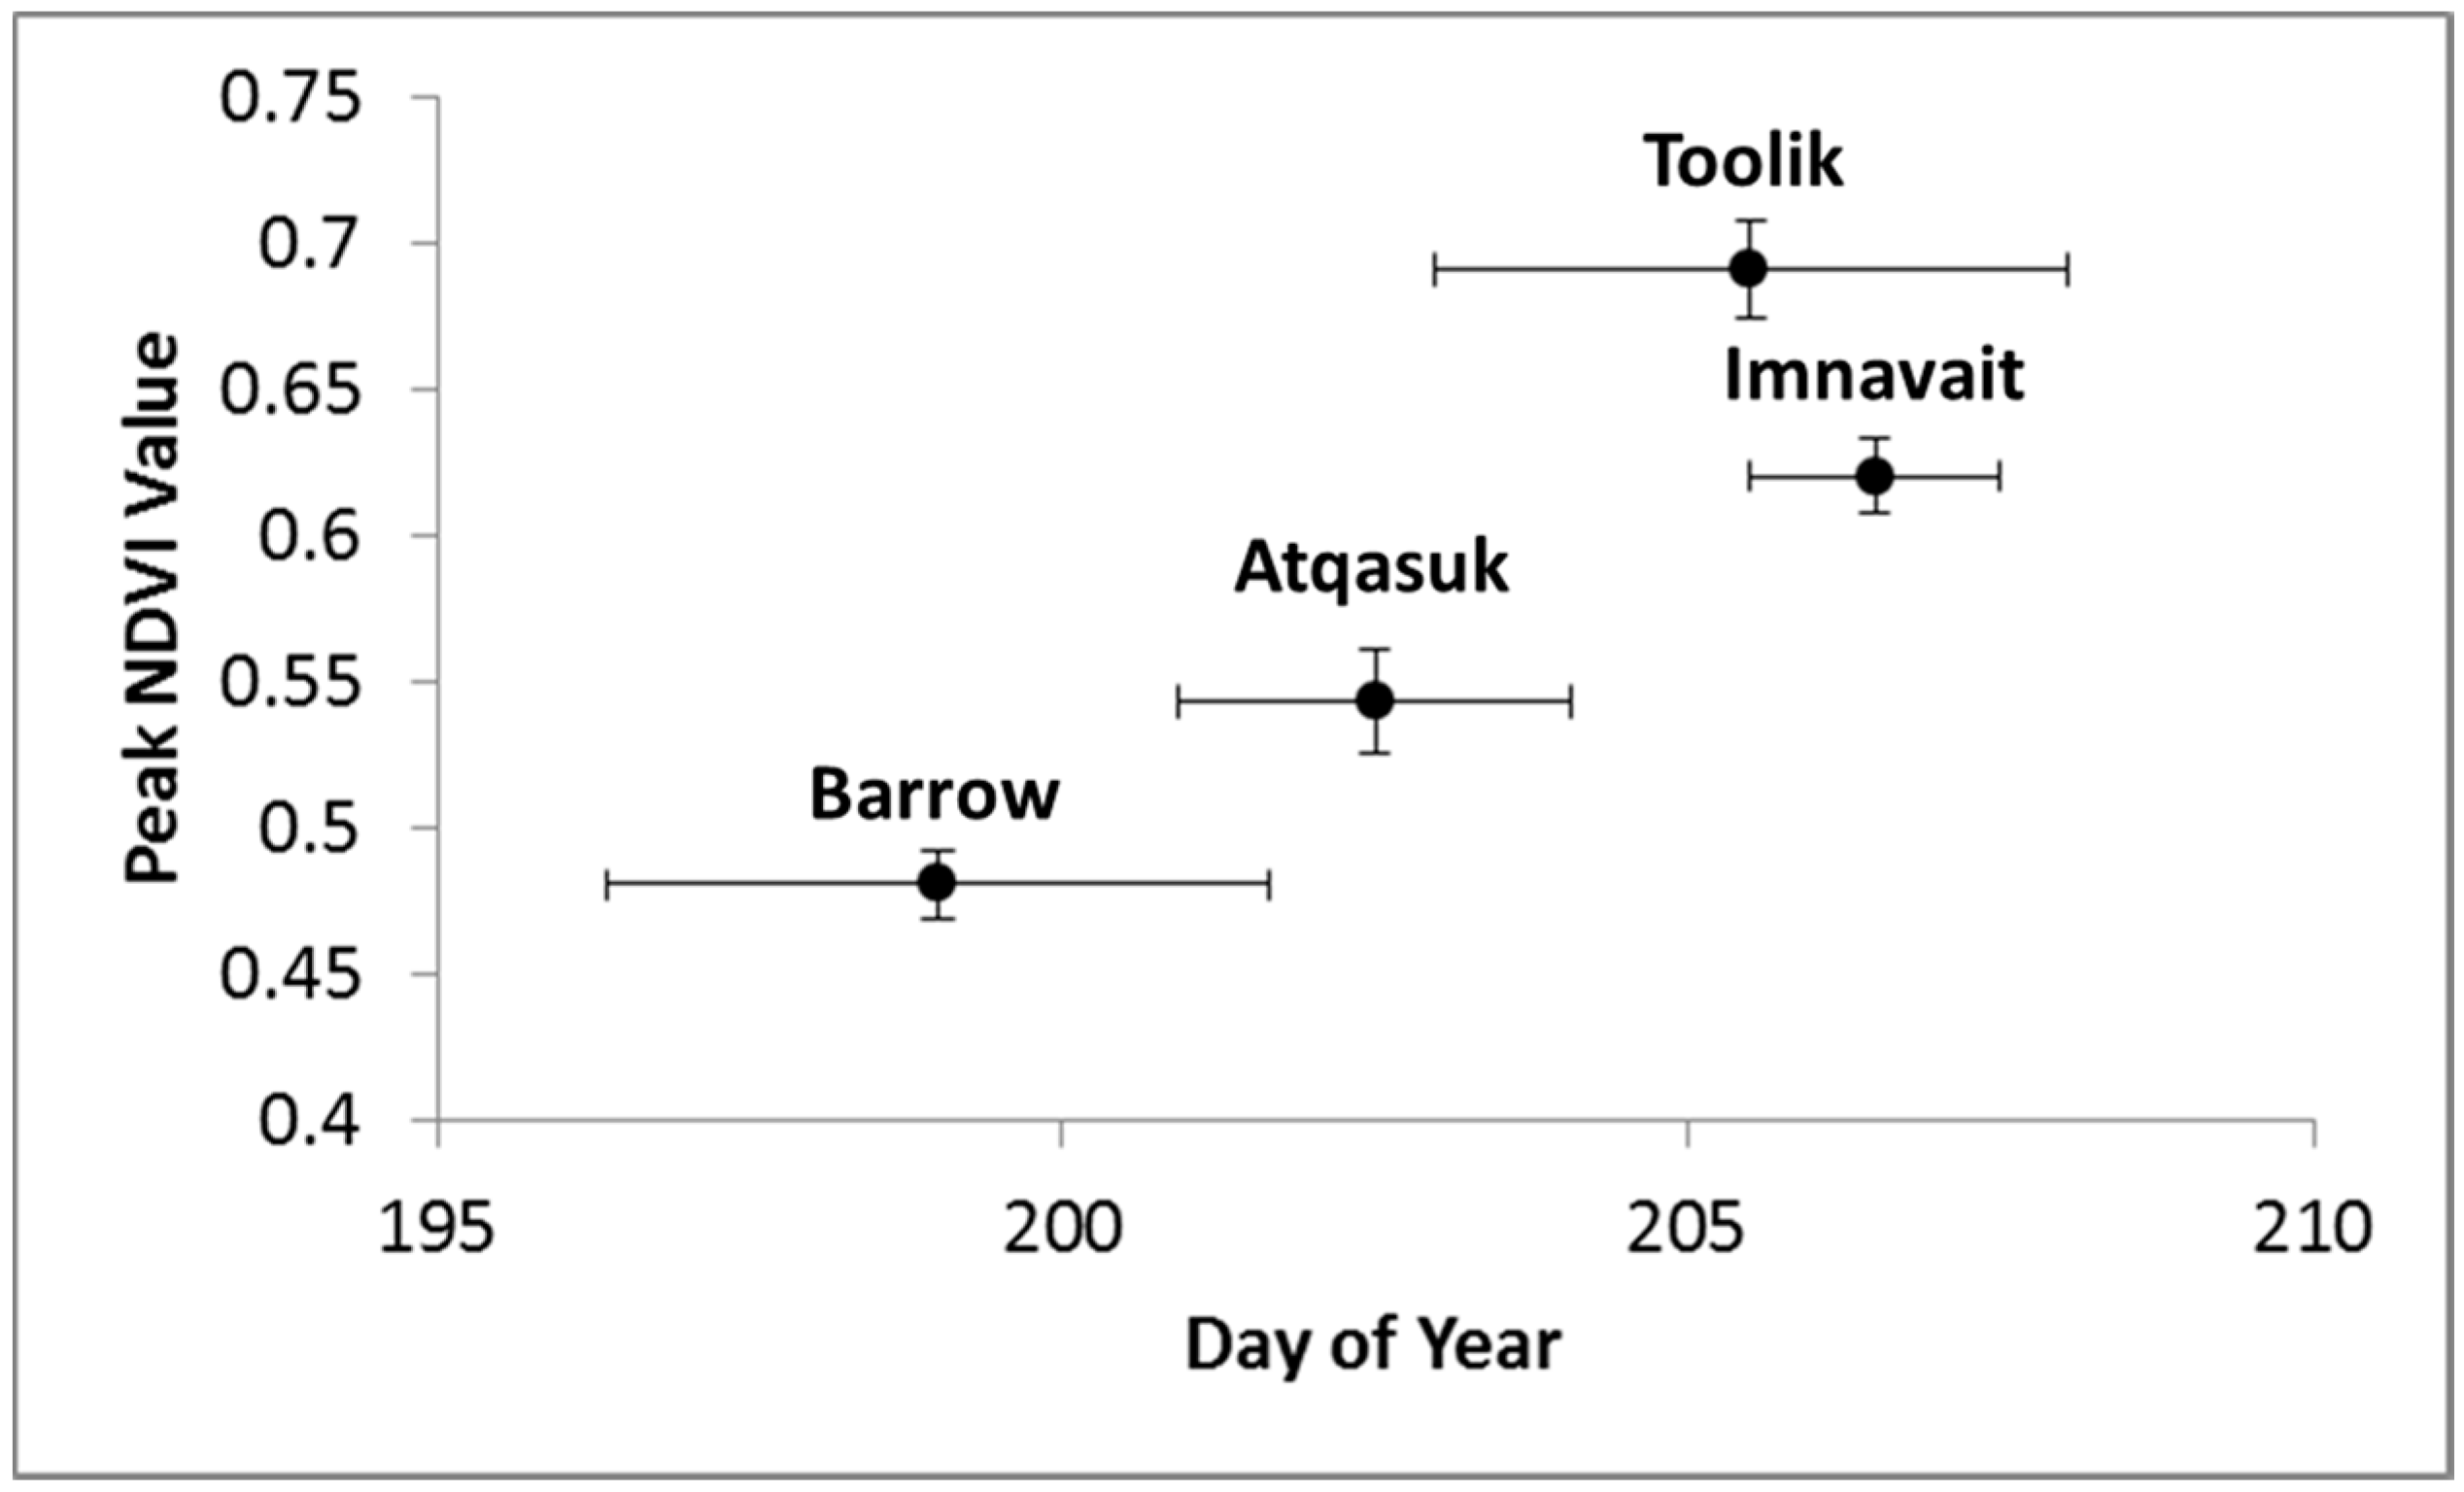
3.2. Site Differences in Peak NDVI and Rates of Greening and Senescence

Averaged over the study period, peak NDVI values differed in timing and magnitude across the four MISP study transects (Figure 3). The two northern sites, Barrow and Atqasuk, peaked 7–8 days earlier (day of year (DOY) 199 and 203, respectively) compared to the more southerly sites, Toolik Lake and Imnavait Creek (DOY 206 and 207, respectively). Similarly, Barrow and Atqasuk had lower peak NDVI values (0.4809 and 0.5446, respectively) compared to Toolik Lake and Imnavait Creek (0.6913 and 0.6207, respectively).
A comparison of June NDVI trends, averaged for full transects, showed differences between the rates of change across the four MISP sites (Figure 4). The southernmost sites, Toolik Lake and Imnavait Creek, had faster average rates of increase (+0.0132 and +0.0104 NDVI day−1, respectively, p < 0.0001) compared to the northernmost sites, Barrow and Atqasuk (+0.0031 and +0.0061 NDVI day−1, respectively). This trend in NDVI increase continued following days with an average temperature of <5 °C, with all four transects having NDVI change rates that were below average. For days with average daily temperatures of 5–10 °C, the rates at Barrow and Atqasuk did not differ (+0.0050 and +0.0054 NDVI day−1, respectively, p = 0.8273), however, they were lower than those at Toolik Lake (+0.0134 NDVI day−1, p < 0.0001) and Imnavait Creek (+0.0098 NDVI day−1, p < 0.0001). NDVI values at Toolik Lake and Imnavait Creek did not differ in their response to temperatures >10 °C (+0.0149 and +0.0141 NDVI day−1, respectively, p = 0.5112), but both sites had significantly faster rates of change than Atqasuk (+0.0077 NDVI day−1, p < 0.0001).
The NDVI response at the end of the growing season to temperature categories (decreasing trends) showed a distinct grouping between the northern and southern MISP sites (Figure 5). The difference in the average daily NDVI change between Barrow and Atqasuk was nearly equal (−0.0097 and −0.0094 NDVI day−1, p = 0.8518). However, the rate of decline was faster at Toolik Lake and Imnavait Creek (−0.0142 and −0.0174 NDVI day−1, respectively, p < 0.0001). Following days with an average daily temperature of <5 °C, all MISP transects showed increased rates of NDVI decline compared to the monthly average rate for all sites, with the northern sites as well as the southern sites being not significantly different (Barrow −0.0109 and Atqasuk −0.0134 NDVI day−1, p = 0.1128, and Toolik Lake −0.0185 and Imnavait Creek −0.0181 NDVI day−1, p = 0.7826, respectively). The rate of change in NDVI at Barrow and Atqasuk did not significantly differ following days with an average daily temperature of 5–10 °C (−0.0085 and −0.0083 NDVI day−1, respectively, p = 0.8871), but the rates of NDVI decline were lower than those at the southern sites (Toolik Lake −0.0121 and Imnavait Creek −0.0183 NDVI day−1, p < 0.0001). Following the warmest August days, the rate of NDVI decline at Imnavait Creek was greatest (−0.0124 NDVI day−1) and was significantly higher than that at Toolik Lake (−0.0106 NDVI day−1, p = 0.0158), with both southern sites experiencing declining rates of NDVI that were greater than those at Atqasuk (−0.0066 NDVI day−1, p < 0.0001).

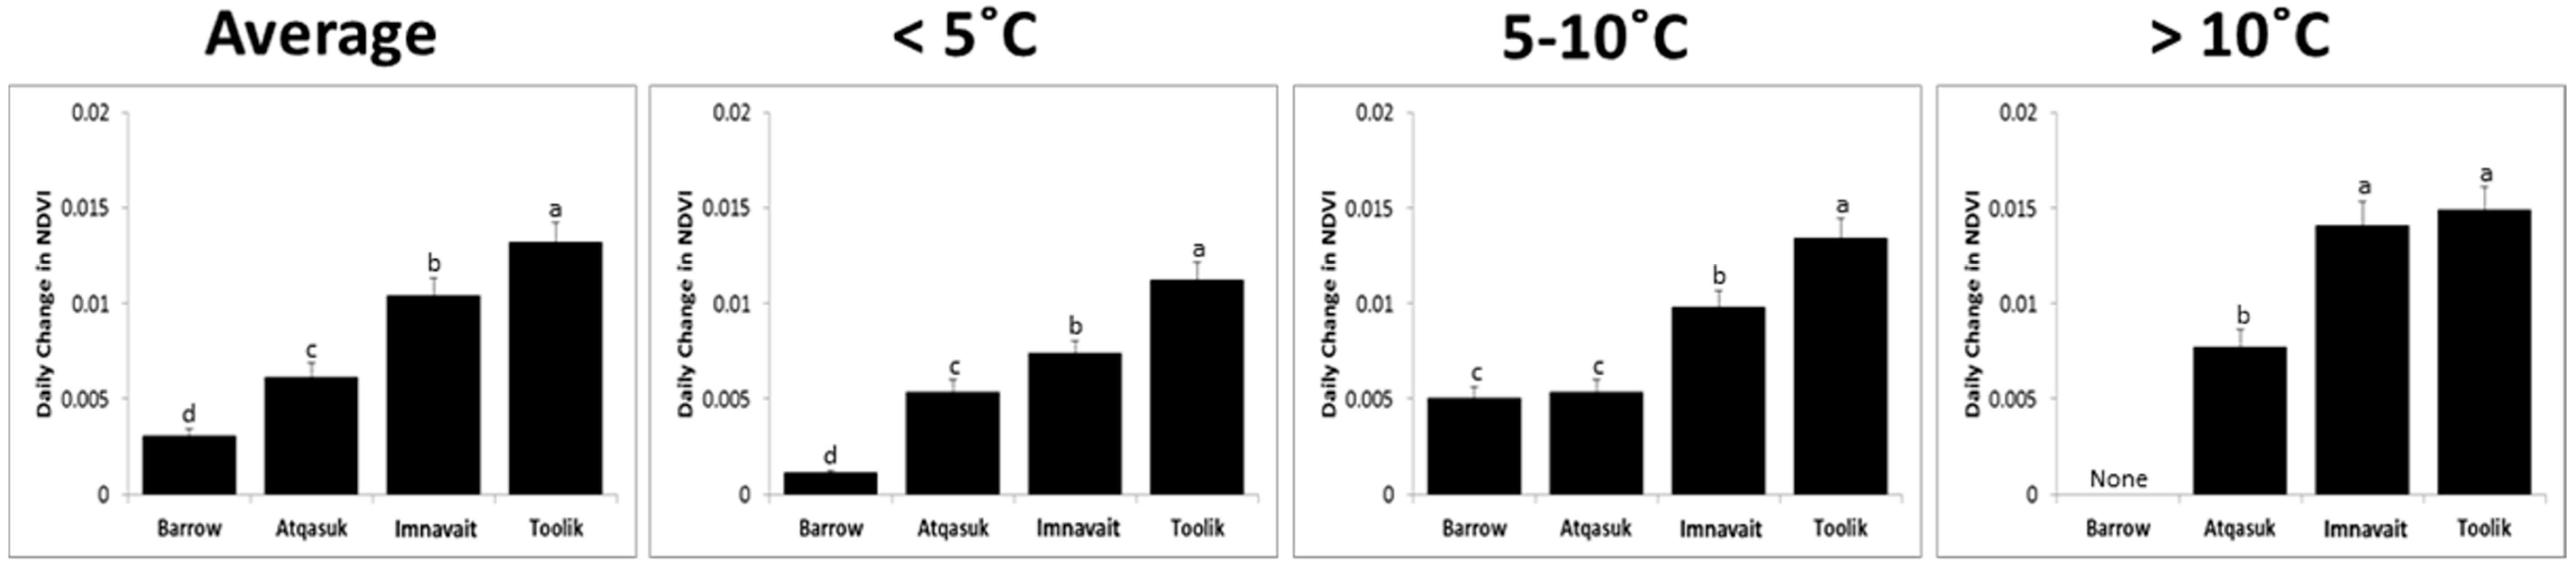
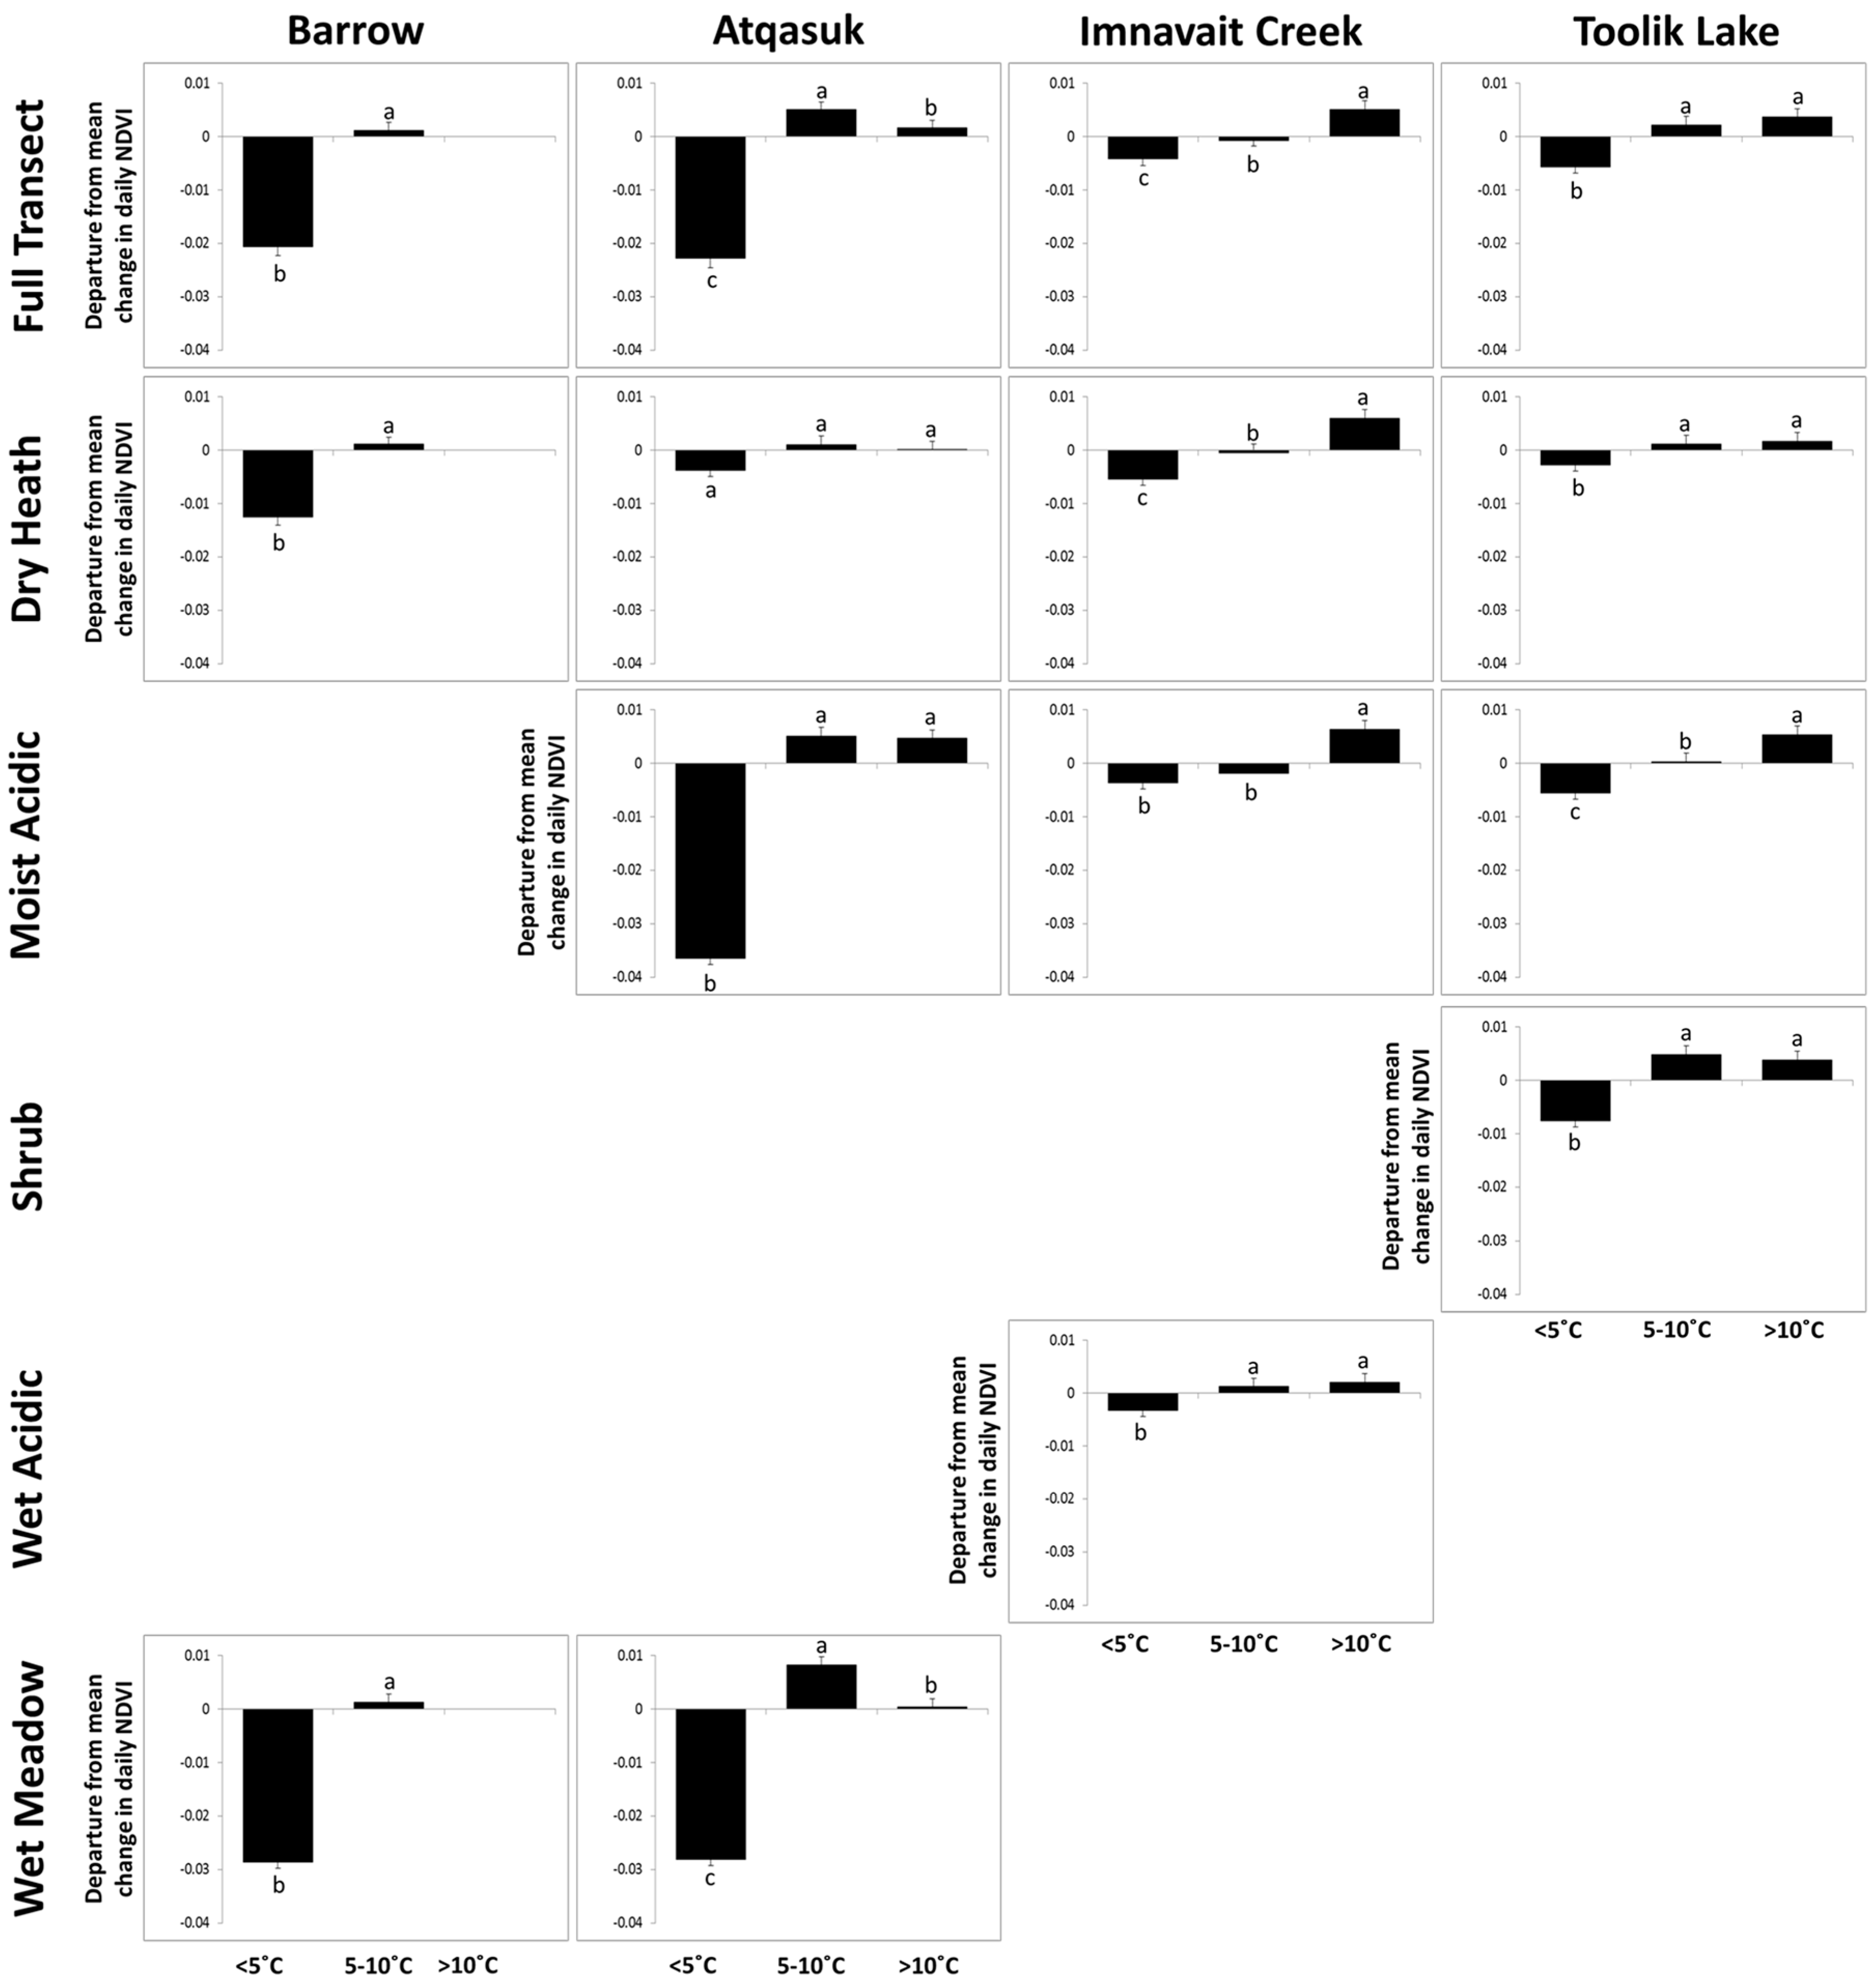
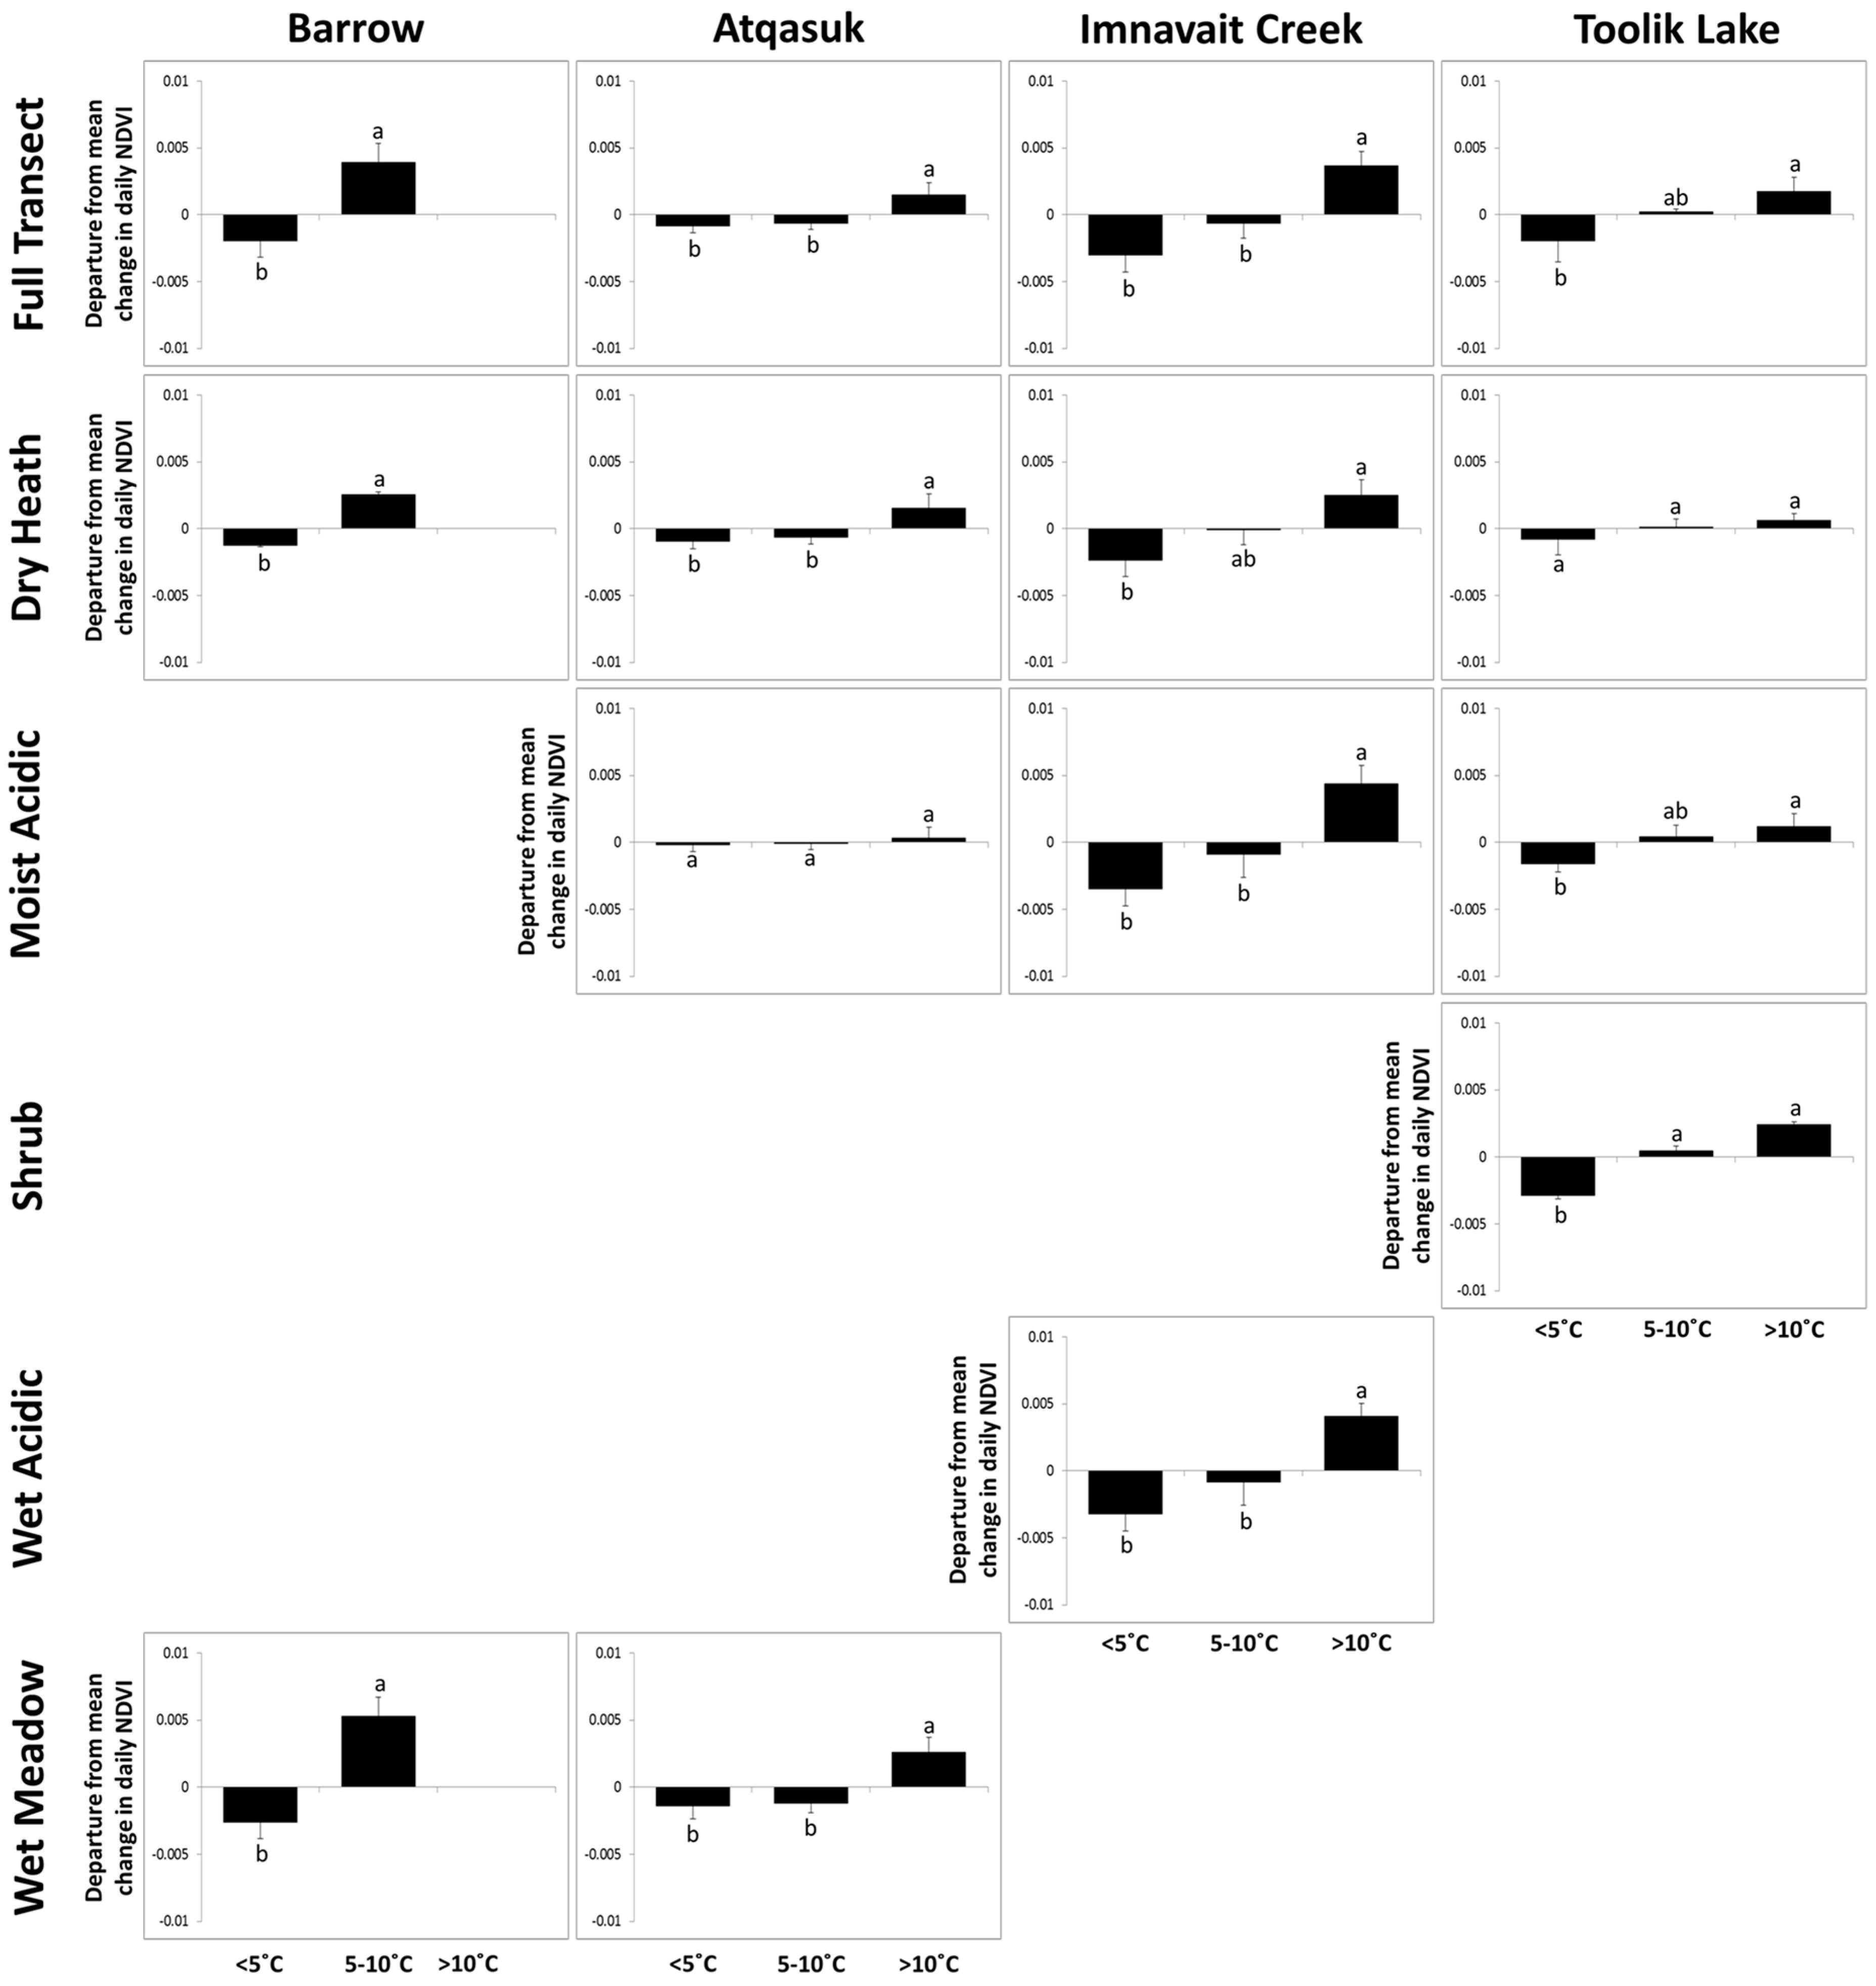
3.3. Greening in Response to Daily Temperatures

Changes in NDVI across the Barrow transect during the June spring greening showed a pronounced increase following warm days and a slowdown following cool days (Figure 6). Barrow was the only transect that significantly changed from the average rate following both warm days in the 5–10 °C category (+0.0039 NDVI day−1, p = 0.021) and cool days (<5 °C, −0.0020 NDVI day−1, p = 0.042). The other three sites did not show significant increases in the rate of NDVI greening until the average air temperatures exceeded 10 °C.
At the habitat-type level, the dry heath at Toolik Lake was the only heath habitat of the four sites that did not show a significant NDVI rate change subsequent to days in the coolest (<5 °C) or the warmest (>10 °C) temperature category (Figure 6). The warmest days caused significant increases in the rate of dry heath greening at Atqasuk (>10 °C, +0.0016 NDVI day−1, p = 0.039) and Imnavait Creek (>10 °C, +0.0025 NDVI day−1, p = 0.031). Cool days (<5 °C) only caused a significant slowing of NDVI greening at Barrow (−0.0013 NDVI day−1, p = 0.048) and Imnavait Creek (−0.0024 NDVI day−1, p = 0.019). The moist acidic tussock tundra was not responsive to temperature differences at Atqasuk. At Imnavait Creek, however, it was sensitive to both the warmest (>10 °C, +0.0044 NDVI day−1, p = 0.006) and coolest days (<5°C, −0.0035 NDVI day−1, p = 0.022). The moist acidic tundra at Toolik was also significantly responsive to warmest days (>10 °C, +0.0012 NDVI day−1, p = 0.032). The acidic shrub tundra, limited to Toolik Lake, did not show any significant responses to warming, but did show significant slowing in NDVI increases following the coolest days (<5 °C, −0.0029 NDVI day−1) compared to the warmest days (>10 °C, +0.0012 NDVI day−1, p = 0.031). The wet acidic tussock tundra, present only at Imnavait Creek, exhibited significant NDVI changes both following the coolest (<5 °C, −0.0032 NDVI day−1, p = 0.017) and warmest days (>10 °C, +0.0041 NDVI day−1, p = 0.008). The wet meadow habitats were responsive to the warmest days in both Barrow (5–10 °C, +0.0053 NDVI day−1, p = 0.017) and Atqasuk (>10 °C, +0.0026 NDVI day−1, p = 0.022), although only Barrow was responsive to the coolest days (<5 °C, −0.0026 NDVI day−1, p = 0.039).

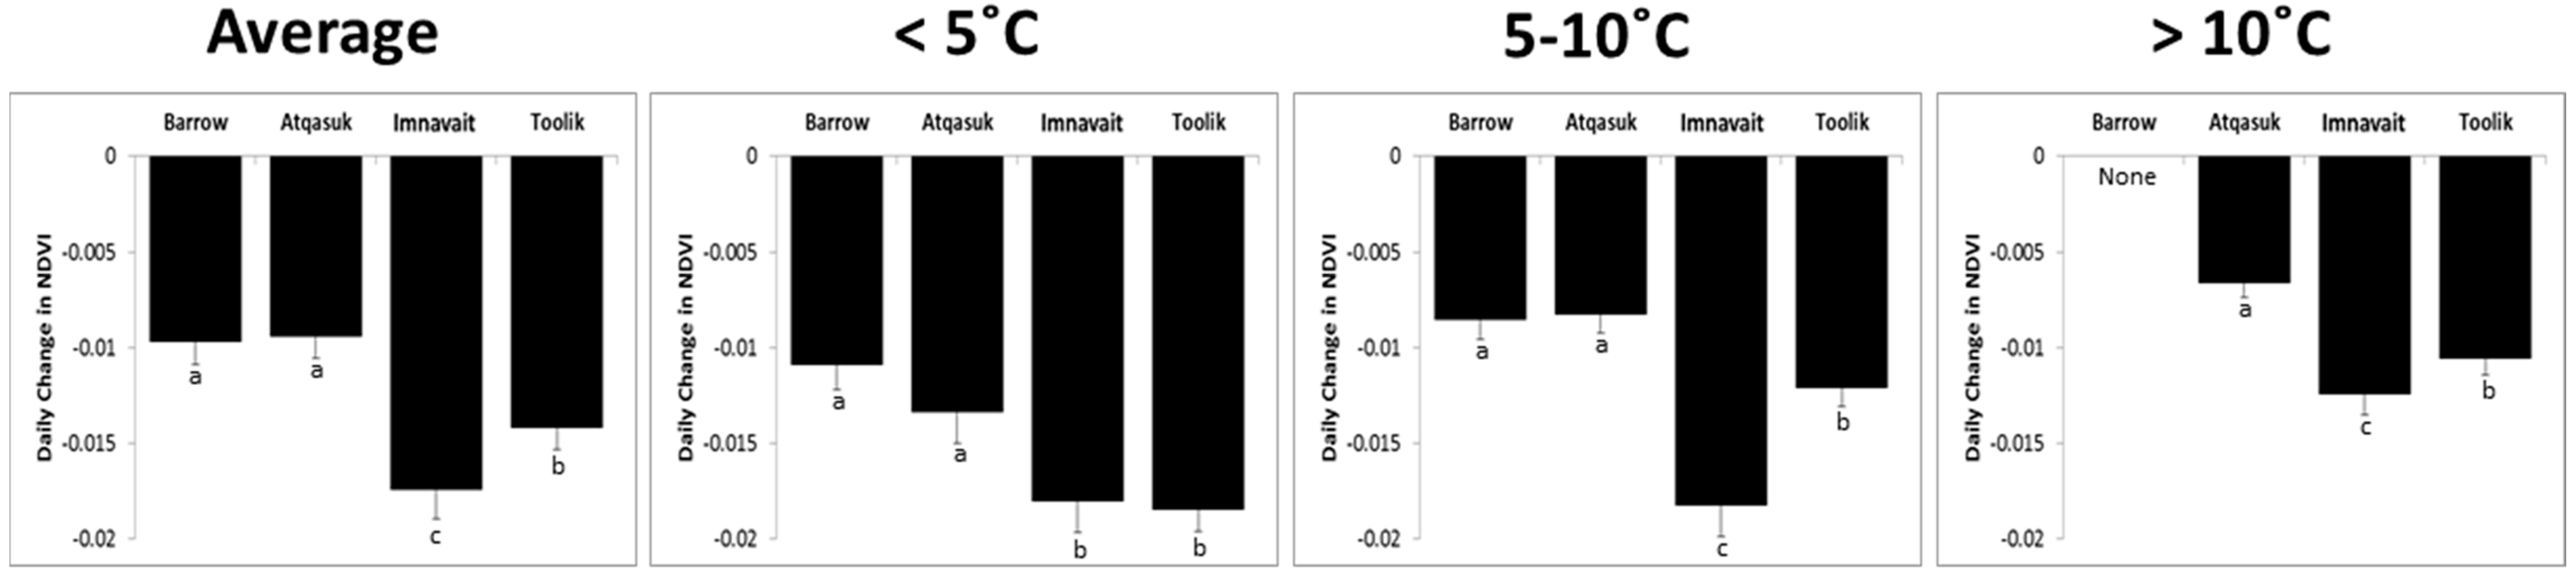
3.4. Senescence in Response to Daily Temperatures

Incorporating all habitat types, the greatest declines in NDVI were significantly associated with the coolest dates at all four sites (Figure 7). Correspondingly, temperatures >10 °C, if observed, significantly slowed the decreasing NDVI trends. The rates of NDVI decline in dry heath habitats at Atqasuk, which are very sparsely vegetated, could not be directly linked to changes in temperature. In contrast, for more densely vegetated dry heath habitats at Imnavait Creek and Toolik Lake, we observed a less pronounced NDVI decline after the warmest days (>10 °C, +0.0059 NDVI day−1, p = 0.037 and +0.0017 NDVI day−1, p < 0.001, respectively) and a more pronounced decline following the coolest days (<5 °C, −0.0055 NDVI day−1, p = 0.039 and −0.0029 NDVI day−1, p < 0.001, respectively). At the Atqasuk transect, the link to temperature categories was primarily related to changes in the NDVI of the moist acidic tussock tundra habitat-type after warm (>10 °C, +0.0047 NDVI day−1, p < 0.001) and cool days (<5 °C, −0.0365 NDVI day−1, p < 0.001); at Toolik Lake and Imnavait Creek, the NDVI of the moist acidic tussock tundra also responded significantly to the warmest (>10 °C, +0.0053 NDVI day−1, p < 0.001 and +0.0064 NDVI day−1, p = 0.007, respectively), as well as the coolest days (<5 °C, −0.0056 NDVI day−1, p < 0.001 and −0.004 NDVI day−1, p = 0.009, respectively). NDVI increases of the acidic shrub tundra, present only at Toolik Lake, could be related to the occurrence of warm days (>10 °C, +0.0038 NDVI day−1, p = 0.010) and, as compared with all other tested habitats, showed the strongest NDVI decrease after coolest days (<5 °C, −0.0077 NDVI day−1, p < 0.001). NDVI changes of the wet acidic tussock tundra at Imnavait Creek were significantly related to the warmest (>10 °C, +0.0020 NDVI day−1, p = 0.047) and coolest days (<5 °C, −0.0033 NDVI day−1, p = 0.016), as well. The wet meadow habitats at Barrow and Atqasuk experienced a significant increase in the rate of NDVI decline on days with temperatures <5 °C versus 5–10 °C.

4. Discussion

4.1. Interannual Variations in Peak NDVI

Our results show that sites significantly differed in the magnitude and timing of season peak NDVI values across the latitudinal gradient. As expected, the southernmost sites, Toolik Lake and Imnavait Creek, had higher peak NDVI values compared to the northern sites, with Barrow having the lowest value. Our results are consistent with previous findings that show increases in the aboveground productivity and resulting NDVI, as an indicator of green biomass, with warmer temperatures and longer growing seasons [4,25,37]. While the southernmost sites showed higher average peak NDVI values averaged over the observation period, their timing was delayed when compared to the northern sites. The Barrow transect reached a peak NDVI value earlier than any of the other sites. The timing and magnitude of peak NDVI values are likely a result of site-specific differences in habitat composition. Barrow is dominated by a combination of grasses and forbs which leaf out in spring and generally do not continue to add new leaves throughout the season. Additionally, Barrow has a high cover proportion of lichens and standing dead plant matter which may lower the habitat NDVI values. In contrast, the southernmost sites are dominated by deciduous shrubs, which leaf out a dense canopy early in the season, and by Eriophorum vaginatum, which continues to lengthen leaves throughout the growing season [38], both of which contribute to the higher habitat NDVI values (Table 1).

4.2. NDVI Response to Temperature

The rates of NDVI changes during spring greening and August senescence also varied across the latitudinal gradient. The rate of early season NDVI change was slowest at the Barrow site. One contributing factor may be the lack of >10 °C average temperature days, while all other sites showed higher rates of change and a higher number of >10 °C days during June. The effect of this temperature difference mirrors the trends in peak seasonal average NDVI values and is consistent with previously reported effects of warmer temperatures on Arctic plant phenology [4,10,17]. Another contributing factor is the prevalence of standing dead matter, mosses, and lichens present at Barrow compared to the remaining sites. Standing dead plant matter and lichens do not change reflectance significantly over the course of the growing season and may dilute the NDVI signal and mask changes of living vascular plants as phenology progresses if they are in the sensor’s field of view or overtop lower statured living plant biomass. Atqasuk, Toolik Lake, and Imnavait Creek are dominated by higher statured species with less standing dead matter. As a result, spectral signals are less strongly influenced by lichens, mosses, and litter present within lower layers.
Our observations indicate that NDVI directly responds to daily fluctuations in the average air temperatures in short temporal scales (three days). The link between air temperature and NDVI change, however, varied with habitat type at all sites. Graminoid-dominated habitats, sedge-dominated wet meadows, and acidic tussock tundra exhibited the strongest increases in the rate of greening in warm days. The responses of dry heath habitats, the only habitat type present across all study transects, were mixed depending on the cover dominance between lichen and shrubs. The evergreen and deciduous shrub-dominated dry heath habitats at Imnavait Creek and Barrow were highly responsive to changes in the daily average air temperature; however, the two primarily lichen-dominated dry heath habitats at Atqasuk and Toolik Lake were relatively unresponsive (Table 1). Our results suggest that, with an increase in shrubs in dry heath habitats, these habitats will have an increased sensitivity to warming springtime temperatures, similar to the findings of Hudson and Henry [39].
Seasonal changes in habitat average NDVI values are reported to be influenced by habitat composition and dominance [21,40]. Some graminoid species, such as E. vaginatum, continue to expand green leaves beyond the initial June flush of most species, contributing to the responsiveness of graminoid-dominated habitats to varying air temperatures. The continual addition of E. vaginatum green leaf biomass during the growing season contributes to increases in the NDVI values at the habitat level. Deciduous shrub species leaf out over a short time during spring and senesce quickly at the beginning of fall, contributing to rapid NDVI changes in both seasons. However, after leaves have expanded in the spring, the habitat average NDVI signal remains fairly constant during the growing season. Mosses constitute a large proportion of the understory in most habitat types in this study [8,11,41]. The extent of moss contribution to habitat reflectance likely varies throughout the growing season and is more influential in the early season before the moss is covered by taller statured plants that leaf out and form the uppermost vegetation layer. As senescence occurs and leaves are dropped, particularly from deciduous shrubs, the moss contribution to habitat reflectance likely increases once again, although sometimes the fallen leaves may carpet the moss understory. Intraseasonal precipitation rates also affect the magnitude and directionality of moss contribution to habitat reflectance, as moss reflectance properties change with drying [42,43]. Precipitation rates also have been shown to impact vascular plant community phenology by slowing the growth of some species and increasing the growth of others [44,45]. The interplay between meteorological factors and community phenology is not well understood and requires additional study.
August senescence was more responsive to air temperature fluctuations compared to June greening. Barrow was the only site for which the decline in NDVI did not respond significantly to warm or cool days. For dry heath habitats, we did not observe a consistent pattern in changes of the NDVI in relation to air temperature fluctuations. The NDVI data of the two northernmost dry heath habitats at Barrow and Atqasuk were unaffected, while the NDVI at the two southernmost dry heath habitats at Toolik Lake and Imnaviat Creek responded to both the warmest and the coolest days. Unlike heath sites, most non-dry heath graminoid- and shrub-dominated habitats were responsive to daily air temperature fluctuations, with the apparent ability to slow senescence during warm time periods and increase senescence when air temperatures were cold; the lone exception was the Barrow wet meadow habitat. On one hand, these observations might highlight the ability of shrubs and graminoids to adapt to short-term air temperature fluctuations, which may aid their ability to lengthen the growing period further driving their habitat dominance [10,46,47,48]. These shifts in shrub and graminoid dominance have been shown to alter habitat characteristics, such as phenology, reflectance, and carbon assimilation (4, 7–8, 12, 15). On the other hand, the fact that the spectral properties of the site-specific species composition may mask the differences in the observed relationship cannot be completely ruled out.

4.3. Interannual Variations in Daily Average Temperatures

Air temperature changes have been documented to alter the annual phenological progression of Arctic plant habitats, with warming being a primary driver of growth period extension [4,5,31]. Graminoid- and shrub-dominated habitats have a larger response to variations of the daily average temperatures in June and August compared to other habitat types. This habitat-type response to temperature fluctuations may be a contributing factor in the well-documented expansion of shrubs and other taller statured vegetation and in the decline of forbs and nonvascular plants [15,16,17,48]. Increased variation of daily air temperatures, as a result of climate change, has the potential to exacerbate these differences in responsiveness and habitat dominance shifts. Species that are less able to take advantage of even small temperature variations may be at a competitive disadvantage and, as a result, decline in dominance compared to more adaptable species. During warm periods later in the season, fast-growing species and those that continue to grow later in the season, such as the graminoids, may be at an advantage by increasing their leaf coverage and storing more carbon in preparation for growth in subsequent years. The detection and understanding of these complex feedbacks require collecting observation data at fine spatial and temporal scales.
Our results show how the rate of change in NDVI signal differs between greening at the beginning of the growing season (June) and senescence at the end of the growing season (August). NDVI values during June green-up increased at a slower rate compared to the speed of August NDVI decreases during senescence at all sites. The rate of NDVI changes is also likely influenced by the interannual variability in the progression of each season (e.g., spring and autumn). Early June and late August were the months that most likely had extreme cold temperature events, such as nighttime freezes and snowstorms, which affected the seasonal phenology [49,50].
Our data show variability in the average air temperature across the sites, months, and years of this study. During the study, there were several midseason snowfalls and a variable timing of winter snowmelt at the beginning of the growing season. Warmer spring temperatures and earlier snowmelt have been documented across the Arctic in recent decades and are expected to continue [2,51]. Warmer June air temperatures and earlier snowmelts advance the progression of phenology in Arctic plant habitats and, with species differing in responsiveness, the competitive dynamics shifts toward the species that are more responsive to temperature variations [4,7,31].
Though our observation period lasted only five years, the changes in temperatures and temperature variability that we observed agree with the long-term trend that has been reported for the Arctic [2,52,53]. The frequency of cool days during August at Barrow and Atqasuk decreased, while the number of warmest days increased. At Toolik Lake and Imnaviat Creek, the frequency of days with average temperatures of 5–10 °C decreased, while the frequency of coolest and warmest days increased. This variability in late season daily temperatures has the potential to alter the rate of senescence once it has begun [5]. At all sites, the habitat average NDVI peaked during July and began to decrease shortly after the first sunset in late July and early August, suggesting that the initiation of senescence is triggered by photoperiod.
We show here that there are differences regarding how effectively habitats phenologically respond to daily temperature changes across a habitat type and across a latitudinal gradient within the same habitat type. These variations in response across both temporal and spatial scales complicate the use of traditional remote sensing methods to monitor seasonal phenology trends [21,25,27,28]. Our results underscore the need for high-frequency, sublandscape scale, remotely-sensed spectral measurements that bridge the gap between visually assessed, human-based, and coarse resolution satellite spectral measurements.

5. Conclusions

Our MISP observations reveal the varied responsiveness of the NDVI of the Arctic tundra plant habitats to fluctuations in daily average air temperatures in short temporal scales during the growing season. This responsiveness differed in magnitude during June greening and August senescence and was significantly dependent on the habitat-type vegetation and latitude. The predicted future shifts in climate have the potential to shift the competitive advantage in the Arctic in favor of habitats and species that are more responsive, and, thus, able to dynamically adjust their physiological response and growth rates to the short-term variability of air temperatures. The spatial heterogeneity of our findings and the observed short-term responses of greenness measures illustrate the necessity of finer resolution remote sensing studies bridging the scale gap of hand-held sensor and satellite observations, to help elucidate and model the habitat responses to environmental fluctuations.

Acknowledgments

This work is based in part on support from the National Science Foundation grants PLR-0856516, PLR-1432277 and PLR-1504224. We thank the staff and management of the University of Alaska Institute of Arctic Biology and CH2MHL Polar Services for support at the Toolik Field Station, as well as CH2MHill Polar Services and UMIAQ for support, permits, and logistics at Barrow and Atqasuk. Permission for use of the Barrow Environmental Observatory is greatly appreciated. Also, we would like to thank Edward Metzger, Jose Luciani, Christine Pardo, Steven Unger, Paulo Olivas, Tim Botting, Jennifer Liebig, Kelseyann Kremers, Michaela Clingaman, Katlyn Betway, Jacob Harris, and Claudia Garcia-Estiu for their assistance during this study.

Author Contributions

Jeremy May was the primary manuscript author, conducted data collection for Toolik Lake and Imnaviat Creek 2015–2016, and oversaw vegetation assessment data collections for the project. Nathan Healey provided manuscript revisions and conducted data collection for Toolik Lake and Imnaviat Creek 2012–2014. Hella Ahrends provided manuscript revisions, co-established the four MISP transects, and conducted preliminary data collection (2011). Robert Hollister provided manuscript revisions, oversaw data collection for Barrow and Atqasuk 2012–2016, and helped develop project concept. Craig Tweedie provided manuscript revisions, assisted in data collection for Barrow and Atqasuk 2012–2016, and helped develop project concept. Jeffrey Welker provided manuscript revisions, helped develop project concept, and implementation of Imnaviat Creek and Toolik Lake transects. William Gould provided manuscript revisions, helped develop project concept, and collection vegetation assessments associated with the project. Steven Oberbauer provided manuscript revisions, oversaw development of project concept and establishment of four MISP transects, oversaw data collection of all four transects 2012–2016.

Conflicts of Interest

The authors declare no conflict of interest.

Appendix A

Table A1. Results of linear regression analysis of NDVI changes in 1-, 2-, 3-, and 4-day time periods for the four full MISP transects in the months of June and August.
Number of Day LagJuneAugust
SlopeR2p-ValueSlopeR2p-Value
Barrow
1 Day 0.00120.0030.39650.00030.0080.2891
2 Day0.00160.0350.21660.00150.0110.2574
3 Day0.00410.1430.04900.00130.0760.0711
4 Day0.00400.0320.14600.00100.0270.5117
Atqasuk
1 Day −0.00050.0060.21400.00020.0020.4871
2 Day0.00100.0510.82680.00080.0470.2066
3 Day0.00130.1160.04440.00110.1480.0453
4 Day0.00120.1040.36020.00090.0740.5377
Imnavait Creek
1 Day 0.00030.0110.16130.00030.0060.5274
2 Day0.00060.0340.18300.00090.0880.1363
3 Day0.00110.102<0.00010.00110.1880.0021
4 Day0.00120.1750.00240.00100.1250.0383
Toolik Lake
1 Day 0.00060.0440.22000.00070.0540.2351
2 Day0.00010.0010.42100.00020.0050.7268
3 Day0.00060.0460.11120.00110.2040.0634
4 Day0.00060.0380.17350.00160.1290.1059

References

  1. Chapin, F.S.; Sturm, M.; Serreze, M.C.; McFadden, J.P.; Key, J.R.; Lloyd, A.H.; McGuire, A.D.; Rupp, T.S.; Lynch, A.H.; Schimel, J.P.; et al. Role of land-surface changes in Arctic summer warming. Science 2005, 310, 657–660. [Google Scholar] [CrossRef] [PubMed]
  2. Stocker, T.; Plattner, D.Q.G.; Tignor, M.; Allen, S.; Boschung, J.; Nauels, A.; Xia, Y.; Bex, V.; Midgley, P. (Eds.) Intergovernmental Panel on Climate Change Fifth Assessment Report: Climate Change. The Physical Basis. Working Group I Contribution to the Fifth Assessment Report of the Intergovernmental Panel on Climate Change; Cambridge University Press: Cambridge, UK, 2013. [Google Scholar]
  3. Prevey, J.; Vellend, M.; Ruger, N.; Hollister, R.; Bjorkman, A.; Myers-Smith, I.; Elmendorf, S.; Clark, K.; Cooper, E.; Elberling, B.; et al. Greater temperature sensitivity of plant phenology at colder sites: Implications for convergence across northern latitudes. Glob. Chang. Biol. 2017, 23, 2660–2671. [Google Scholar] [CrossRef] [PubMed]
  4. Arft, A.M.; Walker, M.D.; Gurevitch, J.; Alatalo, J.M.; Bret-Harte, M.S.; Dale, M.R.T.; Diemer, M.C.; Gugerli, F.; Henry, G.H.R.; Jones, M.H.; et al. Responses of tundra plants to experimental warming: Meta-analysis of the international tundra experiment. Ecol. Monogr. 1999, 64, 491–511. [Google Scholar] [CrossRef]
  5. Marchand, F.L.; Nijs, I.; Heuer, M.; Mertens, S.; Kockelbergh, F.; Pontailler, J.-Y.; Impens, I.; Beyens, L. Climate warming postpones senescence in High Arctic tundra. Arct. Antarct. Alp. Res. 2004, 36, 390–394. [Google Scholar] [CrossRef]
  6. Barrett, R.T.S.; Hollister, R.D.; Oberbauer, S.F.; Tweedie, C.E. Arctic plant responses to changing abiotic factors in northern Alaska. Am. J. Bot. 2005, 102, 2020–2031. [Google Scholar] [CrossRef] [PubMed]
  7. Khorsand Rosa, R.; Oberbauer, S.F.; Starr, G.; La Puma, I.P.; Pop, E.; Ahlquist, L.; Baldwin, T. Plant phenological responses to a long-term experimental extension of growing season and soil warming in the tussock tundra of Alaska. Glob. Chang. Biol. 2015, 21, 4520–4532. [Google Scholar] [CrossRef] [PubMed]
  8. Shaver, G.R.; Chapin, F.S., III. Production: Biomass relationships and element cycling in contrasting Arctic vegetation types. Ecol. Monogr. 1991, 61, 1–31. [Google Scholar] [CrossRef]
  9. Oechel, W.C.; Hastings, S.J.; Vourlitis, G.; Jenkins, M.; Riechers, G.; Grulke, N. Recent change of Arctic tundra ecosystems from a net carbon dioxide sink to a source. Nature 1992, 361, 520–523. [Google Scholar] [CrossRef]
  10. Chapin, F.S.; Shaver, G.R.; Giblin, A.E.; Nadelhoffer, K.J.; Laundre, J.A. Responses of arctic tundra to experimental and observed changes in climate. Ecology 1995, 76, 694–711. [Google Scholar] [CrossRef]
  11. Campioli, M.; Samson, R.; Michelsen, A.; Jonasson, S.; Baxter, R.; Lemeur, R. Nonvascular contribution to ecosystem NPP in a subarctic heath during early and late growing season. Plant Ecol. 2009, 202, 41–53. [Google Scholar] [CrossRef]
  12. Olivas, P.C.; Oberbauer, S.F.; Tweedie, C.E.; Oechel, W.C.; Lin, D.; Kuchy, A. Effects of Fine-Scale Topography on CO2 Flux Components of Alaskan Coastal Plain Tundra: Response to Contrasting Growing Seasons. Arct. Antarct. Alp. Res. 2011, 43, 256–266. [Google Scholar] [CrossRef]
  13. Sturm, M.; Racine, C.; Tape, K. Climate change: Increasing shrub abundance in the Arctic. Nature 2001, 41, 546–547. [Google Scholar] [CrossRef] [PubMed]
  14. Sturm, M.; Schimel, J.; Michelson, G.; Welker, J.; Oberbauer, S.F.; Liston, G.; Fahnestock, J.; Romanovsky, V.E. The role of winter biological processes in converting arctic tundra to shrubland. BioScience 2005, 55, 17–26. [Google Scholar] [CrossRef]
  15. Tape, K.; Sturm, M.; Racine, C. The evidence for shrub expansion in northern Alaska and the Pan-Arctic. Glob. Chang. Biol. 2006, 12, 686–702. [Google Scholar]
  16. Myers-Smith, I.H.; Forbes, B.C.; Wilmking, M.; Hallinger, M.; Lantz, T.; Blok, D.; Tape, K.D.; Macias-Fauria, M.; Sass-Klaassen, U.; Lévesque, E.; et al. Shrub expansion in tundra ecosystems: Dynamics, impacts and research priorities. Environ. Res. Lett. 2011, 6, 045509. [Google Scholar] [CrossRef]
  17. Elmendorf, S.C.; Henry, G.H.R.; Hollister, R.D.; Björk, R.G.; Boulanger-Lapointe, N.; Cooper, E.J.; Cornelissen, J.H.C.; Day, T.A.; Dorrepaal, E.; Elumeeva, T.G.; et al. Plot-scale evidence of tundra vegetation change and links to recent summer warming. Nat. Clim. Chang. 2012, 2, 453–457. [Google Scholar] [CrossRef]
  18. Welker, J.M.; Molau, U.; Parsons, A.N.; Robinson, C.; Wookey, P.A. Response of Dryas octopetala to ITEX manipulations: A synthesis with circumpolar comparisons. Glob. Chang. Biol. 1997, 3, 61–73. [Google Scholar] [CrossRef]
  19. Kerr, J.T.; Ostrovsky, M. From space to species: Ecological applications for remote sensing. Trends Ecol. Evol. 2003, 18, 299–305. [Google Scholar] [CrossRef]
  20. Kriegler, F.J.; Malila, W.A.; Nalepka, R.F.; Richardson, W. Preprocessing transformations and their effects on multispectral recognition. In Proceedings of the Sixth International Symposium on Remote Sensing of Environment, University of Michigan, Ann Arbor, MI, USA, 13–16 October 1969; pp. 97–131. [Google Scholar]
  21. Riedel, S.M.; Epstein, H.E.; Walker, D.A. Biotic controls over spectral reflectance of Arctic tundra vegetation. Int. J. Remote Sens. 2005, 26, 2391–2405. [Google Scholar] [CrossRef]
  22. Stow, D.; Petersen, A.; Hope, A.; Engstrom, R.; Coulter, L. Greenness trends of Arctic tundra vegetation in the 1990s: Comparison of two NDVI data sets from NOAA AVHRR systems. Int. J. Remote Sens. 2007, 28, 4807–4822. [Google Scholar] [CrossRef]
  23. Gamon, J.A.; Huemmrich, K.F.; Stone, R.S.; Tweedie, C.E. Spatial and temporal variation in primary productivity (NDVI) of coastal Alaskan tundra: Decreased vegetation growth following earlier snowmelt. Remote Sens. Environ. 2013, 129, 144–153. [Google Scholar] [CrossRef]
  24. Epstein, H.E.; Raynolds, M.K.; Walker, D.A.; Bhatt, U.S.; Tucker, C.J.; Pinzon, J.E. Dynamics of aboveground phytomass of the circumpolar Arctic tundra during the past three decades. Environ. Res. Lett. 2012, 7. [Google Scholar] [CrossRef]
  25. Jia, G.J.; Epstein, H.E.; Walker, D.A. Greening of Arctic Alaska, 1981–2001. Geophys. Res. Lett. 2003, 30, 2067. [Google Scholar] [CrossRef]
  26. Walker, D.A.; Raynolds, M.K.; Daniëls, F.J.A.; Einarsson, E.; Elvebakk, A.; Gould, W.A.; Katenin, A.E.; Kholod, S.S.; Markon, C.J.; Melnikov, E.S.; et al. The Circumpolar Arctic Vegetation Map. J. Veg. Sci. 2005, 16, 267–282. [Google Scholar] [CrossRef]
  27. Verbyla, D. The greening and browning of Alaska based on 1982–2003 satellite data. Glob. Ecol. Biogeogr. 2008, 17, 547–555. [Google Scholar] [CrossRef]
  28. Raynolds, M.K.; Comiso, J.C.; Walker, D.A.; Verbyla, D. Relationship between satellite-derived land surface temperatures, arctic vegetation types, and NDVI. Remote Sens. Environ. 2008, 112, 1884–1894. [Google Scholar] [CrossRef]
  29. Bhatt, U.S.; Walker, D.A.; Raynolds, M.K.; Comiso, J.C.; Epstein, H.E.; Jia, G.; Gens, R.; Pinzon, J.E.; Tucker, C.J.; Tweedie, C.E.; et al. Circumpolar Arctic tundra vegetation change is linked to sea ice decline. Earth Interact. 2010, 14, 1–20. [Google Scholar] [CrossRef]
  30. Walker, D.A.; Epstein, H.E.; Raynolds, M.K.; Kuss, P.; Kopecky, M.A.; Frost, G.V.; Daniëls, F.J.A.; Leibman, M.O.; Moskalenko, N.G.; Matyshak, G.V.; et al. Environment, vegetation and greenness (NDVI) along the North America and Eurasia Arctic transects. Environ. Res. Lett. 2012, 7, 015504. [Google Scholar] [CrossRef]
  31. Oberbauer, S.F.; Elmendorf, S.C.; Troxler, T.G.; Hollister, R.D.; Rocha, A.V.; Bret-Harte, M.S.; Dawes, M.A.; Fosaa, A.M.; Henry, G.H.R.; Høye, T.T.; et al. Phenological response of tundra plants to background climate variation tested using the International Tundra Experiment. Philos. Trans. R. Soc. Lond. B Biol. Sci. 2013, 368. [Google Scholar] [CrossRef] [PubMed]
  32. Healey, N.C.; Oberbauer, S.F.; Ahrends, H.E.; Dierick, D.; Welker, J.M.; Leffler, A.J.; Hollister, R.D.; Vargas, S.A.; Tweedie, C.E. A Mobile Instrumented Sensor Platform for Long Term Terrestrial Ecosystem Analysis: An Example Application in an Arctic Tundra Ecosystem. J. Environ. Inform. 2014, 24, 1–10. [Google Scholar] [CrossRef]
  33. Henry, G.H.; Molau, U. Tundra plants and climate change: The International Tundra Experiment. Glob. Chang. Biol. 1997, 3, 1–9. [Google Scholar] [CrossRef]
  34. Hollister, R.D. Air temperature for Barrow and Atqasuk, Alaska ITEX sites. Grand Valley State University; Unpublished work. 2017. [Google Scholar]
  35. Environmental Data Center Team. Meteorological Monitoring Program at Toolik, Alaska. Toolik Field Station, Institute of Arctic Biology, University of Alaska Fairbanks, Fairbanks, AK 99775. Available online: http://toolik.alaska.edu/edc/abiotic_monitoring/data_query.php (accessed on 15 October 2016).
  36. R Foundation for Statistical Computing, Vienna, Austria. Available online: www.r-project.org (accessed on 30 June 2017).
  37. Wipf, S.; Rixen, C.; Mulder, C.P. Advanced snowmelt causes shift towards positive neighbour interactions in a subarctic tundra community. Glob. Chang. Biol. 2006, 12, 1496–1506. [Google Scholar] [CrossRef]
  38. Chapin, F.S., III. Environmental controls over growth of tundra plants. Ecol. Bull. 1987, 38, 69–76. [Google Scholar]
  39. Hudson, J.M.; Henry, G.H. Increased plant biomass in a High Arctic heath community from 1981 to 2008. Ecology 2009, 90, 2657–2663. [Google Scholar] [CrossRef] [PubMed]
  40. Hope, A.S.; Kimball, J.S.; Stow, D.A. The relationship between tussock tundra spectral reflectance properties and biomass and vegetation composition. Int. J. Remote Sens. 1993, 14, 1861–1874. [Google Scholar] [CrossRef]
  41. Douma, J.C.; Van Wijk, M.T.; Lang, S.I.; Shaver, G.R. The contribution of mosses to the carbon and water exchange of arctic ecosystems: Quantification and relationships with system properties. Plant Cell Environ. 2007, 30, 1205–1215. [Google Scholar] [CrossRef] [PubMed]
  42. Van Breemen, N. How Sphagnum bogs down other plants. Trends Ecol. Evolut. 1995, 10, 270–275. [Google Scholar] [CrossRef]
  43. Harris, A. Spectral reflectance and photosynthetic properties of Sphagnum mosses exposed to progressive drought. Ecohydrology 2008, 1, 35–42. [Google Scholar] [CrossRef]
  44. Shen, M.; Tang, Y.; Chen, J.; Zhu, X.; Zheng, Y. Influences of temperature and precipitation before the growing season on spring phenology in grasslands of the central and eastern Qinghai-Tibetan Plateau. Agric. For. Metereol. 2011, 151, 1711–1722. [Google Scholar] [CrossRef]
  45. Phoenix, G.K.; Gwynn-Jones, D.; Callaghan, T.V.; Sleep, D.; Lee, J.A. Effects of global change on a sub-Arctic heath: Effects of enhanced UV-B radiation and increased summer precipitation. J. Ecol. 2001, 89, 256–267. [Google Scholar] [CrossRef]
  46. Bardgett, R.D.; van der Wal, R.; Jónsdóttir, I.S.; Quirk, H.; Dutton, S. Temporal variability in plant and soil nitrogen pools in a high-Arctic ecosystem. Soil Biol. Biochem. 2007, 39, 2129–2137. [Google Scholar] [CrossRef]
  47. Molau, U.; Alatalo, J.M. Responses of subarctic-alpine plant communities to simulated environmental change: Biodiversity of bryophytes, lichens, and vascular plants. Ambio 1998, 27, 322–329. [Google Scholar]
  48. Hollister, R.D.; May, J.L.; Kremers, K.S.; Tweedie, C.E.; Oberbauer, S.F.; Liebig, J.A.; Botting, T.F.; Barrett, R.T.S.; Gregory, J.L. Warming experiments elucidate the drivers of observed directional changes in tundra vegetation. Ecol. Evol. 2015, 5, 1881–1895. [Google Scholar] [CrossRef] [PubMed]
  49. Inouye, D.W. Effects of climate change on phenology, frost damage, and floral abundance of montane wildflowers. Ecology 2008, 89, 353–362. [Google Scholar] [CrossRef] [PubMed]
  50. Tolvanen, A. Recovery of the bilberry (Vaccinium myrtillus L.) from artificial spring and summer frost. Plant Ecol. 1997, 130, 35–39. [Google Scholar] [CrossRef]
  51. Vihma, T. Effects of Arctic Sea Ice Decline on Weather and Climate: A Review. Surv. Geophys. 2014, 35, 1175–1214. [Google Scholar] [CrossRef]
  52. Chapman, W.L.; Walsh, J.E. Recent variations of sea ice and air temperatures in high latitudes. Bull. Am. Meteorol. Soc. 1993, 74, 33–47. [Google Scholar] [CrossRef]
  53. Polyakov, I.V.; Bekryaev, R.V.; Alekseev, G.V.; Bhatt, U.S.; Colony, R.L.; Johnson, M.A.; Maskshtas, A.P.; Walsh, D. Variability and trends of air temperature and pressure in the maritime Arctic, 1875–2000. J. Clim. 2003, 16, 2067–2077. [Google Scholar] [CrossRef]
Figure 1. Locations of Mobile Instrumented Sensor Platform (MISP) system transects (stars) and weather stations (x) in Alaska, USA.
Remotesensing 09 01338 g001
Figure 2. Number of days during June and August of 2012–2016 that were <5 °C (solid black circles, solid black linear line of best fit), 5–10 °C (solid grey circle, solid grey linear line of best fit), and >10 °C (open black circles, and dashed black linear line of best fit).
Remotesensing 09 01338 g002
Figure 3. Five-year averages of peak NDVI values and corresponding days of year for the four MISP transects. Error bars denote the standard deviation of the mean for peak NDVI value and day of year.
Remotesensing 09 01338 g003
Figure 4. Daily changes in NDVI (as calculated from the three-day lagged NDVI difference) for the four MISP full transects as June averages and following days of temperatures <5 °C, 5–10 °C, and >10 °C. The letters denote statistical differences derived from repeated measures analysis of variance with Tukey’s post hoc analysis.
Remotesensing 09 01338 g004
Figure 5. Daily changes in NDVI (as calculated from the three-day lagged NDVI difference) for the four MISP full transects as August averages and following days of temperatures <5 °C, 5–10 °C, and >10 °C. The letters denote statistical differences derived from repeated measures analysis of variance with Tukey’s post hoc analysis.
Remotesensing 09 01338 g005
Figure 6. Increases in NDVI, shown as departure from the average, over three days following days of temperatures <5 °C, 5–10 °C, and >10 °C for the four MISP transects and component plant habitats as June averages. Positive values indicate an increase in the rate of NDVI increase (greening) compared with the average rate, and negative values a decrease in the rate of NDVI increase. The letters denote statistical differences as determined with repeated measures analysis of variance with Tukey’s post hoc analysis.
Remotesensing 09 01338 g006
Figure 7. NDVI decreases, shown as departure from the average, over three-day periods for the four MISP transects and component plant habitats as August averages and following days of temperatures <5 °C, 5–10 °C, and >10 °C. Positive values indicate a decrease in the rate of NDVI decline (senescence) compared with the average rate, and negative values an increase in the rate of NDVI decline. The letters denote statistical differences resulting from repeated measures analysis of variance with Tukey’s post hoc analysis.
Remotesensing 09 01338 g007
Table 1. Dominant species and habitat types at each of the four MISP transects.
Community AttributeBarrowAtqasukImnavait CreekToolik Lake
Full Transect
Ave. Daily June Temperature C−4.2 to 10.13.78 to 20.6−5.6 to 19.9−5.7 to 20.5
Ave. Daily August Temperature C0.2 to 10.32.5 to 14.3−0.8 to 17.6−0.8 to 18.2
Dry Heath
Length Along Transect m20201215
Species ListLuzula confusaLedum palustreArctostaphylous alpinaArctostaphyolus alpina
Luzula arcticaVaccinium vitis-idaeaVaccinium vitis-idaeaVaccinium vitis-idaea
Salix rotundifoliaCassiope tetragonaCassiope tetragonaCassiope tetragona
Vaccinium vitis-idaeaCarex bigelowiiBetula nanaBetula nana
Pedicularis kaneiiHierochloe alpinaHierochloe alpinaCarex bigelowii
LichenLichenLichenLichen
Moist Acidic
Length Along Transect m 121814
Species List Eriophorum vaginatum Eriophorum vaginatumEriophorum vaginatum
Salix pulchraSalix pulchraSalix pulchra
Ledum palustreBetula nanaBetula nana
Vaccinium vitis-idaeaLedum palustreLedum palustre
Carex bigelowiiCarex bigelowiiCarex bigelowii
Pleurocarpous mossVaccinium vitis-idaeaVaccinium vitis-idaea
Sphagnum sp.Pleurocarpous mossPleurocarpous moss
Sphagnum sp.Sphagnum sp.
Shrub
Length Along Transect m 16
Species List Salix pulchra
Betula nana
Ledum palustre
Carex bigelowii
Pleurocarpous moss
Sphagnum sp.
Wet Acidic
Length Along Transect m 14
Species List Eriophorum vaginatum
Salix pulchra
Betula nana
Ledum palustre
Carex bigelowii
Cassiope tetragona
Pleurocarpous moss
Sphagnum sp.
Wet Meadow
Length Along Transect m2512
Species ListCarex aquatilis- stansCarex aquatilis
Dupontia fisheriiEriophorum angustifolium
Eriophorum angustifoliumEriophorum russeolum
Eriophorum russeolumSalix pulchra
Pleurocarpous mossSalix polaris
Sphagnum sp.Pleurocarpous moss
Sphagnum sp.

