Article

Measuring Leaf Water Content with Dual-Wavelength Intensity Data from Terrestrial Laser Scanners

1
Department of Forest Sciences, University of Helsinki, Helsinki 00014, Finland
2
Centre of Excellence in Laser Scanning Research, Finnish Geospatial Research Institute FGI, Masala 02431, Finland
3
Department of Remote Sensing and Photogrammetry, Finnish Geospatial Research Institute FGI, Masala 02431, Finland
4
Department of Navigation and Positioning, Finnish Geospatial Research Institute FGI, Masala 02431, Finland
5
Department of Built Environment, Aalto University, P.O. Box 15800, Aalto 00076, Finland
*
Author to whom correspondence should be addressed.
Remote Sens. 2017, 9(1), 8; https://doi.org/10.3390/rs9010008
Submission received: 24 October 2016 / Revised: 5 December 2016 / Accepted: 21 December 2016 / Published: 25 December 2016

Abstract

:
Decreased leaf moisture content, typically measured as equivalent water thickness (EWT), is an early signal of tree stress caused by drought, disease, or pest insects. We investigated the use of two terrestrial laser scanners (TLSs) employing different wavelengths for improving the understanding how EWT can be retrieved in a laboratory setting. Two wavelengths were examined for normalizing the effects of varying leaf structure and geometry on the measured intensity. The relationship between laser intensity features, using red (690 nm) and shortwave infrared (1550 nm) wavelengths, and the EWT of individual leaves or groups of needles were determined with and without intensity corrections. To account for wrinkles and curvatures of the leaves and needles, a model describing the relationship between incidence angle and backscattered intensity was applied. Additionally, a reflectance model describing both diffuse and specular reflectance was employed to remove the fraction of specular reflectance from backscattered intensity. A strong correlation (R2 = 0.93, RMSE = 0.004 g/cm2) was found between a normalized ratio of the two wavelengths and the measured EWT of samples. The applied intensity correction methods did not significantly improve the results of the study. The backscattered intensity responded to changes in EWT but more investigations are needed to test the suitability of TLSs to retrieve EWT in a forest environment.

Graphical Abstract

1. Introduction

Climate change is increasing global mean surface temperature, affecting precipitation patterns and the frequency and duration of drought periods globally [1]. Environmental changes result in alterations in forest ecosystems that are potentially harmful to the native fauna and can cause tree dieback (e.g., the spread of non-native tree pests and pathogens) and changes in the susceptibility of host plants [2,3]. The collection of forest health data has traditionally been based on visual subjective estimation of tree canopies, which is time-consuming and prone to error and bias; thus, new methods for mapping and monitoring forest health are needed to provide objective and efficient estimation of forest health, improve the prediction of global climate-induced tree mortality, and provide tools for the strategic mitigation of damage.
Laser scanners can measure an object in five dimensions using a light detection and ranging technique whereby laser light is emitted and the reflected light is received by the detector [4]. These five dimensions include three spatial dimensions (x, y, and z-coordinates), time as the fourth dimension, and the intensity of the reflected light as the fifth dimension. Two types of methods can be used to calculate the distance the target: (1) time of flight technique when the light source is pulse-based, or (2) phase modulation technique when continuous wave light is used. The elementary difference between these techniques is that pulse-based techniques are able to record multiple range measurements from a single pulse, whereas continuous wave techniques provide a single range measurement. A wide range of forestry applications has been developed over two decades using the three-dimensional information, but relatively little focus has been put on the fifth dimension because the calibration of intensity data has been problematic [5,6,7]. Since reflectance information has been widely utilized in optical remote sensing techniques and proven useful for many applications, more focus should be put on investigating the potential of intensity information from laser scanners. The recent technical development of multispectral laser scanners supports this as a wider array of wavelengths can be put to use [4,8,9].
A number of studies have investigated the use of intensity information from single wavelength laser scanners to impute single-tree attributes, classify species, and map understory trees from airborne laser scanning data [10,11,12]. Terrestrial laser scanner (TLS) data with intensity information have been used to study the estimation of leaf area distribution, measurement of tree stem diameters, and discrimination of marls and limestones using mainly 1535 nm wavelength [13,14,15]. However, it has been found that the laser intensity measurement is affected by the incidence angle between the scanner and the target surface, and the distance to the target complicates the utilization of intensity data [16]. Other issues include the edge effect, when the laser beam hits the target with only a part of the laser footprint reducing the return intensity [17]. The edge effect is likely to be pronounced when phase modulation techniques are used for range measurement as the background is taken into account, producing noisy ghost points [18], whereas pulsed laser scanners can detect the returned light energy from the first object that the laser beam hits. The calibration of laser intensity data is necessary because of the aforementioned effects for obtaining more accurate results in radiometric measurements [19].
The calibration of intensity measurements from TLS data has recently been investigated in a search for correction methods regarding the range and incidence angle effects [20,21]. These studies have shown that the range effect is strongly dependent on the instrument used; thus, reference measurements using an external target are required. The effect of incidence angle on recorded intensity has been found to be influenced by the reflectance and surface properties (i.e., the surface roughness or grain size) of the target [20]. If the target has a surface that is characterized by perfectly diffuse reflection (i.e., light is reflected with constant intensity in all directions), then the backscatter intensity is proportional to the incidence angle, following the Lambert’s cosine law. However, usually natural surface reflection is a combination of specular (i.e., mirror reflection) and diffuse reflection, thus the determination of the fraction of either specular or diffuse reflection is required. A surface characterized by a more specular reflection is likely to be more affected by the incidence angle as more light is mirrored to the detector, as was found in the visible light domain [22]. Kaasalainen et al. [20] proposed an empirical model combining the Lommel–Seeliger function and Lambert’s cosine law to correct for the effect of incidence angle on TLS intensity data. Höfle [23] investigated radiometric correction methods for individual maize plant detection from TLS data, and showed that the amplitude of variation was significantly reduced for homogeneous areas using his method.
Vegetation water content, which is typically measured as equivalent water thickness (EWT) in the remote sensing literature, is an important indicator of plant physiological status [24]. EWT is a measure of the weight of water per unit of leaf area, usually given in g/cm2. Decreased EWT has been identified as an early signal of forest drought stress [25] and infestation of forest insect pests (e.g., the mountain pine beetle) [26]. Early detection of tree stress is vital in reducing the spread of insect pests and the mitigation of damage since tree stress increases the susceptibility of the host plant and infected trees should be removed to minimize attacks on living trees [27]. Since a detailed description of the relationship between leaf water content and vegetation is beyond the scope of this paper, a more detailed review of the relationship between vegetation status and water content and the detection of EWT using reflectance in the optical domain can be found in Ceccatto et al. [28].
The mapping of EWT has recently been studied at leaf level using a single wavelength full-waveform TLS operating at 1550 nm, resulting in a significant correlation between backscattered intensity and EWT (R2 = 0.74), with eight broadleaf species exhibiting a variety of leaf surface types [29]. However, the achieved correlation was a result of a number of intensity correction methods including the removal of the specular reflection component, and correction of incidence angle. The removal of the specular reflection component requires a priori information about the reflectance model parameters, complicating the use of such methods in a heterogeneous forest environment. Zhu et al. [30] also investigated the estimation of canopy leaf water content in a recent publication showing that EWT can be predicted with a coefficient of determination of 0.66 after incidence angle correction. While the proposed method has potential for mapping EWT in broadleaf species, the applicability of the method for conifer species remains a research topic for the future.
Laser scanners utilizing two or more wavelengths simultaneously could potentially help in overcoming the influence of incidence angle and partial hits to leaves if the wavelengths are similarly influenced by these factors [17]. A normalized ratio of two wavelengths should then be insensitive to the effect of incidence angle since the effect is partially cancelled out [31]. This also enables the use of spectral ratios where optimally one wavelength is affected by the variable of interest and the other is located at a stable region of the spectrum. A small number of studies have investigated the utilization of multispectral laser scanners and reflectance indices calculated from the intensity data in estimation of vegetation biochemical parameters and tree health [31,32,33]. Gaulton et al. [31] used a dual-wavelength TLS (1064 nm & 1550 nm, for more details on the instrument [34]) for estimating EWT in a laboratory setting, resulting in a high correlation (R2 = 0.80) between the normalized ratio of the two wavelengths and the measured EWT of leaf samples from herbaceous species, but the number of samples and species in this study was very small and there is a need for further investigations, especially using tree species. Eitel et al. [33] examined the ability of a dual-wavelength laser scanner (532 nm & 658 nm) in providing information about foliar nitrogen content, and Nevalainen et al. [35] proposed a non-destructive method for the estimation of chlorophyll in tree canopies with a hyperspectral laser scanner utilizing eight wavelengths, both concluding that spectral indices calculated from these wavelengths were able to improve the estimation of the investigated biochemical parameters.
This paper tests the feasibility of using multisensor multispectral laser scanning (690 nm & 1550 nm) for the estimation of leaf-level EWT of five different tree species in combination with laser intensity correction methods in a laboratory setting. The rationale for using laser indices calculated from two wavelengths is the expected insensitivity to confounding factors that could affect the results. So far, the use of multispectral TLS data for retrieval of leaf EWT has been studied only with a very limited number of species (no tree species) and samples, emphasizing the need for further investigation using a larger dataset—also with multisensory data including intensity correction methods. The study has only investigated broadleaved species, whereas here conifer species, which comprise a majority of boreal forest biomass, are also investigated. The complex nature of conifer leaves sets more challenges to the processing of intensity data when a single laser measurement is produced from several leaves instead of one as the width of the needles are smaller than the laser footprint. Here, different methods for correcting multispectral intensity data due to the influence of incidence angle and between-species variation in reflective properties are also considered in combination with spectral indices calculated from the intensity data in a novel manner. The developed method could improve ground-based measurement of canopy EWT, which could be beneficial as a calibration and validation tool for airborne and space borne remote-sensing techniques, allowing more accurate estimation of EWT on larger scales. The objectives of this study are: (1) to investigate the correlation between EWT- and TLS-measured laser intensity using dual-wavelength data and calculated spectral ratios; (2) to examine the influence of incidence angle correction to account for wrinkles and curvatures of the leaves in the results; (3) to examine if the removal of specular backscatter intensity will provide a more general model for the relationship of EWT and laser intensity with this set of species, and (4) to examine the effect of leaf dry mass on backscattered intensity.

2. Materials and Methods

2.1. Experiment Design

The estimation of EWT with laser scanner intensity data at two wavelengths is based on the assumption that one band responds to varying leaf water content, while the other is not sensitive to its changes but other structural components, thus normalizing structural effects on measured intensity. The wavelengths chosen for this study were 1550 nm and 690 nm, based on the availability of laser scanners at the laboratory. The shortwave infrared band at 1550 nm is located at a water absorption window where increased leaf water content should reduce the reflected laser light energy, and the red band at 690 nm should be insensitive to changes in leaf water content. This was confirmed by leaf reflectance modeling with the radiative transfer model (i.e., PROSPECT-5 model) [36], where EWT varied between 0.0024 g/cm2 and 0.05 g/cm2, while other leaf parameters were kept constant (Figure 1). However, there are other biochemical parameters (e.g., chlorophyll content) that can alter the reflectance at 690 nm; thus, it may be a suboptimal choice for normalizing structural effects.
The relationship between laser intensity and EWT was investigated using a total of 101 leaf and needle samples from five different species. The deciduous species were Small-leaved Lime (Tilia cordata L.), Silver birch (Betula pendula L.), and Norway maple (Acer platanoides L.), whereas the conifer species were Norway spruce (Picea abies L.) and Scots pine (Pinus sylvestris L.). Thus, the leaf structures investigated in this study range from large-leaved deciduous species to small-needled conifer species. The samples were collected from the test forest stand in Kirkkonummi, southern Finland. The forest represents an Oxalis-Myrtillus forest type in Cajander’s classification, which is an eutrophic forest type in Finland [37]. One branch per tree species was collected from mature trees with a branch cutter from an approximately five-meter height and the cut end of the branch was immediately placed in a water container. The branches were then re-cut under water to maintain water connection to the xylem during transportation to the laboratory [38].
Twenty individual leaves from each broadleaved tree species were randomly collected from the branches and attached to black cardboard frames to avoid any unwanted changes in their position during the experiment, similarly to Gaulton et al. [31]. As pine needles were too small to be measured individually, a set of approximately 20 pine needles representing different age classes (one-, two-, and three-year needles) were chosen for each sample and mounted on cardboard frames side by side with tape so that each needle was crossing the frame. The amount of tape used in the mounting was kept at a minimum to avoid its effect on the drying process. As spruce needles were too small to be attached on the frames directly, three spruce twigs of approximately 10 cm in length were randomly cut for each sample and mounted on cardboard frames, with only needles within the frame to avoid returns from woody material. The aim was to fill the frames entirely with the leaves and needles to maximize the number of laser hits to a single sample.
As the samples dried naturally in their frames [31], they were scanned at 11 to 17 time intervals during a 77 h time period, in which the deciduous species reached a constant level of moisture. Spruce and pine needle samples were found to dry relatively slowly during the experiment; therefore, they were dried in an oven at 65 °C in 10-min time periods after 44 h of drying naturally to capture a wider range of EWT values than would have been possible without drying, similar to the approach used by Zhu et al. [29]. The relative humidity in the laboratory was about 45% during the experiment.

2.2. The Calculation of Eco-Physiological Parameters

Before the samples were mounted on the frames, they were first weighed with a precision scale and then photographed with a full frame digital camera (Canon 5D mark II, Canon Inc., New York, NY, USA) and a 50 mm lens with a reference object next to the sample with a known area in order to calculate leaf area with the open-source computer software EasyLeafArea [39]. The software calculates the leaf area based on the ratio of segmented pixels from the reference object and the leaves. Before each measurement the samples were weighed (including the frame, whose weight was known) to allow the calculation of EWT (Table 1). All samples were dried in an oven at 65 °C for 48 h after the experiment to measure the dry weight and calculate EWT. Since spruce samples contained twigs, they were weighed separately and subtracted from the fresh weight (a constant 50% moisture content was assumed) and from the dry weight in the calculation of EWT.
The EWT was calculated using the following equation [40]:
(FW − DW)/A (g/cm2),
where F W is the weight of the fresh leaf (g), D W is the weight of the completely dried leaf (g), and A is the surface area of the leaf (cm2).
The measurements also allowed the calculation of leaf mass per unit area (LMA), which describes the leaf thickness or/and density. Thus, LMA was calculated to investigate the effect of varying LMA on the backscattered intensity from TLS measurements, and to gain a better understanding of the variables accounting for the variation in laser intensity at the investigated wavelengths (690 nm and 1550 nm). The LMA was calculated with the following equation:
DW/A (g/cm2).

2.3. Terrestrial Laser Scanners

The samples were measured with two TLSs, a FARO X330 (FARO Europe GmbH & Co. KG, Korntal-Münchingen, Germany) and a Leica HDS6100 (Leica Geosystems AG, Heerbrugg, Switzerland) utilizing 1550 nm and 690 nm wavelengths, respectively. The TLSs were chosen based on the availability of laser scanners at the laboratory, and it should be noted that the wavelength at 690 nm is suboptimal as a reference wavelength due to its expected sensitivity to chlorophyll content. The measurements were done consequentially with a 90-second time interval from a distance of 4.4 meters. Both of the laser scanners are based on the measuring phase shift of the returning laser energy to calculate the distance between the scanner and the target. Beam divergences were 0.19 mrad and 0.22 mrad with spot sizes of 2.25 mm and 3 mm at exit, resulting in a spot size of 3.09 mm and 3.97 mm at target range for FARO and Leica scanners, respectively (Table 2). High scan resolutions were used to maximize the number of measurements from each sample, resulting in a point spacing of approximately 1.2 × 1.2 mm for both scanners; thus resulting in significant overlap between consecutive measurement spots. A highly absorptive black acrylic fabric was placed 10 cm behind the samples to avoid any unwanted background reflectance from the sample setting. The lighting in the laboratory was ambient natural light from the windows, hence the lighting changed slightly according to the sun’s movement but the samples were not subjected to direct sunlight. To minimize the difference in incidence angle between the scanners, they were placed as close as possible to each other, resulting in an incidence angle difference of approximately 3°, which is small enough to be negligible [20]. Optimally in multispectral laser scanning the laser beams should be completely aligned and have the same properties in terms of beam divergence and spot size, but this is not achievable with multisensory systems. To account for this, the intensity measurements over a larger area are averaged.

2.4. Pre-Processing of TLS Data

Each scan was processed and returns from each leaf sample were extracted manually in the open-source software CloudCompare v.2.6.2. The number of extracted returns from each leaf sample varied from 405 to 2984 depending on the leaf area of the sample. As cardboard frames were used as mounting platforms, returns close to the edge of the frame were avoided and only returns representing full hits on a leaf were extracted for further analysis to avoid any unwanted edge effect [17].
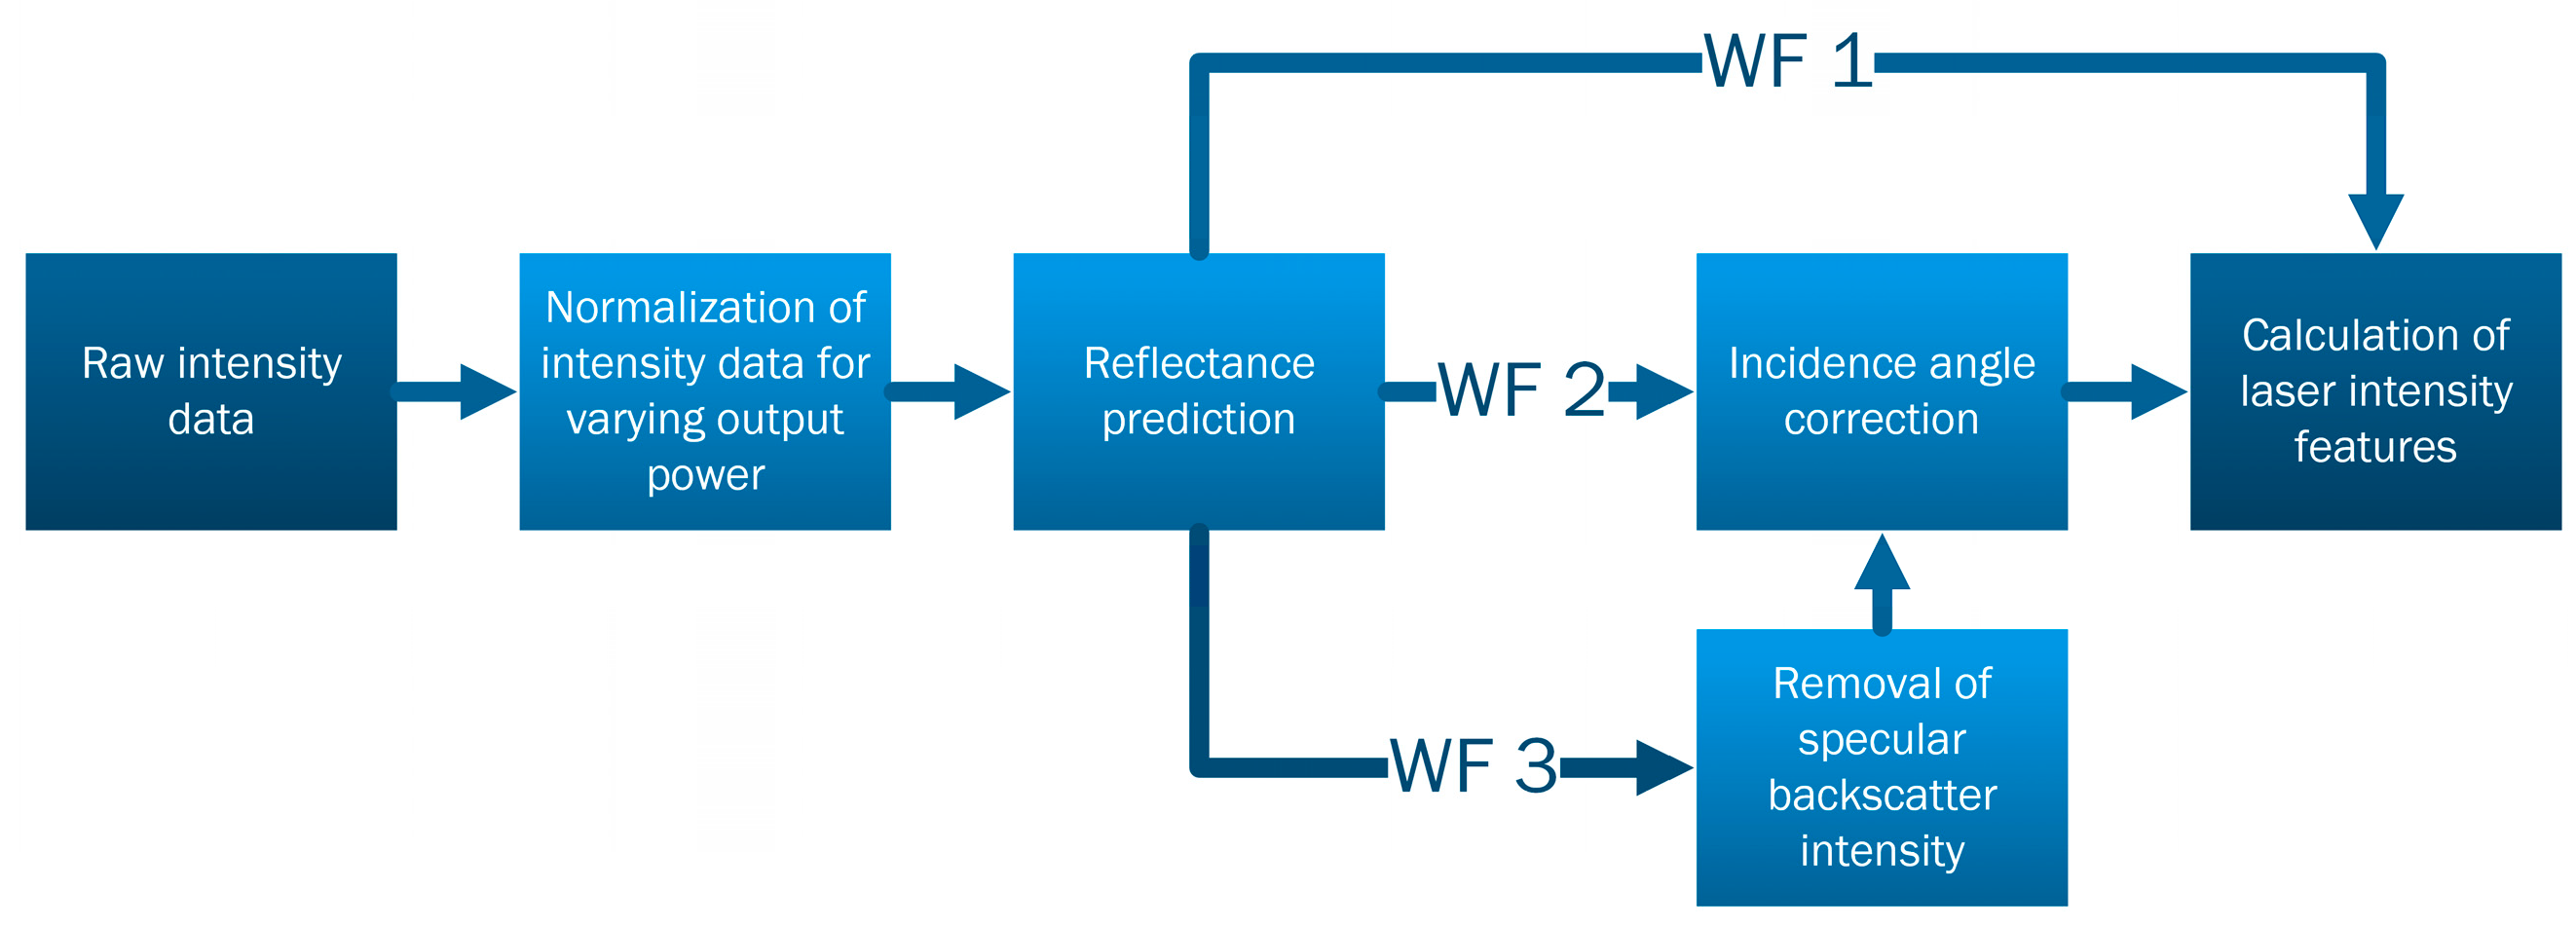
Different approaches were taken to test how various correction methods of laser intensity data affected the results. Figure 2 shows the three alternative processing workflows for the intensity data correction. In steps one to three, normalization of intensity data for varying output power and calibration of laser intensity to known reflectance were considered as a fundamental part of processing, resulting in calibrated intensity. Then, two additional correction methods for calibrated intensity data were attempted: incidence angle correction, and incidence angle correction with removal of specular backscatter intensity. The correction methods are described in detail in the next sections.

2.5. Intensity Calibration

The TLSs are commercial laser scanners that have been designed mainly for range measurements; thus, they are not optimized for intensity measurements, and the method used for calculating the backscattered laser light signal, measured as intensity, has not been published by the manufacturers. These are limitations that require the calibration of intensity data. Here, we present a calibration method that is able to reduce the effect of environmental conditions on the measured intensity, and reduce the effect of the scanners possible amplifier for small reflectances (i.e., linearize the measured intensity), thus providing a relative calibration based on reflectance measurements as a reference. We aimed at observing the alterations in the intensity measurements and calculated spectral ratios due to changed EWT and LMA, hence no physical calibration was conducted.
A stationary four-grade Spectralon-panel (Labsphere, North Sutton, NH, USA) (nominal reflectances 99%, 50%, 25%, and 12%) was scanned from the same distance and angle to investigate the relationship of measured raw intensity and reflectance measured with an ASD FieldSpec Pro FR (Analytical Spectral Devices, Inc., Boulder, CO, USA) field spectrophotometer. The measured intensity of the 99% Spectralon was somewhat saturated in both of the laser scanners since the maximum intensity of the digital numbers (DN) was reached. Therefore, we used only the 50%, 25%, and 12% panels as calibration and reference targets. The raw intensity values of the leaves were below the intensity of the 50% panel, thus the measurements are within the calibrated range.
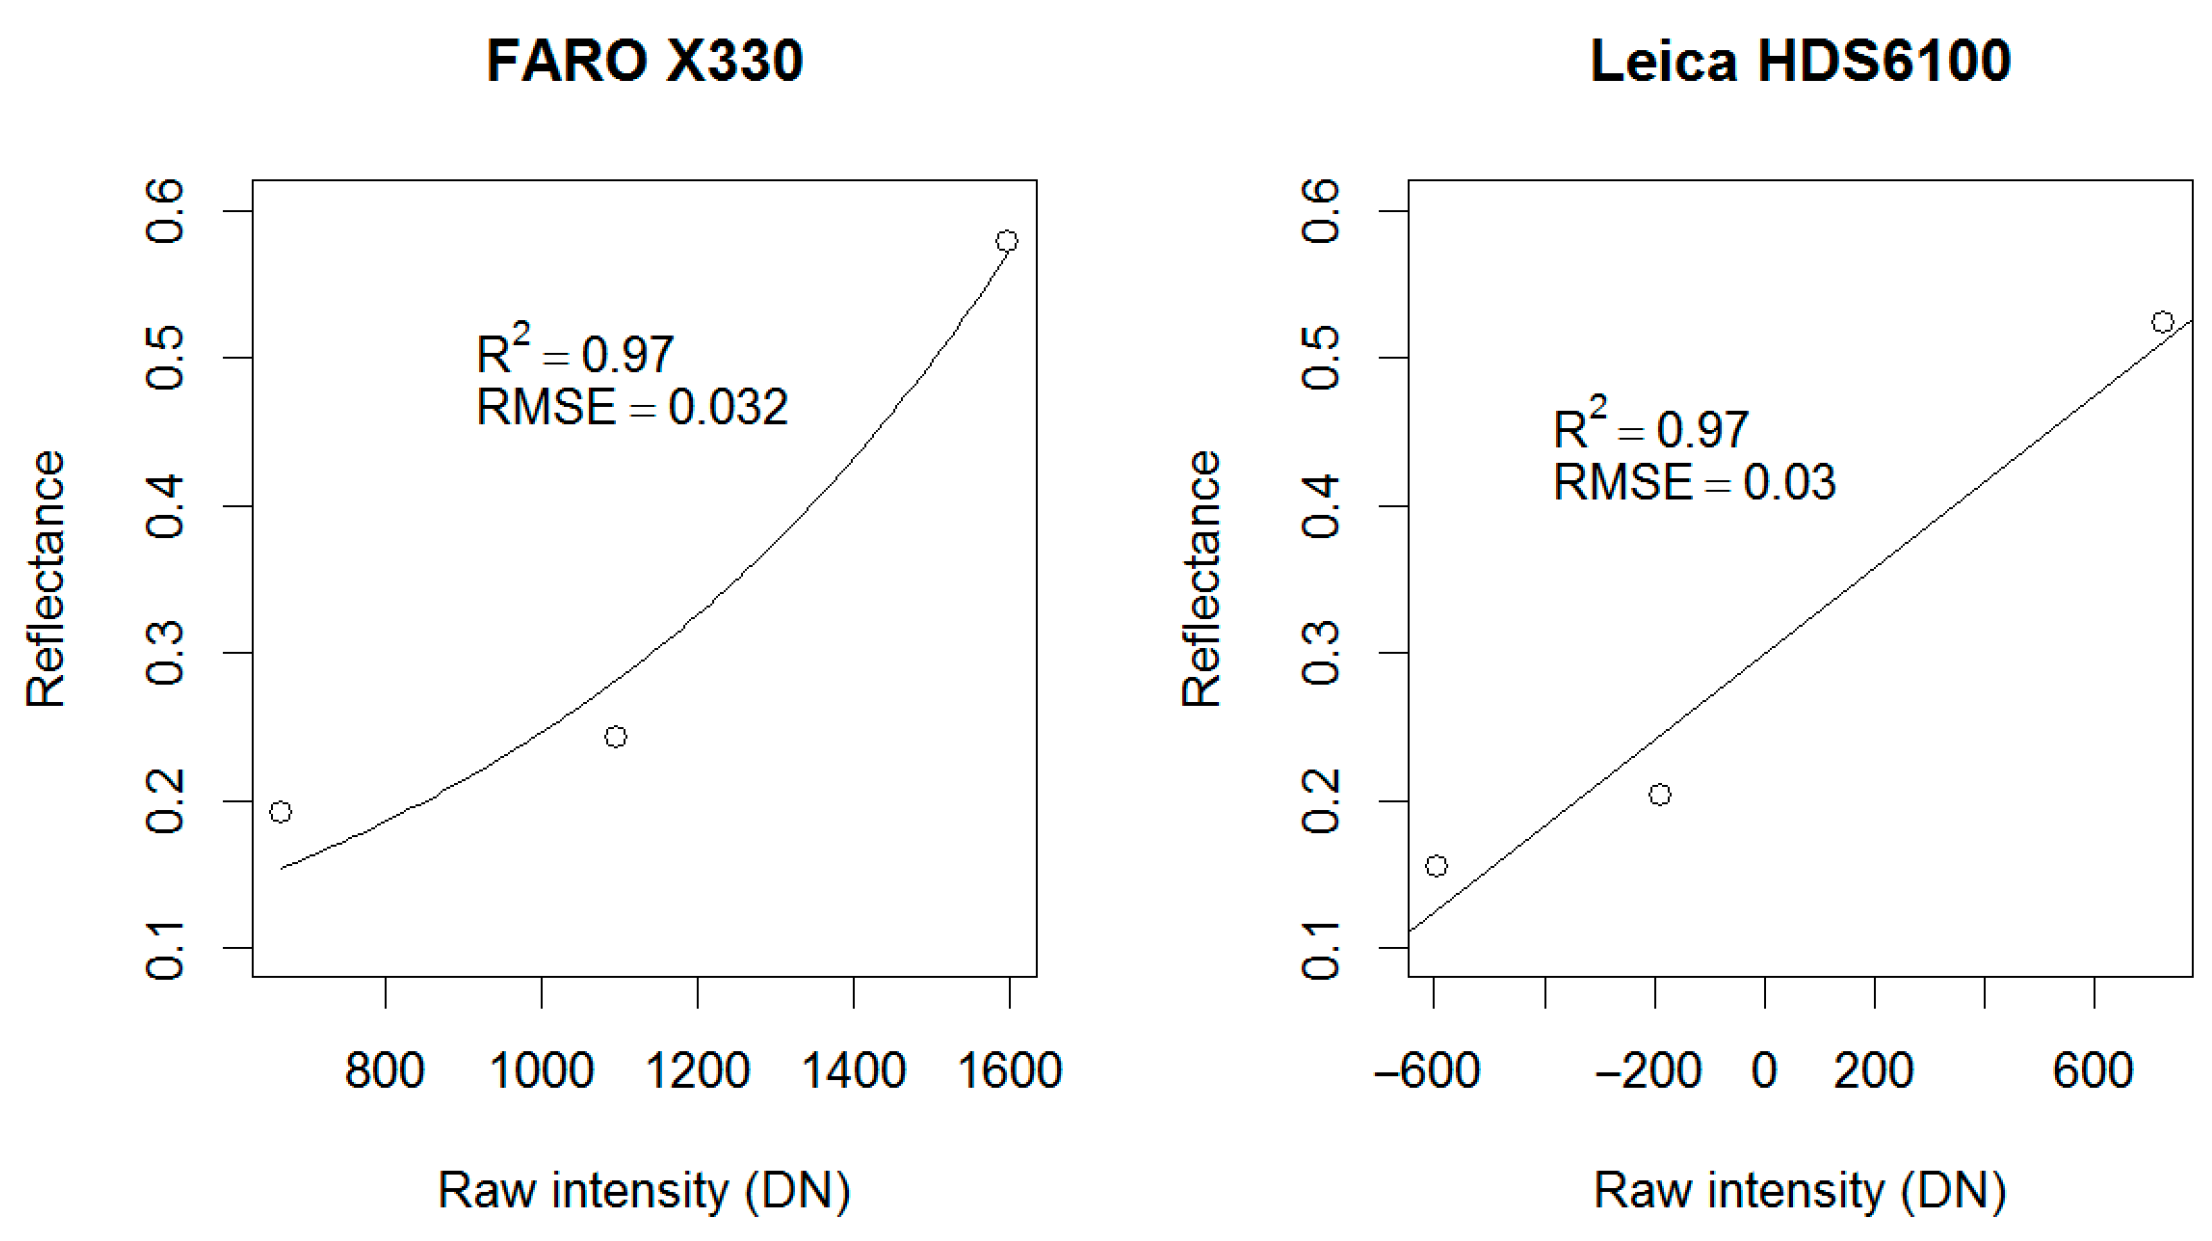
First, the relationship between the raw intensity and the measured reflectance of the reference targets was evaluated to detect any non-linearity of the intensity measurements quantified with DNs. Leica showed a linear relationship between the intensity and reflectance, hence no transformations were needed, but the FARO showed a logarithmic relationship between the raw intensity and measured reflectance; thus, a logarithmic transformation was applied to linearize the raw intensity values. The following equation was used to correct for the logarithmic effect (Equation (3)), also used previously by Kaasalainen et al. [41]:
y = 10 ( x A 1 ) A 0 ,
where A 1 and A 0 are empirical parameters determined by fitting the spectrophotometer measured reflectance and the raw intensity measured by the FARO scanner. For the Leica scanner, a linear regression model was developed similarly by fitting the ASD measured reflectance and raw intensity measured by the Leica scanner. The models used for converting the DNs to calibrated intensity were then an exponential model and a linear model for FARO and Leica, respectively (Figure 3). The difference in the processing of the backscattered light signal can be observed from Figure 3, where the Leica at 690 nm seems to have a more linear response compared to the FARO at 1550 nm.
Then, the variations in output laser power due to small variations in temperature and background illumination were normalized for each wavelength and measurement using the mean of approximately 19,000 returns from the 50% Spectralon reference panel. The effect of varying range on intensity was not corrected in this study as the samples were measured within a very narrow range, with only a 5 cm of range variation between samples (Kaasalainen 2011). However, a range correction would be required when measuring plant entities with more variation in terms of range to the laser scanner (e.g., scanning a tree).

2.6. Incidence Angle Correction

2.6.1. Incidence Angle

The incidence angle is the angle between the target surface normal and the incoming laser beam (i.e., how much deviation there is from a perpendicular line to the surface); thus, the calculation of surface normal is demanded for the correction process. First, a plane, or a surface function in general, must be formed from the nearest neighbors of each point to be able to calculate the surface normal. The search for nearest neighbors was done with a search radius of 4 mm, which was found to be suitable for the point spacing in the TLS data used in this study. Then, a plane was fitted to the point and its neighbors by minimizing the fitting error, and a normal was calculated for the plane [42]. The orientation of the normal was checked and flipped when necessary to point towards the scanner. Then, the incidence angle was calculated from the surface normal and the laser beam vector with the following equation:
α = arccos (PN)/|PN|,
where α is the incidence angle, P is the laser beam vector from the laser scanner to the surface, and N is the surface normal vector.

2.6.2. Model for Correcting the Incidence Angle Effect on Backscatter Intensity

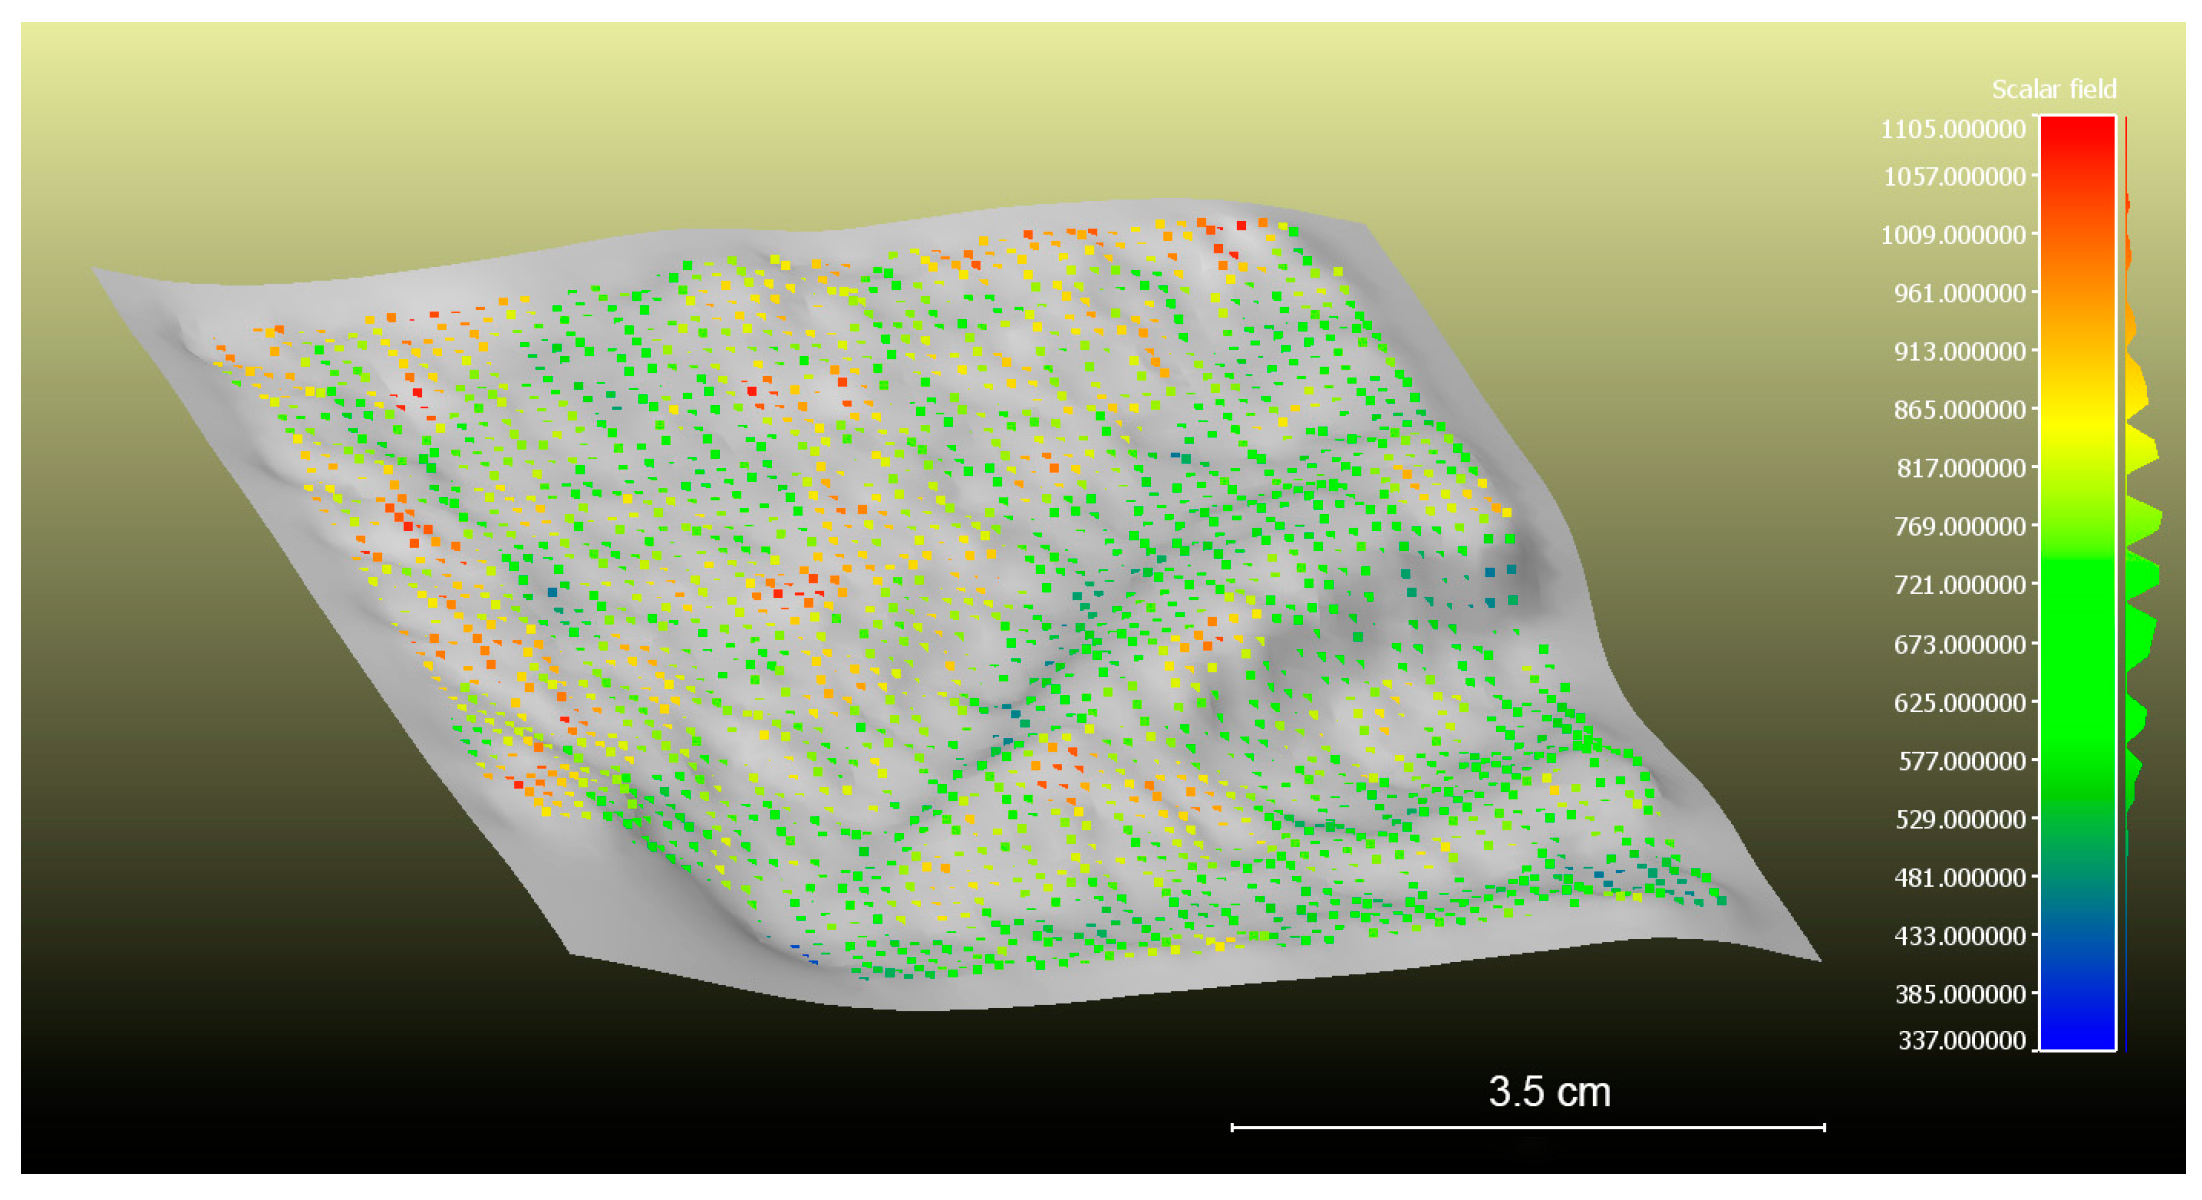
Leaf surface is characterized by small curves and wrinkles, thus different local incidence angles were present although the leaves were facing the laser scanners at an approximately perpendicular angle (Figure 4). Also, the utilization of two TLSs resulted in small differences in the incidence angle between the scanners; thus, a correction of the incidence angle was attempted. An empirical scattering model employing a linear combination of the Lommel–Seeliger law [43] and the Lambert’s cosine law can be expressed as follows [20]:
S ( ε ,   τ ) = cos ε cos τ   ( 2 c 1 cos ε + cos τ + d ) ,
where c and d represent target surface attributes. In our experiment the geometry is ε = τ . Kaasalainen et al. [20] have discussed this approach in more detail. The observed intensity can then be expressed with the following equation [20]:
I ( ε ) = a ( ω , g ) ( 1 b ( ω , g ) ( 1 cos ε ) ) ,
where ω represents the albedo and g the grain size of the material. The parameter b represents the Lambertian component, and parameter a is the intensity at zero incidence angle. The parameter b = 1 gives a fully Lambertian behavior; values lower than that give a more diffuse behavior than Lambertian, and higher values give a more specular scattering. Since no exact physical relationship between surface parameters and scattering law was found before [20] and the model fitted the data well, this function can be used to empirically correct for the incidence angle.
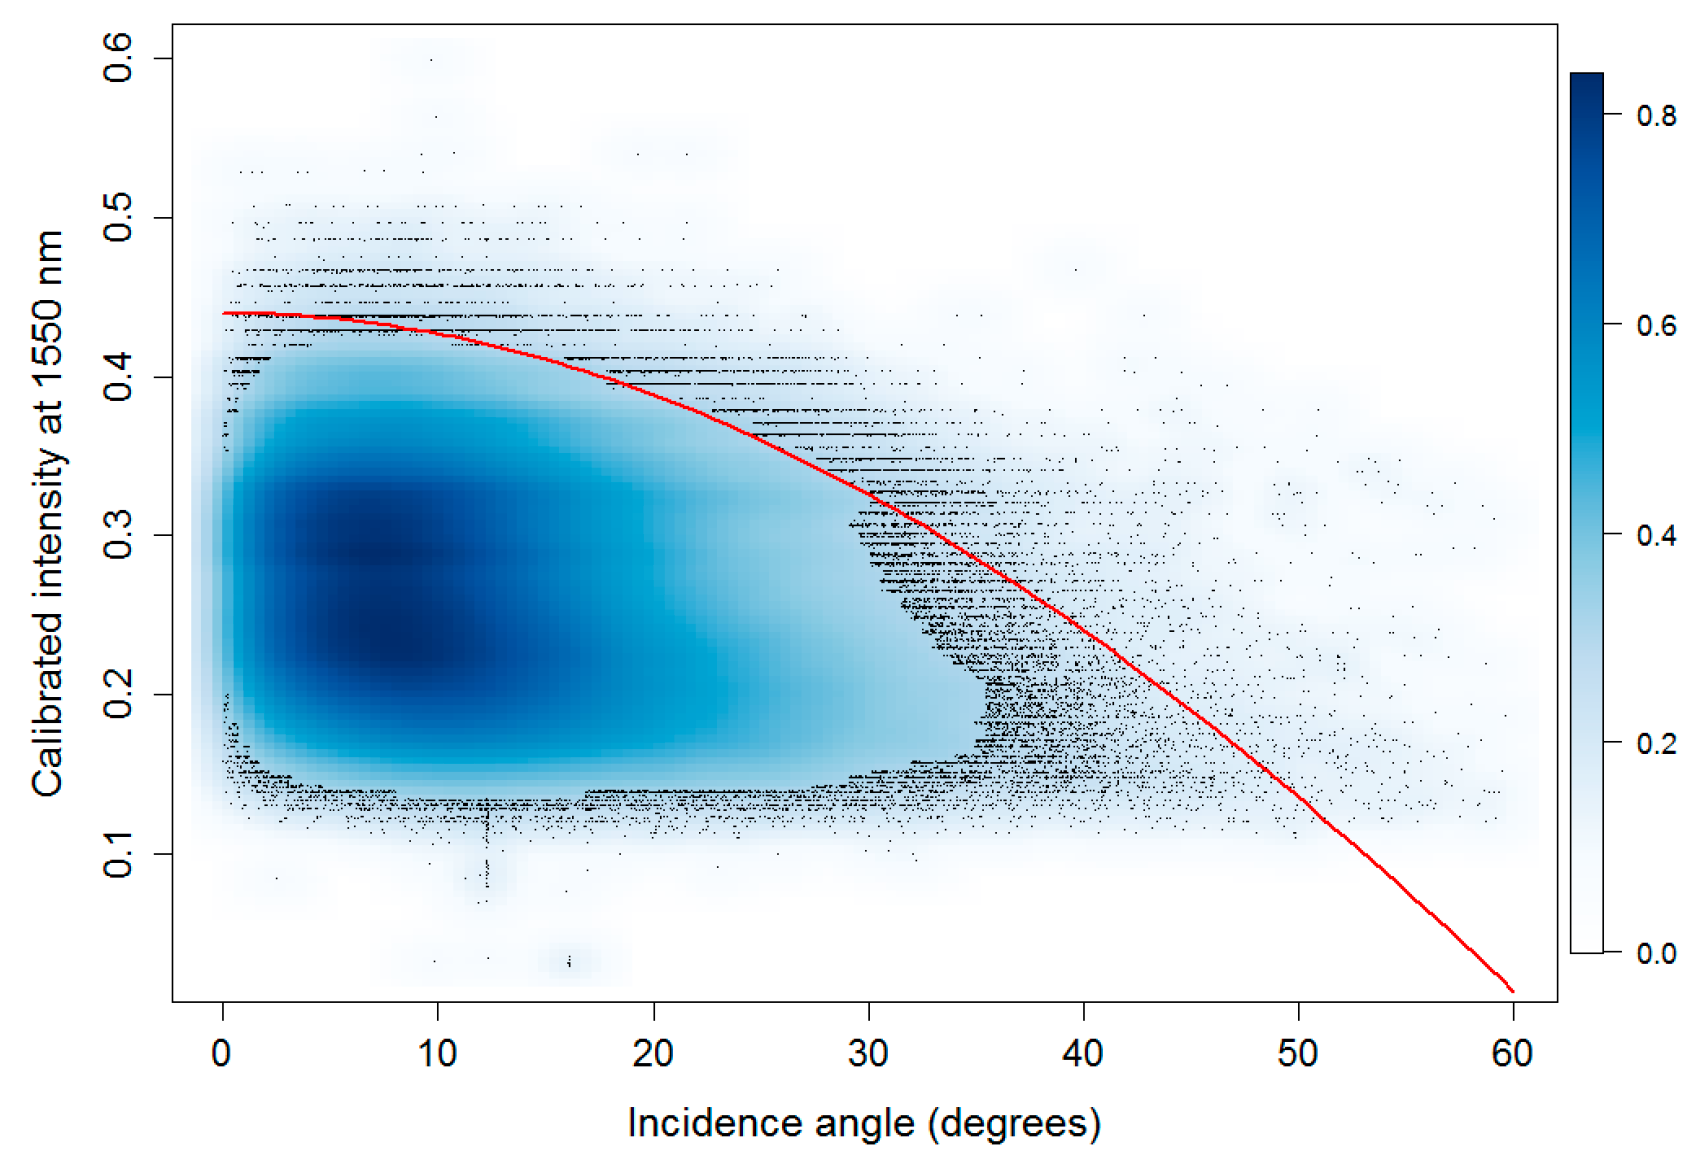
The model parameters were visually evaluated from density scatterplots with all of the calibrated intensities and related incidence angles for a single species (Figure 5). The evaluation is based on the assumption that the leaf surface presents a highly heterogeneous surface with a variety of incidence angles. In Figure 5 it can be observed that the returns with the highest intensity decrease towards larger incidence angles. This decreasing tail was “lifted” using the incidence angle correction, resulting in a flatter relationship between the calibrated intensity and incidence angle. The correction was validated by observing the relationship between the incidence angle corrected calibrated intensity and incidence angle with similar figures to Figure 5.

2.7. Removal of Specular Backscatter Intensity

Removal of specular backscatter intensity was attempted in order to compensate for the different reflective properties of leaf surfaces, produce a better fit for models between calibrated intensity and the related EWT, and provide a more general model for predicting EWT. Leaf surface reflectance is a combination of specular (i.e., mirror-light reflectance) and diffuse reflectance; thus, a mixed Lambertian/non-Lambertian model is needed for simulating the surface reflectance. Poullain et al. [44] presented linear combinations of the Lambertian model and the Beckmann law, which was used to simulate backscatter intensity from TLS data in this paper. The theory can be applied to a wide range of surfaces from smooth to rough as it has a parameter for defining the surface roughness. The Lambertian model defines the diffuse backscattering of matte surfaces, whereas the Beckmann law [45] models the specular reflectance properties from shiny surfaces.
I = f ( k d cos α + 1 ( 1 k d ) cos 5 α e ( tan 2 α m 2 ) ) ,
where I is the backscatter intensity, f is the backscatter intensity at normal incidence angle, k d represents the fraction of the diffuse backscatter intensity, α is the incidence angle, and m is the surface roughness parameter, varying from 0 (smooth surface) to 0.6 (rough surface). The reflectance model was used to estimate the fraction of specular intensity for each species. The model parameters were also visually estimated through iteration from density scatterplots with the calibrated intensity and incidence angle data similar to Section 2.6.2 (Table 3). The model parameters were determined through an iteration process to find a fit between the modeled intensity and the measured intensity using the density scatterplots. Then, the fraction of specular intensity was removed from the calibrated intensity using the estimated parameters for each species.

2.8. Laser Intensity Features

Statistics were calculated for each point cloud representing a leaf sample from the calibrated intensity, which was calculated according to the three workflows. These features were the mean and standard deviation of the intensity value distribution. Then, spectral indices were calculated using the mean intensity values for each sample. The spectral indices were calculated as follows [33]:
L a s e r R a t i o I n d e x   ( L R I ) = 1550 m e a n 690 m e a n ,
N o r m a l i z e d L a s e r D i f f e r e n c e I n d e x   ( N L D I ) = 690 m e a n 1550 m e a n 690 m e a n + 1550 m e a n ,
where 1550 m e a n is the mean of the backscattered intensity at 1550 nm, and 690 m e a n is the mean of the backscattered intensity at 690 nm. Similar spectral indices employing a wavelength at 1064 nm instead of 690 nm have been used before for estimating leaf water content (e.g., see [31]).

2.9. Statistical Analysis

The mean and standard deviation of extracted intensity values were calculated for both wavelengths and spectral indices were calculated for each sample at each time interval. Simple linear regression methods were used to determine the relationships between measured EWT and laser intensity features for all species pooled together, and separately for each species. Reduced major axis (RMA) regression was chosen as the regression method since it is symmetrical in describing relationships between variables, and therefore biochemical parameters can be estimated through model inversion [46]. Logarithmic or square root transformation was applied to the regression variables prior to regression analysis when they showed non-linearity to ensure a linear relationship between the variables. The non-linearity of the relationship was detected by examining the residuals of the linear regression model. The accuracy of the developed regression models for predicting EWT was evaluated with the root mean square error (RMSE) and the coefficient of determination ( R 2 ), which were obtained by model inversion and leave-one-out cross-validation methods using the following equations:
R M S E = i = 1 n ( y i y ^ i ) 2 n
R 2 = 1 i ( y i y ^ i ) 2 i ( y i y ¯ ) 2 ,
where n is the number of observations, y i is the observed value for the measurement i , y ^ i is the predicted value for the measurement i , and y ¯ is the mean of the observed data.
The effect of LMA on the laser intensity features was estimated by dividing the data into groups of similar EWT (with deviation less than 0.002 g/cm2), as the leaf moisture content was expected to influence the laser intensity features. Then, the correlation between LMA and laser intensity features was calculated for each group containing over 10 samples, and reported with Pearson’s correlation coefficient. All the statistical analyses, including the calculations conducted in the calibration process, were conducted in the open-source software package R version 3.2.3. [47].

3. Results

3.1. Correlation between Calibrated Intensity and EWT

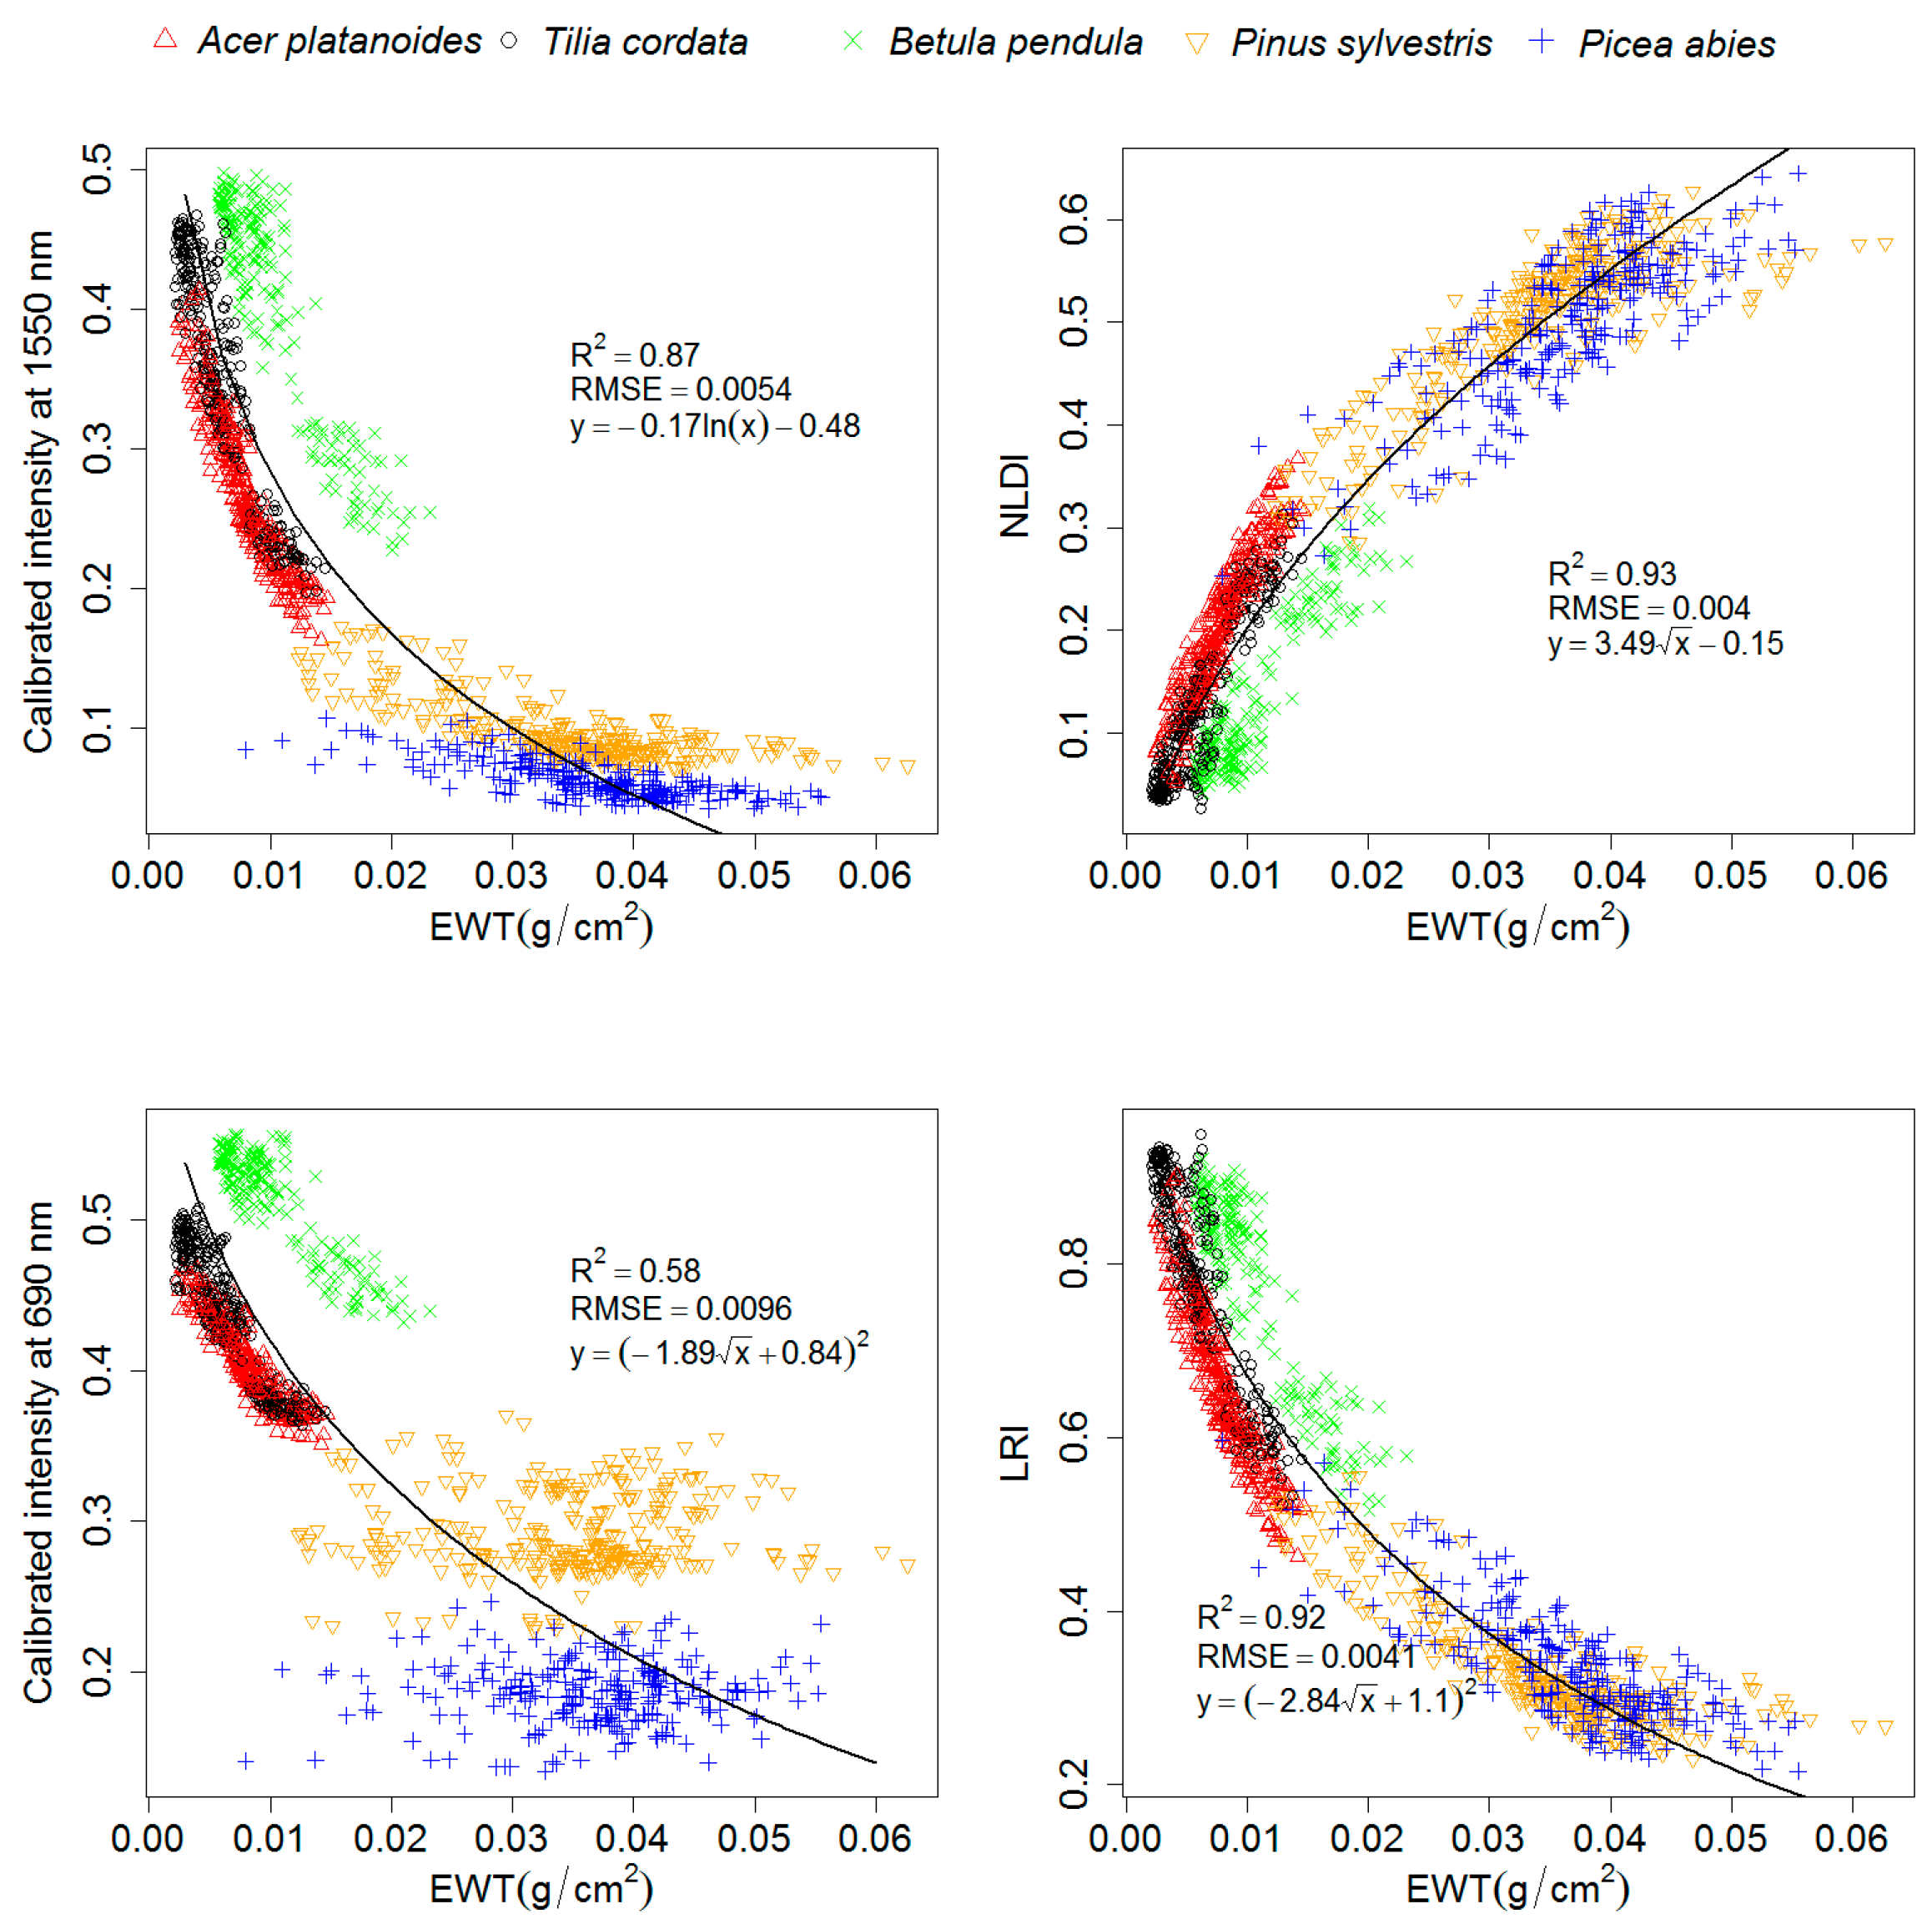
Calibrated intensity at 1550 nm showed a negative relationship with EWT with coefficients of determination of 0.84–0.87 for the deciduous tree species and 0.40–0.63 for the conifer species (Table 4). Also, a coefficient of determination of 0.87 was observed for these variables when combining the tree species together (Figure 6). As expected, the calibrated intensity at 1550 nm increased whereas the EWT decreased, indicating the absorbance property of water at this wavelength (i.e., a part of the energy of the laser is absorbed by the leaves’ water). The calibrated intensity values obtained at 690 nm showed a somewhat similar trend in deciduous tree species: deciduous species showed a correlation between calibrated intensity at 690 nm and EWT with coefficients of determination of 0.82–0.83, whereas conifer species showed no correlation (R2 = 0.01).
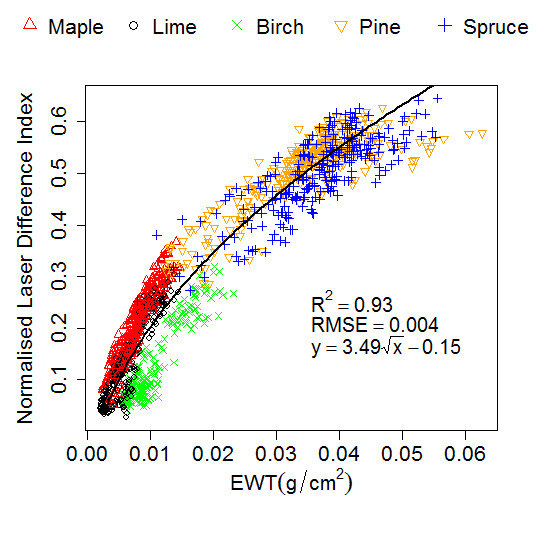
The spectral indices calculated from the two laser wavelengths correlated with EWT. NLDI correlated with EWT for all species pooled together with a coefficient of determination of 0.93, whereas LRI was nearly equal in explaining differences in EWT (R2 = 0.92). The spectral indices showed very similar correlations with EWT compared to the calibrated intensity at 1550 nm in deciduous species, but both of the conifer species showed a stronger correlation between EWT and spectral indices than for the calibrated intensity at 690 nm or 1550 nm. The calibrated intensity at 690 nm did not alter with EWT for the conifer species, improving the performance of the spectral indices, as the wavelength at 690 nm acted as a reference band, not altered by EWT.

3.2. Correlation between Calibrated Intensity and EWT after Incidence Angle Correction

The incidence angle correction of backscattered intensity increased the coefficients of determination of the relationships between the laser intensity features and EWT by only 0–0.04. The results for the deciduous species did not improve significantly after the incidence angle correction, showing only minor changes in the coefficients of determination. The conifer species displayed similar results, but the correlation between calibrated intensity at 1550 nm and spectral indices and EWT improved slightly for both species, whereas other laser intensity features showed no improvement in the ability to explain leaf water content. This is likely to result from the fact that the samples were facing the laser scanners, resulting in low incidence angles between the samples. Also there is a minor effect of incidence angle on the measured intensity since the majority of the laser returns coincided with the leaves with incidence angles lower than 15 degrees where the effect of incidence angle is only 0%–7% according to the modeling results. The incidence angle correction results for the conifer species may be somewhat random since needles are not able to form a solid planar surface. Part of the laser light was able to penetrate through gaps between needles; thus, generating noisier point clouds than for the deciduous species.

3.3. Correlation between Calibrated Intensity and EWT after Incidence Angle Correction and the Removal of Specular Backscatter Intensity

Backscatter intensity was simulated for the TLSs to estimate the fraction of specular reflectance and to provide a more general model for predicting EWT. The removal of the specular fraction of reflectance was attempted in order to reduce between-species variation of reflectance and to obtain a more general model for predicting EWT and, thus, a better correlation between EWT and the laser intensity features. The process did not improve the results, but reduced the correlation between EWT and laser intensity features to coefficients of determination to 0.12–0.69, as shown in the last rows of Table 4. In particular, the relationship between the spectral ratios and EWT was reduced after this correction process.

3.4. The Effect of Leaf Dry Mass on Calibrated Intensity

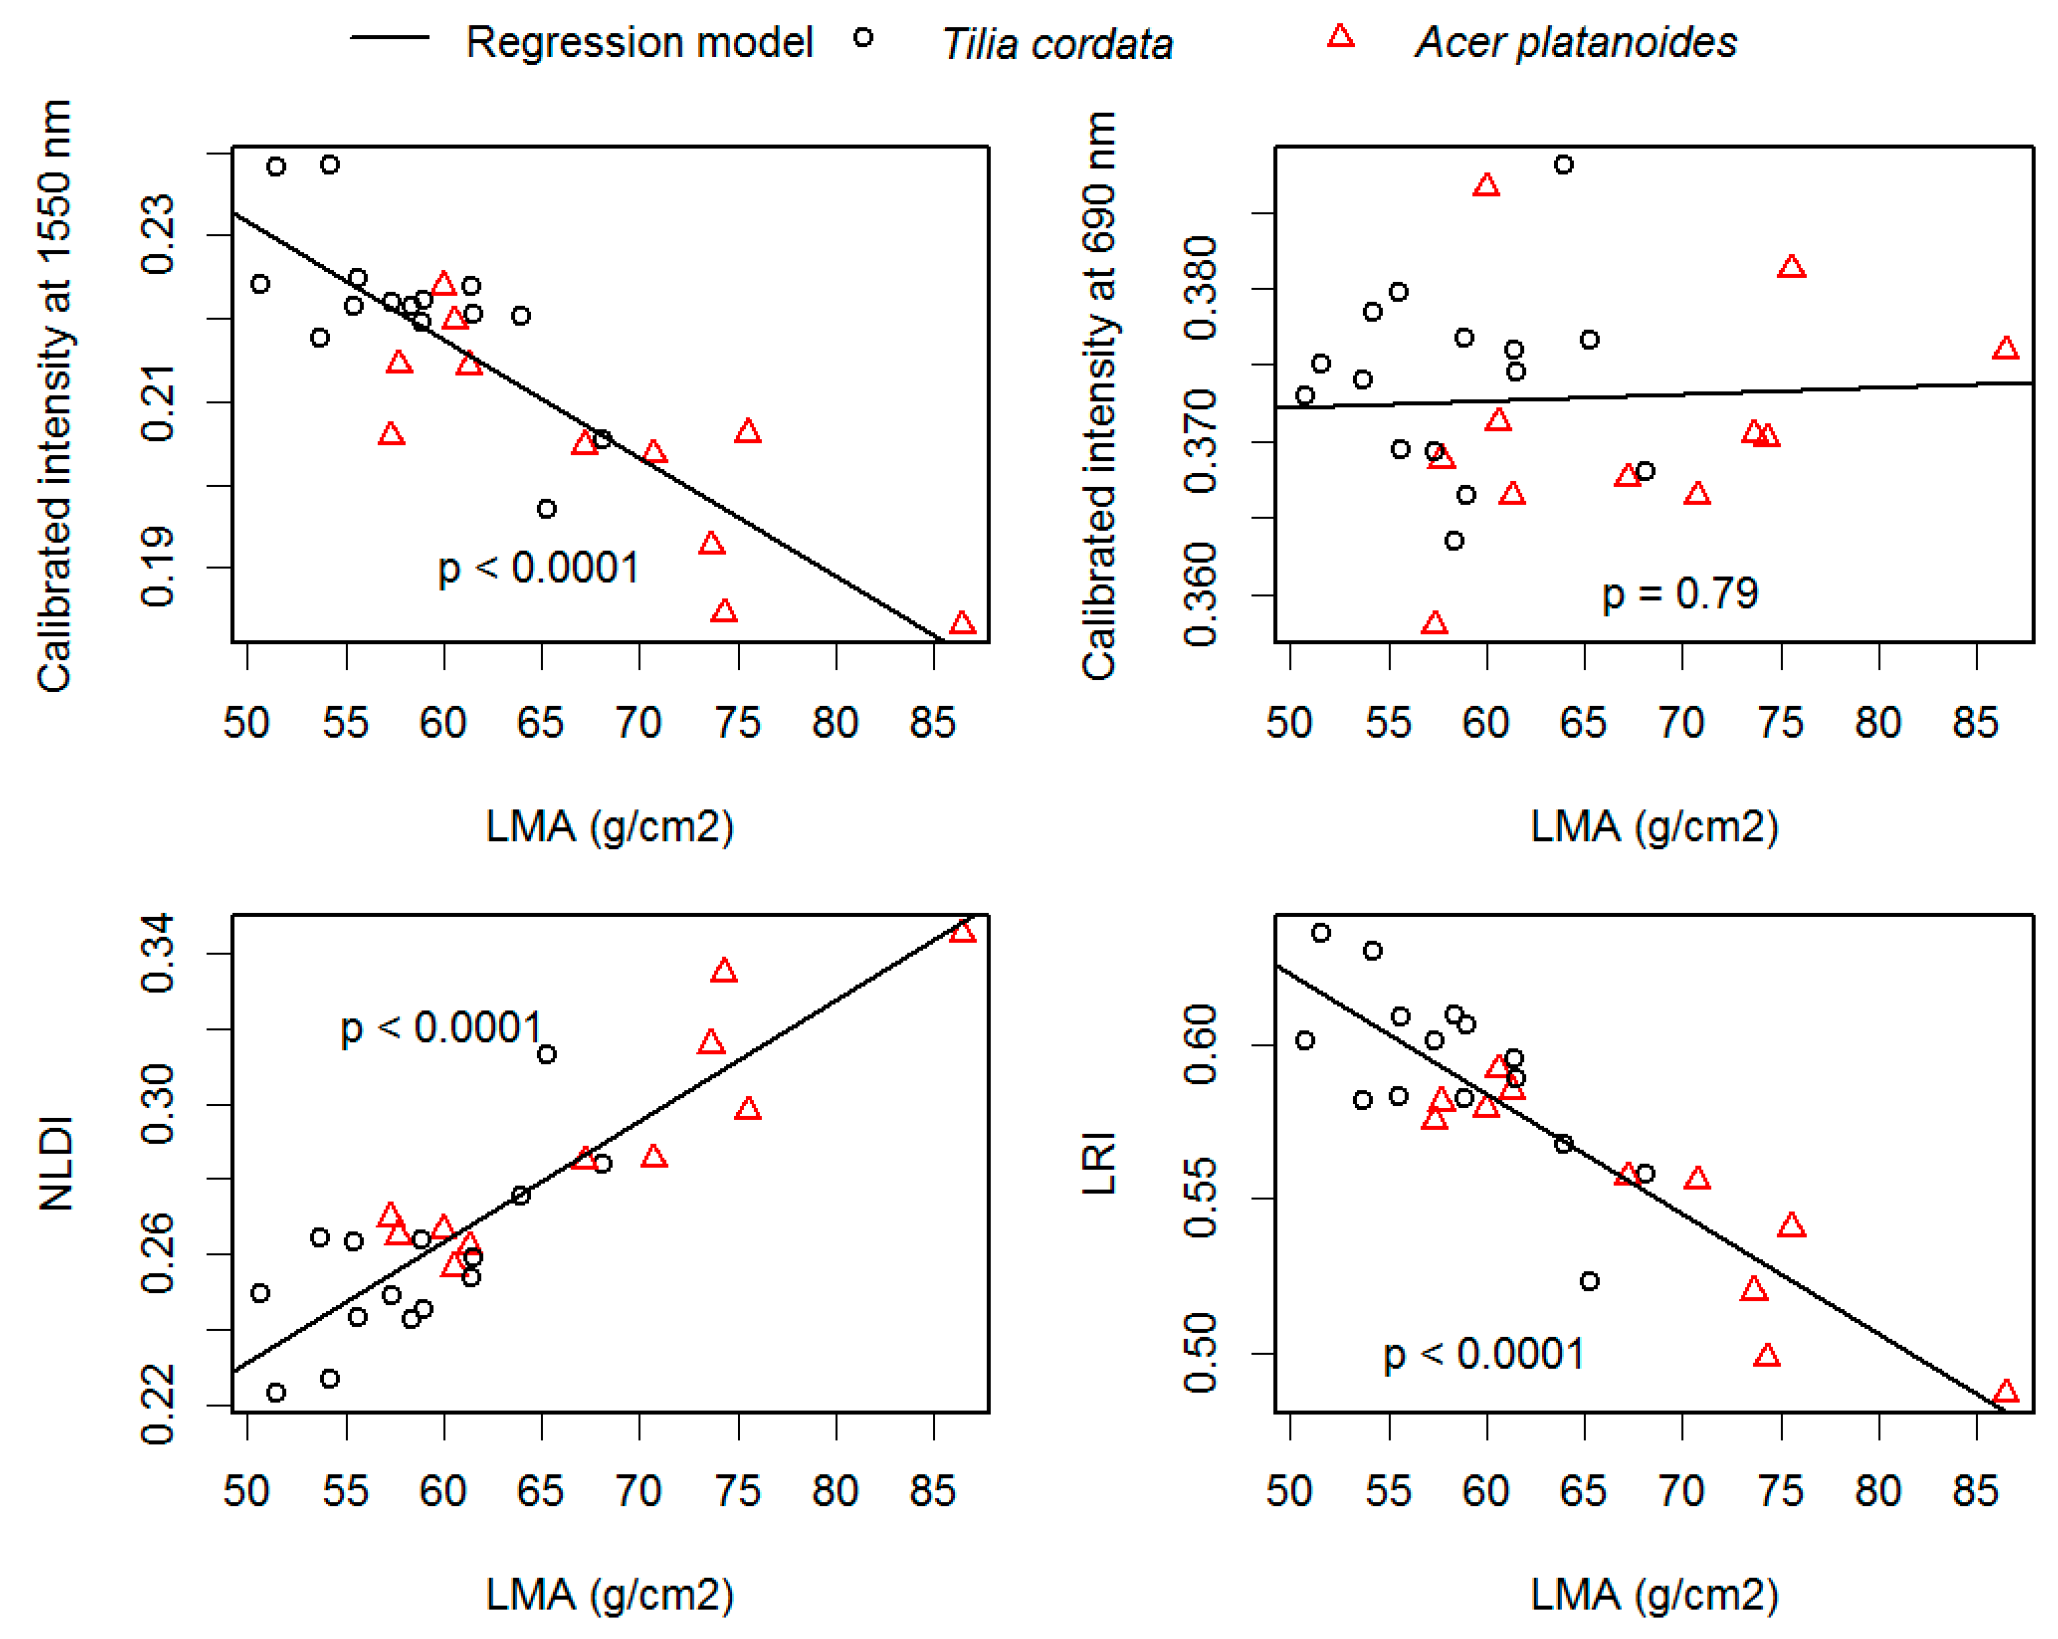
LMA was calculated for each sample to estimate its effect on the laser intensity features. The results showed that LMA had a statistically significant effect on the calibrated intensity at the 1550 nm wavelength, but no significant effect on the intensity at 690 nm (Figure 7). The spectral indices were also significantly affected by the LMA. The correlation coefficients between LMA and the spectral indices were 0.88 and −0.88 for the two groups examined (Table 5).

4. Discussion

Calibrated intensity at 1550 nm and EWT were found to be closely linked in this study, supporting the modeling results from the PROSPECT-5 model. Gaulton et al. [31] showed somewhat similar results (R2 = 0.65), with only five leaf samples employing a laser wavelength at 1545 nm. Zhu et al. [29] also presented a significant correlation (R2 = 0.74) between laser intensity at 1550 nm and EWT with a wide range of leaf structures, but there was wide variability in the correlation between the species.
The correlation of calibrated intensity at 690 nm and EWT was an unexpected outcome as the modeling results presented previously (see Figure 1) showed no changes in this part of the spectrum due to decreased EWT. This may be due to other eco-physiological changes in the leaves resulting from the drying process, which can alter, for example, the internal structure of cells, and the chlorophyll and carotenoid content of leaves [48]. Cell wall architecture of dry leaves has been studied microscopically, where they found the cell walls to contract during the dehydration process [49]. There could be a relation between the contraction of cells and backscattered reflectance if this process is modifying the interaction between the laser beam and the leaf surface. For instance, if more light energy is reflected in a mirror-like behavior instead of diffuse scattering, more of that energy should reflect back to the detector. However, with our study design we were not able to analyze whether the backscattered reflectance model is significantly altered through the drying of leaves; this requires further investigation.
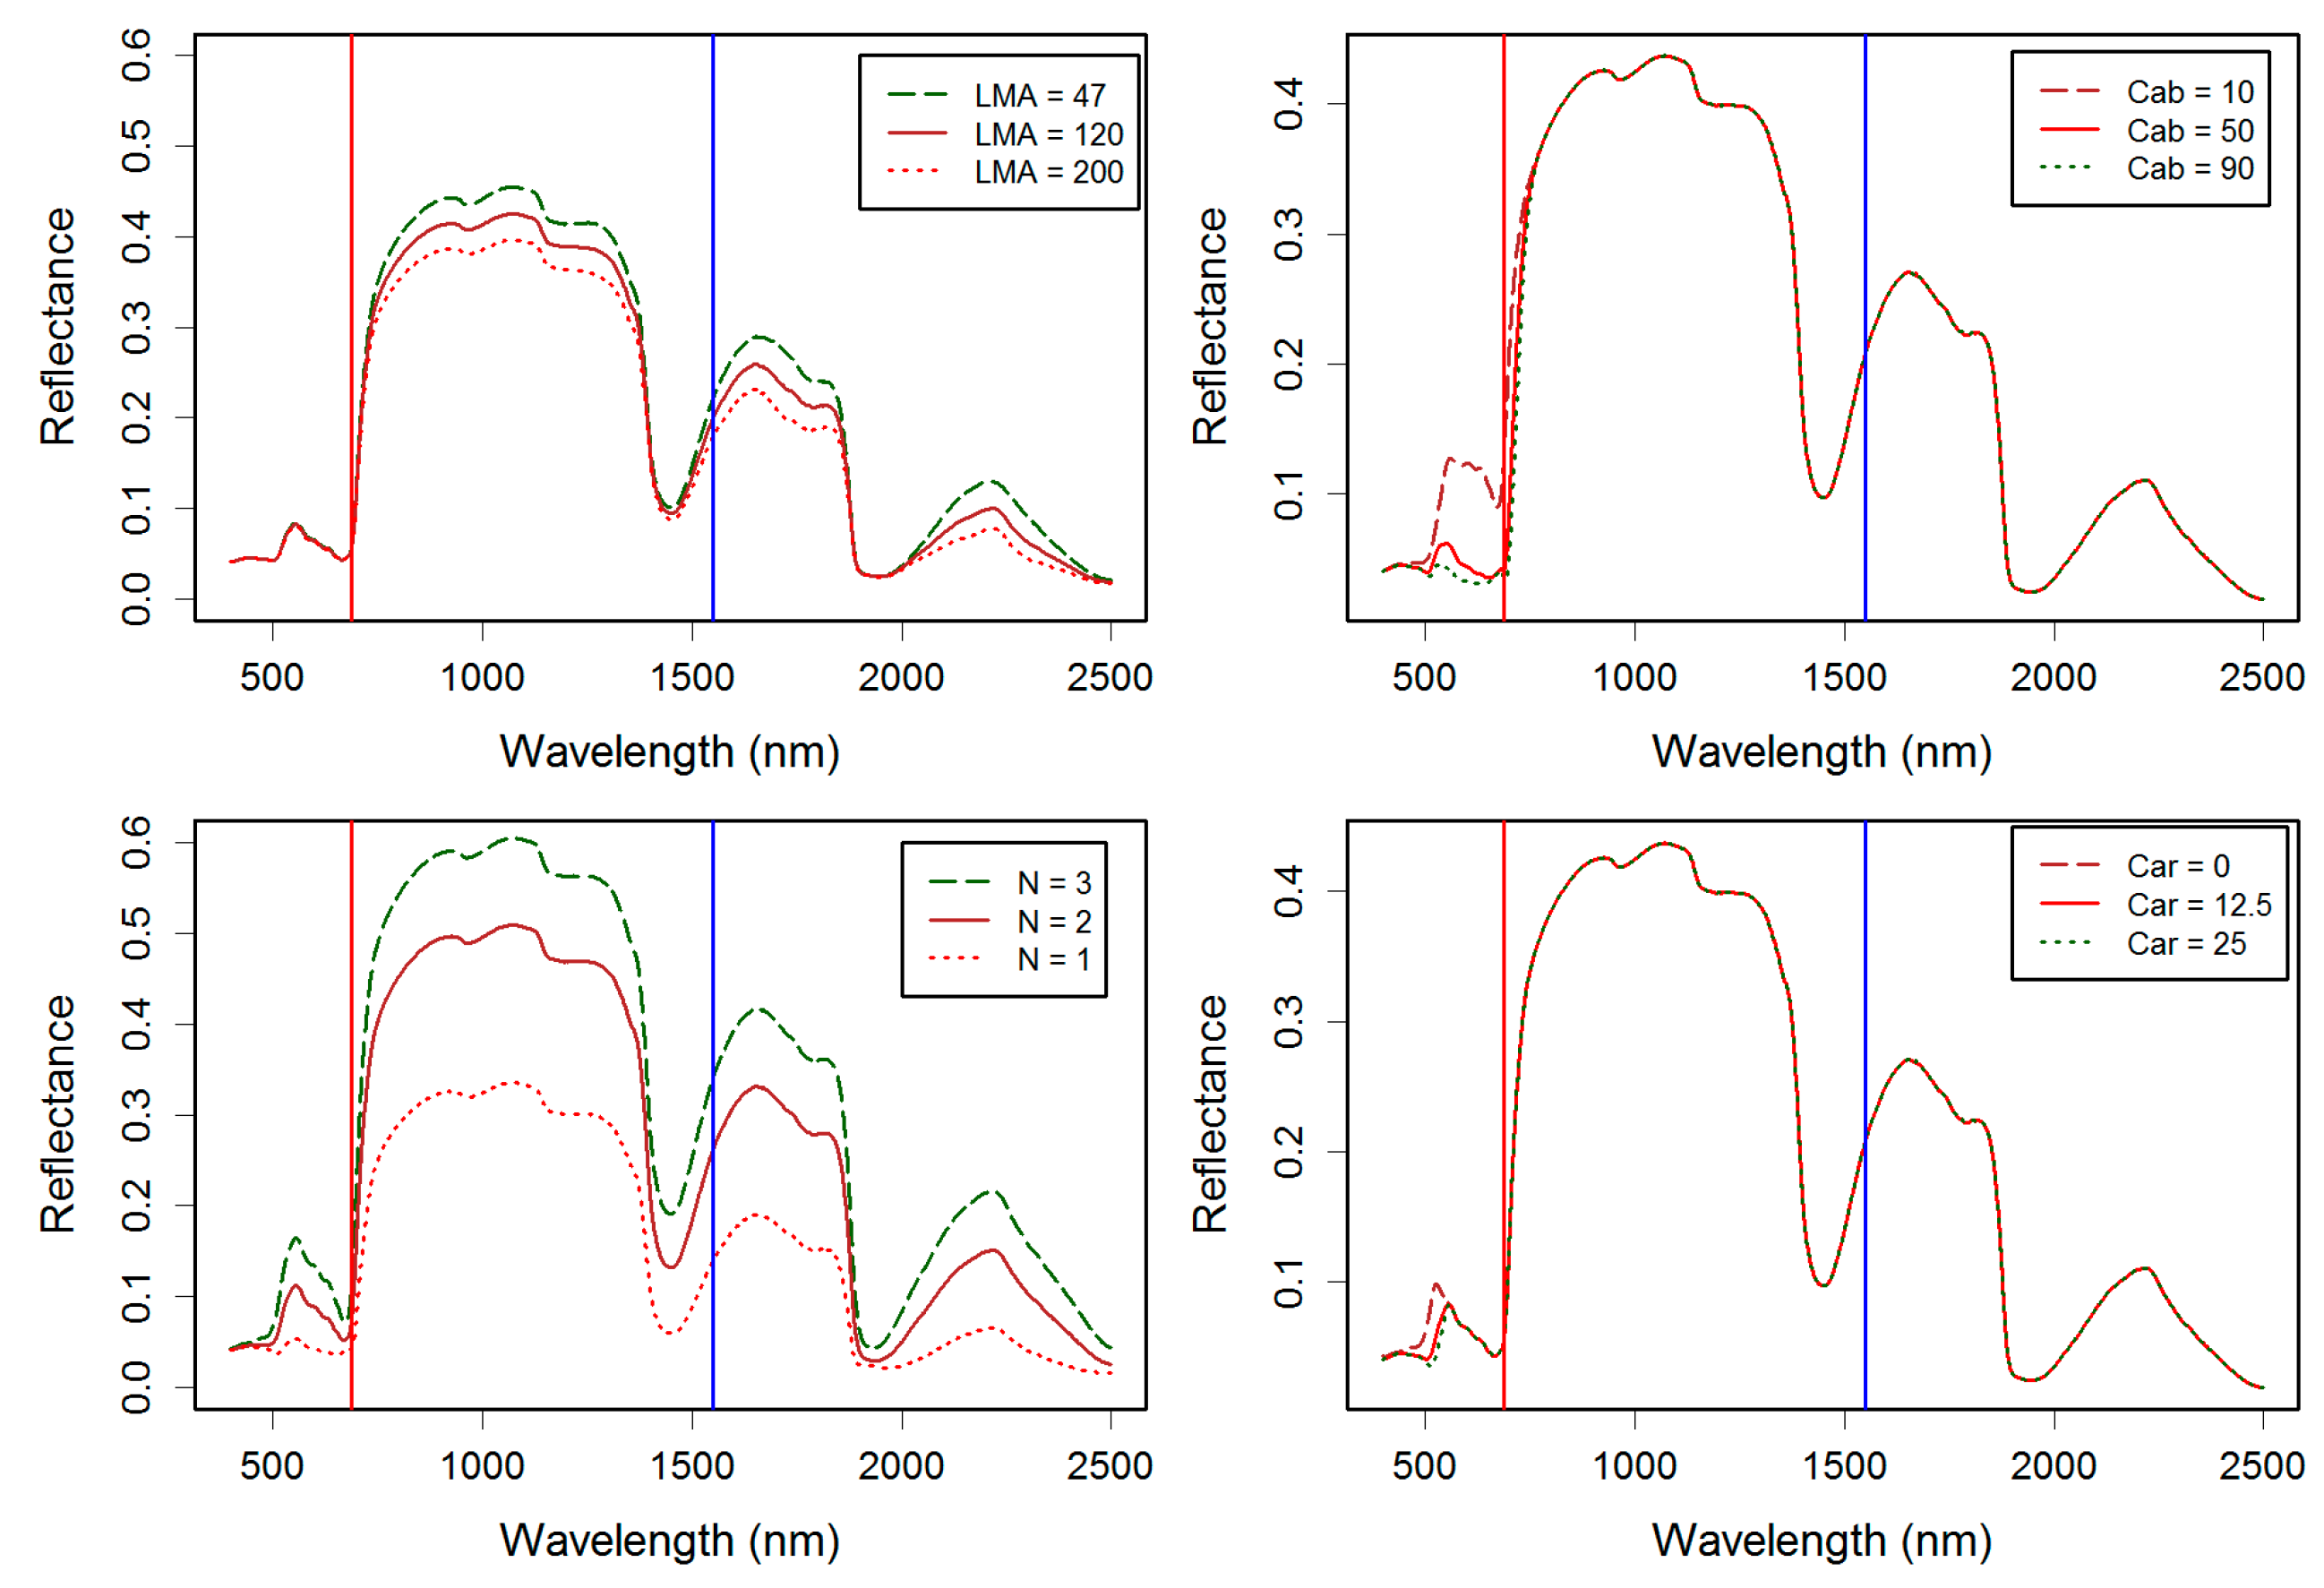
Drought stress has been shown to be related to a decreased chlorophyll content; thus, it may affect the reflectance at the 690 nm wavelength [50,51]. The effect of chlorophyll content, carotenoid content, and leaf structural parameter on leaf reflectance at the studied wavelengths was evaluated with the PROSPECT-5 model (Figure 8). The results show that the chlorophyll content and the leaves’ internal structures may affect the reflectance at 690 nm, whereas the carotenoid content and the EWT did not appear to change the reflectance at this wavelength, potentially explaining the high correlation between calibrated intensity at 690 nm and EWT in deciduous species. The differences between deciduous and conifer species at this wavelength could be derived from a different rate of change in internal structure due to drying, since conifers were shown to evaporate water more slowly, and the duration of the experiment was only 77 h. However, the wavelength at 690 nm is likely sub-optimal as a reference wavelength for normalizing the effect of different leaf structures because of the aforementioned factors, and also since it does not seem to be affected by LMA and other leaf structural effects that are affecting the 1550 nm band according to the modeling results.
The spectral indices showed strong correlations with EWT, which is in accordance with the results of Gaulton et al. [31]. The correlations of the spectral indices were significantly stronger for the conifer species compared to the calibrated intensity at 1550 nm; thus, it seems that the wavelength at 690 nm is able to partially account for leaf structural differences that complicate the use of a single wavelength for estimating EWT. A reference wavelength located around 1000 nm could be better for normalizing structural effects since the modeling results show it is more sensitive to the leaf structural parameter (Figure 8), and it is also physically closer to the 1550 nm wavelength, possibly resulting in more similar backscattering behavior. However, a comparison study of reference wavelengths should be conducted to find an optimal wavelength for normalization of leaf structural effects.
The differences in the performance of the laser intensity features in explaining EWT between conifer and deciduous species were likely due to alterations in leaf structure. The area of illumination from the laser beam was filled entirely in the case of deciduous species, as the leaves were large and flat, whereas conifer species, having needles less than 2 mm wide, could not fill the laser footprint completely as the diameter of the laser beam spot was larger than 3 mm at the target for both scanners. This resulted in different scattering geometry between the conifers and deciduous tree species. The greater performance of the spectral indices compared to single wavelength features in estimating EWT in conifer species (see Table 4) may indicate that the use of two wavelengths could partially cancel out the effect of varying incidence angle on backscattered intensity, which is one rationale for using dual-wavelength laser scanning systems for the estimation of eco-physiological parameters. However, more investigations are needed in order to validate this assumption.
The incidence angle correction did not improve the results in this study. This is likely due to the position of the leaves as they were facing the scanner, resulting in a standard deviation of 2°–4° in mean incidence angle between the samples. Thus, the micro-topography of leaves seems to have an insignificant effect on the measured intensity since no significant improvement in the developed EWT prediction models were shown. Additionally, the limitations of the ranging device should be noted since the incidence angle was approximated from the point clouds; thus, any measuring error in ranging can cause an error in the calculation of the surface normal and the resulting incidence angle. The accuracy of the ranging measurements may not be sufficient to account for small wrinkles and curvatures of leaves, but when a wider range of leaf angles and larger surfaces are present (i.e., scanning a tree), the incidence angle correction could be able to improve the estimation of EWT, as was found in Zhu et al. [29]. Also, the surface properties of the target affect the effect of incidence angle on the measured intensity, thus rough surfaces are less influenced by the incidence angle if the surface scattering is highly diffuse [20]. Since a single laser footprint illuminates several needles, which are likely pointing in different directions, resulting in a complicated measuring geometry, incidence angle correction methods are more difficult to apply for conifer species. Thus, the estimation of tree crown EWT with TLS needs to be carefully investigated for single trees with several tree species representing different leaf structures. The effect of incidence angle on different vegetation indices also seems to vary between samples and wavelength combinations in TLS measurements, which calls for rigorous experiments with multiple wavelengths and a variety of samples [22].
The removal of specular backscatter intensity did not improve the estimation of EWT over the range of species used in this study, which may be because of the ranging error discussed already. The estimation of model parameters was done using the incidence angle data obtained from ranging measurements, thus the parameters may have not been estimated correctly. Also, the visual method used for evaluating the parameters may have resulted in inaccuracies in the parameter estimation. Manual measurement of incidence angle (e.g., see [29]) may be a more accurate method to obtain the variation of laser intensity caused by changes in incidence angle, allowing the parameters of the reflectance model to be more precisely estimated. However, this part of the intensity correction may be unnecessary, as our regression models were able to estimate EWT with a coefficient of determination of 0.93 without the removal of specular backscatter intensity. The accuracy of the estimation probably depends on the collection of species investigated, as varying results have been obtained using different species [29].
The TLSs differed in their technical specifications: Leica HDS6100 had a larger laser footprint and beam divergence and a lower output power than the FARO X330, whereas FARO had a wider dynamic range in the intensity recording values. It is uncertain how much these differences affected the results. For example, the ability to penetrate tree canopies has been found to be affected by the output power of the laser scanner in airborne laser scanning [52]. Dual-wavelength TLS systems with aligned laser beams at both wavelengths would be able to reduce the effect of varying optical and technical properties of the scanning mechanism, and provide a tool for studying the utilization of multi-wavelength laser scanning data. Perfectly aligned laser beams at two wavelengths could help reduce the confounding effect of the incidence angle on backscattered intensity if both of the wavelengths respond similarly to changing incidence angle, but such a system is technically very difficult to build. Also, the effect of the range on the backscattered intensity could be reduced without a complicated calibration procedure if the same terms are met as for the incidence angle. Since it is difficult to achieve the alignment of the laser beams, an averaging approach over a larger area could be more feasible, as was done here. When measuring trees it is difficult to determine if the laser returns from both laser scanners are reflected from the exact same surface since a longer wavelength is more likely to penetrate deeper into the leaves and canopies; thus, more tests are required to investigate whether the returns are spatially significantly different between two wavelengths and scanners. However, since an averaging method is used, the use of two laser scanners at different wavelengths can be a viable option for mapping EWT despite the fact that there may be some differences in the measuring geometry. Other wavelengths should be investigated as a reference, especially near-infrared wavelengths that are closer to 1550 nm and hence may be more similar in terms of tissue and canopy penetration.
LMA was shown to have a significant effect on the laser return intensity at 1550 nm when comparing leaf samples of similar EWT. The effect partially hinders the estimation of leaf EWT but the intensity variation caused by LMA was small enough to allow a high correlation between EWT and laser return intensity at 1550 nm. The lower accuracy of the regression models between laser intensity features and EWT for the conifer species could derive at least partially from the higher deviation in LMA.
Here, the effect of range on backscattered intensity was not corrected since the samples were scanned from positions with only a small variation in distance. The measurement setting in this study is very different from a forest environment when trees and canopies are scanned; thus, the correction of range effect is necessary to obtain accurate estimates of values such as EWT using TLSs in a forest environment. Kaasalainen et al. [20] have presented correction methods for the range effect. However, it is uncertain how much varying incidence angle and range will affect the estimation of EWT at the canopy scale, and how well the correction methods will perform in a more complicated measurement environment. Future research that investigates the use of lasers at multiple wavelengths in estimation of eco-physiological parameters across different spatial scales is needed to further evaluate the suitability of multi-wavelength laser systems for conducting tree health assessments.
The investigated measurements were conducted in a laboratory where environmental variables such as temperature, humidity, wind, and illumination were fairly constant; thus, the results of this study are limited to similar conditions. In a natural environment leaves move between the consecutive scans, other parts of the canopy are observed in different angle and direction, leaf surface water may be present, and air moisture content can be high, leading to an erroneous estimation of EWT. Additionally, the leaf surface crossed by the laser beam at 690 nm and 1550 nm can be significantly different, with the 1550 nm band penetrating deeper into the canopy. All these limitations should be addressed before the investigated method can be fully applied to tree canopies in an operational context.

5. Conclusions

In this study, the suitability of using two TLSs’ laser return backscatter intensities that measure at red (690 nm) and shortwave infrared (1550 nm) wavelengths to assess EWT of individual leaves and groups of needles was tested. Specifically, leaf-level measurements were conducted to test whether laser-based spectral indices calculated from the intensity measurements could improve the ability to estimate the EWT of leaves compared to using only intensity from 1550 nm laser. The results showed that leaf EWT in deciduous tree species can be assessed at a high accuracy using intensity at 1550 nm, whereas the use of spectral indices did not improve the results for these species, and that leaf EWT in conifer species can be estimated at moderate to high accuracy using the laser-based spectral indices. It was also shown that leaf dry mass affects the laser return intensity at 1550 nm, explaining part of the variation at this wavelength. Methods for incidence angle correction and the removal of specular backscatter intensity were examined, but those methods did not improve the results, which may be due to the fact that the measurement target in this study is small (i.e., at the leaf level), the tests were conducted in a controlled environment and therefore the effects of incidence angle and specular backscatter intensity are not significant.
The results indicate that laser-based measurement methods exploiting intensity at various wavelengths have high potential in estimating the eco-physiological status of vegetation. The methods could be useful in assessing forest health condition and mapping declined trees from TLS measurements, providing more accurate data on forest health status that can be used in research such as assessing the effects of climate change on forest health and as training data for airborne or spaceborne remote sensing measurements. However, more research is needed on the canopy-level estimation of EWT and other eco-physiological parameters across different vegetation structures and spatial scales outside of the laboratory to further evaluate the suitability of TLS measurements in forest health assessments at varying scales and to outline the limitations of the method.

Acknowledgments

This work was supported by the Academy of Finland project “Centre of Excellence in Laser Scanning Research (CoE-LaSR)” under Grant 272195, and Finnish Society of Forest Science under Grant 201510040. Samuli Junttila would like to thank Jürgen Gittinger from FARO Ltd. for providing valuable information on the X330 laser scanner and Teemu Hakala for assistance.

Author Contributions

Samuli Junttila designed the experiment, conducted the statistical analysis, and wrote the manuscript. Mikko Vastaranta helped with experiment design, contributed to the data analysis, and commented on the manuscript. Xinlian Liang contributed to the design of the experiment and writing of the manuscript. Harri Kaartinen and Antero Kukko assisted with the measurement setup and provided technical support. Sanna Kaasalainen contributed to the intensity correction methods. Markus Holopainen, Hannu Hyyppä, and Juha Hyyppä arranged all the required resources, supervised the experiment, and participated in the writing of the manuscript. All authors have read and approved the final manuscript.

Conflicts of Interest

The authors declare no conflict of interest.

References

  1. Solomon, S.; Qin, D.; Manning, M.; Chen, Z.; Marquis, M.; Averyt, K.; Tignor, M.; Miller, H. Climate Change 2007: The Physical Science Basis. Contribution of Working Group I to the Fourth Assessment Report of the Intergovernmental Panel on Climate Change; Cambridge University Press: Cambridge, UK, 2007. [Google Scholar]
  2. Allen, C.D.; Macalady, A.K.; Chenchouni, H.; Bachelet, D.; McDowell, N.; Vennetier, M.; Kitzberger, T.; Rigling, A.; Breshears, D.D.; Hogg, E. A global overview of drought and heat-induced tree mortality reveals emerging climate change risks for forests. For. Ecol. Manag. 2010, 259, 660–684. [Google Scholar] [CrossRef]
  3. Dale, V.H.; Joyce, L.A.; McNulty, S.; Neilson, R.P.; Ayres, M.P.; Flannigan, M.D.; Hanson, P.J.; Irland, L.C.; Lugo, A.E.; Peterson, C.J. Climate change and forest disturbances: Climate change can affect forests by altering the frequency, intensity, duration, and timing of fire, drought, introduced species, insect and pathogen outbreaks, hurricanes, windstorms, ice storms, or landslides. Bioscience 2001, 51, 723–734. [Google Scholar] [CrossRef]
  4. Eitel, J.U.; Höfle, B.; Vierling, L.A.; Abellán, A.; Asner, G.P.; Deems, J.S.; Glennie, C.L.; Joerg, P.C.; LeWinter, A.L.; Magney, T.S. Beyond 3-d: The new spectrum of lidar applications for earth and ecological sciences. Remote Sens. Environ. 2016, 186, 372–392. [Google Scholar] [CrossRef]
  5. Hyyppä, J.; Hyyppä, H.; Leckie, D.; Gougeon, F.; Yu, X.; Maltamo, M. Review of methods of small-footprint airborne laser scanning for extracting forest inventory data in boreal forests. Int. J. Remote Sens. 2008, 29, 1339–1366. [Google Scholar] [CrossRef]
  6. Kankare, V.; Holopainen, M.; Vastaranta, M.; Puttonen, E.; Yu, X.; Hyyppä, J.; Vaaja, M.; Hyyppä, H.; Alho, P. Individual tree biomass estimation using terrestrial laser scanning. ISPRS J. Photogramm. Remote Sens. 2013, 75, 64–75. [Google Scholar] [CrossRef]
  7. Kantola, T.; Lyytikäinen-Saarenmaa, P.; Vastaranta, M.; Kankare, V.; Yu, X.; Holopainen, M.; Talvitie, M.; Solberg, S.; Puolakka, P.; Hyyppä, J. Using high density als data in plot level estimation of the defoliation by the common pine sawfly. In Procedings of the 2011 SilviLaser, Hobart, Australia, 16–20 October 2011.
  8. Douglas, E.S.; Strahler, A.; Martel, J.; Cook, T.; Mendillo, C.; Marshall, R.; Chakrabarti, S.; Schaaf, C.; Woodcock, C.; Li, Z.; et al. Dwel: A dual-wavelength echidna lidar for ground-based forest scanning. In Proceedings of the 2012 IEEE International Geoscience and Remote Sensing Symposium (IGARSS), Munich, Germany, 22–27 July 2012; pp. 4998–5001.
  9. Li, W.; Niu, Z.; Sun, G.; Gao, S.; Wu, M. Deriving backscatter reflective factors from 32-channel full-waveform lidar data for the estimation of leaf biochemical contents. Opt. Express 2016, 24, 4771–4785. [Google Scholar] [CrossRef]
  10. Vauhkonen, J.; Korpela, I.; Maltamo, M.; Tokola, T. Imputation of single-tree attributes using airborne laser scanning-based height, intensity, and alpha shape metrics. Remote Sens. Environ. 2010, 114, 1263–1276. [Google Scholar] [CrossRef]
  11. Korpela, I.; Ørka, H.O.; Maltamo, M.; Tokola, T.; Hyyppä, J. Tree species classification using airborne lidar—Effects of stand and tree parameters, downsizing of training set, intensity normalization, and sensor type. Silva Fenn. 2010, 44, 319–339. [Google Scholar] [CrossRef]
  12. Korpela, I.; Hovi, A.; Morsdorf, F. Understory trees in airborne lidar data—Selective mapping due to transmission losses and echo-triggering mechanisms. Remote Sens. Environ. 2012, 119, 92–104. [Google Scholar] [CrossRef]
  13. Béland, M.; Widlowski, J.-L.; Fournier, R.A.; Côté, J.-F.; Verstraete, M.M. Estimating leaf area distribution in savanna trees from terrestrial lidar measurements. Agric. For. Meteorol. 2011, 151, 1252–1266. [Google Scholar] [CrossRef]
  14. Lovell, J.; Jupp, D.; Newnham, G.; Culvenor, D. Measuring tree stem diameters using intensity profiles from ground-based scanning lidar from a fixed viewpoint. ISPRS J. Photogramm. Remote Sens. 2011, 66, 46–55. [Google Scholar] [CrossRef]
  15. Franceschi, M.; Teza, G.; Preto, N.; Pesci, A.; Galgaro, A.; Girardi, S. Discrimination between marls and limestones using intensity data from terrestrial laser scanner. ISPRS J. Photogramm. Remote Sens. 2009, 64, 522–528. [Google Scholar] [CrossRef]
  16. Kaasalainen, S.; Ahokas, E.; Hyyppä, J.; Suomalainen, J. Study of surface brightness from backscattered laser intensity: Calibration of laser data. Geosci. Remote Sens. Lett. 2005, 2, 255–259. [Google Scholar] [CrossRef]
  17. Eitel, J.U.; Vierling, L.A.; Long, D.S. Simultaneous measurements of plant structure and chlorophyll content in broadleaf saplings with a terrestrial laser scanner. Remote Sens. Environ. 2010, 114, 2229–2237. [Google Scholar] [CrossRef]
  18. Balduzzi, M.A.; Van der Zande, D.; Stuckens, J.; Verstraeten, W.W.; Coppin, P. The properties of terrestrial laser system intensity for measuring leaf geometries: A case study with conference pear trees (pyrus communis). Sensors 2011, 11, 1657–1681. [Google Scholar] [CrossRef] [PubMed]
  19. Kaasalainen, S.; Krooks, A.; Kukko, A.; Kaartinen, H. Radiometric calibration of terrestrial laser scanners with external reference targets. Remote Sens. 2009, 1, 144–158. [Google Scholar] [CrossRef]
  20. Kaasalainen, S.; Jaakkola, A.; Kaasalainen, M.; Krooks, A.; Kukko, A. Analysis of incidence angle and distance effects on terrestrial laser scanner intensity: Search for correction methods. Remote Sens. 2011, 3, 2207–2221. [Google Scholar] [CrossRef]
  21. Lichti, D.D. Spectral filtering and classification of terrestrial laser scanner point clouds. Photogramm. Rec. 2005, 20, 218–240. [Google Scholar] [CrossRef]
  22. Kaasalainen, S.; Nevalainen, O.; Hakala, T.; Anttila, K. Incidence angle dependency of leaf vegetation indices from hyperspectral lidar measurements. Photogramm. Fernerkund. Geoinform. 2016, 2016, 75–84. [Google Scholar] [CrossRef]
  23. Höfle, B. Radiometric correction of terrestrial lidar point cloud data for individual maize plant detection. IEEE Geosci. Remote Sens. Lett. 2014, 11, 94–98. [Google Scholar] [CrossRef]
  24. Sanchez, R.; Hall, A.; Trapani, N.; De Hunau, R.C. Effects of water stress on the chlorophyll content, nitrogen level and photosynthesis of leaves of two maize genotypes. Photosynth. Res. 1983, 4, 35–47. [Google Scholar] [CrossRef] [PubMed]
  25. Wulder, M.A.; Dymond, C.C.; White, J.C.; Leckie, D.G.; Carroll, A.L. Surveying mountain pine beetle damage of forests: A review of remote sensing opportunities. For. Ecol. Manag. 2006, 221, 27–41. [Google Scholar] [CrossRef]
  26. Skakun, R.S.; Wulder, M.A.; Franklin, S.E. Sensitivity of the thematic mapper enhanced wetness difference index to detect mountain pine beetle red-attack damage. Remote Sens. Environ. 2003, 86, 433–443. [Google Scholar] [CrossRef]
  27. Wermelinger, B. Ecology and management of the spruce bark beetle ips typographus—A review of recent research. For. Ecol. Manag. 2004, 202, 67–82. [Google Scholar] [CrossRef]
  28. Ceccato, P.; Flasse, S.; Tarantola, S.; Jacquemoud, S.; Grégoire, J.-M. Detecting vegetation leaf water content using reflectance in the optical domain. Remote Sens. Environ. 2001, 77, 22–33. [Google Scholar] [CrossRef]
  29. Zhu, X.; Wang, T.; Darvishzadeh, R.; Skidmore, A.K.; Niemann, K.O. 3d leaf water content mapping using terrestrial laser scanner backscatter intensity with radiometric correction. ISPRS J. Photogramm. Remote Sens. 2015, 110, 14–23. [Google Scholar] [CrossRef]
  30. Zhu, X.; Wang, T.; Skidmore, A.K.; Darvishzadeh, R.; Niemann, K.O.; Liu, J. Canopy leaf water content estimated using terrestrial lidar. Agric. For. Meteorol. 2017, 232, 152–162. [Google Scholar] [CrossRef]
  31. Gaulton, R.; Danson, F.; Ramirez, F.; Gunawan, O. The potential of dual-wavelength laser scanning for estimating vegetation moisture content. Remote Sens. Environ. 2013, 132, 32–39. [Google Scholar] [CrossRef]
  32. Junttila, S.; Kaasalainen, S.; Vastaranta, M.; Hakala, T.; Nevalainen, O.; Holopainen, M. Investigating bi-temporal hyperspectral lidar measurements from declined trees—Experiences from laboratory test. Remote Sens. 2015, 7, 13863–13877. [Google Scholar] [CrossRef]
  33. Eitel, J.U.; Magney, T.S.; Vierling, L.A.; Dittmar, G. Assessment of crop foliar nitrogen using a novel dual-wavelength laser system and implications for conducting laser-based plant physiology. ISPRS J. Photogramm. Remote Sens. 2014, 97, 229–240. [Google Scholar] [CrossRef]
  34. Danson, F.M.; Gaulton, R.; Armitage, R.P.; Disney, M.; Gunawan, O.; Lewis, P.; Pearson, G.; Ramirez, A.F. Developing a dual-wavelength full-waveform terrestrial laser scanner to characterize forest canopy structure. Agric. For. Meteorol. 2014, 198, 7–14. [Google Scholar] [CrossRef]
  35. Nevalainen, O.; Hakala, T.; Suomalainen, J.; Mäkipää, R.; Peltoniemi, M.; Krooks, A.; Kaasalainen, S. Fast and nondestructive method for leaf level chlorophyll estimation using hyperspectral lidar. Agric. For. Meteorol. 2014, 198, 250–258. [Google Scholar] [CrossRef]
  36. Feret, J.-B.; François, C.; Asner, G.P.; Gitelson, A.A.; Martin, R.E.; Bidel, L.P.; Ustin, S.L.; le Maire, G.; Jacquemoud, S. Prospect-4 and 5: Advances in the leaf optical properties model separating photosynthetic pigments. Remote Sens. Environ. 2008, 112, 3030–3043. [Google Scholar] [CrossRef]
  37. Cajander, A.K. Theory of forest types. Acta For. Fenn. 1926, 29, 1–108. [Google Scholar]
  38. Warren, C.; Ethier, G.; Livingston, N.; Grant, N.; Turpin, D.; Harrison, D.; Black, T. Transfer conductance in second growth Douglas-fir (Pseudotsuga menziesii (Mirb.) Franco) canopies. Plant Cell Environ. 2003, 26, 1215–1227. [Google Scholar] [CrossRef]
  39. Easlon, H.M.; Bloom, A.J. Easy leaf area: Automated digital image analysis for rapid and accurate measurement of leaf area. Appl. Plant Sci. 2014, 2. [Google Scholar] [CrossRef] [PubMed]
  40. Danson, F.; Steven, M.; Malthus, T.; Clark, J. High-spectral resolution data for determining leaf water content. Int. J. Remote Sens. 1992, 13, 461–470. [Google Scholar] [CrossRef]
  41. Kaasalainen, S.; Kukko, A.; Lindroos, T.; Litkey, P.; Kaartinen, H.; Hyyppa, J.; Ahokas, E. Brightness measurements and calibration with airborne and terrestrial laser scanners. IEEE Trans. Geosci. Remote Sens. 2008, 46, 528–534. [Google Scholar] [CrossRef]
  42. Hoffman, R.; Jain, A.K. Segmentation and classification of range images. IEEE Trans. Pattern Anal. Mach. Intell. 1987, PAMI-9, 608–620. [Google Scholar] [CrossRef]
  43. Fairbairn, M.B. Planetary photometry: The lommel-seeliger law. J. R. Astron. Soc. Can. 2005, 99, 92–93. [Google Scholar]
  44. Poullain, E.; Garestier, F.; Bretel, P.; Levoy, F. Modeling of ALS intensity behavior as a function of incidence angle for coastal zone surface study. In Proceedings of the 2012 IEEE International Geoscience and Remote Sensing Symposium (IGARSS), Munich, Germany, 22–27 July 2012; pp. 2849–2852.
  45. Beckmann, P.; Spizzichino, A. The Scattering of Electromagnetic Waves from Rough Surfaces; Artech Print on Demand: Norwood, MA, USA, 1987. [Google Scholar]
  46. Smith, R.J. Use and misuse of the reduced major axis for line-fitting. Am. J. Phys. Anthropol. 2009, 140, 476–486. [Google Scholar] [CrossRef] [PubMed]
  47. Team, R.C. R: A Language and Environment for Statistical Computing; Foundation for Statistical Computing; Erste Bank AG: Vienna, Austria, 2013. [Google Scholar]
  48. Cui, Z.-W.; Xu, S.-Y.; Sun, D.-W. Effect of microwave-vacuum drying on the carotenoids retention of carrot slices and chlorophyll retention of chinese chive leaves. Dry. Technol. 2004, 22, 563–575. [Google Scholar] [CrossRef]
  49. Vicré, M.; Sherwin, H.; Driouich, A.; Jaffer, M.; Farrant, J. Cell wall characteristics and structure of hydrated and dry leaves of the resurrection plant craterostigma wilmsii, a microscopical study. J. Plant Physiol. 1999, 155, 719–726. [Google Scholar] [CrossRef]
  50. Alberte, R.S.; Thornber, J.P.; Fiscus, E.L. Water stress effects on the content and organization of chlorophyll in mesophyll and bundle sheath chloroplasts of maize. Plant Physiol. 1977, 59, 351–353. [Google Scholar] [CrossRef] [PubMed]
  51. Zahedi, H.; Alahrnadi, S.J. Effects of drought stress on chlorophyll fluorescence parameters, chlorophyll content and grain yield of wheat cultivars. J. Biol. Sci. 2007, 7, 841–847. [Google Scholar]
  52. Chasmer, L.; Hopkinson, C.; Smith, B.; Treitz, P. Examining the influence of changing laser pulse repetition frequencies on conifer forest canopy returns. Photogramm. Eng. Remote Sens. 2006, 72, 1359–1367. [Google Scholar] [CrossRef]
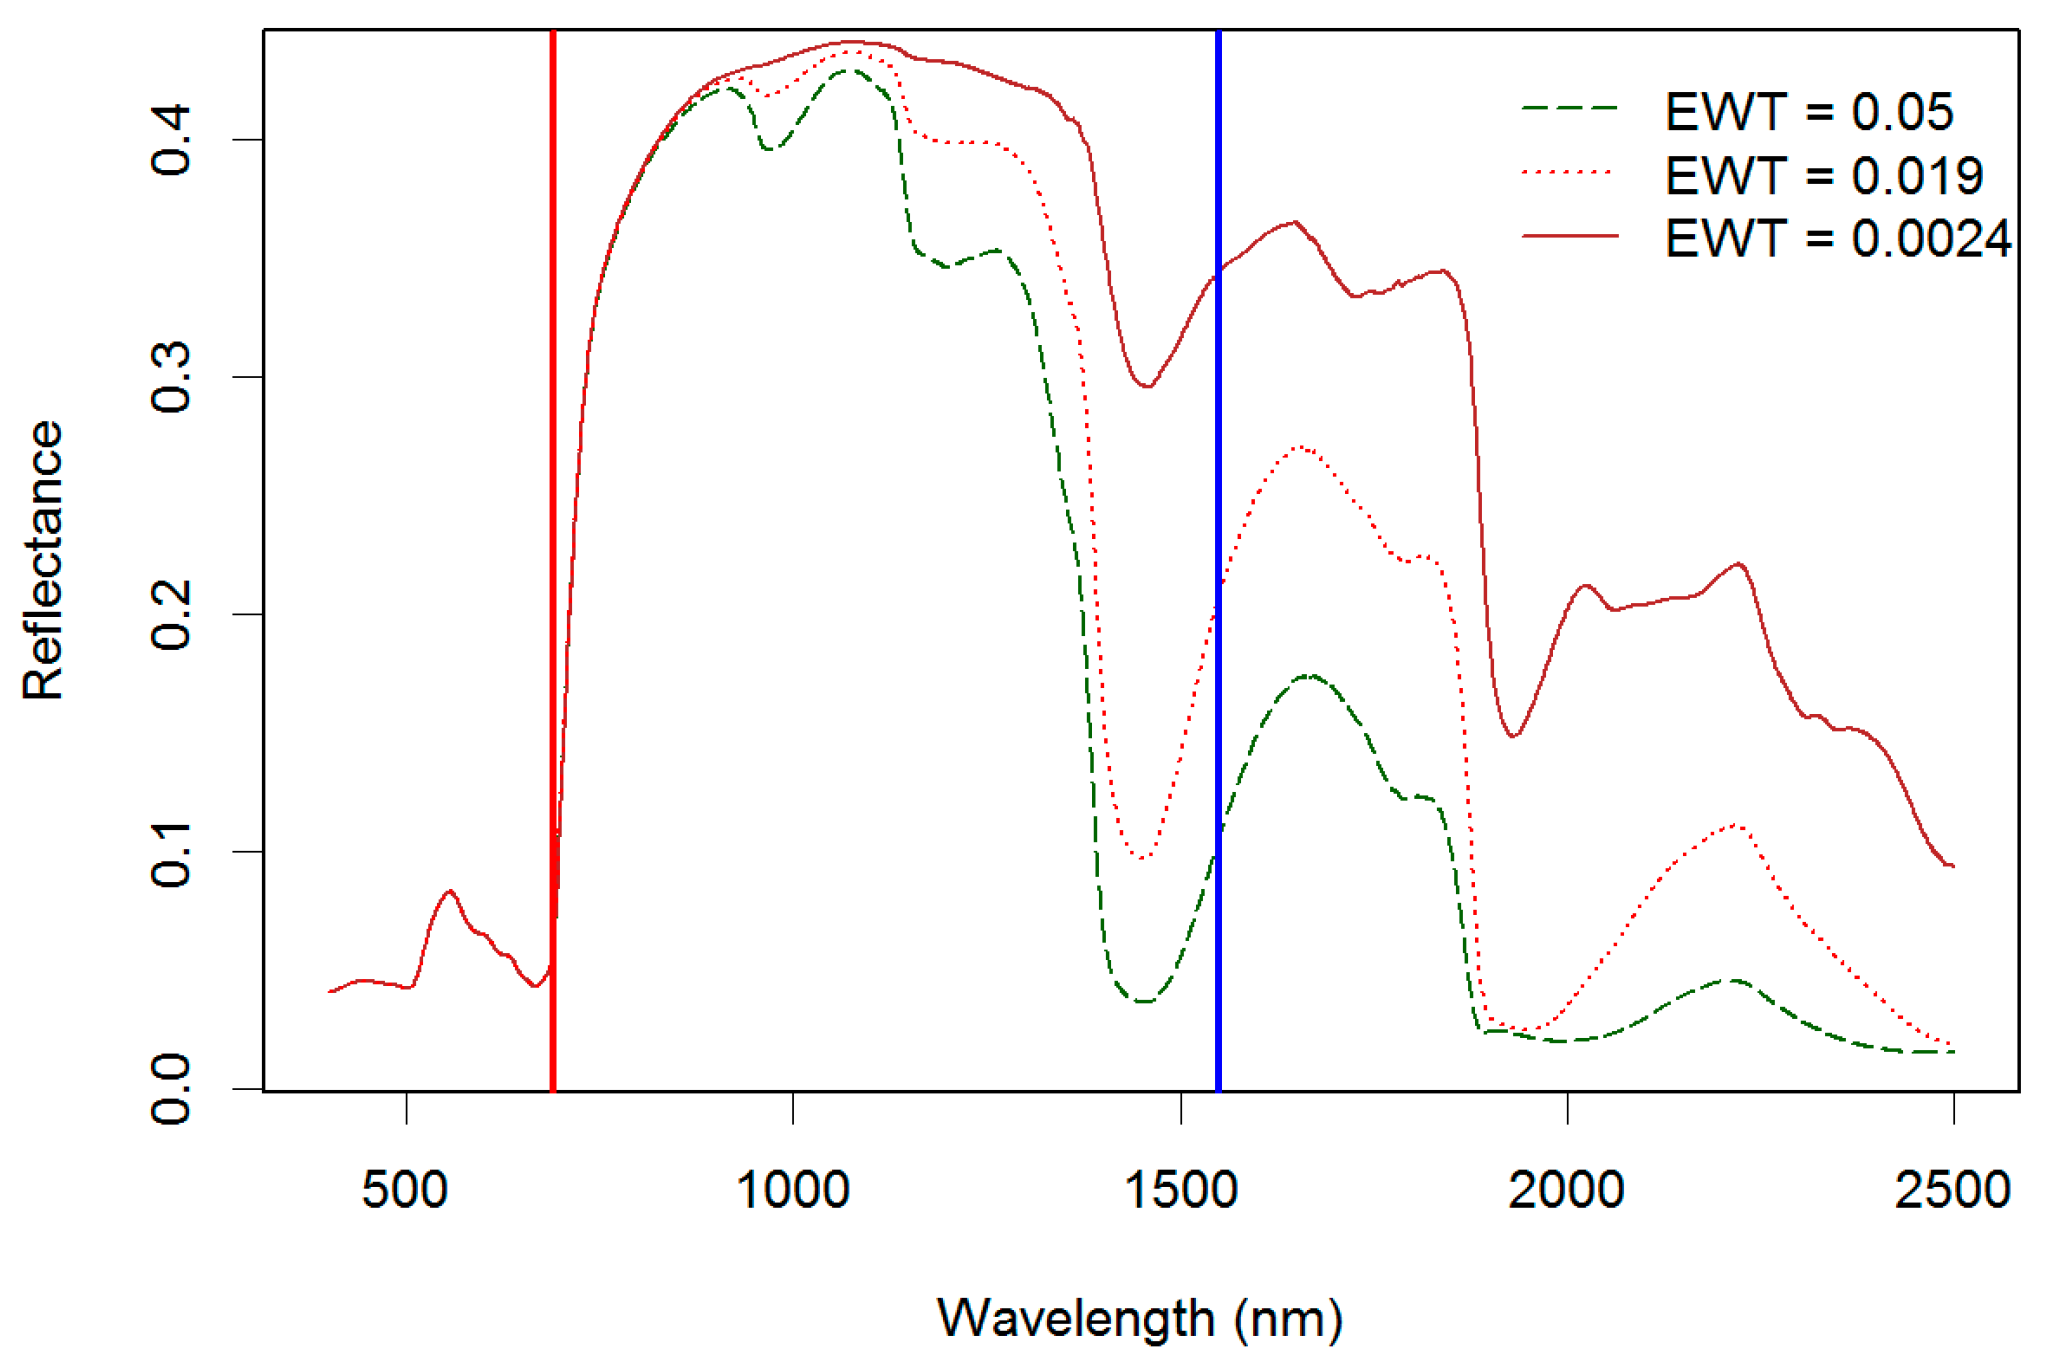
Figure 1. Leaf reflectance spectra between 400 nm and 2500 nm modeled with the PROSPECT-5 model for equivalent water thickness (EWT) ranging between 0.0024 g/cm2 and 0.05 g/cm2. The red and blue bars represent the wavelengths of 690 nm and 1550 nm where the laser scanners were used, respectively.
Remotesensing 09 00008 g001
Figure 2. The different processing workflows (WFs) of the intensity data correction. The acronyms are WF 1: Intensity calibration; WF 2: Intensity calibration & incidence angle correction; WF 3: Intensity calibration, incidence angle correction & removal of specular backscatter intensity.
Remotesensing 09 00008 g002
Figure 3. Raw intensity measurements presented against measured reflectance of the Spectralon reflectance panels (50%, 25%, 12%) with the regression models, and respective coefficient of determinations (R2) and root mean square errors (RMSE), between raw intensity (digital number, DN) and reflectance for the FARO and Leica scanners, respectively.
Remotesensing 09 00008 g003
Figure 4. A sample of Acer platanoides L. with a surface constructed from the point cloud from the FARO X330, and the points with the raw intensity values, illustrating the curvy wrinkled characteristics of a leaf surface measured with a terrestrial laser scanner.
Remotesensing 09 00008 g004
Figure 5. An example of a density scatterplot of laser returns used to estimate the model parameters for maple (n = 684,617). The density values represent a 2D kernel density estimate. Two percent of the points with the lowest kernel density were plotted (black dots). The red line represents the fitted model for incidence angle correction.
Remotesensing 09 00008 g005
Figure 6. EWT plotted against spectral indices and the reflectance at the two wavelengths (1550 nm & 690 nm) for all measured species before the incidence angle correction (n = 1180).
Remotesensing 09 00008 g006
Figure 7. Leaf mass per unit area (LMA) and laser intensity features for samples (n = 26) with EWT between 0.011 g/cm2 and 0.013g/cm2. P-value shows the significance level of the relationships between laser intensity features and LMA.
Remotesensing 09 00008 g007
Figure 8. Leaf reflectance spectra between 400 nm and 2500 nm modeled with the PROSPECT-5 model for leaf mass per unit area (LMA) ranging between 47 g/m2 and 200 g/m2, chlorophyll content (Cab) ranging between 10 µg/cm2 and 90 µg/cm2, leaf structural parameter (N) ranging between 1 and 3, and carotenoid content ranging between 0 µg/cm2 and 25 µg/cm2 based on Ceccatto et al. [28]. The red and blue bars represent the laser wavelengths of 690 nm and 1550 nm, respectively.
Remotesensing 09 00008 g008
Table 1. A summary of the statistics of equivalent water thickness (EWT; g/cm2) and leaf mass per unit area (LMA; g/cm2) of the samples from all the measurements.
Species NameMeasurementsEWTStandard Deviation of EWT (g/cm2)
Mean EWT (g/cm2)Min EWT (g/cm2)Max EWT (g/cm2)
Tilia cordata L.2480.00620.00210.01450.0084
Betula pendula L.1400.01170.00580.02320.0045
Acer platanoides L.2980.00820.00240.01470.0028
Picea abies L.2420.03640.00790.05520.0083
Pinus sylvestris L.2520.03290.01230.05270.0084
Species NameMeasurementsLMAStandard Deviation of LMA (g/m2)
Mean LMA (g/m2)Min LMA (g/m2)Max LMA (g/m2)
Tilia cordata L.24858.950.770.85.1
Betula pendula L.14094.187.9101.84.4
Acer platanoides L.29872.757.788.39.1
Picea abies L.242502.7434.8589.249.7
Pinus sylvestris L.252248.2212.1325.631.8
Table 2. Technical specifications for the terrestrial laser scanners. Ranging error is defined as the standard deviation of systematic measurement error at below 25 m.
Scanner TypeBeam Divergence (mrad)Beam Diameter at Exit (mm)Wavelength (nm)Output Power (mW)Scan Rate (kHz)Intensity Recording (DN)Ranging Error (mm)
FARO X3300.192.251550500488−2048 to 2033±2
Leica HDS61000.22369030508−1228 to 2048±2
Table 3. Parameters for the models for incidence angle correction and backscatter intensity simulation.
Model for Correcting the Incidence Angle
SpeciesFARO X330Leica HDS6100
bb
Tilia cordata L.1.780.82
Betula pendula L.2.30.71
Acer platanoides L.1.740.75
Picea abies L.0.580.25
Pinus sylvestris L.0.820.82
Model for Simulating Backscatter Intensity
SpeciesFARO X330Leica HDS6100
kdmkdm
Tilia cordata L.0.600.490.70.59
Betula pendula L.0.450.450.780.58
Acer platanoides L.0.490.550.910.55
Picea abies L.0.950.580.990.6
Pinus sylvestris L.0.990.580.990.6
Table 4. Coefficients of determination (R2) and root-mean square errors (RMSE) for the regression analyses between EWT and laser intensity features for each species separately and all species pooled together.
Calibrated Intensity
Species/Wavelength or Spectral Index1550 nm690 nmNLDILRI
Tilia cordataR20.840.830.850.86
RMSE0.00120.00130.00120.0011
Betula pendulaR20.860.820.860.86
RMSE0.00170.00190.00170.0017
Acer platanoidesR20.870.830.860.86
RMSE0.00100.00110.00100.0010
Picea abiesR20.480.010.610.56
RMSE0.00590.0110.00510.0054
Pinus sylvestrisR20.530.010.690.67
RMSE0.00510.0120.00510.0052
All speciesR20.87 a0.58 b0.93 c0.92 b
RMSE0.00540.00960.0040.0042
Incidence Angle Corrected Calibrated Intensity
Tilia cordataR20.800.820.820.84
RMSE0.00140.00130.00130.0012
Betula pendulaR20.820.790.830.84
RMSE0.00180.00190.00180.0017
Acer platanoidesR20.840.770.850.85
RMSE0.00110.00130.00110.0011
Picea abiesR20.510.010.640.59
RMSE0.00580.0110.00500.0053
Pinus sylvestrisR20.540.010.690.68
RMSE0.00620.0120.00500.0052
All speciesR20.86 a0.53 b0.92 c0.91 b
RMSE0.00550.010.00430.0046
Calibrated Intensity after Incidence Angle Correction and Removal of Specular Fraction of Backscatter Intensity
All speciesR20.690.12 b0.45 c0.36 b
RMSE0.00830.0160.0120.011
The best coefficients of determination for each species has been put in bold; a EWT variable logarithmic transformed before regression; b X and Y variables square root transformed before regression; c EWT variable square root transformed before regression.
Table 5. Pearson’s correlation coefficients for the relationship between laser intensity features and LMA in two groups of samples with similar leaf water content.
EWT (g/cm2)1550 nm690 nmNLDILRINumber of Samples
0.011–0.013−0.850.050.89−0.8826
0.013–0.015−0.87−0.500.88−0.8912