Article

The Tasks of the Crowd: A Typology of Tasks in Geographic Information Crowdsourcing and a Case Study in Humanitarian Mapping

by
João Porto de Albuquerque
1,2,3,*,
Benjamin Herfort
2 and
Melanie Eckle
2
1
Centre for Interdisciplinary Methodologies, University of Warwick, CV4 7AL Coventry, UK
2
GIScience Chair, Institute of Geography, Heidelberg University, 69120 Heidelberg, Germany
3
Department of Computer Systems, ICMC, University of São Paulo, 135566-590 São Carlos/SP, Brazil
*
Author to whom correspondence should be addressed.
Remote Sens. 2016, 8(10), 859; https://doi.org/10.3390/rs8100859
Submission received: 2 August 2016 / Revised: 8 September 2016 / Accepted: 11 October 2016 / Published: 18 October 2016
(This article belongs to the Special Issue Citizen Science and Earth Observation)

Abstract

:
In the past few years, volunteers have produced geographic information of different kinds, using a variety of different crowdsourcing platforms, within a broad range of contexts. However, there is still a lack of clarity about the specific types of tasks that volunteers can perform for deriving geographic information from remotely sensed imagery, and how the quality of the produced information can be assessed for particular task types. To fill this gap, we analyse the existing literature and propose a typology of tasks in geographic information crowdsourcing, which distinguishes between classification, digitisation and conflation tasks. We then present a case study related to the “Missing Maps” project aimed at crowdsourced classification to support humanitarian aid. We use our typology to distinguish between the different types of crowdsourced tasks in the project and choose classification tasks related to identifying roads and settlements for an evaluation of the crowdsourced classification. This evaluation shows that the volunteers achieved a satisfactory overall performance (accuracy: 89%; sensitivity: 73%; and precision: 89%). We also analyse different factors that could influence the performance, concluding that volunteers were more likely to incorrectly classify tasks with small objects. Furthermore, agreement among volunteers was shown to be a very good predictor of the reliability of crowdsourced classification: tasks with the highest agreement level were 41 times more probable to be correctly classified by volunteers. The results thus show that the crowdsourced classification of remotely sensed imagery is able to generate geographic information about human settlements with a high level of quality. This study also makes clear the different sophistication levels of tasks that can be performed by volunteers and reveals some factors that may have an impact on their performance.

Graphical Abstract

1. Introduction

The ever-growing research field of Volunteered or Crowdsourced Geographic Information encompasses several modes of production of geographic information by citizens [1]. These range from the by-products of the information exchange in common social media platforms [2] to data that is actively contributed by citizens, e.g., in platforms such as OpenStreetMap (OSM) [3]. In this paper, we are interested in such more active approaches, which are sometimes referred to as citizen science [4] and human computation [5], and have been increasingly used to mobilise the interpretive skills of citizens in a variety of application domains, including the analysis of remotely sensed imagery.
Previous studies in this field have focused on the analysis of the geographic data that is produced by citizens for different purposes [6,7,8,9]. These studies addressed important research questions as regards to the design of effective crowdsourcing approaches, such as: Are there differences in the performance of experts and non-expert volunteers [7]? How to choose the volunteers with the most appropriate skill set for particular tasks [5]? Which tasks may benefit from more specialised and trained volunteers and which tasks are suitable for a broader public [8]? What is the best strategy for merging the crowdsourced results achieved by different volunteers [10]? Since the crowdsourcing projects analysed in these studies are based on different types of tasks, which vary considerably in complexity and difficulty, it is still challenging to interpret and put together their results to compose a broader panorama.
The present paper attempts to make a contribution towards filling this gap by examining the following specific research question: RQ1—Which types of tasks can be crowdsourced for generating and validating geographic information from remotely sensed imagery? To answer this question, we review the related literature and propose a typology that consists of three types of tasks that volunteers can perform in the production and validation of geographic information using crowdsourcing: classification, digitisation, and conflation.
Building upon this typology, we are interested in examining how these different tasks are used in existing crowdsourcing projects in the domain of humanitarian aid and disaster risk management [10,11,12,13,14]. This domain is particularly interesting for crowdsourcing, since several mapping tasks that are typical in humanitarian context can only be partially automated, such as the assessment of buildings, roads, critical infrastructure, and the tracking of refugees/internally displaced persons (IDP). The difficulty in automating these tasks comes mainly from the fact that the features of interest in the humanitarian context are often small in size, heterogeneous and inconsistent [15]. In this context, this paper investigates in detail the results achieved within the “Missing Maps” project, which was recently started with the goal of preventively producing maps in OpenStreetMap for areas that are vulnerable to humanitarian crises. We analyse the results of a crowdsourced classification task aimed at detecting settlements and roads in South Kivu in the Democratic Republic of Congo, seeking to investigate the following research question: RQ2—How well can crowdsourced classification generate information from satellite imagery and what are the factors that influence the performance of crowdsourcing?
The remainder of this paper is organised as follows. The next section presents the basis for this research, summarising the existing literature and proposing the typology of tasks in geographic information crowdsourcing. Section 3 thus presents the case setting, data sets and methodology used for analysing the Missing Maps project, whilst Section 4 presents the results achieved from this analysis. Section 5 provides a discussion of the results and Section 6 concludes this paper and makes recommendations for future research.

2. Background: Typology of Tasks in Geographic Information Crowdsourcing

In reviewing the literature on geographic information crowdsourcing, we are interested in analysing existing approaches as regards to the type of tasks that they propose to volunteers to derive geographic information. Volunteers can use their spatial cognitive skills to perform tasks with varying levels of sophistication and complexity, and to recognise this, we propose to distinguish between three types of crowdsourced tasks: classification, digitisation and conflation. An overview of these types is presented in Table 1 and the next sections describe each of them in detail.

2.1. Classification

The first type of analytical tasks that volunteers can perform is related to the use of their interpretive skills and background knowledge to classify an existing piece of geographic information. In the case of airborne imagery, this usually consists of a specific part of an image for which its geographical reference and extent is known, but it could also be any other type of geographic information such as a georeferenced social media message. In a classification task, the volunteer recognises features/objects in an existing piece of geographic information and then enriches this by adding an extra attribute that represents a value or category. This additional attribute is often referred to as a “property”, “label” or “tag”. One of the most widely used practical platforms for crowdsourced classification is the Tomnod platform illustrated in Figure 1.
In the humanitarian context, several past projects relied upon crowdsourced classification tasks. Chan et al. [16] analysed crowdsourced classification of damage assessment in the aftermath of the hurricane Sandy hitting the US east coast in 2012. Non-expert volunteers were asked to evaluate the level of damage present in aerial images captured after the hurricane hit the coastline. A more recent example is the MicroMappers crowdsourcing platform, with which volunteers can support disaster management by reading and labelling tweets. Imran et al. [18] used this tool to classify social media messages. The crowdsourced classifications obtained were, in turn, used to train supervised classifiers that are applied to the stream of new of social media messages. A similar approach that combines automated and human classification is pursued by Ostermann [19].
Classification is the task type with the lowest level of spatial cognitive complexity in our typology since it usually consists of analysing a single information source and selecting one category/label out of a small number of options. For this reason, classification tasks have the potential to be distributed to a large number of volunteers, since they tend to not require much previous experience or dedicated time to complete each task. However, even if the spatial cognitive complexity of classification tasks is the lower in our typology (i.e., it does not require too much spatial thinking and familiarity with spatial tools), the interpretation of the contents of an image may pose varying levels of difficulty, depending on the phenomenon to be identified and on the image type. For instance, the classification of the damage level of buildings based on a remotely sensed imagery after an earthquake can be a challenging task even for remote sensing experts [10], and this is also true for images acquired on the ground [27]. In consonance with these studies, an initiative to assess the classifications of building damage performed based on satellite imagery after the Typhoon Haiyan in the Philippines also revealed low accuracy levels in comparison with data from field assessments [11].

2.2. Digitisation

Type II of our proposed classification (digitisation) consists of creating new digital geographic objects based on existing geographic information. In a digitisation task, a volunteer also starts with the recognition of a real-world object/feature in an existing piece of information, but then goes further to produce a corresponding digital representation (i.e., usually a vectorial geographic object). This representation should include both a geometry (which can be a point, lines or area) and a location (which is usually defined relatively to the existing geographic information). In this manner, digitisation tasks are analogous to the automated object-based analysis methods in the field of remote sensing “which aim to delineate readily usable objects from imagery” [28].
OpenStreetMap (OSM) is certainly the most important project to rely upon crowdsourced digitisation of geographic information, and this has been increasingly performed based on remotely sensed imagery. Particularly in the humanitarian context, satellite providers (e.g., through the International Charter on Space and Major Disasters) have provided high-resolution remotely sensed imagery for a worldwide volunteer community to map disaster-affected areas. After the 2010 Haiti earthquake, for instance, crowdsourced digitisation of roads and building footprints based on satellite imagery was performed and later used for the rapid analysis of the damage caused by the earthquake [21]. After his, the Humanitarian OpenStreetMap Team (HOT) was created and has organised several similar efforts to crowdsource the digitisation of geographic features after disasters using a dedicated coordination tool (Figure 2).
In research, several works have analysed crowdsourcing digitisation of geographic information. Hillen and Höfle [9] present a crowdsourcing approach to digitising buildings from earth observation data incorporating the reCAPTCHA concept. The ForestWatcher citizen science project asked volunteers to draw polygons for regions that show deforestation [22].
In comparison with tasks of Type I, digitisation tasks require more advanced spatial cognitive skills from volunteers, and can be favoured by previous experience and knowledge with remote sensing and digital mapping tools or GIS software. However, the difficulty to accomplish digitisation tasks may considerably vary depending on the geometry of the objects to be digitised (e.g., digitising points is certainly easier in comparison with lines or polygons) and the difficulty involved in the interpretation of the existing information.

2.3. Conflation

Conflation is proposed here as a third task type of geographic information crowdsourcing, based on the common use of this word in the geospatial domain ([30,31]) to indicate “the process of combining geographic information from overlapping sources so as to retain accurate data, minimize redundancy, and reconcile data conflicts” [32]. This process is also related to the terms spatial data integration [33] and data fusion [34]. Here we adopt the term “conflation” because it seems to be the most general and closely connected to geographic features, thus being capable of encompassing the multifarious tasks that volunteers can perform. Conflation thus requires that volunteers interpret more than one source of geographic information, identify matching objects/features and bring them in relation to producing new geographic information [31]. In this manner, conflation tasks can be composed of subtasks that involve classification (e.g., updating an existing geographic object based on the conflated information) and digitisation (e.g., creation of new geographic object based on the conflated information). Automated conflation methods have been developed [35], but they are usually dependent on the context and the data sources to be conflated.
In practical projects, conflation tasks are often performed by GIS professionals and researchers and is also common practice in specific GIScience and remote sensing studies (e.g., [36]). In addition, in the OpenStreetMap community, volunteers with more advanced skills use GIS-like tools (such as the JOSM editor) to display geographic information in several layers and conflate them into consistent objects in the OSM database. However, only a few studies have focused on proposing tasks for volunteers that involve the conflation of several geographic information sources. We found only two examples in the literature. The Geo-Wiki platform [25] is a first example, in which citizens are able to visualise data from different land cover datasets which are conflated with geo-tagged pictures in order to determine which land cover type is found on the ground. Anhorn, Herfort and Albuquerque [23] present an attempt to design crowdsourcing conflation tasks using the open-sourced crowdsourcing platform PyBossa (Figure 3). By simultaneously presenting satellite imagery from two different timestamps, volunteers could compare them to detect changes (e.g., temporary shelters that were not used anymore). This task is clearly related to automated change detection algorithms in the field of remote sensing (e.g., [37]).
Conflation tasks have the highest spatial cognitive complexity in our typology, thus requiring more advanced knowledge and skills. Indeed, since conflation is performed based on the contents of several information sources, it normally requires wider contextual knowledge. Hence, due to this high complexity, this is the task type for which volunteers can potentially make the highest use of their interpretive skills and background knowledge and thus perform better than automated methods. The conflation of crowdsourced geographic information with other sources has been also mentioned as one of the most promising avenues for future research in this area [1].
Particularly in the humanitarian context, on-the-ground teams usually generate information using different devices, tools, which is recorded in different data formats. For instance, the American Red Cross uses Field Papers, phones, large-format printed maps and GPS devices in their field-mapping campaigns [38]. In contrast, crowdsourcing efforts in the aftermath of disasters, such as those of the Humanitarian OpenStreetMap Team described above, are usually based exclusively on remotely sensed imagery. Thus, including crowdsourcing tasks to conflate geographic information collected on-the-ground with remotely sensed imagery could be highly beneficial in this context.

3. Case Study for Missing Maps South Kivu and Methodology

In order to analyse the practical use of crowdsourced geographic classification, we conduct a case study in the field of humanitarian aid and disaster risk reduction: the Missing Maps project. The next section presents an overview of the project and the remainder of this section outlines the methodology used in the analysis of the case.

3.1. Case Setting and Crowdsourcing Tasks

Missing Maps (MM) is a humanitarian project founded in November 2014 by the American Red Cross, British Red Cross, Humanitarian OpenStreetMap Team and Doctors Without Borders. The goal of the project is “to map the most vulnerable places in the world” [39] using OpenStreetMap, with the goal of enabling local development, facilitating humanitarian aid and reducing the risk of disasters. Herein we focus on the subproject “Map South Kivu”, which was started 1 June 2015 with the goal of creating base map information of the regions of South Kivu in the Democratic Republic of Congo. Many of the official sources of geographic information for this region are out-dated or contain insufficient detail to quantify rural settlement patterns and thus accurately measure population concentration and accessibility [40].
Using our typology of tasks explained in the previous section, we analysed the several tasks undertook by volunteers in the Map South Kivu project (Table 2). The first crowdsourcing tasks of this project are based on the crowdsourced classification of satellite imagery from Bing maps with the pybossa tool and are related to two problems faced in this context. First, for some areas in South Kivu, there was no aerial imagery coverage, or dense clouds hide the ground’s surface. Thus, in the first task (1.1 in Table 2), volunteers analysed tiles from satellite imagery in the area and indicated whether they contained useful information. The second problem was related to the fact that land use and distribution of human settlements are heterogeneous, i.e., there are large areas covered with dense forest, among which a few villages and settlements appear. In order to tackle this, the second classification task (1.2 in Table 2) was built based on the areas identified in the previous task, asking volunteers to check whether these areas depicted inhabited areas—and thus were worth pursuing further mapping efforts.
The second type of tasks comprises digitisation of roads and residential areas (task 2.1 in Table 2) and later the digitisation of building footprints (task 2.2), both based on the areas identified in the previous classification tasks (task 1.2). These tasks were presented to volunteers in the HOT Tasking Manager [29] and employed the common procedures for mapping and validation of the OpenStreetMap community described above (Section 2.2), which were already explored in previous work [41,42].
The last group of crowdsourcing tasks in the project (tasks 2.3, 2.4 and 2.5 in Table 2) consists of conflation tasks, which are generally undertaken by experienced mappers of the OSM community. They used data from different sources, such as data collected in situ from field, GPS tracks or other sources. They conflate these additional information sources to enrich the OSM data created by digitisation tasks of volunteers and include further attributes that cannot be derived from remotely sensed imagery. These attributes contain more precise information about local object names (e.g., village names), relevant building usage (e.g., hospitals and schools), or the capacity and status of roads. These tasks are performed manually using tools such as the JOSM editor, and currently do not rely upon crowdsourcing supporting tools to distribute the work for volunteers.
Our proposed typology is thus able to make clear the different tasks undertook by volunteers in the Mapping South Kivu project. The tasks build upon each other, with classification tasks building the basis for the further mapping efforts in digitisation and conflation tasks. Hence, the accuracy of the crowdsourced geographic information classification has a crucial role in the project. In our case study, we, therefore, aim at analysing how well the information on the existence of roads, buildings and settlements can be generated from satellite imagery using a crowdsourced classification approach. Furthermore, we investigate which factors may influence the performance of crowdsourced classifications in this case. The next sections thus present the datasets and the methodology used in the case study.

3.2. Methodology

Figure 4 depicts the workflow used to produce and analyse the crowdsourced classifications. This workflow is divided into three main parts: (1) pre-processing; (2) crowdsourcing; and (3) analysis. After a description of the datasets used, each of these parts is explained in detail.

3.2.1. Datasets

Bing satellite imagery was the basis for the crowdsourced classification in this case. From 2010, the Bing Maps platform allows the OpenStreetMap community to use its satellite imagery for mapping via the Bing API. The Bing satellite imagery used in this study was captured between 21 January 2010 and 17 June 2014. Using a tool we implemented based on the Pybossa platform, volunteers could view the imagery at various zoom levels.
Another input dataset that was integrated into our methodology contained the polygons that defined the area of interest. In this case study, we use the extent of the HOT Tasking Manager Project #1088 as the area of interest. Areas within the region without aerial imagery coverage or dense cloud coverage that hides the ground’s surface (identified in the previous classification task) were excluded from this case study.
While other studies use rather small datasets to validate crowdsourcing results, we perform our validation using a reference dataset for a large area, the OpenStreetMap data covering the overall task. These data were downloaded from Geofabrik [43]. The OpenStreetMap used here as a reference was produced and validated within the Missing Maps project (tasks 2.1 and 2.2 in Table 2). These mapping tasks focused explicitly on roads and land use features. Throughout the mapping process, the information has been validated by experienced OSM mappers. Therefore, we assume this dataset to be accurate regarding human settlements and roads that are the focus of the crowdsourced classification.

3.2.2. Pre-Processing

In the first step, we generated tasks using satellite imagery and the areas of interest. The area of interest is gridded into many equal-sized rectangular polygons. Therefore, each task comprises of a polygon geometry (squares) and geographically associated satellite imagery tiles that are obtained from Bing Maps. The size of these polygons is defined by the width and height of the user interface and the chosen default zoom level of the application. In this case study, the area of interest was divided into 8291 grid polygons covering an area of 0.5 km2 each that altogether lead to a coverage area of 4145.5 km2.
During pre-processing, we also generate a reference data set that is used for the classification evaluation. Therefore, we selected all roads, buildings and settlements from the OpenStreetMap (OSM) dataset. In this study, we consider roads to be those line features in the OSM database that are tagged using the key “highway”, as this key was proposed for tagging all roads. Buildings polygons are extracted using the key “building”. Settlements are polygon features that are described with the key “landuse” and the value “residential” within the OSM database.
Based on this information, we calculated the reference dataset. We assigned “yes” to all grid polygons that intersect with at least one road, building or settlement in the OSM database. Conversely, all grid polygons that do not intersect roads, buildings and settlement objects are labelled with “no”.

3.2.3. Crowdsourcing

The crowdsourcing task was developed using the PyBossa framework. For our case study, volunteers were asked whether they can see settlements or roads in the satellite imagery. Figure 5 depicts the interface implemented. Each task was assessed by four different volunteers. The single classification result comprises of information about the task id, task geometry and user classification (“yes” or “no”). Additional information on username and timestamp were also captured.

3.2.4. Analysis: Overall Performance Evaluation

For the analysis, we first compute the aggregated answer for each task. As presented in Table 3 there are several methods for doing this regarding our task design. In this study, we adopt the method (3) “majority, tie is yes” as our aggregation criteria. Thus, we consider the aggregated answer to be “yes” if at least the half of the volunteers choose “yes” and the aggregated answer is “no” if more than the half of the volunteers choose “no”.
In the sequence, the aggregated classification results are grouped into correct ones (true positives and true negatives) and incorrect ones (false positives and false negatives) in comparison with the reference dataset (Table 4). “True positives” (tp) are features where the aggregated classification result and the reference dataset agree on the existence of roads, buildings or settlements, whilst “true negatives” (tn) are features where both datasets agree that there are no roads, buildings and/or settlements. Features present in the reference dataset but not in the aggregated classification result are regarded as “false negatives” (fn); “false positives” (fp) are features that are indicated as such in the aggregated classification result, but not in the reference dataset.
Based on the aggregated results, the performance of the crowdsourced classification is analysed using the following usual metrics in information retrieval, as given by Equations (1)–(4).
  • Accuracy:
    t p + t n t p + t n + f p + f n
  • Sensitivity:
    t p t p + f n
  • Precision:
    t p t p + f p
  • F1 Score:
    2 tp 2 t p + f p + f n
Furthermore, we calculated the agreement level among volunteers as the proportion of agreeing pairs of classifications out of all the possible pairs of assignments, following Fleiss [44]. This is calculated using Equation (5), where n is the number of ratings per subject (i.e., a tile in our case), k is the number of categories into which assignments are made (two in our case), and nij is the number of raters which assigned the i-th subject to the j-th category.
P i = 1 n ( n 1 ) J = 1 k n i j 2 n i j

3.2.5. Analysis of Geographic Factors Influencing Crowdsourced Classification Performance

In order to quantify the factors that influence the performance of crowdsourced classification, we first analysed the number of incorrect classifications per task, which can be seen as a measure of the level of difficulty of a task. Afterwards, we investigated the influence of different geographic features on the classification performance (Table 5), beginning by the length of roads and the area of settlements. We calculated the length of roads and area of settlements based on the corresponding OSM objects of the reference dataset contained in each square of our analysed case.
The analysis is guided by the hypothesis that it is easier to classify those features correct that are larger or longer. Correct classifications or easier tasks should, therefore, correspond to longer roads and larger settlements within a square. We compare the spatial distribution of wrong classifications, roads and settlements and statistical distributions of road length and settlement area for correctly and incorrectly classified tests using violin plots (which combine a box plot with a density chart). In order to test statistical significance, we conduct Wilcoxon–Mann–Whitney test to analyse whether the results show significance for the aggregated classification results.
Thus, we conducted a qualitative analysis of common classification errors associated with these two geographic features with the goal of identifying examples and potential sources of errors. One of the identified factors is the presence of waterways since they can be easily mistaken for roads. We thus investigate the association between the presence of waterways and incorrect classifications first by contrastively comparing their spatial distributions in maps and later by testing the significance of association using the chi-square independence test.

3.2.6. Predictive Analysis of Crowdsourced Classification Results

After the exploratory analysis, to determine how well the analysed factors of Table 5 (road length, settlement area, waterway, and agreement) were able to predict a correct crowdsourced classification, we fitted a logistic regression model as in Equation (6).
L o g i t ( P i ) = a + b R i +   c S i + d A i +   e W i + f O i
Notice that the area variable was square rooted to linearise it in relation to road length. Furthermore, the existence of waterways functions as a categorical (“dummy”) variable that separates the function into two simultaneous models. Analogously, the variable O was introduced as a binary factor to control for the existence of objects in a tile.

4. Results

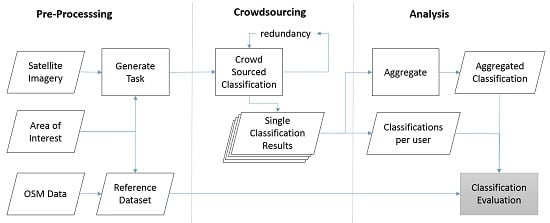
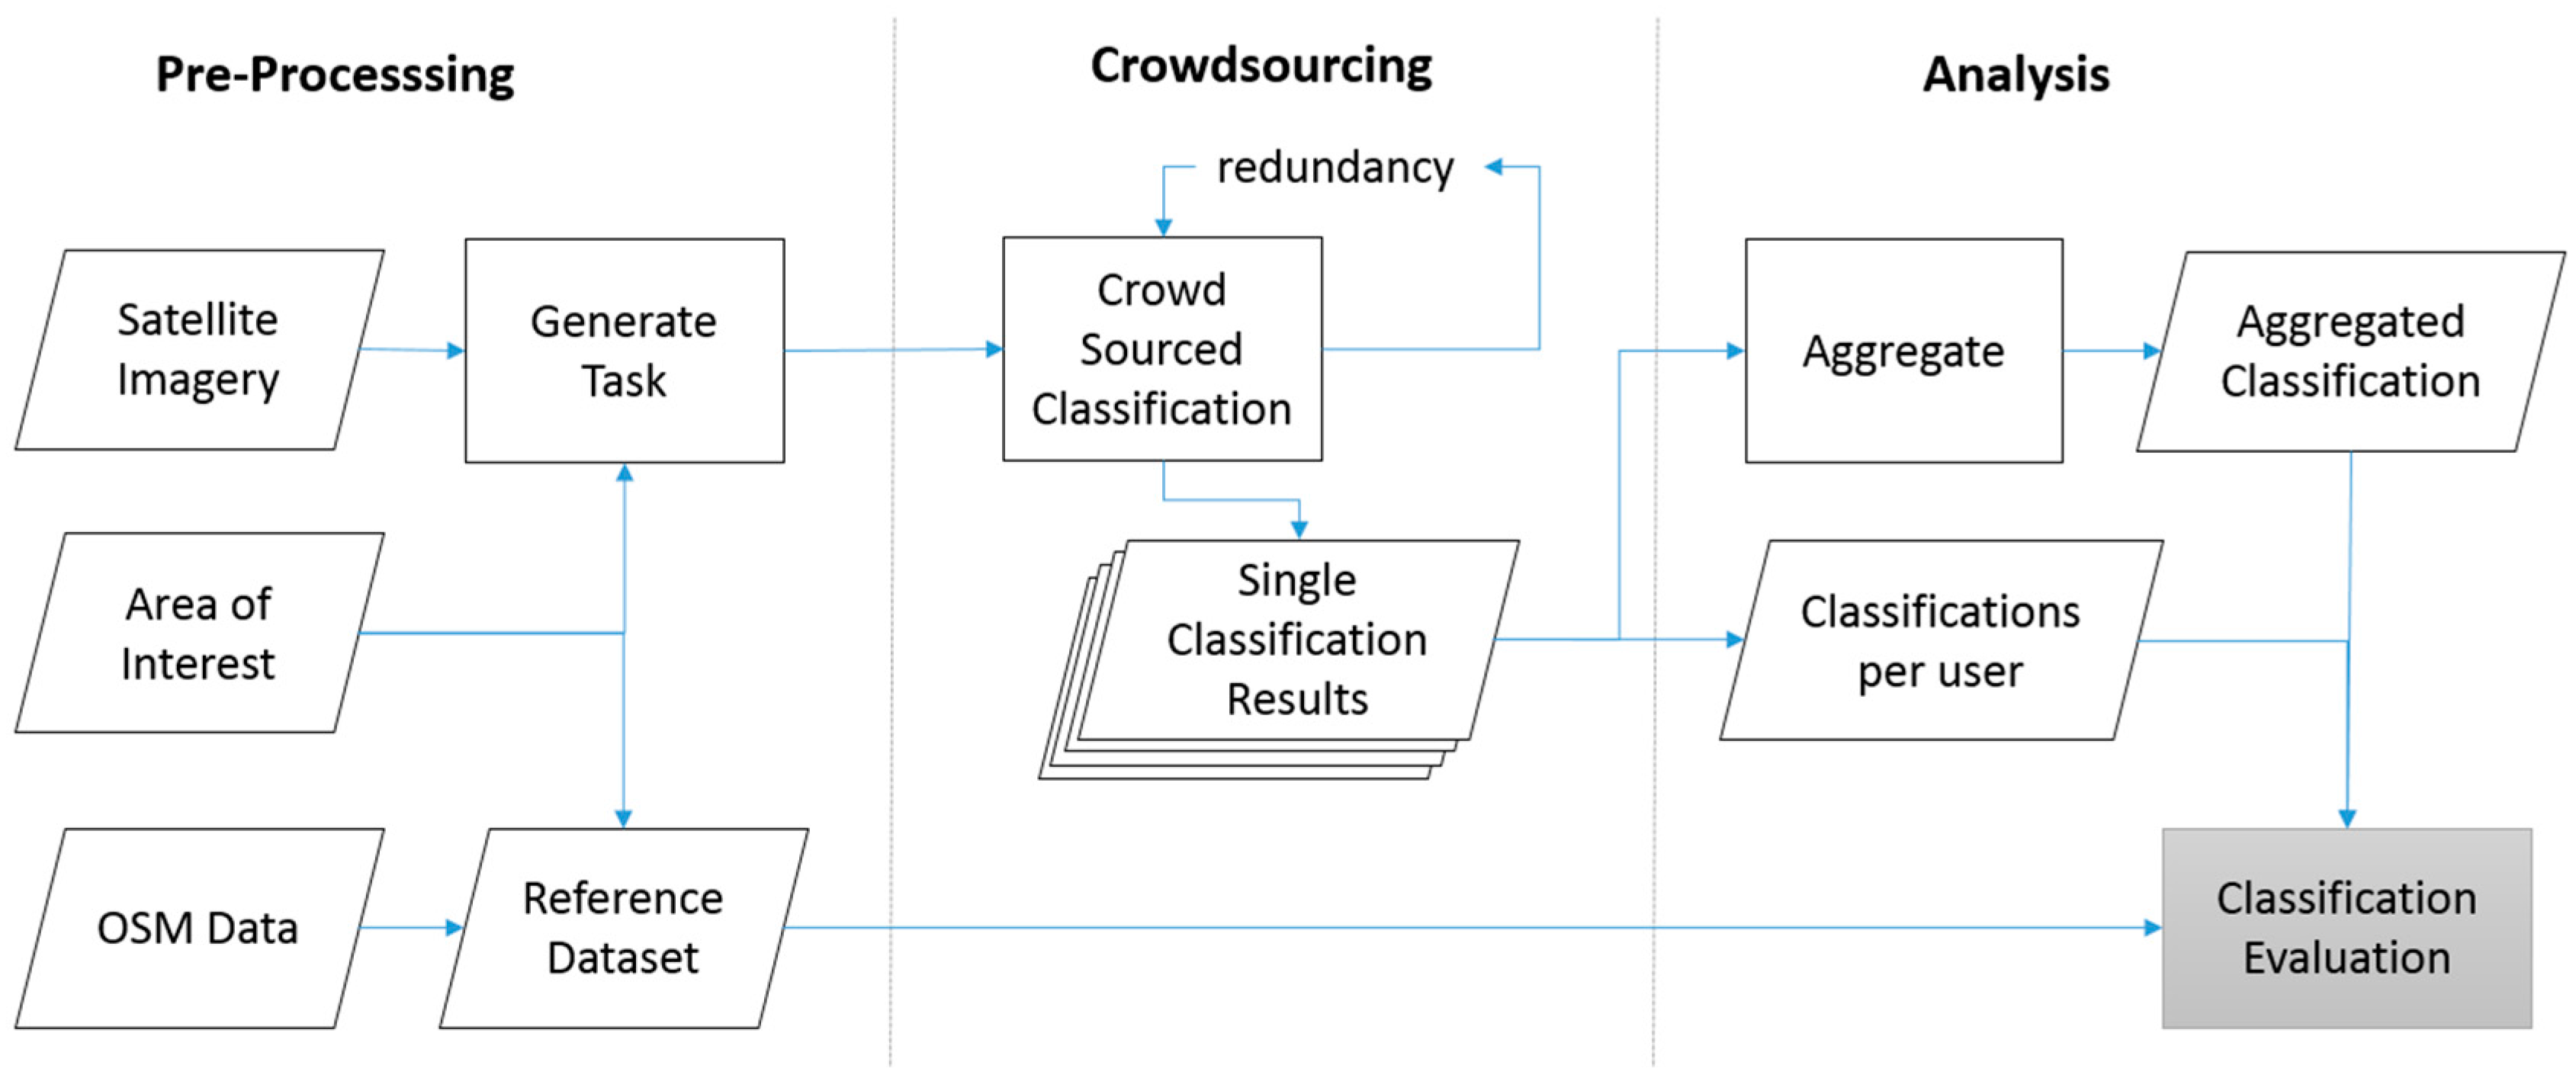
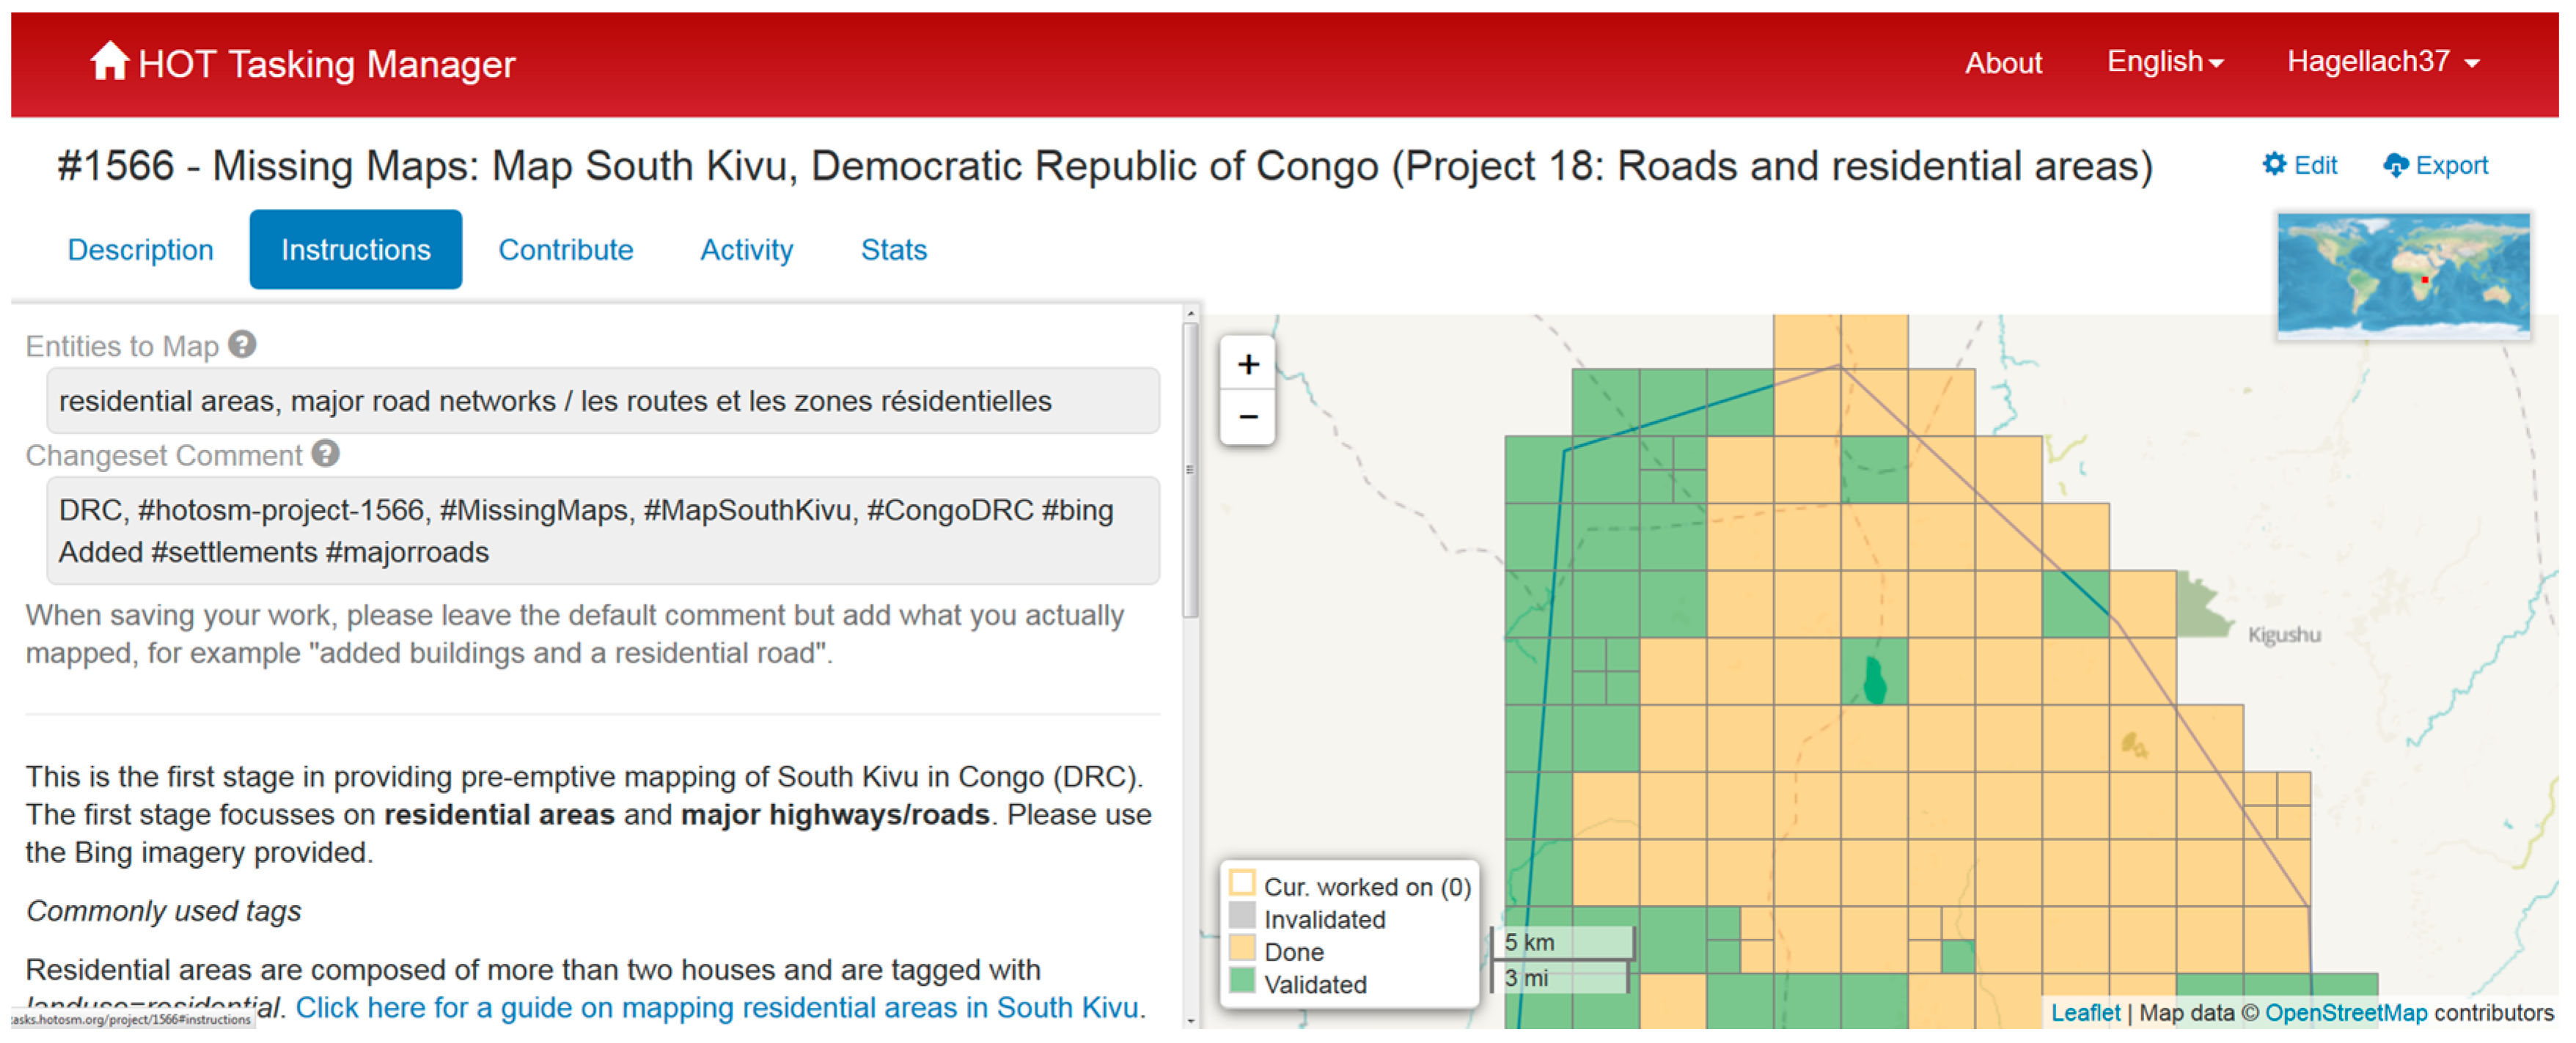
The results of the case study performed on crowdsourced classifications in the context of the Mapping South Kivu projects are presented in this section in two parts. First, an overall classification of the results is described in the next section (Section 4.1), followed by a detailed analysis of the factors influencing the crowdsourced classification performance (Section 4.2), and then the predictive analysis of the classification results (Section 4.3).

4.1. Overall Classification Performance

The overall classifications results are summarised in Table 6. In total, 35,560 classifications were performed by 539 volunteers. The majority of the contributions (23,192) are “no” classifications, whilst 8368 classifications are labelled as “yes”.
As shown in Table 7, whilst the different aggregation methods show only little variations regarding accuracy, they differ considerably regarding sensitivity and precision. As expressed by the F1 score, the best compromise between sensitivity and precision is reached using aggregation method (3) majority, tie is “yes”. Applying this method, we reach an accuracy of 89%, a sensitivity of 73% and a precision of 89%. Aggregation methods (1) and (2) show very good results regarding precision, but very low values for sensitivity. Aggregation method (4) shows the opposite characteristics.
On average, each user contributed 66 classifications, and the median is around 21. 
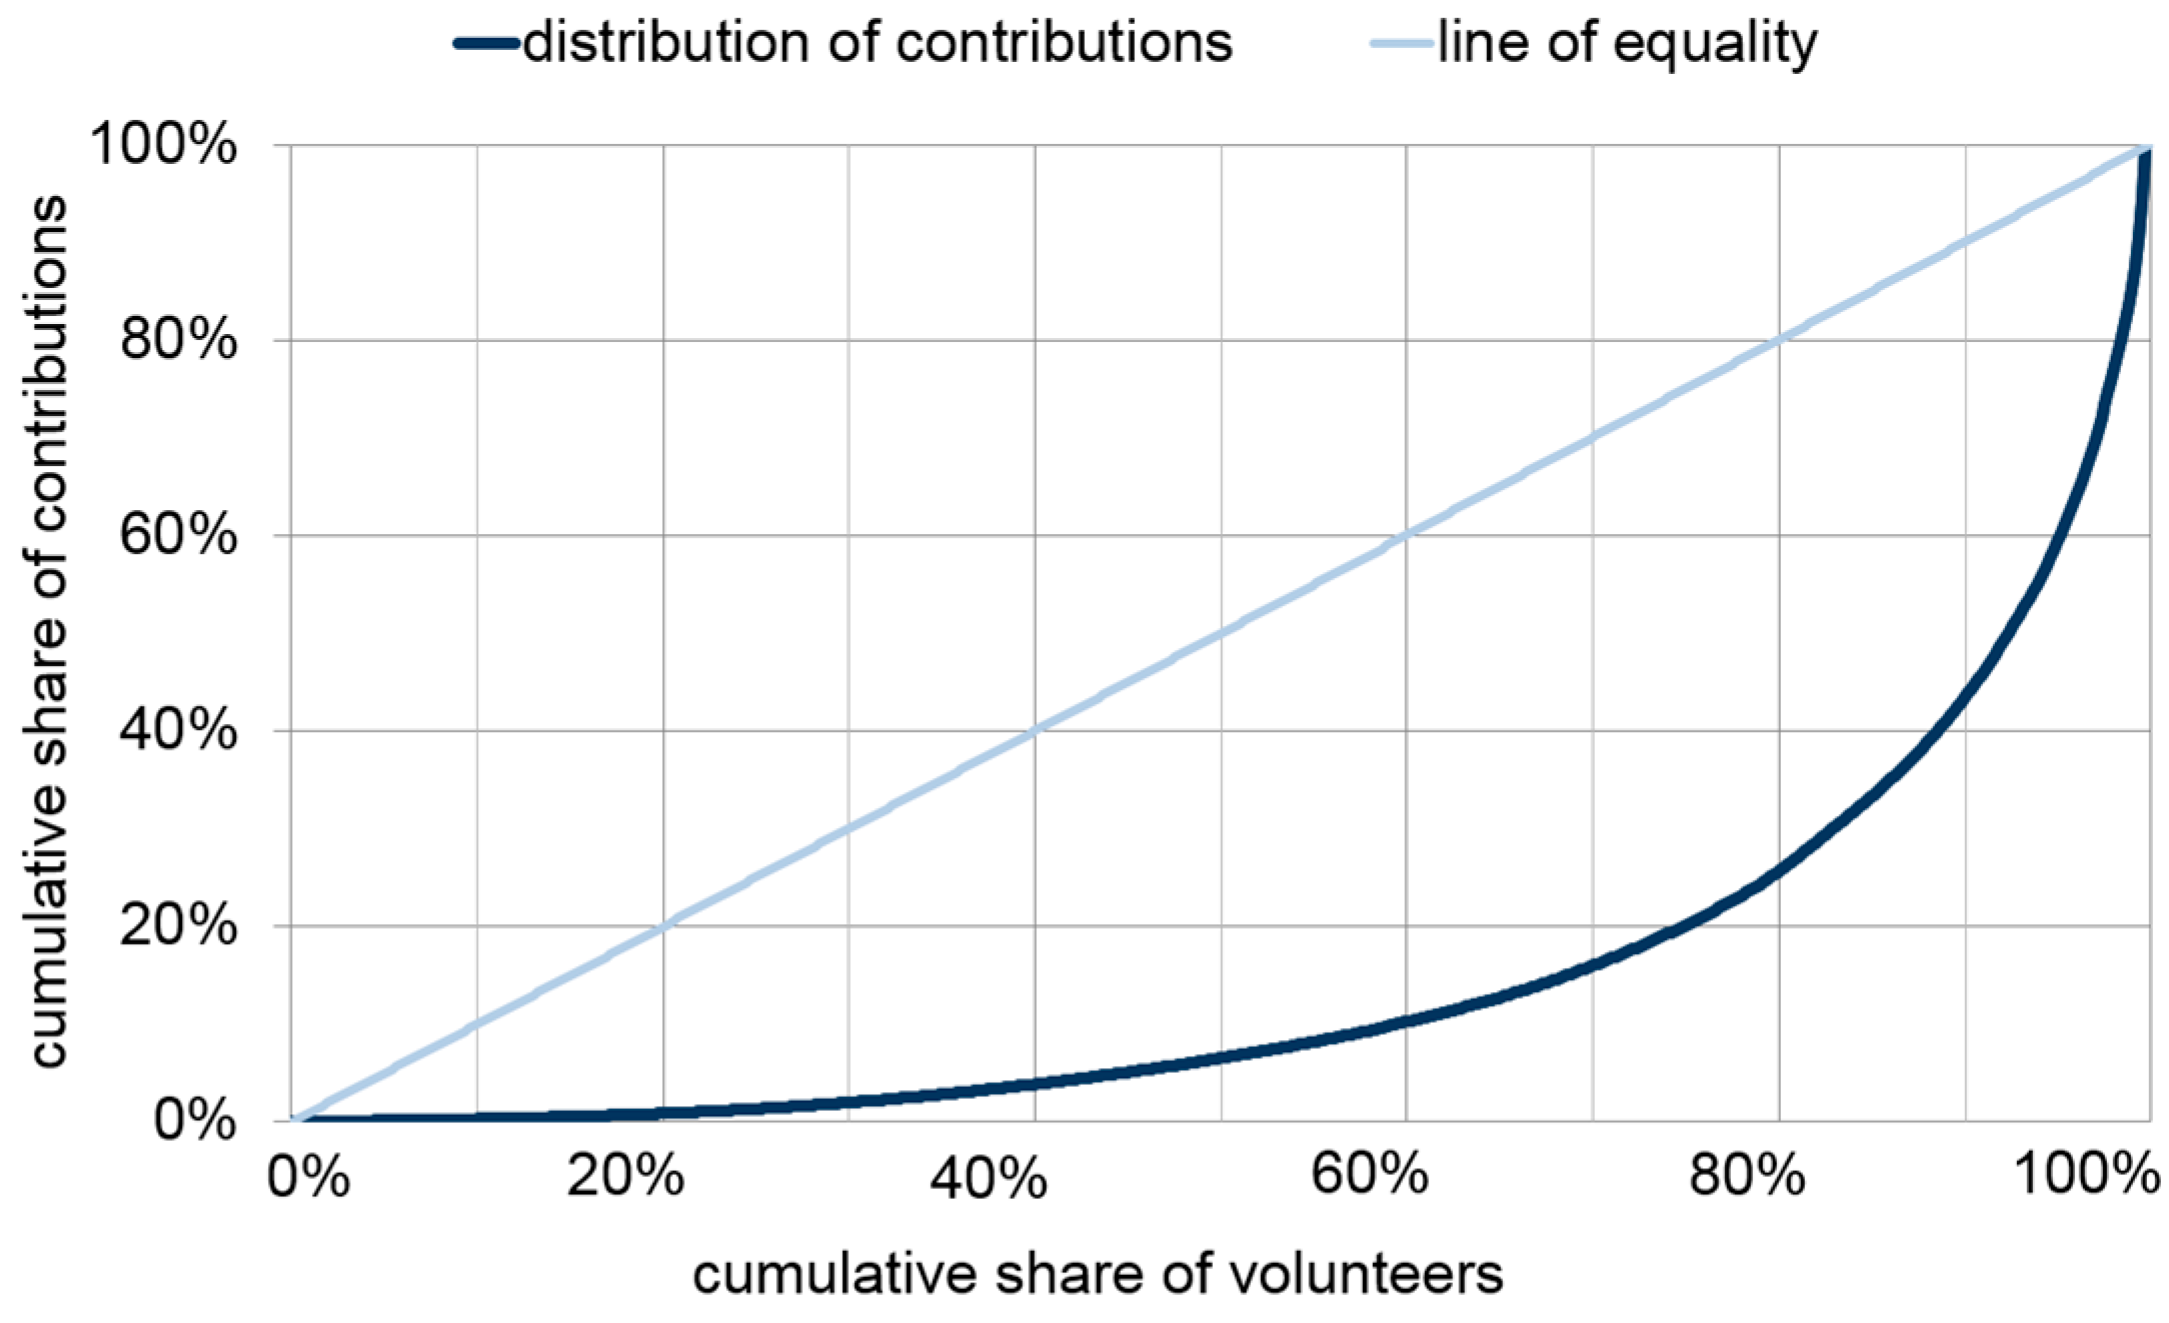
Figure 6 presents the degree of inequality of contributions per user. The diagram illustrates that around 75% of the volunteers contributed only 20% of the classifications, whilst 25% of the volunteers contributed 80% of the classifications.
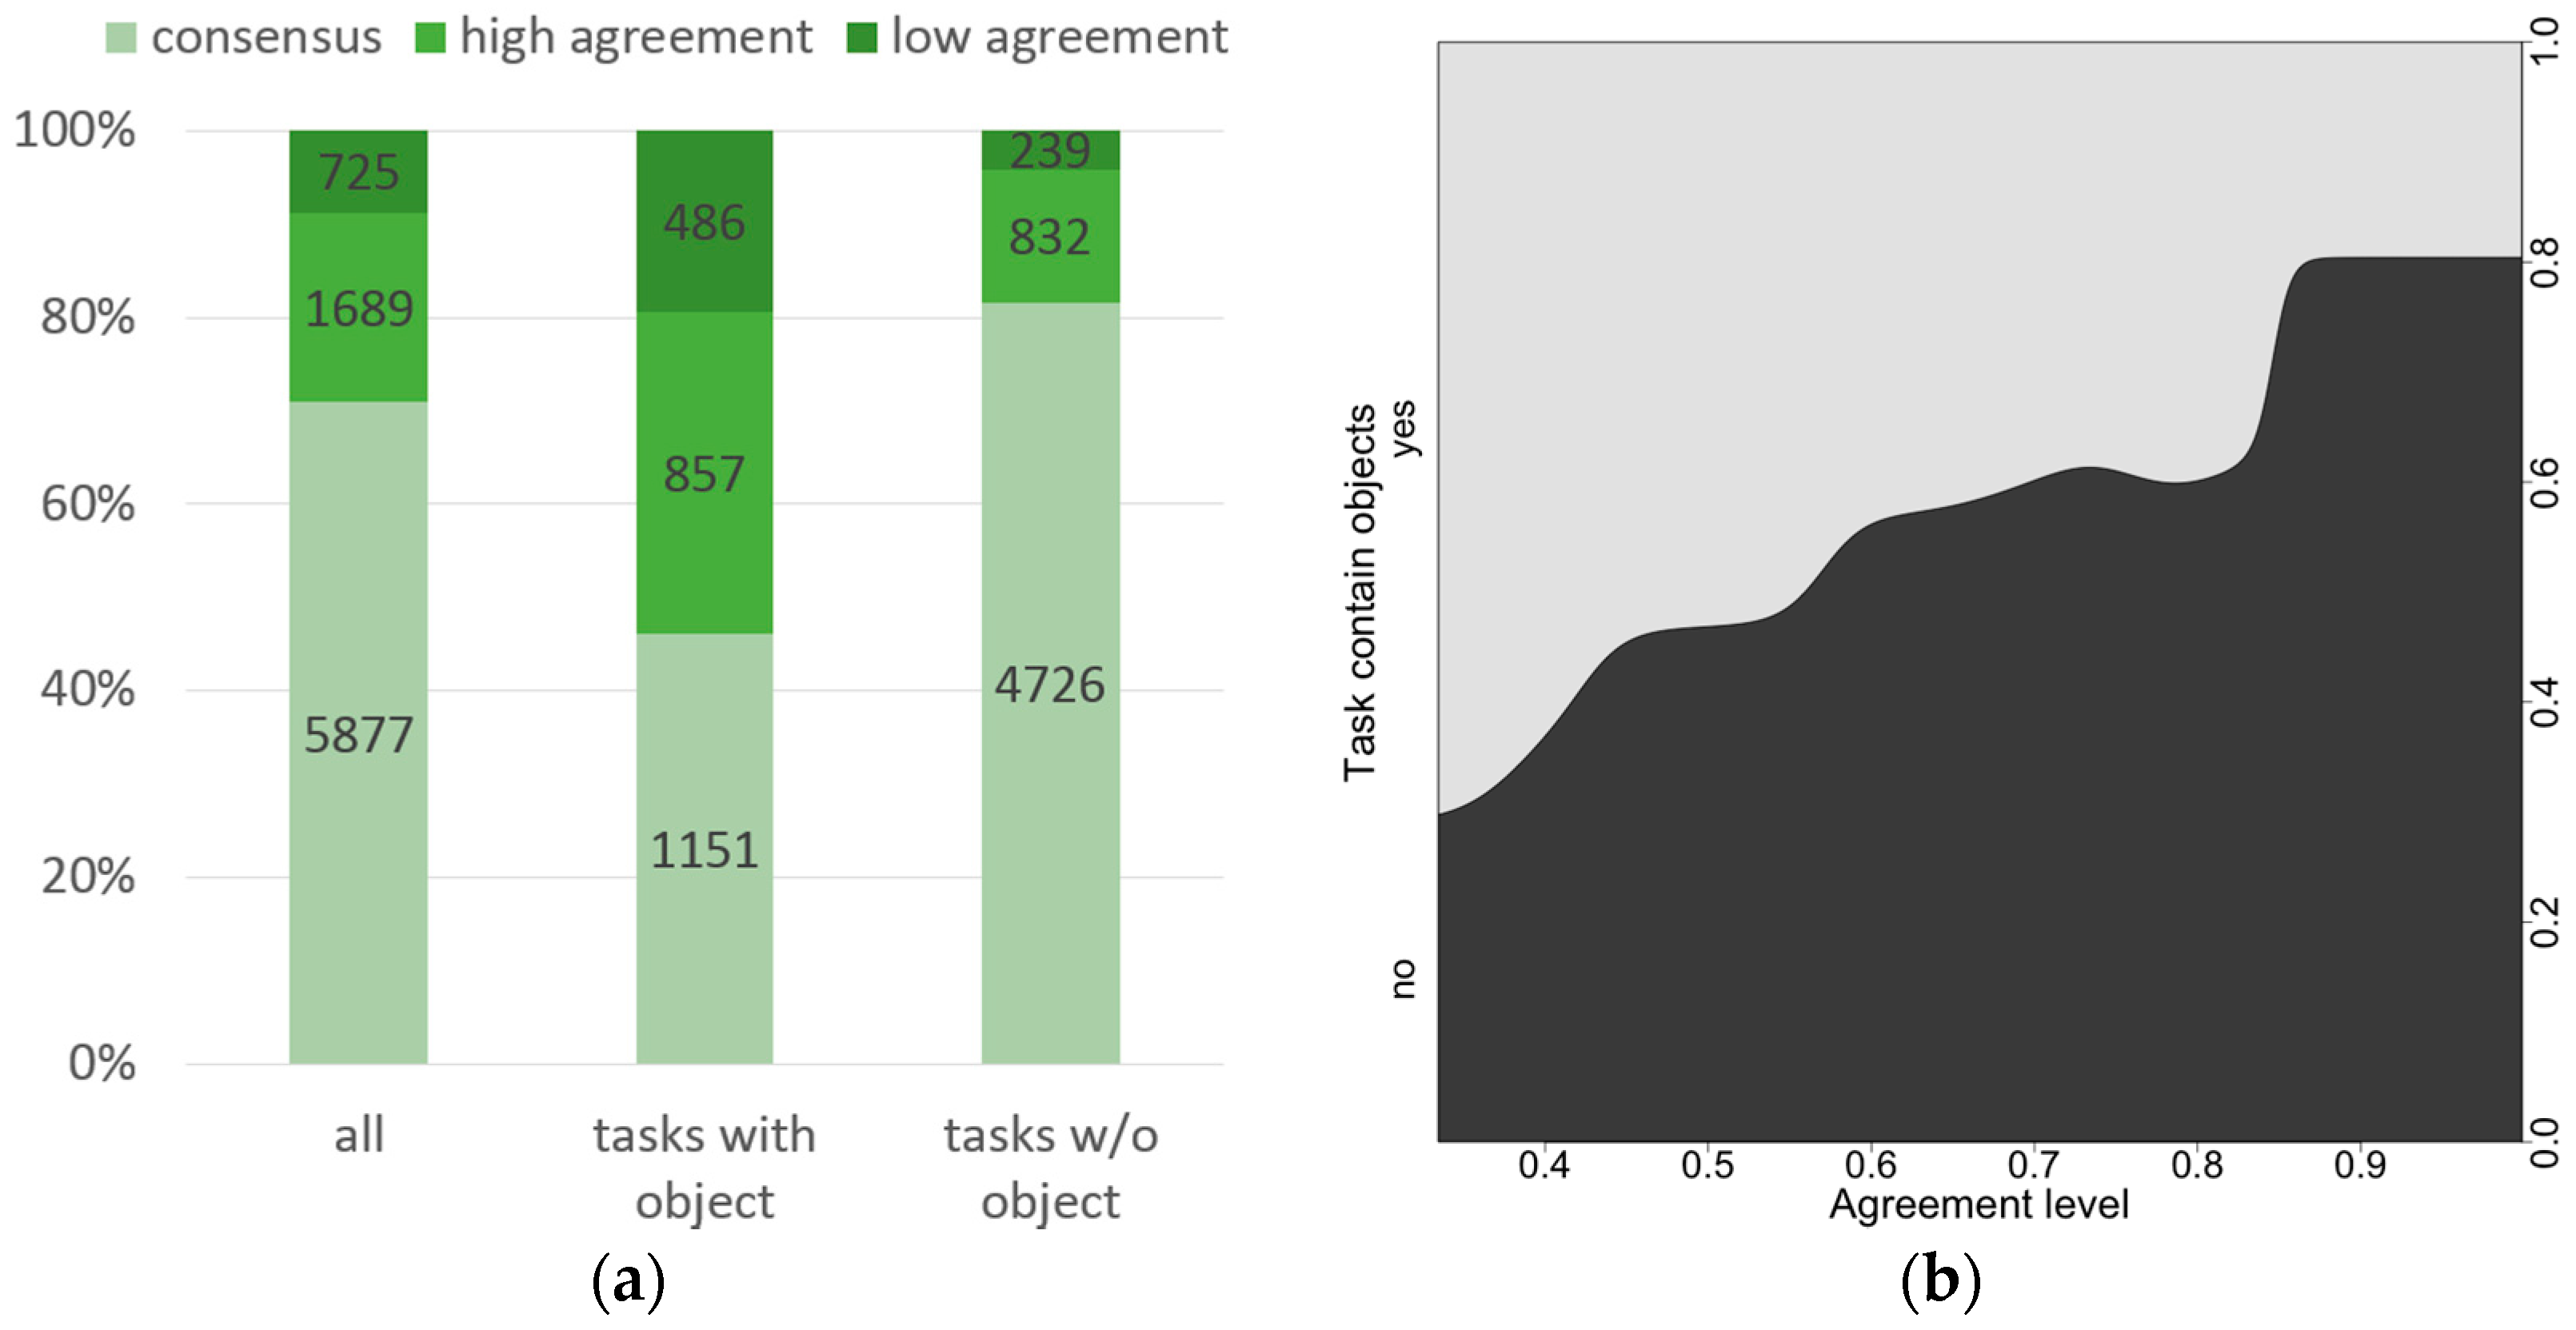
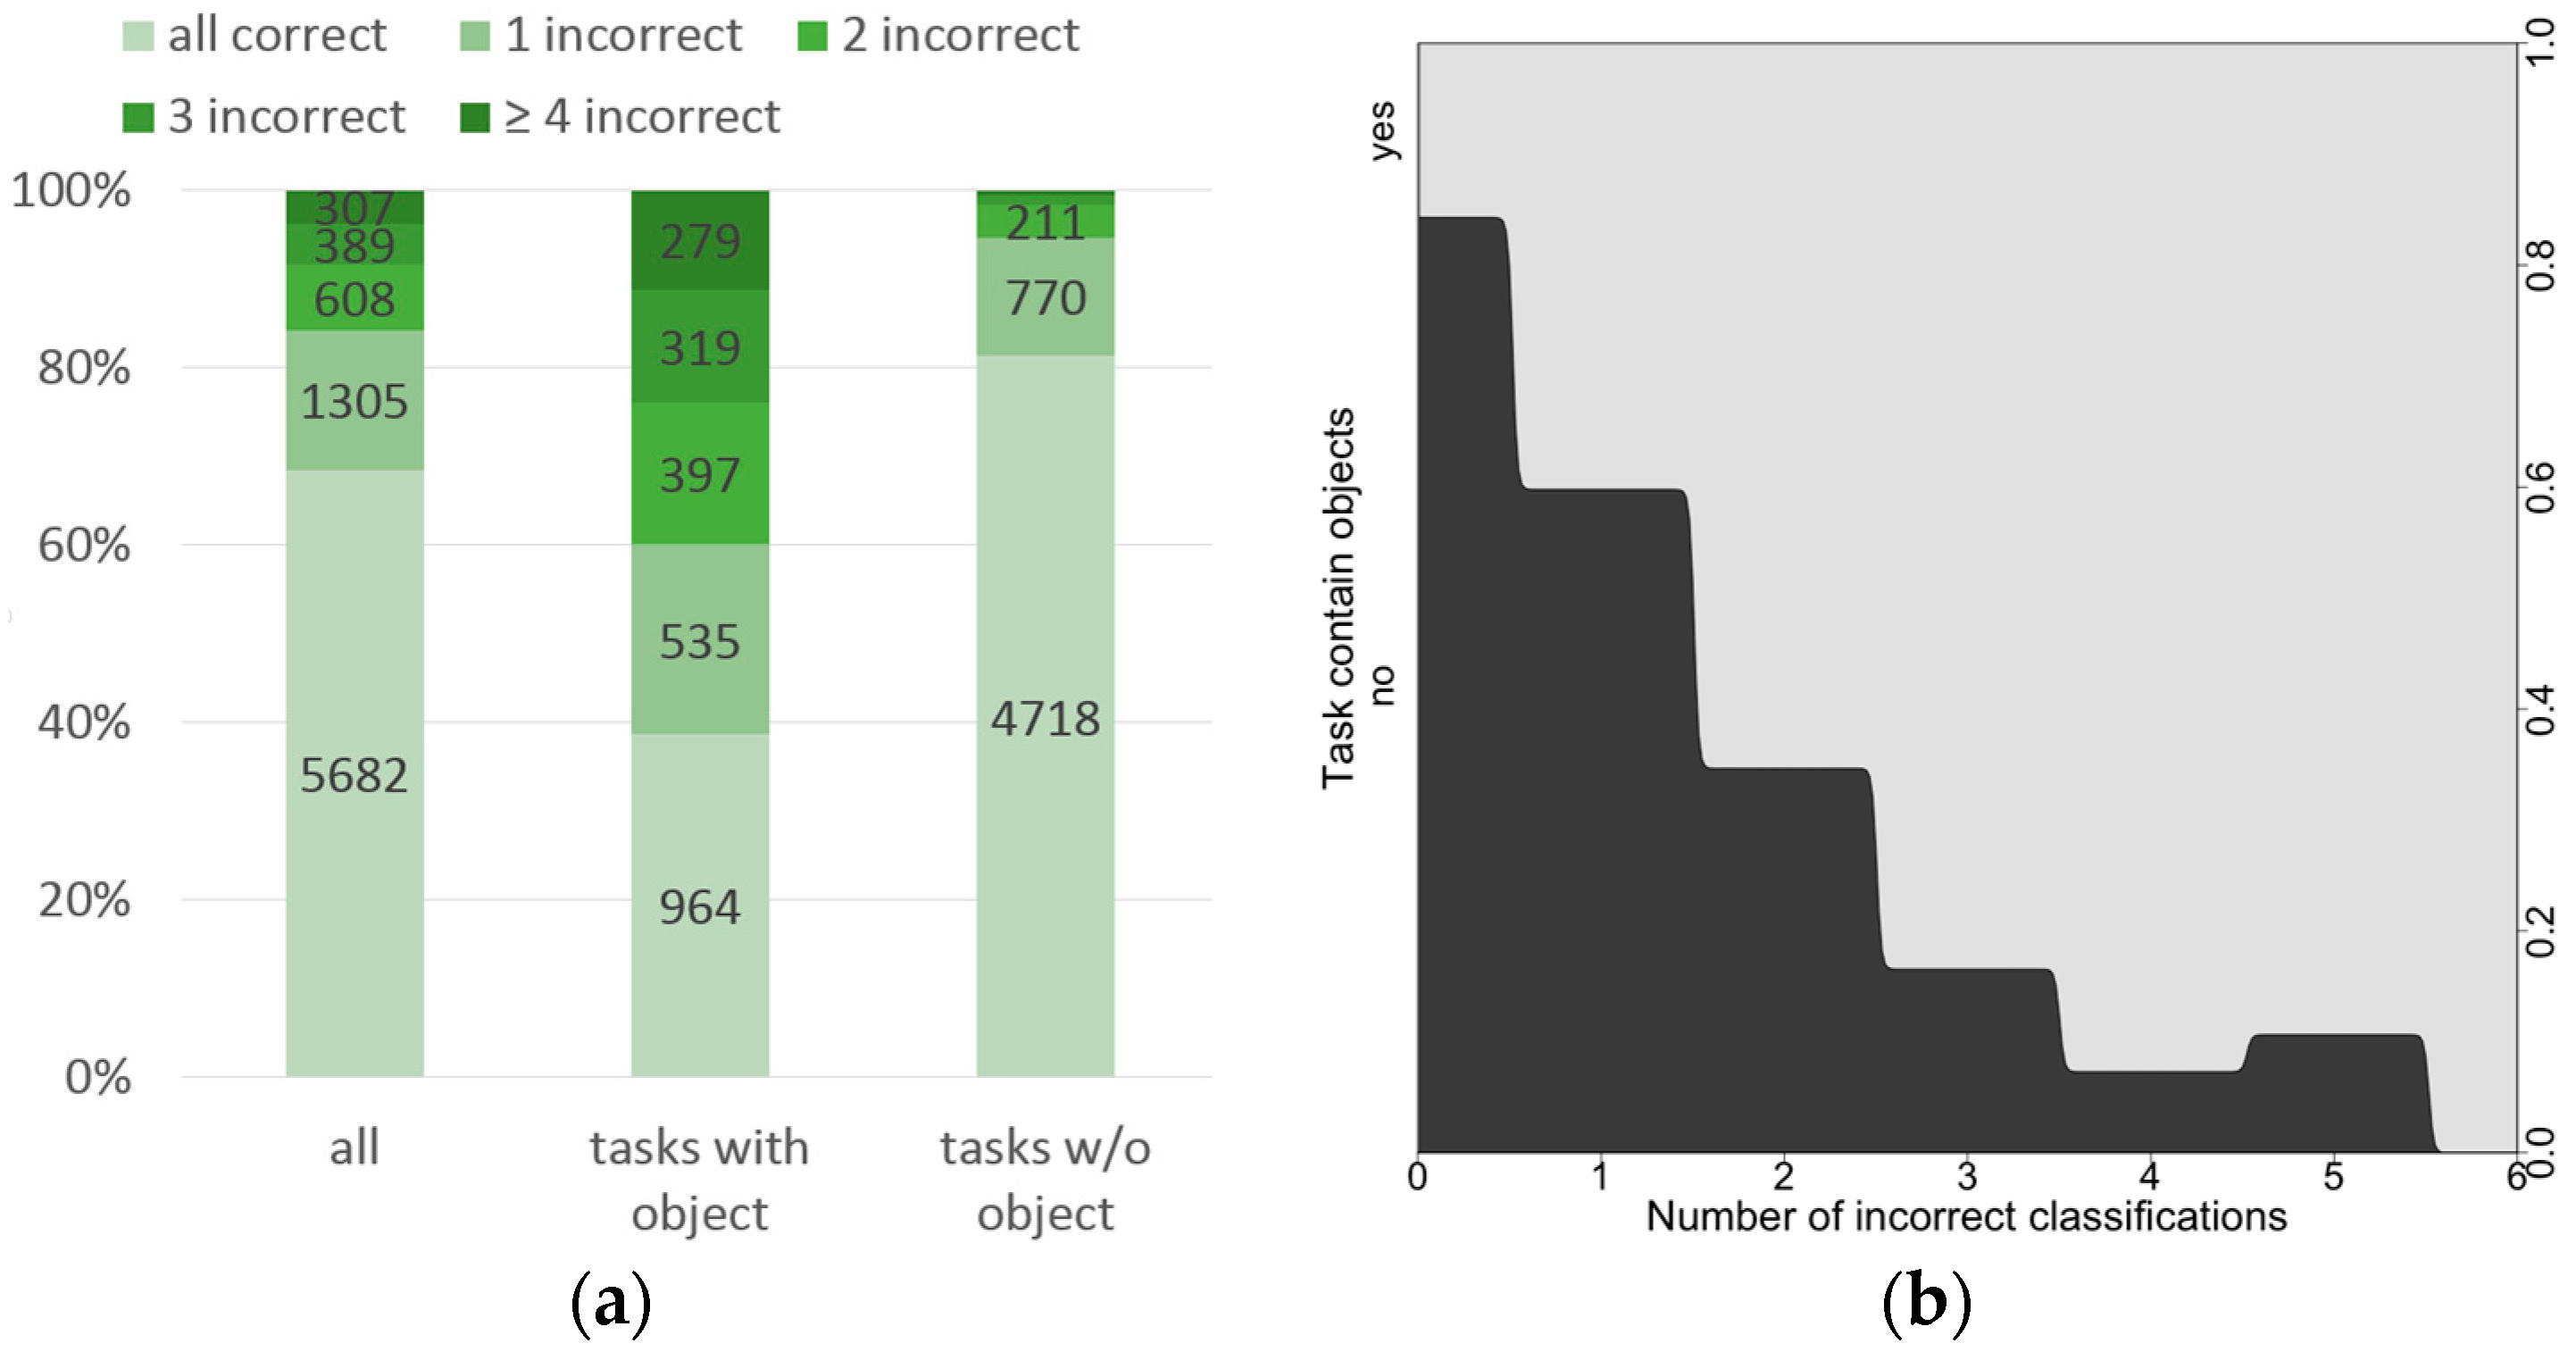
Figure 7a shows the distribution of all classifications per task for all tasks, for tasks with objects and for tasks without objects. Using the number of incorrect classifications as a proxy for the task difficulty, we can see that about 69% of all tasks can be considered as “easy cases” (all crowdsourced classifications were correct), 28% as “medium cases” (1 to 3 incorrect classifications) and only 4% as “difficult cases” (four or more classifications were incorrect). About 12% of all tasks with objects are “difficult cases”, whilst this is the case only in less than 0.5% of all tasks without objects. Thus, tasks that contain geographic objects are more difficult than tasks without objects and thus more incorrectly classified by volunteers. This is clearly confirmed by the condition plot of Figure 7b. A considerable amount of volunteers appears to have missed roads or settlements, thus incorrectly classifying tasks that have such features. However, tasks without objects (e.g., forests) are mostly classified correctly, suggesting that volunteers tend to not mistake other image elements for buildings or roads.
In order to further explore this distinction between tasks with and without objects, Figure 8 shows the distribution of tasks concerning different user agreement levels. Tasks with objects have an above-average proportion of cases where there was a low agreement in the classifications of volunteers. In contrast, tasks without object tend to have more consensual cases. Assuming that disagreement is also connected to tasks that are more difficult to analyse, it seems these are happening more frequently in tasks that contain objects.
Moreover, the level of agreement in the classification of the volunteers and the possible influence on the performance of the classification was investigated. Table 8 presents the results of the comparison for the different levels of agreement (“consensus”, “high”, and “low”) and the respective statistical measures. In tasks for which all volunteers came to the same classification result (consensus), the performance achieved was clearly superior according to all metrics. The same pattern can be seen comparing tasks with high level of agreement with tasks with a low level of agreement. In 
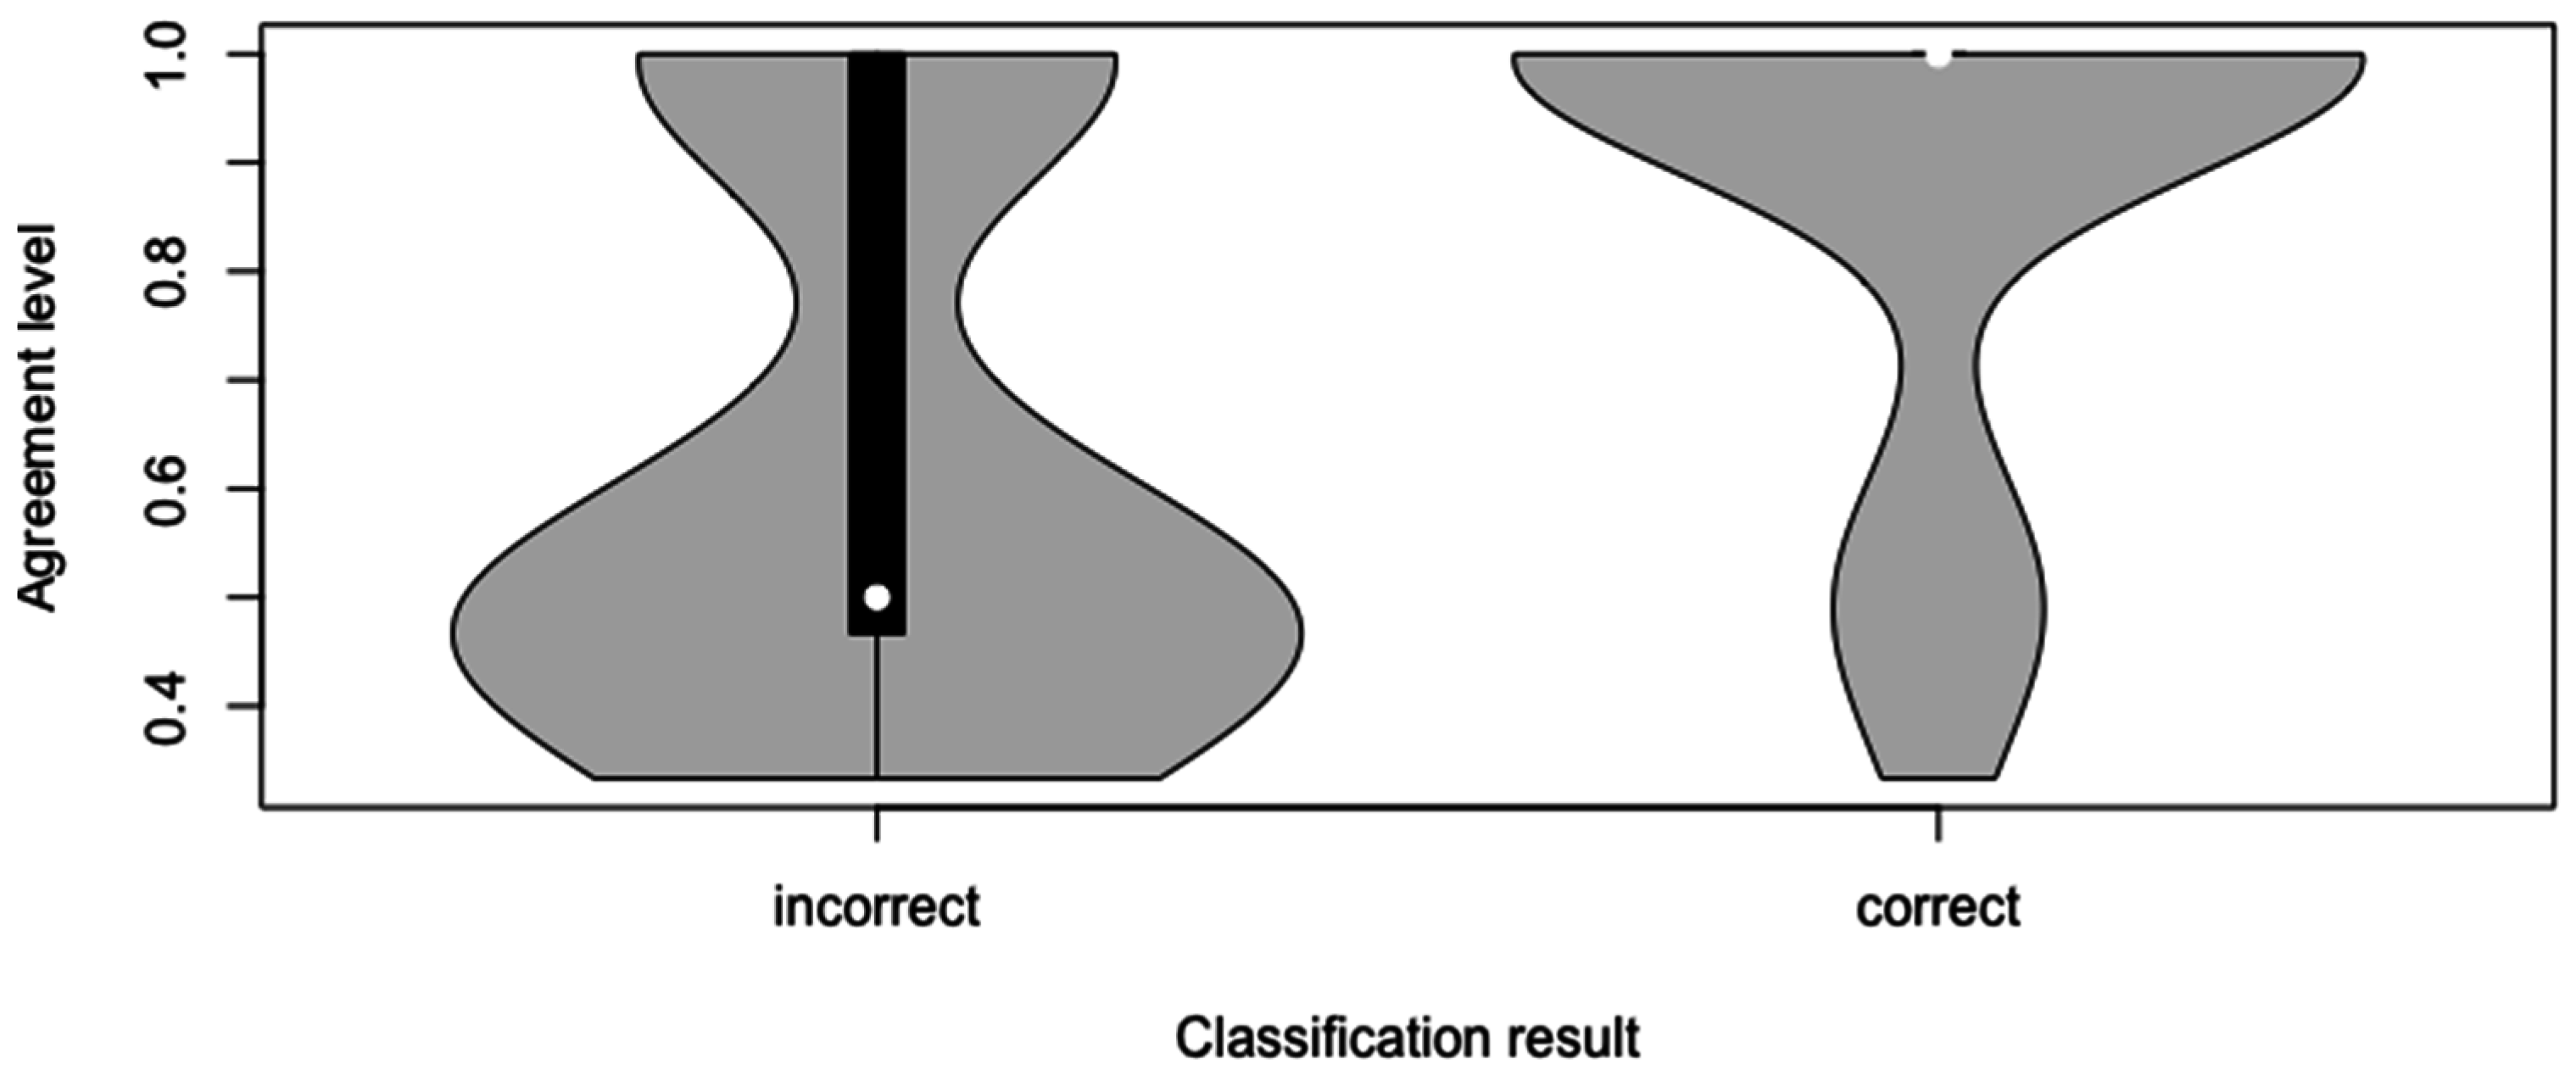
Figure 9, the violin plot clearly shows that the distributions of tasks incorrectly classified tend to have lower levels of agreement in comparison with tasks that were correctly classified.
The results of this overall analysis show that the volunteers achieved a reasonable performance in general. However, there are big differences between tasks with and without objects and varying levels of task difficulty, as indicated both by the number of incorrect classifications and by the agreement level between volunteers. We thus further investigate geographic factors that may influence the performance of crowdsourced classifications in the next section.

4.2. Geographic Factors that Influence Crowdsourced Classification Performance

In this section, we analyse the influence of geographic factors on classification performance. The analysis is divided into two parts. First, the impact of road length and settlement area on the number of false negatives per task are investigated. In the second part, we focus on the influence of waterways on the number of false positives per task.
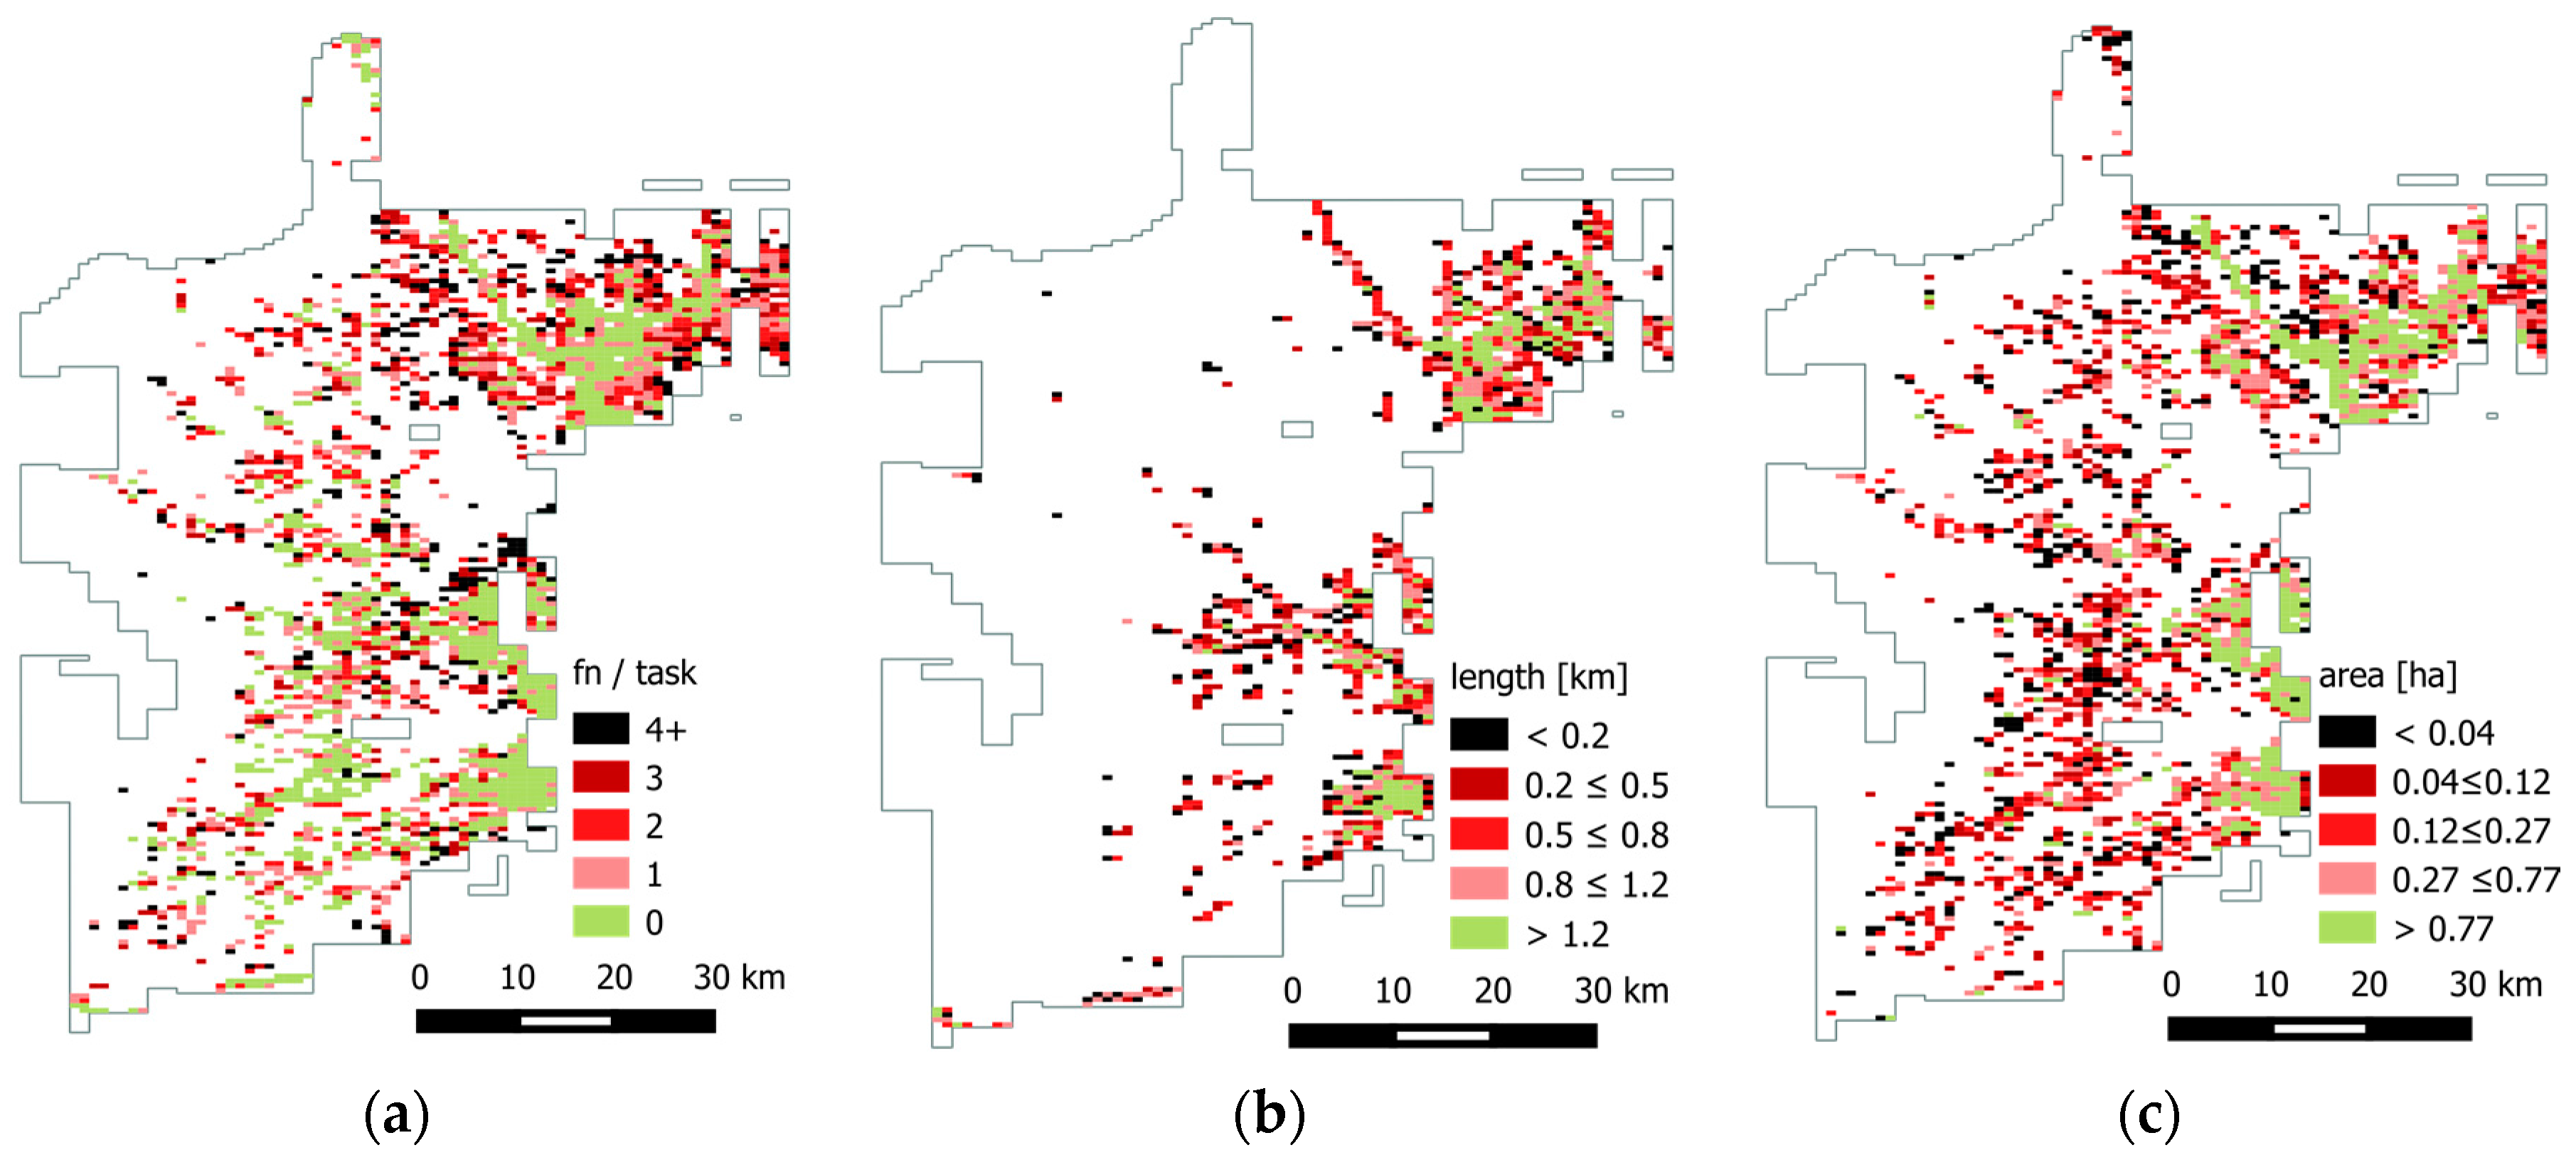
Figure 10a provides an overview of the spatial distribution of all tasks with objects and the corresponding number of incorrect classifications per task, which is used here as a proxy for task difficulty. Green areas indicate regions that were classified correctly, in accordance with the reference data. Dark red and black areas mark tasks with a high level of difficulty, the “hard cases”. Figure 10b maps the distribution of the road length in each task. Dark red and black tasks indicate shorter roads (which are supposedly more difficult to detect), whilst lighter colours indicate longer and more visible roads. The same scheme is applied in the settlement area map of Figure 10c. A visual inspection of the maps may suggest that easy tasks tend to be associated with longer roads and larger settlements (green regions). This is especially apparent for the settled areas along the eastern border of the area of interest.
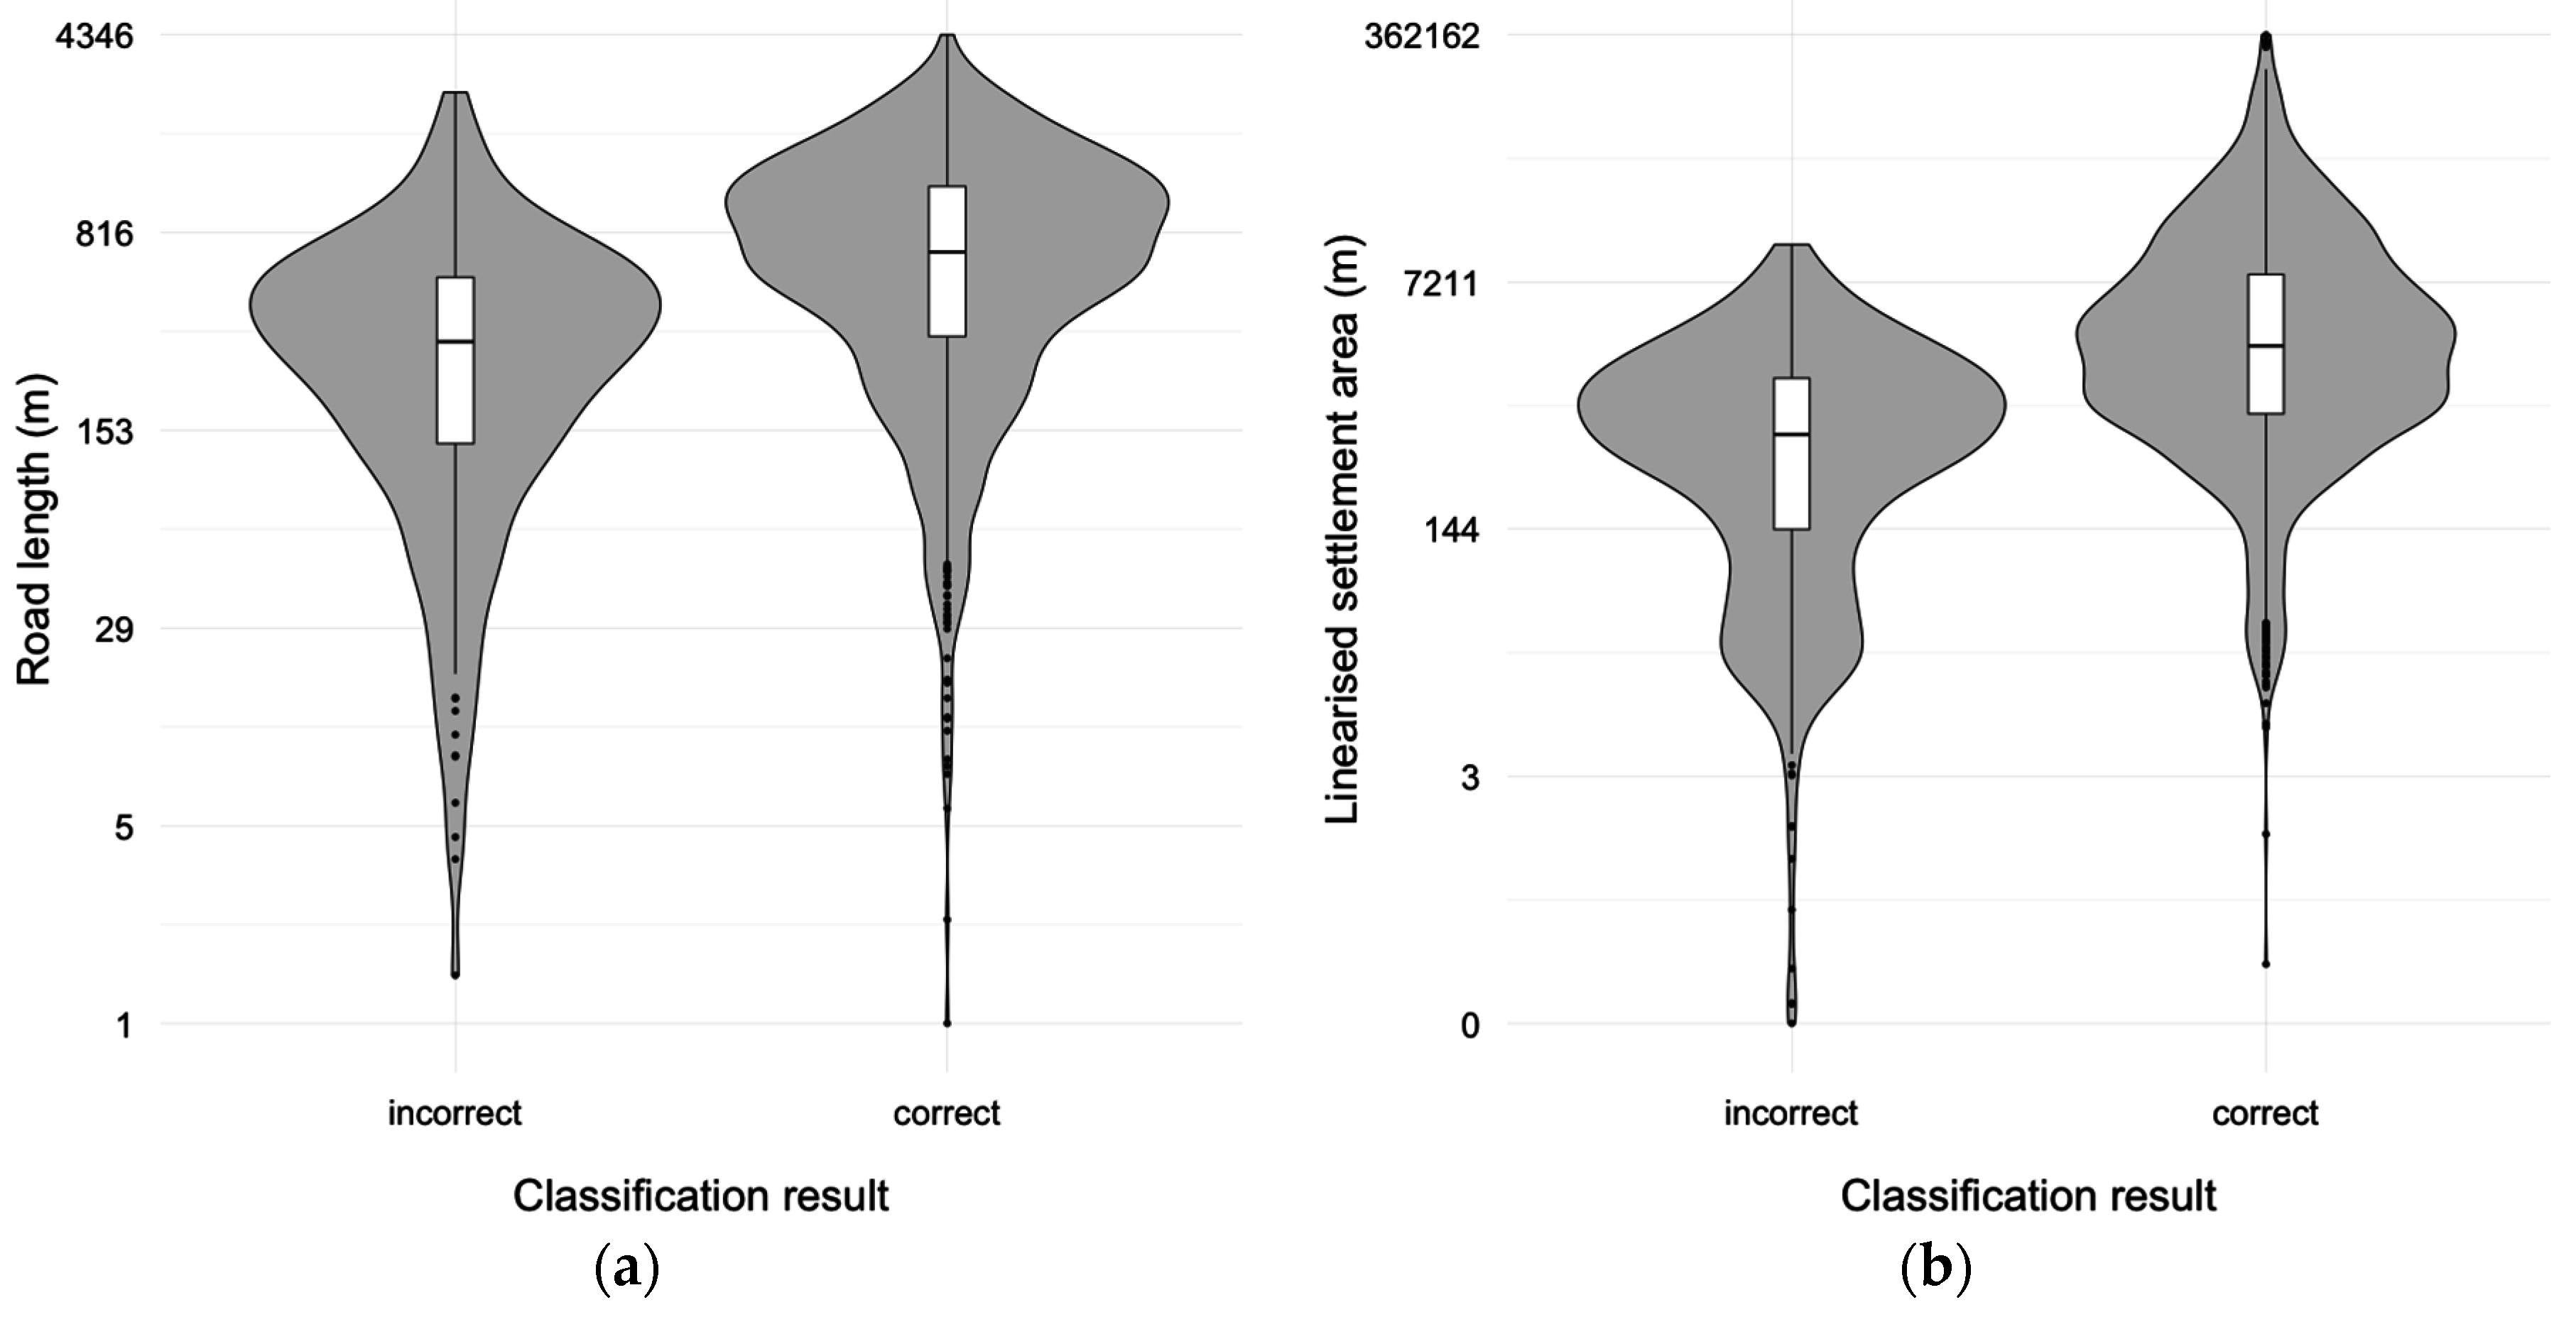
The violin plots of Figure 11 seem to confirm slightly different distributions for tasks classified correctly or incorrectly by volunteers as regards to road length (Figure 11a), and settlement area (Figure 11b). Tasks classified correctly in the aggregated results tend to show higher values for road length and settlement area in comparison with incorrectly classified tasks. Furthermore, an application of the Wilcoxon–Mann–Whitney test supports the alternative hypothesis that the distributions of road length and settlement area for correctly classified tasks in comparison with incorrectly classified ones (length: W = 3,605,300, p < 0.0005; area: W = 4,407,000, p < 0.0005). This suggests that the most difficult tasks for volunteers tend to contain smaller roads and smaller settlements.
The results seem to indicate that different task difficulties are associated with different characteristics of geographic features such as road length and settlement area. We thus performed a qualitative analysis of common errors related to these groups. As follows, we present detailed information for the “difficult cases” and general information on the “medium” and “easy” cases.
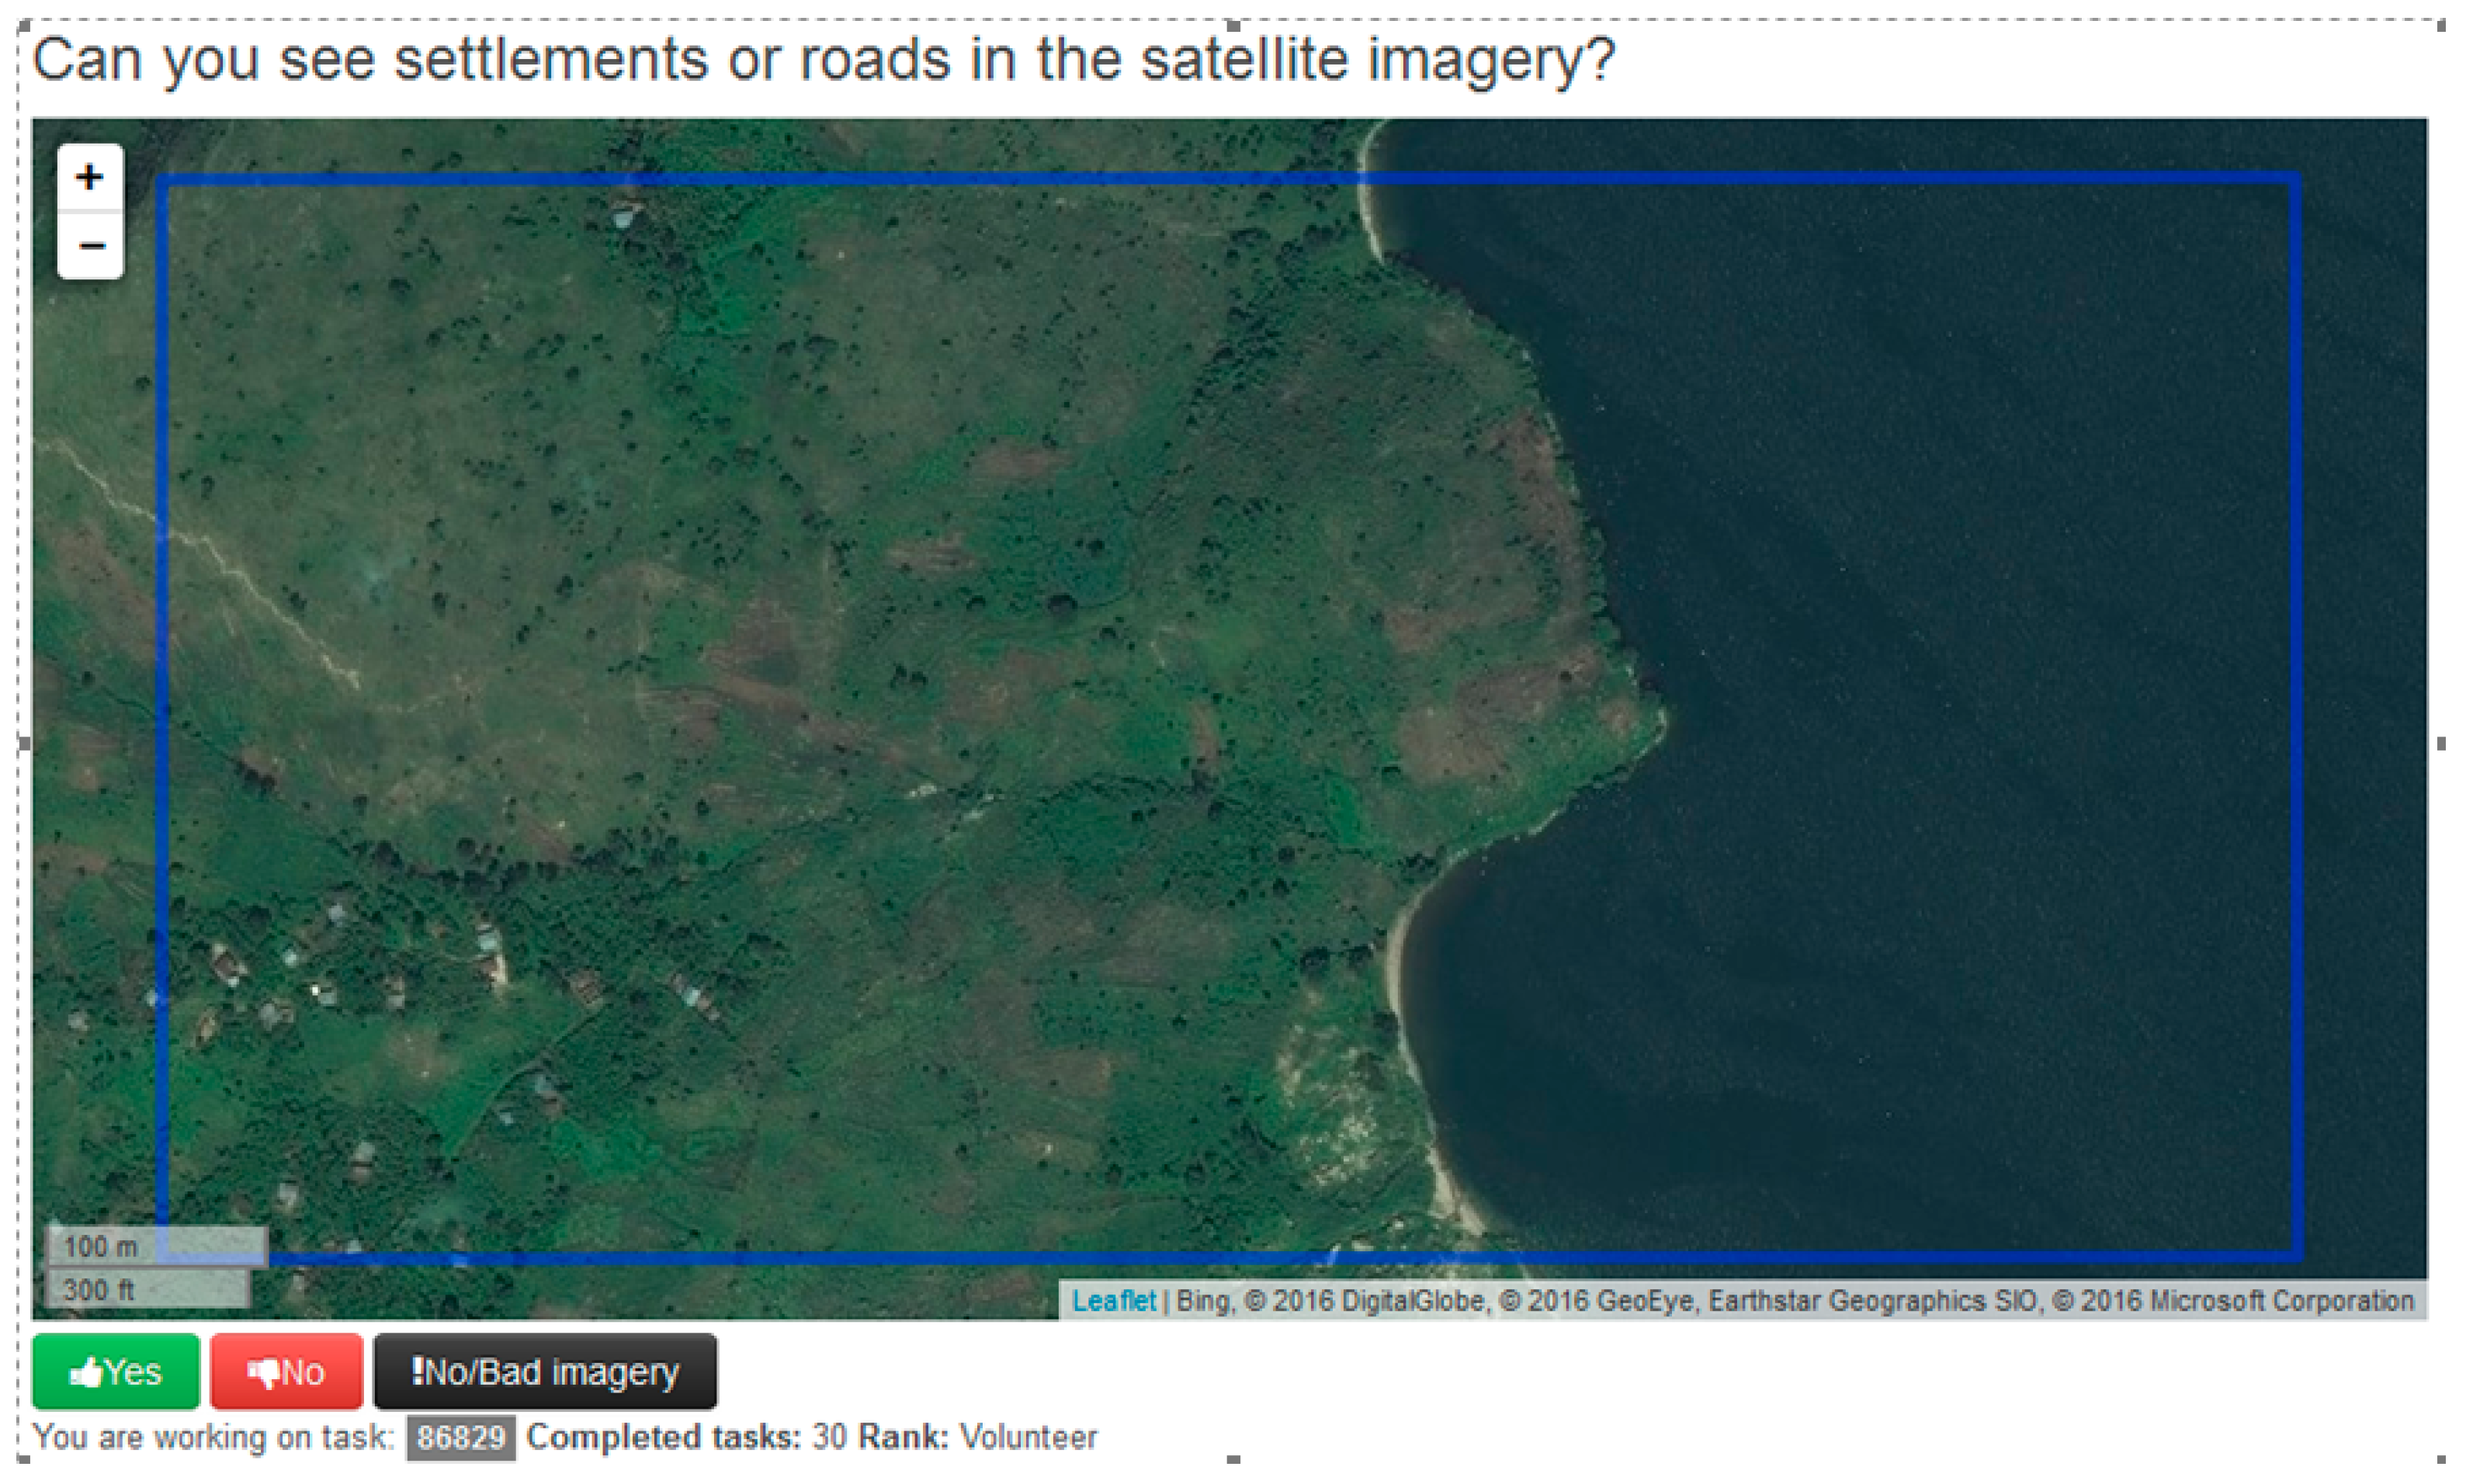
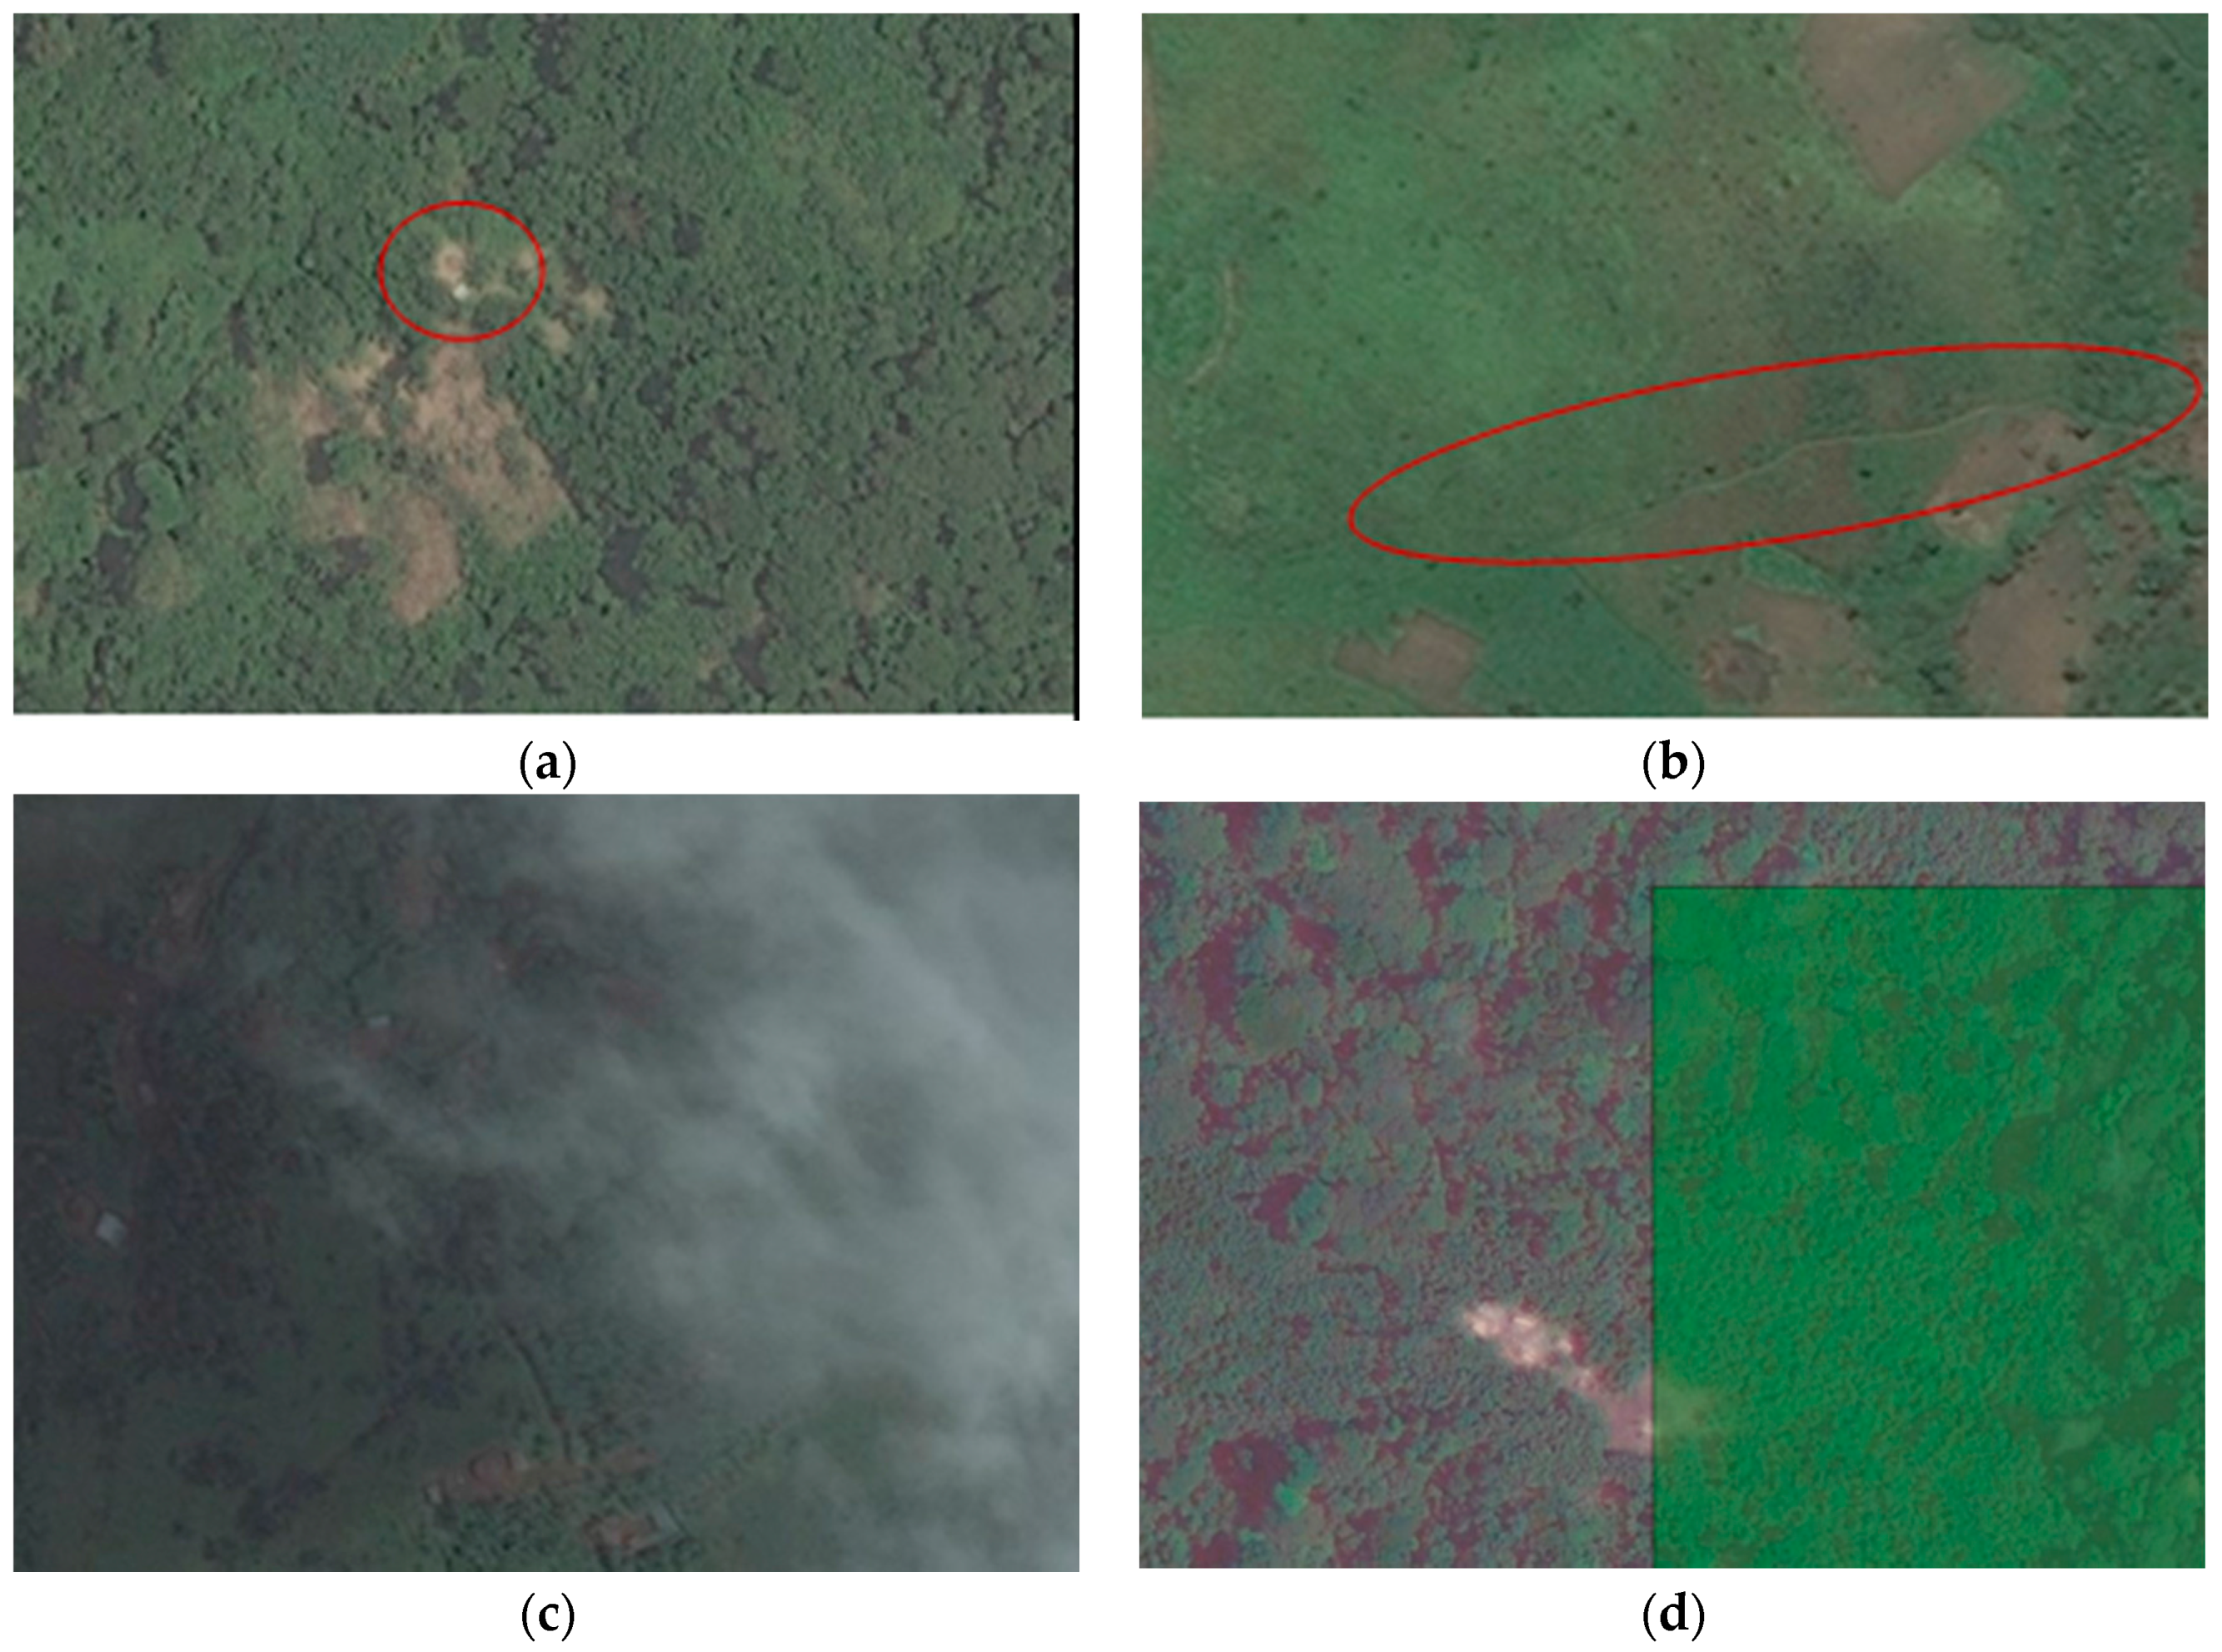
In our dataset, 279 tasks containing objects could not be correctly classified by a single user. This was mostly due to “difficult cases” that contain very small features that are more likely to be missed. Especially small buildings that show a low contrast compared to their surrounding were often not identified by volunteers. In areas covered by dense forest, small settlements appear as bright spots in the imagery. Nevertheless, these spots are often misinterpreted as clearings in the forest. Since these settlements usually contain only a few buildings it is not possible to use the spatial collocation as an additional criterion (Figure 12a). This problem becomes even more apparent for roads (Figure 12b). Apart from the given conditions on the ground, the quality of satellite imagery provided in a task can also constitute an influencing factor for task difficulty. Partial cloud coverage as presented in Figure 12c or poor imagery quality can easily cause volunteers to miss features. These limitations apply to all crowdsourced tasks that rely on satellite imagery. The last factor we observed in the case study is related to the design of the crowdsourcing task. The presented micro-tasking classification approach causes the overall task to be split into smaller subtasks. As a result, settlements and roads might be cut into smaller parts or only partially displayed (Figure 12d). This can cause buildings or roads to be difficult to identify as the overall context is not visible in the single task given to the volunteer. Moreover, features that appear at the edge of the task geometry can be more easily missed.
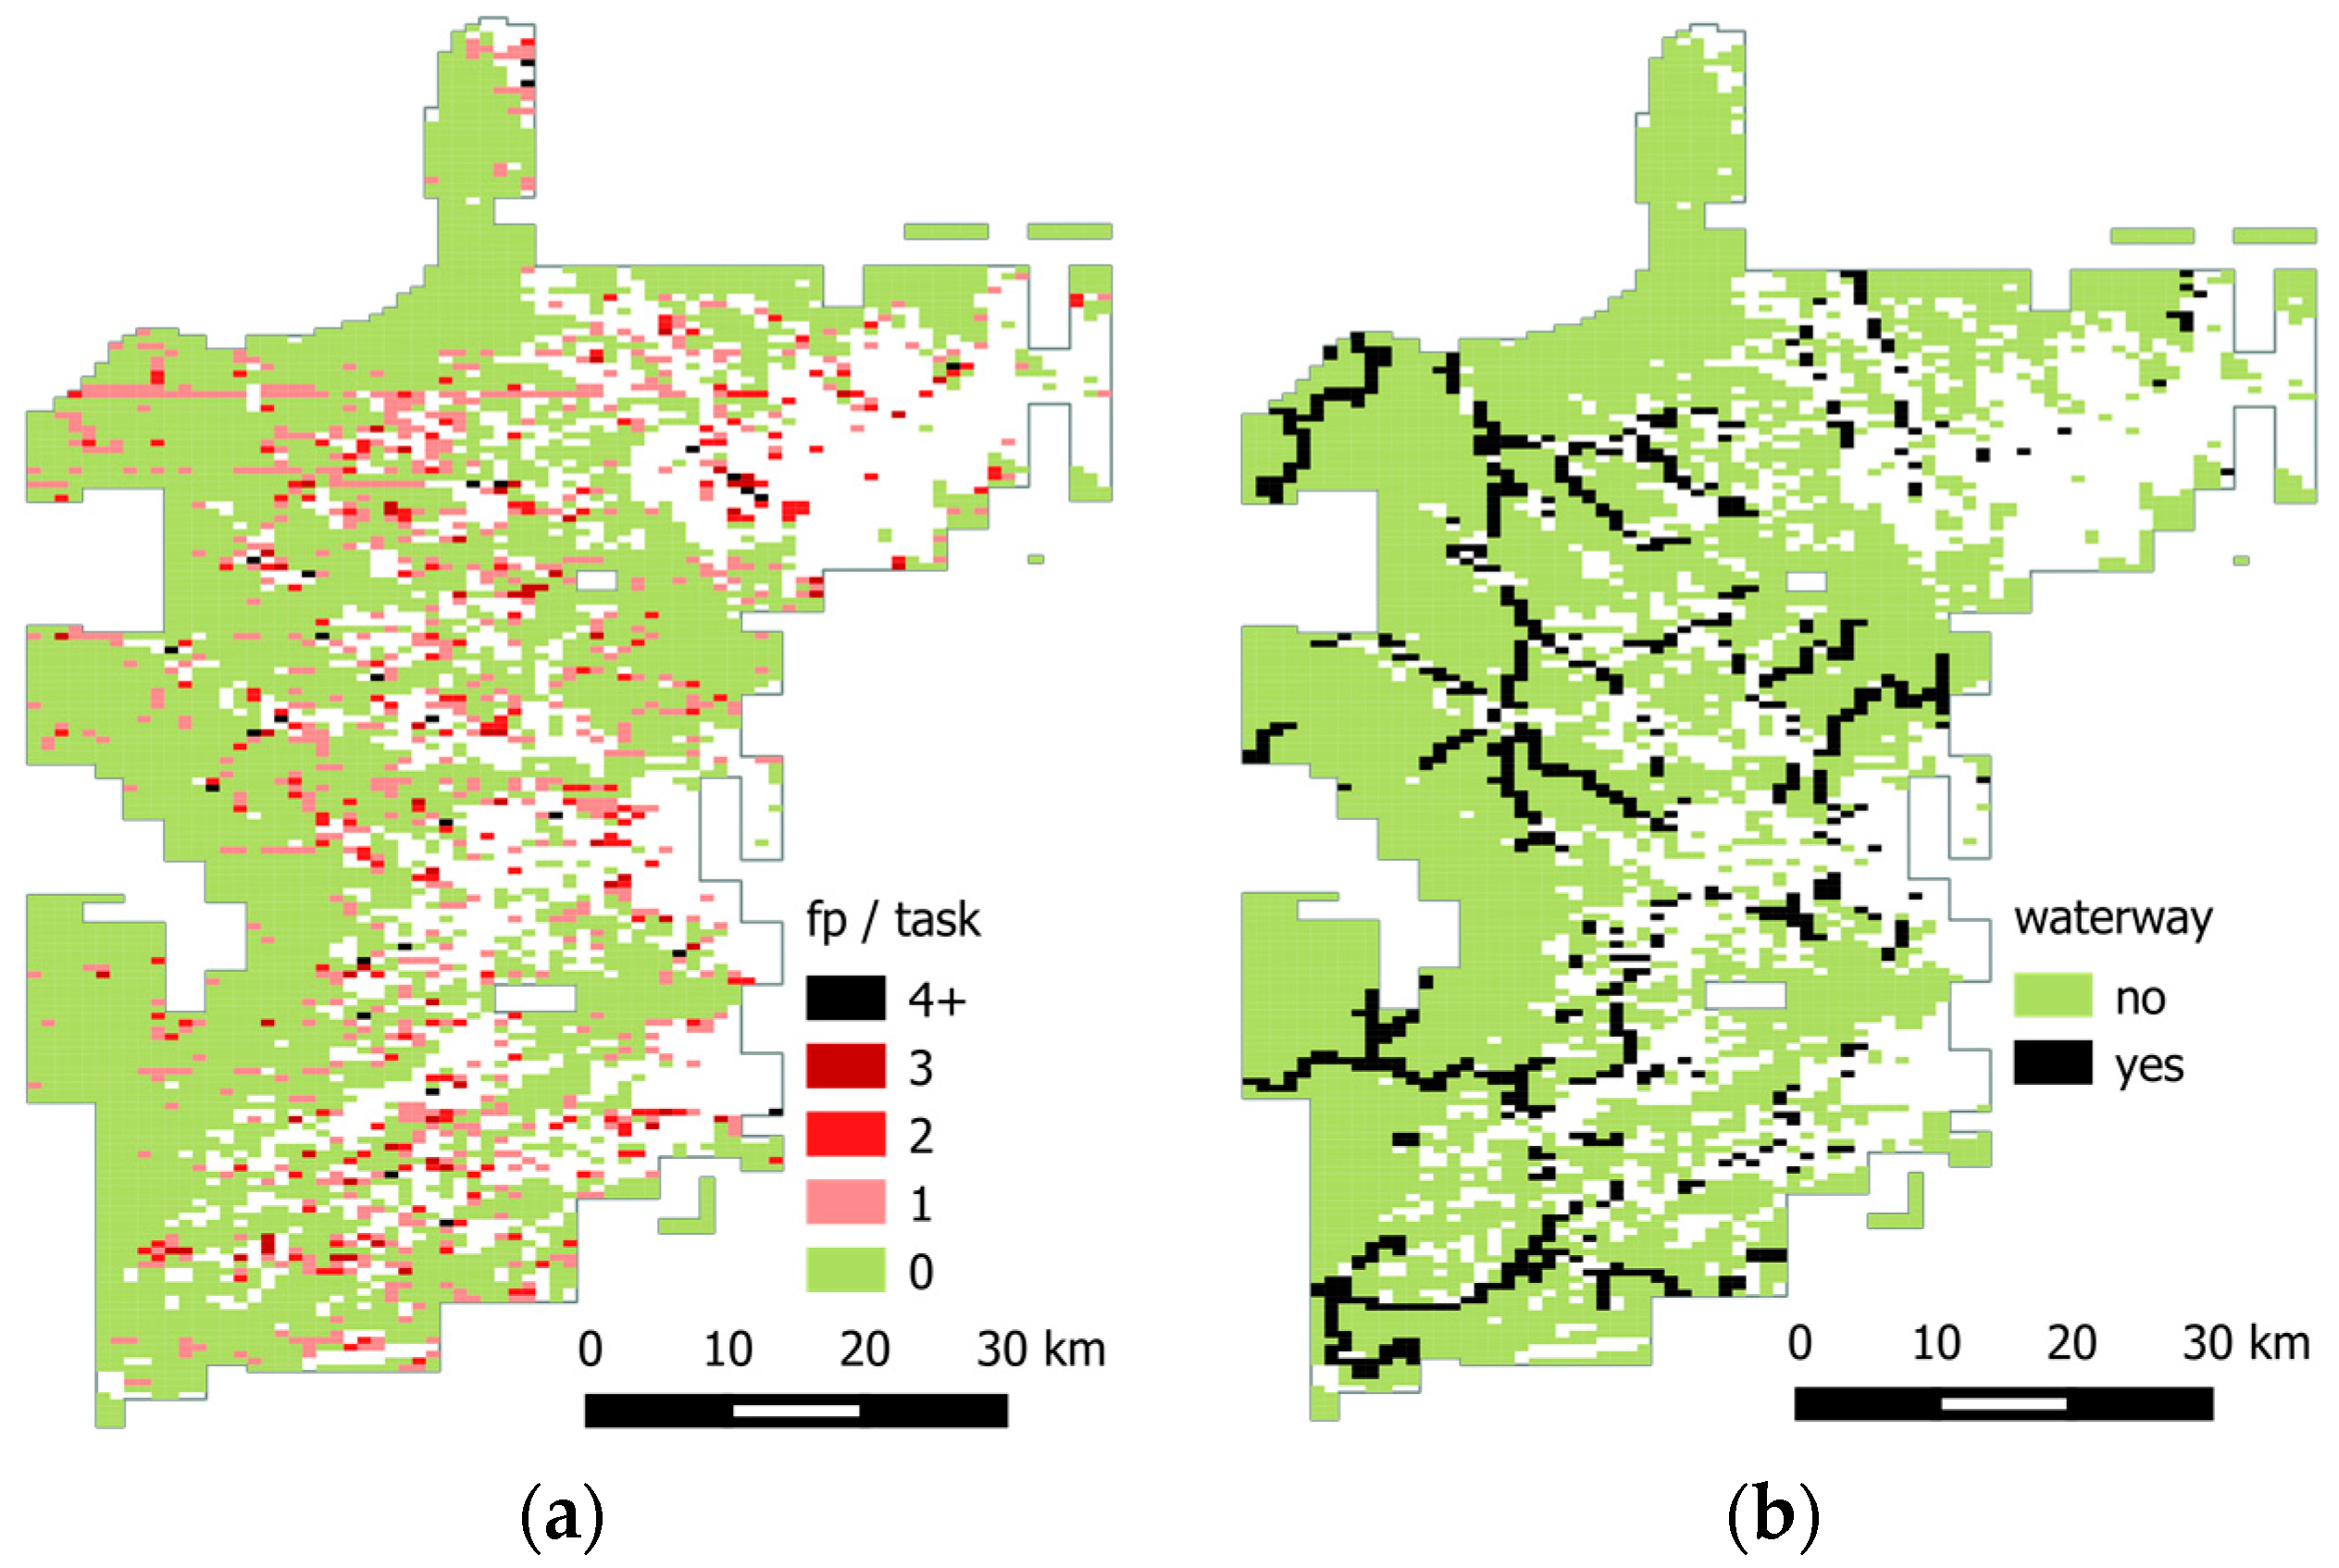
In our qualitative analysis, another geographic feature emerged as possibly associated with incorrect classifications: the existence of waterways, which can easily be mistaken for roads. In order to further investigate this association, Figure 13 shows the spatial distribution of all false positive features regarding their number of incorrect classifications and the spatial distribution of tasks containing waterways. The visual interpretation indicates a possible relation between the presence of waterways and misclassification. An investigation using Pearson’s chi-square independence test has confirmed that the hypothesis of independence between the existence of waterways and an incorrect classification result can be rejected (χ2(1) = 170.74, p < 0.0005).
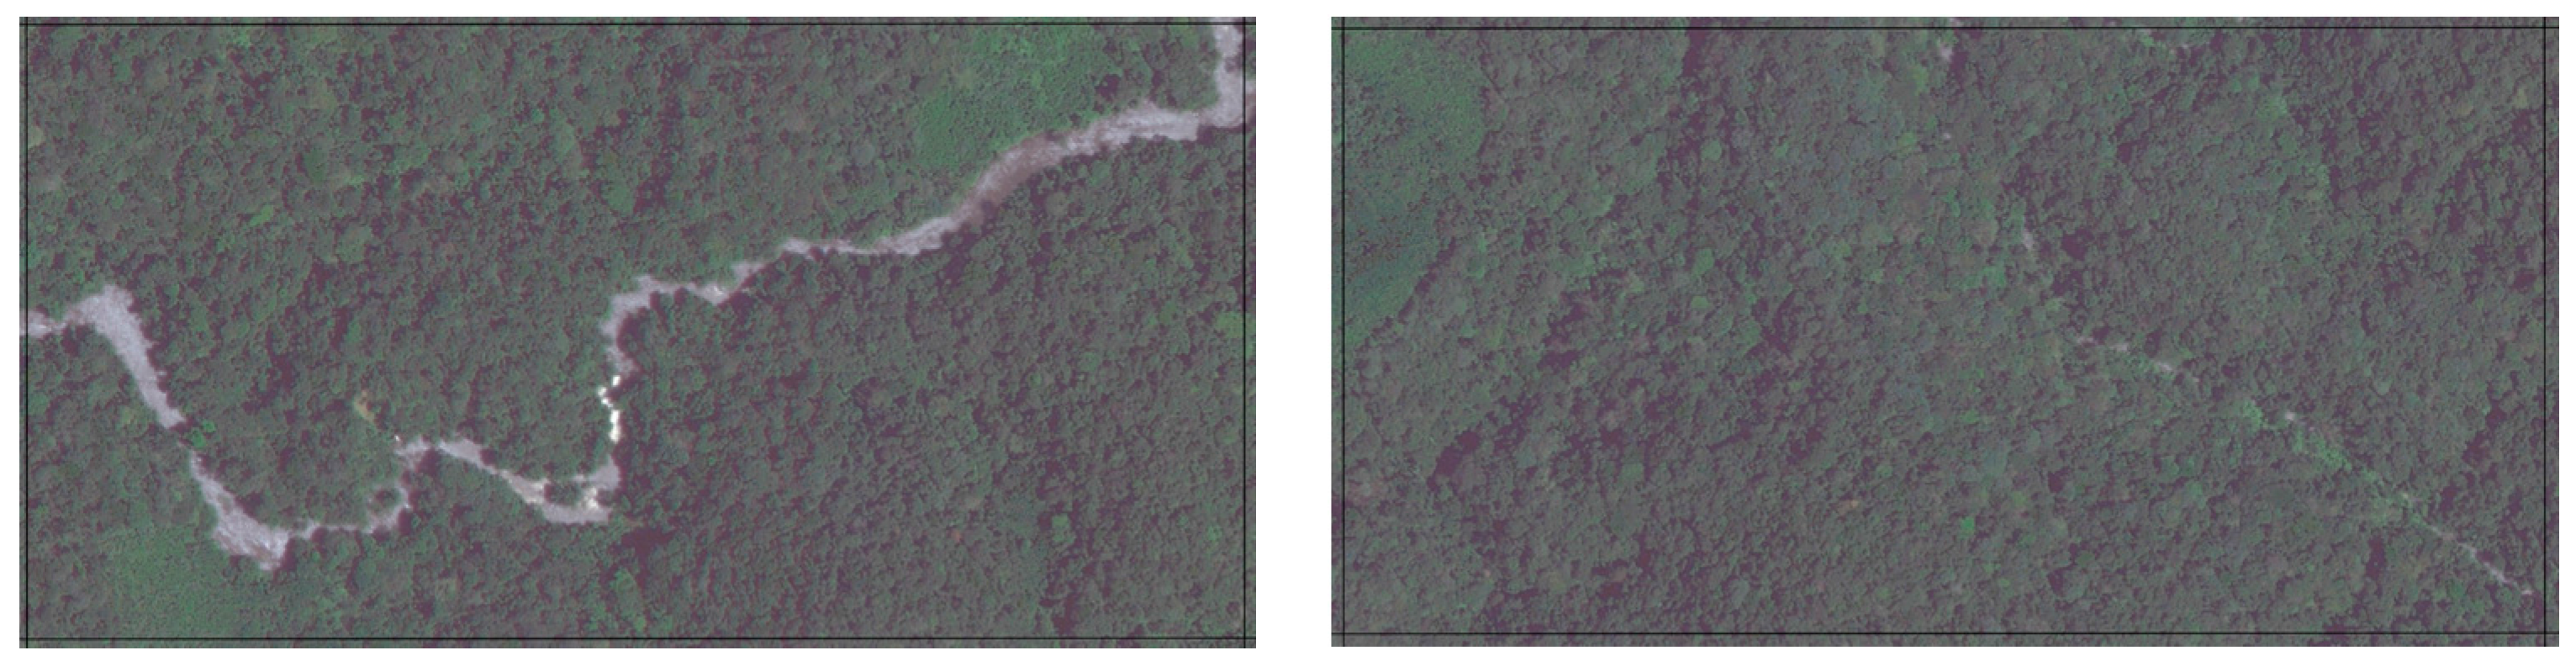
In the pursuit of qualitatively examining this issue, Figure 14 shows two examples of false positive tasks in which waterways were apparently misidentified as roads. Besides this, some bright spots in waterways have been mistaken by roofs of buildings due to cascades or water foam. Altogether, there are only a few tasks related to waterways in which the number of incorrect classifications per task is greater than three. This indicates that, despite the strong association, in general, the existence of waterways may constitute only a small factor for incorrect classifications.

4.3. Predictive Analysis of Crowdsourced Classification Results

The last step of our analysis consisted of fitting a logistic regression model with the identified factors (see Table 9 and Equation (6) in Section 4.3). The logistic regression model used all individual classifications performed by volunteers (n = 35,560) and was statistically significant with χ2(5) = 9443.632, p < 0.0005. The model explained 40.8% (Nagelkerke pseudo R2) of the variance in the classification performance and correctly classified 84.9% of the cases. In the Receiver Operating Characteristic (ROC) curve, the model achieved an AUC (Area Under Curve) of 89.7%. As expected, increases in the road length and settlement area contained in a tile were associated with a slight (albeit significant) increased likelihood of correct classification. More pronounced was the effect of agreement level: tasks with highest agreement (i.e., consensus) were 41 times more probable to be correctly classified than tasks with the lowest agreement within crowdsourced classifications. In contrast, tasks that did not contain objects were only slightly more likely to be correctly classified, whilst the influence of waterways was not found significant for the regression.

5. Discussion

The results of our case study show that the crowdsourced classification of satellite imagery can produce geographic information about human settlements with a high level of quality, achieving an accuracy of 89%, sensitivity of 73% and precision of 89%. These results are comparable to the performance of automated approaches to detect buildings from very high resolution remote sensing data, such as that proposed by Vakalopolou et al. [45], who achieved an average sensitivity of 80% and an average precision of 90%. Nevertheless, features smaller than approximately 250 m2 could not be detected using automated methods. Within our dataset such small features represent about 14% of all features. Furthermore, automated methods depend on large training data sets to be able to reach good results. The crowdsourcing approaches analysed in this paper can be used in the future to complement automated approaches both by generating initial training datasets and for tackling specific cases in which automated approaches do not perform well.
Whilst other studies [7,46] have already shown the influence of image resolution on the accuracy of crowdsourced classification, this study has shown that additional factors such as the size of geographic features are significantly associated with the likelihood of a correct classification by the volunteers. In this manner, our analysis is able to pinpoint “difficult cases” that require particular consideration and treatment, since they are not random but rather occur in a systematic way and can thus be systematically addressed. For instance, errors related to geographic features may be reduced by introducing targeted training for volunteers. If the structures of settlements and roads of an area are known in advance, this information can help volunteers to detect and identify the needed features more easily and thus prevent mistakes.
Furthermore, the measure we chose for assessing the agreement level of volunteers (Equation (5)) was shown to be a very good predictor of task difficulty and thus of the reliability of the resulting crowdsourced classification. With consensual volunteer responses being 41 times more likely to be correct. This is an important result, since the agreement level can be calculated exclusively on the basis of the agreement between pairs of volunteer responses (without resort to external reference data or expert validation). Therefore, the agreement level metric of Equation (5) seems to be a good candidate for use in future crowdsourcing projects as a quality index for the data produced by the volunteers. Moreover, this metric seems to work better than disagreement with majority: using an aggregation by simple majority, the correct classification for “difficult cases”, which can only be detected by few users, will be outvoted [20]. However, a systematic comparison with this and other alternative metrics for task difficulty should be performed in a variety of contexts to allow generalisation.
The analyses of the classification results also demonstrate a significant influence of the task design. Crowdsourcing tasks are usually designed by splitting up large areas into many small subtasks, i.e., a typical “divide et impera” approach. However, this fragmentation can lead to wrong classifications, since the volunteer loses thereby the overall context that is sometimes needed to correctly identify features (e.g., smaller roads that connect to a larger road network). Moreover, the splitting up of the tasks can cause features to be located towards the edges of the individual tasks and therefore become difficult to distinguish. To address these issues, one option is to make the areas in the immediate vicinity of the task edges visible and allow volunteers zooming out to consider the surrounding area.
A potential limitation of the workflow proposed in this paper is related to the reference dataset, which was derived using information from OpenStreetMap. As previous quality analyses of OpenStreetMap show (e.g., [47,48,49]), the completeness of OpenStreetMap data is heterogeneous, with some areas very well mapped, whilst other areas lacking basic objects. This suggests that OpenStreetMap may not be able to offer a complete reference data set for some areas. This could pose a threat to the validity of the performance results derived from our evaluation approach, for incomplete OpenStreetMap data would lead to an underestimation of false negatives. However, in our particular case study, the effects of this threat are minimised, since the Missing Maps project included specific tasks for digitisation of roads, residential areas and building footprints (see Section 3.1). These tasks were mapped and validated by experienced volunteers and thus can be expected to have achieved a high level of completeness. Nevertheless, the suitability of OpenStreetMap to provide reference data in future studies must be considered individually for the intended study areas.
Furthermore, the number and skills of contributing volunteers is a key factor to ensure the scalability of the crowdsourcing approach. Our case study replicates the findings of several other crowdsourced projects, in which a few highly motivated volunteers are responsible for accomplishing most of the crowdsourced tasks. Therefore, attracting more volunteers and encouraging them to spend more time solving the crowdsourcing tasks are crucial factors to be addressed by any future crowdsourced project. These limitations can be tackled by designing improved interaction mechanisms, such as the MapSwipe App [50], which was recently developed by Doctors without Borders/Médicin Sans Frontiers (MSF) within the Missing Maps Project and is built upon on the approach presented in this paper. This app addresses a larger volunteer base (currently counting with about 9000 volunteers) by making interaction convenient to volunteers, who may classify images from their mobile phones even when they are offline, and relies upon gamification mechanisms (e.g., badges and rankings) to foster motivation.

6. Conclusions

Future “smart” geo-crowdsourcing approaches should build upon the lessons learned in this paper to include and integrate strategies to differentiate between different types and levels of task difficulty that can be undertaken by volunteers in geographic information crowdsourcing. As proposed in this paper, classification is only the first and most basic step in the wider potential field of crowdsourcing approaches based on remotely sensed imagery. Based on our proposed typology, we can envisage more comprehensive crowdsourcing projects that implement a cyclical process with different task types. For instance, a project could start with classification tasks to identify important tiles in the imagery and then automatically use the data generated to create digitisation tasks. The results of crowdsourced digitisation could be, in turn, passed on to volunteers on the ground, who could enrich the digitised information with local knowledge by means of conflation tasks. This cyclical process is being partially used in practical initiatives such as the Missing Maps project reported here, but further automated support and smarter approaches to creating and assigning tasks are still needed, in particular for conflation tasks.
The crowdsourcing approaches analysed here thus bears the potential to generate geographic information for both larger and smaller human settlements, including even small, heterogeneous and inconsistent features that cannot be automatically detected and are often unavailable in official land use maps. Thus, geographic information crowdsourcing based on remotely sensed imagery could improve land use maps and provide high-resolution local data at the building/infrastructure level. This detailed information is an important requirement for risk assessment aimed at implementing disaster risk reduction strategies (e.g., early warning systems), but it is not generally available and is very costly to obtain, especially in developing countries [51]. Furthermore, such crowdsourcing approaches could also be used to support urban planning, by monitoring urbanisation processes and helping to estimate population concentrations in high spatial and temporal scales. Moreover, this approach can be of particular interest for humanitarian aid organisations to monitor informal or dynamic settlements, e.g., temporary camps of refugees or internally displaced persons, which are very volatile and not covered by other information sources [52].
Whilst the current study focused on a classification task and the influence of some geographic features on the performance of volunteers, future work could cover additional factors. In this paper, we did not collect or integrate further information regarding the individual skills and experience of volunteers, but this kind of information may have a significant influence on the classification results. In future projects, this information could be gathered by asking the volunteers to fill a survey or letting them go through a training data set before starting with the real tasks. Another aspect that was not covered in this study is the influence of quality of the satellite imagery provided, which can vary in different regions, applications and use cases. Therefore, this factor should be investigated in future studies.

Acknowledgments

The authors would like to thank the volunteers of the Humanitarian OpenStreetMap Team and the Missing Maps Project for their inspiring work, as well as the classification volunteers for their great help with the crowdsourcing tasks. JPA acknowledges financial support from CAPES (Grant No. 88887.091744/2014-01), the Deutsche Forschungsgemeinschaft and Ruprecht-Karls-Universität Heidelberg (Excellence Initiative II/Action 7). BH and ME are grateful to the HEiKA—Heidelberg Karlsruhe Research Partnership for partially supporting this research. The authors acknowledge the financial support of the Deutsche Forschungsgemeinschaft and Ruprecht-Karls-Universität Heidelberg within the funding programme Open Access Publishing.

Author Contributions

Joao Porto De Albuquerque and Benjamin Herfort conceived and designed the study. Benjamin Herfort performed the case study experiments. Joao Porto De Albuquerque, Benjamin Herfort and Melanie Eckle analysed the data. Joao Porto De Albuquerque interpreted the data and wrote the paper with contributions from Benjamin Herfort and Melanie Eckle.

Conflicts of Interest

The authors declare no conflict of interest.

References

  1. See, L.; Mooney, P.; Foody, G.; Bastin, L.; Comber, A.; Estima, J.; Fritz, S.; Kerle, N.; Jiang, B.; Laakso, M.; et al. Crowdsourcing, citizen science or volunteered geographic information? The current state of crowdsourced geographic information. ISPRS Int. J. Geo-Inf. 2016, 5. [Google Scholar] [CrossRef]
  2. De Albuquerque, J.P.; Herfort, B.; Brenning, A.; Zipf, A. A geographic approach for combining social media and authoritative data towards identifying useful information for disaster management. Int. J. Geogr. Inf. Sci. 2015, 29, 1–23. [Google Scholar] [CrossRef]
  3. Jokar Arsanjani, J.; Zipf, A.; Mooney, P.; Helbich, M. OpenStreetMap in GIScience; Springer International Publishing: Basel, Switzerland, 2015. [Google Scholar]
  4. Haklay, M. Citizen science and volunteered geographic information: Overview and typology of participation. In Crowdsourcing Geographic Knowledge; Sui, D., Elwood, S., Goodchild, M., Eds.; Springer: Dordrecht, The Netherlands, 2013; pp. 105–122. [Google Scholar]
  5. Meier, P. Human computation for disaster response. In Handbook of Human Computation; Michelucci, P., Ed.; Springer: New York, NY, USA, 2013; pp. 95–104. [Google Scholar]
  6. Kerle, N. Remote sensing based post-disaster damage mapping with collaborative methods. In Intelligent Systems for Crisis Management; Zlatanova, S., Peters, R., Dilo, A., Scholten, H., Eds.; Springer: Berlin/Heidelberg, Germany, 2013; pp. 121–133. [Google Scholar]
  7. See, L.; Comber, A.; Salk, C.; Fritz, S.; van der Velde, M.; Perger, C.; Schill, C.; McCallum, I.; Kraxner, F.; Obersteiner, M. Comparing the quality of crowdsourced data contributed by expert and non-experts. PLoS ONE 2013, 8. [Google Scholar] [CrossRef] [PubMed]
  8. Eckle, M.; Porto de Albuquerque, J. Quality assessment of remote mapping in OpenStreetMap for disaster management purposes. In Proceedings of the ISCRAM 2015 Conference, Kristiansand, Norway, 24–27 May 2015.
  9. Hillen, F.; Höfle, B. Geo-reCAPTCHA: Crowdsourcing large amounts of geographic information from earth observation data. Int. J. Appl. Earth Obs. Geoinf. 2015, 40, 29–38. [Google Scholar] [CrossRef]
  10. Kerle, N.; Hoffman, R.R. Collaborative damage mapping for emergency response: The role of Cognitive Systems Engineering. Nat. Hazards Earth Syst. Sci. 2013, 13, 97–113. [Google Scholar] [CrossRef]
  11. Westrope, C.; Banick, R.; Levine, M. Groundtruthing OpenStreetMap building damage assessment. Procedia Eng. 2014, 78, 29–39. [Google Scholar] [CrossRef]
  12. Schelhorn, S.J.; Herfort, B.; Leiner, R.; Zipf, A.; de Albuquerque, J.P. Identifying elements at risk from OpenStreetMap: The case of flooding. In Proceedings of the 11th International ISCRAM Conference; Hiltz, S.R., Pfaff, M.S., Plotnick, L., Shih, P.C., Eds.; ISCRAM: University Park, PA, USA, 2014; pp. 508–512. [Google Scholar]
  13. Herfort, B.; Eckle, M.; de Albuquerque, J.P.; de Zipf, A. Towards assessing the quality of volunteered geographic information from OpenStreetMap for identifying critical infrastructures. In Proceedings of the ISCRAM 2015 Conference, Kristiansand, Norway, 24–27 May 2015.
  14. Eckle, M.; de Albuquerque, J.P.; Herfort, B.; Leiner, R.; Jacobs, C.; Zipf, A. Leveraging OpenStreetMap to support flood risk management in municipalities : A prototype decision support system. In Proceedings of the ISCRAM 2016 Conference, Rio de Janeiro, Brazil, 22–25 May 2016.
  15. Voigt, S.; Schoepfer, E.; Fourie, C.; Mager, A. Towards semi-automated satellite mapping for humanitarian situational awareness. In Proceedings of the IEEE Global Humanitarian Technology Conference (GHTC 2014), San Jose, CA, USA, 10–13 October 2014; pp. 412–416.
  16. Chan, J.; Crowley, J.; Elhami, S.; Erle, S.; Munro, R.; Schnoebelen, T. Aerial Damage Assessment Following Hurricane Sandy. Available online: http://www.giscorps.org/index.php?option=com_content&task=view&id=135&Itemid=59 (accessed on 18 October 2016).
  17. Vieweg, S.; Castillo, C.; Imran, M. Integrating social media communications into the rapid assessment of sudden onset disasters. Soc. Inform. 2014, 8851, 444–461. [Google Scholar]
  18. Imran, M.; Castillo, C.; Lucas, J.; Meier, P.; Rogstadius, J. Coordinating human and machine intelligence to classify microblog communications in crises. In Proceedings of the 11th International ISCRAM Conference, University Park, PA, USA, 18–21 May 2014.
  19. Ostermann, F. Hybrid geo-information processing : Crowdsourced supervision of geo - spatial machine learning tasks. In Proceedings of the 18th AGILE International Conference on Geographic Information Science, Lisbon, Portugal, 9–12 June 2015; p. 4.
  20. Salk, C.F.; Sturn, T.; See, L.; Fritz, S. Limitations of majority agreement in crowdsourced image interpretation. Trans. GIS 2016. [Google Scholar] [CrossRef]
  21. Barrington, L.; Ghosh, S.; Greene, M.; Har-Noy, S.; Berger, J.; Gill, S.; Lin, A.Y.M.; Huyck, C. Crowdsourcing earthquake damage assessment using remote sensing imagery. Ann. Geophys. 2011, 54, 680–687. [Google Scholar]
  22. Arcanjo, J.S.; Luz, E.F.P.; Fazenda, Á.L.; Ramos, F.M. Methods for evaluating volunteers’ contributions in a deforestation detection citizen science project. Future Gener. Comput. Syst. 2016, 56, 550–557. [Google Scholar] [CrossRef]
  23. Anhorn, J.; Herfort, B.; Porto de Albuquerque, J. Crowdsourced validation and updating of dynamic features in OpenStreetMap an analysis of shelter mapping after the 2015 Nepal earthquake. In Proceedings of the ISCRAM 2016 Conference, Rio de Janeiro, Brazil, 22–25 May 2016.
  24. Soden, R.; Budhathoki, N.; Palen, L. Resilience-building and the crisis informatics Agenda: Lessons learned from open cities Kathmandu. In Proceedings of the 11th International ISCRAM Conference, University Park, PA, USA, 18–21 May 2014; pp. 1–10.
  25. Fritz, S.; McCallum, I.; Schill, C.; Perger, C.; Grillmayer, R.; Achard, F.; Kraxner, F.; Obersteiner, M. Geo-wiki.ORG: The use of crowdsourcing to improve global land cover. Remote Sens. 2009, 1, 345–354. [Google Scholar] [CrossRef]
  26. Tomnod. Available online: http://www.tomnod.com/campaign/campaign_1230/question/156989 (accessed on 19 July 2016).
  27. Lue, E.; Wilson, J.P.; Curtis, A. Conducting disaster damage assessments with Spatial Video, experts, and citizens. Appl. Geogr. 2014, 52, 46–54. [Google Scholar] [CrossRef]
  28. Blaschke, T. Object based image analysis for remote sensing. ISPRS J. Photogramm. Remote Sens. 2010, 65, 2–16. [Google Scholar] [CrossRef]
  29. HOT Tasking Manager. Available online: http://tasks.hotosm.org (accessed on 27 July 2016).
  30. Saalfeld, A. Conflation Automated map compilation. Int. J. Geogr. Inf. Syst. 1988, 2, 217–228. [Google Scholar] [CrossRef]
  31. Samal, A.; Seth, S.; Cueto, K. A feature-based approach to conflation of geospatial sources. Int. J. Geogr. Inf. Sci. 2004, 18, 459–489. [Google Scholar] [CrossRef]
  32. Longley, P.A.; Goodchild, M.F.; Maguire, D.J.; Rhind, D.W. Geographic Information Systems and Science; Wiley: London, UK, 2001. [Google Scholar]
  33. Blodgett, D.L.; Booth, N.L.; Kunicki, T.C.; Walker, J.I.; Viger, R.J. Description and Testing of the Geo Data Portal: A Data Integration Framework and Web Processing Services for Environmental Science Collaboration; USGS: Reston, VA, USA, 2011; p. 18. [Google Scholar]
  34. Bleiholder, J.; Naumann, F. Data fusion. ACM Comput. Surv. 2008, 41, 1–41. [Google Scholar] [CrossRef]
  35. Ruiz, J. J.; Ariza, F.J.; Ureña, M.A.; Blázquez, E.B. Digital map conflation: A review of the process and a proposal for classification. Int. J. Geogr. Inf. Sci. 2011, 25, 1439–1466. [Google Scholar] [CrossRef]
  36. Schnebele, E.; Cervone, G.; Waters, N. Road assessment after flood events using non-authoritative data. Nat. Hazards Earth Syst. Sci. 2014, 14, 1007–1015. [Google Scholar] [CrossRef]
  37. Singh, A. Review article digital change detection techniques using remotely-sensed data. Int. J. Remote Sens. 1989, 10, 989–1003. [Google Scholar] [CrossRef]
  38. The American Red Cross. Case Study: Lessons Learned from Community Mapping in Urban and Rural Areas in East Africa and Bangladesh; American Red Cross: Washington, DC, USA, 2015; pp. 1–6. [Google Scholar]
  39. Missing Maps. Available online: http://www.missingmaps.org (accessed on 18 October 2016).
  40. Linard, C.; Gilbert, M.; Snow, R.W.; Noor, A.M.; Tatem, A.J. Population distribution, settlement patterns and accessibility across Africa in 2010. PLoS ONE 2012, 7. [Google Scholar] [CrossRef] [PubMed]
  41. Poiani, T.H.; Rocha, R.d.S.; Degrossi, L.C.; de Albuquerque, J.P. Potential of Collaborative Mapping for Disaster Relief: A Case Study of OpenStreetMap in the Nepal Earthquake 2015. In Proceedings of the 2016 49th Hawaii International Conference on System Sciences (HICSS), Washington, DC, USA, 5 January 2016; pp. 188–197.
  42. Palen, L.; Soden, R.; Anderson, T.J.; Barrenechea, M. Success & scale in a data-producing organization: The socio-technical evolution of OpenStreetMap in response to humanitarian events. In Proceedings of the 33rd Annual ACM Conference on Human Factors in Computing Systems—CHI ’15, Seoul, Korea, 18–23 April 2015; ACM Press: New York, NY, USA, 2015; pp. 4113–4122. [Google Scholar]
  43. Geofabrik OpenStreetMap Data Extracts. Available online: http://download.geofabrik.de/ (accessed on 18 October 2016).
  44. Fleiss, J.L. Measuring nominal scale agreement among many raters 1. 1971, 76, 378–382. [Google Scholar] [CrossRef]
  45. Vakalopoulou, M.; Karantzalos, K.; Komodakis, N.; Paragios, N. Building detection in very high resolution multispectral data with deep learning features. In Proceedings of the 2015 IEEE International Geoscience and Remote Sensing Symposium (IGARSS), Milan, Italy, 26–31 July 2015; pp. 1873–1876.
  46. Battersby, S.E.; Hodgson, M.E.; Wang, J. Spatial resolution imagery requirements for identifying structure damage in a hurricane disaster: A cognitive approach. Photogramm. Eng. Remote Sens. 2012, 78, 625–635. [Google Scholar] [CrossRef]
  47. Arsanjani, J.J.; Fonte, C.C. On the Contribution of Volunteered Geographic Information to Land Monitoring Efforts. In European Handbook of Crowdsourced Geographic Information; Capineri, C., Haklay, M., Huang, H., Antoniou, V., Kettunen, J., Ostermann, F., Purves, R., Eds.; Ubiquity Press: London, UK, 2016; pp. 269–284. [Google Scholar]
  48. Neis, P.; Zielstra, D.; Zipf, A. The street network evolution of crowdsourced maps: OpenStreetMap in Germany 2007–2011. Future Internet 2011, 4, 1–21. [Google Scholar] [CrossRef]
  49. Hecht, R.; Kunze, C.; Hahmann, S. Measuring completeness of building footprints in OpenStreetMap over space and time. ISPRS Int. J. Geo-Inf. 2013, 2, 1066–1091. [Google Scholar] [CrossRef]
  50. Map Swipe. Available online: http://mapswipe.org (accessed on 27 July 2016).
  51. Phillips, E.; Murnane, R.; Ali, A. Solving the Puzzle: Innovating to Reduce Risk; GFDRR: Washington, DC, USA, 2016. [Google Scholar]
  52. Pesaresi, M.; Huadong, G.; Blaes, X.; Ehrlich, D.; Ferri, S.; Gueguen, L.; Halkia, M.; Kauffmann, M.; Kemper, T.; Lu, L.; et al. A global human settlement layer from optical HR/VHR RS data: Concept and first results. IEEE J. Sel. Top. Appl. Earth Obs. Remote Sens. 2013, 6, 2102–2131. [Google Scholar] [CrossRef]
Figure 1. Tomnod platform for classification tasks in Ethiopia. Volunteers are showed an image and should indicate whether they identified buildings in the highlighted area [26].
Remotesensing 08 00859 g001
Figure 2. The Humanitarian OpenStreetMap Team Tasking Manager [29] is the crowdsourcing tool used to coordinate the simultaneous digitisation efforts of thousands of volunteers worldwide. It presents instructions for volunteers and asks them to select a square to map. By doing this, the selected region is opened for mapping in one of the OpenStreetMap editors.
Remotesensing 08 00859 g002
Figure 3. PyBossa crowdsourcing tool configured to present conflation tasks aimed at updating and validating shelters mapped after the 2015 Nepal Earthquake. On the (a) side of the image, a more recent image is shown, whereas on the (b) side, the reference image used for mapping is presented. The overlaid blue polygon is a mapped shelter object that comes from the OpenStreetMap database. Volunteers should analyse the three data sources to check if the shelters mapped before are still valid. Source: Anhorn et al. (2016) [23].
Remotesensing 08 00859 g003
Figure 4. Overview of the methodological workflow of this paper.
Remotesensing 08 00859 g004
Figure 5. Web user interface of the crowdsourced classification task.
Remotesensing 08 00859 g005
Figure 6. Contributions per volunteer.
Remotesensing 08 00859 g006
Figure 7. Task difficulty: (a) tasks without object have a higher share of correct classifications; and (b) a conditional density plot that confirms that tasks with higher number of misclassifications are more probable to contain objects.
Remotesensing 08 00859 g007
Figure 8. Distribution of user agreement in tasks: (a) tasks without object have a higher share of consensual classifications; and (b) a conditional density plot that confirms that classifications with higher agreement are more probable to contain no objects.
Remotesensing 08 00859 g008
Figure 9. Violin plot showing the distribution of agreement level of tasks according to the classification result.
Remotesensing 08 00859 g009
Figure 10. Spatial distribution of number of false negatives, road length and settlement area: (a) number of false negatives/task; (b) road length; and (c) settlement area.
Remotesensing 08 00859 g010
Figure 11. Violin plots showing the distribution of road length (a) and settlement area (b) according to classification results (both log transformed).
Remotesensing 08 00859 g011
Figure 12. Examples of “difficult cases”: (a) isolated settlement containing only a few buildings; (b) a road that appears amidst forest areas; (c) image partially covered by clouds; (d) a settlement that is split into two different tasks.
Remotesensing 08 00859 g012
Figure 13. Spatial distribution of false positives per task and of waterways: (a) number of false positives/task; and (b) waterways.
Remotesensing 08 00859 g013
Figure 14. Examples of tiles containing waterways that were incorrectly classified by volunteers.
Remotesensing 08 00859 g014
Table 1. Types of tasks in geographic information crowdsourcing.
TypesDescriptionNumber of Data SourcesSpatial Cognitive ComplexityExamples in the Extant Literature
I. ClassificationThe process of assigning predefined attributes (values/categories) to existing geographical informationsinglelow[16,17,18,19,20]
II. DigitisationThe process of creating new digital geographic objects based on existing geographic information.singlemedium[9,21,22]
III. ConflationThe process of integrating existing geographic information representing the same real-world object into a consistent digital representation.multiplehigh[23,24,25]
Table 2. Crowdsourcing Tasks in the Map South Kivu Project.
TypesTasksInput dataCrowdsourcing Tool
I. Classification1.1 assessment of information availability in imagerysatellite imageryPyBossa
1.2 assessment of inhabited areassatellite imagery, imagery availability rasterPyBossa
II. Digitisation2.1 digitisation of roads and residential areassatellite imagery, (inhabited area raster)OSM Tasking Manager
2.2 Digitisation of building footprintssatellite imagery, residential area featuresOSM Tasking Manager
III. Conflation2.3 merging data captured in the field OSM, Field Papers
2.4 adding village namesOSM features, Field Papers, GPS tracks-
2.5 adding attributes to buildings and highwaysOSM features, Field Papers, GPS tracks-
Table 3. Classification aggregation methods.
MethodCriteriaAggregated Result
(1) positive consensusall “yes”“yes”
≥1 × “no”“no”
(2) majority, tie is “no”“yes” > “no”“yes”
“no” ≥ “yes”“no”
(3) majority, tie is “yes”“yes” ≥ “no”“yes”
“no” > “yes”“no”
(4) negative consensus≥1 × “yes”“yes”
all “no”“no”
Table 4. Confusion table of classification result and reference dataset.
Reference Dataset
“yes”“no”
crowdsourced classification“yes”correct: true positive (tp)wrong: false positive (fp)
“no”wrong: false negative (fn)correct: true negative (tn)
Table 5. Overview of the analysed factors.
FactorVariableUnit
road lengthR[km]
settlement areaS[m2]
waterway existenceW“yes” (1), “no” (0)
agreement levelA<0.5 (low), 0.5 < 1.0 (high), 1.0 (consensus)
Object existenceO“yes” (1), “no” (0)
Table 6. Overall classification results.
Reference Dataset
“yes”“no”Total
classification result“yes”684915198368
“no”382623,36627,192
total10,675 (2494 tasks)24,885 (5797 tasks)
Table 7. Classification performance metrics.
Aggregation MethodAccuracySensitivityPrecisionf1
aggregated per task (n = 8291)
(1) positive consensus0.800.350.990.52
(2) majority, tie is “no”0.870.610.930.74
(3) majority, tie is “yes”0.890.730.890.80
(4) negative consensus0.700.910.500.65
Table 8. Overview of statistical measures for different levels of agreement.
AccuracySensitivityPrecisionf1
agreement level
(1) consensus (n = 5877)0.950.760.990.86
(2) high (n = 1689)0.770.610.910.73
(3) low (n = 725)0.690.850.710.78
Table 9. Logistic regression analysis for the model L o g i t ( P i ) = a + b R i +   c S i +   d A i +   e W i + f O i , where the variables correspond to the factors listed in Table 5 (i.e., road length, settlement area, waterways, agreement level and the existence of objects) and P i is the probability that the task is correctly classified.
CoefficientsStandard ErrorSignificanceOdds Ratio
Road length0.0010.0000.0 ***1.001
Settlement Area (square rooted)0.0180.0010.0 ***1.018
Agreement level3.7190.0720.0 ***41.227
Waterway (existence)−0.0870.0450.0530.916
Object (existence)−2.4330.0480.0 ***0.088
*** = means a p-value < 0.0005.

