
Quality Assessment of S-NPP VIIRS Land Surface Temperature Product


Abstract
:
1. Introduction
2. Data
2.1. VIIRS LST EDR
2.2. Reference Data
2.2.1. MODIS LST Product
2.2.2. AATSR LST Product
2.2.3. SURFRAD Ground Observations

| No. | Site Location | Station Acronyms | Lat(N)/Lon(W) | Surface Type |
|---|---|---|---|---|
| 1 | Bondville, IL | BON | 40.05/88.37 | Crop Land |
| 2 | Fort Peck, MT | FPT | 48.31/105.10 | Grass Land |
| 3 | Goodwin Creek, MS | GWN | 34.25/89.87 | Grassland |
| 4 | Table Mountain, CO | TBL | 40.13/105.24 | Grass/Crop Land |
| 5 | Desert Rock, NV | DRA | 36.63/116.02 | Shrub Land |
| 6 | Pennsylvania State University, PA | PSU | 40.72/77.93 | Mixed Forest |
| 7 | Sioux Falls, SD | SFX | 43.73/97.49 | Cropland |
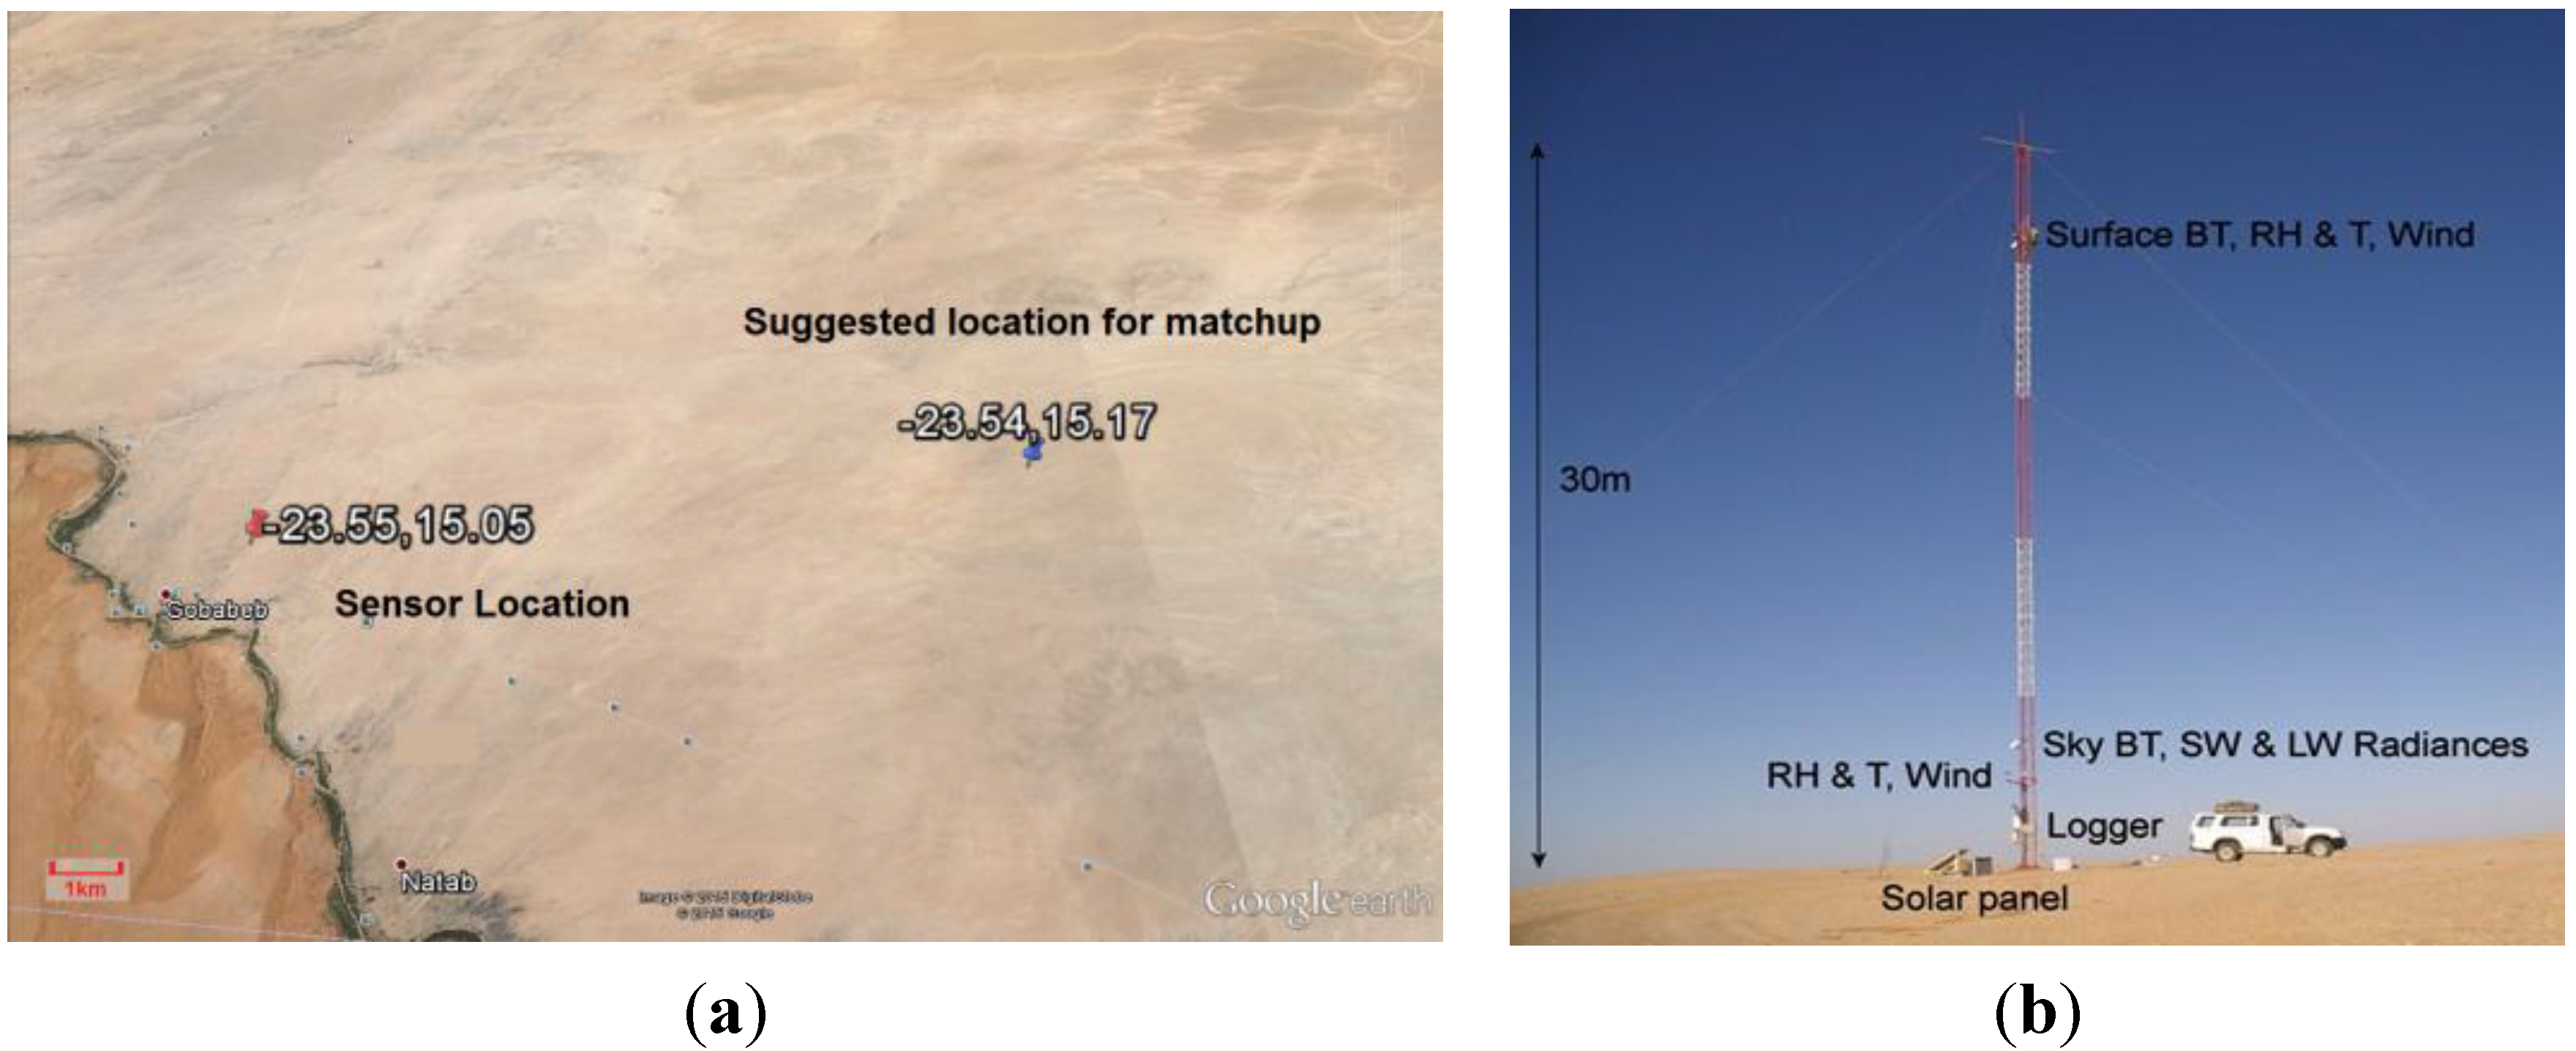
2.2.4. Ground Observation at Gobabeb, Namibia

2.3. Quality Control Procedures
- (1)
- Ground data quality control
- (2)
- Satellite data quality control
- (3)
- Match up process
3. LST Assessment Methodology
3.1. T-Based Validation Method
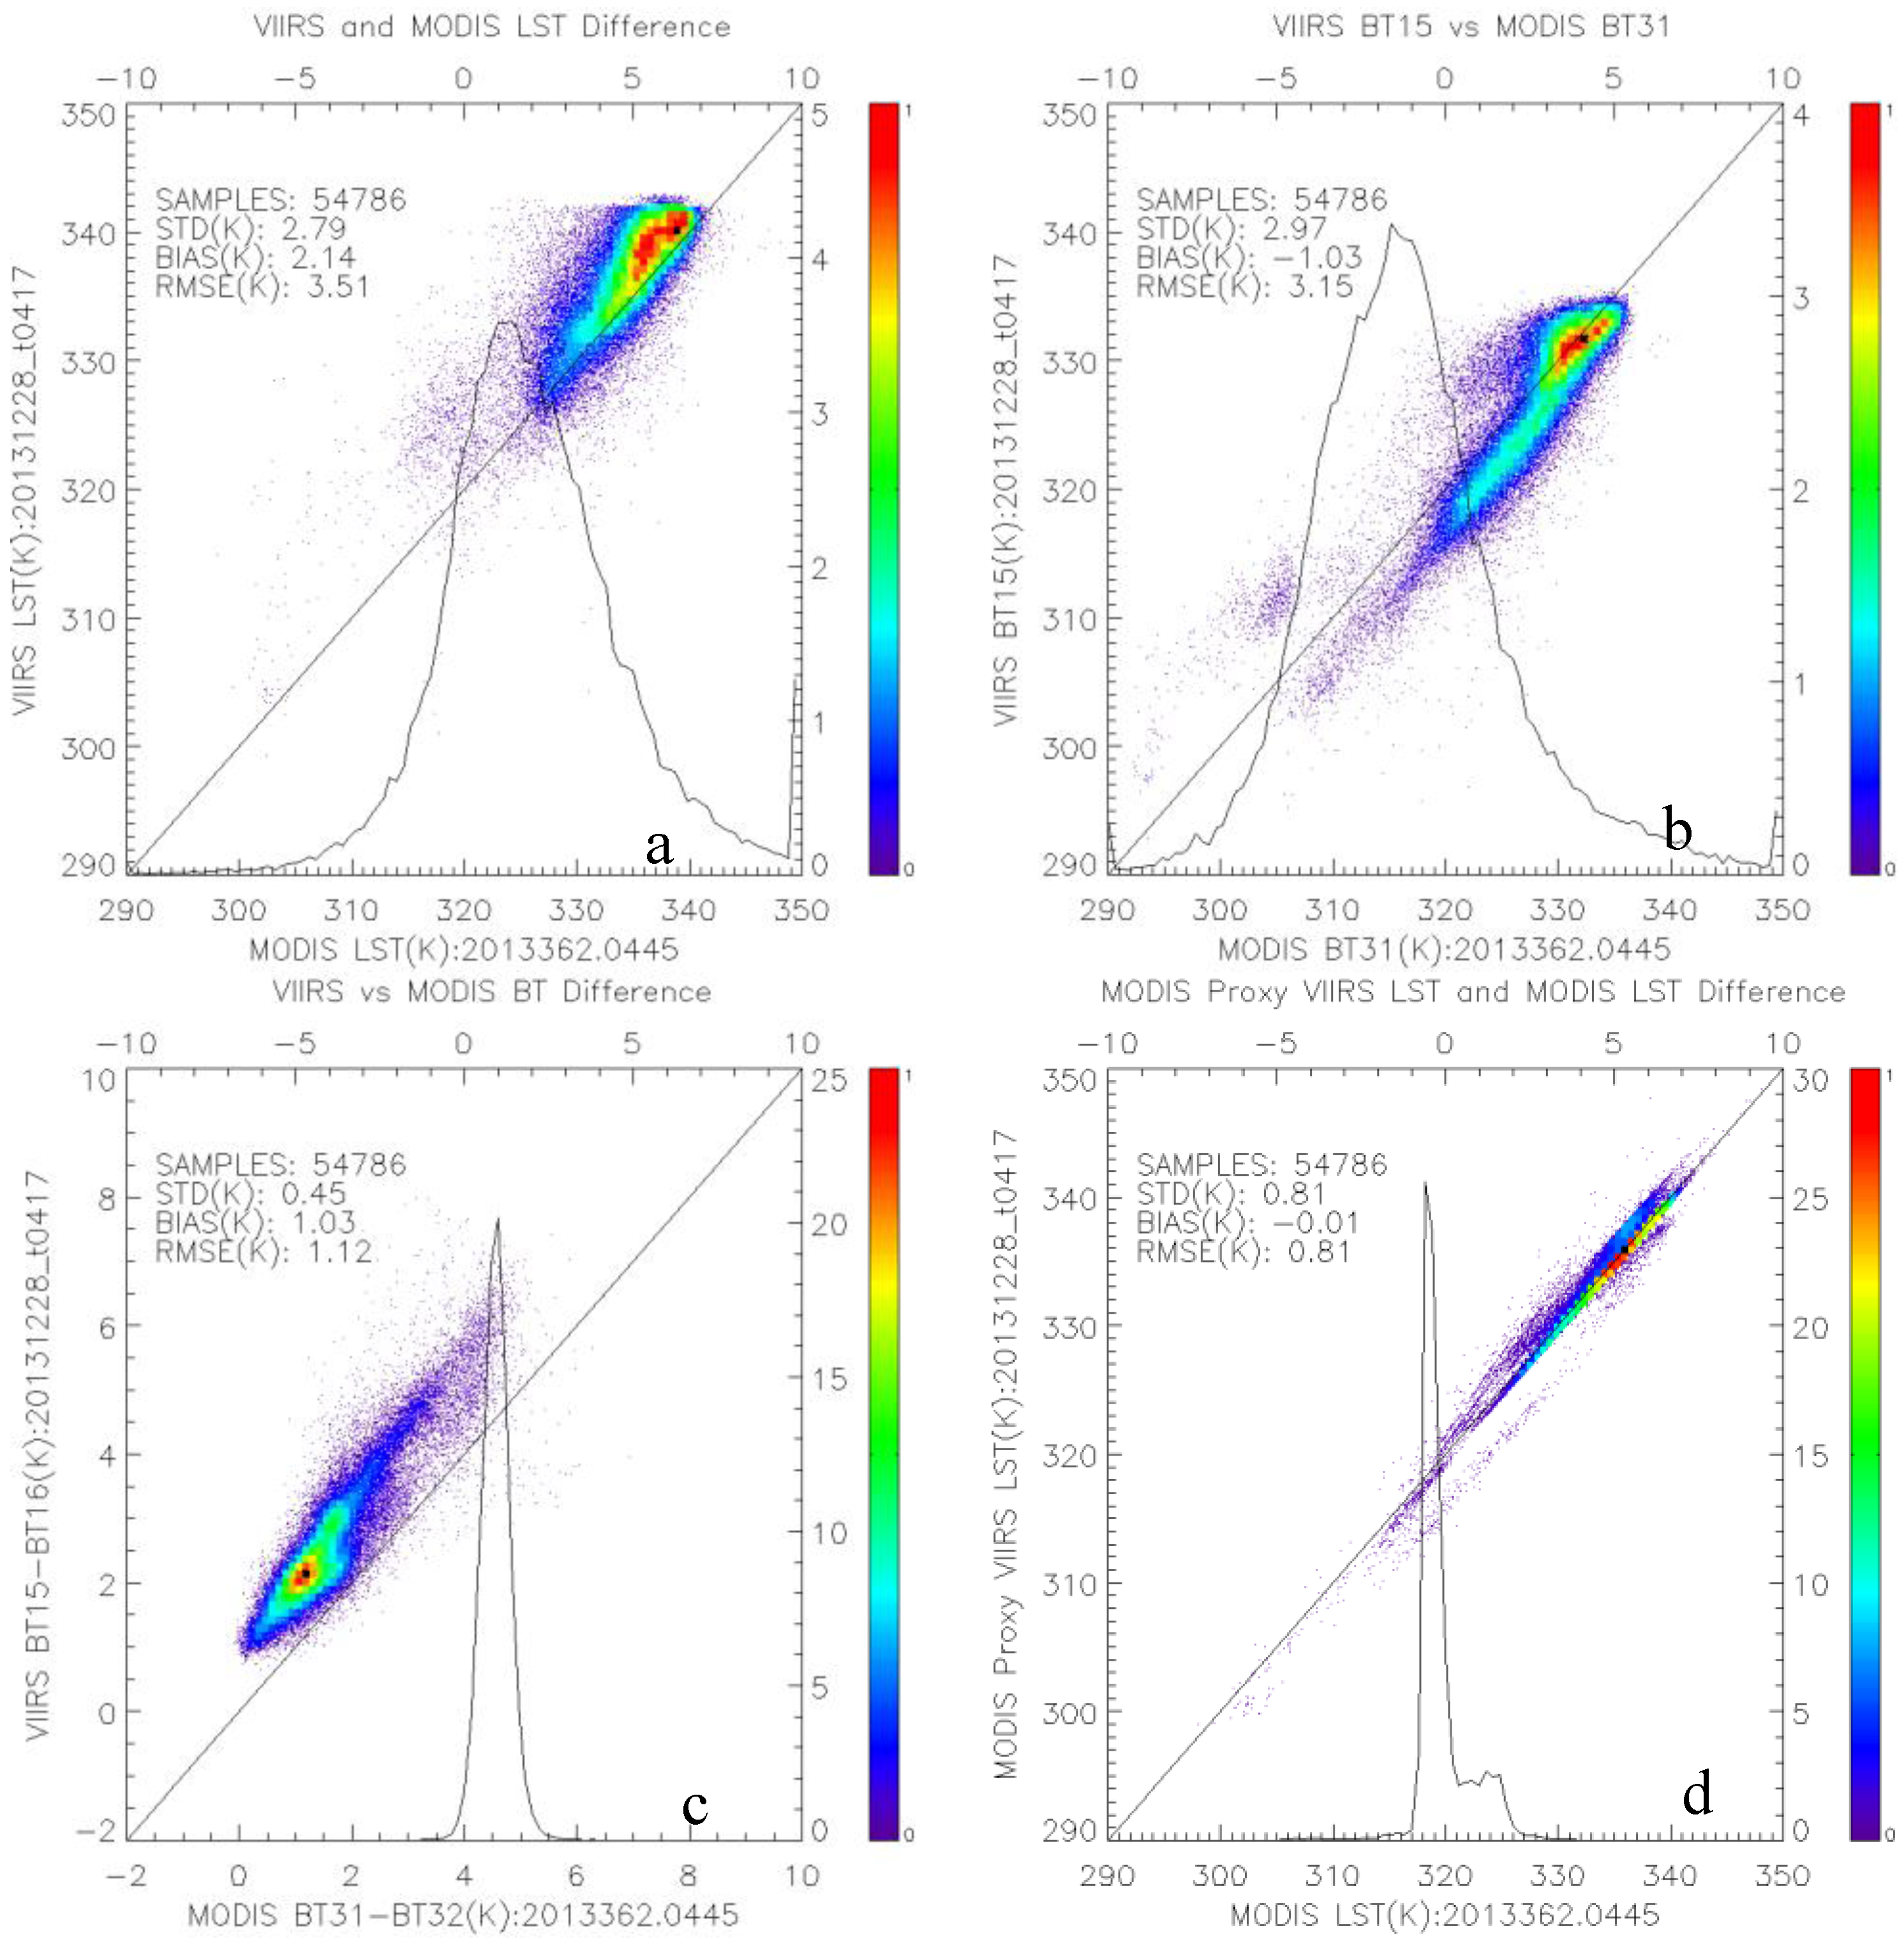
3.2. Cross Satellite Comparison Method
3.3. VIIRS LST Uncertainty to Input Imprecision
| No. | IGBP Land Surface Type | Percentage |
|---|---|---|
| 1 | Evergreen Needle Leaf Forests | 1.91 |
| 2 | Evergreen Broadleaf Forests | 9.25 |
| 3 | Deciduous Needle leaf Forests | 1.17 |
| 4 | Deciduous Broadleaf Forests | 0.78 |
| 5 | Mixed Forests | 5.85 |
| 6 | Closed Shrub Lands | 0.06 |
| 7 | Open Shrub Lands | 15.18 |
| 8 | Woody Savannahs | 8.16 |
| 9 | Savannahs | 8.13 |
| 10 | Grasslands | 8.45 |
| 11 | Permanent Wetlands | 0.87 |
| 12 | Croplands | 7.25 |
| 13 | Urban build-up | 0.39 |
| 14 | Croplands/Natural Vegetation Mosaics | 4.11 |
| 15 | Snow ice | 10.46 |
| 16 | Barren | 12.54 |
| 17 | Water Bodies | 5.45 |
4. Results
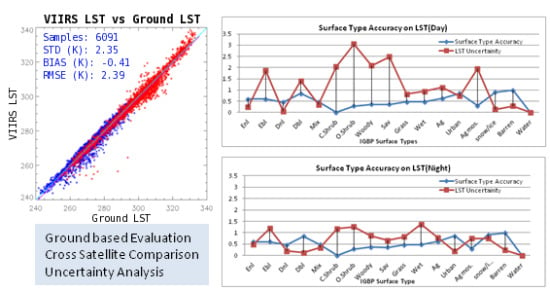
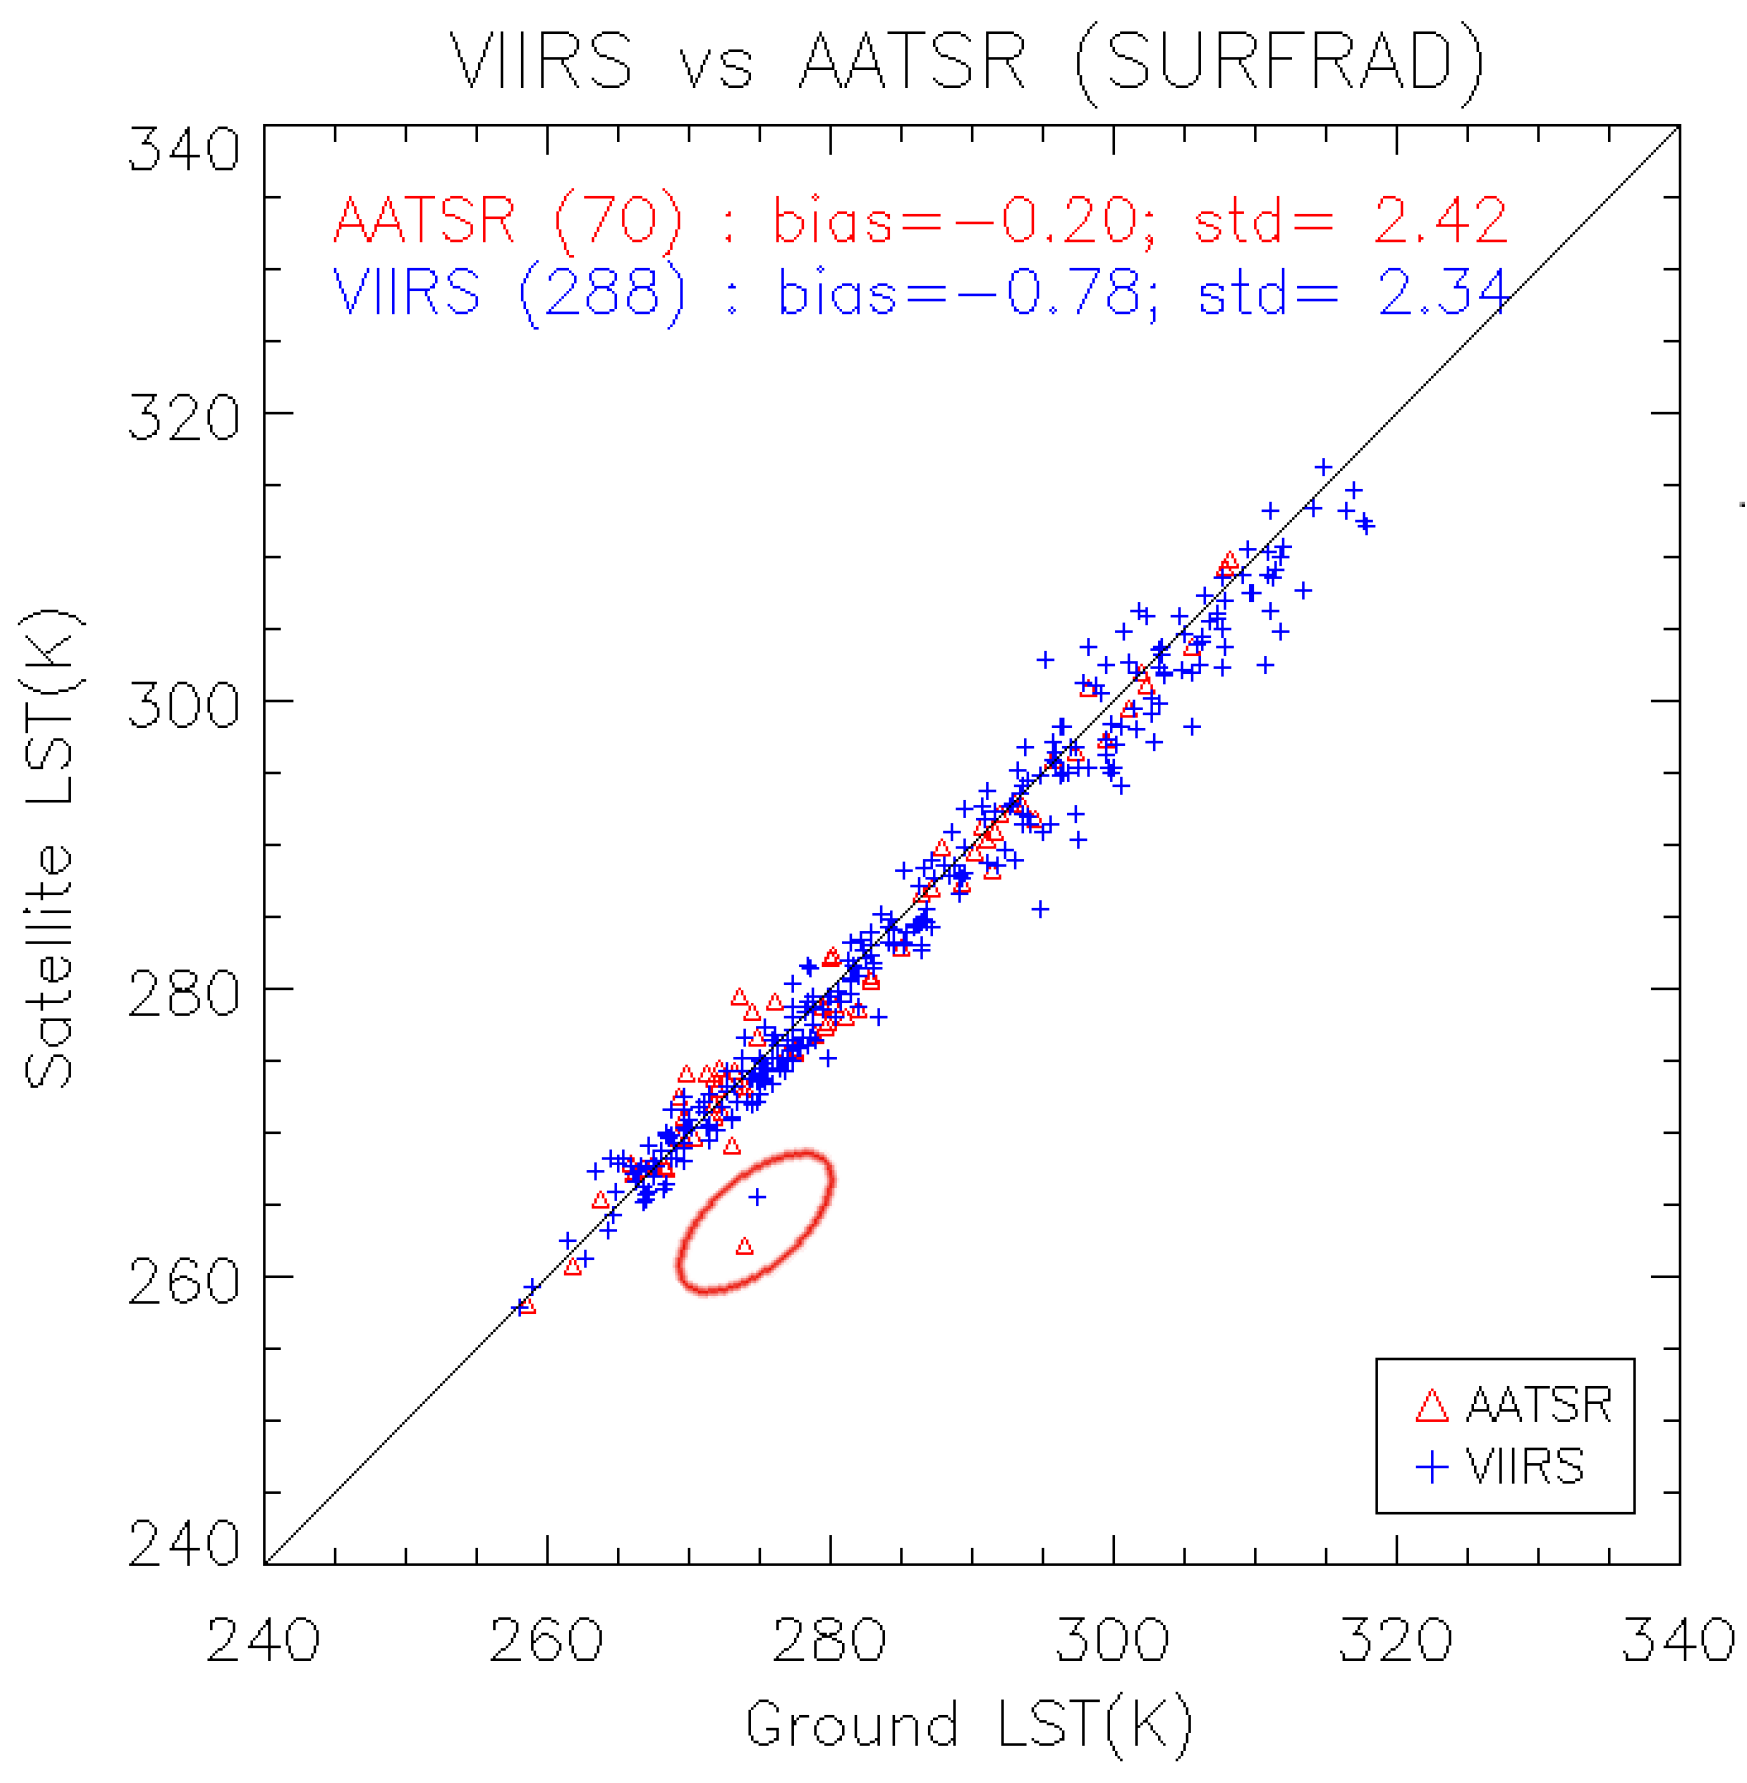
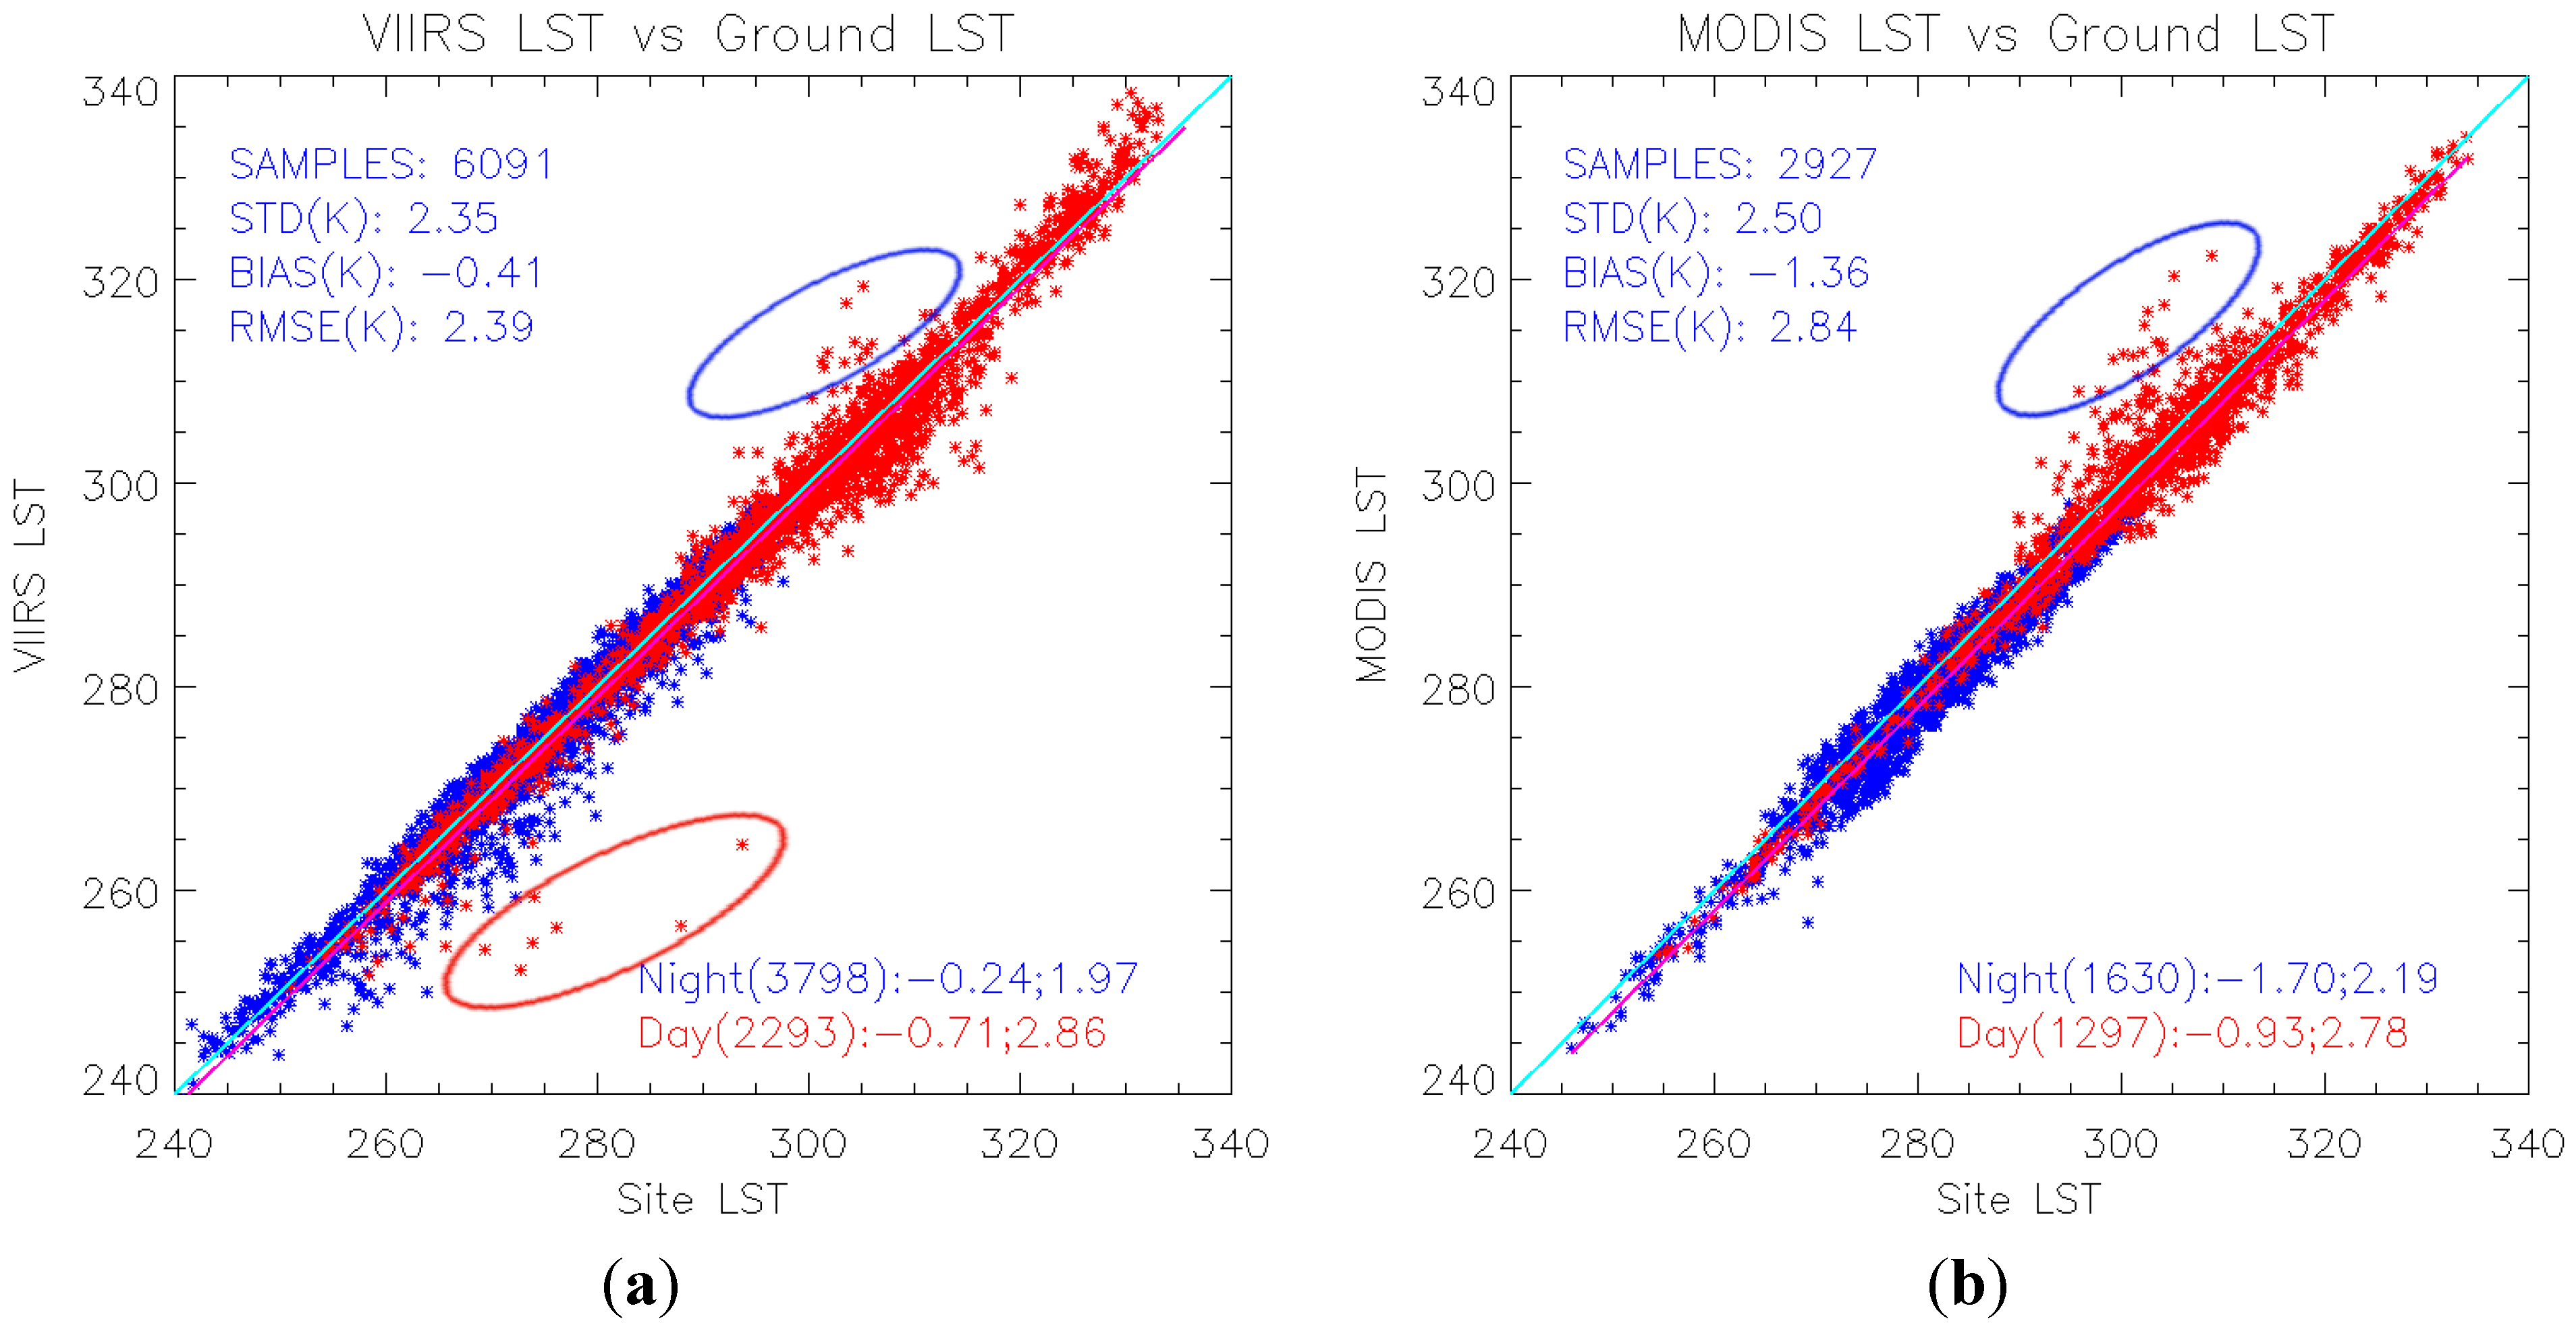
4.1. Comparison with SURFRAD Data

| Season | Samples | Overall | Day | Night | |||
|---|---|---|---|---|---|---|---|
| Bias | STD | Bias | STD | Bias | STD | ||
| Spring | 1549 | −0.57 | 2.55 | −0.58 | 3.16 | −0.56 | 2.13 |
| Summer | 1433 | −0.12 | 2.46 | −0.90 | 3.70 | 0.26 | 1.40 |
| Fall | 1734 | −0.23 | 1.82 | −0.46 | 1.97 | −0.07 | 1.70 |
| Winter | 1372 | −0.72 | 2.21 | −0.85 | 1.80 | −0.63 | 2.44 |
| Viirs_lst | Surfrad_lst | BT15 | BT16 | Date | Time | STZ | STAZ | SOZ | SOAZ |
|---|---|---|---|---|---|---|---|---|---|
| 312.19 | 304.77 | 306.05 | 302.51 | 2013140 | 1905 | 33.39 | −98.15 | 26.34 | −133.20 |
| 313.65 | 305.98 | 308.04 | 304.88 | 2013163 | 1835 | 14.57 | 78.10 | 19.43 | −146.77 |
| 311.39 | 301.43 | 306.27 | 303.76 | 2013164 | 1815 | 39.15 | 74.33 | 17.73 | −159.42 |
| 313.91 | 304.41 | 307.21 | 303.14 | 2013169 | 1825 | 32.07 | 75.08 | 17.95 | −155.56 |
| 310.84 | 303.62 | 304.40 | 300.88 | 2013170 | 1805 | 50.70 | 72.09 | 16.85 | −169.68 |
| 313.14 | 305.44 | 308.69 | 306.60 | 2014128 | 1855 | 6.24 | −100.44 | 27.15 | −142.34 |
| 312.03 | 301.27 | 308.06 | 306.73 | 2014130 | 1815 | 44.90 | 73.11 | 23.26 | −161.37 |
| 308.33 | 300.28 | 302.04 | 299.51 | 2014130 | 2000 | 67.60 | −90.80 | 35.98 | −118.65 |
| 309.05 | 302.28 | 305.02 | 303.27 | 2014144 | 1855 | 6.25 | −97.24 | 24.05 | −137.94 |
| 311.75 | 303.35 | 307.29 | 305.41 | 2014151 | 1825 | 38.72 | 74.25 | 19.61 | −154.49 |
| 309.26 | 303.50 | 304.43 | 302.02 | 2014154 | 1910 | 25.26 | −99.96 | 24.39 | −130.55 |
| 306.46 | 299.39 | 303.54 | 302.82 | 2014165 | 1900 | 15.91 | −99.07 | 22.50 | −132.85 |
| Site | Surface Types | Samples Number | Overall | Nighttime | Daytime | ||||||
|---|---|---|---|---|---|---|---|---|---|---|---|
| Bias | Std | Rmse | Bias | Std | Rmse | Bias | Std | Rmse | |||
| BON | Cropland | 768 | −0.42 | 2.92 | 2.95 | −0.48 | 2.05 | 2.10 | −0.27 | 4.33 | 4.33 |
| BON | Snow/ice | 39 | 0.12 | 1.34 | 1.33 | 0.12 | 0.83 | 0.80 | 0.12 | 1.50 | 1.48 |
| DRA | Closed Shrublands | 97 | −0.96 | 1.42 | 1.71 | −1.32 | 0.84 | 1.56 | −0.45 | 1.88 | 1.91 |
| DRA | open shrublands | 1128 | −0.18 | 1.57 | 1.58 | −0.58 | 0.88 | 1.05 | 0.26 | 2.00 | 2.01 |
| DRA | Barren | 149 | −0.23 | 1.55 | 1.56 | −1.04 | 0.75 | 1.28 | 0.87 | 1.67 | 1.88 |
| FPK | Grass | 491 | −0.19 | 1.84 | 1.85 | 0.07 | 1.63 | 1.63 | −0.70 | 2.12 | 2.23 |
| FPK | Crop/vegetation Mosaic | 90 | −1.13 | 2.61 | 2.83 | −1.70 | 2.86 | 3.31 | −0.08 | 1.69 | 1.67 |
| FPK | Snow/ice | 56 | −3.16 | 5.57 | 6.36 | - | - | - | −3.16 | 5.57 | 6.36 |
| GWN | Woody Savannahs | 390 | 0.06 | 2.69 | 2.69 | 1.39 | 1.75 | 2.23 | −2.10 | 2.56 | 3.30 |
| GWN | Crop/vegetation Mosaic | 487 | −0.18 | 2.52 | 2.52 | 1.28 | 1.61 | 2.06 | −2.20 | 2.11 | 3.05 |
| PSU | Deciduous broadleaf forests | 21 | −0.85 | 2.52 | 2.60 | −0.48 | 2.55 | 2.51 | −1.77 | 2.39 | 2.80 |
| PSU | Grass | 157 | −0.28 | 1.85 | 1.86 | −0.21 | 1.93 | 1.93 | −0.37 | 1.75 | 1.77 |
| PSU | Cropland | 35 | −1.16 | 2.20 | 2.46 | −1.21 | 2.38 | 2.63 | −0.91 | 1.04 | 1.31 |
| PSU | Crop/vegetation Mosaic | 406 | −0.15 | 2.51 | 2.51 | −0.19 | 2.56 | 2.56 | 0.00 | 2.34 | 2.32 |
| PSU | Snow/ice | 105 | −1.30 | 3.10 | 3.35 | −2.29 | 3.67 | 4.29 | −0.72 | 2.56 | 2.64 |
| SXF | Cropland | 762 | −0.44 | 2.33 | 2.37 | −0.13 | 2.07 | 2.07 | −1.08 | 2.69 | 2.90 |
| SXF | Snow/ice | 119 | −1.91 | 3.64 | 4.10 | −1.94 | 1.94 | 2.72 | −1.90 | 4.10 | 4.50 |
| TBL | Grass | 749 | −0.68 | 1.81 | 1.94 | −0.70 | 1.59 | 1.74 | −0.63 | 2.35 | 2.43 |
| TBL | Snow/ice | 41 | −1.36 | 1.80 | 2.24 | −2.43 | 0.80 | 2.54 | −1.06 | 1.90 | 2.14 |
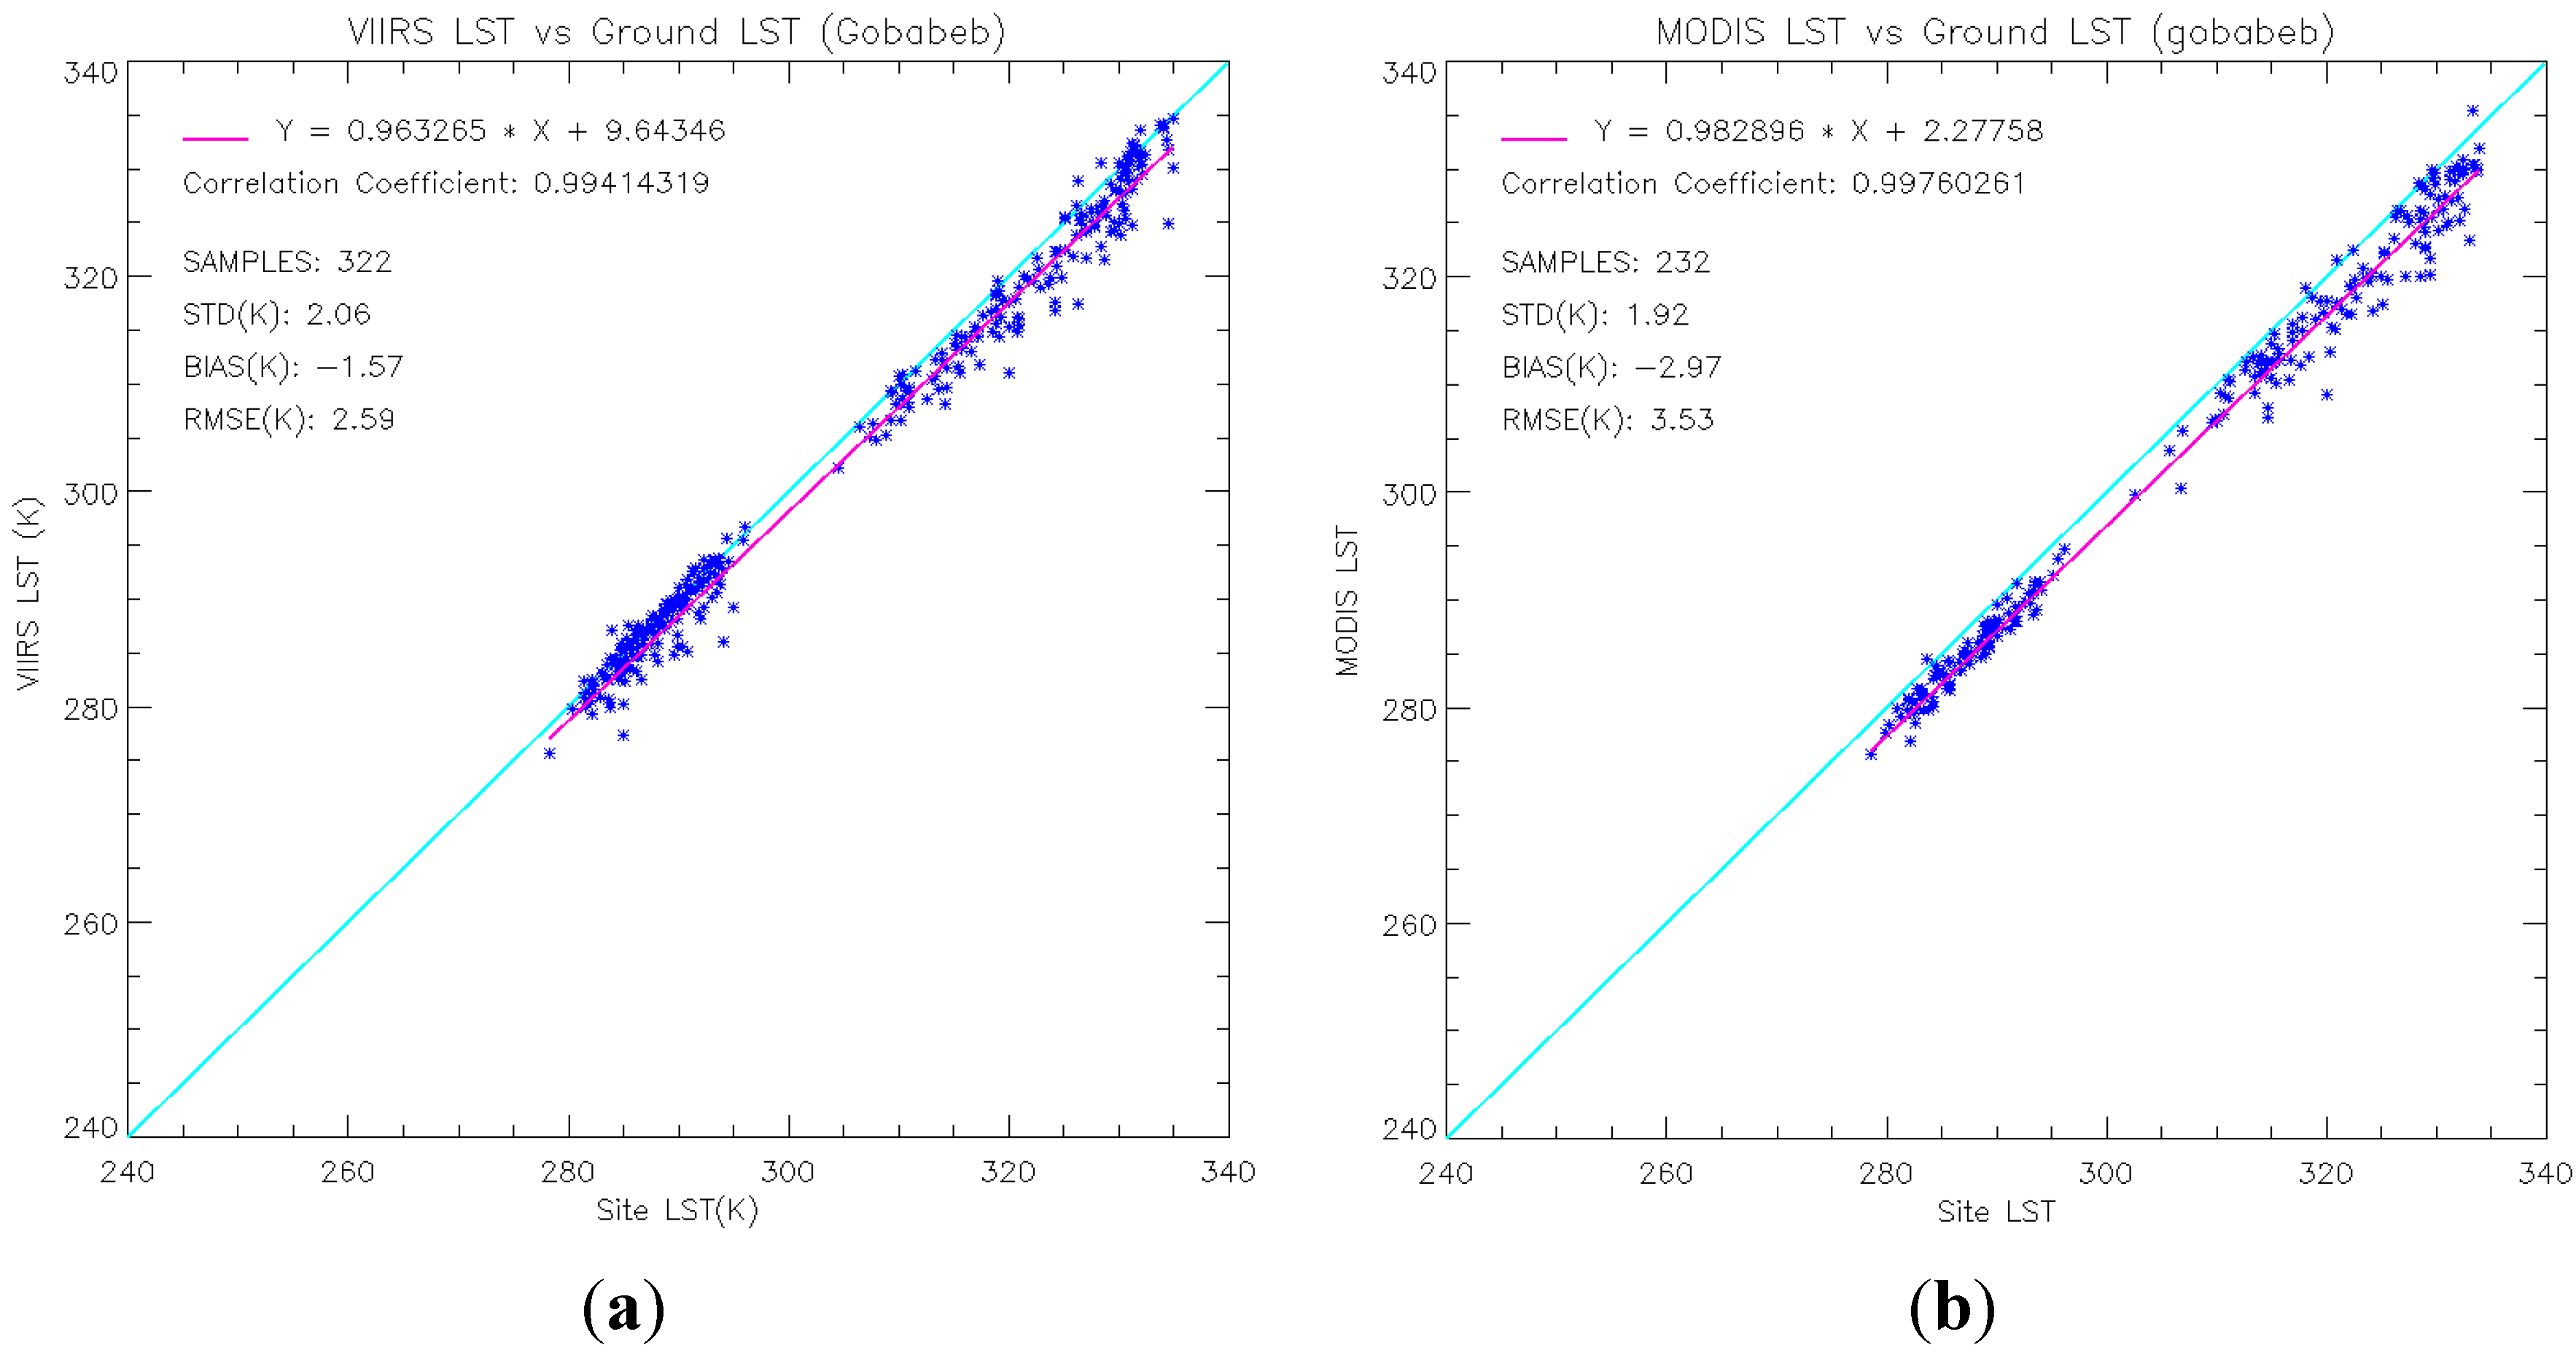
4.2. Comparison with Data from Gobabeb, Namibia

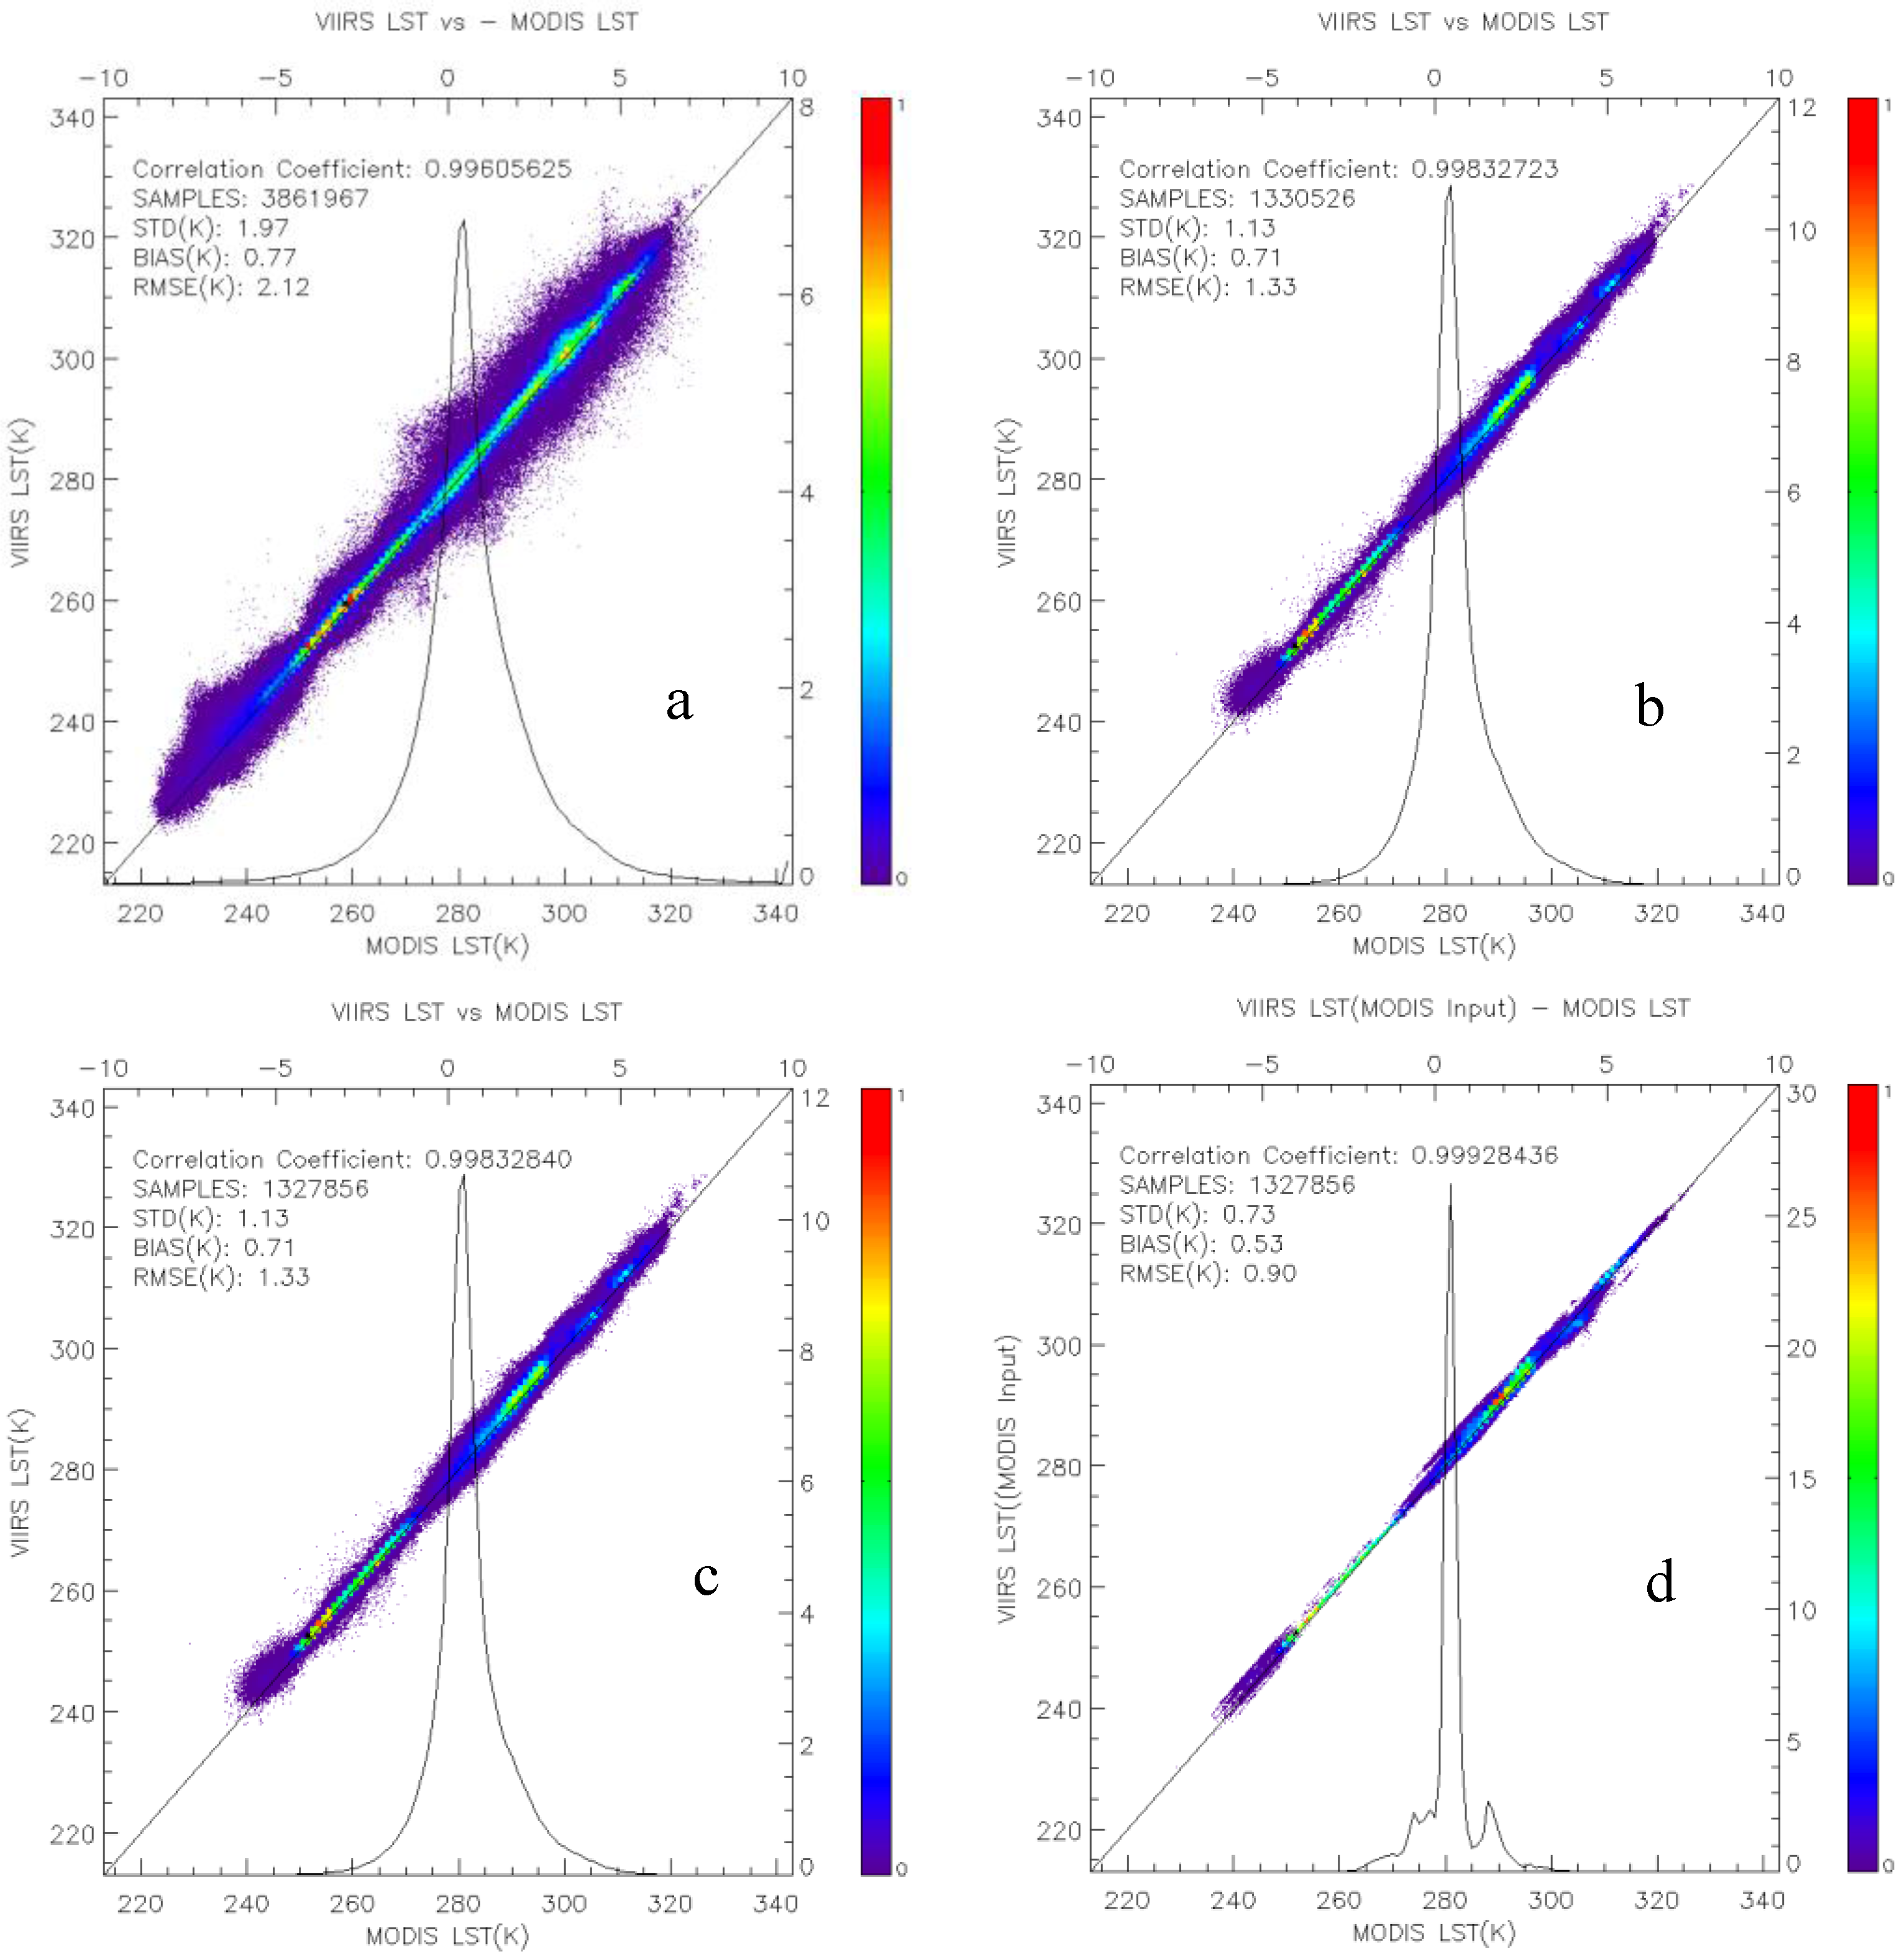
4.3. Cross Comparison with MODIS Aqua LST

| Surface Type | Night | Day | ||||
|---|---|---|---|---|---|---|
| Bias | STD | Samples | Bias | STD | Samples | |
| Evergreen Needleleaf Forest | −0.36 | 1.15 | 31 | 0.24 | 1.01 | 12 |
| Evergreen broadleaf Forest | −0.06 | 0.93 | 11110 | 0.20 | 0.92 | 40085 |
| Deciduous Needleleaf Forest | 1.70 | 2.09 | 104 | −1.41 | 0.28 | 2 |
| Deciduous Broadleaf Forest | 0.50 | 0.93 | 1947 | −0.46 | 0.97 | 1871 |
| Mixed Forest | −0.10 | 1.28 | 5666 | −0.72 | 1.19 | 218 |
| Closed Shrublands | 1.60 | 0.97 | 858 | - | - | - |
| Open Shrublands | 2.11 | 1.34 | 166680 | −0.37 | 1.43 | 1097 |
| Woody Savannahs | 0.15 | 1.13 | 124278 | 0.46 | 1.36 | 7728 |
| Savannahs | 0.76 | 1.03 | 145338 | 3.34 | 1.01 | 505 |
| Grasslands | 0.46 | 1.24 | 51831 | −0.33 | 1.35 | 259 |
| Wetlands | 0.61 | 1.34 | 4371 | 1.72 | 1.13 | 340 |
| Croplands | 0.21 | 1.23 | 26030 | −0.32 | 1.06 | 11583 |
| Urban | 0.60 | 1.22 | 769 | 0.38 | 1.40 | 52 |
| Natural Vegetation Mosaics | 0.44 | 1.04 | 53593 | 1.14 | 1.49 | 2551 |
| Snow/ice | - | - | - | 0.47 | 0.57 | 552550 |
| Barren | 2.04 | 1.24 | 1222 | 1.08 | 1.12 | 111549 |
| Water | 1.40 | 1.53 | 3073 | −0.19 | 1.00 | 553 |
5. Discussion
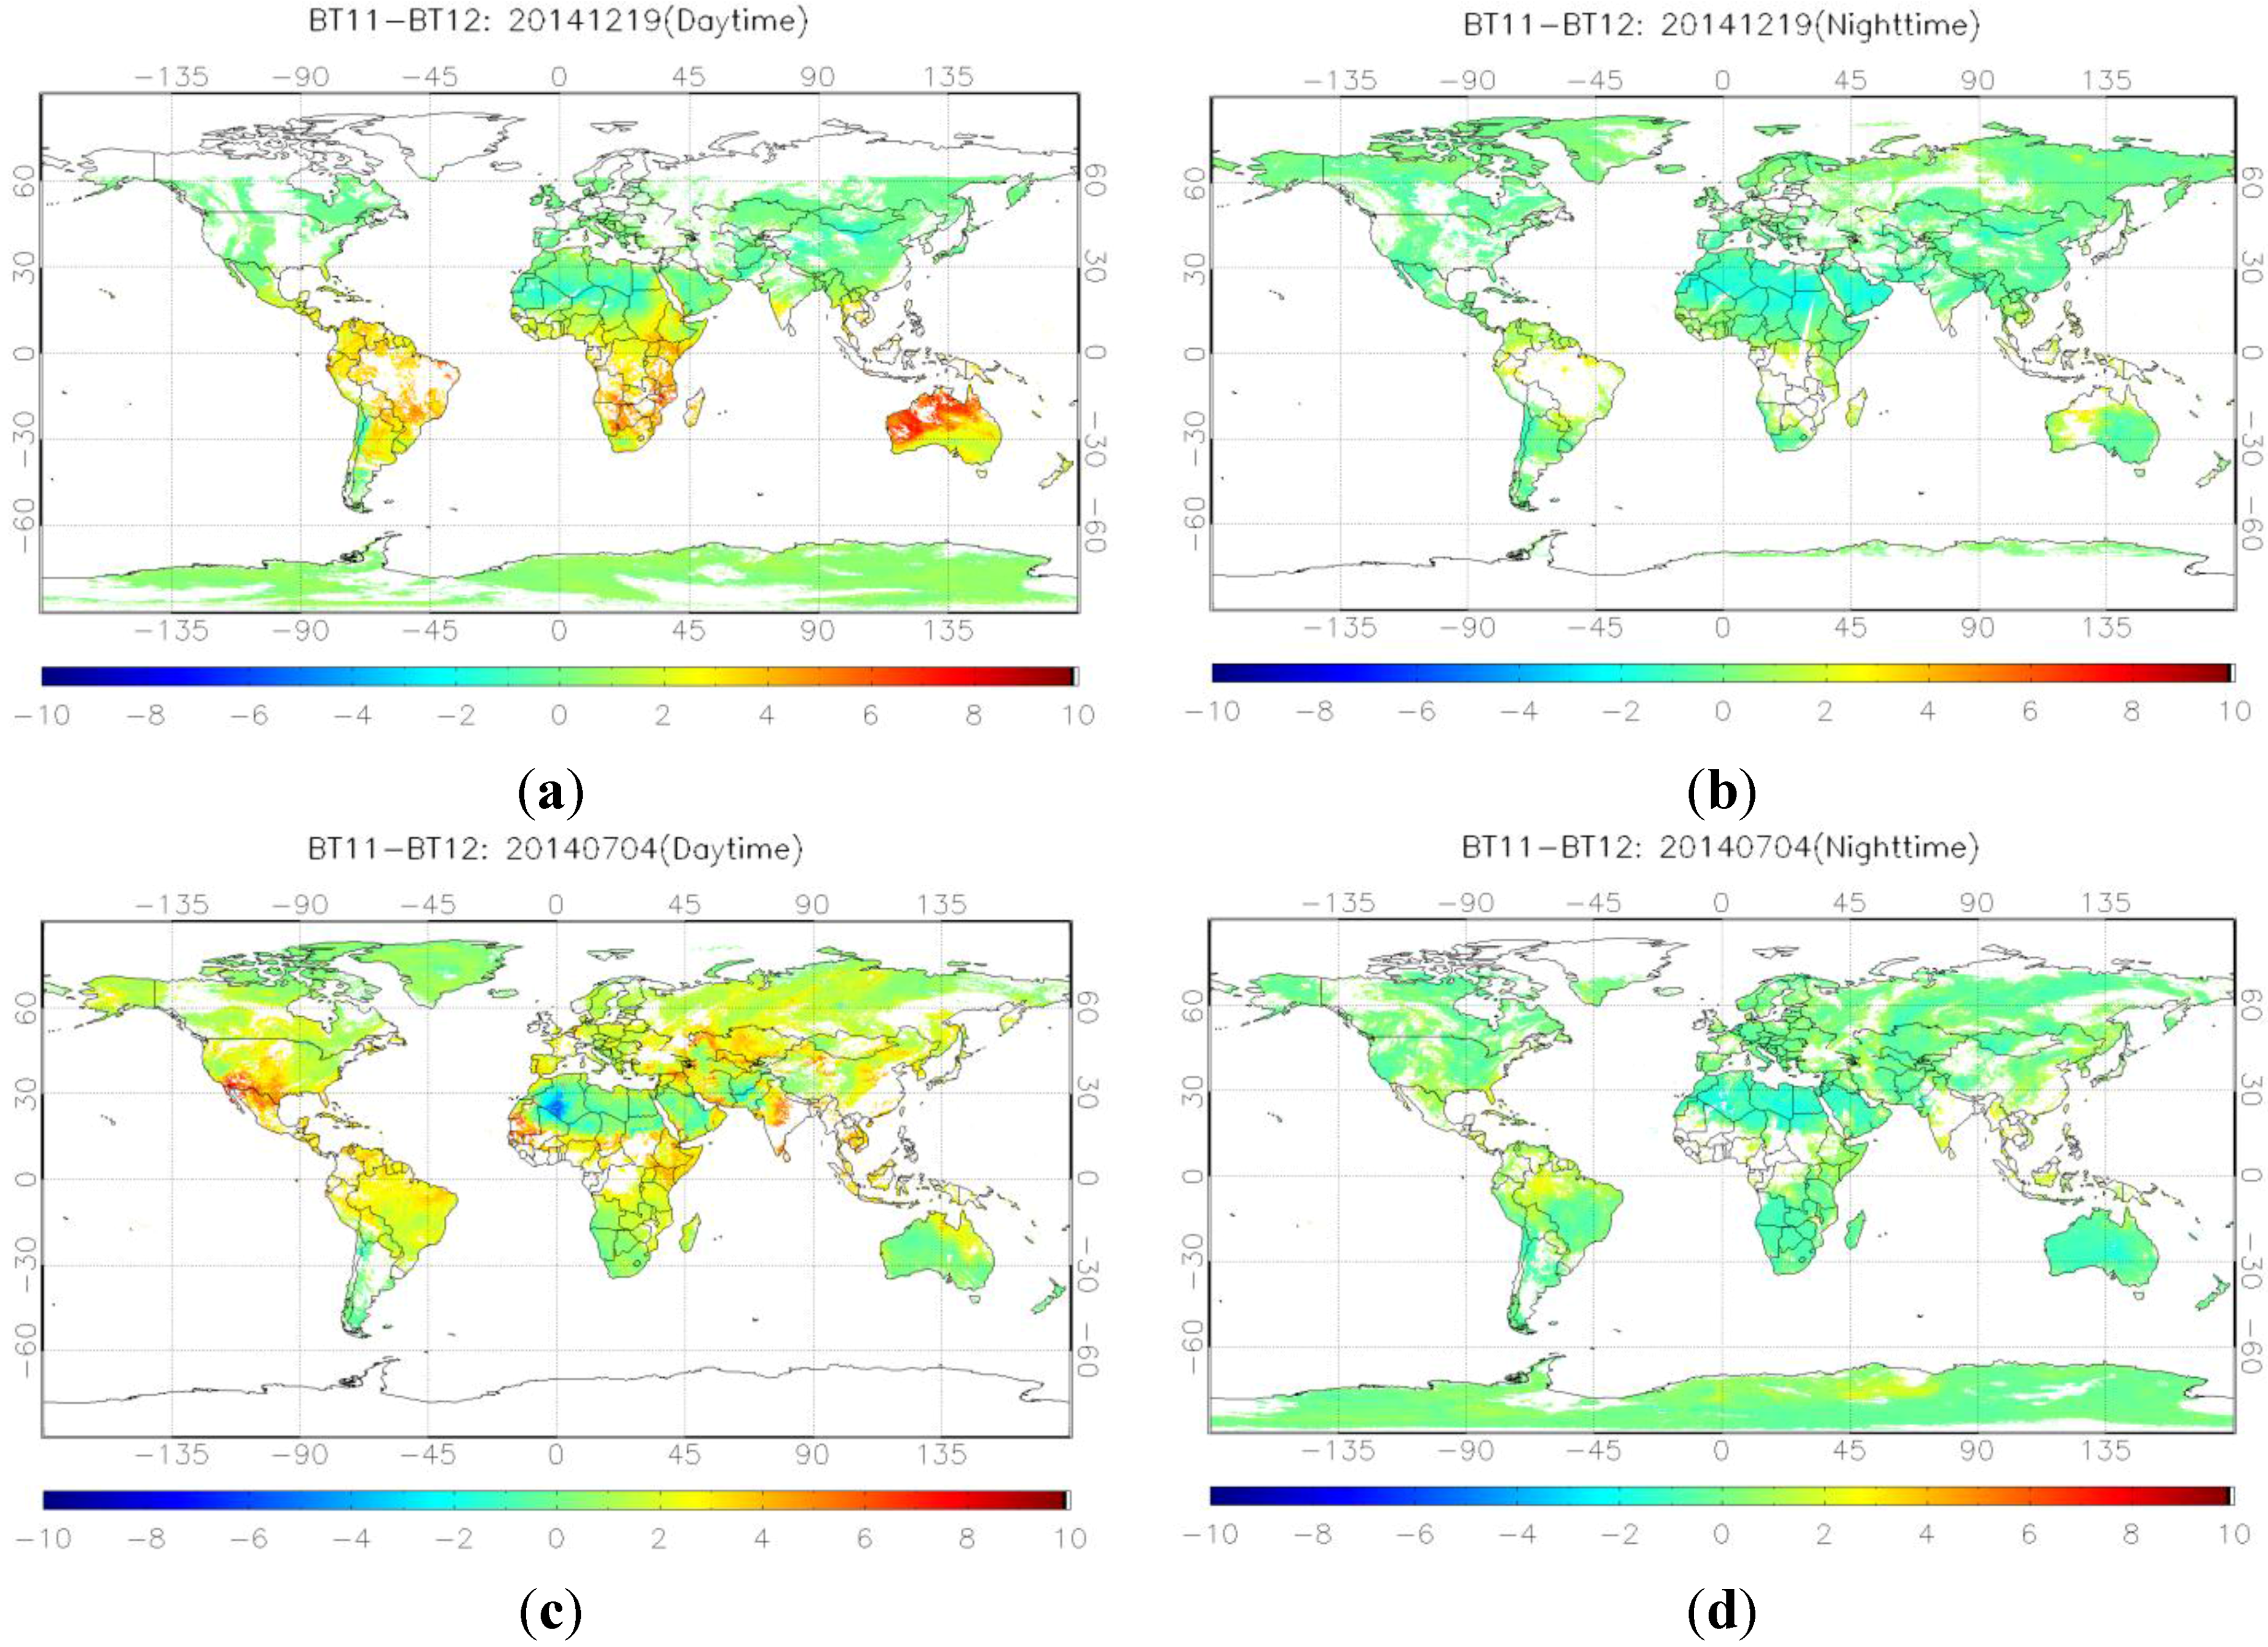
5.1. Impact from the Non-Linear Term
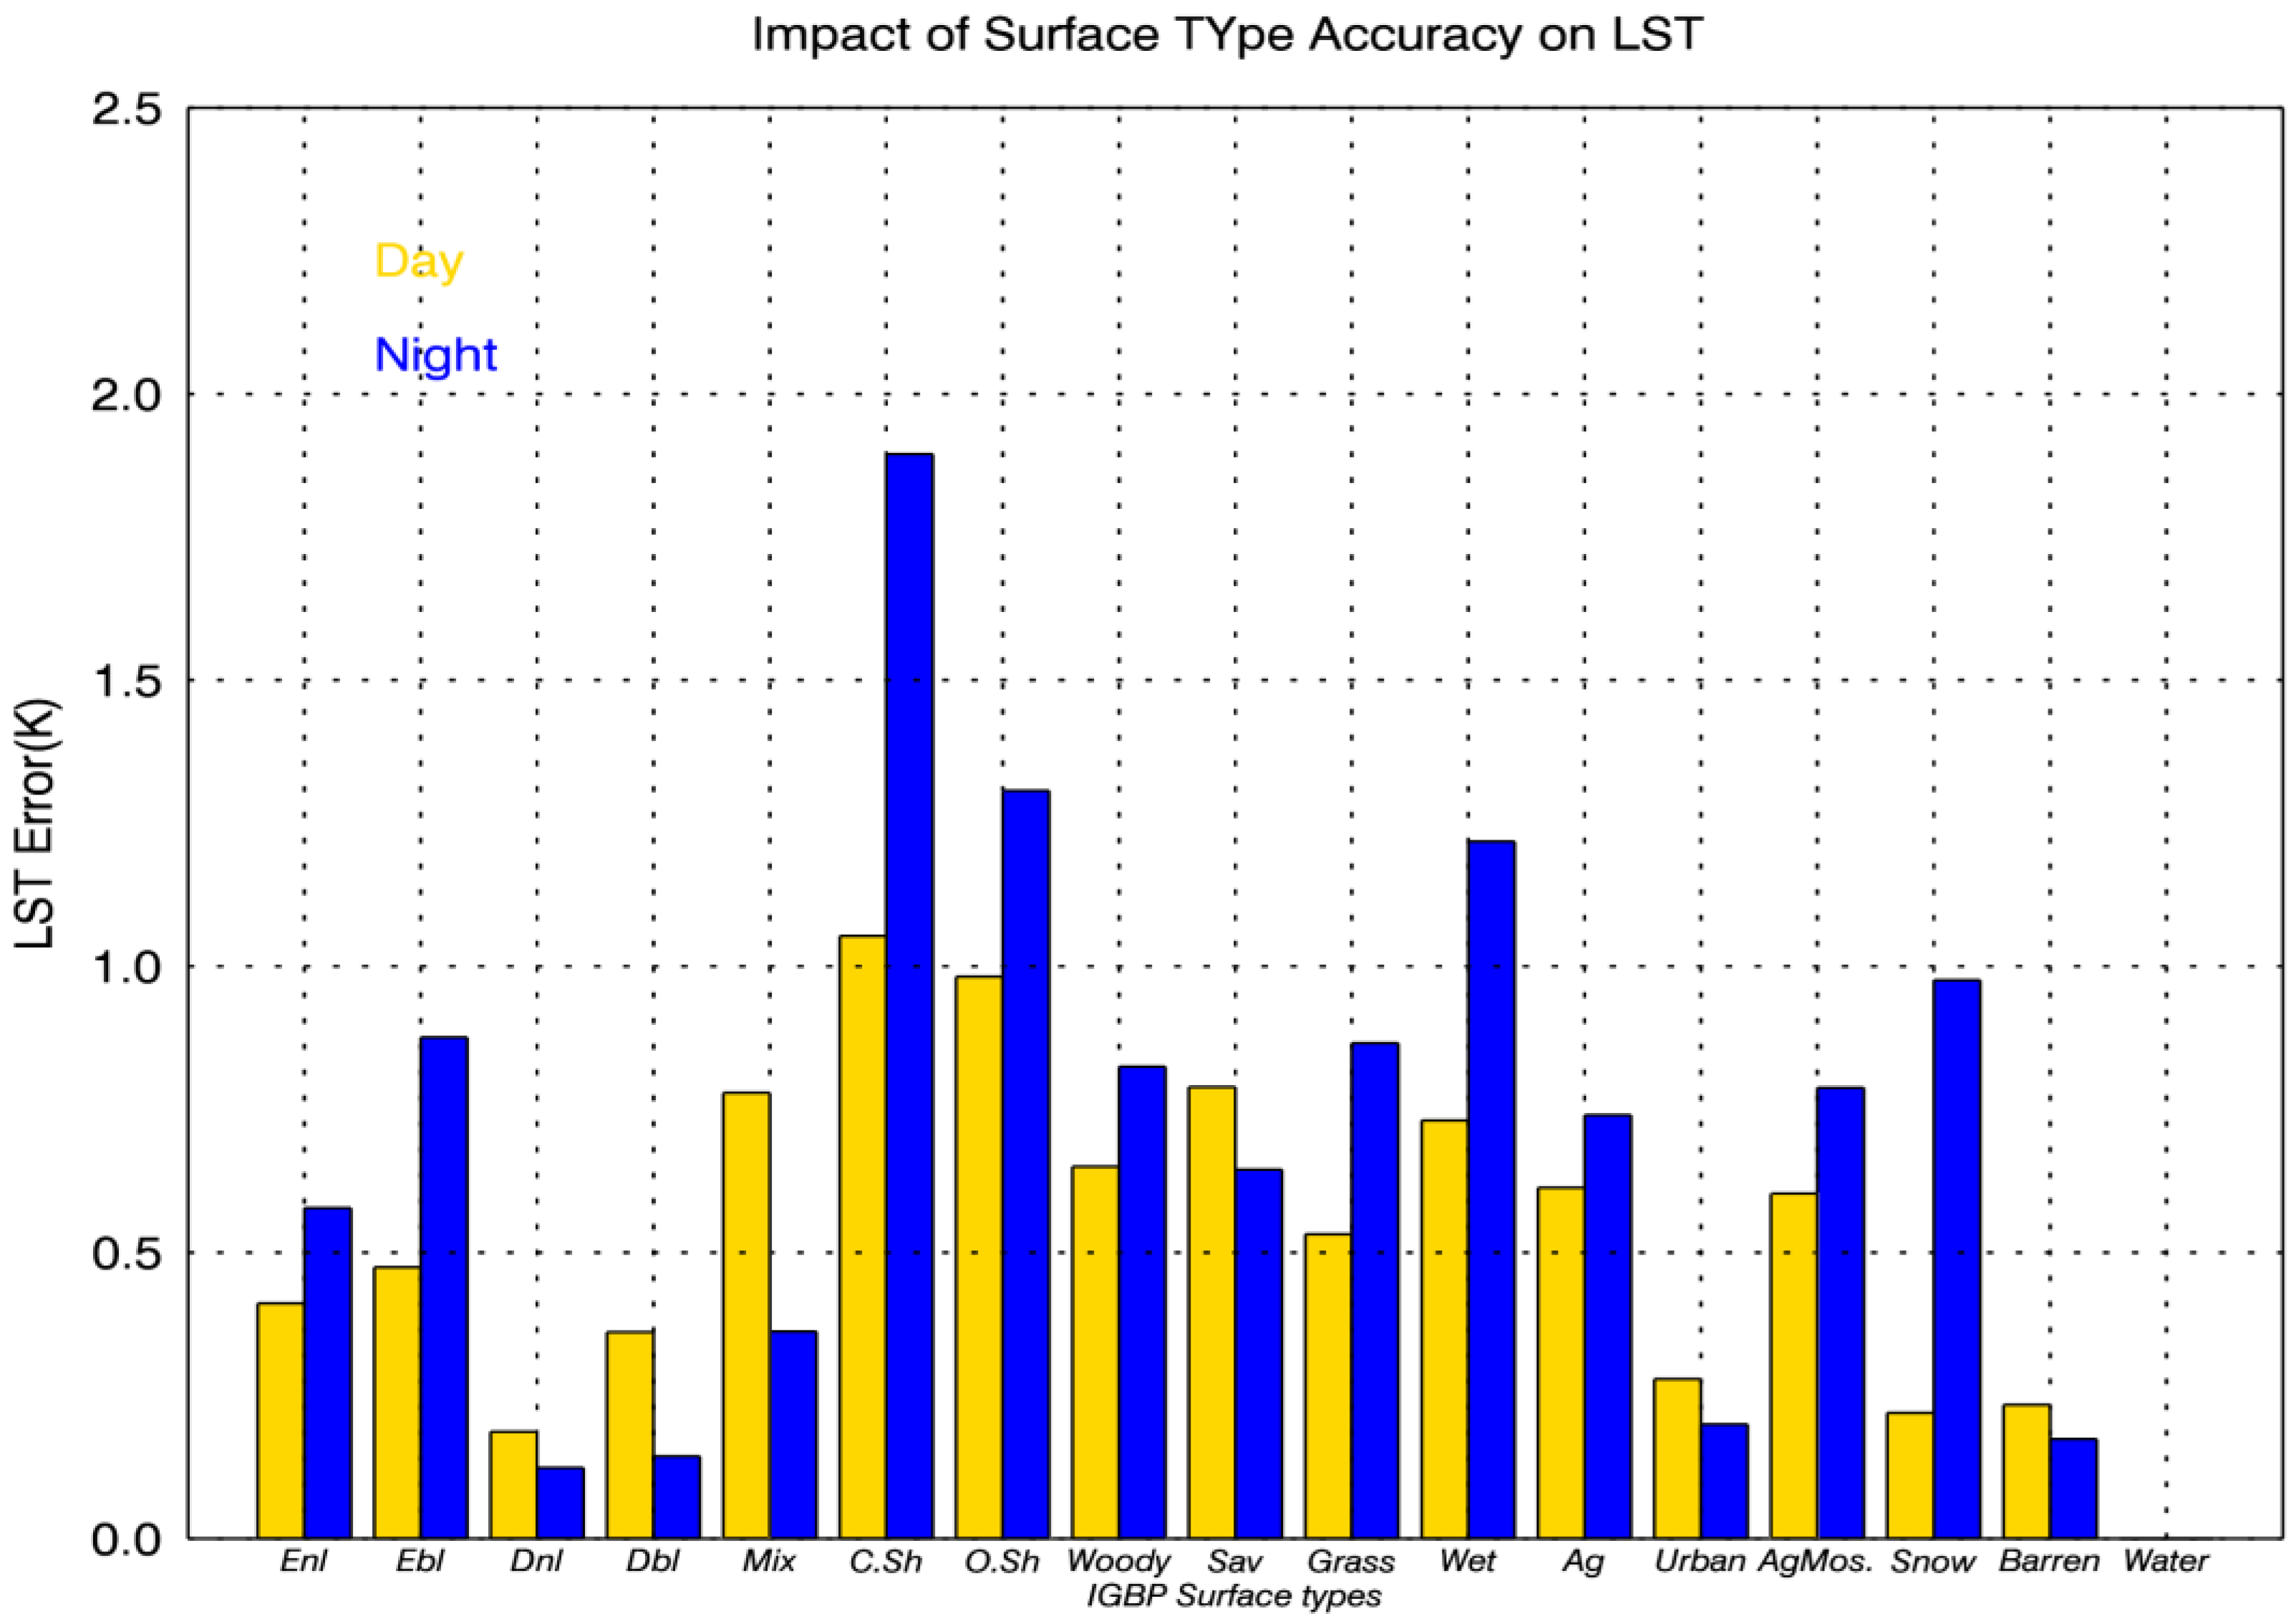
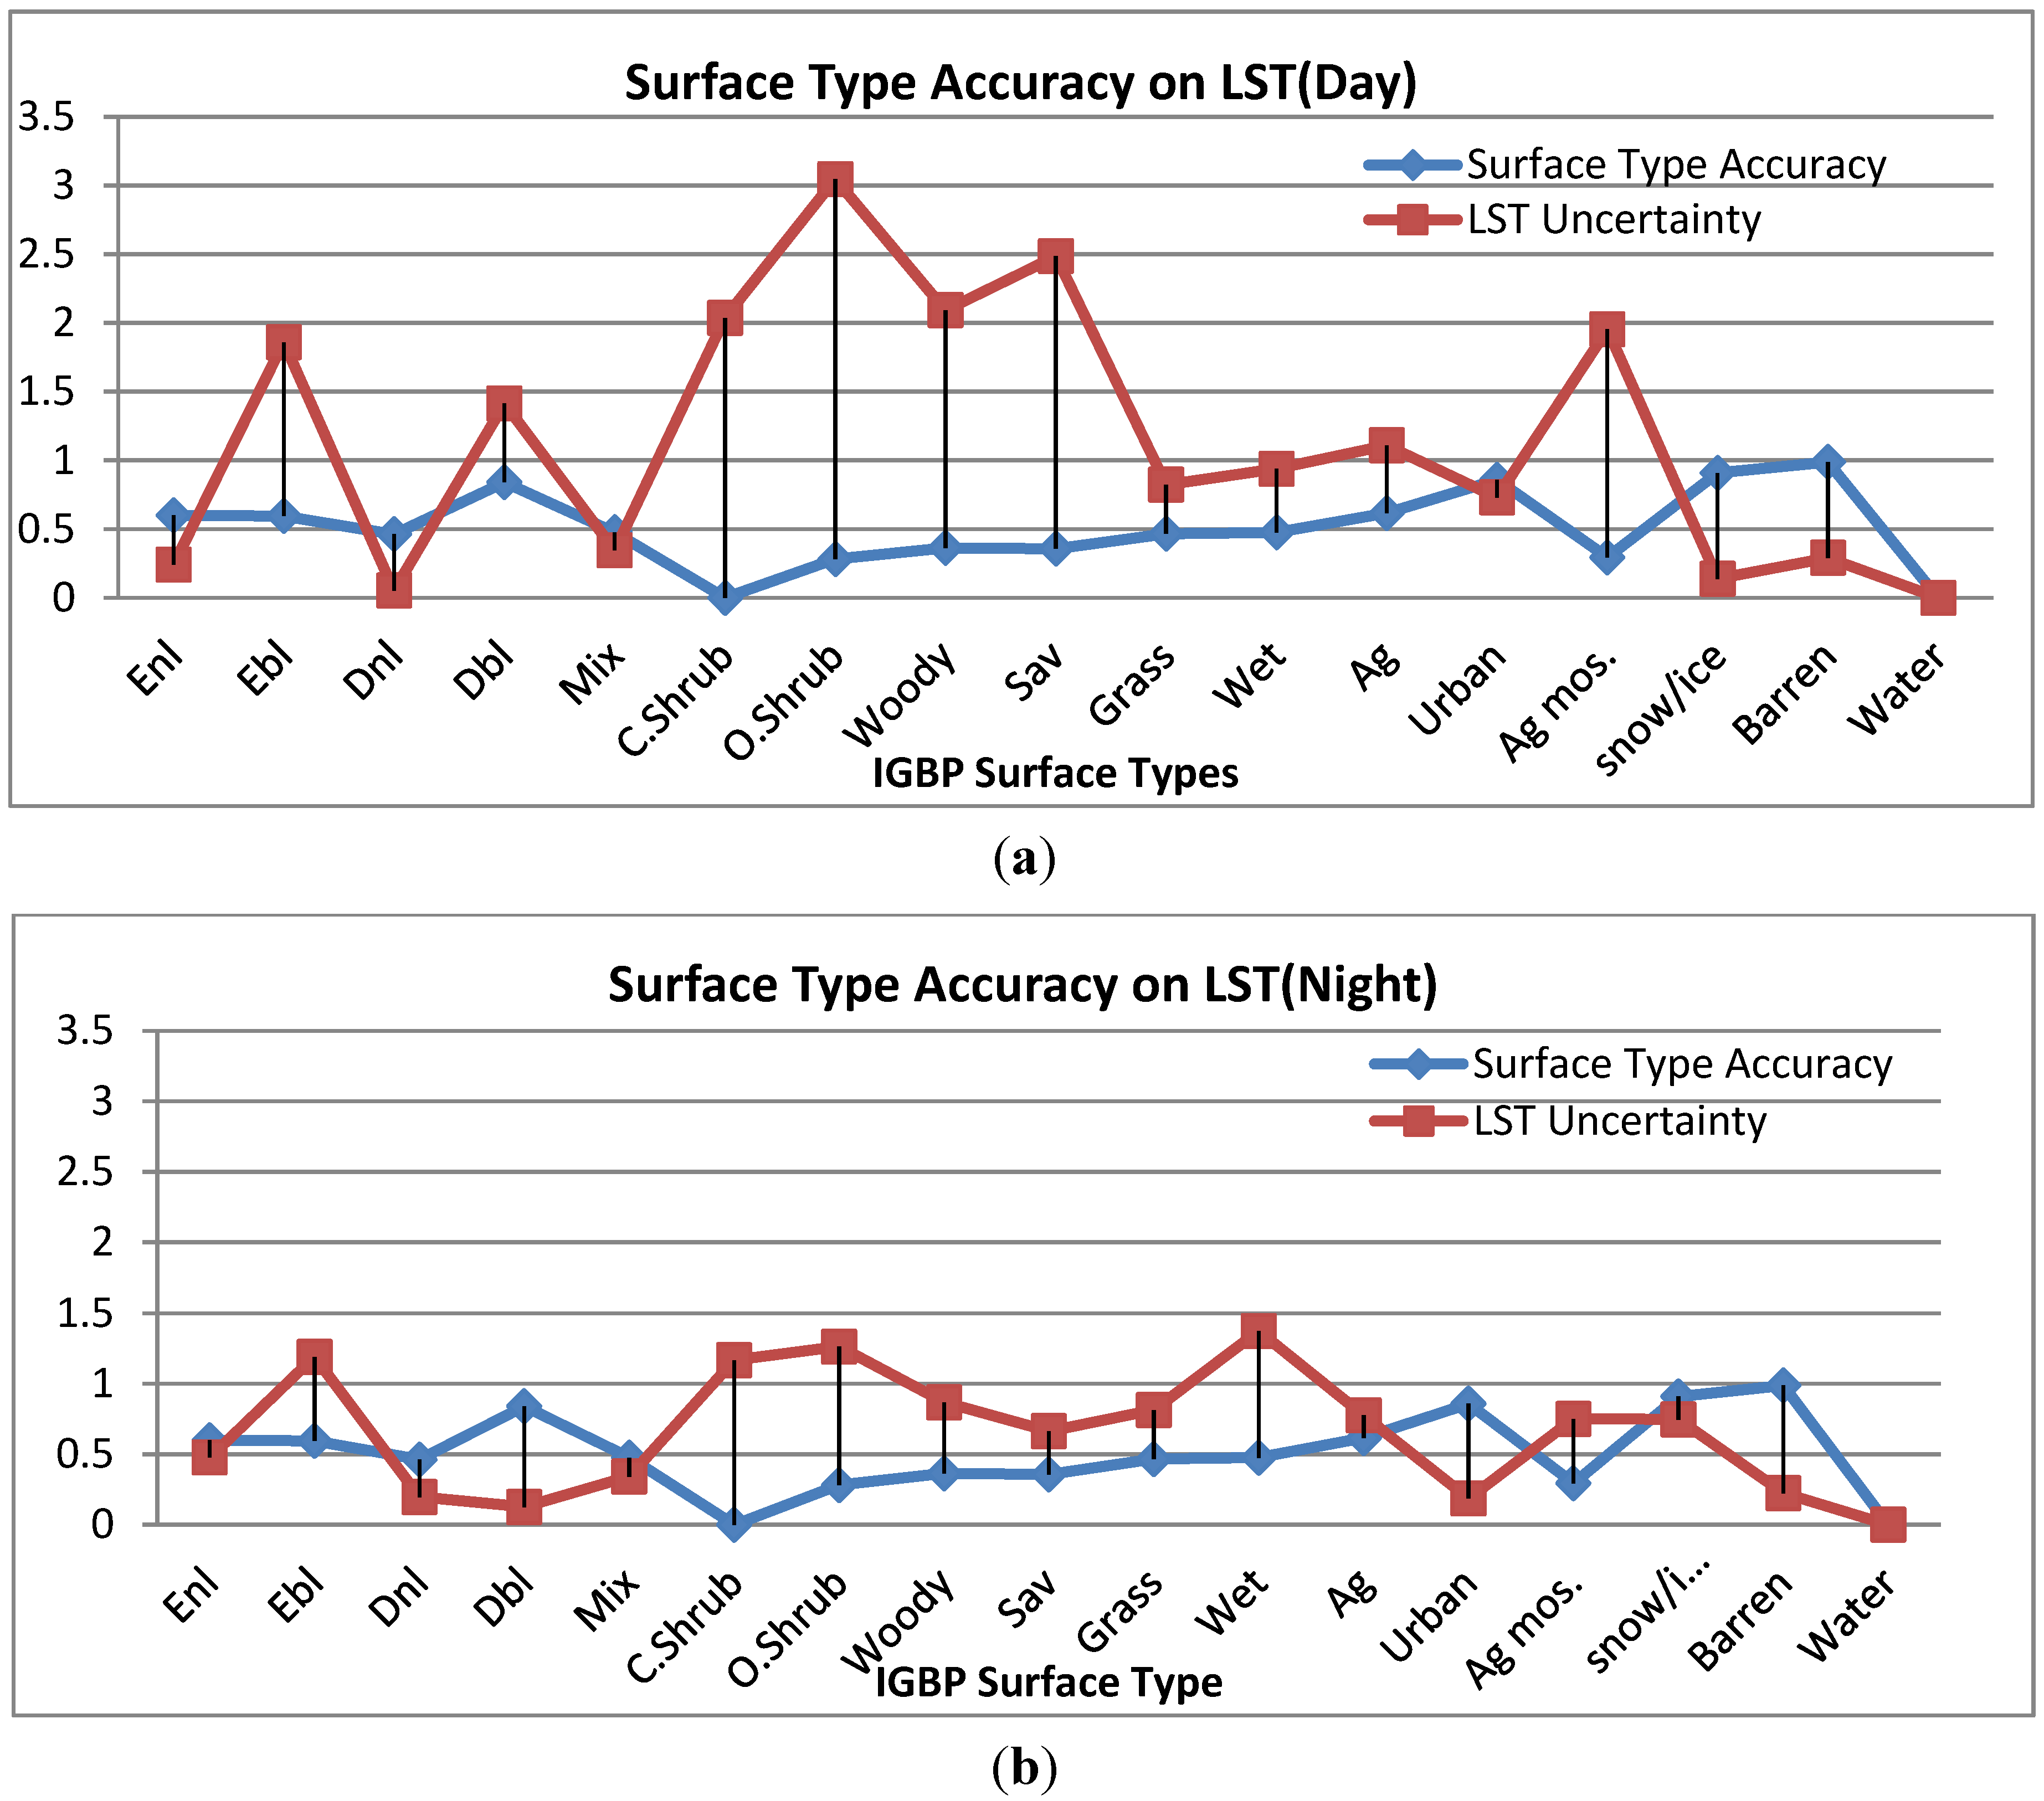
5.2. Uncertainty due to Error of Surface Type

6. Conclusions
Acknowledgments
Author Contributions
Conflicts of Interest
References
- Yu, Y.; Tarpley, D.; Privette, J.L.; Flynn, L.E.; Xu, H.; Chen, M.; Vinnikov, K.Y.; Sun, D.; Tian, Y. Validation of GOES-R satellite land surface temperature algorithm using SURFRAD ground measurements and statistical estimates of error properties. IEEE Trans. Geosci. Remote Sens. 2012, 50, 704–713. [Google Scholar]
- Meng, C.L.; Li, Z.-L.; Zhan, X.; Shi, J.C.; Liu, C.Y. Land surface temperature data assimilation and its impact on evapotranspiration estimates from the common land model. Water Resour. Res. 2009, 45, W02421. [Google Scholar] [CrossRef]
- Zheng, W.; Wei, H.; Wang, Z.; Zeng, X.; Meng, J.; Ek, M.; Mitchell, K.; Derber, J. Improvement of daytime land surface skin temperature over arid regions in the NCEP GFS model and its impact on satellite data assimilation. J. Geophys. Res. Atmos. 2012, 117, D06117. [Google Scholar] [CrossRef]
- Anderson, M.C.; Kustas, W.P.; Norman, J.M.; Hain, C.R.; Mecikalski, J.R.; Schultz, L.; Gonzalez-Dugo, M.P.; Cammalleri, C.; d’Urso, G.; Pimstein, A.; et al. Mapping daily evapotranspiration at field to continental scales using geostationary and polar orbiting satellite imagery. Hydro. Earth Sys. Sci. 2011, 15, 223–239. [Google Scholar] [CrossRef]
- Anderson, M.C.; Allen, R.G.; Morse, A.; Kustas, W.P. Use of Landsat thermal imagery in monitoring evapotranspiration and managing water resources. Remote Sens. Environ. 2012, 122, 50–65. [Google Scholar] [CrossRef]
- Rajasekar, U.; Weng, Q. Urban heat island monitoring and analysis by data mining of MODIS imageries. ISPRS J. Photogramm. Remote Sens. 2009, 64, 86–96. [Google Scholar] [CrossRef]
- Li, H.; Sun, D.; Yu, Y.; Wang, H.; Liu, Y.; Liu, Q.; Du, Y.; Wang, H.; Cao, B. Evaluation of the VIIRS and MODIS LST products in an arid area of Northwest China. Remote Sens. Environ. 2014, 142, 111–121. [Google Scholar] [CrossRef]
- Jiménez-Muñoz, J.C.; Sobrino, J.A. A generalized single-channel method for retrieving land surface temperature from remote sensing data. J. Geophys. Res. 2003, 108, 4688–4695. [Google Scholar] [CrossRef]
- Prata, A.J. Land surface temperatures derived from the AVHRR and the ATSR. 1, Theory. J. Geophys. Res. 1993, 98, 689–16702. [Google Scholar]
- Coll, C.; Caselles, V.; Sobrino, J.A.; Valor, E. On the atmospheric dependence of the split-window equation for land surface temperature. Int. J. Remote Sens. 1994, 15, 105–122. [Google Scholar] [CrossRef]
- Wan, Z.; Dozier, J. A generalized split-window algorithm for retrieving land-surface temperature from space. IEEE Trans. Geosci. Remote Sens. 1996, 34, 892–905. [Google Scholar]
- Gillespie, A.R.; Rokugawa, S.; Hook, S.J.; Matsunaga, T.; Kahle, A.B. Temperature/Emissivity Separation Algorithm Theoretical Basis Document, version 2.4; NASA/GSFC: Greenbelt, MD, USA, 1996. [Google Scholar]
- Yu, Y.; Tarpley, D.; Privette, J.; Goldberg, M.; Raja, M.; Vinnikov, K.; Xu, H. Developing algorithm for operational GOES-R land surface temperature product. IEEE Trans. Geosci. Remote Sens. 2009, 47, 936–951. [Google Scholar]
- Sun, D.; Pinker, R.T. Estimation of land surface temperature from a Geostationary Operational Environmental Satellite (GOES-8). J. Geophys. Res. 2003, 108. [Google Scholar] [CrossRef]
- Gillespie, A.R.; Rokugawa, S.; Matsunaga, T.; Cothern, J.S.; Hook, S.; Kahle, A.B. A temperature and emissivity separation algorithm for Advanced Spaceborne Thermal Emission and Reflection Radiometer (ASTER) images. IEEE Trans. Geosci. Remote Sens. 1998, 36, 1113–1126. [Google Scholar] [CrossRef]
- Dash, P.; Göttsche, F.-M.; Olesen, F.-S.; Fischer, H. Land surface temperature and emissivity estimation from passive sensor data: Theory and practice—Current trends. Int. J. Remote Sens. 2002, 23, 2563–2594. [Google Scholar] [CrossRef]
- Coll, C.; Valor, E.; Galve, J.M.; Mira, M.; Bisquert, M.; García-Santos, V.; Caselles, E.; Caselles, V. Long-term accuracy assessment of land surface temperatures derived from the advanced along-track scanning radiometer. Remote Sens. Environ. 2012, 116, 211–225. [Google Scholar] [CrossRef]
- Freitas, S.C.; Trigo, I.F.; Bioucas-Dias, J.M.; Goettsche, F.-M. Quantifying the uncertainty of land surface temperature retrievals from SEVIRI/Meteosat. IEEE Trans. Geosci. Remote Sens. 2010, 48, 523–534. [Google Scholar] [CrossRef]
- Niclòs, R.; Galve, J.M.; Valiente, J.A.; Estrela, M.J.; Coll, C. Accuracy assessment of land surface temperature retrievals from MSG2-SEVIRI data. Remote Sens. Environ. 2011, 2011, 2126–2140. [Google Scholar] [CrossRef]
- Hulley, G.C.; Hook, S.J. Intercomparison of versions 4, 4.1 and 5 of the MODIS land surface temperature and emissivity products and validation with laboratory measurements of sand samples from the Namib Desert, Namibia. Remote Sens. Environ. 2009, 133, 1313–1318. [Google Scholar] [CrossRef]
- Guillevic, P.C.; Biard, C.J.; Hulley, G.C.; Privette, J.L.; Hook, S.J.; Olioso, A.; Göttsche, F.M.; Radocinski, R.; Román, M.O.; Yu, Y.; Csiszar, I. Validation of land surface temperature products derived from the Visible Infrared Imaging Radiometer Suite (VIIRS) using ground-based and heritage satellite measurements. Remote Sens. Environ. 2014, 154, 19–37. [Google Scholar] [CrossRef]
- Justice, C.O.; Román, M.O.; Csiszar, I.; Vermote, E.F.; Wolfe, R.; Hook, S.J.; Friedl, M.; Wang, Z.; Schaaf, C.; Miura, T.; et al. Land and cryosphere products from Suomi NPP VIIRS: Overview and status. J. Geophys. Res. 2013, 118, 9753–9765. [Google Scholar] [CrossRef] [PubMed]
- CLASS. Available online: http://www.nsof.class.noaa.gov (accessed on 14 September 2015).
- Wan, Z. New refinements and validation of the collection-6 MODIS land-surface temperature/emissivity product. Remote Sens. Environ. 2014, 140, 36–45. [Google Scholar] [CrossRef]
- Prata, A.J. Land Surface Temperature Measurement from Space: AATSR Algorithm Theoretical Basis Document. Available online: https://earth.esa.int/c/document_library/et_file?folderId=13019&name=DLFE-660.pdf (accessed on 15 December 2014).
- Coll, C.; Caselles, V.; Galve, J.M.; Valor, E.; Niclòs, R.; Sánchez, J.M.; Rivas, R. Ground measurements for the validation of land surface temperatures derived from AATSR and MODIS data. Remote Sens. Environ. 2005, 97, 288–300. [Google Scholar] [CrossRef]
- Augustine, J.A.; DeLuisi, J.J.; Long, C.N. SURFRAD—A national surface radiation budget network for atmospheric research. Bull. Am. Meteorol. Soc. 2000, 81, 2341–2357. [Google Scholar] [CrossRef]
- Augustine, J.A.; Hodges, G.B.; Cornwall, C.R.; Michalsky, J.J.; Medina, C.I. An update on SURFRAD—The GCOS surface radiation budget network for the continental United States. J. Atmos. Ocean. Technol. 2005, 22, 1460–1472. [Google Scholar] [CrossRef]
- Hulley, G.C.; Simon, J.H. The North American ASTER land surface emissivity database (NAALSED), version 2.0. Remote Sens. Environ. 2009, 13, 1967–1975. [Google Scholar] [CrossRef]
- Li, S.; Yu, Y.; Sun, D.; Tarpley, D.; Zhan, X.; Chiu, L. Evaluation of 10 year AQUA/MODIS land surface temperature with SURFRAD observations. Int. J. Remote Sens. 2014, 35, 830–856. [Google Scholar] [CrossRef]
- Liu, Y.; Yu, Y.; Tarpley, D.; Wang, X.; Wang, Z. Initial assessment of Suomi NPP VIIRS Land Surface Temperature (LST) algorithms ballroom G. In Presented at the AMS 93rd Annual Meeting, Austin, TX, USA, 5–10 January 2013.
- Salibury, J.W.; D’Aria, D.M. Emissivity of Terrestrial Materials in the 8–14 µm atmospheric window. Remote Sens. Environ. 1992, 42, 83–106. [Google Scholar] [CrossRef]
- Wang, K.; Liang, S. Evaluation of ASTER and MODIS land surface temperature and emissivity products using long-term surface longwave radiation observations at SURFRAD sites. Remote Sens. Environ. 2009, 113, 1556–1565. [Google Scholar] [CrossRef]
- Wang, K.; Wan, Z.; Wang, P.; Sparrow, M.; Liu, J.; Zhou, X.; Haginoya, S. Estimation of surface long wave radiation and broadband emissivity using MODIS land surface temperature/emissivity product. J. Geophys. Res. 2005, 110, D11109. [Google Scholar] [CrossRef]
- Seemann, S.W.; Borbas, E.E.; Knuteson, R.O.; Stephenson, G.R.; Huang, H.-L. Development of a global infrared land surface emissivity database for application to clear sky sounding retrievals from multi-spectral satellite radiance measurements. J. Appl. Meteor. Climatol. 2008, 47, 108–123. [Google Scholar] [CrossRef]
- Göttsche, F.-M.; Olesen, F.-S.; Bork-Unkelbach, A. Validation of land surface temperature derived from MSG/SEVIRI with in situ measurements at Gobabeb, Namibia. Int. J. Remote Sens. 2013, 34, 3069–3083. [Google Scholar] [CrossRef]
- Göttsche, F.-M.; Hulley, G.C. Validation of six satellite-retrieved land surface emissivity products over two land cover types in a hyper-arid region. Remote Sens. Environ. 2012, 124, 149–158. [Google Scholar] [CrossRef]
- Kabsch, E.; Olesen, F.; Prata, F. Initial results of the land surface temperature (lST) validation with the Evora, Portugal ground-truth station measurements. Int. J. Remote Sens. 2008, 29, 5329–5345. [Google Scholar] [CrossRef]
- Kondratyev, K.Y. Radiation in the Atmosphere; Academic Press: New York, NY, USA, 1969. [Google Scholar]
- Simultaneous Nadir Overpasses (SNOs) Tool. Available online: http://ncc.nesdis.noaa.gov/SNOPredictions (accessed on 14 September 2015).
- Theocharous, E.; Usadi, E.; Fox, N.P. CEOS Comparison of IR Brightness Temperature Measurements in Support of Satellite Validation. Part I: Laboratory and Ocean Surface Temperature Comparison of Radiation Thermometers; National Physical Laboratory: Teddington, UK, 2010. [Google Scholar]
- Wan, Z.; Zhang, Y.; Zhang, Q.; Li, Z. Validation of the land-surface temperature products retrieved from Terra Moderate Resolution Imaging Spectroradiometer data. Remote Sens. Environ. 2002, 83, 163–180. [Google Scholar] [CrossRef]
- Wan, Z.; Zhang, Y.; Zhang, Q.; Li, Z. Quality assessment and validation of the MODIS global land surface temperature. Int. J. Remote Sens. 2004, 25, 261–274. [Google Scholar] [CrossRef]
- Coll, C.; Wan, Z.; Galve, J.M. Temperature-based and radiance-based validations of the V5 MODIS land surface temperature product. J. Geophys. Res. 2009, 114, D20102. [Google Scholar] [CrossRef]
- Hook, S.J.; Vaughan, R.G.; Tonooka, H.; Schladow, S.G. Absolute radiometric in-flight validation of mid infrared and thermal infrared data from ASTER and MODIS on the Terra spacecraft using the Lake Tahoe, CA/NV, USA, automated validation site. IEEE Trans. Geosci. Remote Sens. 2007, 45, 1798–1807. [Google Scholar] [CrossRef]
- Guillevic, P.; Privette, J.; Coudert, B.; Palecki, M.A.; Demarty, J.; Ottlé, C.; Augustine, J.A. Land Surface Temperature product validation using NOAA’s surface climate observation networks-scaling methodology for the Visible Infrared Imager Radiometer Suite (VIIRS). Remote Sens. Environ. 2012, 124, 282–298. [Google Scholar] [CrossRef]
- Hale, R.C.; Gallo, K.P.; Tarpley, D.; Yu, Y. Characterization of in situ locations for calibration/validation of satellite-derived land surface temperature data. Remote Sens. Lett. 2011, 2, 41–50. [Google Scholar] [CrossRef]
- Ermida, S.L.; Trigo, I.F.; DaCamara, C.C.; Göttsche, F.M.; Olesen, F.S.; Hulley, G. Validation of remotely sensed surface temperature over an oakwood landscape-The problem of viewing and illumination geometries. Remote Sens. Environ. 2014, 148, 16–27. [Google Scholar] [CrossRef]
- Sun, D.; Yu, Y.; Fang, L.; Liu, Y. Toward an operational land surface temperature algorithm for GOES. J. Appl. Meteor. Clim. 2013, 52, 1974–1986. [Google Scholar] [CrossRef]
- Wan, Z.; Li, Z.-L. Radiance-based validation of the V5 MODIS land-surface temperature product. Int. J. Remote Sens. 2008, 29, 5373–5395. [Google Scholar] [CrossRef]
- Jacob, F.; Petitcolin, F.; Schmugge, T.; Vermote, E.; French, A.; Ogawa, K. Comparison of land surface emissivity and radiometric temperature derived from MODIS and ASTER sensors. Remote Sens. Environ. 2004, 90, 137–152. [Google Scholar] [CrossRef]
- Trigo, I.F.; Monteiro, I.T.; Olesen, F.; Kabsch, E. An assessment of remotely sensed land surface temperature. J. Geophys. Res. 2008, 113, D17108. [Google Scholar] [CrossRef]
- Wan, Z.; Li, Z. A physics-based algorithm for land-surface emissivity and temperature from EOS/MODIS data. IEEE Trans. Geosci. Remote Sens. 1997, 35, 980–996. [Google Scholar]
- Soliman, A.; Duguay, C.; Saunders, W.; Hachem, S.P.-A. Land surface temperature from MODIS and AATSR: Product development and intercomparison. Remote Sens. 2012, 4, 3833–3856. [Google Scholar] [CrossRef]
- VIIRS Surface Type EDR ATBD. Available online: http://www.star.nesdis.noaa.gov/jpss/documents/ATBD/D0001-M01-S01-024_JPSS_ATBD_VIIRS-Surface-Type_A.pdf (accessed on 15 September 2015).
- Yu, Y.; Privette, J.L.; Pinheiro, A.C. Analysis of the NPOESS VIIRS land surface temperature algorithm using MODIS data. IEEE Trans. Geosci. Remote Sens. 2005, 43, 2340–2350. [Google Scholar]
- Hutchison, K.D.; Iisager, B.D.; Mahoney, R.L. Enhanced snow and ice identification with the VIIRS cloud mask algorithm. Remote Sens. Lett. 2013, 4, 929–936. [Google Scholar] [CrossRef]
- Kopp, T.; Heidinger, A.; Thomas, W. VIIRS Cloud Mask (VCM) Provisional Status. Available online: http://www.star.nesdis.noaa.gov/jpss/documents/meetings/2013/EDRProvReview/VCM_provisional_brief_Jan2013.pdf (accessed on 10 June 2015).
- Kopp, T.J.; Thomas, W.; Heidinger, A.K.; Botambekov, D.; Frey, R.A.; Hutchison, K.D.; Iisager, B.D.; Brueske, K.; Reed, B. The VIIRS Cloud Mask: Progress in the first year of S-NPP toward a common cloud detection scheme. J. Geophys. Res. Atmos. 2014, 119, 2441–2456. [Google Scholar] [CrossRef]
- VIIRS LST ATBD. Available online: http://www.star.nesdis.noaa.gov/jpss/documents/ATBD/D0001-M01-S01-022_JPSS_ATBD_VIIRS-LST_A.pdf (accessed on 15 September 2015).
- Li, Z.; Tang, B.; Wu, H.; Ren, H.; Yan, G.; Wan, Z.; Trigo, I.F.; Sobrino, J.A. Satellite-derived land surface temperature: current status and perspectives. Remote Sens. Environ. 2013, 131, 14–37. [Google Scholar] [CrossRef]
© 2015 by the authors; licensee MDPI, Basel, Switzerland. This article is an open access article distributed under the terms and conditions of the Creative Commons Attribution license (http://creativecommons.org/licenses/by/4.0/).
Share and Cite
Liu, Y.; Yu, Y.; Yu, P.; Göttsche, F.M.; Trigo, I.F. Quality Assessment of S-NPP VIIRS Land Surface Temperature Product. Remote Sens. 2015, 7, 12215-12241. https://doi.org/10.3390/rs70912215
Liu Y, Yu Y, Yu P, Göttsche FM, Trigo IF. Quality Assessment of S-NPP VIIRS Land Surface Temperature Product. Remote Sensing. 2015; 7(9):12215-12241. https://doi.org/10.3390/rs70912215
Chicago/Turabian StyleLiu, Yuling, Yunyue Yu, Peng Yu, Frank M. Göttsche, and Isabel F. Trigo. 2015. "Quality Assessment of S-NPP VIIRS Land Surface Temperature Product" Remote Sensing 7, no. 9: 12215-12241. https://doi.org/10.3390/rs70912215
APA StyleLiu, Y., Yu, Y., Yu, P., Göttsche, F. M., & Trigo, I. F. (2015). Quality Assessment of S-NPP VIIRS Land Surface Temperature Product. Remote Sensing, 7(9), 12215-12241. https://doi.org/10.3390/rs70912215