Visualizing and Quantifying Vineyard Canopy LAI Using an Unmanned Aerial Vehicle (UAV) Collected High Density Structure from Motion Point Cloud


Abstract
:
1. Introduction
2. Materials and Methods
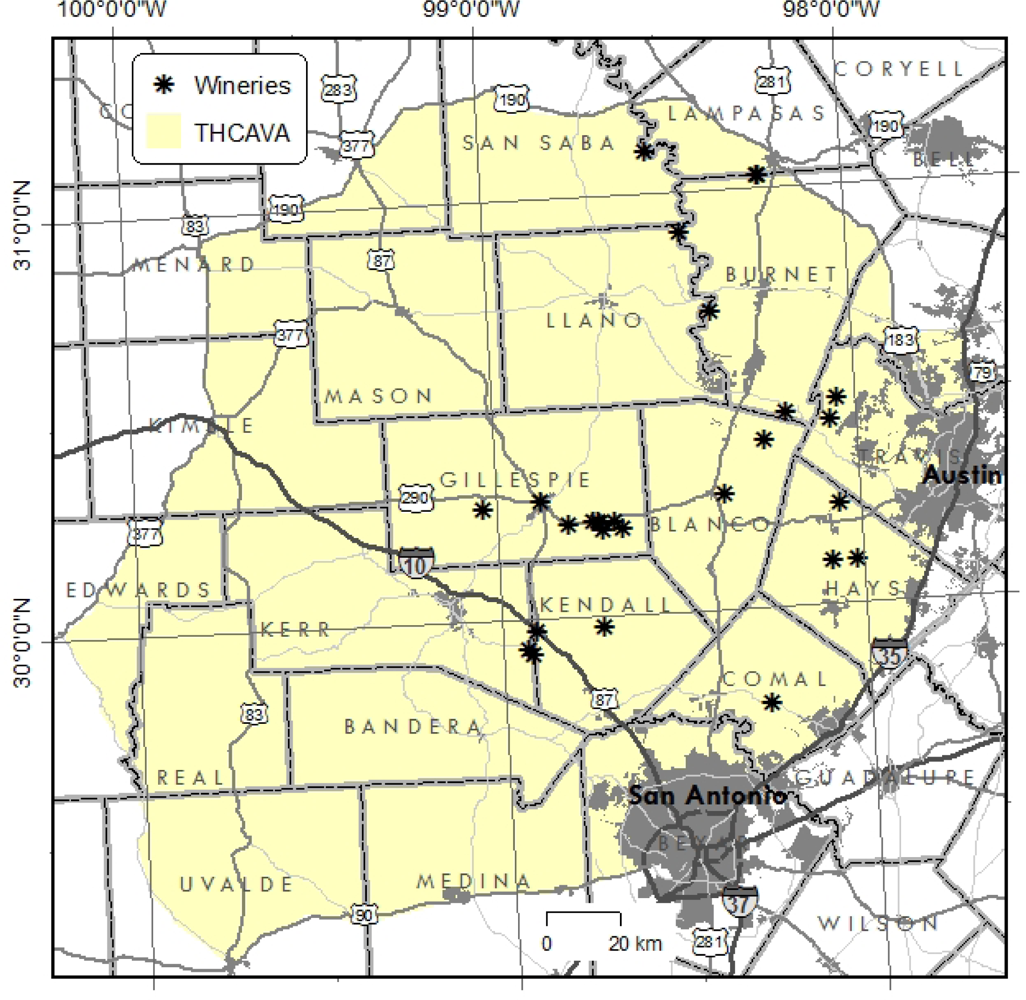
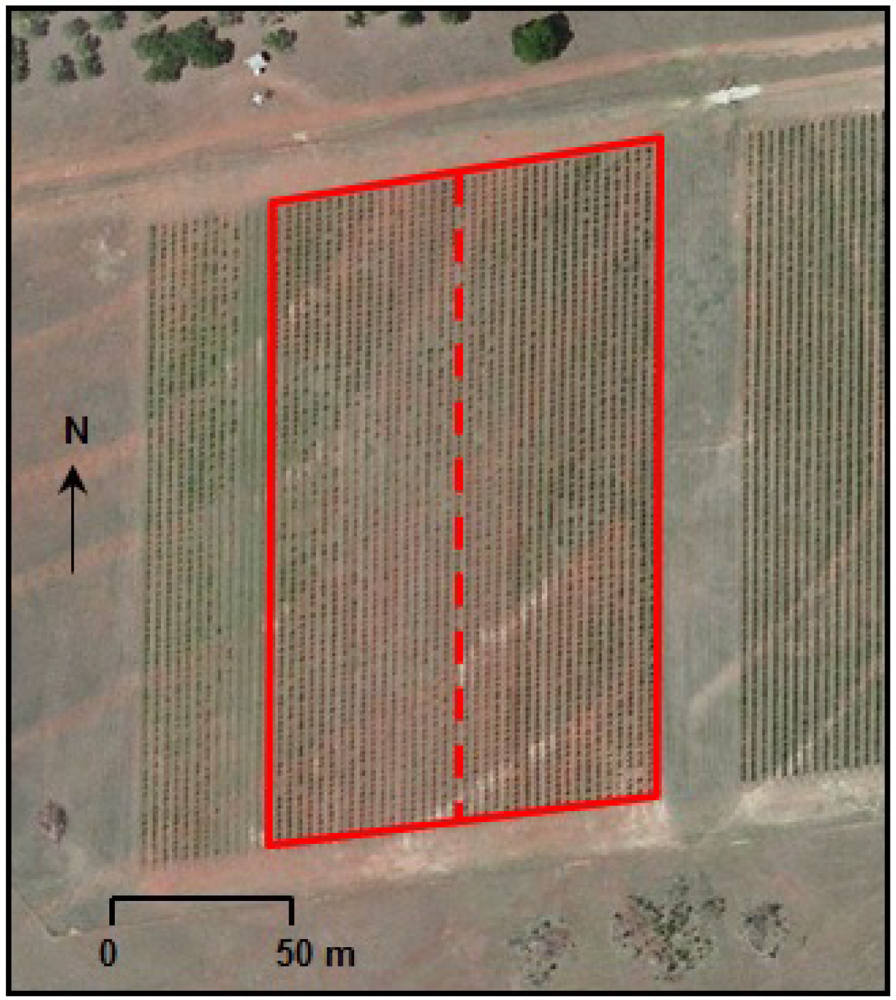
2.1. Study Site
2.2. Data Collection
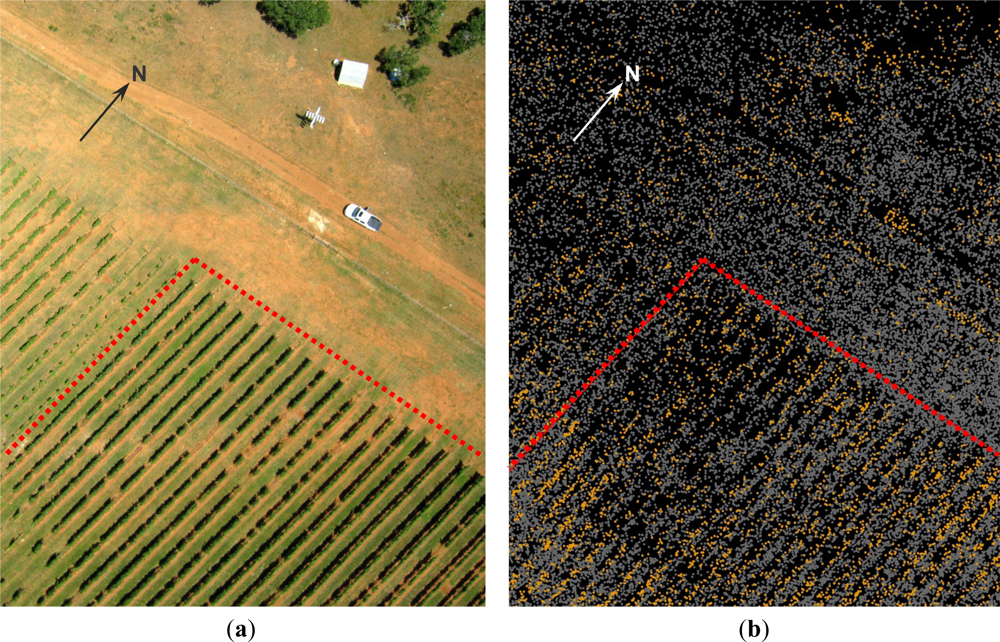
2.3. Data Processing
2.4. Data Analysis
3. Results
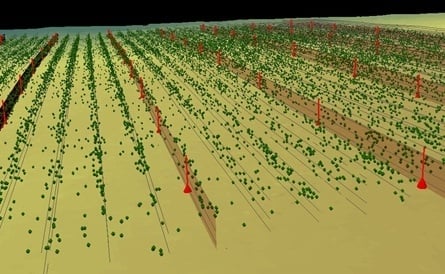
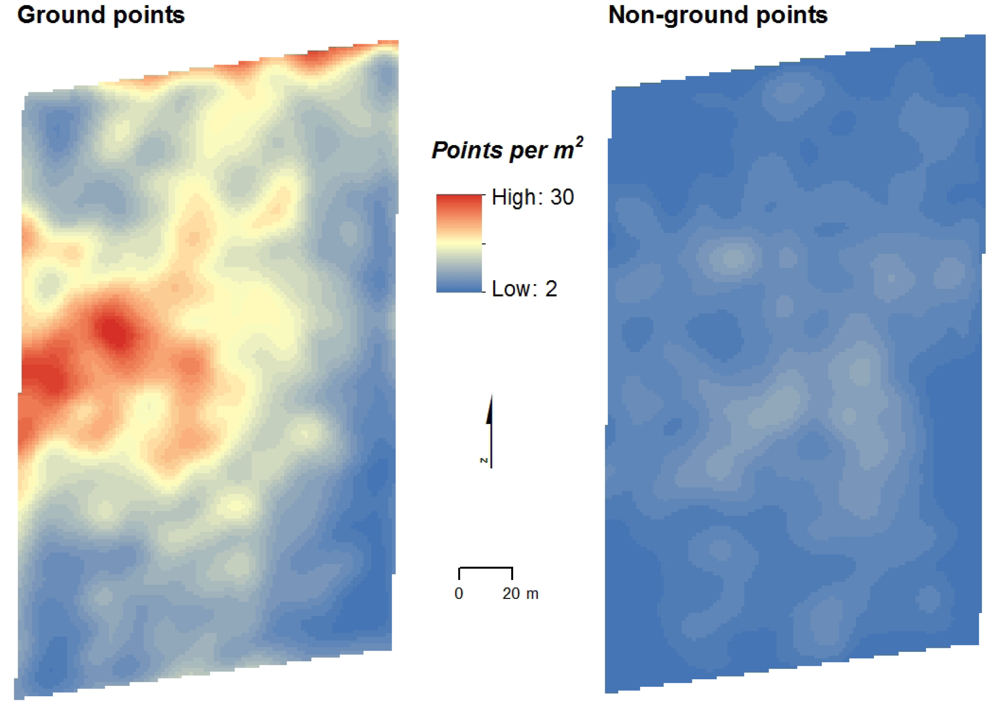
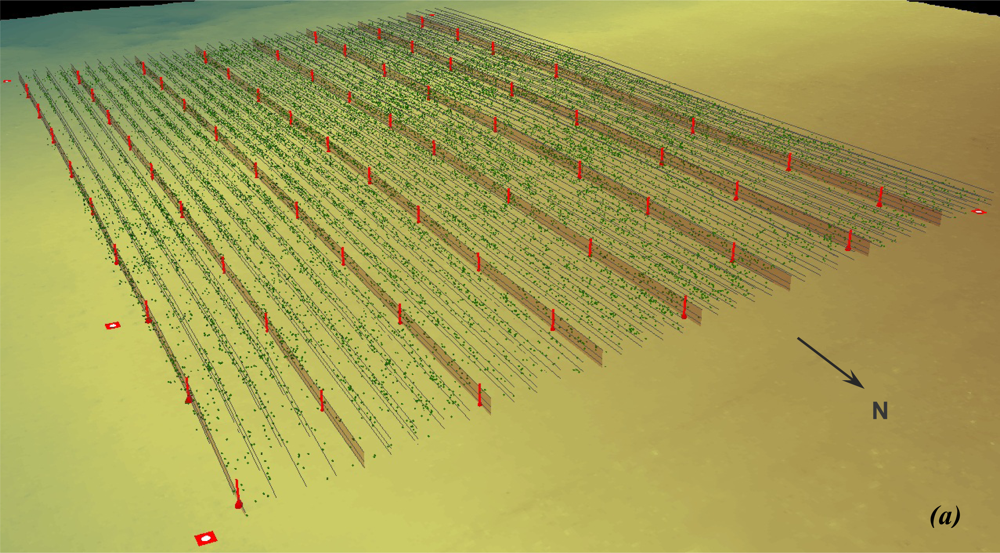
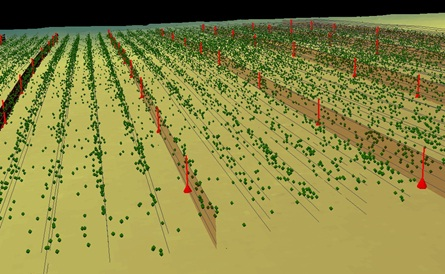
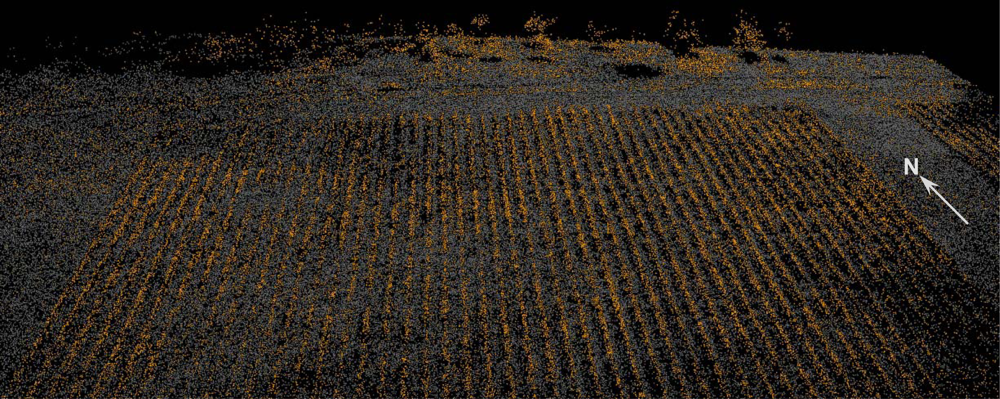
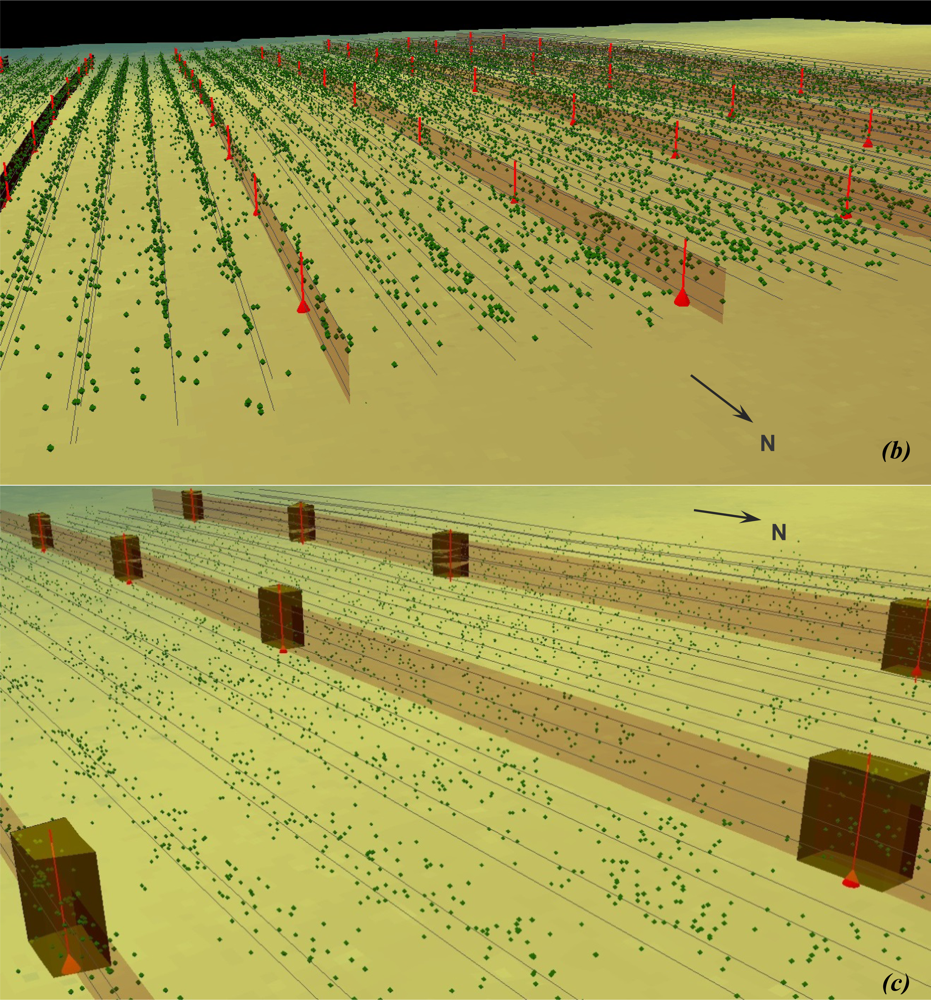
3.1. SfM Results and Point Cloud Visualization
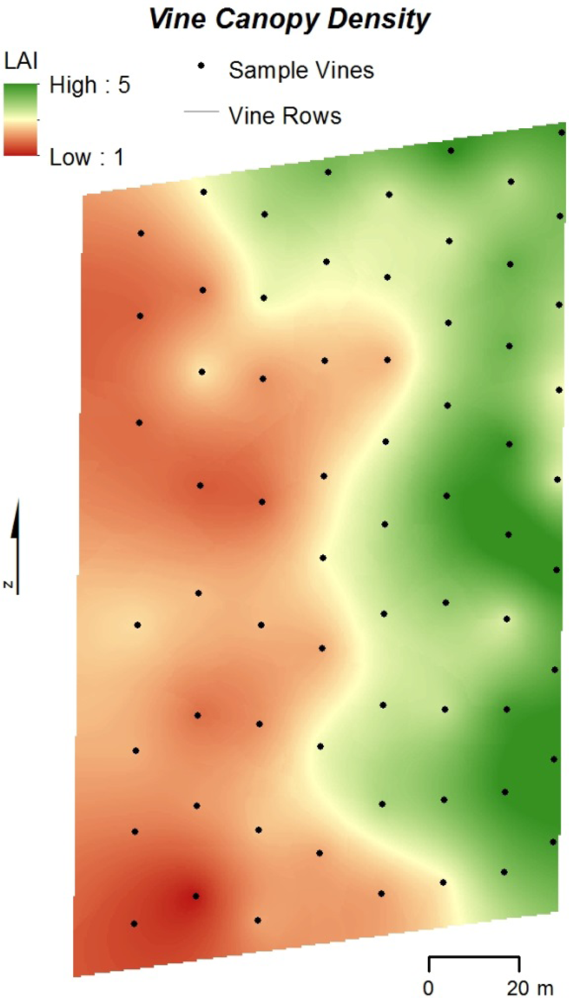
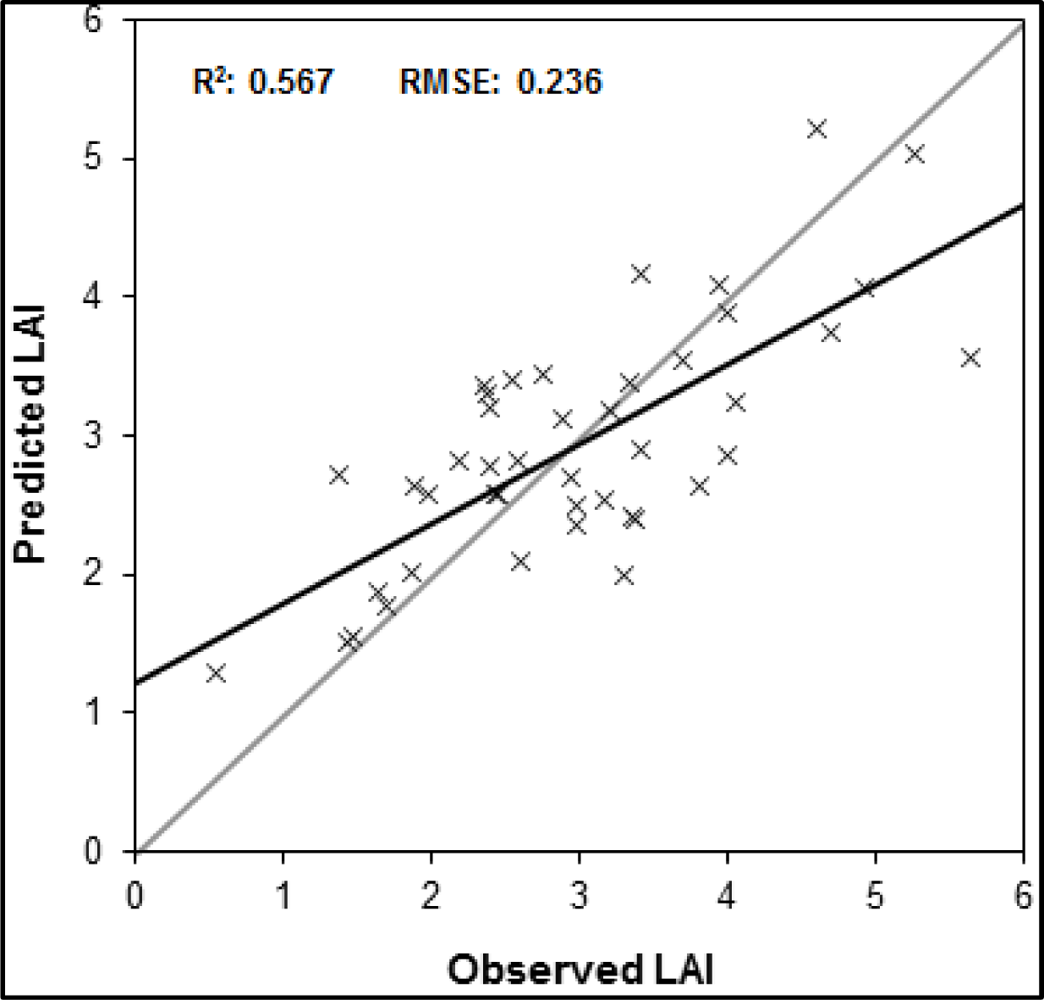
3.2. Relationship between SfM Output and LAI
4. Discussion
4.1. General Study Limitations
4.2. SfM as an Alternative Source of High-Density 3D Data
4.3. SfM LAI Estimates Compared to Lidar and Spectral-Based Approaches
4.4. Potential of SfM as a Source of 3D Data for LAI Estimation
5. Conclusions
Acknowledgments
References
- Proffitt, T.; Bramley, R.G.V.; Lamb, D.W.; Winter, E. Precision Viticulture: A New Era in Vineyard Management and Wine Production; Winetitles: Ashford, SA, Australia, 2006. [Google Scholar]
- Creasy, G.L.; Creasy, L.L. Crop Production Science in Horticulture 16: Grapes; CABI: Cambridge, UK, 2009. [Google Scholar]
- Hall, A.; Louis, J.; Lamb, D.W. Characterising and mapping vineyard canopy using high-spatial-resolution aerial multispectral images. Comput. Geosci. 2003, 23, 813–822. [Google Scholar]
- Hall, A.; Lamb, D.W.; Holzapfel, B.P.; Louis, J.P. Within-season temporal variation in correlations between vineyard canopy and winegrape composition and yield. Prec. Agr. 2011, 12, 103–117. [Google Scholar]
- Johnson, L.F.; Herwitz, S.; Dunagan, S.; Lobitz, B.; Sullivan, D.; Slye, R. Collection of Ultra High Spatial Resolution Image Data over California Vineyards with a Small UAV. Proceedings of the 30th International Symposium on Remote Sensing Environment, Honolulu, HI, USA, 10–14 November 2003.
- Johnson, L.F.; Roczen, D.E.; Youkhana, S.K.; Nemani, R.R.; Bosch, D.F. Mapping vineyard leaf area with multispectral satellite imagery. Comput. Electron. Agr. 2003, 38, 33–44. [Google Scholar]
- Rouse, J.W.; Haas, R.H.; Deering, D.W.; Schell, J.A.; Harlan, J.C. Monitoring Vegetation Systems in the Great Plains with ERTS. Proceedings of the 3rd Earth Resource Technology Satellite (ERTS) Symposium, Washington, DC, USA, 10–14 December 1973.
- Johnson, L.F. Temporal stability of an NDVI-LAI relationship in a Napa Valley vineyard. Aust. J. Grape Wine Res. 2003, 9, 96–101. [Google Scholar]
- Rosell, J.R.; Llorens, J.; Sanz, R.; Arno, J.; Ribes-Dasi, M.; Masip, J.; Escola, A.; Camp, F.; Solanelles, F.; Gracia, F.; et al. Obtaining the three-dimensional structure of tree orchards from remote 2D terrestrial LIDAR scanning. Agr. For. Meteorol. 2009, 149, 1505–1515. [Google Scholar]
- Keightley, K.E.; Bawden, G.W. 3D volumetric modeling of grapevine biomass using tripod LiDAR. Comput. Electron. Agr. 2010, 74, 305–312. [Google Scholar]
- Llorens, J.; Gil, E.; Llop, J.; Escola, A. Ultrasonic and LIDAR sensors for electronic canopy characterization in vineyards: advances to improve pesticide application methods. Sensors 2011, 11, 2177–2194. [Google Scholar]
- Llorens, J.; Gil, E.; Llop, J.; Queralto, M. Georeferenced LiDAR 3D vine plantation map generation. Sensors 2011, 11, 6237–6256. [Google Scholar]
- Sanz-Cortiella, R.; Llorens-Calveras, J.; Escola, A.; Arno-Satorra, J.; Ribes-Dasi, M.; Masip-Vilalta, J.; Camp, F.; Gracia-Aguila, F.; Solanelles-Batlle, F.; Planas-DeMarti, S.; et al. Innovative LIDAR 3D dynamic measurement system to estimate fruit-tree leaf area. Sensors 2011, 11, 5769–5791. [Google Scholar]
- Seidel, D.; Beyer, F.; Hertel, D.; Fleck, S.; Leuschner, C. 3D-laser scanning: a non-destructive method for studying above-ground biomass and growth of juvenile trees. Agr. For. Meteorol. 2011, 151, 1305–1311. [Google Scholar]
- Mathews, A.J.; Jensen, J.L.R. An airborne LiDAR-based methodology for vineyard parcel detection and delineation. Int. J. Remote Sens. 2012, 33, 5251–5267. [Google Scholar]
- Means, J.E.; Acker, S.A.; Fitt, B.J.; Renslow, M.; Emerson, L.; Hendrix, C.J. Predicting forest stand characteristics with airborne scanning Lidar. Photogramm. Eng. Remote Sensing 2000, 66, 1367–1371. [Google Scholar]
- Popescu, S.C.; Wynne, R.H.; Scrivani, J.A. Fusion of small-footprint and multispectral data to estimate plot-level volume and biomass in deciduous and pine forests in Virginia, USA. For. Sci. 2004, 50, 551–565. [Google Scholar]
- Jensen, J.L.R.; Humes, K.S.; Vierling, L.A.; Hudak, A.T. Discrete-return lidar-based prediction of leaf area index in two conifer forests. Remote Sens. Environ. 2008, 112, 3947–3957. [Google Scholar]
- Peduzzi, A.; Wynne, R.H.; Thomas, V.A.; Nelson, R.F.; Reis, J.J.; Sanford, M. Combined use of airborne Lidar and DBInSAR data to estimate LAI in temperate mixed forests. Remote Sens. 2012, 4, 1758–1780. [Google Scholar]
- Louarn, G.; Lecoeur, J.; Lebon, E. A three-dimensional statistical reconstruction model of grapevine (vitis vinifera) simulating canopy structure variability within and between cultivar/training system pairs. Ann. Bot. 2008, 101, 1167–1184. [Google Scholar]
- Omasa, K.; Hosoi, F.; Konishi, A. 3D Lidar imaging for detecting and understanding plant responses and canopy structure. J. Exp. Bot. 2007, 58, 881–898. [Google Scholar]
- Leberl, F.; Irschara, A.; Pock, T.; Meixner, P.; Gruber, M.; Scholz, S.; Weichert, A. Point clouds: Lidar versus 3D vision. Photogramm. Eng. Remote Sensing 2010, 76, 1123–1134. [Google Scholar]
- Turner, D.; Lucieer, A.; Watson, C. Development of an Unmanned Aerial Vehicle (UAV) for Hyper Resolution Mapping Based Visible, Multispectral, and Thermal Imagery. Proceedings of 34th International Symposium of Remote Sensing Environment, Sydney, NSW, Australia, 10–15 April 2011.
- Dey, A.; Mummet, L.; Sukthankar, R. Classification of Plant Structures from Uncalibrated Image Sequences. Proceedings of IEEE Workshop on Applications of Computer Vision, Breckenridge, CO, USA, 9–11 January 2012.
- Snavely, N. Scene Reconstruction and Visualization from Internet Photo Collections, 2008.
- Snavely, N.; Seitz, S.M.; Szeliski, R. Modeling the world from internet photo collections. Int. J. Comput. Vis. 2008, 80, 189–210. [Google Scholar]
- Kaminsky, R.S.; Snavely, N.; Seitz, S.T.; Szeliski, R. Alignment of 3D Point Clouds to Overhead Images. Proceedings of Second IEEE Workshop on Internet Vision, Miami, FL, USA, 20–25 June 2009.
- Dandois, J.P.; Ellis, E.C. Remote sensing of vegetation structure using computer vision. Remote Sens. 2010, 2, 1157–1176. [Google Scholar]
- Harwin, S.; Lucieer, A. Assessing the accuracy of georeferenced point clouds produced via multi-view stereopsis from unmanned aerial vehicle (UAV) imagery. Remote Sens. 2012, 4, 1573–1599. [Google Scholar]
- Rosnell, T.; Honkavaara, E. Point cloud generation from aerial image data acquired by a quadrocopter type micro unmanned aerial vehicle and a digital still camera. Sensors 2012, 12, 453–480. [Google Scholar]
- Mathews, A.J.; Jensen, J.L.R. Three-Dimensional Building Modeling Using Structure from Motion: Improving Model Results with Telescopic Pole Aerial Photography. Proceedings of 35th Applied Geography Conference, Minneapolis, MN, USA, 10–12 October 2012; pp. 98–107.
- Turner, D.; Lucieer, A.; Watson, C. An automated technique for generating georectified mosaics from ultra-high resolution unmanned aerial vehicle (UAV) imagery, based on structure from motion (SfM) point clouds. Remote Sens. 2012, 4, 1392–1410. [Google Scholar]
- Fonstad, M.A.; Dietrich, J.T.; Courville, B.C.; Jensen, J.L.; Carbonneau, P.E. Topographic structure from motion: a new development in photogrammetric measurement. Earth Surf. Proc. Landf. 2013. [Google Scholar] [CrossRef]
- Pollefeys, M.; Gool, L.V.; Vergauwen, M.; Verbiest, F.; Cornelis, K.; Tops, J. Visual modeling with a hand-held camera. Int. J. Comput. Vis. 2004, 59, 207–232. [Google Scholar]
- Stamatiadis, S.; Taskos, D.; Tsadila, E.; Christofides, C.; Tsadilas, C.; Schepers, J.S. Comparison of passive and active canopy sensors for the estimation of vine biomass production. Prec. Agr. 2010, 11, 306–315. [Google Scholar]
- Aber, J.S.; Marzoff, I.; Ries, J.B. Small-Format Aerial Photography: Principles, Techniques and Geosciences Applications; Elsevier: Oxford, UK, 2010. [Google Scholar]
- Lopez-Lozano, R.; Casterad, M.A. Comparison of different protocols for indirect measurement of leaf area index with ceptometers in vertically trained vineyards. Aust. J. Grape Wine Res. 2013, 19, 116–122. [Google Scholar]
- Axelsson, P. DEM generation from laser scanner data using adaptive TIN models. Int. Arch. Photogramm. Remote Sens. Spat. Sci. Inform. 2000, 33, 110–117. [Google Scholar]
- Hyer, E.J.; Goetz, S.J. Comparison and sensitivity analysis of instruments and radiometric methods for LAI estimation: Assessments from a boreal forest site. Agr. For. Meteorol. 2004, 122, 157–174. [Google Scholar]
- Garrigues, S.; Shabanov, N.V.; Swanson, K.; Morisette, J.T.; Baret, F. Intercomparison and sensitivity analysis of leaf area index retrievals from LAI-2000, AccuPar, and digital hemispherical photography over croplands. Agr. For. Meteorol. 2008, 148, 1193–1209. [Google Scholar]
- Arno, J.; Escola, A.; Valles, J.M.; Llorens, J.; Sanz, R.; Masip, J.; Palacin, J.; Rosell-Polo, J.R. Leaf area index estimation in vineyards using a ground-based LiDAR scanner. Prec. Agr. 2012. [Google Scholar] [CrossRef] [Green Version]
- Hall, A.; Louis, J.P.; Lamb, D.W. Low-resolution remotely sensed images of winegrape vineyards map spatial variability in planimetric canopy area instead of leaf area index. Aust. J. Grape Wine Res. 2008, 14, 9–17. [Google Scholar]
- Zhao, K.; Popescu, S.C. Lidar-based mapping of leaf area index and its use for validating GLOBCARBON satellite LAI product in a temperate forest of the southern USA. Remote Sens. Environ. 2009, 113, 1628–1645. [Google Scholar]
- Barilotti, A.; Turco, S.; Alberti, G. LAI Determination in Forestry Ecosystem by Lidar Data Analysis. Proceedings of Workshop 3D Remote Sensing in Forestry, Vienna, Austria, 14–15 February 2006.


| Total Images | Discarded Images | Input Images | Entire Point Cloud | Noise Removed | Classified | |
|---|---|---|---|---|---|---|
| Ground | Non-Ground | |||||
| 206 | 5 | 201 | 462,959 | 30,775 | 333,835 | 98,349 |
| 100.0% | 2.4% | 97.6% | 100.0% | 6.7% | 72.1% | 21.2% |
| R2: 0.567 | R2 Adj.: 0.495 | RMSE: 0.236, n: 44 | F Ratio: 7.86 | p < 0.0001 | ||||
|---|---|---|---|---|
| Term | Estimate | Standard Error | t Ratio | Prob > |t|, α = 0.05 |
| Intercept | 4.61 | 0.979 | 4.71 | <0.001 |
| Var | 4.77 | 1.97 | 2.42 | 0.020 |
| CV | −5.05 | 1.58 | −3.19 | 0.003 |
| Per5 | −2.91 | 0.565 | −5.16 | <0.001 |
| Per9 | 1.85 | 0.422 | 1.38 | <0.001 |
| Per10-5 | −0.716 | 0.289 | −2.48 | 0.018 |
| RatioPer6 | −2.45 | 0.996 | −2.51 | 0.017 |
| = 4.61 + (4.77 × Var) − (5.05 × CV) − (2.91 × Per5) + (1.85 × Per9) − (0.716 × Per10-5) − (2.45 × RatioPer6) | ||||
© 2013 by the authors; licensee MDPI, Basel, Switzerland This article is an open access article distributed under the terms and conditions of the Creative Commons Attribution license ( http://creativecommons.org/licenses/by/3.0/).
Share and Cite
Mathews, A.J.; Jensen, J.L.R. Visualizing and Quantifying Vineyard Canopy LAI Using an Unmanned Aerial Vehicle (UAV) Collected High Density Structure from Motion Point Cloud. Remote Sens. 2013, 5, 2164-2183. https://doi.org/10.3390/rs5052164
Mathews AJ, Jensen JLR. Visualizing and Quantifying Vineyard Canopy LAI Using an Unmanned Aerial Vehicle (UAV) Collected High Density Structure from Motion Point Cloud. Remote Sensing. 2013; 5(5):2164-2183. https://doi.org/10.3390/rs5052164
Chicago/Turabian StyleMathews, Adam J., and Jennifer L. R. Jensen. 2013. "Visualizing and Quantifying Vineyard Canopy LAI Using an Unmanned Aerial Vehicle (UAV) Collected High Density Structure from Motion Point Cloud" Remote Sensing 5, no. 5: 2164-2183. https://doi.org/10.3390/rs5052164
APA StyleMathews, A. J., & Jensen, J. L. R. (2013). Visualizing and Quantifying Vineyard Canopy LAI Using an Unmanned Aerial Vehicle (UAV) Collected High Density Structure from Motion Point Cloud. Remote Sensing, 5(5), 2164-2183. https://doi.org/10.3390/rs5052164