Forecasting Regional Sugarcane Yield Based on Time Integral and Spatial Aggregation of MODIS NDVI


Abstract
:1. Introduction
2. Data and Methods
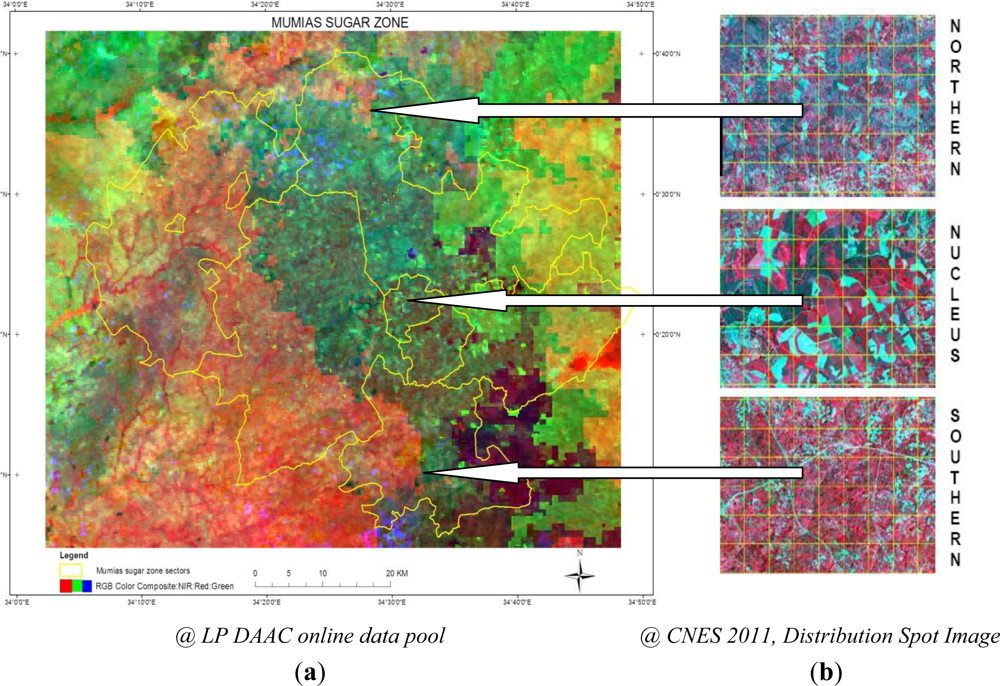
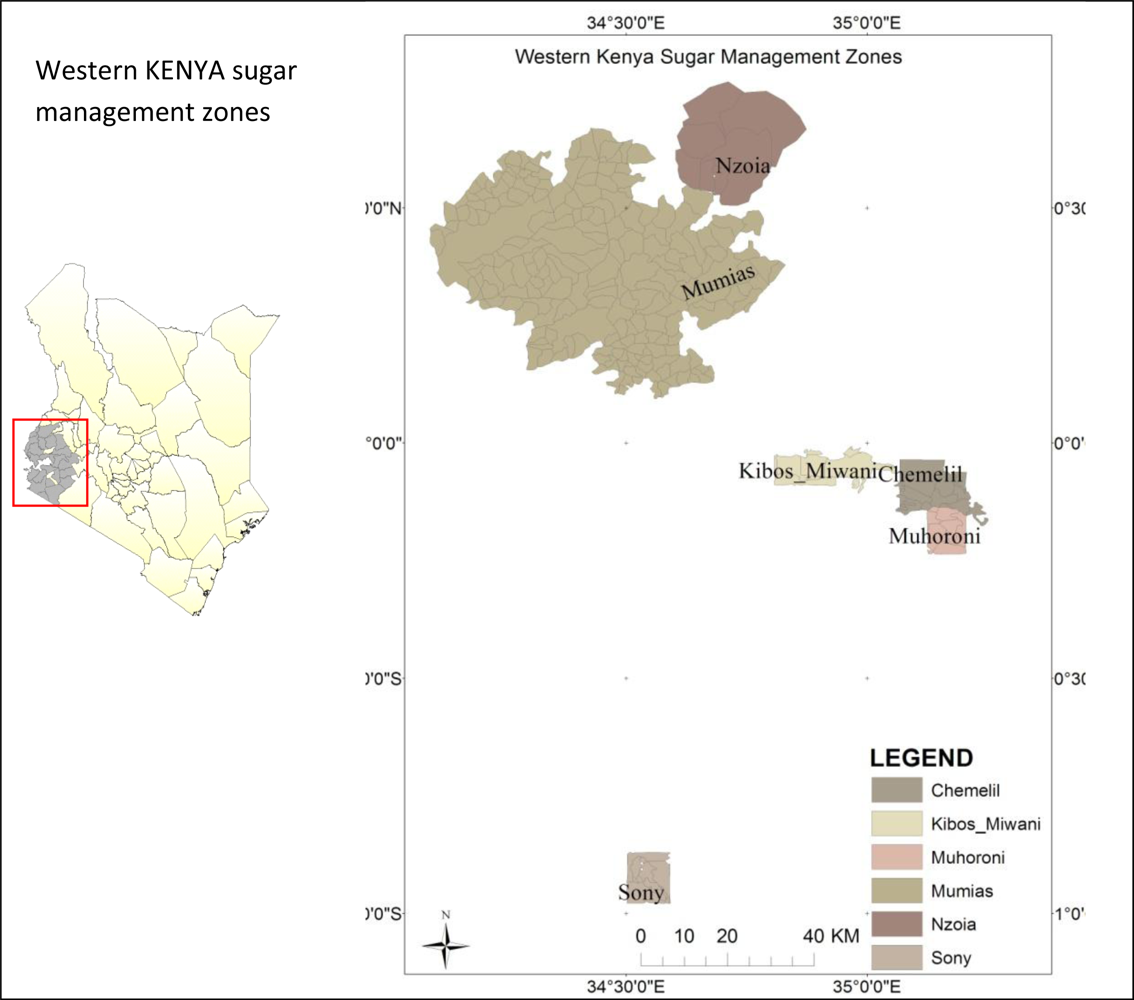
2.1. Study Area
2.2. Data
2.2.1. Satellite Data and Pre-Processing
2.2.2. Agronomic and Climatic Data
2.3. Data Analysis
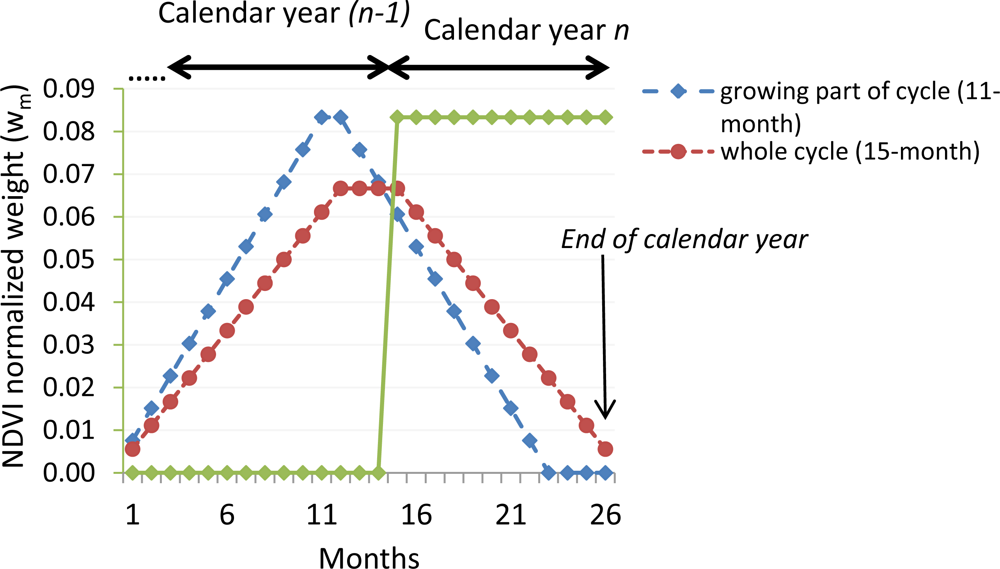
2.3.1. Time-Integration of NDVI Values
2.3.2. Spatio-Temporal Analysis
3. Results and Discussion
3.1. Yield and Climatic Data Variability
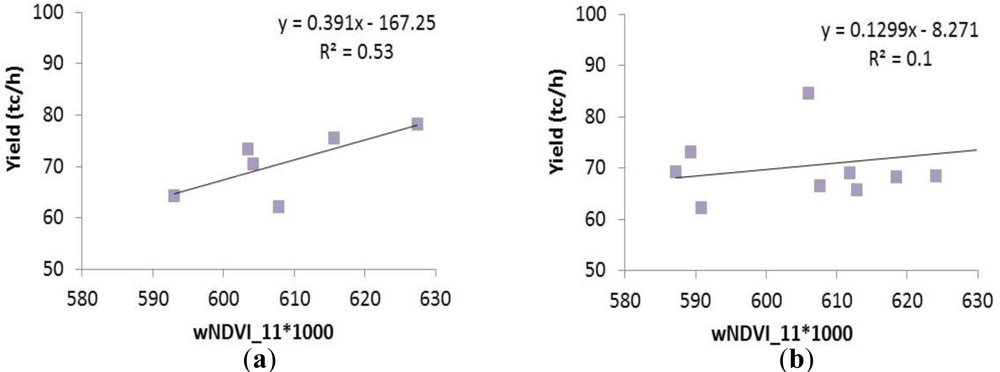
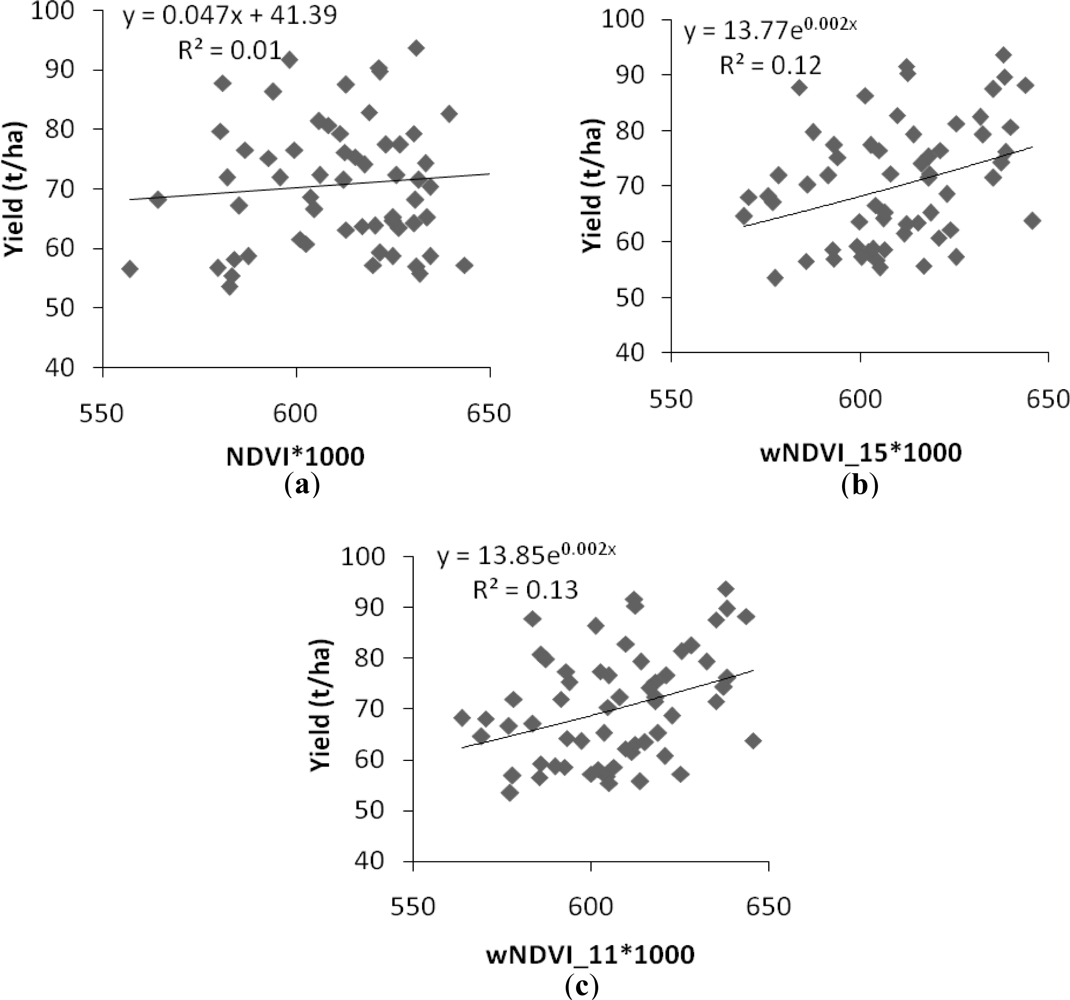
3.2. Relationship between Yield and NDVI
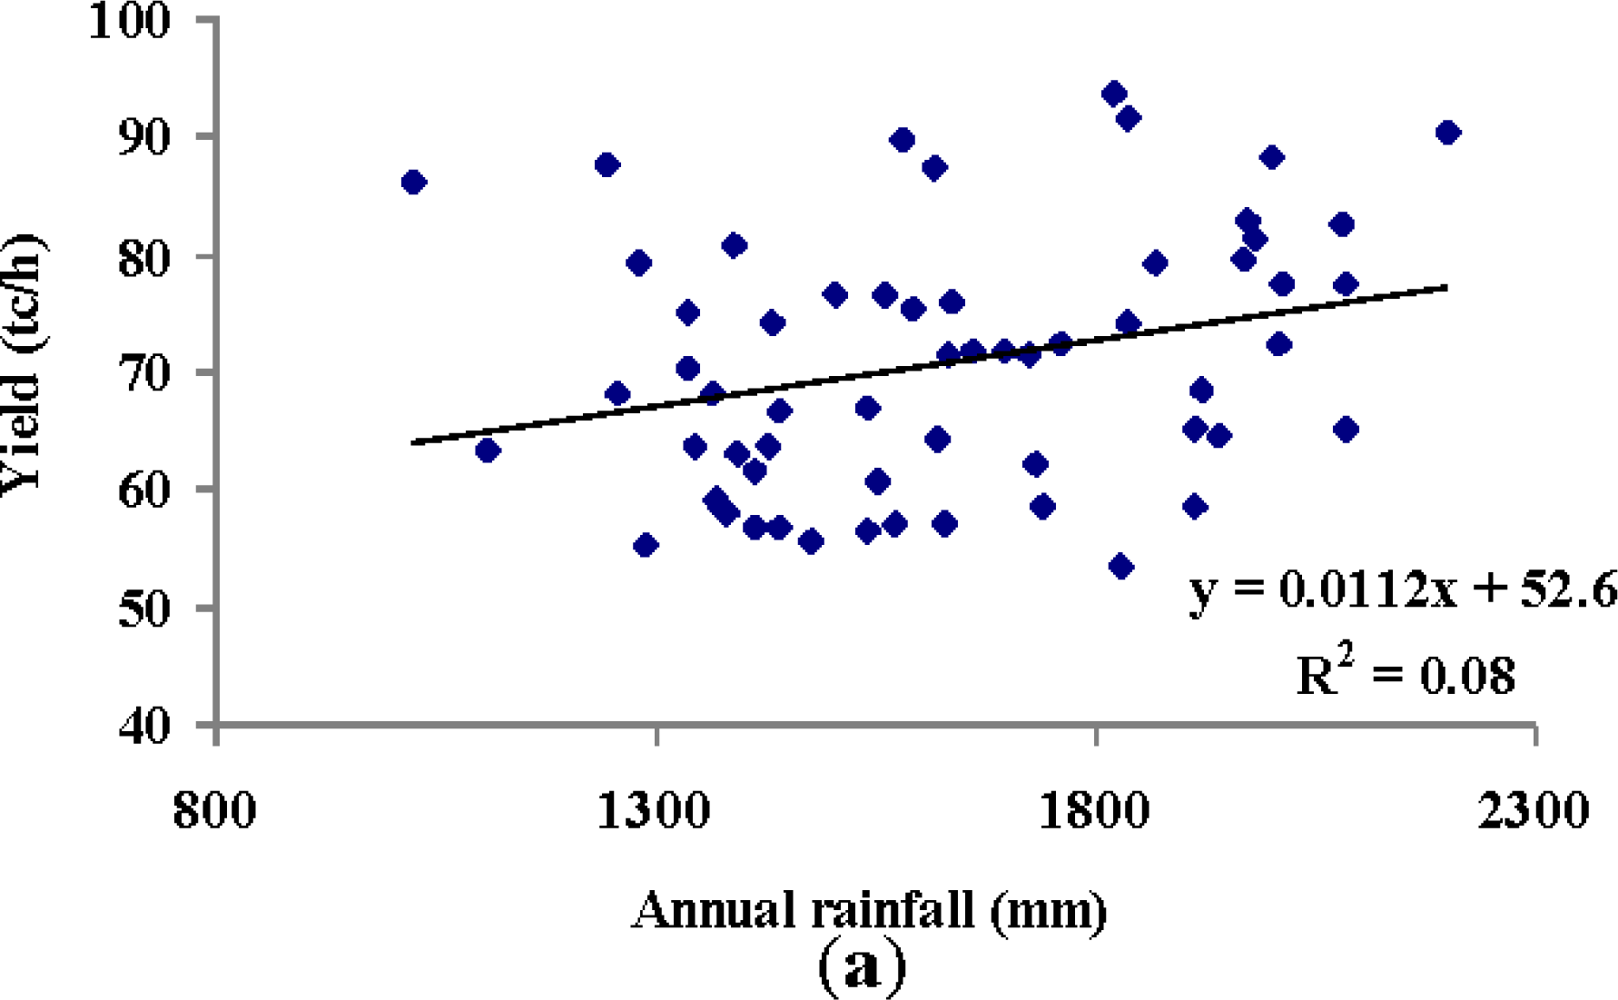
3.3. Relationship between Yield and Rainfall
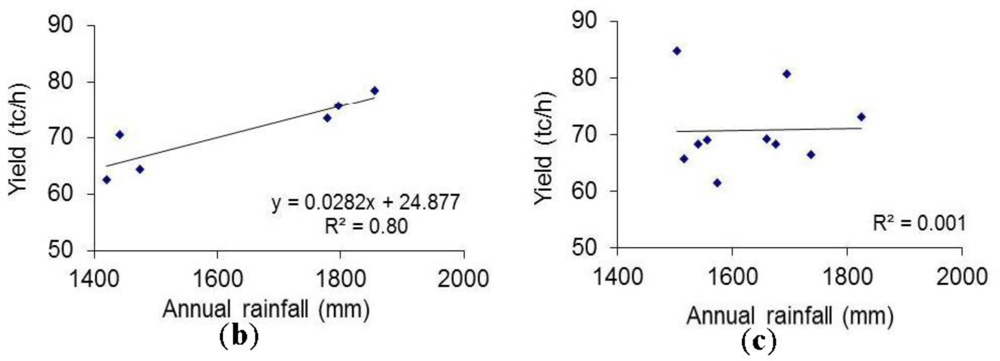
3.4. Relationship between Yield-wNDVI Slope and Rainfall
3.5. A Quantitative Evaluation of the Model
4. General Discussion and Conclusions
Acknowledgments
- Conflict of InterestThe authors declare no conflict of interest.
References
- Kenya Sugar Research Foundation (KESREF). Sugarcane Growers’ Guide; Kenya Sugar Research Foundation: Kisumu, Kenya, 2010. [Google Scholar]
- Bastidas-Obando, E.; Carbonell-Gonzalez, J. Evaluating the Applicability of MODIS Data for Forecasting Sugarcane Yields in Colombia. In Proceedings of International Society of Sugar Cane Technologists (ISSCT), Durban, South Africa, 29 July–2 August 2007.
- Kenya Sugar Board. Cane Census 2009/2010–2010/2011. In Agriculture; Kenya Sugar Board: Nairobi, Kenya, 2009. [Google Scholar]
- Lofton, J.; Tubana, B.S.; Kanke, Y.; Teboh, J.; Viator, H.; Dalen, M. Estimating sugarcane yield potential using an in-season determination of normalized difference vegetative index. Sensors 2012, 12, 7529–7547. [Google Scholar]
- Lamb, J.A.; Dowdy, R.H.; Anderson, J.L.; Rehm, G.W. Spatial and temporal stability of corn grain yields. J. Prod. Agr. 1997, 10, 410–414. [Google Scholar]
- Longley, P.A.; Goodchild, M.F.; Maguire, D.J.; Rhind, D.W. Geographical Information Systems (Abridged): Principles, Techniques, Management, and Applications; John Wiley & Sons, Inc: Hoboken, NJ, USA, 2005; p. 358. [Google Scholar]
- Pettorelli, N.; Vik, J.O.; Mysterud, A.; Gaillard, J.M.; Tucker, C.J.; Stenseth, N.C. Using the satellite-derived NDVI to assess ecological responses to environmental change. Trends Ecol. Evol. 2005, 20, 503–510. [Google Scholar]
- Zarco-Tejada, P.J.; Ustin, S.L.; Whiting, M.L. Temporal and spatial relationships between within-field yield variability in cotton and high-spatial hyperspectral remote sensing imagery. Agron. J. 2005, 97, 641–653. [Google Scholar]
- El Hajj, M.; Bégué, A.; Guillaume, S.; Martiné, J.-F. Integrating SPOT-5 time series, crop growth modeling and expert knowledge for monitoring agricultural practices—The case of sugarcane harvest on Reunion Island. Remote Sens. Environ. 2009, 113, 2052–2061. [Google Scholar]
- Bégué, A.; Lebourgeois, V.; Bappel, E.; Todoroff, P.; Pellegrino, A.; Baillarin, F.; Siegmund, B. Spatio-temporal variability of sugarcane fields and recommendations for yield forecast using NDVI. Int. J. Remote Sens. 2010, 31, 5391–5407. [Google Scholar]
- Gunnula, W.; Kosittrakun, M.; Righetti, T.; Weerathaworn, P.; Prabpan, M. Normalized difference vegetation index relationships with rainfall patterns and yield in small plantings of rain-fed sugarcane. Aust. J. Crop Sci. 2011, 5, 1845–1851. [Google Scholar]
- Goward, S.N.; Dye, D.G. Evaluation North American net primary productivity with satellite observations. Adv. Space Res. 1987, 7, 165–174. [Google Scholar]
- Prince, S.D. Satellite remote sensing of primary production: Comparison of results for Sahellian grassland 1981–1988. Int. J. Remote Sens. 1991, 12, 1301–1312. [Google Scholar]
- Atzberger, C. Advances in remote sensing of agriculture: Context description, existing operational monitoring systems and major information needs. Remote Sens. 2013, 5, 949–981. [Google Scholar]
- Fernandes, J.L.; Rocha, J.V.; Lamparelli, R.A.C. Sugarcane yield estimates using time series analysis of SPOT Vegetation images. Sci. Agr. 2011, 6, 139–146. [Google Scholar]
- Bastiaanssen, W.G.M.; Ali, S. A new crop yield forecasting model based on satellite measurements applied across the Indus Basin, Pakistan. Agr. Ecosyst. Environ. 2003, 94, 321–340. [Google Scholar]
- Gonçalves, R.R.V.; Zullo, J., Jr; Romani, L.A.S.; Nascimento, C.R.; Traina, A.J.M. Analysis of NDVI time series using cross-correlation and forecasting methods for monitoring sugarcane fields in Brazil. Int. J. Remote Sens. 2012, 33, 4653–4672. [Google Scholar]
- Funk, C.; Budde, E.M. Phenologically-tuned MODIS NDVI-based production anomaly estimates for Zimbabwe. Remote Sens. Environ. 2009, 113, 115–125. [Google Scholar]
- Mulianga, B.; Bégué, A.; Simoes, M.; Todoroff, P.; Clouvel, P. MODIS Data for Forecasting Sugarcane Yield in Kenya through a Zonal Approach. In Proceedings of the Sentinel-2 Preparatory Symposium, Frascati (IT), Frascati, Italy, 23–27 April 2012.
- Nguyen, T.T.H. Spatial and temporal unmixing of coarse resolution polar orbiter observations for sugarcane yield assessments—A seasonal integration method based on MODIS and MISR FPAR estimates in Xinavane, Mozambique.
- Rojas, O. Operational maize yield model development and validation based on remote sensing and agrometeorologal data in Kenya. Int. J. Remote Sens. 2007, 28, 3775–3793. [Google Scholar]
- Kastens, J.H.; Kastens, T.L.; Kastens, D.L.A.; Price, K.P.; Martinko, E.A.; Lee, R.-Y. Image masking for crop yield forecasting using AVHRR NDVI time series imagery. Remote Sens. Environ. 2005, 99, 341–356. [Google Scholar]
- Kenya Sugar Board. Year Book of Statistics. Sugar Board Papers; Kenya Sugar Board: Nairobi, Kenya, 2010.
- Ribot, J.C.; Magalhães, A.R.; Panagides, S.S. Climate Variability, Climate Change and Social Vulnerability in the Semi-Arid Tropics; Cambridge University Press: Cambridge, UK, 2005. [Google Scholar]
- Shisanya, C.; Recha, C.; Anyamba, A. Rainfall variability and its impact on normalized difference vegetation index in arid and semi arid lands of Kenya. Int. J. Geosci. 2011, 2, 36–47. [Google Scholar]
- Amolo, R.; Abayo, G.; Muturi, S.; Rono, J. The Impact of Planting and Harvesting Time on Sugarcane Productivity in Kenyan Sugar Industry; KESREF: Kisumu, Kenya, 2009; Volume 3, pp. 18–27. [Google Scholar]
- Jaetzold, R.; Schmidt, H.; Hornetz, B.; Shisanya, C. Farm Management Handbook of Kenya—Natural Conditions and Farm Management Information; Ministry of Agriculture, Farm Management Section: Nairobi, Kenya, 1985; Volume 2, p. 317. [Google Scholar]
- United States Geological Survey (USGS)-Global Visualization Viewer (GloVis). NASA Land Processes Distributed Active Archive Center (LP DAAC). Online Data Pool. Available online: https://lpdaac.usgs.gov/get_data (accessed on 7 December 2012).
- Rouse, J.W.; Hass, R.H.; Schell, J.A.; Deering, D.W. Monitoring Vegetation Systems in the Great Plains with ERTS. Proceedings of the Third Earth Resources Technology Satellite-1 Symposium, Washington, DC, USA, 10–14 December 1973; pp. 309–317.
- Cunha, M.; Andre, R.S.M.; Lisa, S. Very early prediction of wine yield based on satellite data from vegetation. Int. J. Remote Sens. 2010, 31, 3125–3142. [Google Scholar]
- Duveiller, G.; López, L.R.; Baruth, B. Enhanced processing of 1-km spatial resolution fAPAR time series for sugarcane yield forecasting and monitoring. Remote Sens. 2013, 5, 1091–1116. [Google Scholar]
- Rasmussen, M.S. Assessment of millet yields and production in northern Burkina Faso using integrated NDVI from the AVHRR. Int. J. Remote Sens. 1992, 13, 3431–3442. [Google Scholar]
- Veron, S.R.; Oesterheld, M.; Paruelo, J.M. Production as a function of resource availability: Slopes and efficiencies are different. J. Veg. Sci. 2005, 16, 351–354. [Google Scholar]


| KIBOS | MUMIAS | CHEMELIL | MUHORONI | SONY | NZOIA | |
|---|---|---|---|---|---|---|
| Rainfall (mm·yr−1) | 1,421 (102) | 1,835 (186) | 1,426 (263) | 1,486 (214) | 1,869 (221) | 1,763 (252) |
| Yield (t·ha−1) | 71.1 (9.6) | 75.6 (11.1) | 62.6 (9.6) | 63.9 (7.9) | 80.1 (11.3) | 75.0 (5.2) |
| Sugarcane fraction (%) | 32.2 (4.5) | 48.7 (2.5) | 38.8 (6.3) | 50.5 (7.3) | 33.3 (5.3) | 22.2 (2.7) |
| Zone | wNDVI_11 | Model Yield (t·ha−1) | Measured Yield (t·ha−1) | Squared Error (t·ha−1) |
|---|---|---|---|---|
| Mumias | 566.5 | 54.2 | 48 | 38.44 |
| Nzoia | 602.8 | 68.4 | 64.7 | 13.69 |
| Chemelil | 586.9 | 62.2 | 59 | 10.24 |
| Muhoroni | 604.4 | 69.1 | 63.6 | 30.25 |
| Kibos | 596.1 | 65.8 | 62.7 | 9.61 |
| Sony | 610.5 | 71.5 | 69 | 6.25 |
| RMSE | 4.25 |
© 2013 by the authors; licensee MDPI, Basel, Switzerland This article is an open access article distributed under the terms and conditions of the Creative Commons Attribution license ( http://creativecommons.org/licenses/by/3.0/).
Share and Cite
Mulianga, B.; Bégué, A.; Simoes, M.; Todoroff, P. Forecasting Regional Sugarcane Yield Based on Time Integral and Spatial Aggregation of MODIS NDVI. Remote Sens. 2013, 5, 2184-2199. https://doi.org/10.3390/rs5052184
Mulianga B, Bégué A, Simoes M, Todoroff P. Forecasting Regional Sugarcane Yield Based on Time Integral and Spatial Aggregation of MODIS NDVI. Remote Sensing. 2013; 5(5):2184-2199. https://doi.org/10.3390/rs5052184
Chicago/Turabian StyleMulianga, Betty, Agnès Bégué, Margareth Simoes, and Pierre Todoroff. 2013. "Forecasting Regional Sugarcane Yield Based on Time Integral and Spatial Aggregation of MODIS NDVI" Remote Sensing 5, no. 5: 2184-2199. https://doi.org/10.3390/rs5052184
APA StyleMulianga, B., Bégué, A., Simoes, M., & Todoroff, P. (2013). Forecasting Regional Sugarcane Yield Based on Time Integral and Spatial Aggregation of MODIS NDVI. Remote Sensing, 5(5), 2184-2199. https://doi.org/10.3390/rs5052184