SAR Images Statistical Modeling and Classification Based on the Mixture of Alpha-Stable Distributions
Abstract
:1. Introduction
2. Mixture of Alpha-Stable Distributions
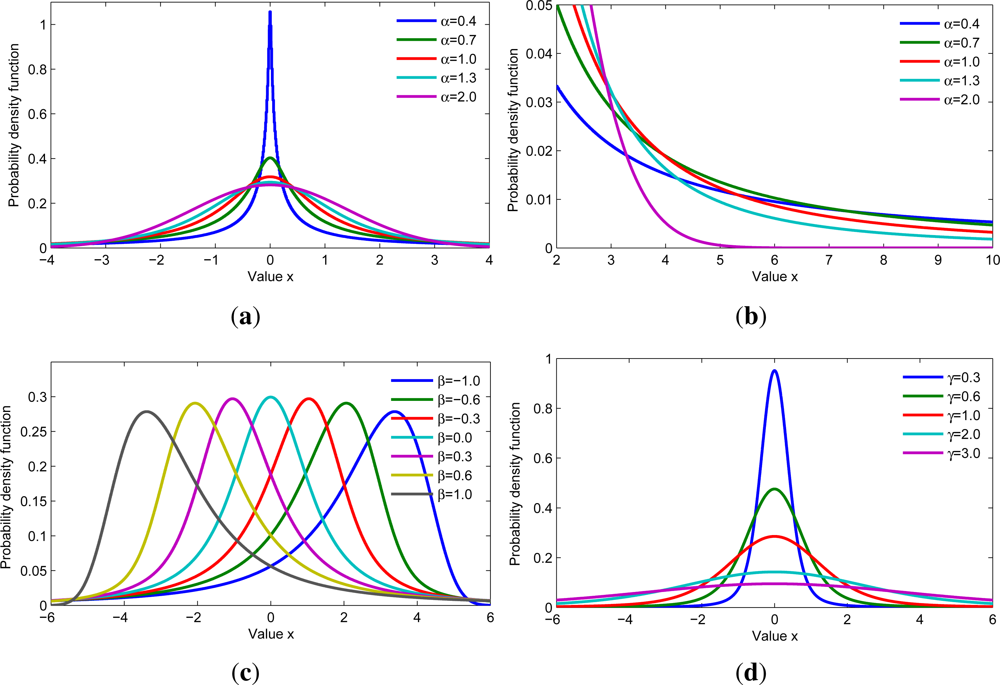
2.1. Alpha-Stable Distribution
2.2. Mixture of Alpha-Stable (MAS) Distributions
2.3. PSA Estimator for MAS Distributions
| 1: | Input: |
| X = {xj}, , , k = 1, 2, … , K, L, T(0), Iter | |
| 2: | for each t < Iter do |
| 3: | Decrease temperature |
| 4: | Assign initial parameters , , k = 1, 2, … , K |
| 5: | For each data sample xj, obtain allocation variable zj using Equation (6) |
| 6: | Update parameters of the proposal distribution q(·|·) = N (·|δ, σ): set δ to value of the previous iteration and set σ to the standard deviation of the previous L estimations if t > L, otherwise set σ to its initialization value |
| 7: | Sample new candidates from proposal distribution q(·|·) = N (·|δ, σ) for each component |
| 8: | Accept according to Equation (8) and set , otherwise set |
| 9: | Obtain weight ω = (ω1, … , ωk, …, ωK) of each component as in [27] by drawing samples from distribution ω ∼ D, where D(ζ + n1, …, ζ + nk, … ,ζ + nK) is the Dirichlet distribution with ζ > 0, and nk is the number of samples assigned to the kth component |
| 10: | end for |
| 11: | Output: |
| θk = (αk, βk, γk, μk), ωk, k = 1, 2, …, K |
2.4. Simulation Result for PSA Estimator on MAS Distributions
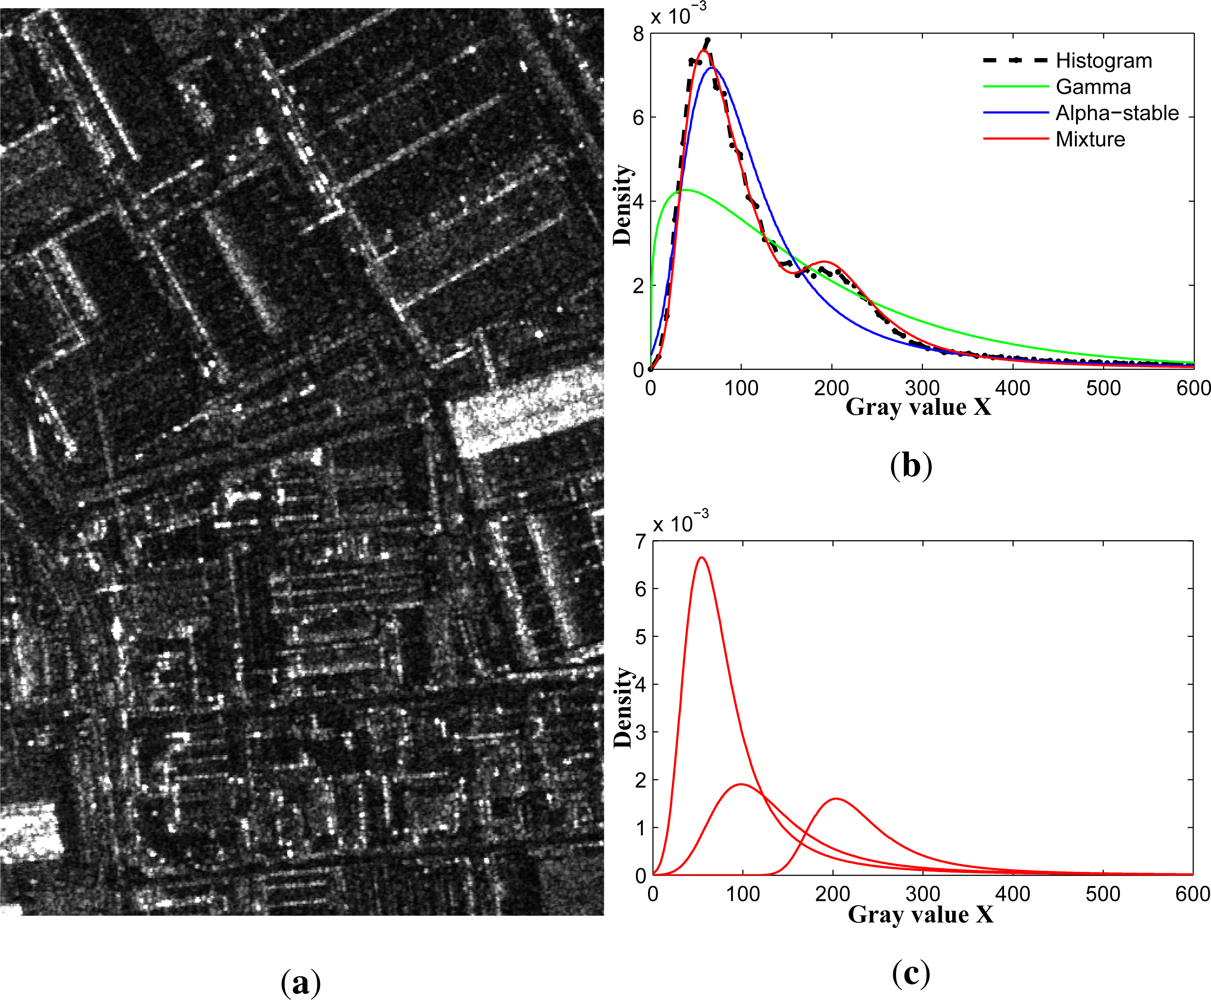
3. MAS-Based Statistical Modeling of SAR Images
4. MAS-Based MRF Classification Algorithm
4.1. MRF-Based Segmentation
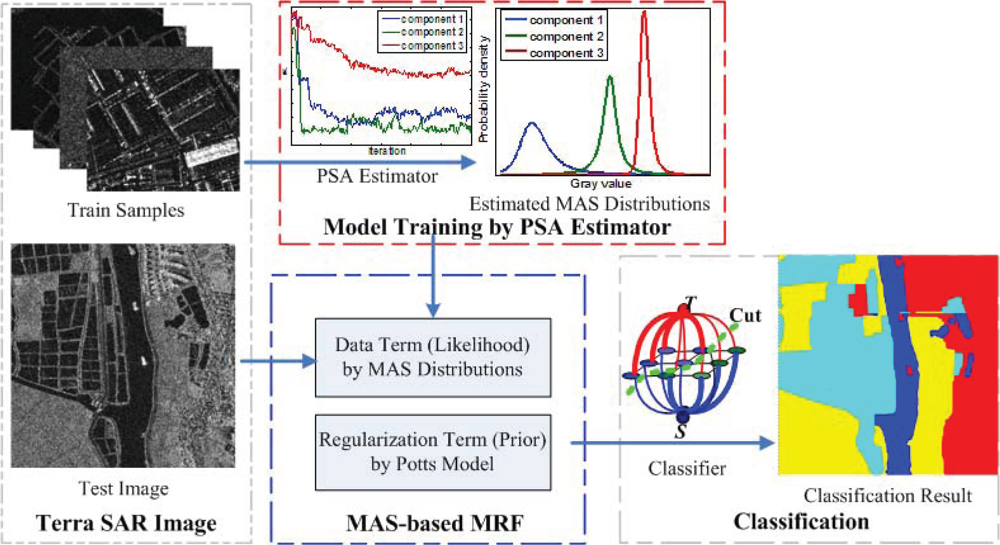
4.2. MAS-Based MRF Classification Algorithm
5. Experiment and Result Analysis
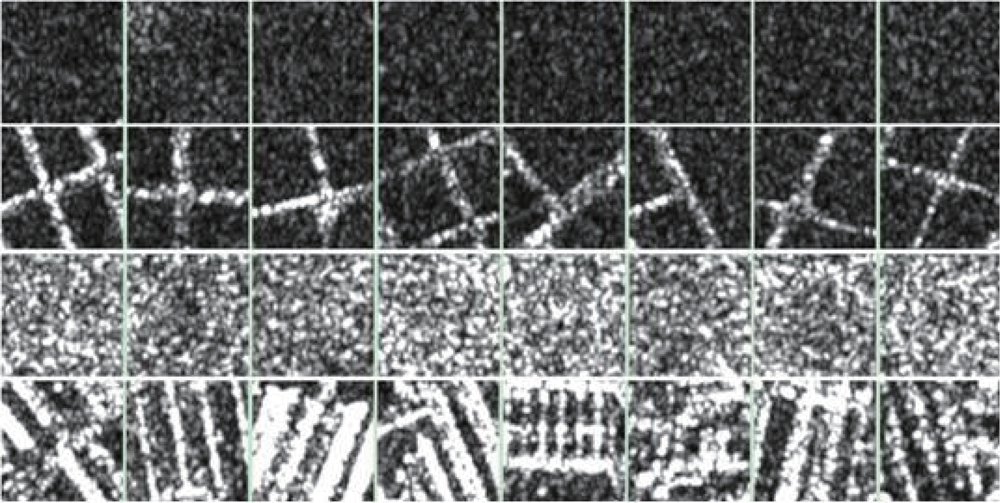
5.1. Experimental Data
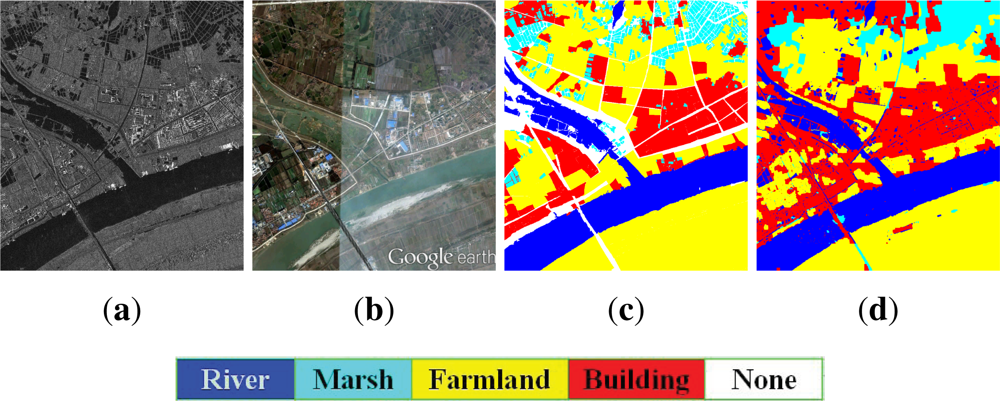
5.1.1. Wuhan Data
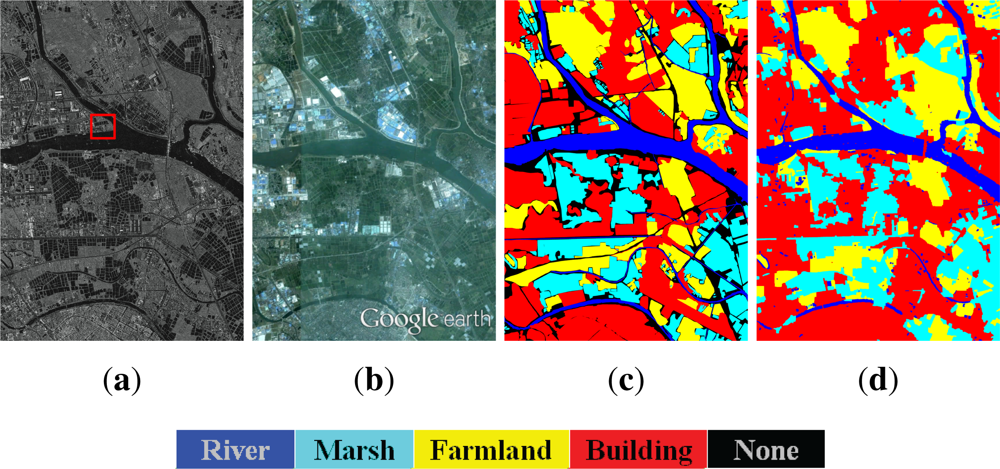
5.1.2. Foshan Dataset
5.2. Classification Result
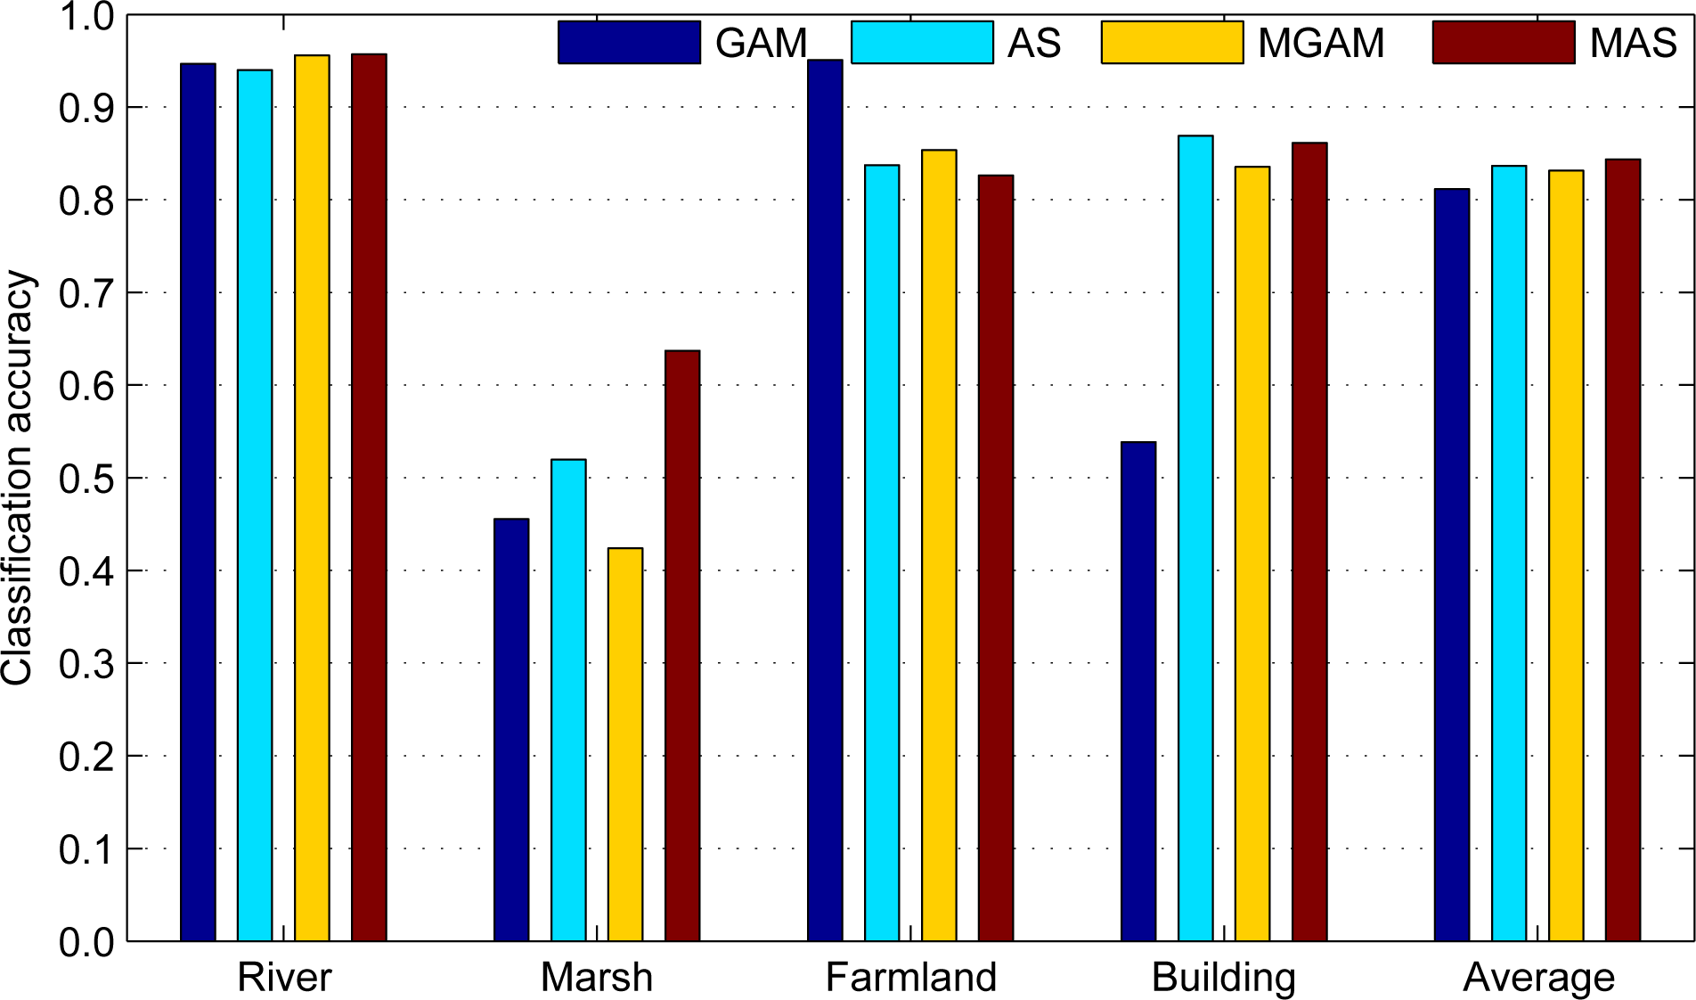
5.3. Result Analysis
6. Conclusions
Acknowledgments
- Conflict of InterestThe authors declare no conflict of interest.
References
- Perko, R.; Raggam, H.; Deutscher, J.; Gutjahr, K.; Schardt, M. Forest assessment using high resolution SAR data in X-band. Remote Sens. 2011, 3, 792–815. [Google Scholar]
- Alberga, V. Similarity measures of remotely sensed multi-sensor images for change detection applications. Remote Sens. 2009, 1, 122–143. [Google Scholar]
- Hasager, C.B.; Badger, M.; Pena, A.; Larsén, X.G.; Bingol, F. SAR-based wind resource statistics ′ in the Baltic Sea. Remote Sens. 2011, 3, 117–144. [Google Scholar]
- Tison, C.; Nicolas, J.M.; Tupin, F.; Maitre, H. A new statistical model for Markovian classification of urban areas in high-resolution SAR images. IEEE Trans. Geosci. Remote Sens. 2004, 42, 2046–2057. [Google Scholar]
- Jacob, A.M.; Hemmerly, E.M.; Fernandes, D. SAR Image Classification Using a Neural Classifier Based on Fisher Criterion. In Proceedings of the 7th Brasilian Symposium on Neural Networks (SBRN02), Recife, Brazil, 11–14 November 2002; pp. 168–172.
- Chamundeeswari, V.V.; Singh, D.; Singh, K. Unsupervised Land Cover Classification of SAR Images by Contour Tracing. In Proceedings of Geoscience and Remote Sensing Symposium (IGARSS 2007), Barcelona, Spain, 23–27 July 2007; pp. 547–550.
- Oliver, C.J. Understanding Synthetic Aperture Radar Images; Artech House: Boston, MA, USA/London, UK, 1998. [Google Scholar]
- Oliver, C. Optimum texture estimators for SAR clutter. J. Phys. D Appl.Phys. 1993, 26, 1824–1835. [Google Scholar]
- Menon, M. Estimation of the shape and scale parameters of the Weibull distribution. Technometrics 1963, 5, 175–182. [Google Scholar]
- Szajnowski, W. Estimators of log-normal distribution parameters. IEEE Trans. Aerosp Electron. Syst. 1977, AES-13, 533–536. [Google Scholar]
- Jakeman, E.; Pusey, P. A model for non-Rayleigh sea echo. IEEE Trans. Antennas Propagat. 1976, 24, 806–814. [Google Scholar]
- Jao, J.K. Amplitude distribution of composite terrain radar clutter and the K-distribution. IEEE Trans. Antennas Propag. 1984, AP-32, 1049–1062. [Google Scholar]
- Li, H.C.; Hong, W.; Wu, Y.R.; Fan, P.Z. On the empirical-statistical modeling of SAR images with generalized gamma distribution. IEEE J. Sel. Top. Signal Process. 2011, 5, 386–397. [Google Scholar]
- Galland, F.; Nicolas, J.M.; Sportouche, H.; Roche, M.; Tupin, F.; Refregier, P. Unsupervised synthetic aperture radar image segmentation using fisher distributions. IEEE Trans. Geosci. Remote Sens. 2009, 47, 2966–2972. [Google Scholar]
- Frery, A.; Muller, H.-J.; Yanasse, C.; Sant’Anna, S. A model for extremely heterogeneous clutter. IEEE Trans. Geosci. Remote Sens. 1997, 35, 648–659. [Google Scholar]
- Kuruoglu, E.E.; Zerubia, J. Modeling SAR images with a generalization of the Rayleigh distribution. IEEE Trans. Image Process. 2004, 13, 527–533. [Google Scholar]
- Achim, A.; Tsakalides, P.; Bezerianos, A. SAR image denoising via bayesian wavelet shrinkage based on heavy-tailed modeling. IEEE Trans. Geosci. Remote Sens. 2003, 41, 1773–1784. [Google Scholar]
- Gao, G.; Shi, G.T.; Zou, H.X.; Zhou, S.L. Characterizing the statistical properties of SAR clutter by using an empirical distribution. Int. J. Antennas Propag. 2013, 109145:1–109145:8. [Google Scholar] [CrossRef]
- Gao, G. Statistical modeling of SAR images: A survey. Sensors 2010, 10, 775–795. [Google Scholar]
- Liao, M.S.; Wang, C.C.; Wang, Y.; Jiang, L.M. Using SAR images to detect ships from sea clutter. IEEE Geosci. Remote Sens. Lett. 2008, 5, 194–198. [Google Scholar]
- Chen, J.Y.; Sun, H. Multi-Resolution Edge Detection Based on Alpha-Stable Model in SAR Images Using Translation-Invariance Contourlet Transform. In Proceedings of Signal Processing and Information Technology (ISSPIT 2006), Vancouver, BC, Canada, 27–30 August 2006; pp. 264–270.
- Peng, Y.J.; Xu, X.; Zhou, W.B.; Zhao, Y. SAR image classification based on alpha-stable distribution. Remote Sens. Lett. 2011, 2, 51–59. [Google Scholar]
- Wan, T.; Canagarajah, N.; Achim, A. Segmentation-driven image fusion based on alpha-stable modeling of wavelet coefficients. IEEE Trans. Multimed. 2009, 11, 624–633. [Google Scholar]
- Deng, C.Z.; Zhu, H.S.; Wang, S.Q. Curvelet Domain Watermark Detection Using Alpha-Stable Models. In Proceedings of Information Assurance and Security (ICIAS 2009), XI’an, China, 18–20 August 2009; pp. 313–316.
- Ge, X.H.; Zhu, G.X.; Zhu, Y.T. On the testing for alpha-stable distributions of network traffic. Comput. Commun. 2004, 5, 447–457. [Google Scholar]
- Xu, W.D.; Wu, C.F.; Dong, Y.C. Modeling Chinese stock returns with stable distribution. Math. Comput. Modell. 2011, 54, 610–617. [Google Scholar]
- Salas-Gonzalez, D.; Kuruoglu, E.E.; Ruiz, D.P. Finite mixture of alpha-stable distributions. Digital Signal Process. 2009, 19, 250–264. [Google Scholar]
- Salas-Gonzalez, D.; Kuruoglu, E.E.; Ruiz, D.P. Modelling with mixture of symmetric stable distributions using Gibbs sampling. Signal Process. 2009, 90, 774–783. [Google Scholar]
- Salas-Gonzalez, D.; Kuruoglu, E.E.; Ruiz, D.P. Bayesian Estimation of Mixtures of Skewed Alpha-Stable Distributions with an Unknown Number of Components. In Proceedings of European Signal Processing, EUSIPCO 2006, Florence, Italy, 4–8 September 2006.
- Buckle, D.J. Bayesian inference for stable distribution. J. Am. Stat. Assoc. 1995, 90, 605–613. [Google Scholar]
- Casarin, R. Bayesian Inference for Mixtures of Stable Distributions; Working Paper No. 0428; CEREMADE, University Paris IX: Paris, France, 2004. [Google Scholar]
- Boykov, Y.; Veksler, O.; Zabih, R. Fast approximate energy minimization via Graph Cuts. IEEE Trans. Pattern Anal. Mach. Intell. 2001, 23, 1222–1239. [Google Scholar]
- Kolmogorov, V.; Zabih, R. What energy functions can be minimized via Graph Cuts? IEEE Trans. Pattern Anal. Mach. Intell 2004, 26, 147–159. [Google Scholar]
- Boykov, Y.; Kolmogorov, V. An experimental comparison of Min-Cut/Max-Flow algorithms for energy minimization in vision. IEEE Trans. Pattern Anal. Mach. Intell. 2004, 26, 1124–1137. [Google Scholar]
- Levy, P. Theorie des erreurs : La loi de Gauss et les lois exceptionnelles. Bull. Socit Mathmatique France 1924, 52, 49–85. [Google Scholar]
- Belov, I.A. On the Computation of the Probability Density Function of Alpha-Stable Distributions. In Proceedings of the 10th International Conference on Mathematical Modelling and Analysis (ICMMA 2005), Trakai, Lithuania, 1–5 June 2005; pp. 333–341.
- Chambers, J.; Mallows, C.; Stuck, B. A method for simulating stable random variables. J. Am. Stat. Assoc. 1976, 71, 340–344. [Google Scholar]
- Geman, S.; Geman, D. Stochastic relaxation, Gibbs distribution, and the Bayesian restauration of images. IEEE Trans. Pattern Anal. Mach. Intell. 1984, PAMI-6, 721–741. [Google Scholar]
- Wu, F. The Potts model. Rev. Mod. Phys. 1982, 54, 235–268. [Google Scholar]
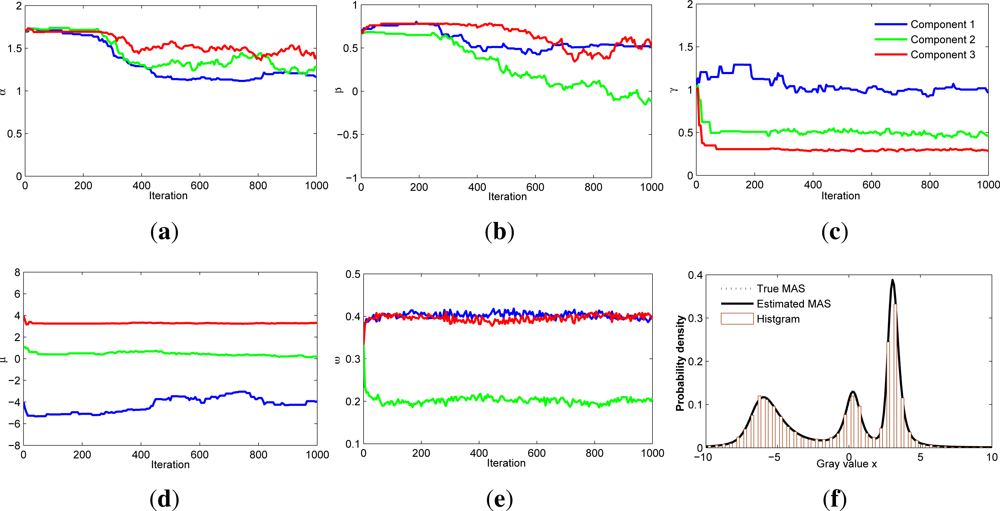
| Parameter | PSA | Salas-Gonzalez | ||||
|---|---|---|---|---|---|---|
| Name | True | Starting | Estimated | std | Estimated | std |
| α1 | 1.20 | 1.70 | 1.20 | 0.02 | 1.27 | 0.09 |
| β1 | 0.50 | 0.70 | 0.53 | 0.01 | 0.65 | 0.08 |
| γ1 | 1.00 | 1.00 | 1.01 | 0.02 | 0.98 | 0.06 |
| μ1 | −4.25 | −4.00 | −4.11 | 0.19 | −4.30 | 0.60 |
| ω1 | 0.40 | 0.33 | 0.40 | 0.01 | 0.40 | 0.02 |
| α2 | 1.20 | 1.70 | 1.28 | 0.07 | 1.30 | 0.17 |
| β2 | 0.00 | 0.70 | −0.03 | 0.07 | 0.04 | 0.30 |
| γ2 | 0.50 | 1.00 | 0.47 | 0.02 | 0.45 | 0.05 |
| μ2 | 0.30 | 1.00 | 0.25 | 0.07 | 0.40 | 0.30 |
| ω2 | 0.20 | 0.33 | 0.20 | 0.01 | 0.20 | 0.02 |
| α3 | 1.50 | 1.70 | 1.45 | 0.04 | 1.37 | 0.12 |
| β3 | 0.50 | 0.70 | 0.51 | 0.08 | 0.34 | 0.20 |
| γ3 | 0.30 | 1.00 | 0.30 | 0.01 | 0.30 | 0.02 |
| μ3 | 3.25 | 4.00 | 3.28 | 0.02 | 3.24 | 0.06 |
| ω3 | 0.40 | 0.33 | 0.40 | 0.01 | 0.40 | 0.02 |
| Average KSD (Maximum KSD) | ||||
|---|---|---|---|---|
| Model | River | Marsh | Farmland | Building |
| Gamma | 0.042 (0.213) | 0.205 (0.427) | 0.044 (0.172) | 0.280 (0.590) |
| Weibull | 0.058 (0.207) | 0.109 (0.171) | 0.047 (0.164) | 0.085 (0.152) |
| G0 | 0.118 (0.915) | 0.051 (0.100) | 0.145 (0.806) | 0.035 (0.287) |
| K | 0.024 (0.133) | 0.081 (0.164) | 0.014 (0.069) | 0.064 (0.287) |
| Alpha-stable | 0.046 (0.079) | 0.027 (0.071) | 0.042 (0.072) | 0.039 (0.100) |
| Acceptance Probability at 5% Significance Level (Percentage) | ||||
|---|---|---|---|---|
| Model | River | Marsh | Farmland | Building |
| Gamma | 81.17 | 0.17 | 71.67 | 0.00 |
| Weibull | 55.33 | 0.00 | 70.33 | 0.67 |
| G0 | 83.83 | 45.44 | 81.69 | 83.33 |
| K | 97.00 | 4.17 | 99.83 | 43.83 |
| Alpha-stable | 68.83 | 96.50 | 70.83 | 67.50 |
| Average KSD (Maximum KSD) | ||||
|---|---|---|---|---|
| Components | River | Marsh | Farmland | Building |
| 1 | 0.046 (0.079) | 0.027 (0.071) | 0.042 (0.072) | 0.039 (0.100) |
| 3 | 0.025 (0.050) | 0.024 (0.088) | 0.012 (0.049) | 0.026 (0.099) |
| 5 | 0.021 (0.041) | 0.023 (0.113) | 0.011 (0.025) | 0.024 (0.115) |
| 7 | 0.021 (0.074) | 0.022 (0.110) | 0.010 (0.023) | 0.023 (0.115) |
| Acceptance Probability at 5% Significance Level (Percentage) | ||||
|---|---|---|---|---|
| Components | River | Marsh | Farmland | Building |
| 1 | 68.83 | 96.50 | 70.83 | 67.50 |
| 3 | 99.83 | 96.83 | 100.00 | 87.17 |
| 5 | 100.00 | 97.17 | 100.00 | 88.67 |
| 7 | 100.00 | 98.00 | 100.00 | 89.33 |
| Dataset | Wuhan data (Average accuracy: 84.35) | |||
|---|---|---|---|---|
| Class | River | Marsh | Farmland | Building |
| River | 95.7 | 0.7 | 1.2 | 2.4 |
| Marsh | 22.2 | 63.7 | 2.5 | 11.6 |
| Farmland | 0.6 | 1.3 | 82.6 | 15.5 |
| Building | 3.6 | 0.7 | 9.6 | 86.1 |
| Dataset | Foshan data (Average accuracy: 83.22) | |||
|---|---|---|---|---|
| Class | River | Marsh | Farmland | Building |
| River | 80.3 | 11.2 | 2.0 | 6.5 |
| Marsh | 4.0 | 87.3 | 3.4 | 5.3 |
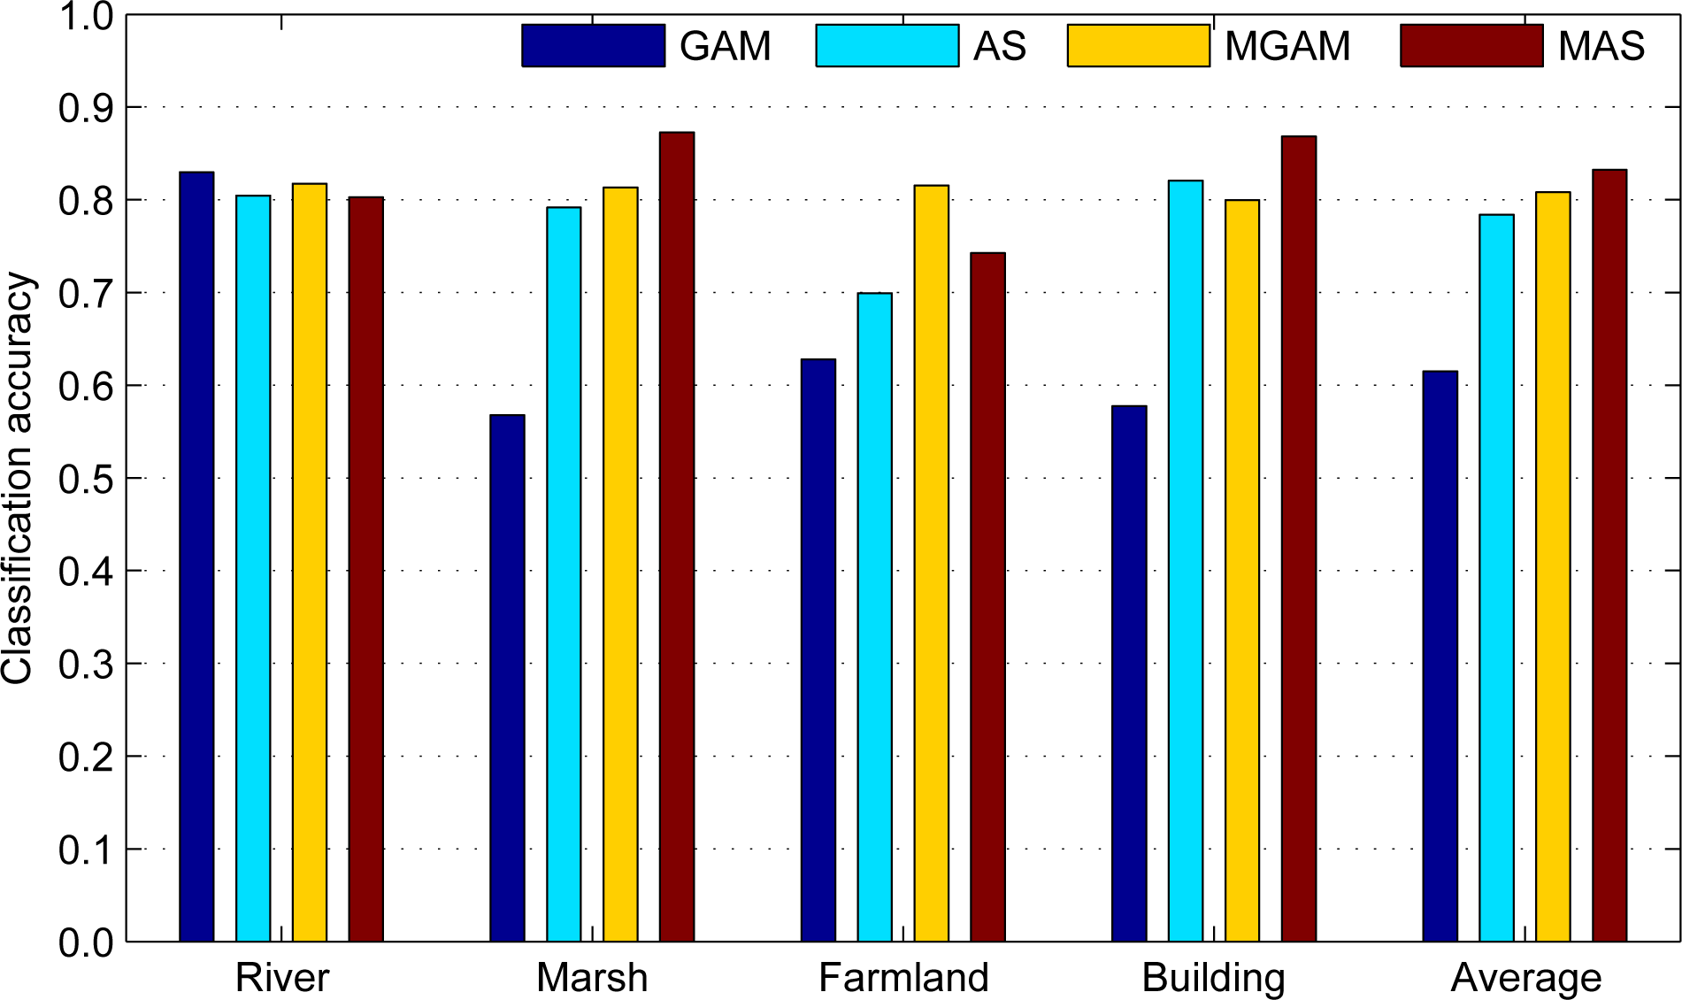
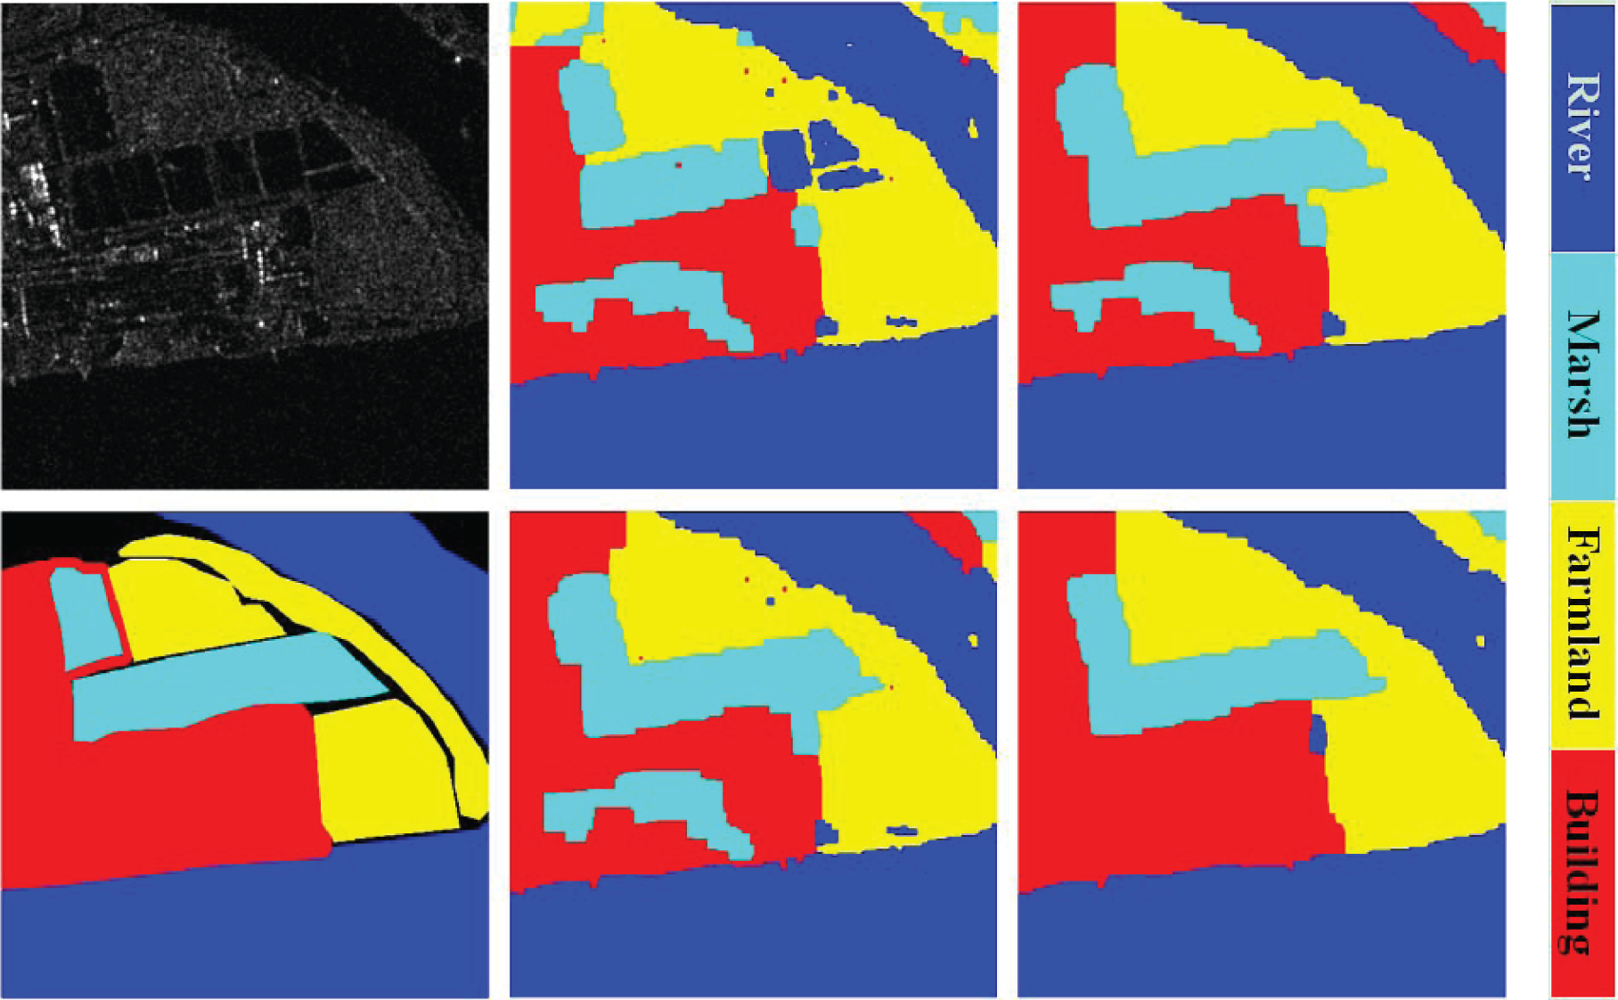
| Farmland | 0.3 | 0.9 | 74.3 | 24.5 |
| Building | 0.7 | 10.0 | 2.5 | 86.8 |
© 2013 by the authors; licensee MDPI, Basel, Switzerland This article is an open access article distributed under the terms and conditions of the Creative Commons Attribution license ( http://creativecommons.org/licenses/by/3.0/).
Share and Cite
Peng, Y.; Chen, J.; Xu, X.; Pu, F. SAR Images Statistical Modeling and Classification Based on the Mixture of Alpha-Stable Distributions. Remote Sens. 2013, 5, 2145-2163. https://doi.org/10.3390/rs5052145
Peng Y, Chen J, Xu X, Pu F. SAR Images Statistical Modeling and Classification Based on the Mixture of Alpha-Stable Distributions. Remote Sensing. 2013; 5(5):2145-2163. https://doi.org/10.3390/rs5052145
Chicago/Turabian StylePeng, Yijin, Jiayu Chen, Xin Xu, and Fangling Pu. 2013. "SAR Images Statistical Modeling and Classification Based on the Mixture of Alpha-Stable Distributions" Remote Sensing 5, no. 5: 2145-2163. https://doi.org/10.3390/rs5052145
APA StylePeng, Y., Chen, J., Xu, X., & Pu, F. (2013). SAR Images Statistical Modeling and Classification Based on the Mixture of Alpha-Stable Distributions. Remote Sensing, 5(5), 2145-2163. https://doi.org/10.3390/rs5052145


