Article

A 2025 High-Resolution Glacier Inventory of the Greater Caucasus Reveals Accelerated Area Loss

by
Levan G. Tielidze
1,2,*,
Gennady A. Nosenko
3,
Akaki Nadaraia
2,
Tatiana E. Khromova
3,
Roman M. Kumladze
2,4,
Caroline C. Clason
5,
Mikheil Elashvili
2,6 and
Lela Gadrani
2,7
1
School of Earth, Atmosphere and Environment, Monash University, Clayton, VIC 3800, Australia
2
School of Natural Sciences and Medicine, Ilia State University, 0179 Tbilisi, Georgia
3
Department of Glaciology, Institute of Geography, Russian Academy of Sciences, 119017 Moscow, Russia
4
National Environmental Agency, Ministry of Environmental Protection and Agriculture of Georgia, 0102 Tbilisi, Georgia
5
Department of Geography, Durham University, Durham DH1 3LE, UK
6
Department of Mathematics, Bridgewater State University, Bridgewater, MA 02324, USA
7
Institut des Géosciences de l’Environnement, University Grenoble Alpes, 38400 Grenoble, France
*
Author to whom correspondence should be addressed.
Remote Sens. 2026, 18(9), 1441; https://doi.org/10.3390/rs18091441
Submission received: 28 March 2026 / Revised: 29 April 2026 / Accepted: 2 May 2026 / Published: 6 May 2026

Highlights

What are the main findings?
  • A new high-resolution (3 m) glacier inventory for 2025 identifies 2341 glaciers covering 964.0 ± 22.8 km2 across the Greater Caucasus, providing the most detailed regional dataset to date.
  • Glacier area loss has accelerated in recent decades, with rates exceeding −1.8% yr−1 since 2014, indicating intensified glacier retreat across the region.
What are the implications of the main findings?
  • High-resolution satellite imagery significantly improves the detection of small and debris-covered glaciers, reducing uncertainties in regional glacier inventories.
  • Continued glacier shrinkage, driven by rising temperatures and reduced winter precipitation, has important implications for regional water resources and climate-change adaptation.

Abstract

The Greater Caucasus is one of the most extensively glacierized mountain systems in mid-latitude Eurasia and has experienced substantial glacier retreat in recent decades. Continuous monitoring using high-resolution satellite observations is therefore essential for accurately quantifying ongoing and future changes. In this study, we present a new glacier inventory for 2025 derived from high-resolution (3 m) PlanetScope satellite imagery combined with topographic information from the 30 m Advanced Land Observing Satellite (ALOS) Global Digital Surface Model (2006–2011). A total of 101 cloud-free PlanetScope scenes, acquired primarily during August–September 2025, were manually delineated to ensure precise glacier boundary detection. Regional climatic data, including summer temperature and winter precipitation from the ERA5 reanalysis, were compiled to support interpretation of glacier changes since the 1960s. The new inventory identifies 2341 glaciers covering 964.0 ± 22.8 km2 across the Greater Caucasus. Glacier distribution is highly uneven: most of the glacier-covered area is found in the Central Caucasus (730.2 ± 15.5 km2), whereas considerably smaller glacierized areas occur in the Western and Eastern sectors. Most glaciers are located on northern slopes (687.7 ± 16.0 km2), reflecting strong topographic and climatic asymmetry. Mean glacier elevations range from ~3300 to 3600 m a.s.l., increasing eastward in response to decreasing precipitation. Size-class analysis shows that small glaciers (<0.5 km2) dominate numerically, whereas a limited number of large valley glaciers (>5.0 km2) contribute disproportionately to total glacier area. Comparison with previous inventories indicates continued and accelerated glacier retreat, particularly since 2014, with a mean area loss rate of −1.8% yr−1. These comparisons further show that a total of 965 glaciers (~122.9 km2) have become extinct across the Greater Caucasus since the 1960s. This trend is primarily driven by increasing summer temperatures and declining winter precipitation. This high-resolution inventory provides the most detailed glacier dataset currently available for the Greater Caucasus and establishes an updated benchmark for future glacier monitoring, climate change studies, and hydrological assessments.

1. Introduction

Mountain glaciers are among the most sensitive indicators of ongoing climate change [1]. Over the past century, widespread glacier shrinkage has been observed across nearly all glacierized regions worldwide [2,3], largely driven by increasing air temperatures and changes in precipitation patterns. These changes have significant implications for global sea-level rise [4], regional water resources [5,6], and mountain ecosystem stability [7]. Because glaciers respond rapidly to atmospheric variability, long-term monitoring of glacier extent provides valuable insights into climate dynamics and environmental change [8].
Glacier inventories play a fundamental role in cryospheric research by providing spatially explicit information on glacier extent, distribution, and morphometric characteristics [9]. Such inventories are essential for quantifying glacier changes through time and for improving glacier mass-balance modelling and hydrological assessments [3]. Historically, glacier inventories were compiled using aerial photography and topographic maps [10,11,12], but advances in satellite remote sensing have significantly improved the spatial coverage and consistency of glacier mapping at regional and global scales [13,14].
Remote sensing techniques have become the primary tool for glacier monitoring, particularly since the launch of satellite missions such as the Landsat Program [15], Terra (ASTER) [16,17] and Sentinel-2 [18]. These platforms have enabled the development of several global glacier databases [19] and have supported numerous regional glacier inventories [20,21]. Nevertheless, most glacier inventories are still based on medium-resolution imagery (10–30 m), which can introduce uncertainties in complex mountain terrain, particularly for small glaciers [22] and debris-covered ice [23,24].
The Greater Caucasus represents one of the most glacierized mountain regions in mid-latitude Eurasia and provides an important freshwater resource for surrounding regions [25]. The glaciers of this mountain system are also associated with natural hazards, including glacial lake outburst floods [26], rock-ice avalanches [27,28], and debris flows [29]. Several glacier inventories have been compiled for the Caucasus since the mid-twentieth century, including regional assessments based on the original aerial imagery [30], topographical maps (1960s), Landsat satellite imagery (1986, 2000s, 2014s) [31,32,33] and the most recent inventory derived from Sentinel-2 imagery around 2020 [34]. However, a consistent high-resolution regional assessment of glacier extent has not yet been produced.
The objectives of this study are therefore: (i) to produce a new high-resolution glacier inventory for the Greater Caucasus using PlanetScope imagery for 2025, and (ii) to establish an updated dataset that can be directly compared with previous inventories (1960, 1986, 2000, 2014, and 2020) to evaluate long-term glacier change and its relationship with regional climate variability and as a baseline for future assessments.

2. Study Area

The Greater Caucasus Mountains form a major orographic system extending ~1200 km between the Black Sea and the Caspian Sea, representing one of the most glacierized regions in mid-latitude Eurasia (Figure 1). The range exceeds 5000 m a.s.l., including Mount Elbrus (5642 m a.s.l.), the highest peak in Europe. High elevations, steep relief, and favourable climatic conditions support extensive glacier development along the main ridge. Geologically, the range is part of the Alpine orogenic belt formed by the collision of the Eurasian and Arabian plates [35], resulting in a complex assemblage of sedimentary, metamorphic, and igneous rocks. Combined tectonic uplift and intense glacial-fluvial erosion have produced rugged alpine landscapes with cirques, deep valleys, and glacial troughs that favour glacier formation, particularly in high-elevation accumulation zones.
Climatic and topographic conditions vary markedly along the longitudinal axis of the range, which is typically divided into the Western, Central, and Eastern Caucasus (Figure 1). The Western Caucasus is influenced by moist air masses from the Black Sea, receiving up to ~3200 mm of annual precipitation [36], but hosts relatively small glaciers due to the lower elevations in this region. The Central Caucasus contains the Caucasus’ highest peaks and represents the core region of glaciation, where elevations above 5000 m a.s.l. and annual precipitation of ~2000 mm support large valley glaciers with extensive accumulation areas. In contrast, the Eastern Caucasus is characterized by increasing continentality and reduced precipitation (~1000 mm annually; [37]), which limits glacier extent and results in smaller, more fragmented glacier systems.
Spatial variability in temperature further influences glacier distribution across the region. Mean annual temperatures on southern slopes are typically 1–2 °C higher than on northern slopes, while temperatures at the mean glacier elevation (~3400 m a.s.l.) are approximately −5 °C [12,38]. The regional lapse rate varies seasonally, with a maximum of −5.2 °C km−1 in summer and a minimum of −2.3 °C km−1 in winter [39]. The mountain range also exhibits pronounced north–south asymmetry, with longer glacier tongues on northern slopes and steeper southern slopes which are more exposed to solar radiation. These combined climatic and topographic gradients exert a strong control on glacier distribution, morphology, and long-term evolution across the Greater Caucasus.

3. Materials and Methods

3.1. Satellite Data

This study utilizes high-resolution satellite imagery acquired from Planet Labs (https://www.planet.com/explorer/) (accessed on 13 October 2025). Planet operates one of the largest fleets of Earth observation satellites, providing daily global coverage at spatial resolutions of 3 m. These satellites capture multispectral imagery in several spectral bands, enabling detailed analysis of surface features and land-cover characteristics [40].
Planet imagery has been increasingly used in cryospheric research due to its high spatial resolution and frequent revisit times. These characteristics allow improved identification of glacier margins, debris-covered ice, and small glacier bodies that may not be easily detected using medium-resolution satellite data [41]. The latter is particularly important for monitoring the disappearance of glaciers and supporting the reliable counting of at-risk sites [42]. Previous studies in mountain regions, including the Caucasus, have demonstrated the value of Planet imagery for mapping glacier extent and monitoring short-term glacier changes [43].
A total of 101 cloud-free scenes were selected, primarily acquired during the late ablation season (August–September 2025), when seasonal snow cover is minimal and glacier boundaries are most clearly defined. The imagery provides a spatial resolution of 3 m, allowing accurate delineation of glacier outlines across the entire Greater Caucasus.
In addition to satellite imagery, topographic information was derived from the ALOS Global Digital Surface Model (AW3D30; survey period: 1 January 2006–1 January 2011) (https://www.eorc.jaxa.jp/ALOS/en/dataset/aw3d30/aw3d30_e.htm; accessed on 25 October 2025) which provides elevation data at a spatial resolution of 30 m [44]. These data were used to calculate glacier elevation statistics and other morphometric parameters.

3.2. Glacier Mapping Methodology

Numerous methods have been developed for glacier mapping using satellite imagery, including automated spectral classification techniques such as band-ratio methods and normalized difference snow indices [45,46,47]. These automated approaches are widely used for large-scale glacier inventories because they enable rapid processing of extensive satellite datasets. However, such methods often encounter limitations when applied to complex mountain terrain, particularly where glaciers are partially covered by debris or where seasonal snow complicates spectral classification [48].
Manual digitization remains one of the most reliable approaches for mapping glacier boundaries in regions with complex glacier morphology [49,50]. By visually interpreting high-resolution satellite imagery, analysts can distinguish glacier ice from surrounding terrain based on texture, shading, and geomorphological context. This approach is particularly advantageous when working with high-resolution imagery, where detailed surface features can be clearly identified.
Following established procedures used in previous glacier inventories of the Greater Caucasus [33,34], glacier outlines in this study were delineated manually (Figure 1c). Each glacier boundary was digitized at a scale of between 1:2000 and 1:6000 depending on glacier size, morphology, shadowing and debris, ensuring consistent mapping across the study region. Special attention was given to the identification of debris-covered glacier termini and small glacier bodies located in steep cirques.

3.3. Uncertainty Assessment

Uncertainty in glacier area was quantified using a buffer-based method, which is widely applied in glacier mapping studies to account for positional errors along manually digitized glacier boundaries [20,33,51]. This method assumes that the primary source of uncertainty arises from inaccuracies in the delineation of glacier outlines due to image resolution, interpretation ambiguity, and surface characteristics.
For each glacier polygon, an uncertainty buffer of width d (m) was applied along the glacier perimeter. The absolute area uncertainty (ΔA) was calculated as:
Δ A = P · d
where:
  • Δ A is the absolute uncertainty in glacier area (m2);
  • P is the glacier perimeter (m);
  • d is the buffer distance (m), representing the positional uncertainty of the mapped boundary.
The relative area uncertainty ( δ A , expressed as a percentage) was then derived as:
δ A = Δ A A × 100
where:
  • A is the mapped glacier area (m2).
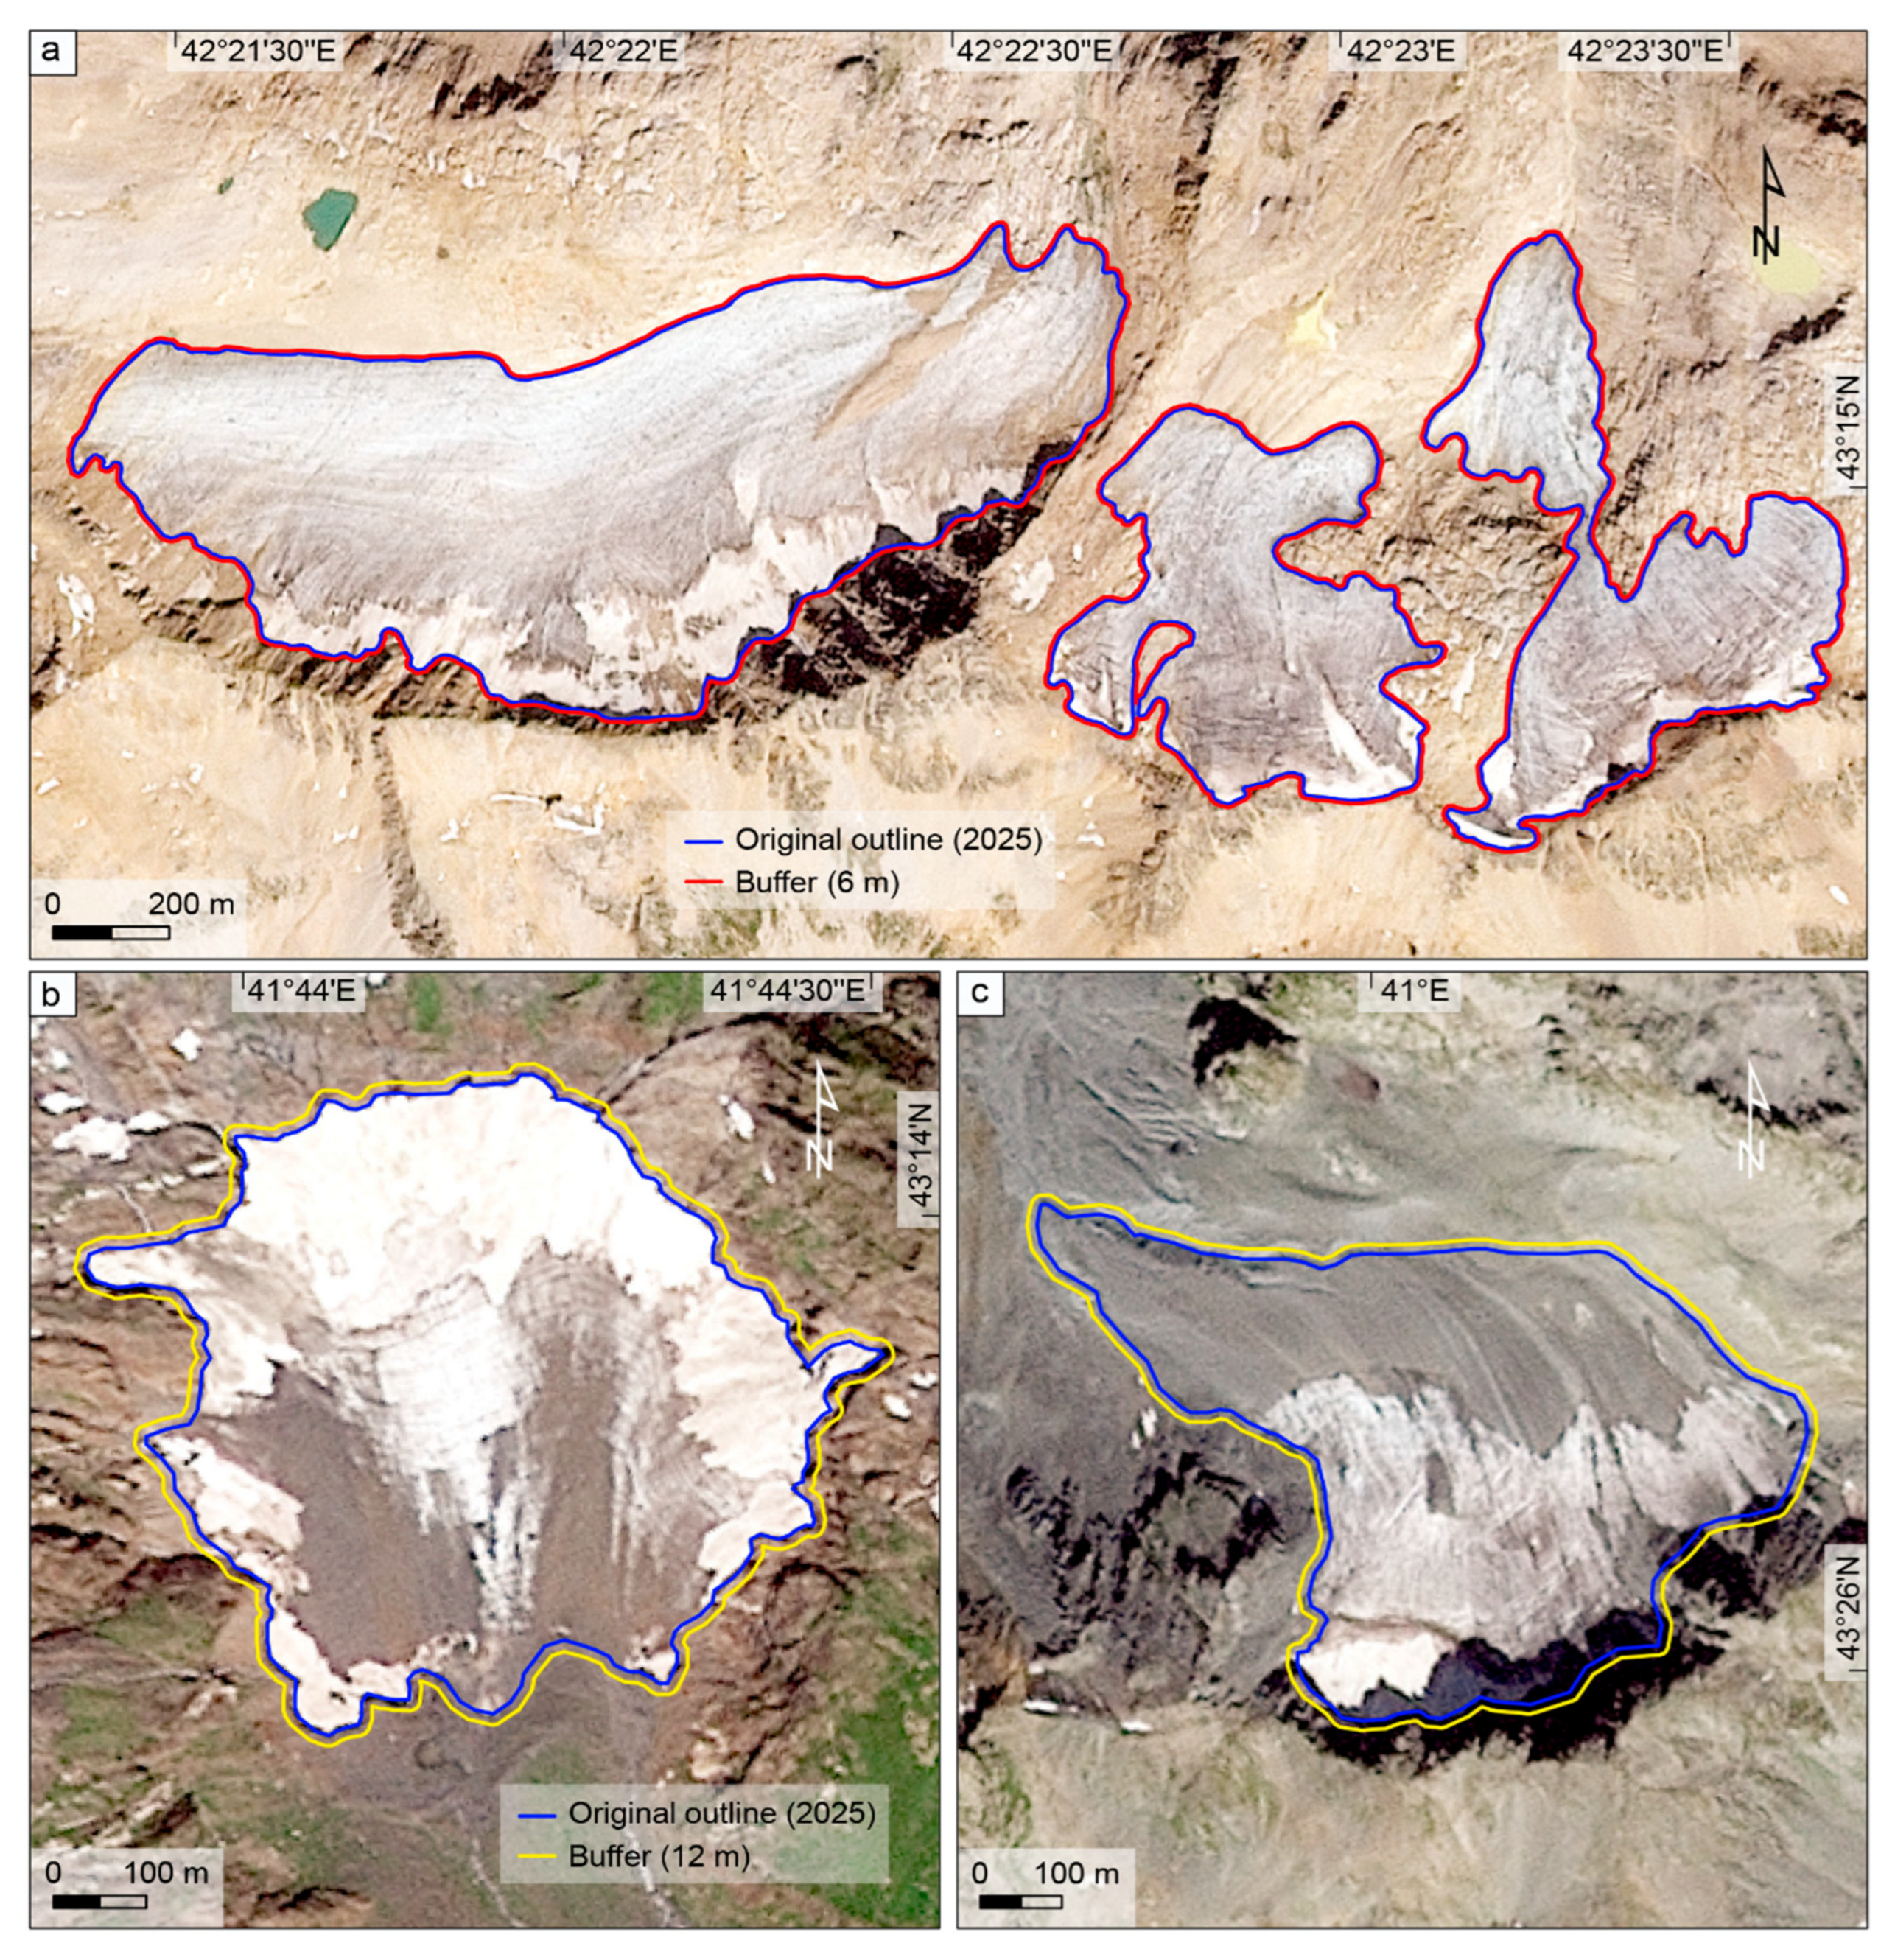
Following established practice [13,20,33,51] different buffer distances were assigned depending on glacier surface characteristics. For debris-free glaciers, a buffer equivalent to two image pixels was applied:
d = 2 × r = 6   m
where r = 3   m is the spatial resolution of PlanetScope imagery.
For debris-covered glaciers, a larger buffer was used to account for increased delineation uncertainty due to reduced spectral contrast between glacier ice and surrounding terrain [23]:
d = 4 × r = 12   m
The total uncertainty for aggregated glacier areas (e.g., regional totals) was calculated by propagating individual glacier uncertainties assuming independence, using:
Δ A total = i = 1 n ( Δ A i ) 2
where:
  • Δ A i is the uncertainty of the i-th glacier;
  • n is the total number of glaciers.
This approach provides a conservative estimate of cumulative uncertainty and avoids simple linear summation, which would overestimate total error.
Application of this method resulted in mean relative uncertainties of approximately ±2.4% for debris-free glaciers and ±4.5% for debris-covered glaciers. These values are lower than those reported in previous Caucasus glacier inventories derived from medium-resolution imagery (e.g., 10–30 m), reflecting the improved boundary delineation achievable with 3 m PlanetScope data (Figure 2).
Nevertheless, relative uncertainty increases for small glaciers, where perimeter-to-area ratios are high, and boundary errors represent a larger fraction of total area. This scale dependency should be considered when interpreting results, particularly for glaciers smaller than 1.0 km2.
This approach is consistent with the theoretical framework of glacier outline uncertainty, whereby positional errors along glacier margins are largely controlled by image resolution and operator-dependent delineation accuracy [13].

3.4. Climate Data

To provide a robust climatic context for the observed glacier distribution and changes, climate data were obtained from the Climate Reanalyzer dataset (https://climatereanalyzer.org/research_tools/monthly_tseries/; accessed on 26 March 2026) based on a fifth-generation European Centre for Medium-Range Weather Forecasts (ERA5) reanalysis [52,53]. The dataset comprises mean summer air temperature (May–September) and total winter precipitation (October–April) for the period 1960–2025, covering the region bounded by 42–43°N and 42–47°E. These variables represent the primary climatic controls on glacier mass balance, with summer temperature governing ablation and winter precipitation determining accumulation [54]. ERA5 data are provided at a spatial resolution of ~0.25° and offer temporally consistent, physically based estimates; however, uncertainties remain in complex mountainous terrain due to elevation smoothing and the limited representation of local topographic effects, particularly for precipitation fields [52,53].

4. Results

4.1. Glacier Area

The 2025 glacier inventory identifies a total of 2341 glaciers across the Greater Caucasus, collectively covering 964.0 ± 22.8 km2. Glacier distribution varies considerably between the three countries that share the mountain range. The largest proportion of glaciers occurs within Russia, which contains 1454 glaciers covering 650.1 ± 15.1 km2, representing approximately 67% of the total glacier area. Georgia hosts 873 glaciers with a combined area of 313.5 ± 7.7 km2, while Azerbaijan contains only 14 glaciers with a total area of 0.5 ± 0.04 km2. Mapping uncertainties derived from a 6 m buffer indicate relative area uncertainties ranging between approximately ±2% and ±3% for most regions (Table 1).
When classified according to the main physiographic sectors of the Greater Caucasus, glaciers are strongly concentrated within the central part of the mountain range. The Central Caucasus contains 1216 glaciers covering 730.2 ± 15.5 km2, accounting for more than three-quarters of the total glacier area. The Western Caucasus contains 875 glaciers with a total area of 168.4 ± 5.5 km2, while the Eastern Caucasus hosts 250 glaciers covering 65.5 ± 1.9 km2 (Table 2).
Slope orientation also plays an important role in glacier distribution. Approximately 1570 glaciers covering 687.7 ± 16.0 km2 are located on the northern slopes of the Greater Caucasus, whereas 771 glaciers covering 276.4 ± 6.9 km2 occur on the southern slopes (Table 2).
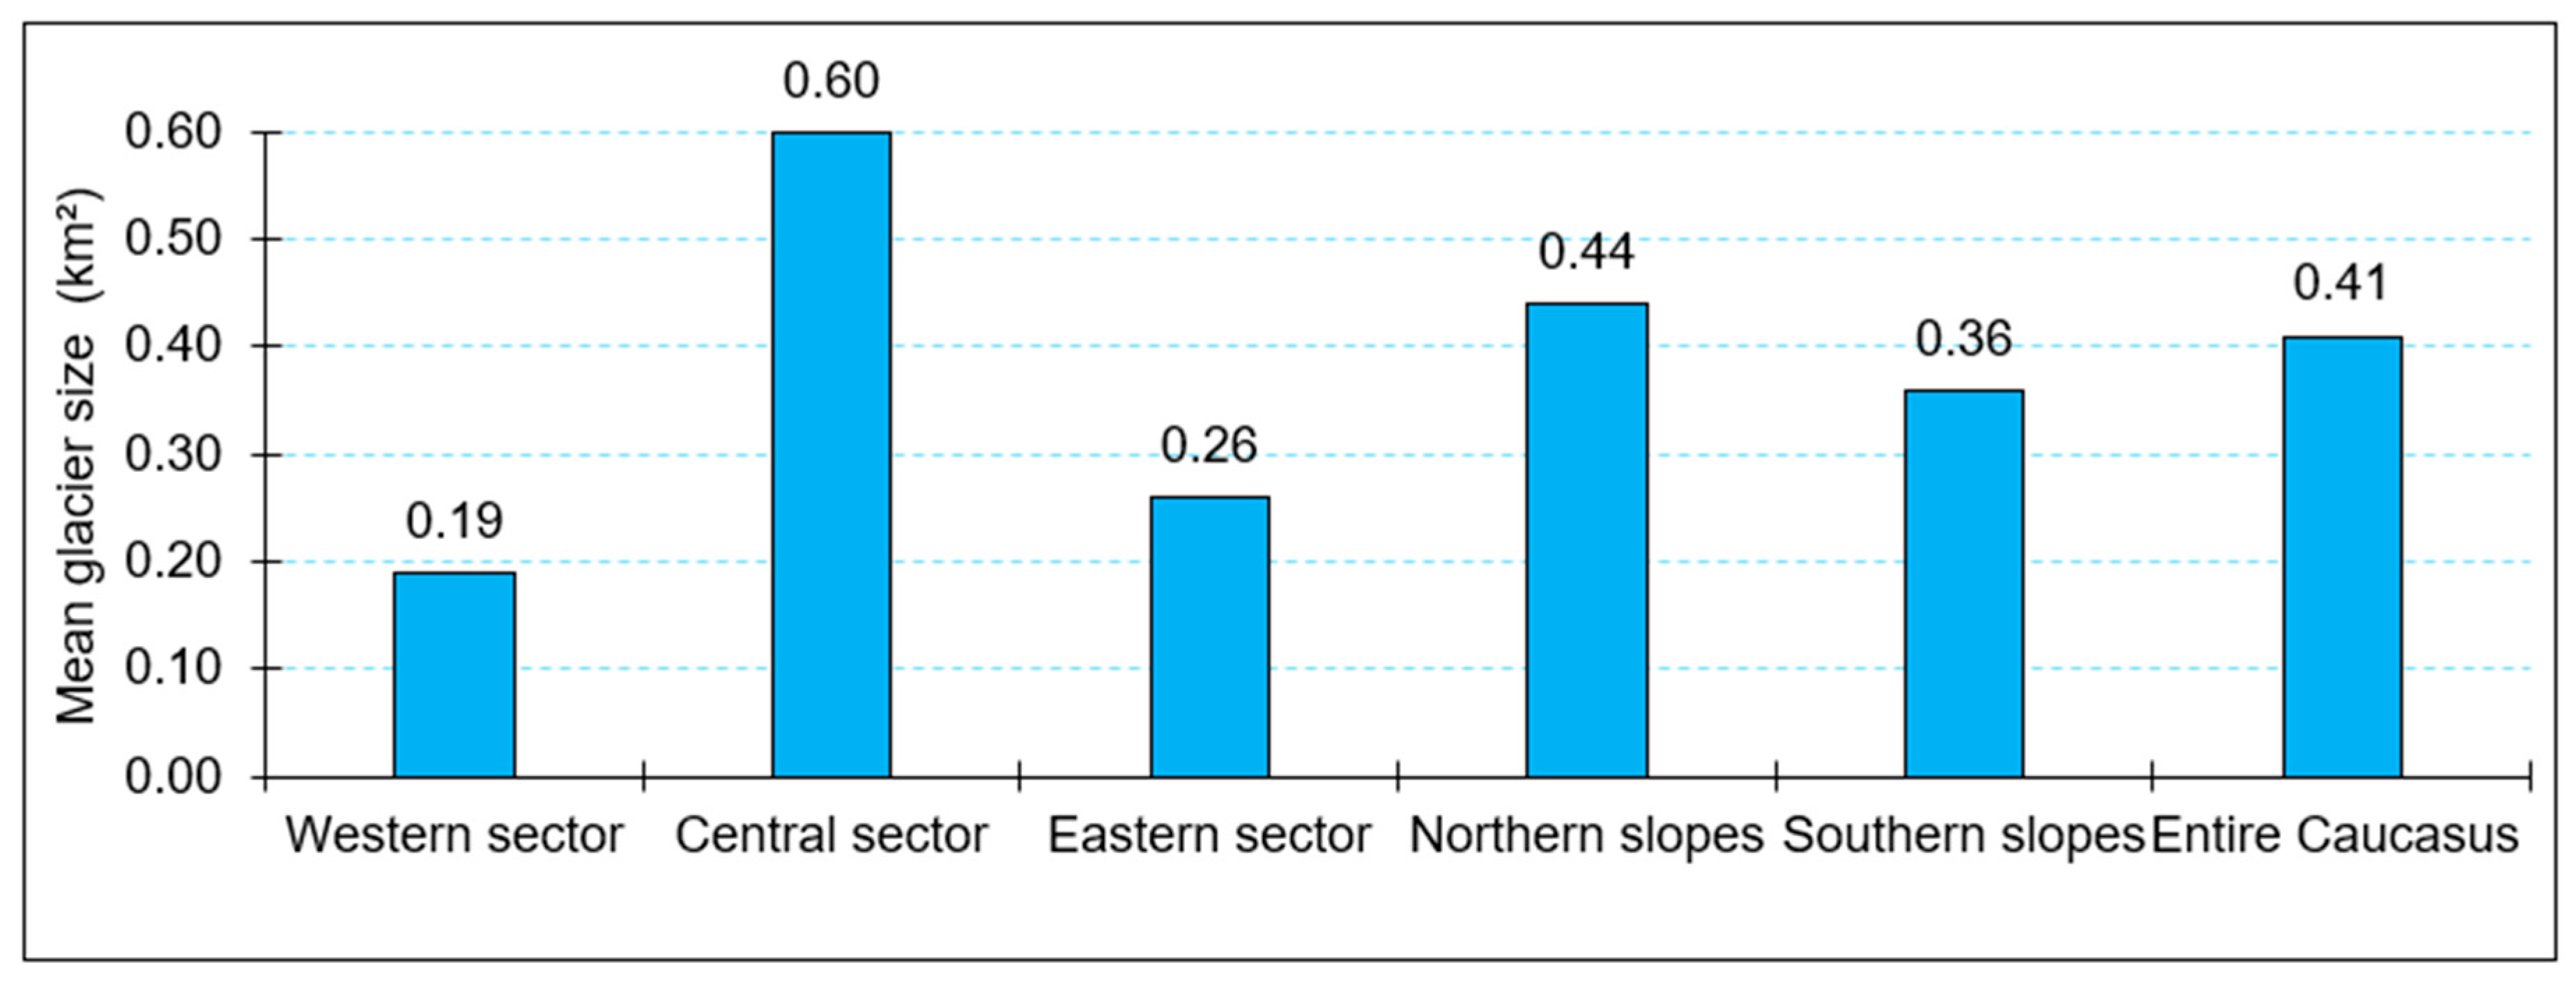
Mean glacier size also exhibits clear spatial variability across both regional sectors and slopes (Figure 3). Glaciers in the Central Caucasus are, on average, substantially larger (0.60 km2) than those in the Western (0.19 km2) and Eastern (0.26 km2) sectors, reinforcing the dominant role of the central range in controlling overall glacier area. In terms of slope orientation, glaciers on northern slopes have a higher mean size (0.44 km2) compared to those on southern slopes (0.36 km2). The mean glacier size for the entire Greater Caucasus is 0.41 km2.

4.2. Glacier Elevation

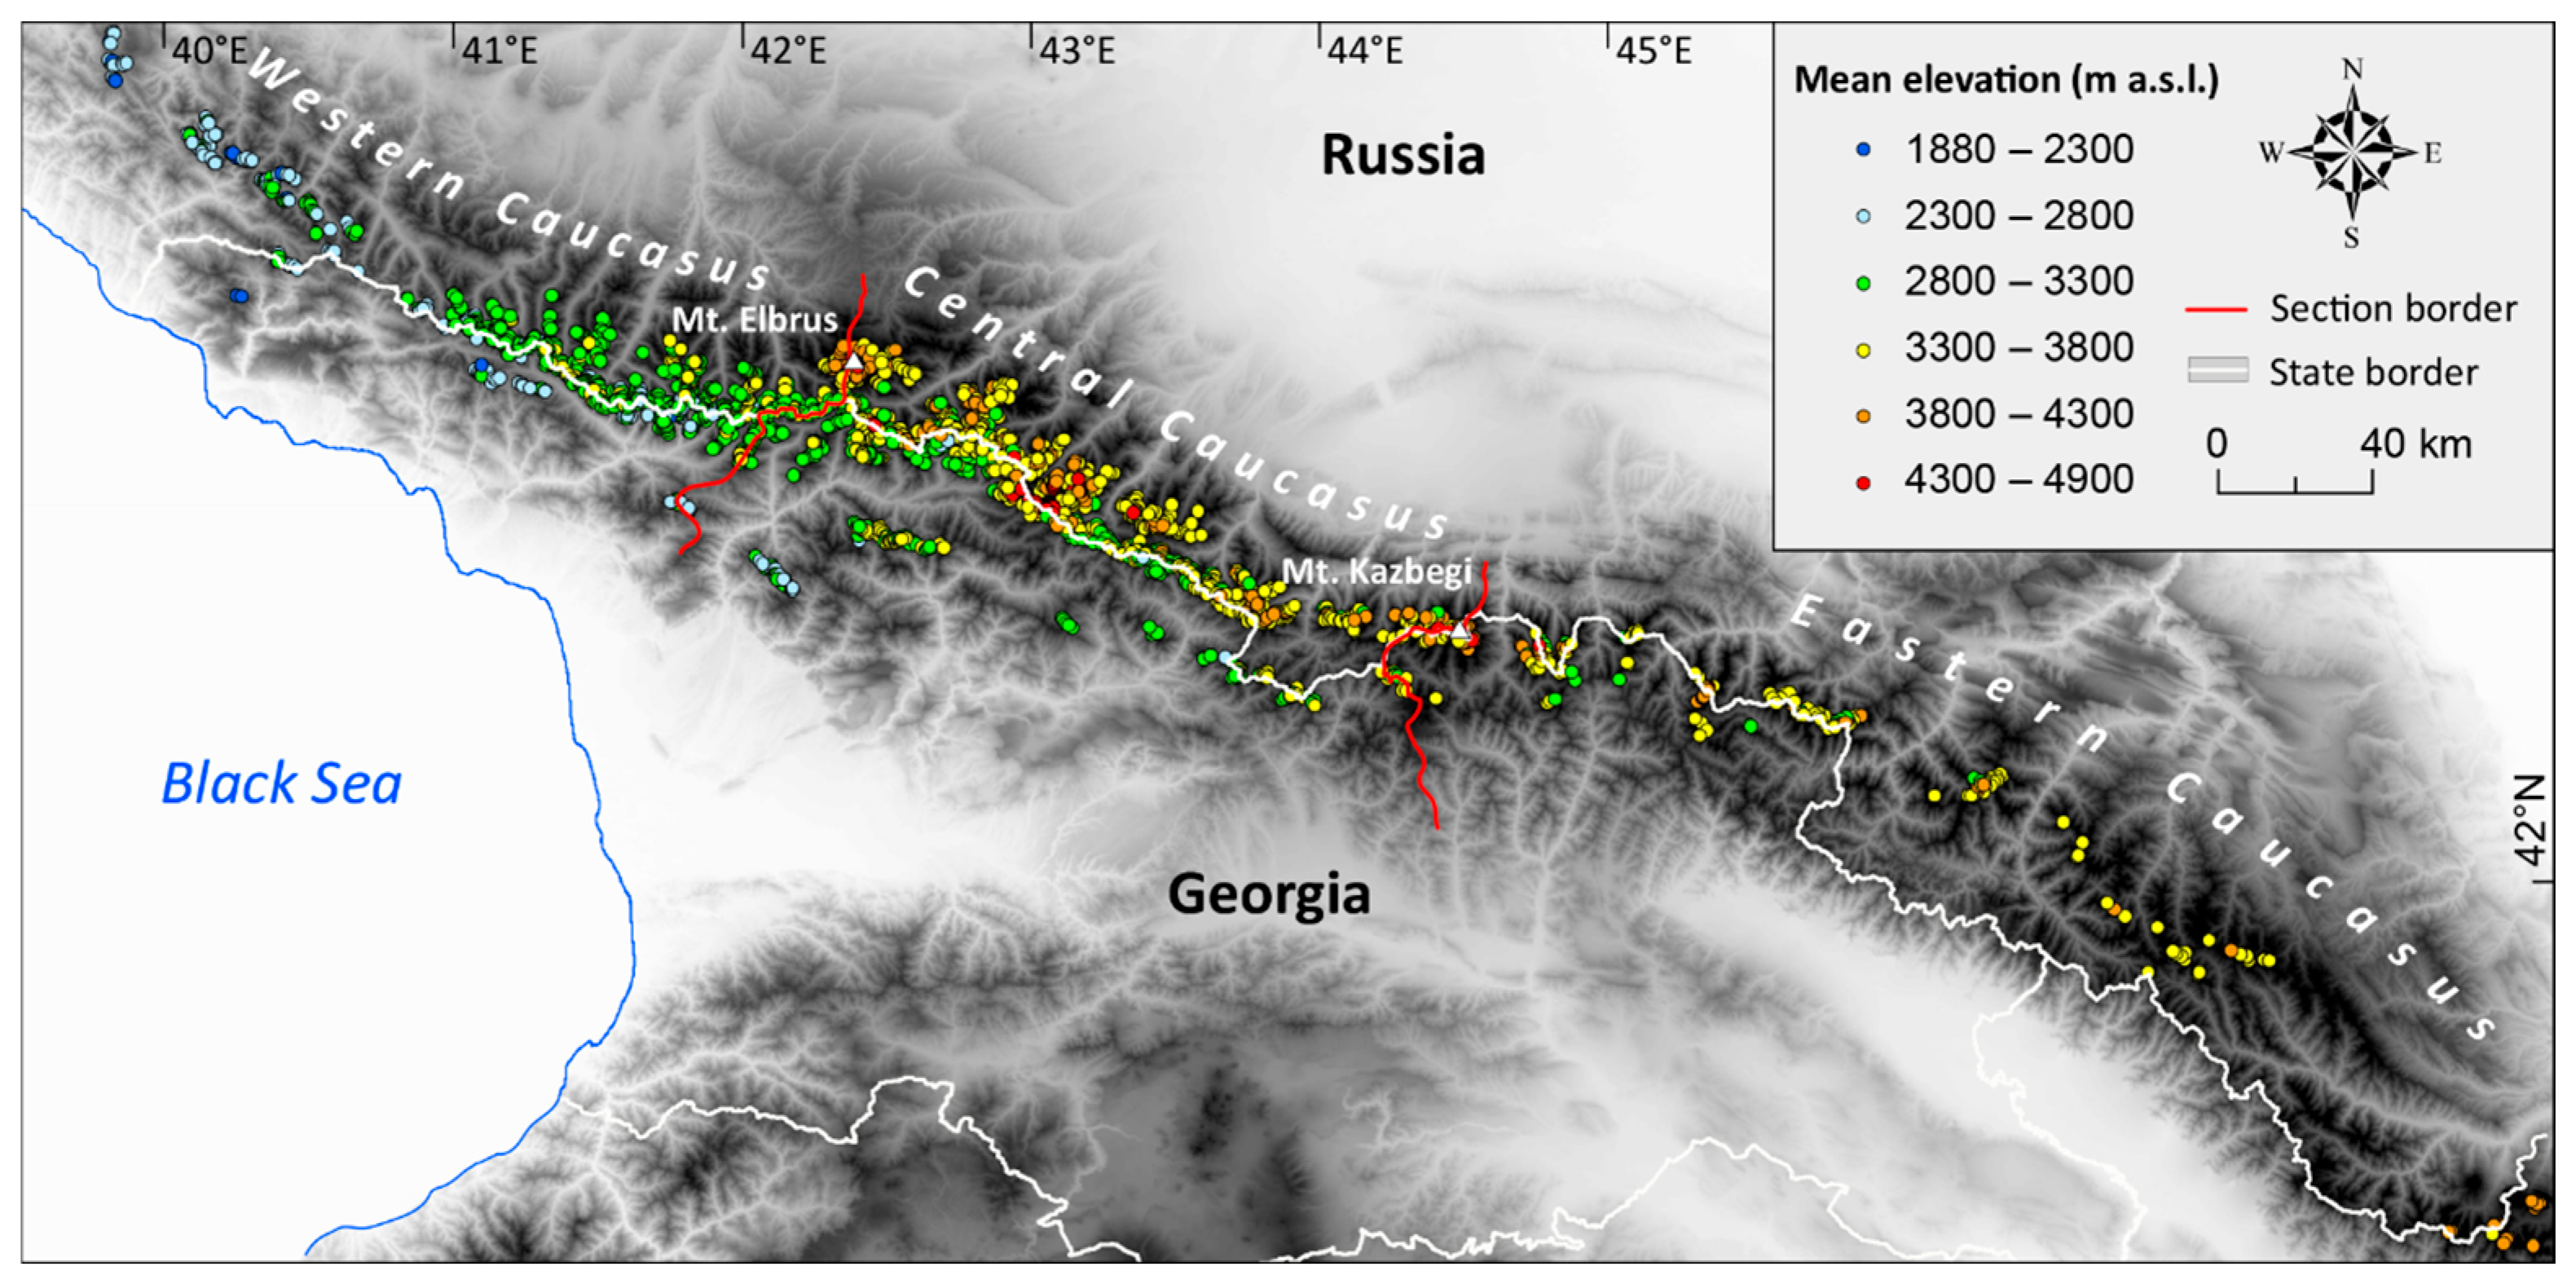
Glacier elevation characteristics vary significantly across the Greater Caucasus and reflect the influence of regional climatic gradients. In the Western Caucasus, glaciers occur at relatively low elevations, with average minimum elevations of approximately 2930 m a.s.l., average mean elevations of 3040 m (Figure 4), and average maximum elevations reaching 3165 m.
In contrast, glacier elevations increase eastward across the mountain range. In the Central Caucasus, average minimum glacier elevations reach approximately 2960 m, with average mean elevations of 3330 m and average maximum elevations exceeding 3740 m.
The Eastern Caucasus exhibits the highest glacier elevations, with average minimum elevations around 3515 m, average mean elevations of approximately 3670 m, and average maximum elevations reaching 3825 m.
A clear contrast is also evident between glaciers located on north- and south-facing slopes, highlighting the role of aspect in modulating glacier elevation. Glaciers on northern slopes occur at systematically higher elevations, with average minimum, mean, and maximum elevations of approximately 3260 m, 3427 m, and 3613 m a.s.l., respectively. In comparison, glaciers on southern slopes are situated relatively at lower elevations, with corresponding values of about 3090 m, 3230 m, and 3380 m a.s.l. (Table 3).

4.3. Glacier Size Classification

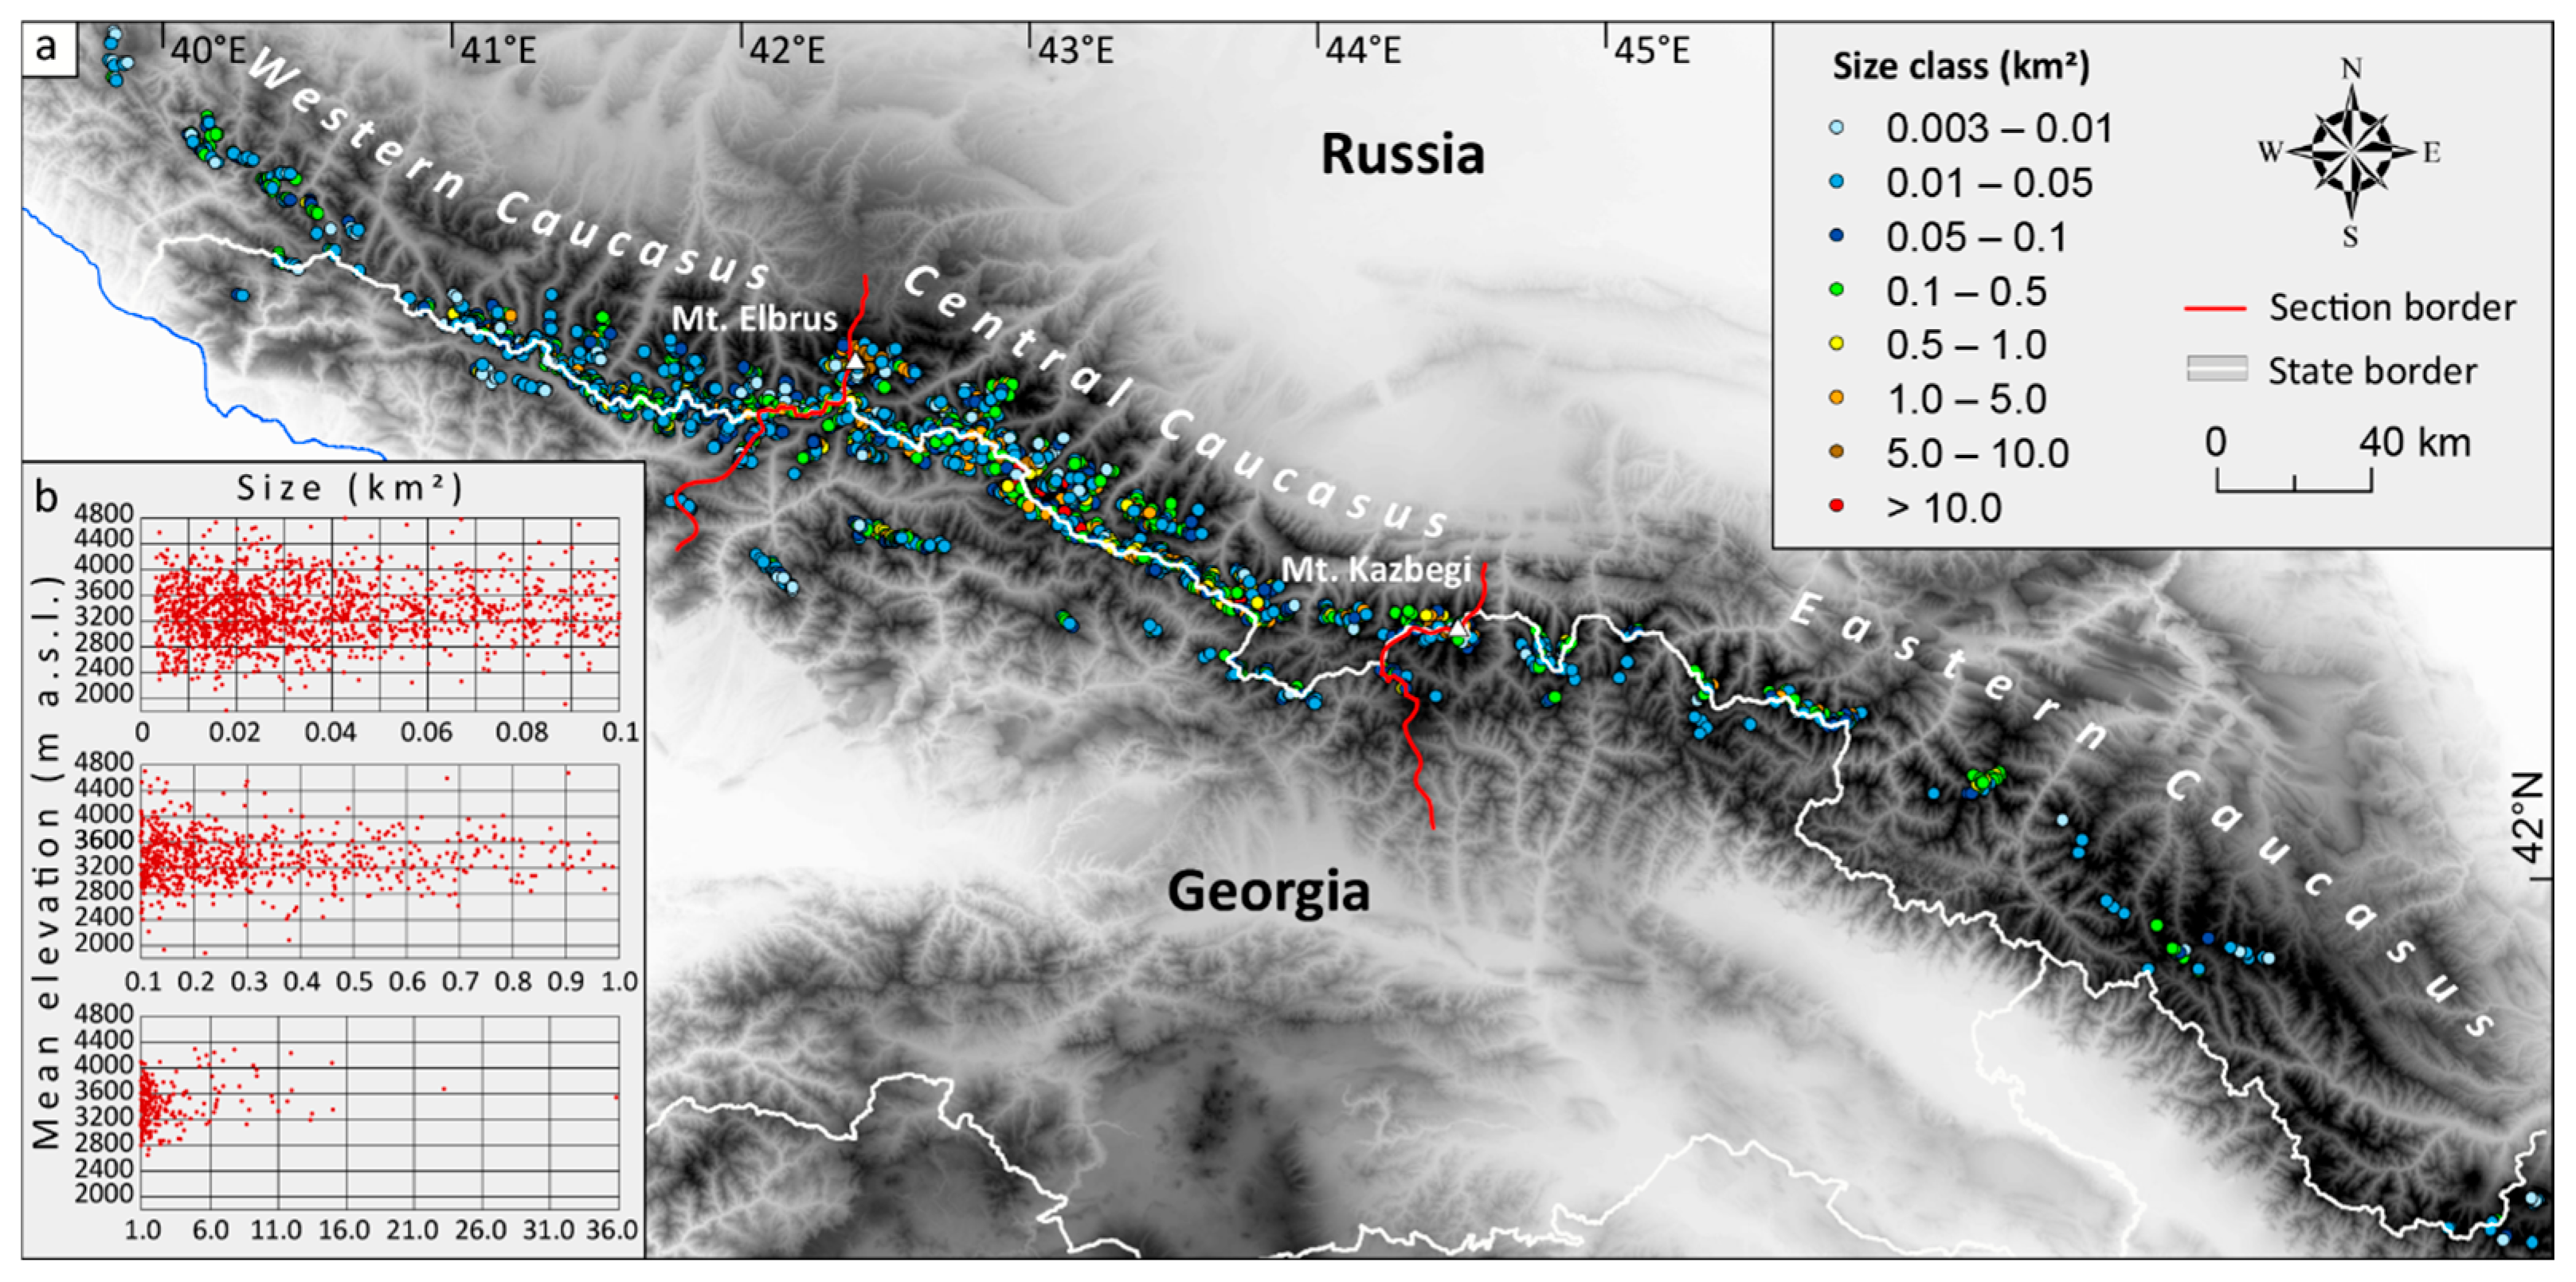
The glacier population of the Greater Caucasus is dominated by small glaciers. The smallest glaciers in the inventory, within the 0.003–0.01 km2 size class, account for 191 glaciers but represent only ~1.3 km2 of total glacier area. The 0.01–0.05 km2 size class contains the largest number of glaciers, with 882 glaciers covering ~23.6 km2 (Figure 5).
Glaciers within the 0.05–0.1 km2 and 0.1–0.5 km2 size classes are also abundant, reflecting the prevalence of small cirque glaciers across the mountain range. They comprise a significant proportion of the total glacier area (~153.5 km2).
Larger glaciers contribute disproportionately to the regional glacierized area. Glaciers within the 1–5 km2 size class account for a significant share (~318.8 km2) of the total glacier area, while glaciers larger than 5 km2 represent the most important ice reservoirs in the region (~371.2 km2). Despite their relatively small number, these large glaciers play a dominant role in regional ice storage and meltwater production.

4.4. Large Glaciers (>10 km2)

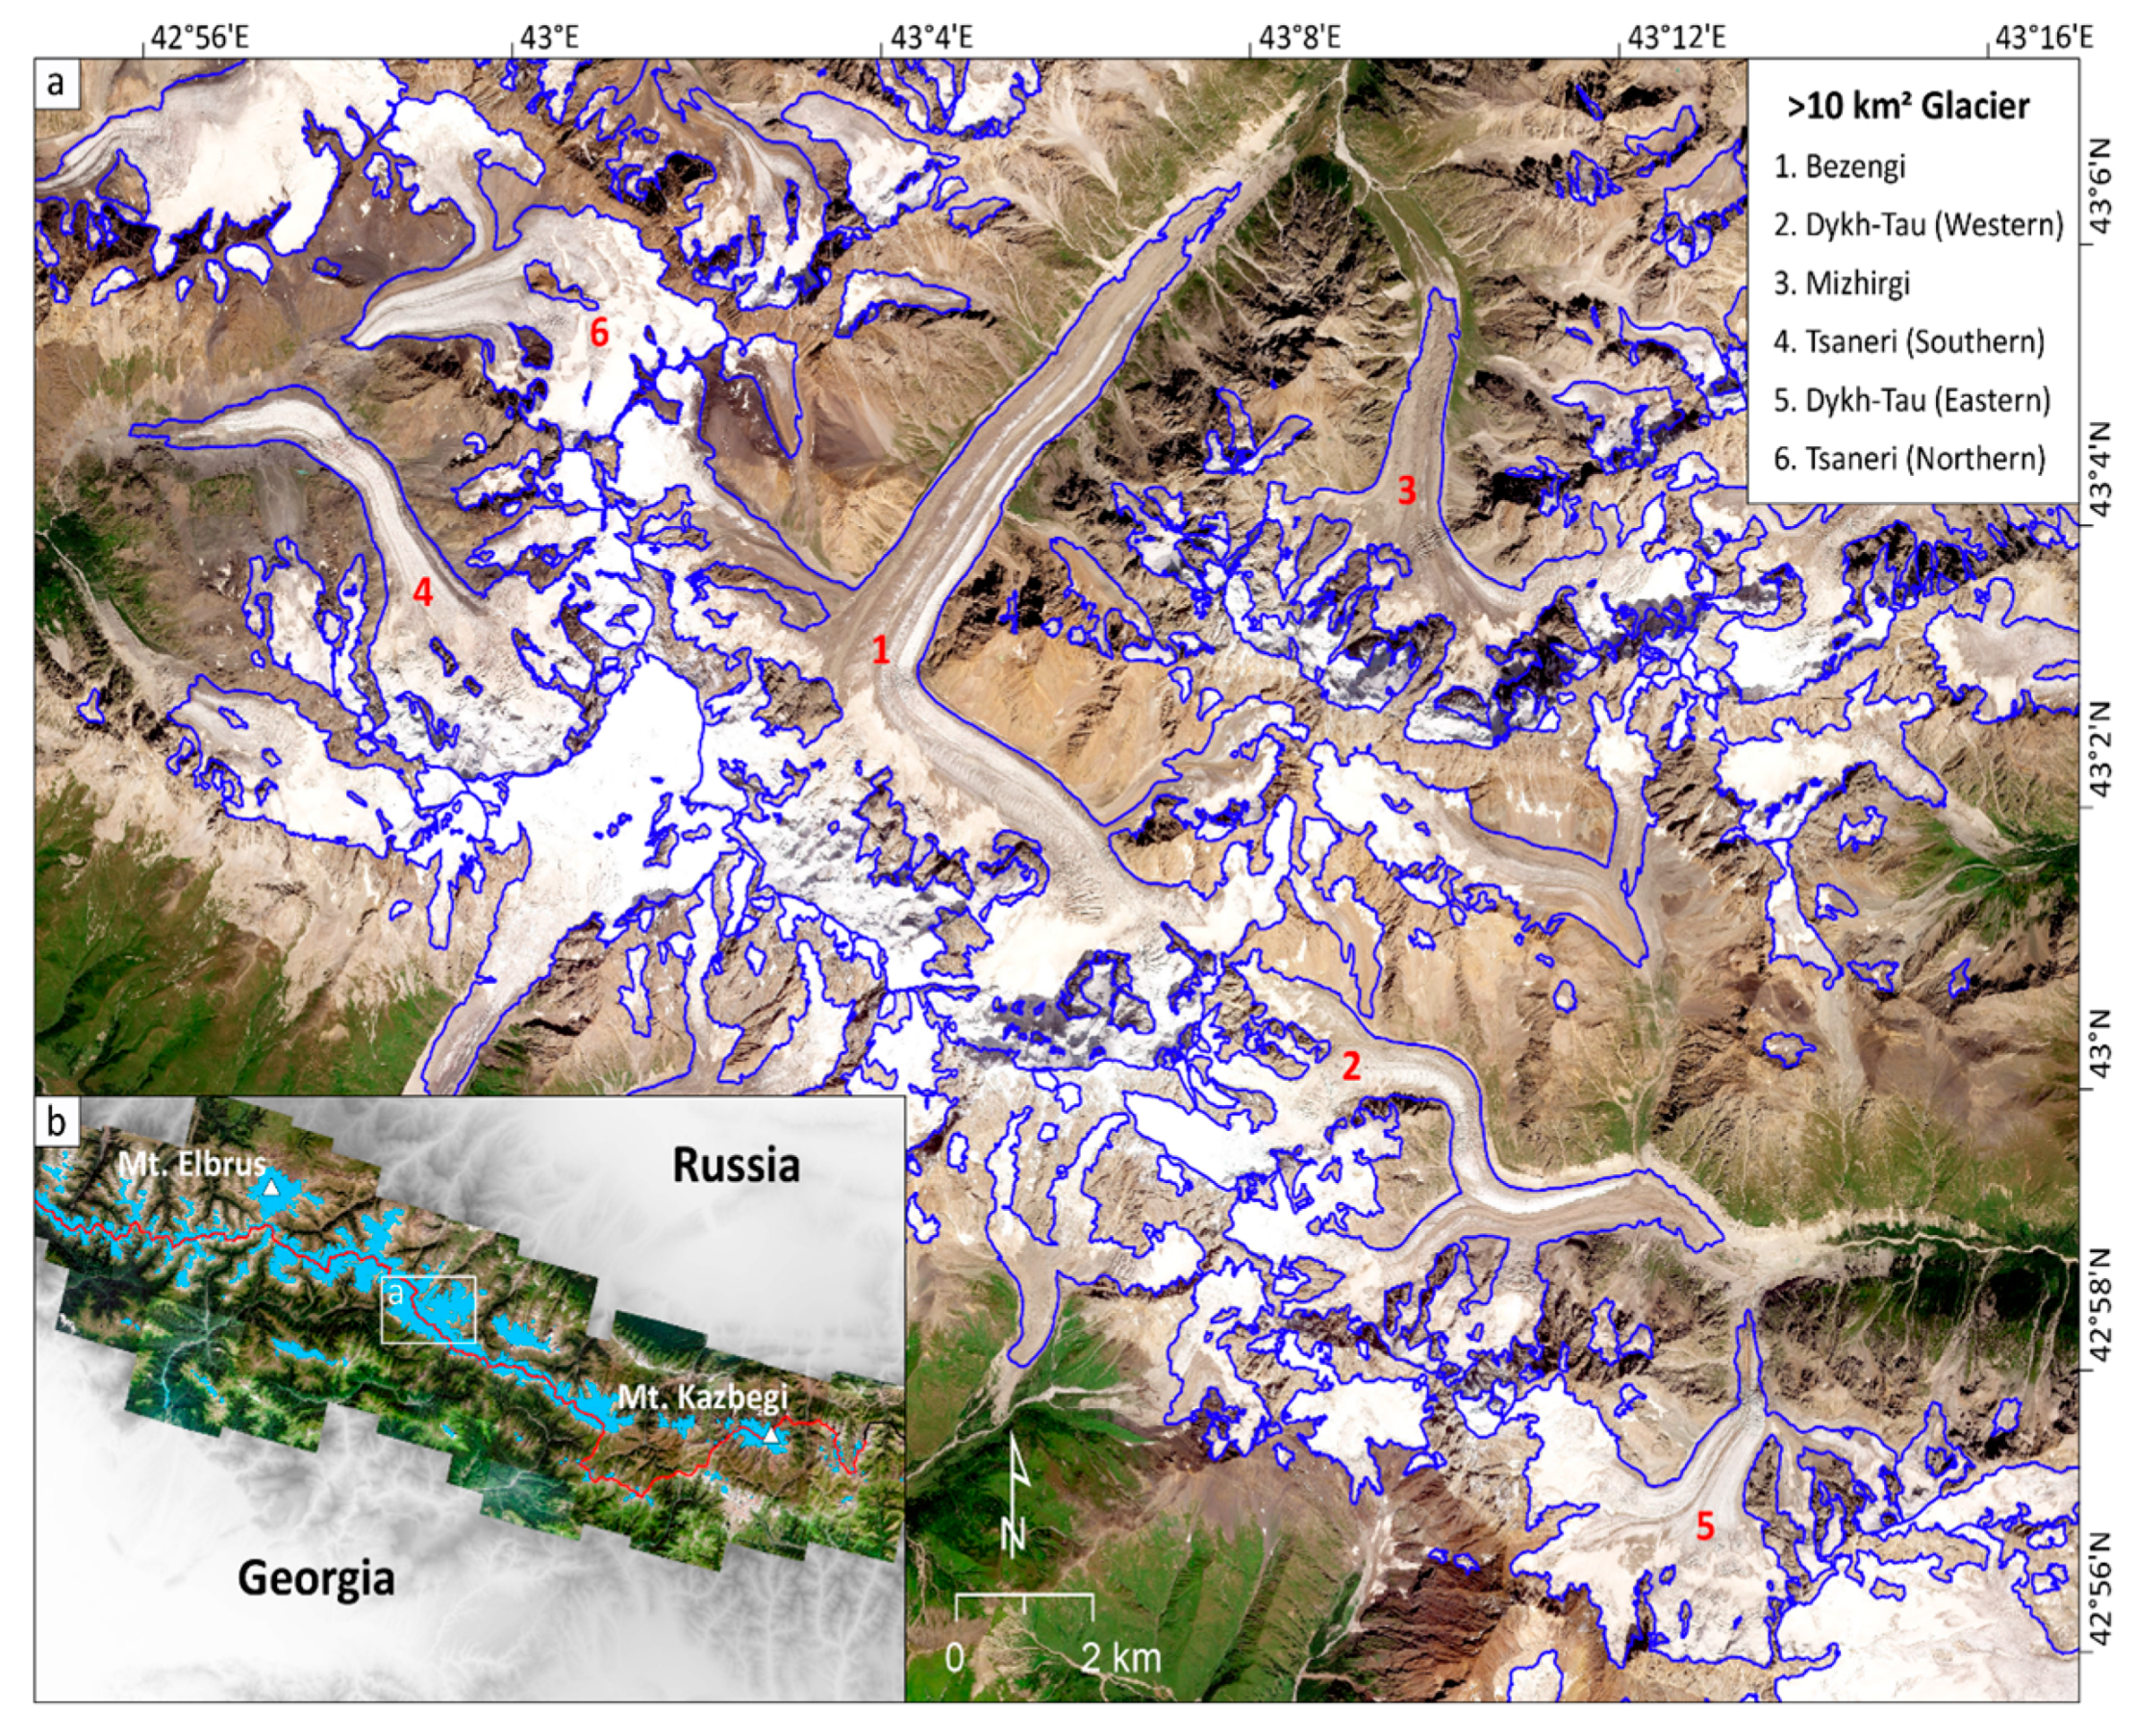
A total of 12 glaciers larger than 10 km2 were identified in the 2025 inventory. These glaciers are primarily located within the Central Caucasus, where the highest elevations and the most glaciologically favourable climatic conditions occur (Figure 6, Table 4). The largest glacier in the region is the Bezengi Glacier, which covers ~35.84 km2. Other major glaciers include the Karaugom Glacier (~23.22 km2) and Lekhziri Glacier (~13.44 km2).
These large valley glaciers contain extensive accumulation areas and long (3–8 km) ice tongues, allowing them to persist despite ongoing climatic warming. Although they represent only a small proportion of the total glacier count, they contribute substantially to the total glacier area and ice volume of the Greater Caucasus.

5. Discussion

5.1. Spatial Patterns of Glacier Cover

The 2025 glacier inventory highlights pronounced spatial heterogeneity in glacier distribution across the Greater Caucasus. The majority of glacierized area is concentrated within the Central Caucasus, which contains more than three-quarters of the total glacier area of the mountain range. This spatial concentration primarily reflects the higher elevations and broader accumulation zones found in this part of the range. The Central Caucasus hosts several of the highest peaks in the region (>5000 m a.s.l.), including Mount Elbrus (5642 m a.s.l.), whose extensive volcanic massif supports some of the largest glaciers in the entire Caucasus.
In contrast, glacierized areas in the Western Caucasus are characterized by a larger number of smaller glaciers (<0.5 km2) occupying cirques and short valley systems. Despite relatively high precipitation in this sector due to proximity to the Black Sea [36], lower mean elevations limit the development of extensive glacier systems. The Eastern Caucasus contains the smallest glacierized area within the mountain range, reflecting the combined influence of decreasing precipitation and increasing continentality toward the Caspian region [37,55]. In addition to these climatic controls, glacier distribution in this sector is also influenced by regional geomorphological characteristics. Several river basins are developed on relatively erodible Jurassic sedimentary rocks, which are subject to sustained denudation processes that limit the long-term preservation of glacial landforms and glacier accumulation zones [56]. These lithological and geomorphological conditions likely contribute to the reduced glacier extent observed in the Eastern Caucasus.
The clear asymmetry in glacier distribution between northern and southern slopes is another important feature of the regional cryosphere. Approximately 71% of the total glacier area is located on the northern slopes of the Greater Caucasus. This asymmetry results from several interacting factors, including differences in solar radiation [57], snow accumulation patterns [58], and topographic shading [59]. Northern slopes generally receive less direct solar radiation and tend to retain snow cover for longer periods, promoting glacier persistence at lower elevations.

5.2. Comparison with Previous Glacier Inventories

Several glacier inventories have been compiled for the Greater Caucasus using different data sources, including historical topographic maps and satellite imagery [12,33,34,60]. These inventories provide an important basis for assessing long-term glacier change across the region. The new 2025 glacier inventory presented here enables a comprehensive comparison with previous datasets and provides an updated assessment of glacier evolution since the late nineteenth century.
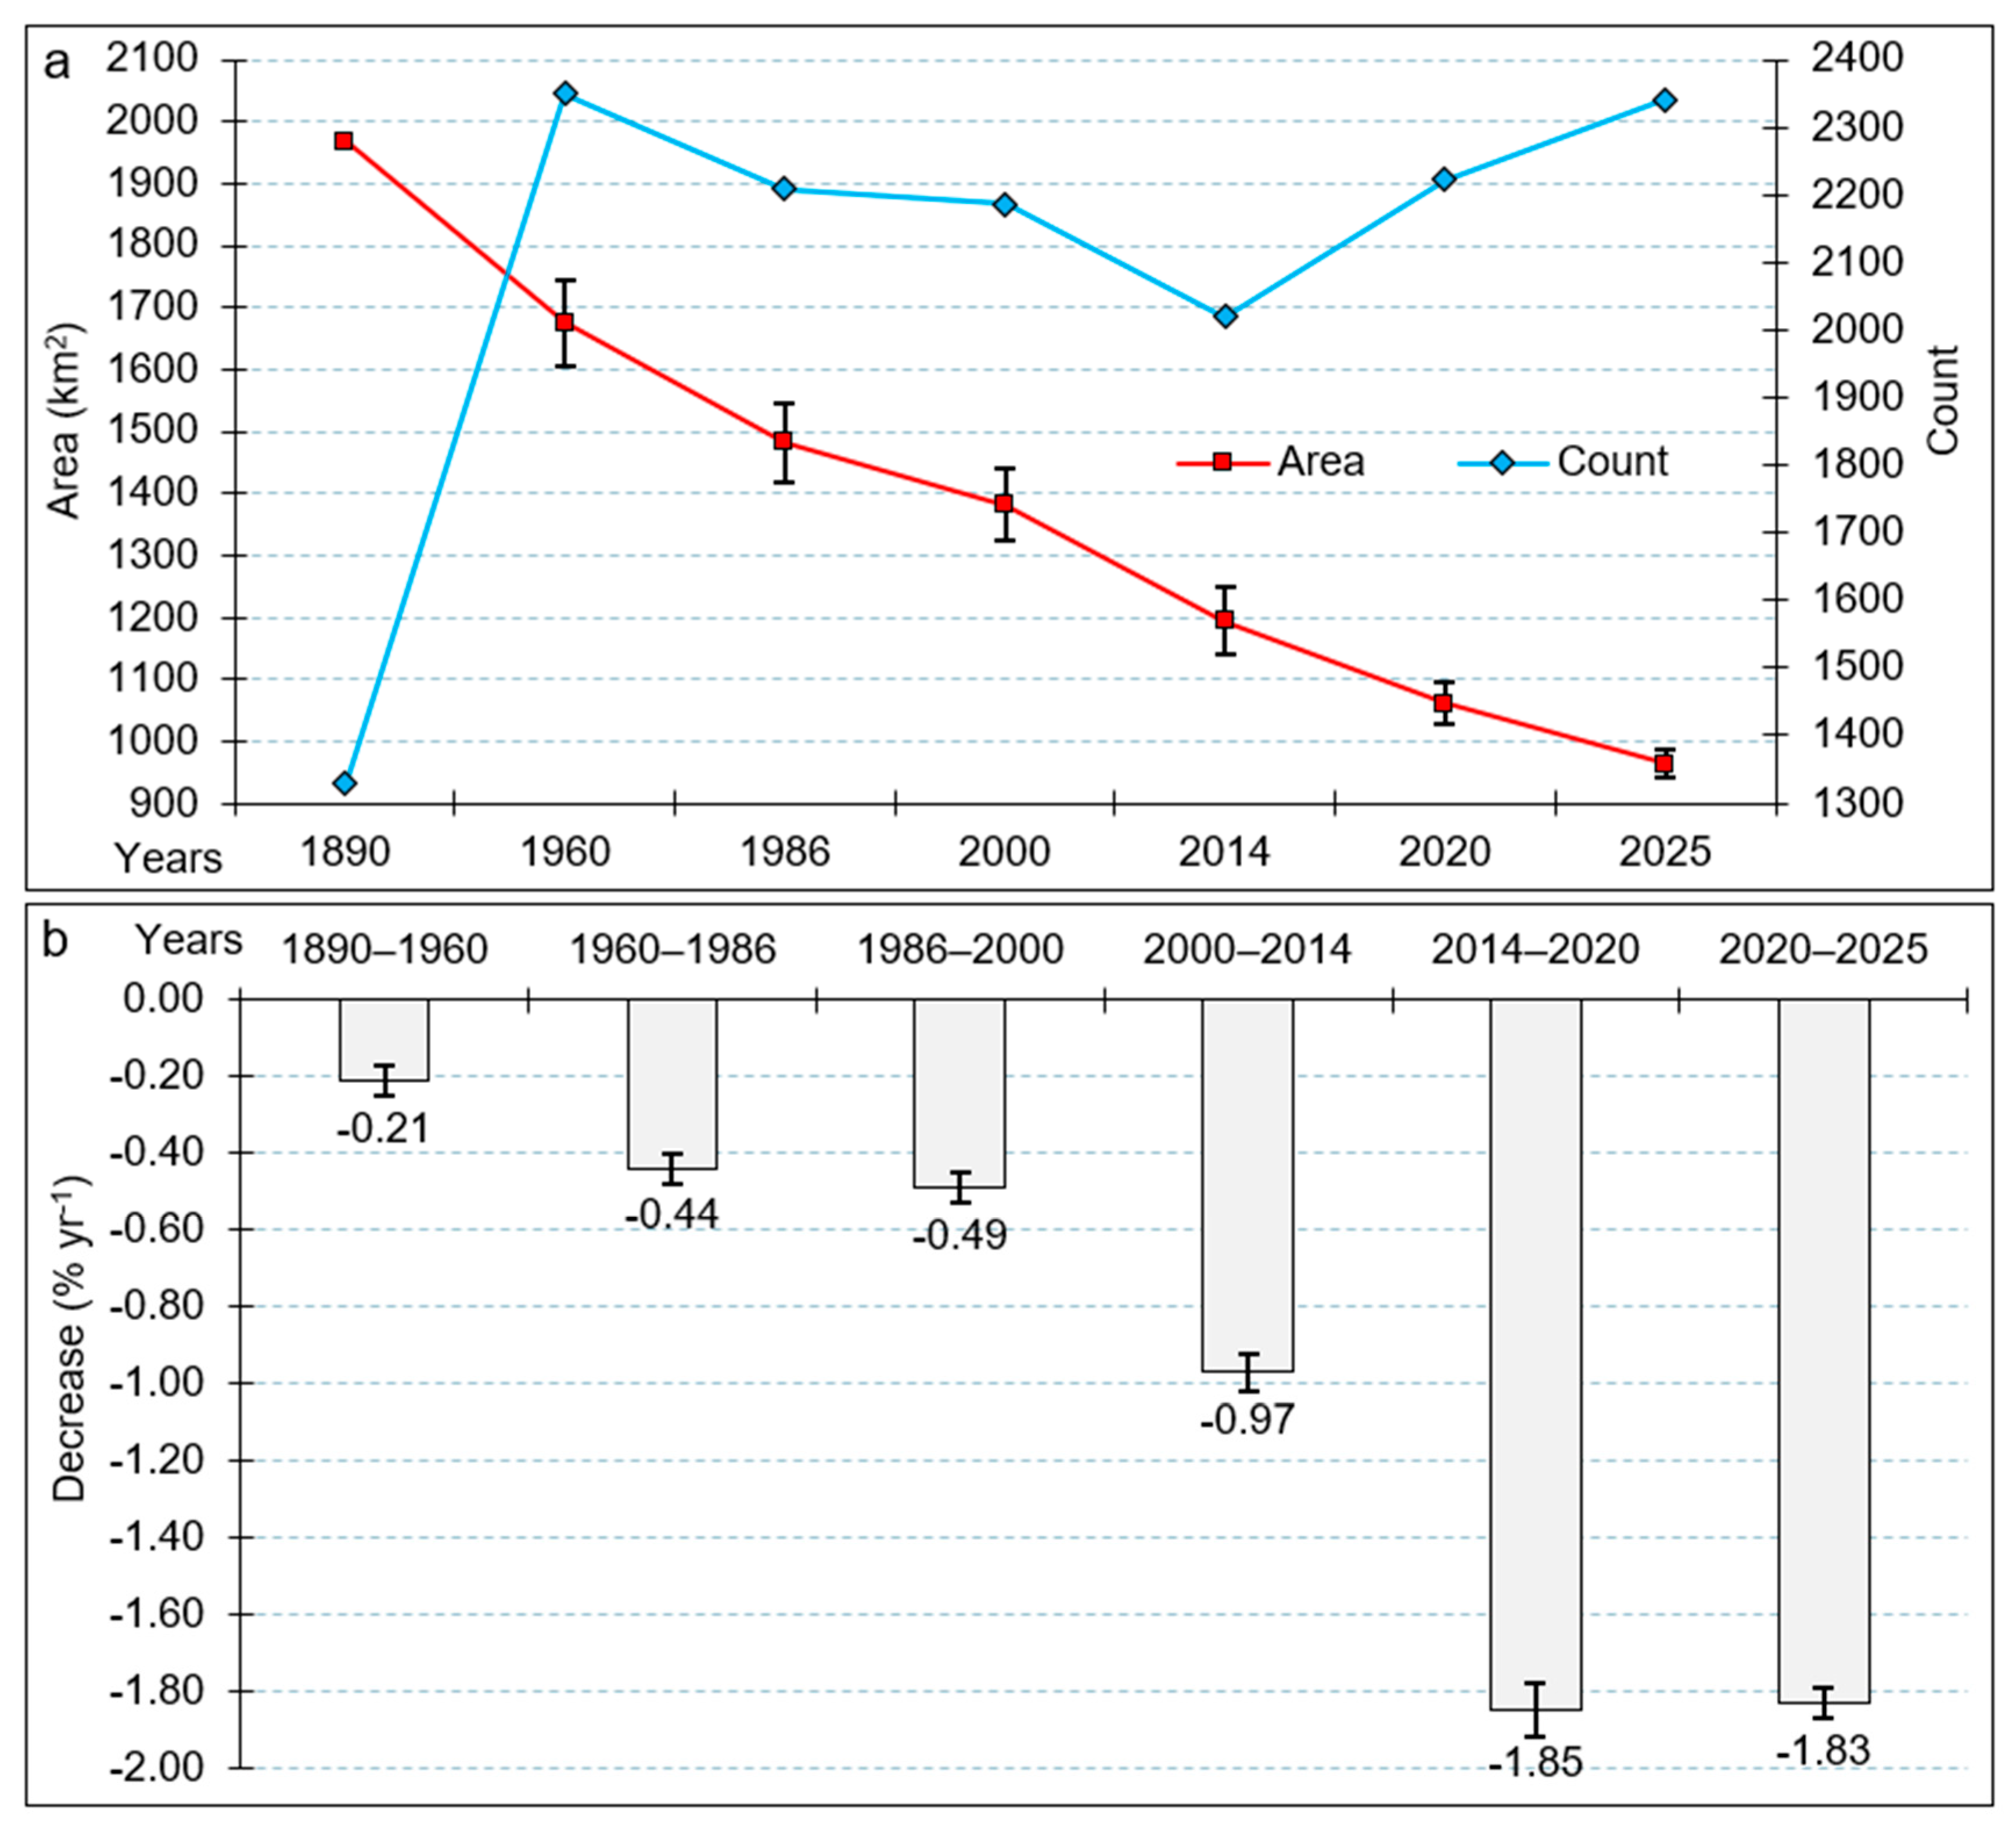
At the end of the nineteenth century, glaciers in the Greater Caucasus covered approximately 1967.4 km2 and consisted of 1329 glaciers (Figure 7a). Since that time, glaciers across the mountain range have experienced substantial and continuous retreat. By the 1960s, inventories derived from topographic maps indicated 2349 glaciers covering 1674.9 ± 70.4 km2, reflecting a significant reduction in total glacierized area compared with the late nineteenth century, but also a significant increase in the total glacier count, likely reflecting a shift in mapping protocols and the ability to differentiate individual glaciers from available data and surveys.
Satellite-based inventories available since the 1980s reveal a continued decline in glacier extent. In 1986, the total glacierized area was estimated at 1482.1 ± 64.4 km2 with 2209 glaciers, followed by further shrinkage to 1381.5 ± 58.2 km2 and 2186 glaciers in 2000. Subsequent inventories indicate that glacier retreat has persisted during the twenty-first century. The 2014 inventory documented 2020 glaciers with a total area of 1193.2 ± 54.0 km2, while the most recent 2020 inventory identified 2223 glaciers covering 1060.9 ± 33.6 km2. The new 2025 inventory presented in this study shows that glacierized area has further decreased to 964.0 ± 22.8 km2, confirming the continuation of strong glacier retreat across the region.
Although glacier area has declined steadily, changes in glacier number show a more complex pattern. The glacier count decreased during the twentieth century but has increased in recent decades (Figure 7a). This apparent increase is primarily related to glacier fragmentation, whereby formerly contiguous glaciers become separated into smaller ice bodies as thinning and retreat progress. Such fragmentation is particularly common for valley glaciers with narrowing tongues and for cirque glaciers. Consequently, reductions in glacier area do not necessarily correspond to proportional decreases in glacier number.
Rates of glacier area change further highlight the acceleration of glacier retreat in recent decades (Figure 7b). Between 1890 and 1960, glacier area declined at an average rate of approximately −0.21% yr−1. The rate increased during the second half of the twentieth century to −0.44% yr−1 between 1960 and 1986, and −0.49% yr−1 between 1986 and 2000. A pronounced acceleration then occurred during the twenty-first century, with glacier area decreasing at a rate of −0.97% yr−1 between 2000 and 2014, which further intensified to −1.85% yr−1 between 2014 and 2020. The most recent period, 2020–2025, shows a similarly high rate of decline of −1.83% yr−1, indicating that glacier shrinkage in the Greater Caucasus reached its highest recorded rate during the past decade.
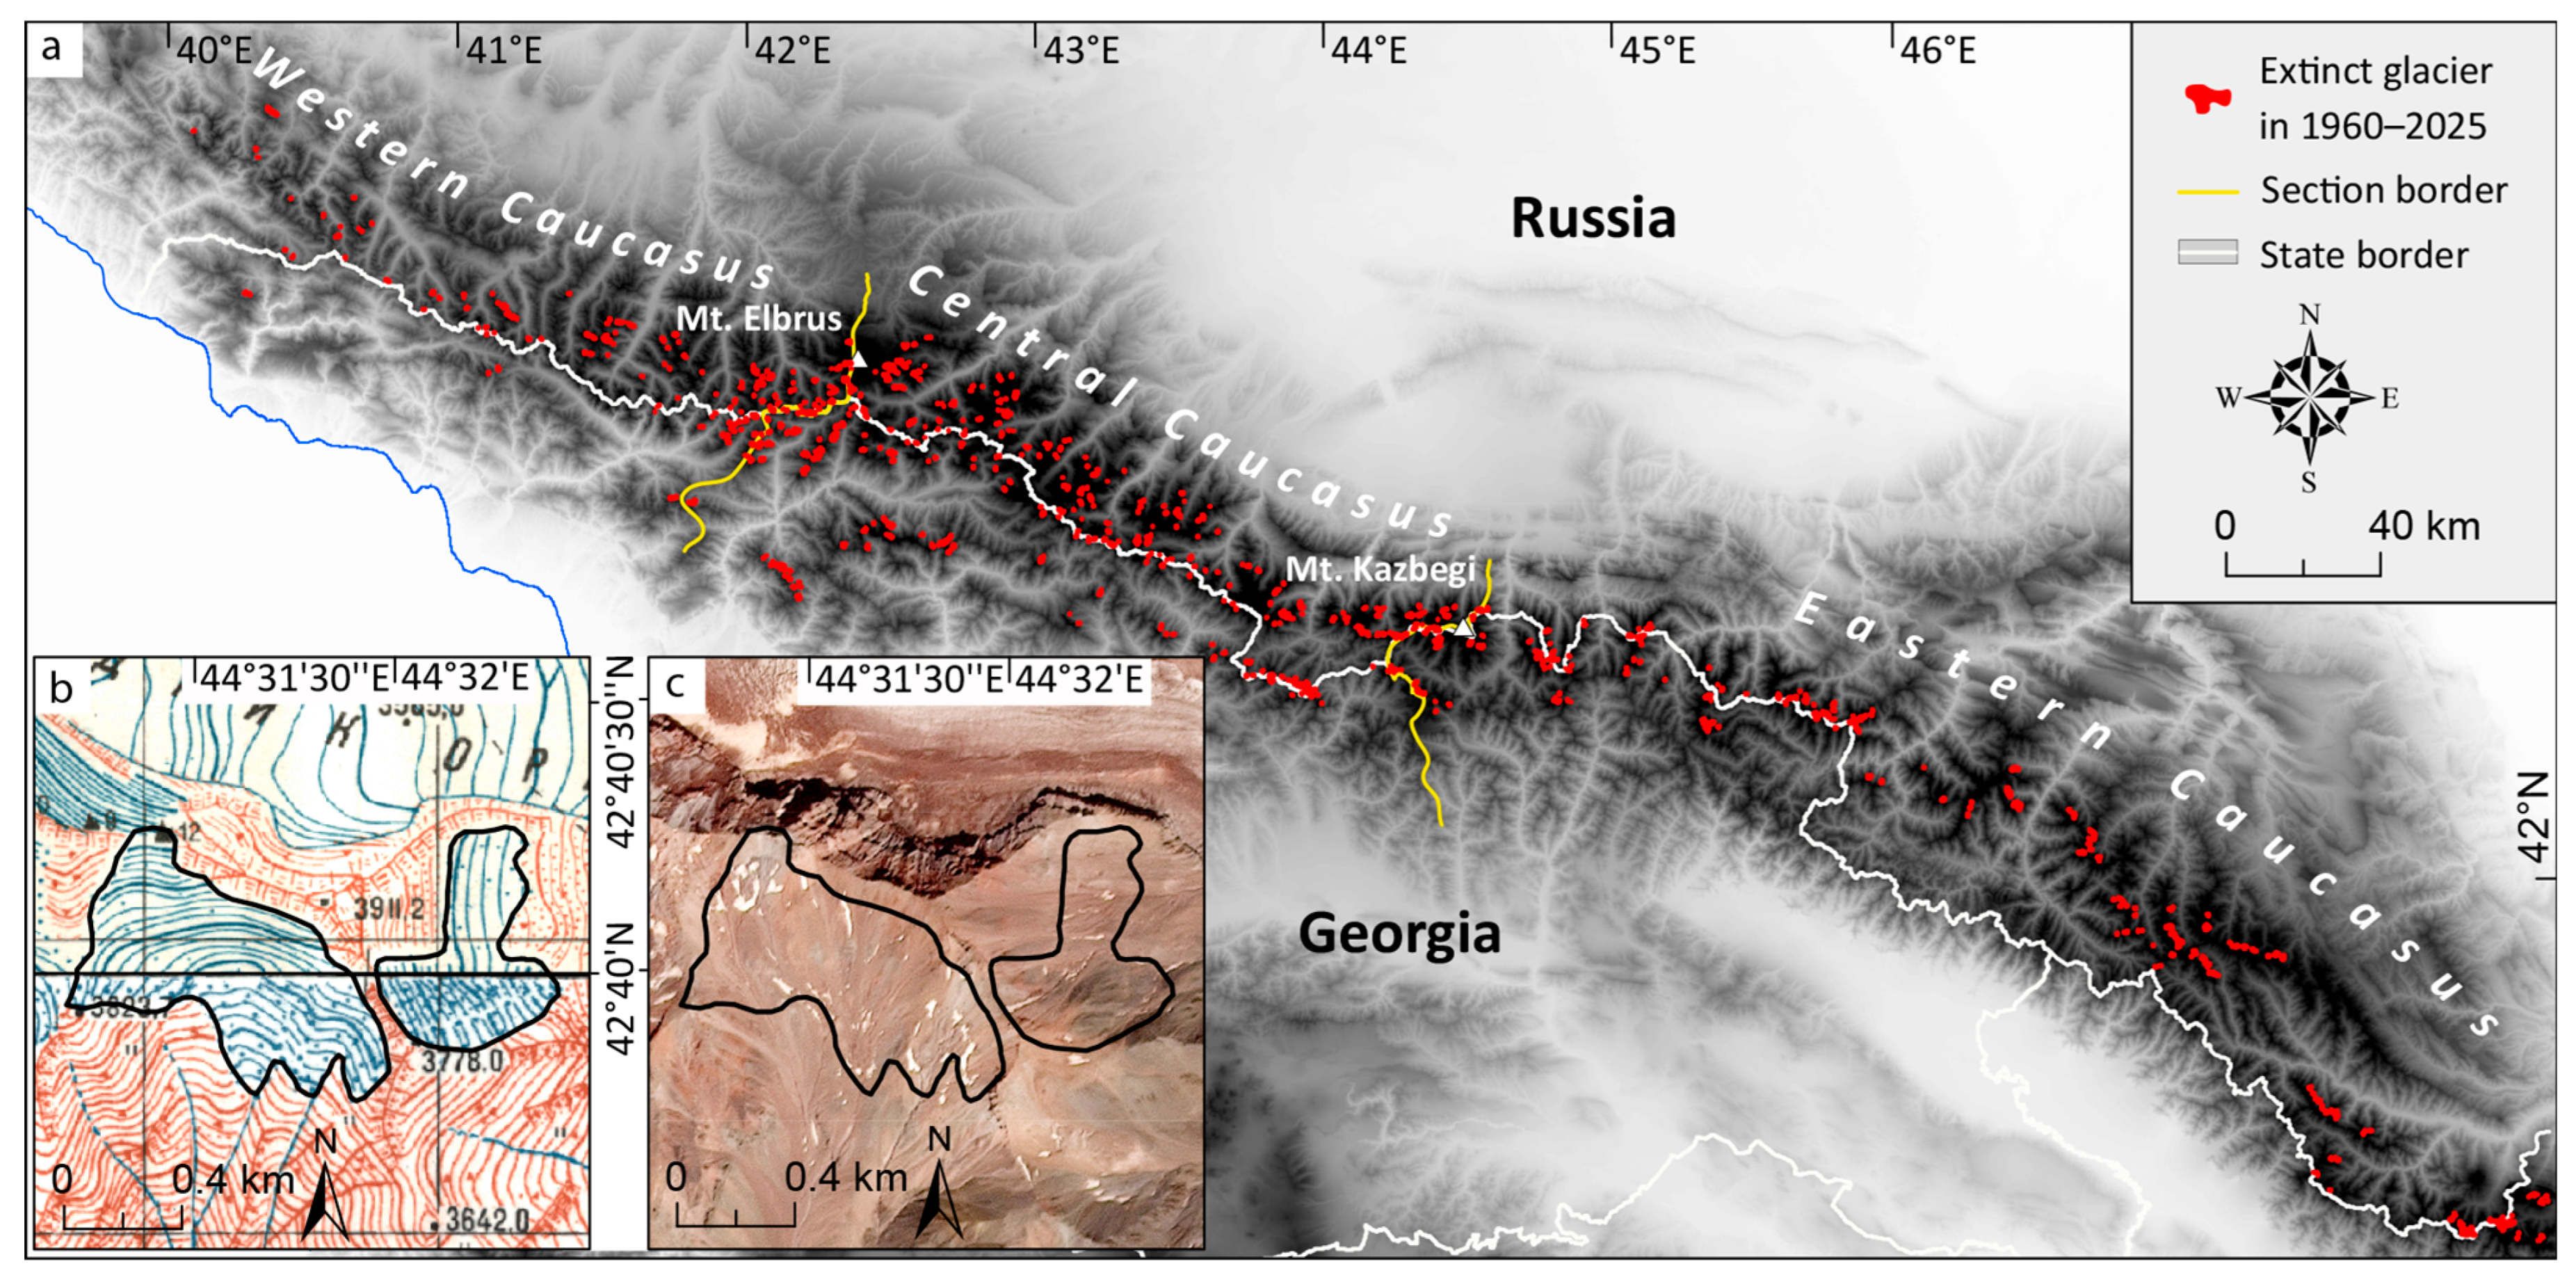
Comparison with the 1960s glacier extents [33] further highlights the magnitude of long-term glacier loss. Over the past ~65 years, a total of 965 glaciers, representing approximately 122.9 km2 of glacierized area, became extinct across the Greater Caucasus (Figure 8).
The accelerated glacier loss and widespread glacier extinction observed in the Greater Caucasus are consistent with trends reported for many mountain glacier regions worldwide [61,62] and reflect the growing influence of climatic warming during recent decades [2,3,63]. The particularly high rates of glacier area decrease recorded since 2000 emphasize the importance of maintaining regularly updated glacier inventories for this region. Given the rapid pace of glacier shrinkage documented in this study, especially since the most recent inventories of 2014 and 2020, we recommend that regional glacier inventories be updated at intervals of approximately five years. Such frequent updates would substantially improve the ability to track ongoing glacier changes and would provide essential datasets for assessing climate-driven glacier dynamics and their implications for regional hydrology and water-resource availability in this mid-latitude mountain environment.

5.3. Climate Controls on Glacier Change

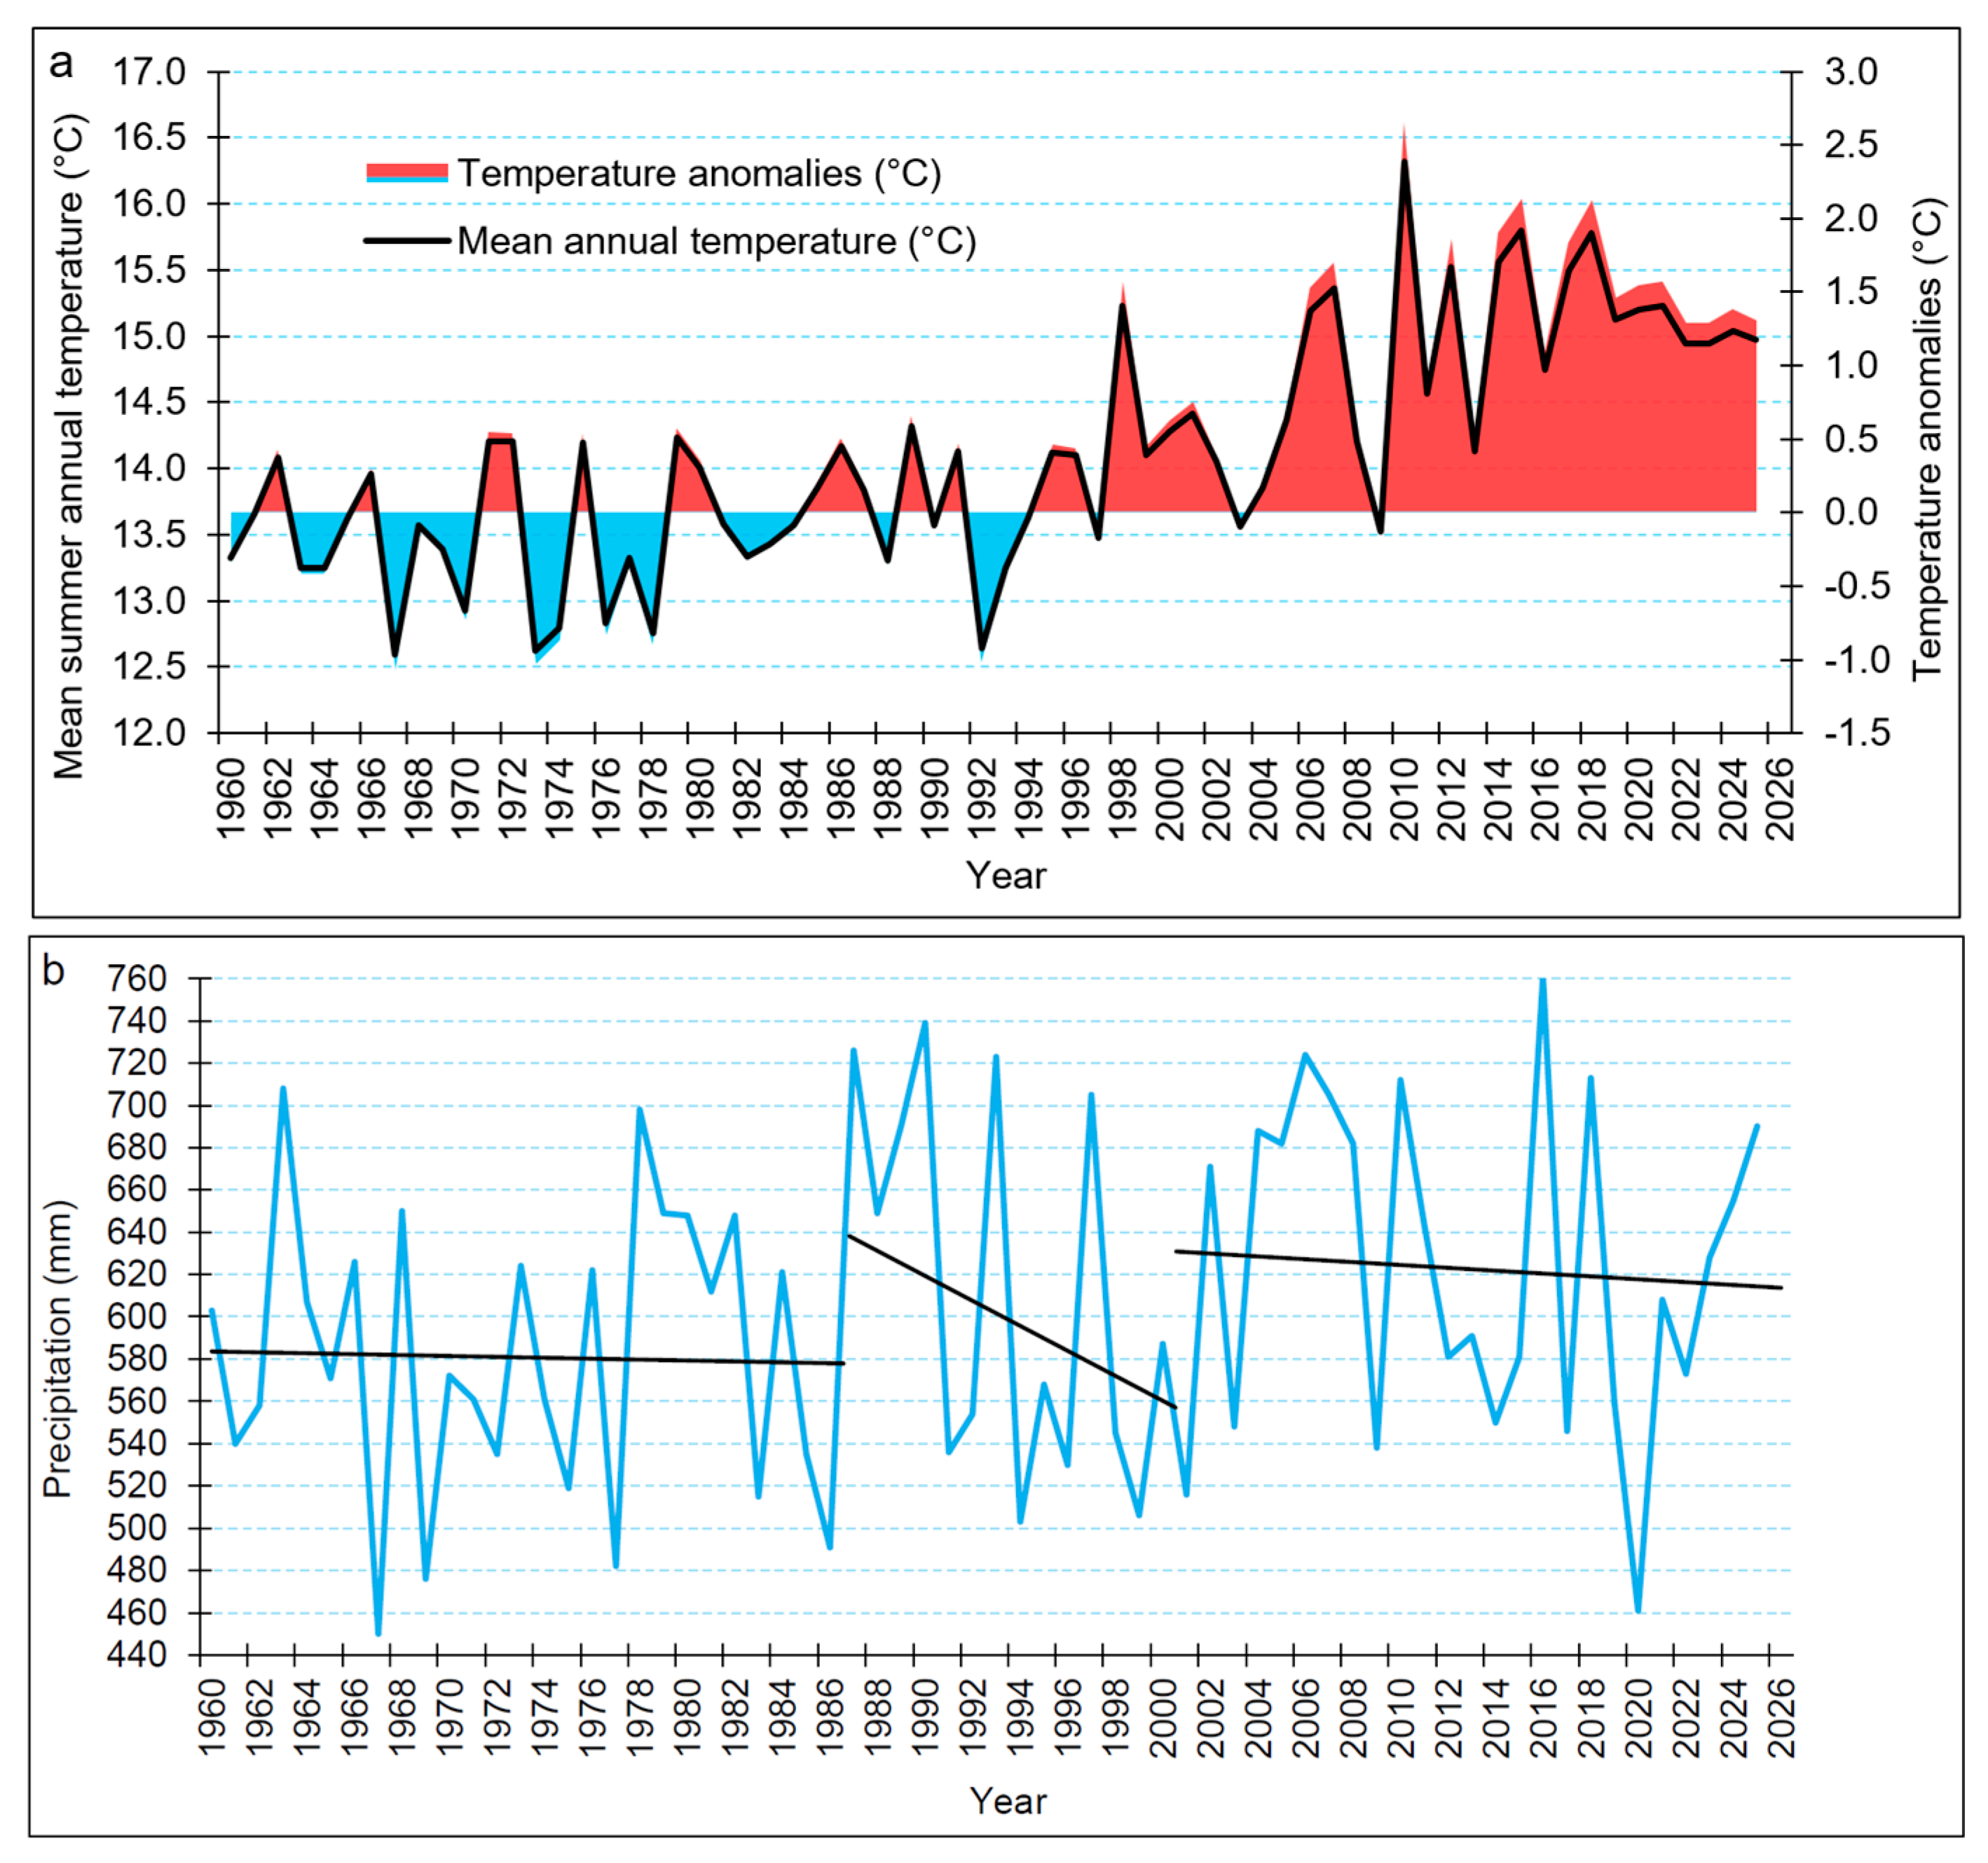
The long-term decline of glaciers in the Greater Caucasus is closely linked to regional climatic trends, particularly changes in air temperature and precipitation. Glaciers respond sensitively to variations in these climatic variables because their mass balance is controlled primarily by the balance between winter snow accumulation and summer melt [64,65]. The climatic records presented in Figure 9 provide important context for interpreting the observed glacier changes.
Figure 9a shows the evolution of mean summer (May–September) temperatures and associated temperature anomalies in the Greater Caucasus between 1960 and 2025 based on ERA5 reanalysis data. The record reveals a clear long-term warming trend across the region. Although short-term fluctuations are evident, particularly during the 1970s and early 1980s, temperatures have increased markedly since the late twentieth century. Positive temperature anomalies dominate the most recent decades, indicating that summers have become substantially warmer compared with the earlier part of the observational record.
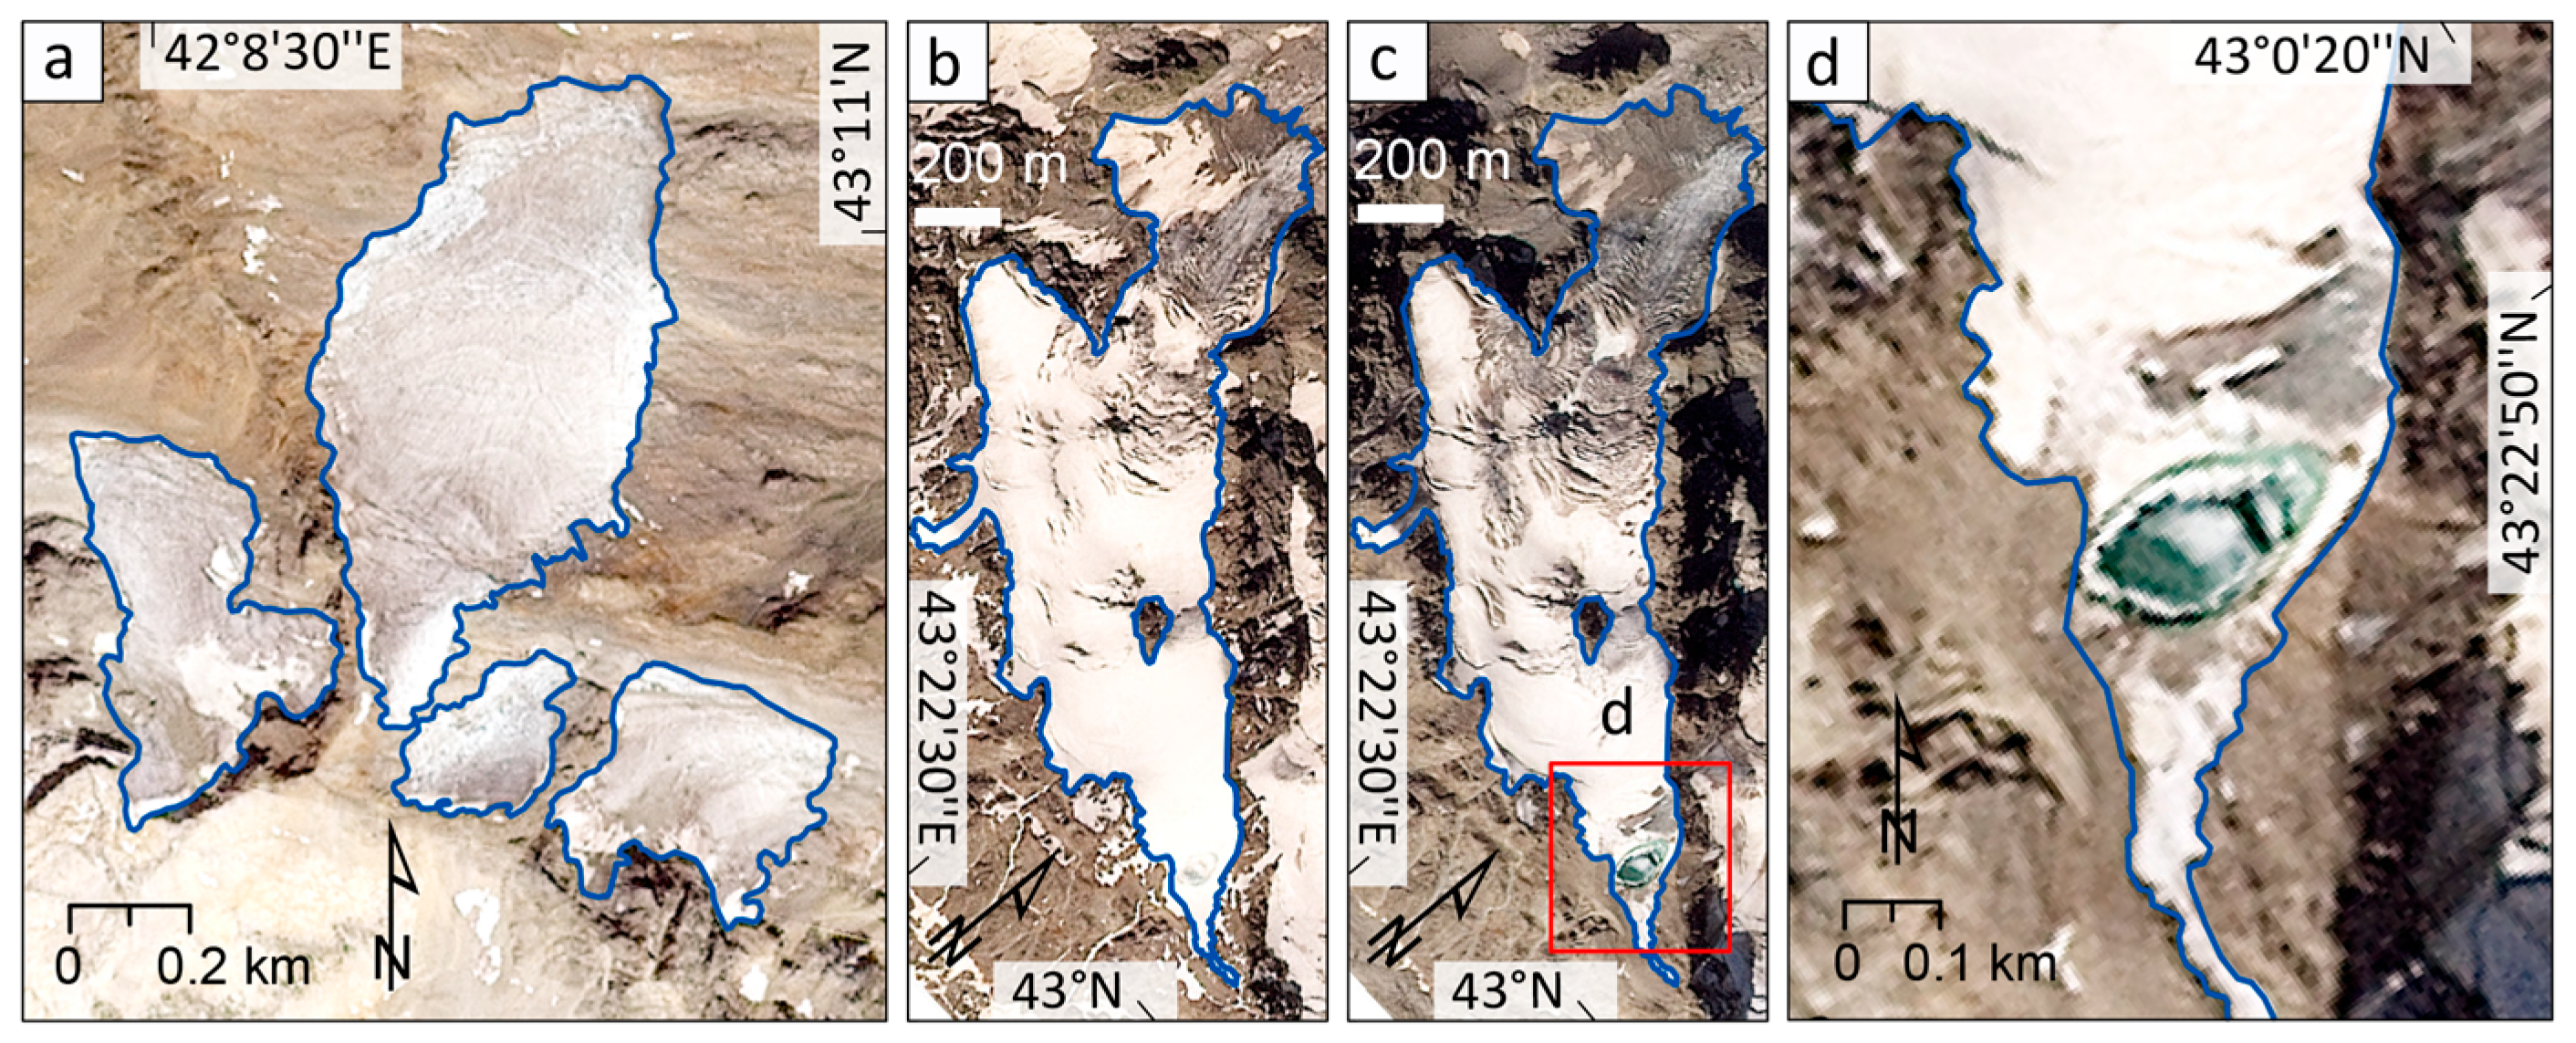
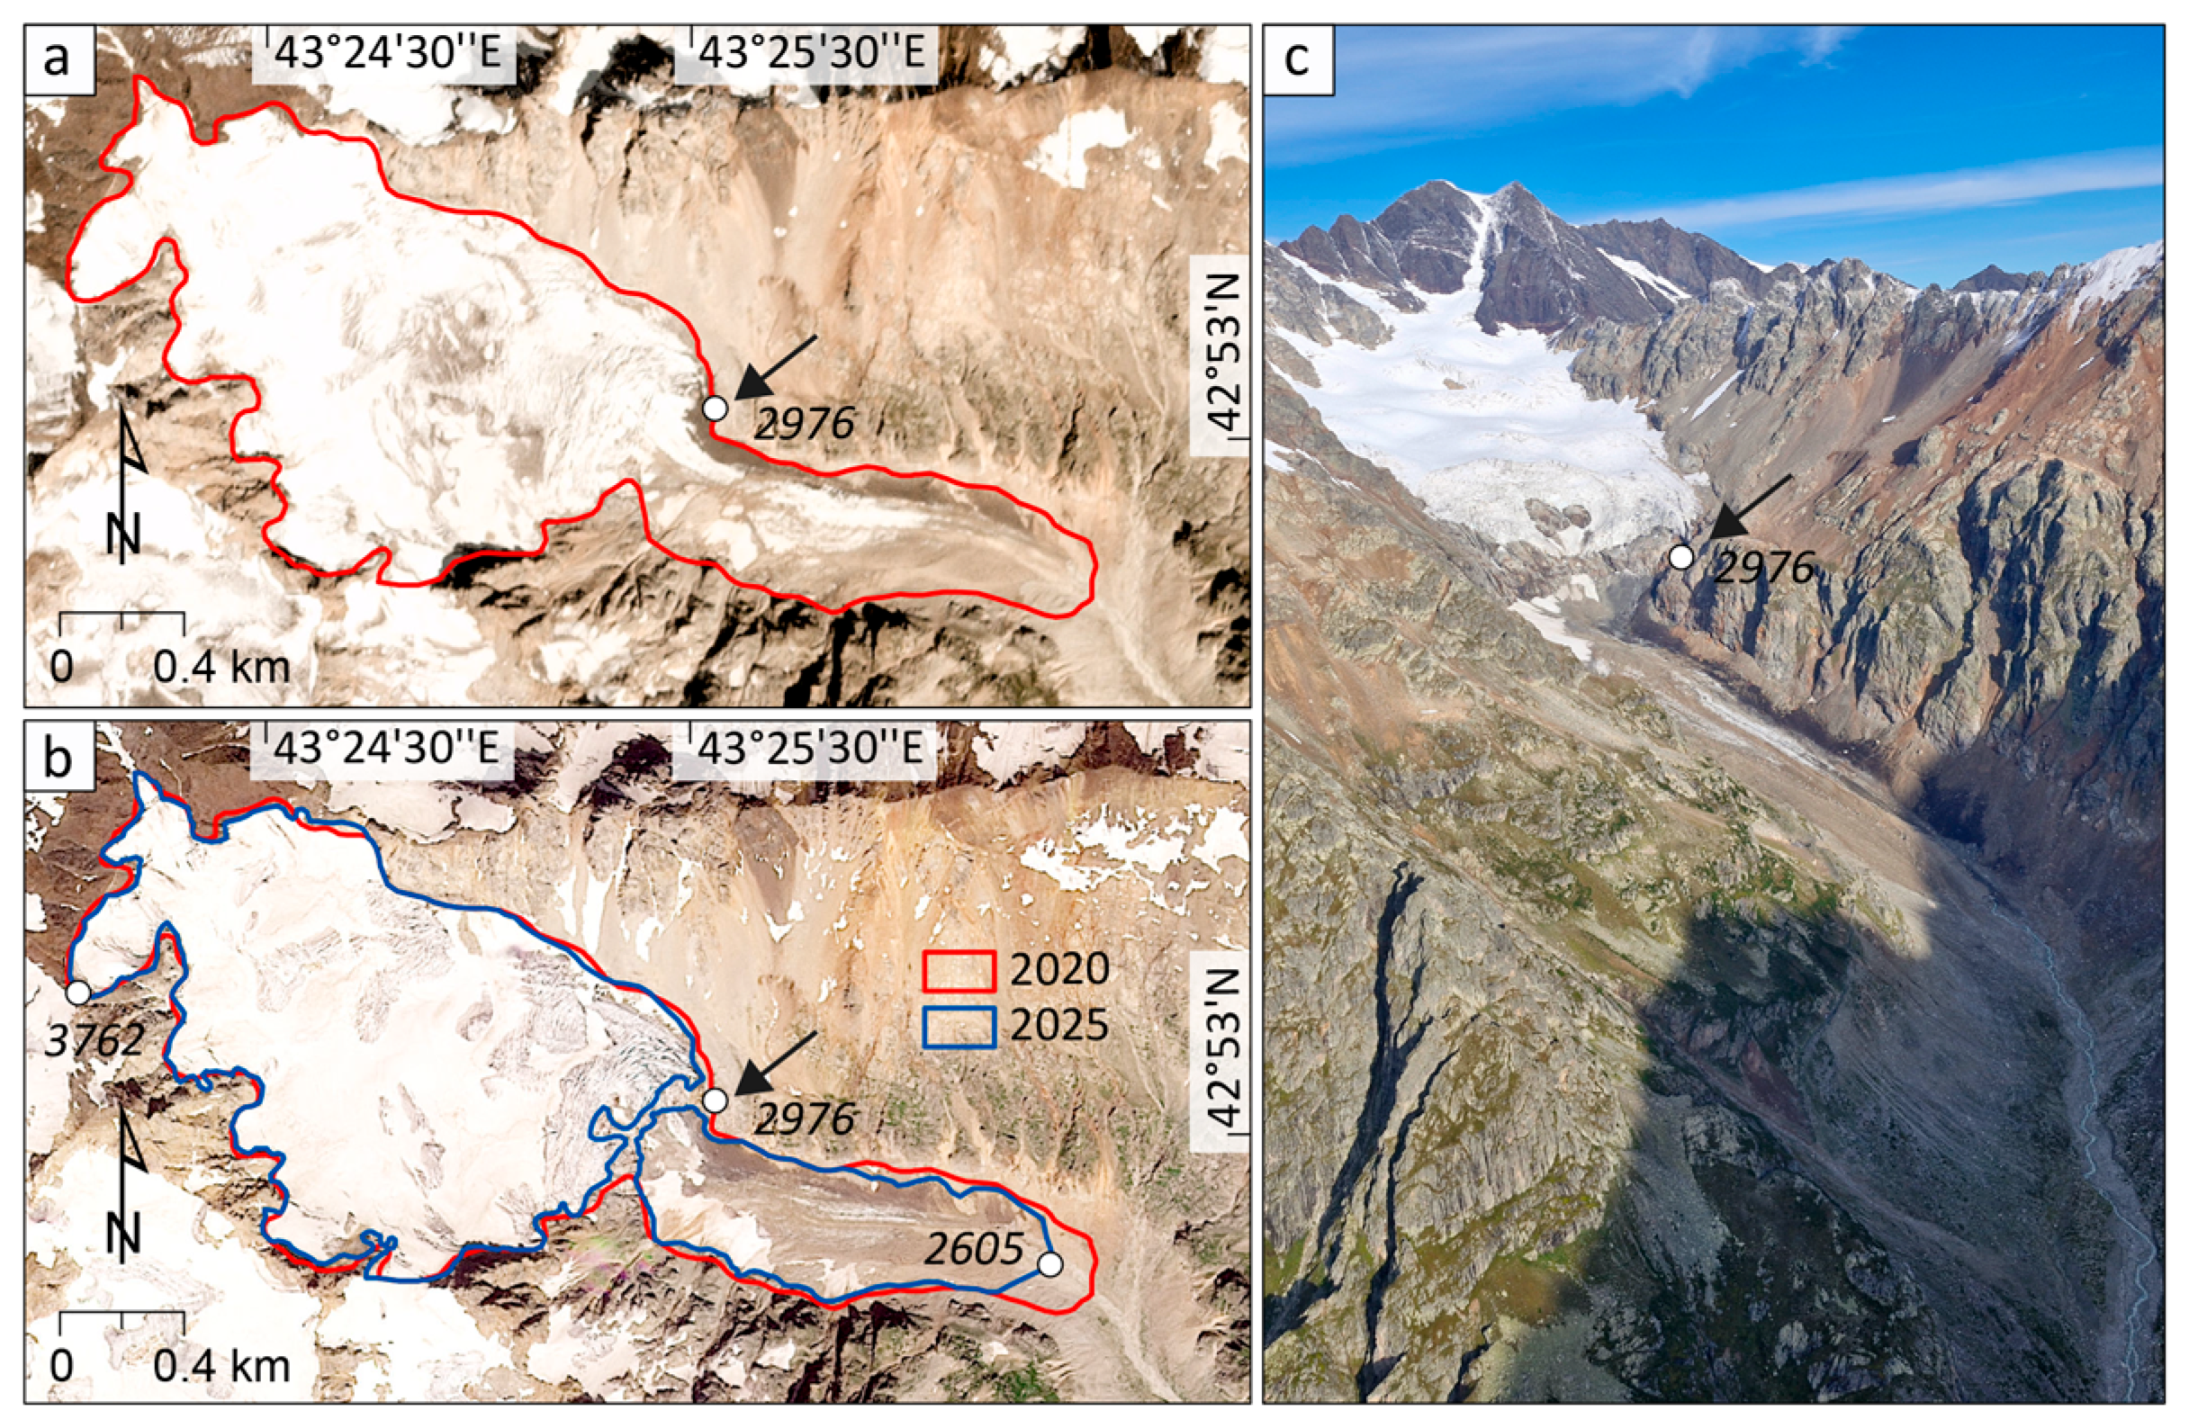
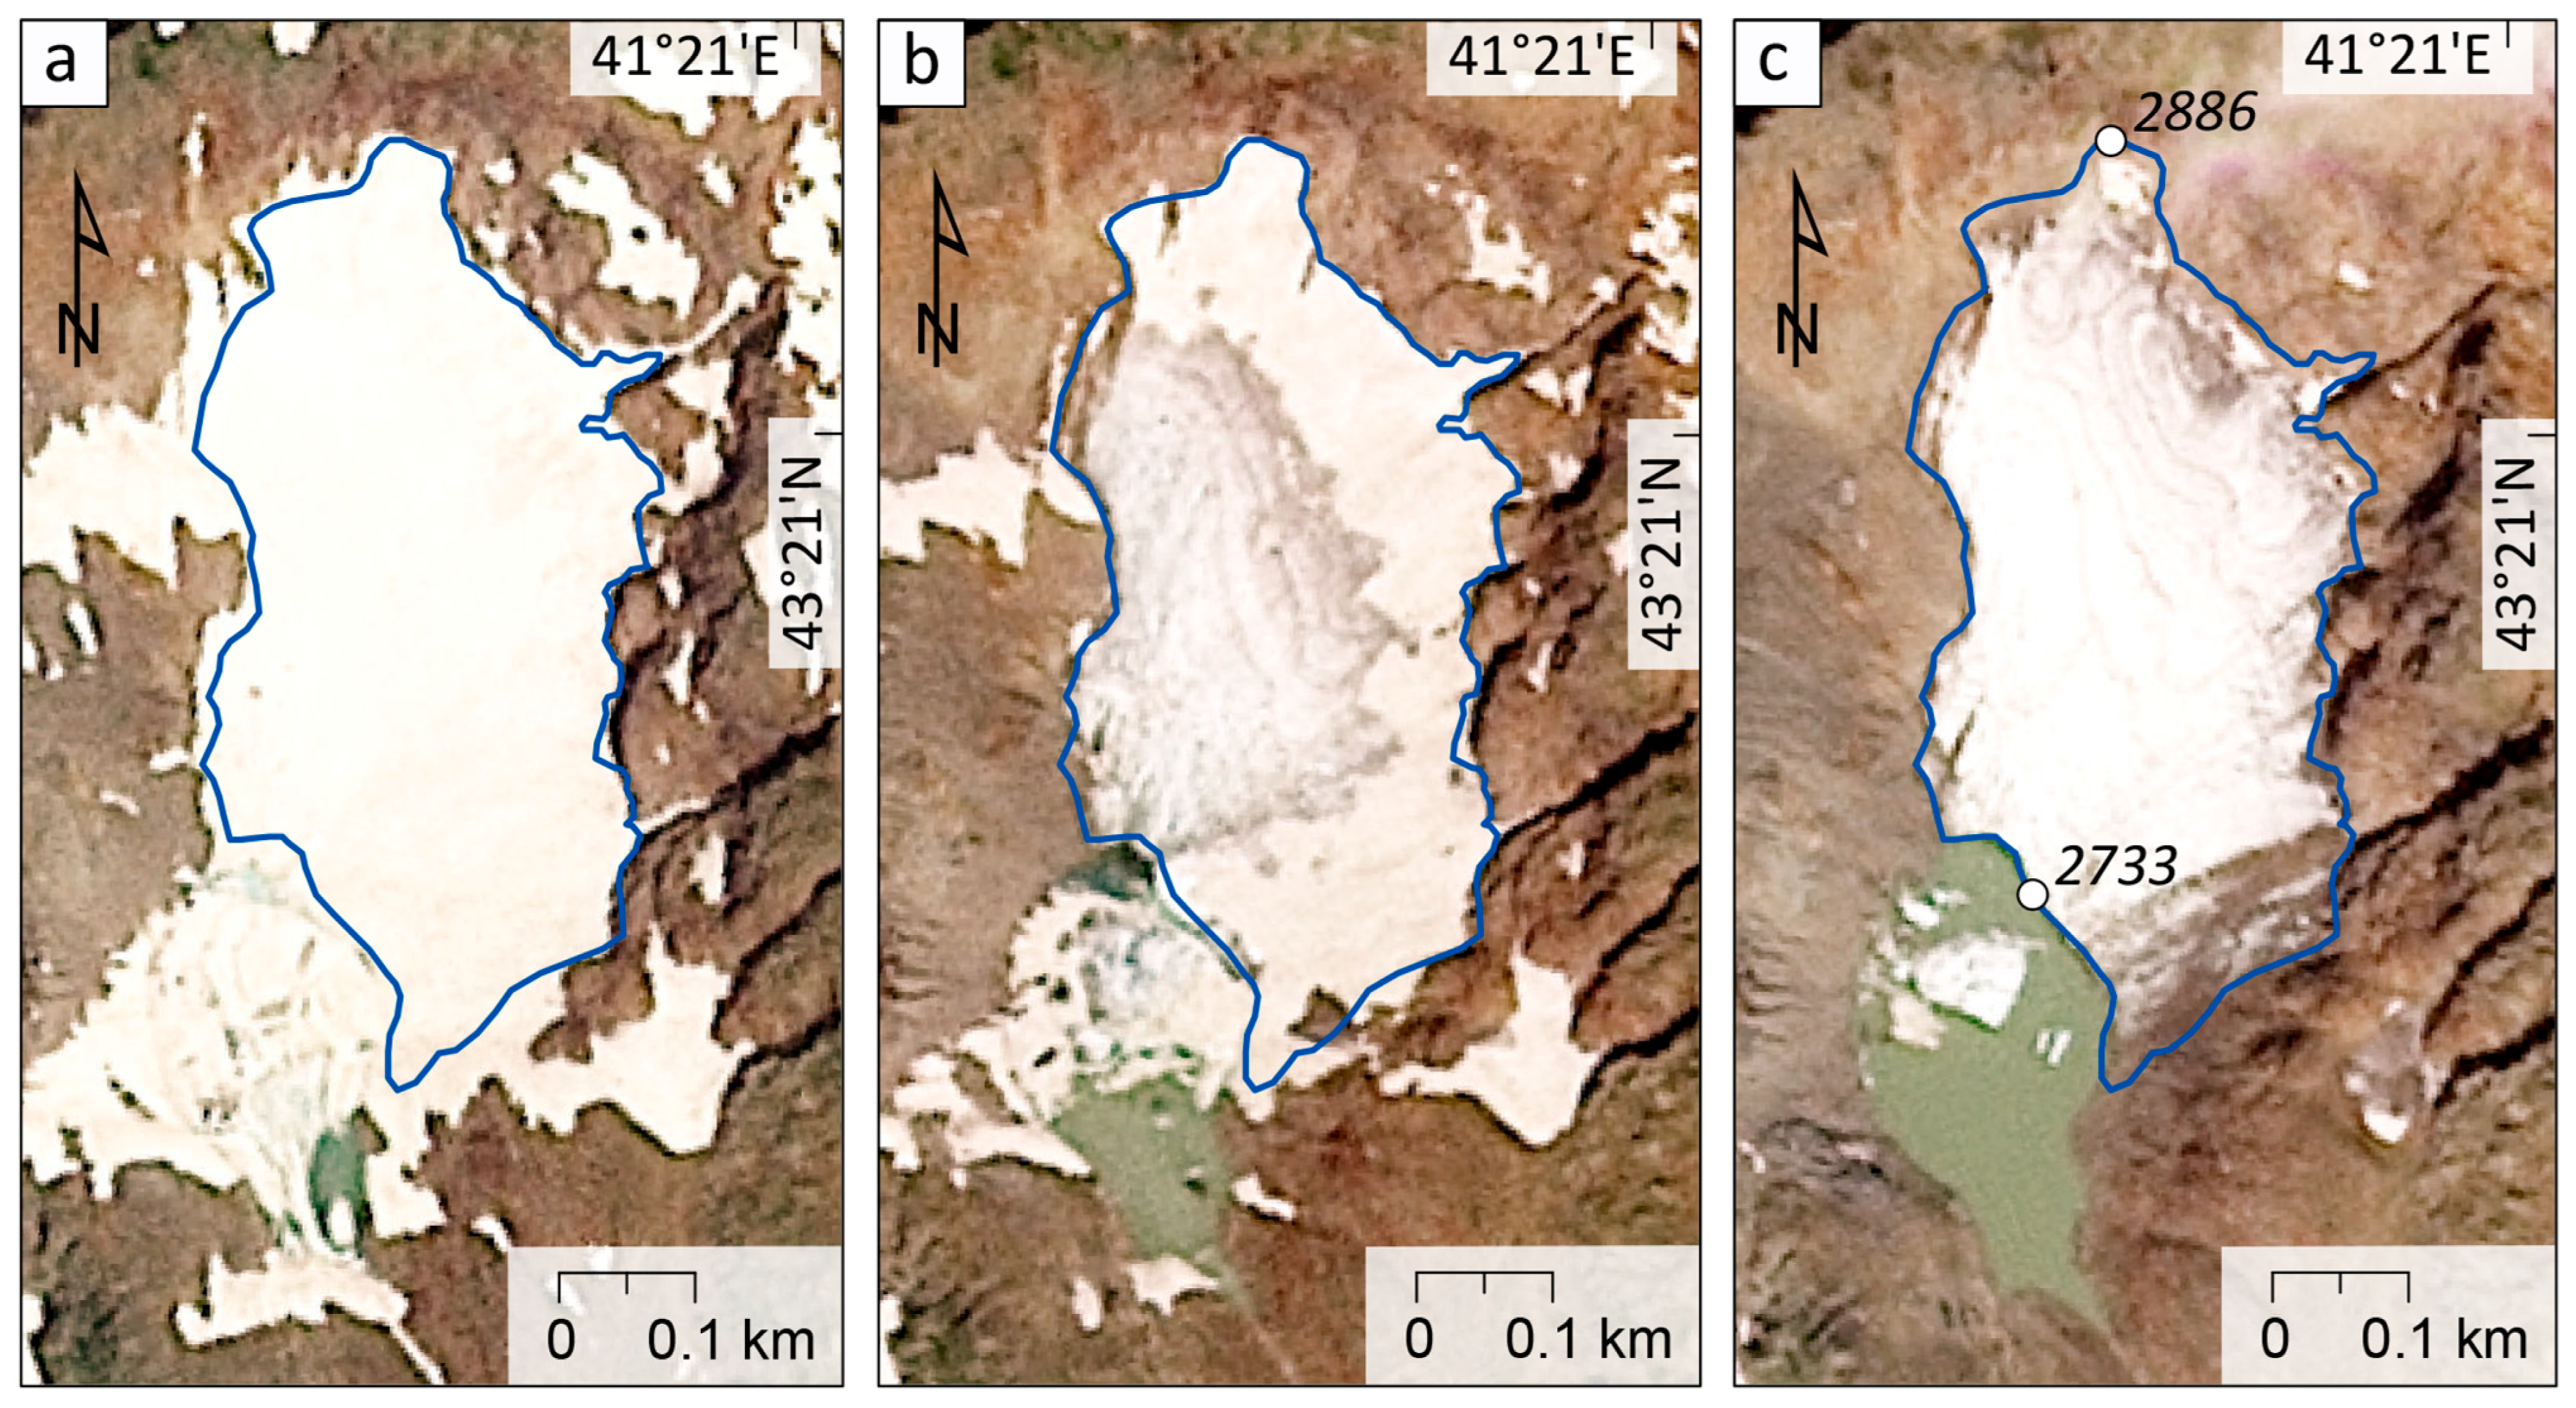
Rising summer air temperatures exert a strong control on glacier ablation processes across the Greater Caucasus. Higher air temperatures increase melt rates on glacier surfaces and promote earlier seasonal snowmelt, exposing glacier ice earlier in the summer season and prolonging the period of active melting. These effects are particularly pronounced for small glaciers (<1.0 km2), which increasingly fail to retain seasonal snow cover and frequently lose their firn zones (Figure 10a). In addition, intensified melt processes can extend into accumulation areas, facilitating the formation of supraglacial lakes (Figure 10b–d), a phenomenon that has historically been uncommon in the Greater Caucasus. The presence of such lakes enhances localized melt through increased absorption of solar radiation and thermal erosion. Enhanced ablation is also contributing to the structural disintegration of glaciers, particularly among medium-sized (1–5 km2) valley glaciers, where thinning and area losses lead to the detachment of glacier tongues from their accumulation areas (Figure 11). Furthermore, the development and expansion of proglacial lakes in front of retreating glacier termini (Figure 12) introduce additional feedback mechanisms that accelerate ice loss through thermal undercutting [66] and calving processes [67]. Collectively, these processes highlight the increasing sensitivity of Caucasus glaciers to atmospheric warming with implications for both resource security and hazards.
Winter precipitation represents the second key climatic control on glacier mass balance because it determines the amount of snow accumulation within glacier accumulation zones [68]. Figure 9b illustrates the variability of total winter (October–April) precipitation across the Greater Caucasus between 1960 and 2025. In contrast to the consistent warming observed in summer temperatures, winter precipitation exhibits strong interannual variability throughout the record. The long-term pattern is characterized by relatively stable conditions until the late 1980s, followed by a period of decline during the 1990s, and a slight decreasing tendency since the early 2000s (Figure 9b). Overall, no sustained increasing trend is evident that could compensate for enhanced ablation, indicating limited potential for increased snow accumulation under current climatic conditions. This combination of reduced snowfall and rising temperatures is accelerating glacier decrease across the region. Small glaciers are particularly vulnerable to these climatic changes because they possess limited accumulation areas and shorter response times [69,70]. As a result, many small cirque glaciers in this region are likely to disappear entirely under continued warming.
Larger valley glaciers in the Central Caucasus exhibit greater resilience to shifts in climate due to their higher elevation accumulation zones and larger ice volumes. Nevertheless, even these glaciers are now experiencing progressive shrinkage and terminus retreat. Continued climatic warming is therefore expected to drive further reductions in glacier area and volume across the Greater Caucasus during the coming decades.

5.4. Mapping Uncertainty and Methodological Considerations

Despite the use of high-resolution satellite imagery, several sources of uncertainty remain in glacier delineation. A key challenge is the identification of debris-covered ice, particularly along the lower ablation zones and lateral margins of large valley glaciers, where spectral contrast between ice and surrounding terrain is reduced. Nevertheless, the high spatial resolution of the imagery used in this study substantially improves the delineation of glacier boundaries, especially for small glaciers and debris-covered areas that were often poorly resolved in earlier inventories. The temporal evolution of debris-covered glacier surfaces was not analysed here, as it requires additional methodological approaches and falls outside the primary scope of this study; however, this aspect warrants dedicated investigation using recently developed techniques [24].
Seasonal snow cover represents an additional source of uncertainty. Residual snow patches may persist even during late summer, particularly in shaded cirques and at high elevations, potentially leading to misclassification of glacier boundaries. Although careful visual interpretation of high-resolution imagery was applied to minimise such effects, some degree of uncertainty in glacier delineation remains unavoidable.
Uncertainty in glacier area was quantified using a two-pixel (6 m) buffer approach, resulting in an estimated error of ±2.4%, which is lower than that reported for previous inventories based on medium-resolution Sentinel imagery (±3.4%; [34]). However, relative uncertainty increases for small glaciers (<1 km2), where delineation errors represent a larger fraction of the total area (up to ±4.3%).
Further improvements in glacier mapping could be achieved through the integration of high-resolution digital elevation models and multi-temporal satellite imagery. Such approaches would enhance the detection of subtle glacier changes and contribute to robust and consistent glacier inventories in this complex mountain environment, highlighting the importance of prioritizing acquisition of high-resolution terrain data in climate-sensitive but information-scarce regions.

6. Conclusions

This study presents a new high-resolution glacier inventory for the Greater Caucasus based on 3 m resolution Planet satellite imagery acquired during 2025. The inventory provides the most detailed regional dataset currently available for this mountain glacier system.
The population of the Caucasus’ glaciers is strongly concentrated in the central Caucasus, which accounts for more than three-quarters of the total glacier area. The Western Caucasus contains a large number of smaller glaciers, while the Eastern Caucasus hosts relatively limited glacierized terrain due to more continental climatic conditions.
Glacier distribution is strongly influenced by slope orientation, with approximately 71% of the total glacier area located on northern slopes. Elevation statistics reveal a clear eastward increase in glacier altitude, reflecting regional climatic gradients characterized by decreasing precipitation from west to east.
Size-class analysis indicates that the glacier population is numerically dominated by small glaciers (<1.0 km2), which are particularly vulnerable to ongoing and future climate change. In contrast, glaciers larger than 10 km2 constitute only a small fraction of the total glacier count but account for a substantial proportion of the total glacierized area (~19%). The largest glacier identified in the inventory is the Bezengi Glacier (35.8 km2).
The use of 3 m resolution Planet imagery allows significantly improved glacier delineation compared with previous inventories based on medium-resolution satellite data. This dataset therefore provides an important new benchmark for monitoring future glacier change in the Greater Caucasus and for supporting studies of glacier-climate interactions, regional hydrology, and cryospheric hazards.
The highest rates of regional glacier retreat on record occurred between 2014 and 2025, emphasizing the importance of maintaining regularly updated glacier inventories for this region. We therefore recommend that the Caucasus regional glacier inventories be updated at intervals of approximately five years, with more frequent monitoring of at-risk glaciers. Continued monitoring using high-resolution satellite observations will be essential for understanding the ongoing evolution of the Caucasus cryosphere and informing mitigation of and adaptation to accelerating climate and glacier change.

Author Contributions

Conceptualization, L.G.T.; methodology, L.G.T.; writing—original draft preparation, L.G.T.; writing—review and editing, L.G.T., G.A.N., A.N., T.E.K., R.M.K., C.C.C., M.E. and L.G.; visualization, L.G.T., G.A.N. and T.E.K. All authors have read and agreed to the published version of the manuscript.

Funding

This work was supported by the Shota Rustaveli National Science Foundation of Georgia (SRNSFG; grant no FR-23-4258) and International Education Centre of Georgia. The digitization of glacier boundaries of the North Caucasus was carried out within the framework of project No. FMWS-2024-0004 of the Institute of Geography of the RAS.

Data Availability Statement

The new glacier inventory will be made available through the Global Land Ice Measurements from Space (GLIMS) database and can serve as a valuable resource for future studies.

Acknowledgments

We gratefully acknowledge Planet Labs for providing access to high-resolution imagery. We also thank three anonymous reviewers for their insightful comments, which significantly improved the manuscript.

Conflicts of Interest

The authors declare no conflicts of interest. The funders had no role in the design of the study; in the collection, analyses, or interpretation of data; in the writing of the manuscript; or in the decision to publish the results.

References

  1. Hock, R.; Rasul, G.; Adler, C.; Cáceres, B.; Gruber, S.; Hirabayashi, Y.; Jackson, M.; Kääb, A.; Kang, S.; Kutuzov, S.; et al. High Mountain Areas. In IPCC Special Report on the Ocean and Cryosphere in a Changing Climate; Pörtner, H.O., Roberts, D.C., Masson-Delmotte, V., Zhai, P., Tignor, M., Poloczanska, E., Mintenbeck, K., Alegría, A., Nicolai, M., Okem, A., et al., Eds.; Cambridge University Press: Cambridge, UK, 2019. [Google Scholar]
  2. Dussaillant, I.; Hugonnet, R.; Huss, M.; Berthier, E.; Bannwart, J.; Paul, F.; Zemp, M. Annual mass change of the world’s glaciers from 1976 to 2024 by temporal downscaling of satellite data with in situ observations. Earth Syst. Sci. Data 2025, 17, 1977–2006. [Google Scholar] [CrossRef]
  3. Network, T.W.; Zemp, M.; Welty, E.; Nussbaumer, S.U.; Bannwart, J.; Gärtner-Roer, I.; Wells, A.; Ahlstrøm, A.P.; Anderson, B.; Andreassen, L.M.; et al. Global glacier mass change in 2025. Nat. Rev. Earth Environ. 2026, 7, 213–215. [Google Scholar] [CrossRef]
  4. Gardner, A.; Moholdt, J.; Cogley, G.; Wouters, B.; Arendt, A.; Wahr, J.; Berthier, E.; Hock, R.; Pfeffer, W.; Kaser, G.; et al. A reconciled estimate of glacier contributions to sea level rise: 2003 to 2009. Science 2013, 340, 852–857. [Google Scholar] [CrossRef]
  5. Radić, V.; Hock, R. Glaciers in the Earth’s hydrological cycle: Assessments of glacier mass and runoff changes on global and regional scales. Surv. Geophys. 2014, 35, 813–837. [Google Scholar] [CrossRef]
  6. Clason, C.; Rangecroft, S.; Owens, P.N.; Łokas, E.; Baccolo, G.; Selmes, N.; Beard, D.; Kitch, J.; Dextre, R.M.; Morera, S.; et al. Contribution of glaciers to water, energy and food security in mountain regions: Current perspectives and future priorities. Ann. Glaciol. 2023, 63, 73–78. [Google Scholar] [CrossRef]
  7. Ficetola, G.F.; Marta, S.; Guerrieri, A.; Cantera, I.; Bonin, A.; Cauvy-Fraunié, S.; Ambrosini, R.; Caccianiga, M.; Anthelme, F.; Azzoni, R.S.; et al. The development of terrestrial ecosystems emerging after glacier retreat. Nature 2024, 632, 336–342. [Google Scholar] [CrossRef]
  8. Al-Yaari, A.; Condom, T.; Junquas, C.; Rabatel, A.; Ramseyer, V.; Sicart, J.-E.; Masiokas, M.; Cauvy-Fraunié, S.; Dangles, O. Climate variability and glacier evolution at selected sites across the world: Past trends and future projections. Earth’s Future 2023, 11, e2023EF003618. [Google Scholar] [CrossRef]
  9. Pfeffer, W.T.; Arendt, A.A.; Bliss, A.; Bolch, T.; Cogley, J.G.; Gardner, A.S.; Hagen, J.; Hock, R.; Kaser, G.; Kienholz, C.; et al. The Randolph Glacier Inventory: A globally complete inventory of glaciers. J. Glaciol. 2014, 60, 537–552. [Google Scholar] [CrossRef]
  10. Andreassen, L.M.; Paul, F.; Kääb, A.; Hausberg, J.E. Landsat-derived glacier inventory for Jotunheimen, Norway, and deduced glacier changes since the 1930s. Cryosphere 2008, 2, 131–145. [Google Scholar] [CrossRef]
  11. Tennant, C.; Menounos, B.; Wheate, R.; Clague, J.J. Area change of glaciers in the Canadian Rocky Mountains, 1919 to 2006. Cryosphere 2012, 6, 1541–1552. [Google Scholar] [CrossRef]
  12. Tielidze, L.G. Glacier change over the last century, Caucasus Mountains, Georgia, observed from old topographical maps, Landsat and ASTER satellite imagery. Cryosphere 2016, 10, 713–725. [Google Scholar] [CrossRef]
  13. Paul, F.; Barrand, N.E.; Baumann, S.; Berthier, E.; Bolch, T.; Casey, K.; Frey, H.; Joshi, S.P.; Konovalov, V.; Le Bris, R.; et al. On the accuracy of glacier outlines derived from remote-sensing data. Ann. Glaciol. 2013, 54, 171–182. [Google Scholar] [CrossRef]
  14. Maslov, K.A.; Persello, C.; Schellenberger, T.; Stein, A. Globally scalable glacier mapping by deep learning matches expert delineation accuracy. Nat. Commun. 2025, 16, 43. [Google Scholar] [CrossRef]
  15. Li, Z.; Sun, W.; Zeng, Q. Measurements of Glacier Variation in the Tibetan Plateau Using Landsat Data. Remote Sens. Environ. 1998, 63, 258–264. [Google Scholar] [CrossRef]
  16. Raup, B.; Kieffer, H.; Hare, T.; Kargel, J. Generation of Data Acquisition Requests for the ASTER Satellite Instrument for Monitoring a Globally Distributed Target: Glaciers. IEEE Trans. Geosci. Remote Sens. 2000, 38, 1105–1112. [Google Scholar] [CrossRef]
  17. Kargel, J.; Abrams, M.J.; Bishop, M.P.; Bush, A.; Hamilton, G.; Jiskoot, H.; Kääb, A.; Kieffer, H.H.; Lee, E.M.; Paul, F.; et al. Multispectral Imaging Contributions to Global Land Ice Measurements from Space. Remote Sens. Environ. 2005, 99, 187–219. [Google Scholar] [CrossRef]
  18. Taylor, L.S.; Quincey, D.J.; Smith, M.W.; Baumhoer, C.A.; McMillan, M.; Mansell, D.T. Remote sensing of the mountain cryosphere: Current capabilities and future opportunities for research. Prog. Phys. Geogr. Earth Environ. 2021, 45, 931–964. [Google Scholar] [CrossRef]
  19. GLIMS; NSIDC. Global Land Ice Measurements from Space Glacier Database; International GLIMS community: Boulder, CO, USA; National Snow and Ice Data Center: Boulder, CO, USA, 2018. [Google Scholar] [CrossRef]
  20. Bolch, T.; Menounos, B.; Wheate, R. Landsat-based inventory of glaciers in western Canada, 1985–2005. Remote Sens. Environ. 2010, 114, 127–137. [Google Scholar] [CrossRef]
  21. Paul, F.; Rastner, P.; Azzoni, R.S.; Diolaiuti, G.; Fugazza, D.; Le Bris, R.; Nemec, J.; Rabatel, A.; Ramusovic, M.; Schwaizer, G.; et al. Glacier shrinkage in the Alps continues unabated as revealed by a new glacier inventory from Sentinel-2. Earth Syst. Sci. Data 2020, 12, 1805–1821. [Google Scholar] [CrossRef]
  22. Stokes, C.R.; Shahgedanova, M.; Evans, I.; Popovnin, V.V. Accelerated loss of alpine glaciers in the Kodar Mountains, south-eastern Siberia. Glob. Planet. Change 2013, 101, 82–96. [Google Scholar] [CrossRef]
  23. Tielidze, L.G.; Bolch, T.; Wheate, R.D.; Kutuzov, S.S.; Lavrentiev, I.I.; Zemp, M. Supra-glacial debris cover changes in the Greater Caucasus from 1986 to 2014. Cryosphere 2020, 14, 585–598. [Google Scholar] [CrossRef]
  24. Tielidze, L.G.; Iacob, G.; Holobâcă, I.H. Mapping of Supra-Glacial Debris Cover in the Greater Caucasus: A Semi-Automated Multi-Sensor Approach. Geosciences 2024, 14, 178. [Google Scholar] [CrossRef]
  25. AAP (Adaptation at Altitude Programme). Melting Heritage: Adapting to Changing Snow and Ice Cover in the South Caucasus; Regional Policy Brief; UN Environment Programme: Nairobi, Kenya; Mountain Research Initiative: Bern, Switzerland; Sustainable Caucasus: Tbilisi, Georgia, 2025. [Google Scholar] [CrossRef]
  26. Chernomorets, S.S.; Petrakov, D.A.; Aleynikov, A.A.; Bekkiev, M.Y.; Viskhadzhieva, K.S.; Dokukin, M.D.; Kalov, R.K.; Kidyaeva, V.M.; Krylenko, V.V.; Krylenko, I.V.; et al. The Outburst of Bashkara Glacier Lake (Central Caucasus, Russia) on 1 September 2017. Kriosf. Zemli 2018, XXII, 61–70. [Google Scholar]
  27. Evans, S.G.; Tutubalina, O.V.; Drobyshev, V.N.; Chernomorets, S.S.; McDougall, S.; Petrakov, D.A.; Hungr, O. Catastrophic detachment and high-velocity long-runout flow of Kolka Glacier, Caucasus Mountains, Russia in 2002. Geomorphology 2009, 105, 314–321. [Google Scholar] [CrossRef]
  28. Tielidze, L.G.; Kumladze, R.M.; Wheate, R.D.; Gamkrelidze, M. The Devdoraki Glacier Catastrophes, Georgian Caucasus. Hung. Geogr. Bull. 2019, 68, 21–35. [Google Scholar] [CrossRef]
  29. Tielidze, L.G.; Charton, J.; Jomelli, V.; Solomina, O.N. Glacial geomorphology of the Notsarula and Chanchakhi river valleys, Georgian Caucasus. J. Maps 2023, 19, 2261490. [Google Scholar] [CrossRef]
  30. Gidrometeoizdat. Catalog of Glaciers of the USSR: Katalog Lednitov USSR, Vol. 8–9; Gidrometeoizdat: Leningrad, Russia, 1967–1978. [Google Scholar]
  31. Stokes, C.R.; Gurney, S.D.; Popovnin, V.; Shahgedanova, M. Late-20th-century changes in glacier extent in the Caucasus Mountains, Russia/Georgia. J. Glaciol. 2006, 52, 99–109. [Google Scholar] [CrossRef]
  32. Shahgedanova, M.; Nosenko, G.; Kutuzov, S.; Rototaeva, O.; Khromova, T. Deglaciation of the Caucasus Mountains, Russia/Georgia, in the 21st century observed with ASTER satellite imagery and aerial photography. Cryosphere 2014, 8, 2367–2379. [Google Scholar] [CrossRef]
  33. Tielidze, L.G.; Wheate, R.D. The Greater Caucasus Glacier Inventory (Russia, Georgia and Azerbaijan). Cryosphere 2018, 12, 81–94. [Google Scholar] [CrossRef]
  34. Tielidze, L.G.; Nosenko, G.A.; Khromova, T.E.; Paul, F. Strong acceleration of glacier area loss in the Greater Caucasus between 2000 and 2020. Cryosphere 2022, 16, 489–504. [Google Scholar] [CrossRef]
  35. Zabarinskaya, L.; Rodnikov, A.; Sergeeva, N.; Safonova, I. The Caucasian-Arabian segment of the Alpine-Himalayan collisional belt: Geology, volcanism and neotectonics. Geosci. Front. 2015, 6, 513–522. [Google Scholar] [CrossRef]
  36. Volodicheva, N. The Caucasus. In The Physical Geography of Northern Eurasia; Shahgedanova, M., Ed.; Oxford University Press: Oxford, UK, 2002; pp. 350–376. [Google Scholar]
  37. Elizbarashvili, M.; Beglarashvili, N.; Pipia, M.; Elizbarashvili, E.; Chikhradze, N. Seasonal Temperature and Precipitation Patterns in Caucasus Landscapes. Atmosphere 2025, 16, 889. [Google Scholar] [CrossRef]
  38. Kutuzov, S.S.; Mikhalenko, V.N.; Grachev, A.M.; Ginot, P.; Lavrentiev, I.I.; Kozachek, A.V.; Krupskaya, V.V.; Ekaykin, A.A.; Tielidze, L.G.; Toropov, P.A. First geophysical and shallow ice core investigation of the Kazbek plateau glacier, Caucasus Mountains, Environ. Earth Sci. 2016, 75, 1488. [Google Scholar] [CrossRef]
  39. Kozachek, A.; Mikhalenko, V.; Masson-Delmotte, V.; Ekaykin, A.; Ginot, P.; Kutuzov, S.; Legrand, M.; Lipenkov, V.; Preunkert, S. Large-scale drivers of Caucasus climate variability in meteorological records and Mt El’brus ice cores. Clim. Past 2017, 13, 473–489. [Google Scholar] [CrossRef]
  40. Planet Labs PBC. Planetscope Product Specifications. 2023. Available online: https://assets.planet.com/docs/Planet_Combined_Imagery_Product_Specs_letter_screen.pdf (accessed on 13 October 2025).
  41. Tarca, G.; Hoelzle, M.; Guglielmin, M. Using PlanetScope images to investigate the evolution of small glaciers in the Alps. Remote Sens. Appl. Soc. Environ. 2023, 32, 101013. [Google Scholar] [CrossRef]
  42. Paul, F. When has a glacier disappeared? Ann. Glaciol. 2026, 1–15. [Google Scholar] [CrossRef]
  43. Tielidze, L.G.; Nadaraia, A.; Kumladze, R.M.; Cook, S.J.; Lobjanidze, M.; Liu, Q.; Megrelidze, I.; Mackintosh, A.N.; Imnadze, G. Post-Little Ice Age Shrinkage of the Tsaneri–Nageba Glacier System and Recent Proglacial Lake Evolution in the Georgian Caucasus. Water 2025, 17, 3209. [Google Scholar] [CrossRef]
  44. Takaku, J.; Tadono, T.; Doutsu, M.; Ohgushi, F.; Kai, H. Updates of ‘AW3D30’ALOS Global Digital Surface Model with Other Open Access Datasets. Int. Arch. Photogramm. Remote Sens. Spat. Inf. Sci. 2020, 43, 183–189. [Google Scholar] [CrossRef]
  45. Gjermundsen, E.F.; Mathieu, R.; Kääb, A.; Chinn, T.; Fitzharris, B.; Hagen, J.O. Assessment of multispectral glacier mapping methods and derivation of glacier area changes, 1978–2002, in the central Southern Alps, New Zealand, from ASTER satellite data, field survey and existing inventory data. J. Glaciol. 2011, 57, 667–683. [Google Scholar] [CrossRef]
  46. Smith, T.; Bookhagen, B.; Cannon, F. Improving semi-automated glacier mapping with a multi-method approach: Applications in central Asia. Cryosphere 2015, 9, 1747–1759. [Google Scholar] [CrossRef]
  47. Florath, J.; Keller, S.; Abarca-del-Rio, R.; Hinz, S.; Staub, G.; Weinmann, M. Glacier Monitoring Based on Multi-Spectral and Multi-Temporal Satellite Data: A Case Study for Classification with Respect to Different Snow and Ice Types. Remote Sens. 2022, 14, 845. [Google Scholar] [CrossRef]
  48. Zhang, B.; Liu, G.; Wang, X.; Fu, Y.; Liu, Q.; Yu, B.; Zhang, R.; Li, Z. Semi-Automated Mapping of Complex-Terrain Mountain Glaciers by Integrating L-Band SAR Amplitude and Interferometric Coherence. Remote Sens. 2022, 14, 1993. [Google Scholar] [CrossRef]
  49. Fischer, M.; Huss, M.; Barboux, C.; Hoelzle, M. The new Swiss Glacier Inventory SGI2010: Relevance of using high-resolution source data in areas dominated by very small glaciers. Arct. Antarct. Alp. Res. 2014, 46, 933–945. [Google Scholar] [CrossRef]
  50. Leigh, J.R.; Stokes, C.R.; Carr, R.J.; Evans, I.S.; Andreassen, L.M.; Evans, D.J.A. Identifying and mapping very small (<0.5 km2) mountain glaciers on coarse to high-resolution imagery. J. Glaciol. 2019, 65, 873–888. [Google Scholar] [CrossRef]
  51. Granshaw, F.D.; Fountain, A.G. Glacier change (1958–1998) in the North Cascades National Park Complex, Washington, USA. J. Glaciol. 2006, 52, 251–256. [Google Scholar] [CrossRef]
  52. Hersbach, H.; Bell, B.; Berrisford, P.; Hirahara, S.; Horányi, A.; Muñoz-Sabater, J.; Nicolas, J.; Peubey, C.; Radu, R.; Schepers, D.; et al. The ERA5 global reanalysis. Q. J. R. Meteorol. Soc. 2020, 146, 1999–2049. [Google Scholar] [CrossRef]
  53. Soci, C.; Hersbach, H.; Simmons, A.; Poli, P.; Bell, B.; Berrisford, P.; Horányi, A.; Muñoz-Sabater, J.; Nicolas, J.; Radu, R.; et al. The ERA5 global reanalysis from 1940 to 2022. Q. J. R. Meteorol. Soc. 2024, 150, 4014–4048. [Google Scholar] [CrossRef]
  54. Oerlemans, J. Extracting a Climate Signal from 169 Glacier Records. Science 2005, 308, 675–677. [Google Scholar] [CrossRef]
  55. Toropov, P.A.; Aleshina, M.A.; Grachev, A.M. Large-scale climatic factors driving recession in the Greater Caucasus, 20th–21st century. Int. J. Climatol. 2019, 39, 4703–4720. [Google Scholar] [CrossRef]
  56. Gobejishvili, R.; Lomidze, N.; Tielidze, L. Late Pleistocene (Wurmian) glaciations of the Caucasus. In Quaternary Glaciations: Extent and Chronology; Ehlers, J., Gibbard, P.L., Hughes, P.D., Eds.; Elsevier: Amsterdam, The Netherlands, 2011; pp. 141–147. [Google Scholar] [CrossRef]
  57. Lambrecht, A.; Mayer, C.; Hagg, W.; Popovnin, V.; Rezepkin, A.; Lomidze, N.; Svanadze, D. A comparison of glacier melt on debris-covered glaciers in the northern and southern Caucasus. Cryosphere 2011, 5, 525–538. [Google Scholar] [CrossRef]
  58. Notarnicola, C. Hotspots of snow cover changes in global mountain regions over 2000–2018. Remote Sens. Environ. 2020, 243, 111781. [Google Scholar] [CrossRef]
  59. Olson, M.; Rupper, S. Impacts of topographic shading on direct solar radiation for valley glaciers in complex topography. Cryosphere 2019, 13, 29–40. [Google Scholar] [CrossRef]
  60. Podozerskiy, K.I. Ledniki Kavkazskogo Khrebta (Glaciers of the Caucasus Range): Zapiski Kavkazskogo otdela Russkogo Geograficheskogo Obshchestva; Publ. Zap.; KORGO.: Tiflis, Georgia, 1911; Volume 29, 200p. (In Russian) [Google Scholar]
  61. Raup, B.H.; Andreassen, L.M.; Boyer, D.; Howe, C.; Pelto, M.; Rabatel, A. Tracking extinct glaciers in GLIMS. Ann. Glaciol. 2025, 66, e35. [Google Scholar] [CrossRef]
  62. Thongley, T.; Tielidze, L.G.; Yang, W.; Gunn, A.; Mackintosh, A.N. Accelerated Glacier Area Loss and Extinction of Small Glaciers in the Bhutanese Himalaya over the Past Five Decades. Remote Sens. 2026, 18, 323. [Google Scholar] [CrossRef]
  63. Wang, G.-Y.; Ke, C.-Q.; Fan, Y.-B.; Shen, X.-Y.; Cai, Y.; Nourani, V. Accelerated glacier mass loss in the mid-latitude Eurasia from 2019 to 2022 revealed by ICESat-2. Adv. Clim. Change Res. 2024, 15, 815–829. [Google Scholar] [CrossRef]
  64. Cogley, J.G.; Hock, R.; Rasmussen, B.; Arendt, A.; Bauder, A.; Braithwaite, R.J.; Jansson, P.; Kaser, G.; Moller, M.; Nicholson, L.; et al. Glossary of Glacier Mass Balance and Related Terms; IHP-VII Technical Documents in Hydrology No. 86, IACS Contribution No. 2; UNESCO-IHP: Paris, UK, 2011; 124p. [Google Scholar]
  65. Gharehchahi, S.; Ballinger, T.J.; Jensen, J.L.R.; Bhardwaj, A.; Sam, L.; Weaver, R.C.; Butler, D.R. Local- and Regional-Scale Forcing of Glacier Mass Balance Changes in the Swiss Alps. Remote Sens. 2021, 13, 1949. [Google Scholar] [CrossRef]
  66. Truffer, M.; Motyka, R.J. Where glaciers meet water: Subaqueous melt and its relevance to glaciers in various settings. Rev. Geophys. 2016, 54, 220–239. [Google Scholar] [CrossRef]
  67. Benn, D.I.; Warren, C.R.; Mottram, R.H. Calving processes and the dynamics of calving glaciers. Earth-Sci. Rev. 2007, 82, 143–179. [Google Scholar] [CrossRef]
  68. Benn, D.I.; Evans, D.J.A. Glaciers and Glaciation, 2nd ed.; Hodder Education: London, UK, 2010; p. 802. [Google Scholar] [CrossRef]
  69. Gachev, E.M. Response of Very Small Glaciers to Climate Variations and Change: Examples from the Pirin Mountains, Bulgaria. Atmosphere 2022, 13, 859. [Google Scholar] [CrossRef]
  70. Tielidze, L.G.; Mackintosh, A.N.; Gavashelishvili, A.; Gadrani, L.; Nadaraia, A.; Elashvili, M. Post-Little Ice Age Equilibrium-Line Altitude and Temperature Changes in the Greater Caucasus Based on Small Glaciers. Remote Sens. 2025, 17, 1486. [Google Scholar] [CrossRef]
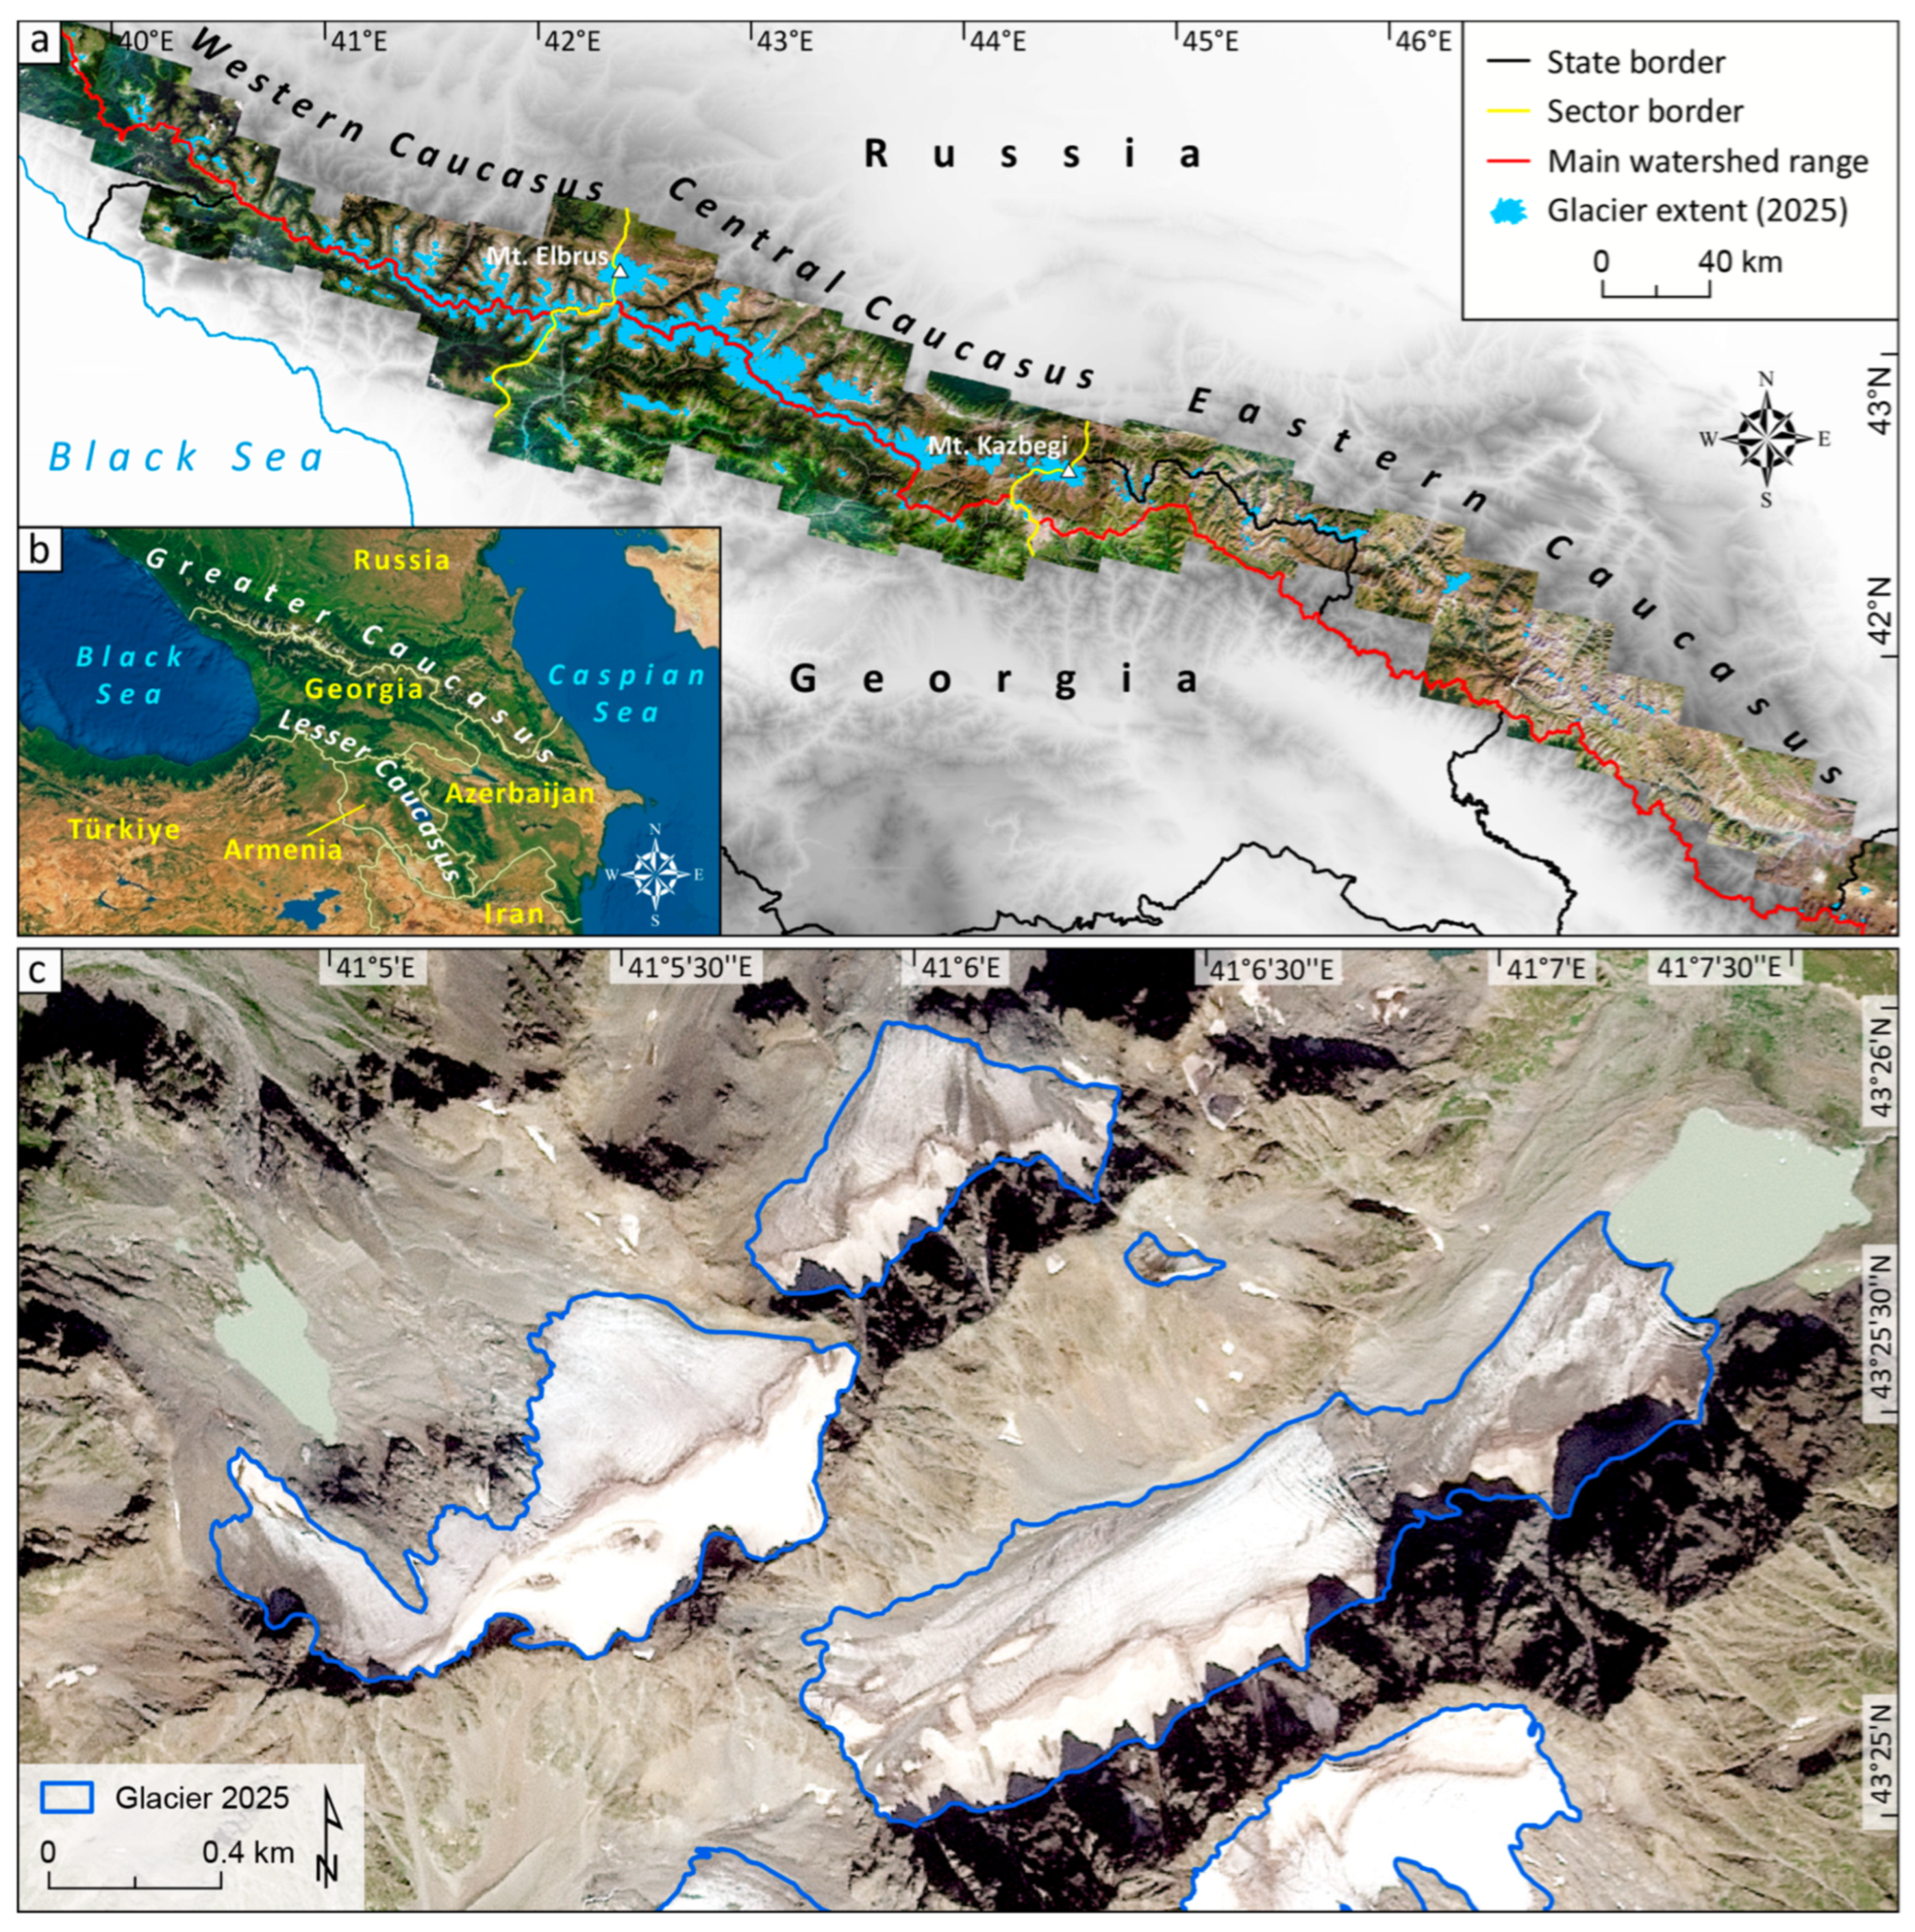
Figure 1. (a) Location of the Greater Caucasus showing the 2025 glacier distribution and coverage of PlanetScope satellite imagery used for the 2025 glacier inventory. (b) Regional location of the Greater Caucasus. (c) An example of glacier mapping within this inventory.
Remotesensing 18 01441 g001
Figure 2. (a) An example of debris-free glacier mapping within this inventory along with a buffer size of 6 m (24/08/2025). (b,c) Examples of debris-covered glacier mapping within this inventory along with a buffer size of 12 m (29/08/2025 and 24/08/2025).
Remotesensing 18 01441 g002
Figure 3. Mean glacier size by regional sector and slope orientation across the Greater Caucasus in 2025.
Remotesensing 18 01441 g003
Figure 4. Spatial distribution of mean glacier elevations across the Greater Caucasus in 2025, represented using a colour-coded classification.
Remotesensing 18 01441 g004
Figure 5. (a) Spatial distribution of glacier size classes across the Greater Caucasus in 2025, represented using a colour-coded classification. (b) Relationship between glacier size class and mean elevation.
Remotesensing 18 01441 g005
Figure 6. (a) Large (>10 km2) glaciers of the Greater Caucasus, derived from imagery acquired on 19 August 2025. (b) Inset map showing the location of the selected area within the broader regional context.
Remotesensing 18 01441 g006
Figure 7. (a) Glacier area and count change for the Greater Caucasus from the 1890s to 2025. (b) Rates of glacier area decline for the Greater Caucasus for different time periods since the 1890s.
Remotesensing 18 01441 g007
Figure 8. (a) Spatial distribution of glaciers that disappeared between 1960 and 2025 across the Greater Caucasus. (b) Example of a glacier inventory based on 1960s topographic maps. (c) The same area in a 2025 PlanetScope image, highlighting complete glacier loss by 2025.
Remotesensing 18 01441 g008
Figure 9. (a) Mean annual summer (May–September) temperature and temperature anomalies for the Greater Caucasus between 1960 and 2025. Red corresponds to warm periods compared to the 1960–2025 average, while blue corresponds to cooling. (b) Total winter (October–April) precipitation for the Greater Caucasus between 1960 and 2025. The ERA5 (42N–43N; 42E–47E) was used as a source for both temperature and precipitation (https://climatereanalyzer.org/research_tools/monthly_tseries/; accessed on 26 March 2026).
Remotesensing 18 01441 g009
Figure 10. Examples of enhanced surface melt processes in the Greater Caucasus: (a) a small glacier lacking persistent firn cover, illustrating loss of the accumulation zone (19/08/25); (bd) development of a supraglacial lake between 29/07/25 and 30/08/25 on a glacier accumulation area, indicating intensified ablation and meltwater ponding in the upper glacier.
Remotesensing 18 01441 g010
Figure 11. An example of glacier disintegration in the Greater Caucasus: (a,b)—separation of a valley glacier tongue from its accumulation area at Zopkhito Glacier between 27/08/2020 and 19/08/2025 driven by sustained thinning and retreat, resulting in fragmentation of the formerly continuous glacier system. (c)—Oblique image of Zopkhito Glacier clearly showing the divided parts of the glacier (22/09/2024). White circles in panel (b) indicate maximum, minimum and detachment elevations (m a.s.l.) of the glacier.
Remotesensing 18 01441 g011
Figure 12. Formation of a proglacial lake at the terminus of a retreating glacier in the Greater Caucasus between 30/07 (a), 13/08 (b), and 16/09/2025 (c). Proglacial lakes enhance glacier area and mass loss through thermal erosion, ice–water interaction, and potential calving processes. White circles in panel ‘c’ indicate the maximum elevation of the glacier and surface elevation (m a.s.l.) of the proglacial lake (or minimum elevation of the glacier).
Remotesensing 18 01441 g012
Table 1. Glacier area and count according to Caucasus countries in 2025.
CountryCountArea (km2)Uncertainty (±) with 6 m Buffer
(km2)%
Russia1454650.0715.12.32
Georgia873313.467.692.45
Azerbaijan140.510.047.84
Total2341964.0422.842.36
Table 2. Glacier area and count according to Caucasus sectors and slopes in 2025.
SubregionCountArea (km2)Uncertainty (±) with 6 m Buffer
(km2)%
Western sector875168.365.463.24
Central sector1216730.1915.462.11
Eastern sector25065.491.922.93
Northern slopes1570687.6515.962.32
Southern slopes771276.396.882.49
Table 3. Average minimum, mean, and maximum glacier elevations (m a.s.l.) by regional sector and slope orientation across the Greater Caucasus in 2025.
Average Elevation (m a.s.l.)SectorSlope OrientationEntire Region
WesternCentralEasternNorthernSouthern
Maximum316537403825361533803535
Mean304033303670342532303360
Minimum293029603515326030903205
Table 4. List of large glaciers (>10 km2) in the Greater Caucasus for 2025.
Glacier NameAreaUncertainty (±)Country
Bezengi35.840.48Russia
Karaugom23.220.24Russia
Dykh-Tau (Western)15.090.25Russia
Azay (Bolshoy)15.020.14Russia
Agashtan13.560.14Russia
Lekhziri (Eastern)13.440.18Georgia
Mizhirgi12.050.23Russia
Ulluchiran12.000.09Russia
Tsaneri (Southern)11.750.15Georgia
Dykh-Tau (Eastern)11.080.14Russia
Tseya10.670.16Russia
Tsaneri (Northern)10.580.12Georgia
Disclaimer/Publisher’s Note: The statements, opinions and data contained in all publications are solely those of the individual author(s) and contributor(s) and not of MDPI and/or the editor(s). MDPI and/or the editor(s) disclaim responsibility for any injury to people or property resulting from any ideas, methods, instructions or products referred to in the content.