Article

Spatiotemporal Coupling and Driving Mechanisms Between Ecological Quality and Vegetation Carbon Sink–Source Dynamics on the Loess Plateau, China

1
School of Public Administration, Shanxi University of Finance and Economics, Taiyuan 030006, China
2
School of Geographical Sciences, Shanxi Normal University, Taiyuan 030031, China
*
Author to whom correspondence should be addressed.
Remote Sens. 2026, 18(9), 1412; https://doi.org/10.3390/rs18091412
Submission received: 26 February 2026 / Revised: 16 April 2026 / Accepted: 29 April 2026 / Published: 2 May 2026
(This article belongs to the Special Issue Remote Sensing in Applied Ecology (Second Edition))

Highlights

What are the main findings?
  • Ecological quality on the Loess Plateau improved significantly from 2002 to 2024, characterized by a coupled trend of reduced surface dryness, increased wetness, and enhanced vegetation restoration.
  • Vegetation carbon storage capacity strengthened markedly, with the carbon sink area expanding by over 20% and key productivity indices (GPP, NPP, NEP) showing sustained growth.
What are the implications of the main findings?
  • The findings confirm the critical role of ecological restoration projects, demonstrating their effectiveness in driving the ecosystem’s transition from vulnerable to recovering, especially in key soil loss areas.
  • This study provides a scientific basis for assessing regional carbon balance and supporting targeted ecological protection strategies in the Yellow River Basin.

Abstract

Against the backdrop of global climate change and the “carbon neutrality” target, the ecological quality improvement of the Loess Plateau—a key region for ecological restoration in China—and its impact on vegetation carbon sources hold significant importance for regional carbon balance and ecological security. Based on MODIS and meteorological reanalysis data from 2002 to 2024, this study constructed the Remote Sensing Ecological Index (RSEI). Combined with a carbon source/sink model, it systematically assessed the spatiotemporal coupling evolution characteristics of ecological environment quality and vegetation carbon storage capacity in the Loess Plateau, and explored the synergistic driving mechanisms of major hydrothermal and surface factors. The results indicate the following: (1) From 2002 to 2024, the ecological environment of the Loess Plateau improved significantly, with the RSEI rising from moderate to good. This improvement was accompanied by a marked decrease in surface dryness, an increase in surface wetness, and notable growth in vegetation cover, revealing a positive coupling relationship characterized by “reduced surface dryness—increased surface wetness—enhanced vegetation restoration.” (2) Regional vegetation carbon storage capacity strengthened markedly. Gross Primary Productivity (GPP), Net Primary Productivity (NPP), and Net Ecosystem Productivity (NEP) all showed significant increasing trends, and the proportion of area classified as carbon sink increased substantially. (3) Spatially, carbon sink distribution exhibited a pattern of “higher in the southeast, lower in the northwest.” Sub-regions A and D were identified as core areas with higher ecological quality and carbon sink capacity, whereas sub-regions B and C were more ecologically fragile and served as primary carbon source areas. (4) The implementation of soil and water conservation measures on the Loess Plateau has effectively enhanced regional carbon storage capacity. Vegetation restoration, improved water conditions, and reduced surface dryness have jointly driven the transition of the Loess Plateau ecosystem from a “vulnerable type” to a “recovering type”, while ecological restoration projects have played a certain role in enhancing the carbon sink. This study provides a theoretical basis and scientific–technological support for ecological protection and high-quality development in the Yellow River Basin.

1. Introduction

Ecological quality serves as the cornerstone for maintaining regional sustainable development and ecological security. Its dynamic monitoring and the analysis of its driving mechanisms have become focal issues in global change research [1,2]. This issue is particularly urgent in arid and semi-arid regions, where ecosystem structures are simple, resistance to disturbance is weak, and sensitivity to climate change and human activities is high. Against the backdrop of global warming, the intensification of the water cycle and the expansion of arid zones are leading to the deterioration of ecological conditions, posing a serious threat to regional and even global sustainable development [3]. On the other hand, over recent decades, China has implemented a series of ecological restoration projects, such as the Grain-for-Green Program and the Three-North Shelter Forest Program [4]. These initiatives have effectively mitigated the process of ecological degradation caused by climate change and human activities, resulting in significant changes in regional ecological quality and vegetation productivity. Amidst the dual context of intensifying global climate change and the advancement of the “carbon neutrality” target, the carbon cycle of terrestrial ecosystems has become a core topic linking ecology, climatology, and sustainable development [5]. As a crucial ecological security barrier in China and a key region for large-scale ecological restoration, the carbon source/sink pattern of the Loess Plateau exerts an important influence on the carbon balance of the nation and even the Northern Hemisphere [6]. When the increase in vegetation and soil carbon stocks brought about by ecological restoration exceeds carbon emissions from erosion and microbial decomposition, the ecosystem acts as a carbon sink. Conversely, under conditions of vegetation degradation or the impact of extreme climate events, the massive release of soil organic carbon may reverse it into a carbon source [7,8]. Recent studies over the past three years indicate that, under the influence of large-scale vegetation restoration and ecological projects, significant changes have occurred in the regional ecological quality and vegetation productivity of the Loess Plateau, exerting a complex yet pronounced effect on the enhancement and stability of carbon sink capacity.
The development of remote sensing technology has provided powerful support for the dynamic and comprehensive monitoring of ecological quality at large scales [2,9]. Early research often relied on single indicators like the Normalized Difference Vegetation Index (NDVI) to assess ecological status, which struggled to fully reflect the complexity of ecosystems. To overcome this limitation, the Remote Sensing Ecological Index (RSEI)—a comprehensive ecological assessment indicator integrating greenness (NDVI), wetness (WET), heat (LST), and dryness (NDBSI)—can objectively reflect the overall condition of regional ecosystems [9,10,11]. This integrated index has been widely applied in ecological quality research across different spatial scales [12]. Concurrently, the emergence of the Google Earth Engine (GEE) cloud platform has greatly enhanced the capacity to process long-term time series and large-scale remote sensing data, making long-term ecological monitoring based on the RSEI more efficient and feasible [13].
As the core implementation area for major ecological projects like the “Grain-for-Green Program,” the Loess Plateau has, after decades of ecological restoration, seen its ecosystem transform from a potential carbon source into a continuously growing carbon sink [14]. The comprehensive improvement in ecological quality forms an important foundation for the enhancement in carbon sink capacity. Currently, academic methods for studying ecosystem carbon storage primarily include field surveys, remote sensing inversion, and model simulations [15,16]. Among these, Net Ecosystem Productivity (NEP), as a key indicator characterizing the net carbon exchange between the atmosphere and terrestrial ecosystems, is widely used for assessing regional carbon source/sink intensity [17]. Gross Primary Productivity (GPP) and Net Primary Productivity (NPP), together with NEP, constitute the core indicator system for characterizing ecosystem productivity, directly reflecting the carbon sequestration effectiveness of ecological projects [18,19,20]. The RSEI and its component indicators (NDVI, FVC, WET, NDBSI, LST), by analyzing key ecological elements such as vegetation cover, water conditions, surface dryness, and thermal environment, provide an important perspective for studying the driving mechanisms of carbon sinks [3]. Several scholars have already used various indicators to reveal the distribution characteristics of carbon sources and sinks in different regions. For example, Zhang et al. estimated NPP and quantified NEP in arid northwestern China using the CASA model, combining vegetation and climate indicators to reveal the spatiotemporal characteristics of carbon source/sink distribution. Feng et al. utilized the NEP indicator to analyze carbon source–sink dynamics in Guizhou Province, China, confirming the research value of combining ecological indicators with carbon cycle indicators [21]. Focusing on the Loess Plateau, the evolution of carbon source/sink patterns and their response to land use change have been researched through the CASA model and other methods [22,23]. Many studies have confirmed significant improvements in both vegetation coverage (greenness) and carbon sink function in this region. However, some research has found that although vegetation greenness in the Loess Plateau generally shows an improving trend, its comprehensive ecological quality has experienced slight degradation due to increased wetness and decreased heat and dryness. This suggests that vegetation ‘greening’ does not entirely equate to an improvement in comprehensive ecosystem quality, and there may be a more complex coupling relationship between the enhancement of carbon sink function and the improvement of ecological quality.
Building upon this, the present study comprehensively utilizes MODIS remote sensing products and meteorological reanalysis data, targeting the Loess Plateau from 2002 to 2024. It focuses on addressing the following scientific questions: (1) How do the spatiotemporal patterns of RSEI and its component indicators (NDVI, WET, NDBSI, LST) evolve from 2002 to 2024, and what is their synergistic relationship with NEP-based carbon sink dynamics? (2) What are the relative contributions of vegetation restoration, hydrothermal conditions, and surface dryness in driving the observed improvements in ecological quality and carbon sink capacity? (3) How do natural factors (topography, climate) and human activities (land use intensity, ecological projects) interact to shape the spatial heterogeneity of carbon sources/sinks across different sub-regions of the Loess Plateau? By quantitatively analyzing the interactive relationship between carbon sink processes and ecological quality, this study aims to deepen the scientific understanding of ecosystem evolution laws/patterns. While previous studies have separately investigated ecological quality or carbon sink dynamics on the Loess Plateau, few have systematically examined their spatiotemporal coupling over a continuous 23-year period with annual resolution. Moreover, the explicit synergy among surface dryness, wetness, and vegetation restoration as a joint driver of carbon sink enhancement has not been quantitatively characterized. This study provides four key innovations: (1) a long-term (2002–2024) coupled assessment of RSEI and NEP at an annual scale, enabling detection of interannual variability and trend shifts; (2) the first quantification of the “reduced NDBSI—increased WET—enhanced NDVI/FVC” synergy and its direct contribution to carbon sink expansion; (3) a sub-regional comparative framework (A–D) that distinguishes core sink areas from fragile zones, offering spatially explicit policy implications. These innovations advance the understanding of ecosystem recovery mechanisms in water-limited regions under large-scale restoration programs.

2. Materials and Methods

2.1. Study Area

The Loess Plateau (33.56–41.83°N, 100.89–114.52°E) is in the north-central part of China. Its geographical extent stretches from the Riyue Mountains in the west to the Taihang Mountains in the east, bounded by the Qinling Mountains to the south and the Yin Mountains to the north. It spans 342 counties (cities, and banners) across seven provinces (autonomous regions), including Qinghai, Gansu, Ningxia, Inner Mongolia, Shaanxi, Shanxi, and Henan, with a total area of approximately 640,000 km2 (Figure 1). The region features complex topography, with elevations ranging from 94 to 5101 m, decreasing in a wavelike pattern from northwest to southeast. It is widely covered by hills and gullies, making it one of the world’s most severe areas for soil and water loss [8].
The Loess Plateau is characterized by a typical temperate continental monsoon climate. The mean annual precipitation is about 200 mm, exhibiting significant spatial and temporal unevenness, with rainfall concentrated primarily in the summer. The mean annual temperature is 12 °C, featuring cold winters, hot summers, and substantial diurnal temperature variations. It possesses the world’s largest loess deposit area. The soil structure is loose and highly permeable, making it extremely susceptible to water erosion and severe soil and water loss problems [8]. Over the long term, hydraulic erosion on the loose and thick loess parent material has formed the typical loess landform of the region, characterized by crisscrossing gullies, undulating hills, and fragmented topography. In terms of geomorphological types, the Loess Plateau mainly comprises rocky mountains, river–valley plains, and loess hilly areas. The loess hilly area is the most extensive, accounting for about 64% of the total area. The regional climate and ecology show distinct zonal differentiation from southeast to northwest: the climate transitions from a warm-temperate semi-humid zone to semi-arid and arid zones. Correspondingly, the vegetation types evolve from forest-steppe and steppe to sandy steppe. Based on location and geographic characteristics differences, the Loess Plateau can be divided into several sub-regions, including loess tableland and gully region, loess hilly and gully region, sandy land and agricultural irrigation region, and earth–rock mountainous and river–valley plain region (Figure 1).

2.2. Material

2.2.1. Satellite Data

The core remote sensing datasets used in this study were obtained from the Moderate Resolution Imaging Spectroradiometer (MODIS) products, covering a continuous period from 2002 to 2024. All data were accessed and preprocessed on the Google Earth Engine (GEE) platform to ensure efficient data acquisition and standardized processing.
The NDVI was derived from the MOD13A1 product (Table 1), with a spatial resolution of 500 m and a 16-day temporal resolution. As a widely validated dataset for global vegetation dynamics monitoring, MOD13A1 provides reliable support for large-scale spatiotemporal analyses of vegetation variation. The Surface Reflectance (SR) data were obtained from the MOD09A1 product, which has the same spatial resolution (500 m) but a higher temporal resolution of 8 days. The SR dataset offers high-frequency reflectance information essential for vegetation index derivation and surface biophysical parameter estimation. The Land Surface Temperature (LST) data were taken from the MOD11A2 product, featuring a 1 km spatial resolution and an 8-day temporal resolution. Based on the split-window algorithm, this dataset effectively reduces atmospheric and cloud effects, making it suitable for regional thermal environment assessments and vegetation-temperature relationship analyses. The Land Cover Type (LCT) data were retrieved from the MCD12Q1 product (500 m, yearly). Among its multiple classification schemes, the International Geosphere-Biosphere Programme (IGBP) system was adopted in this study due to its global applicability and compatibility with vegetation–climate analyses. The Gross Primary Productivity (GPP) and Net Primary Productivity (NPP) data were derived from the MOD17A3H product (500 m, yearly). Developed using the light-use efficiency model, this product integrates MODIS vegetation indices, land surface temperature, and meteorological inputs. Compared with traditional CASA model simulations, MOD17A3H has been calibrated against global eddy covariance flux tower data, ensuring higher reliability for ecosystem productivity assessment. Digital Elevation Model (DEM) data were obtained from the Shuttle Radar Topography Mission (SRTM, 30 m; Table 1) via the USGS Glovis platform. The dataset has undergone void filling and accuracy enhancement and was used to extract topographic parameters (elevation, slope, aspect) for analyzing terrain influences on vegetation and climate.
All satellite datasets underwent preprocessing steps including projection transformation (standardized to WGS84/UTM Zone 48N) [24,25], invalid-value masking, and resampling to a consistent spatial resolution of 500 m, thereby ensuring spatial comparability and alignment across all data layers for subsequent spatiotemporal analyses.

2.2.2. Climatic Data

Monthly climatic datasets from the CRU TS v4.08 and TerraClimate were adopted in the study. The CRU TS dataset provides monthly temperature, precipitation, and potential evapotranspiration from 1981 to 2024. These data were generated by incorporating observations from over 4000 global meteorological stations and applying the Angular Distance Weighting (ADW) interpolation method, which has been widely used in the arid regions and mountains. The TerraClimate dataset offers vapor pressure (VAP) and vapor pressure deficit (VPD) from 2002 to 2024 at a finer spatial resolution of 1/24° (approximately 4 km at mid-latitudes). This dataset integrates PRISM climate grids and MODIS remote sensing data, and is optimized using Climatically Aided Interpolation (CAI) to improve spatial accuracy.
All the datasets adopted in this study are listed in Table 1.

2.3. Methods

2.3.1. RSEI Calculation

The RSEI is a quantitative assessment method that integrates multiple ecological factors based on remote sensing information. Its core lies in combining four indicators—Greenness (NDVI), Wetness (WET), Heat (Land Surface Temperature, LST), and Dryness (Normalized Difference Bare Soil Index, NDBSI)—with Principal Component Analysis (PCA) to achieve an objective evaluation of ecological quality [26]. This approach effectively circumvents the subjective bias inherent in manual weighting. The index value ranges from 0 to 1, with a higher value indicating better ecological quality. This study employed the RSEI to assess ecological changes on the Loess Plateau from 2002 to 2024. Specifically, the NDVI reflects vegetation vigor and productivity; WET indicates the moisture condition of soil, water bodies, and vegetation; LST characterizes the regional thermal environment; and NDBSI signifies the proportion of bare soil and the degree of surface dryness. PCA was applied to reduce the dimensionality of the four standardized indicators. The first principal component (PC1), serving as a comprehensive carrier of ecological information, was extracted. The initial RSEI was then constructed and normalized to obtain the final index. The calculation procedure is as follows:
RSEI = f ( NDVI ,   WET ,   LST ,   NDBSI )
R S E I 0 = 1 { P C 1 [ f ( N D V I , W E T , L S T , N D B S I ) ] }
R S E I = ( R S E I 0 R S E I 0   m i n ) / ( R S E I 0   m a x R S E I 0   m i n )
W E T = 0.1147 × R E D + 0.2489 × N I R 1 + 0.2408 × B L U E + 0.3132 × G R E E N 0.3127 × N I R 2 0.1416 × S W I R 1 0.5087 × S W I R 2
L S T = 0.02 × D N L S T 273.15
N D B S I = ( S I + I B 1 ) / 2
S I = ( S W I R 1 + R E D ) ( N I R + B L U E ) ( S W I R 1 + R E D ) + ( N I R + B L U E )
I B I = 2 × S W I R 1 S W I R 1 + N I R ( N I R N I R + R E D + G R E E N G R E E N + S W I R 1 ) 2 × S W I R 1 S W I R 1 + N I R + ( N I R N I R + R E D + G R E E N G R E E N + S W I R 1 )
where f represents the standardized comprehensive matrix of the four indicators; RSEI0 denotes the initial value of the ecological index; PC1 is the first principal component from the PCA; RSEIMin and RSEIMax are the minimum and maximum values of RSEI0, respectively; RED, NIR1, BLUE, GREEN, NIR2, SWIR1, and SWIR2 represent the reflectances of the red, near-infrared 1, blue, green, near-infrared 2, shortwave infrared 1, and shortwave infrared 2 bands, respectively; DNLST represents the pixel digital number (DN) value of the MODIS land surface temperature product; SI is the bare soil index; IBI is the built-up index. In this study, the RSEI was classified into five ecological quality levels: Worst [0–0.2), Poor [0.2–0.4), Moderate [0.4–0.6), Good [0.6–0.8), and Excellent [0.8–1].

2.3.2. Fraction of Vegetation Cover (FVC) Calculation

Fractional Vegetation Cover (FVC) was estimated from MODIS NDVI data to quantify vegetation conditions. The MOD13A1 product (resolution of 500 m, 16-day composite) was obtained from the NASA LP DAAC (https://lpdaac.usgs.gov/) (accessed on 15 April 2025). NDVI data were reprojected to a uniform coordinate system, and cloud-contaminated pixels were removed using the quality assurance (QA) layer. The maximum value composite (MVC) method was applied to reduce atmospheric and cloud effects.
FVC was calculated using the pixel dichotomy model:
N D V I = F V C × N D V I V e g + ( 1 F V C ) × N D V I S o i l
F V C = ( N D V I N D V I S o i l ) ( N D V I V e g N D V I S o i l l )
where NDVISoil and NDVIVeg represent the NDVI values of bare soil and dense vegetation, respectively. These thresholds were defined as the 5th and 95th percentiles of the NDVI distribution for each year to capture spatial and interannual variability. The resulting FVC values range from 0 to 1. Monthly and annual averages were then computed to analyze spatiotemporal changes in vegetation cover. Based on the calculated FVC, the study area was categorized into five vegetation cover classes: high vegetation cover (FVC ≥ 80%), moderately high vegetation cover (60% ≤ FVC < 80%), moderate vegetation cover (40% ≤ FVC < 60%), low vegetation cover (20% ≤ FVC < 40%), and bare land (FVC < 20%).

2.3.3. NEP Calculation

This study employed the Net Ecosystem Productivity (NEP) calculation model and classification system to estimate regional carbon sinks and sources. The magnitude of vegetation carbon sinks/sources can be represented by the difference between Net Primary Productivity (NPP) and soil microbial respiration and carbon emissions, with other natural environmental and anthropogenic factors not considered in this calculation. The formula for NEP is as follows:
NEP = NPP − HR
HR = 0.22 × [exp(0.0913T) + Ln(0.3145P + 1)] × 30 × 46.5%
where NEP represents the annual total net ecosystem production (gC·m−2·yr−1), NPP is the annual total net primary productivity (gC·m−2·yr −1), and T and P in Equation (11) are monthly mean air temperature (°C) and monthly total precipitation (mm), respectively. Monthly HR values were then summed to obtain annual HR (g C·m−2·yr−1).

2.3.4. Land Use Intensity

Land Use Intensity (LUI) is a key indicator reflecting the functional intensity of land use. The LUI in this study was calculated based on the MODIS global land cover product MCD12Q1.061, utilizing the IGBP classification system. Different land cover types were assigned values as follows: cropland (types 12, 14) was assigned a value of 3, forest (1–5), grassland (10), shrubland (6, 7), savanna (8, 9), water bodies (11, 17), and permanent snow and ice (15) were assigned a value of 2; urban and built-up lands (13) were assigned a value of 4; and barren land (16) was assigned a value of 1. The calculation and export of LUI were completed on the Google Earth Engine (GEE) platform. The formula for calculating Land Use Intensity is as follows:
LUI   =   i = 1 n A i ×   ( S i / S )
where LUI is the Land Use Intensity; Ai is the graded index for land use intensity level i. Referencing established research, the assigned values are 1 for unused land, 2 for forest, grassland, and water bodies, 3 for cropland, and 4 for construction land. Sj represents the area of land use within level i; S denotes the total area of the study region; and n is the number of land use intensity grades within the region.

2.3.5. Geographical Detector

To quantitatively identify and analyze the dominant influencing factors of spatial heterogeneity in ecological quality, this study employed the Geographical Detector model. Based on the principle of spatial stratified heterogeneity, this method quantifies the explanatory power of different influencing factors on the spatial distribution differences in ecological quality (represented by RSEI) by comparing the variance within factor strata with the total variance. Its core premise is that if the spatial distribution of an influencing factor exhibits a pattern similar to the spatial heterogeneity of ecological quality, then that factor possesses stronger explanatory power.
The determinant power index q, calculated according to the factor detection module of the Geographical Detector, can be expressed as follows:
q = 1 h   =   1 L N h σ h 2 N σ 2
where Nh and Nare the number of samples in stratum h and the entire study area, respectively; σ h 2 and σ2 are the variances of the stratum and the overall population, respectively. The value of q ranges from 0 to 1, with a larger value indicating a greater explanatory power of that factor on the spatial heterogeneity of ecological quality [27].
This study selected multidimensional factors encompassing physical geography and human activities as independent variables, these included elevation, slope, aspect, LUI, precipitation, temperature, RH, and FVC. The Geographical Detector model was applied to quantitatively analyze the degree of influence of each factor on the variation in ecological quality (RSEI) in the Loess Plateau region, thereby revealing the main driving factors and their interactive characteristics behind the spatial heterogeneity of ecological quality.

2.3.6. Trend and Correlation Analysis

To examine the temporal evolution and interdependence of major ecological and climatic indicators, this study adopted the Mann–Kendall (MK) trend test, Pearson correlation, and simple linear regression. The MK test, a robust non-parametric approach, was applied to identify monotonic variations within the time series, with the Z-value and corresponding p-level determining the statistical significance, while Sen’s slope quantified the rate of change. Pearson’s correlation coefficient was then used to evaluate the linear association and direction between vegetation metrics and environmental drivers. In addition, linear regression models were fitted to describe these relationships quantitatively, where the coefficient of determination (R2) was used to measure the proportion of variance explained by the predictors.

3. Results

3.1. Spatiotemporal Evolution Characteristics of Ecological Quality and Ecosystem Carbon Cycle

3.1.1. Spatiotemporal Evolution of Ecological Quality

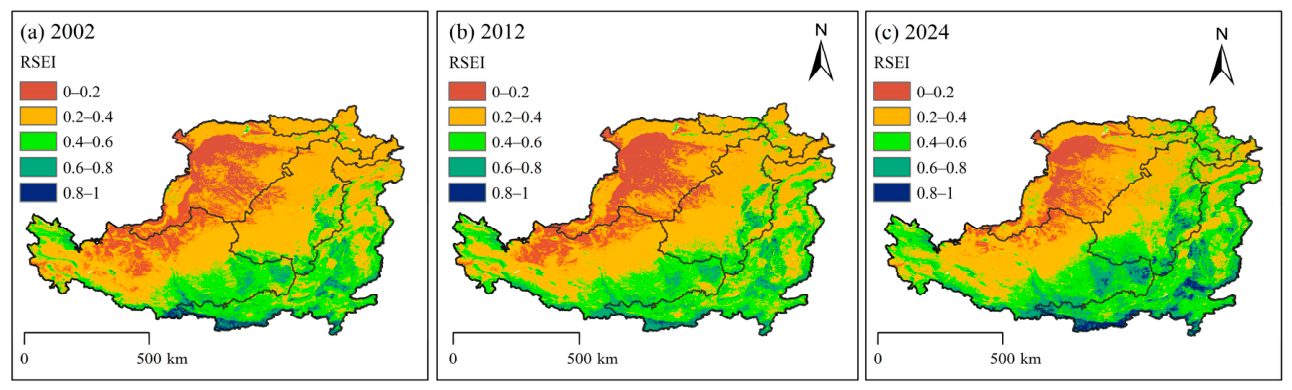
From 2002 to 2024, the ecological quality of the Loess Plateau showed notable improving trend (Figure 2). The proportion of areas with poor ecological quality (RSEI < 0.4) decreased from 68.56% in 2002 to 52.51% in 2024, while the proportion of areas with good to excellent quality (RSEI ≥ 0.6) increased from 7.60% to 15.35%. The regional mean RSEI value, derived from the same comparable framework, increased from 0.53 in 2002 to 0.60 in 2024, representing an increase of approximately 13.2%, which elevated the ecological grade from Moderate to Good. Spatially, ecological improvement exhibited distinct regional disparities. Sub-regions A, B, and D all showed clear recovery, with the proportion of poor ecological quality (RSEI < 0.4) decreasing notably and good-to-excellent area (RSEI ≥ 0.6) increasing from 2002 to 2024. In contrast, sub-region C remained persistently poor-worst grade, with over 94% of its area in the poor-worst category throughout the study period, indicating almost no recovery, whereas the worst proportion showed notable negative trend.
To ensure the reliability of RSEI trends across different years, we examined the PCA results for each year. The first principal component (PC1) consistently explained 75.09–83.62% of the total variance over the study period. The contribution rate of PC1 is high, and it can effectively integrate the characteristic information of each indicator; therefore, PC1 can be used to construct the RSEI.

3.1.2. Spatiotemporal Characteristics of Ecosystem Carbon Cycle

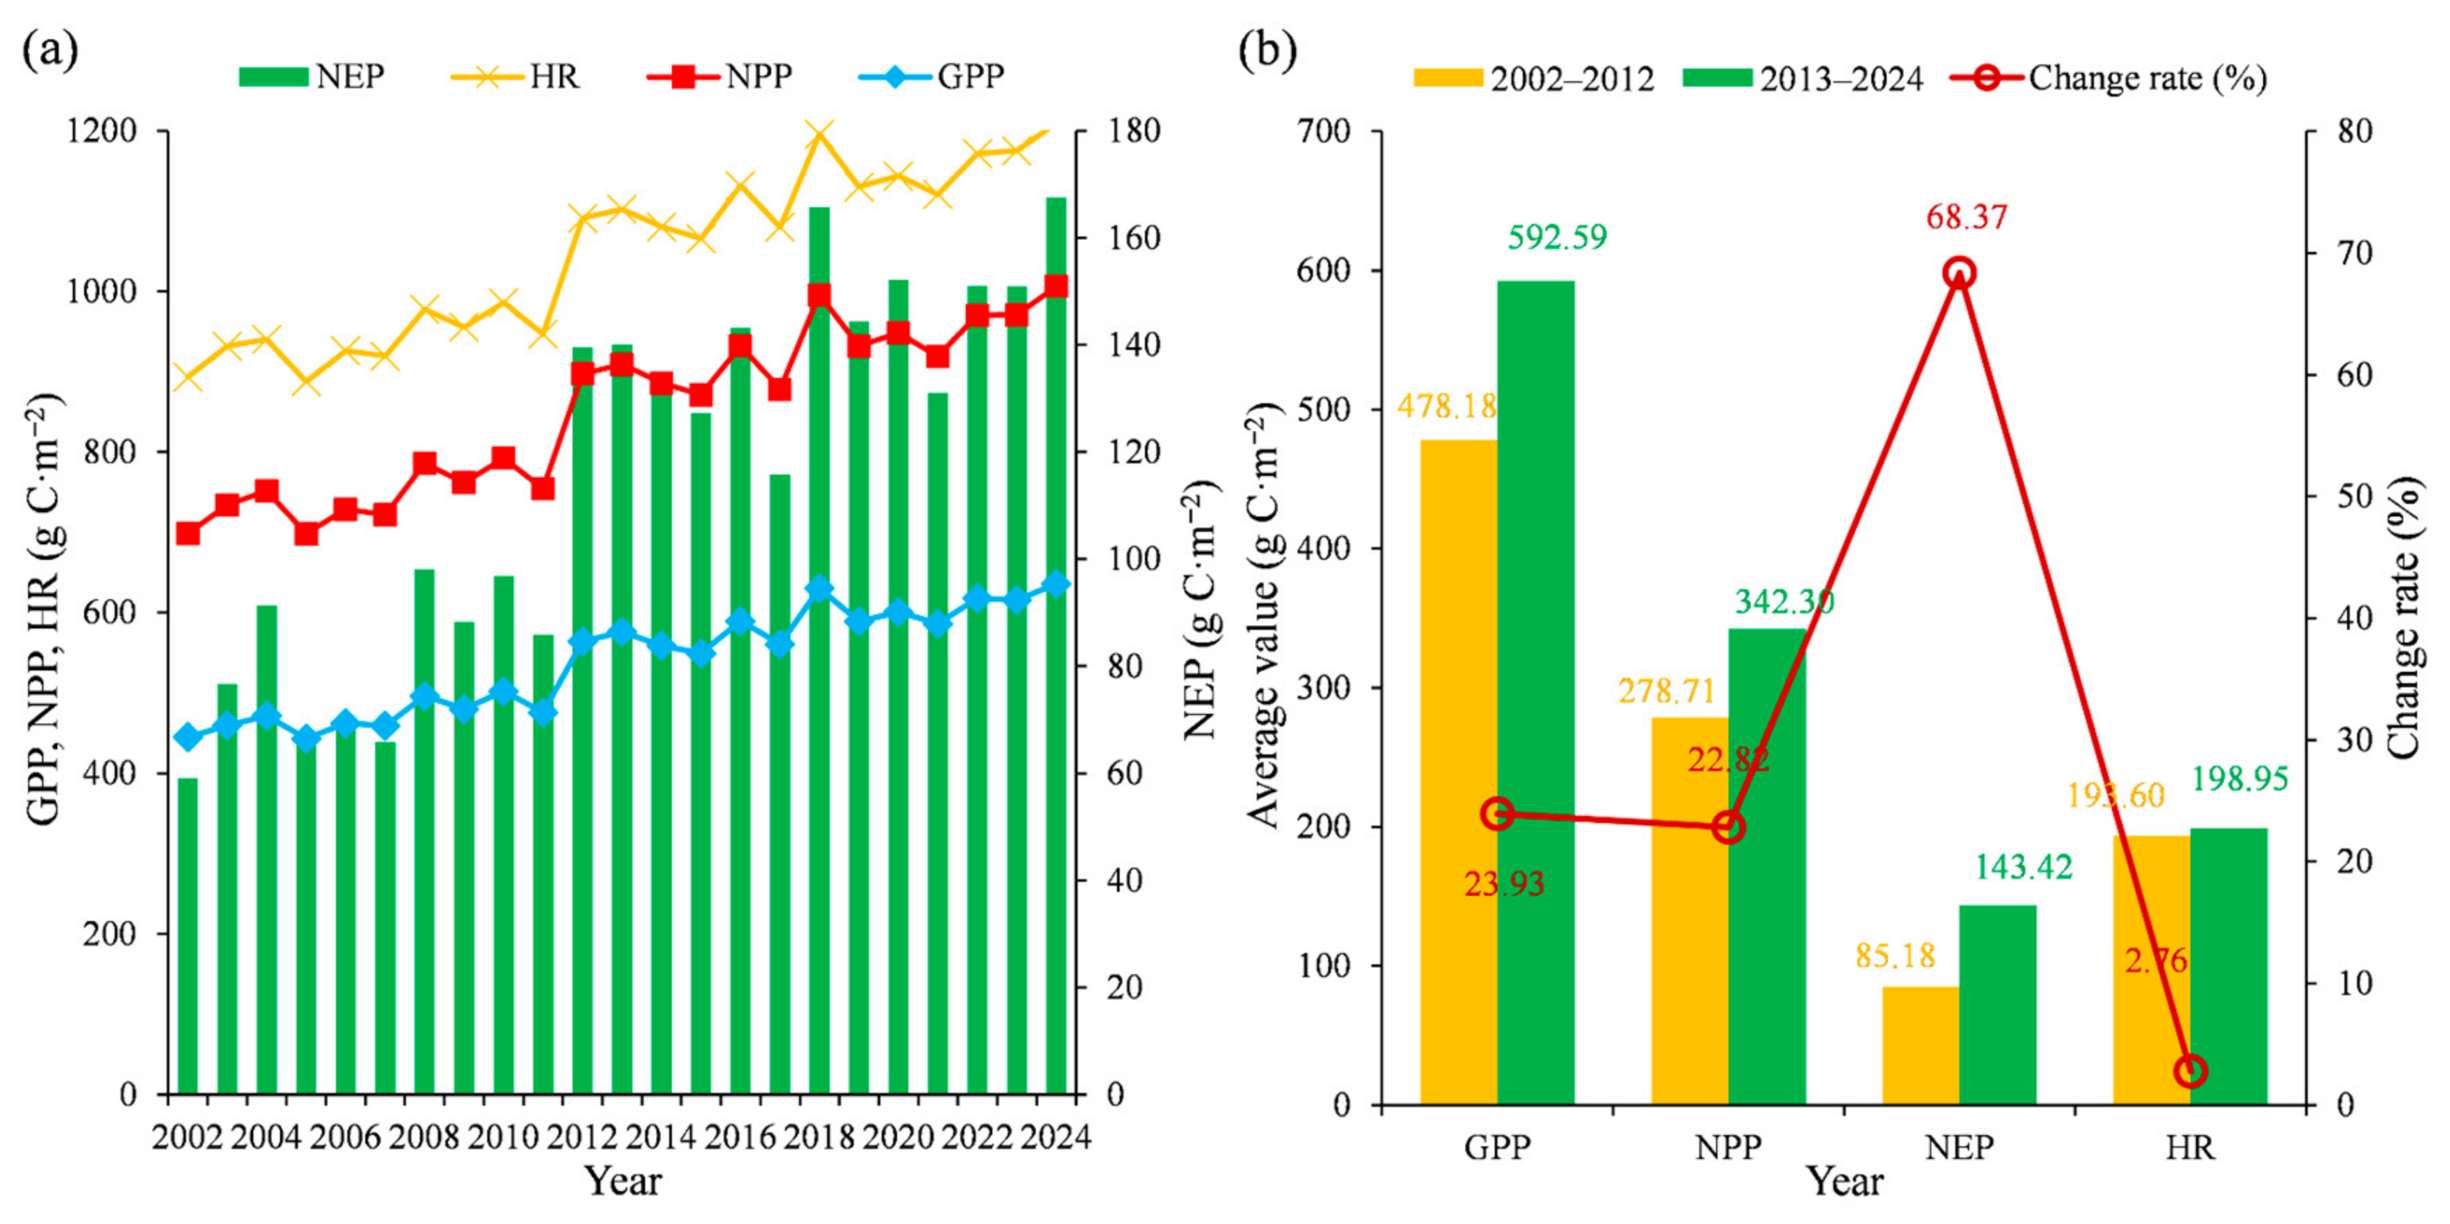
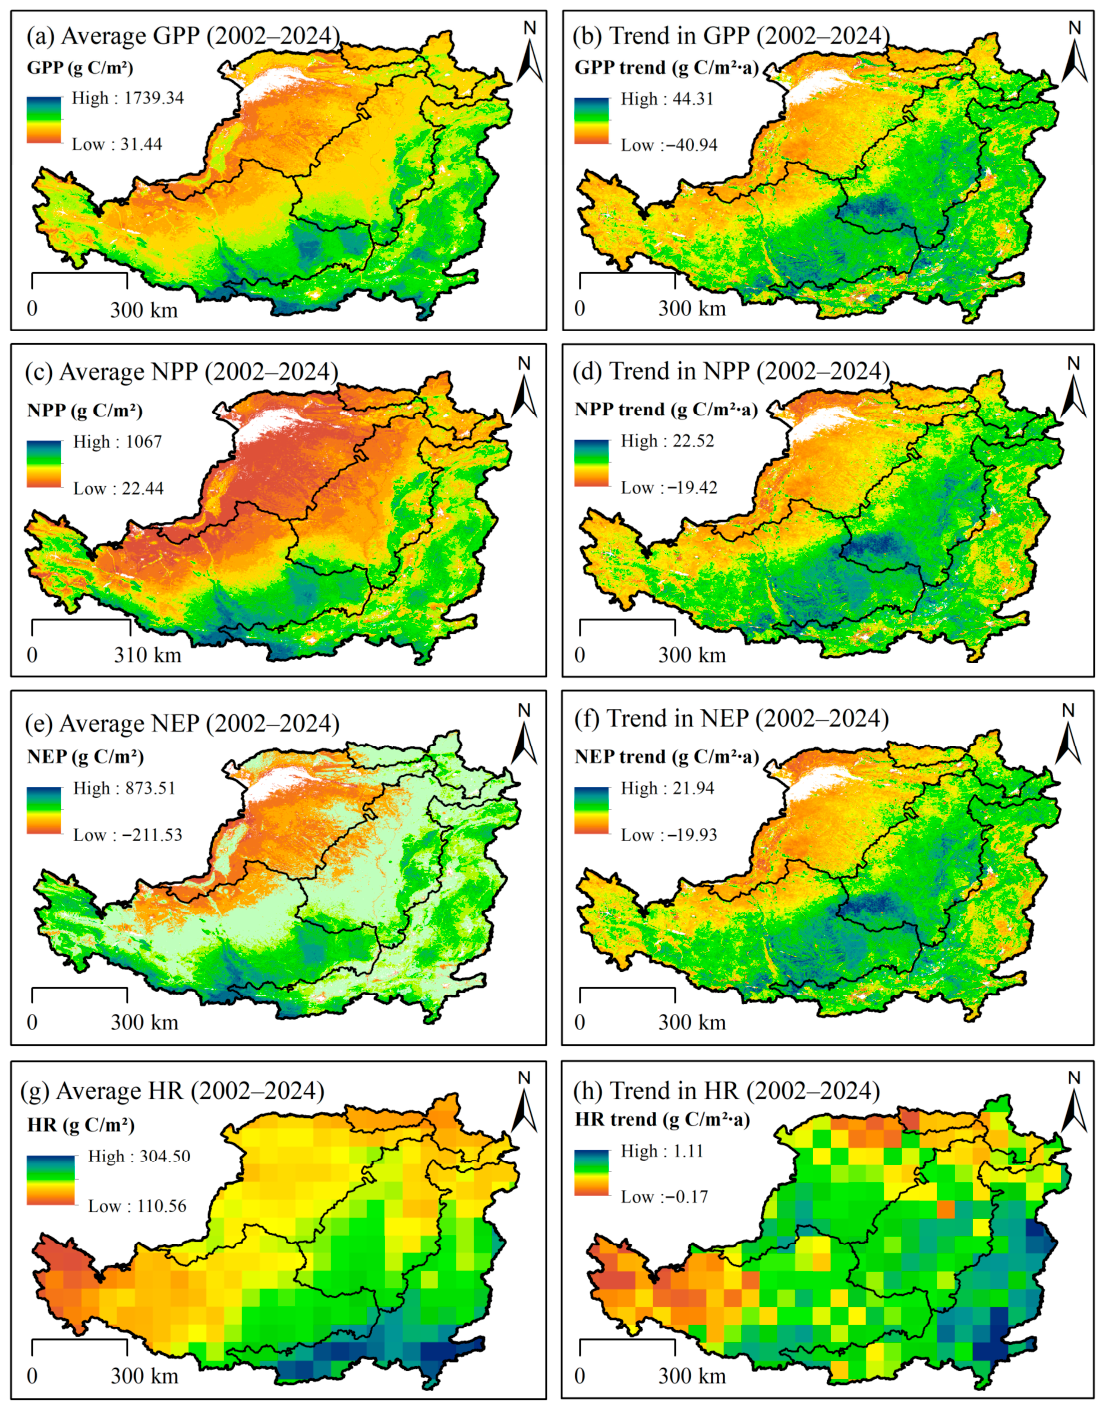
During the period 2002–2024, the GPP of the Loess Plateau exhibited an overall increasing trend, with an average annual increase of 9.16 g C·m−2·a−1, indicating enhanced vegetation photosynthetic carbon fixation capacity (Figure 3). Examining distinct phases, GPP increased significantly at a rate of 7.82 g C·m−2·a−1 from 2002 to 2012 (p < 0.05), while the growth rate slightly decreased to 5.99 g C·m−2·a−1 after 2013. Spatially, the multi-year average GPP across all four sub-regions of the Loess Plateau showed an upward trend from 2002 to 2024. Sub-region D had the highest value (714.11 g C·m−2), signifying the strongest photosynthetic carbon fixation capacity, whereas Sub-region C had the lowest (276.34 g C·m−2). Sub-regions A and B recorded values of 562.45 g C·m−2 and 507.06 g C·m−2, respectively. Regions with relatively faster overall growth rates were primarily concentrated in the southeastern part. Sub-region B showed the most pronounced increase (12.09 g C·m−2·a−1), followed by Sub-regions A and D with growth rates of 9.23 g C·m−2·a−1 and 10.46 g C·m−2·a−1, respectively. Sub-region C had the slowest growth rate (4.15 g C·m−2·a−1) (Figure 4b).
The multi-year average NPP fluctuated between 253.56 and 370.26 g C·m−2, with an average annual growth rate of 5.10 g C·m−2·a−1 (p < 0.01). Specifically, the NPP growth rate was 4.73 g C·m−2·a−1 during 2002–2012, which decreased to 3.13 g C·m−2·a−1 for the period 2013–2024. The multi-year average increased by 63.6 g C·m−2 during the latter period, representing a 22.8% increase compared to the 2002–2012 average. The spatial pattern of NPP displayed a gradual decrease from southeast to northwest. Sub-region D had the highest multi-year average (389.32 g C·m−2), while Sub-region C had the lowest (159.26 g C·m−2). Sub-regions A and B recorded values of 345.76 g C·m−2 and 295.98 g C·m−2, respectively (Figure 4c). In terms of dynamic changes, NPP showed an increasing trend in most areas, particularly in northern Sub-region A and Sub-region B, where growth rates could reach 22.52 g C·m−2·a−1. Although localized declines occurred in Sub-region C, the overall trend remained a slow increase (2.10 g C·m−2·a−1).
The multi-year average NEP was 115.57 g C·m−2, fluctuating between 59.06 and 167.44 g C·m−2. This indicates that the regional ecosystem functioned overall as a carbon sink (accounting for 77.8% of the area), primarily distributed across extensive regions except the northwest. Low carbon sink areas were mainly concentrated in the northwestern mountains and agricultural irrigation districts, while high carbon sink areas were clustered in the southeast (Figure 4e). Since 2002, the proportion of carbon source areas decreased from 35.63% to 15.49%, whereas the proportion of carbon sink areas increased from 64.40% to 84.51%, demonstrating a significant enhancement in overall carbon sink capacity. NEP showed an overall upward trend with an average annual growth rate of 4.65 g C·m−2·a−1 (Figure 4f). The highest growth rates were observed in northeastern Sub-region A and Sub-region B (5.20 and 6.32 g C·m−2·a−1, respectively), while Sub-regions C and D had growth rates of 1.68 and 4.86 g C·m−2·a−1.
HR showed a significant upward trend (p < 0.01), increasing by an average of 0.46 g C·m−2·a−1 annually. In terms of multi-year averages, Sub-regions D and B had the highest values (222.47 g C·m−2 and 197.71 g C·m−2, respectively), while Sub-region A had the lowest (182.70 g C·m−2). Sub-region C recorded a value of 183.15 g C·m−2 (Figure 4g). The spatial distribution of growth rates indicated an overall increasing trend, with faster growth in the southeastern part gradually slowing towards the northwest. Among the sub-regions, Sub-region D had the fastest growth rate (0.59 g C·m−2·a−1), followed by Sub-regions C and B with rates of 0.42 and 0.49 g C·m−2·a−1, respectively. Sub-region A had the slowest growth rate (0.35 g C·m−2·a−1) (Figure 4h).
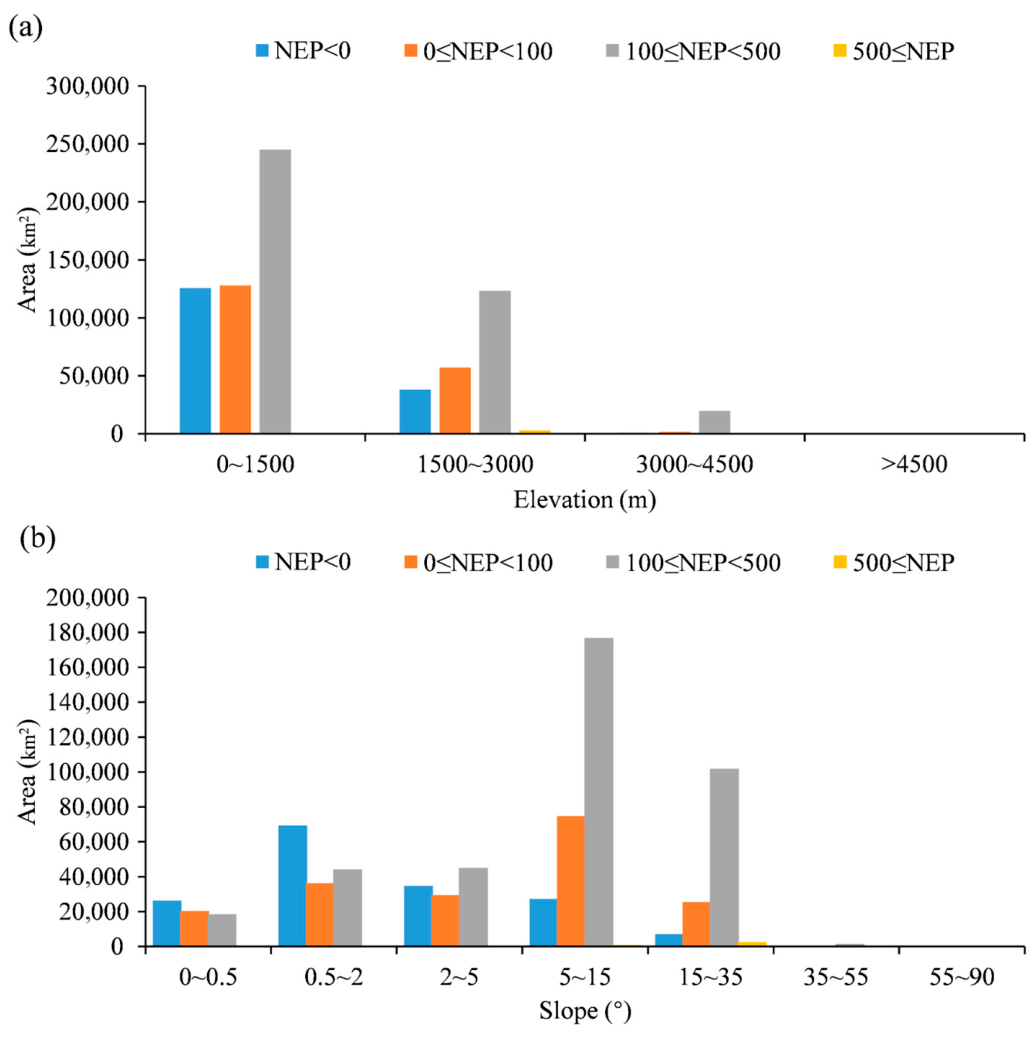
This study classified the Loess Plateau into four elevation ranges: 0–1500 m, 1500–3000 m, 3000–4500 m, and >4500 m. From the perspective of altitude distribution (Figure 5a), Carbon sources were predominantly concentrated within the 0–1500 m range, accounting for 76.11% of the total carbon source area. Carbon sinks were also mainly distributed in this range, constituting 64.59% of the total carbon sink area. The proportional area of both carbon sources and sinks gradually decreased with increasing elevation. Specifically, the proportion of carbon sink area was highest within the 1500–3000 m range at 83.8%, followed by 95.3% within the 3000–4500 m range. In contrast, the proportion was only 9.8% in areas above 4500 m, indicating a lower carbon sink capacity at high altitudes.
Regarding slope distribution (Figure 5b), carbon sources were mainly found on very gentle slopes (0.5–2°) and gentle slopes (2–5°), together accounting for 63.12%. Carbon sinks were primarily concentrated on moderate slopes (5–15°) and steep slopes (15–35°). Among these, the moderate slope range had the highest proportion of carbon sinks at 43.68%. Areas with steeper slopes typically experience severe soil and water loss and feature rugged topography, which is unfavorable for vegetation growth and consequently reduces carbon sink capacity.

3.2. Spatiotemporal Dynamics of Various Ecological Quality Indicators

3.2.1. Spatiotemporal Changes in NDVI

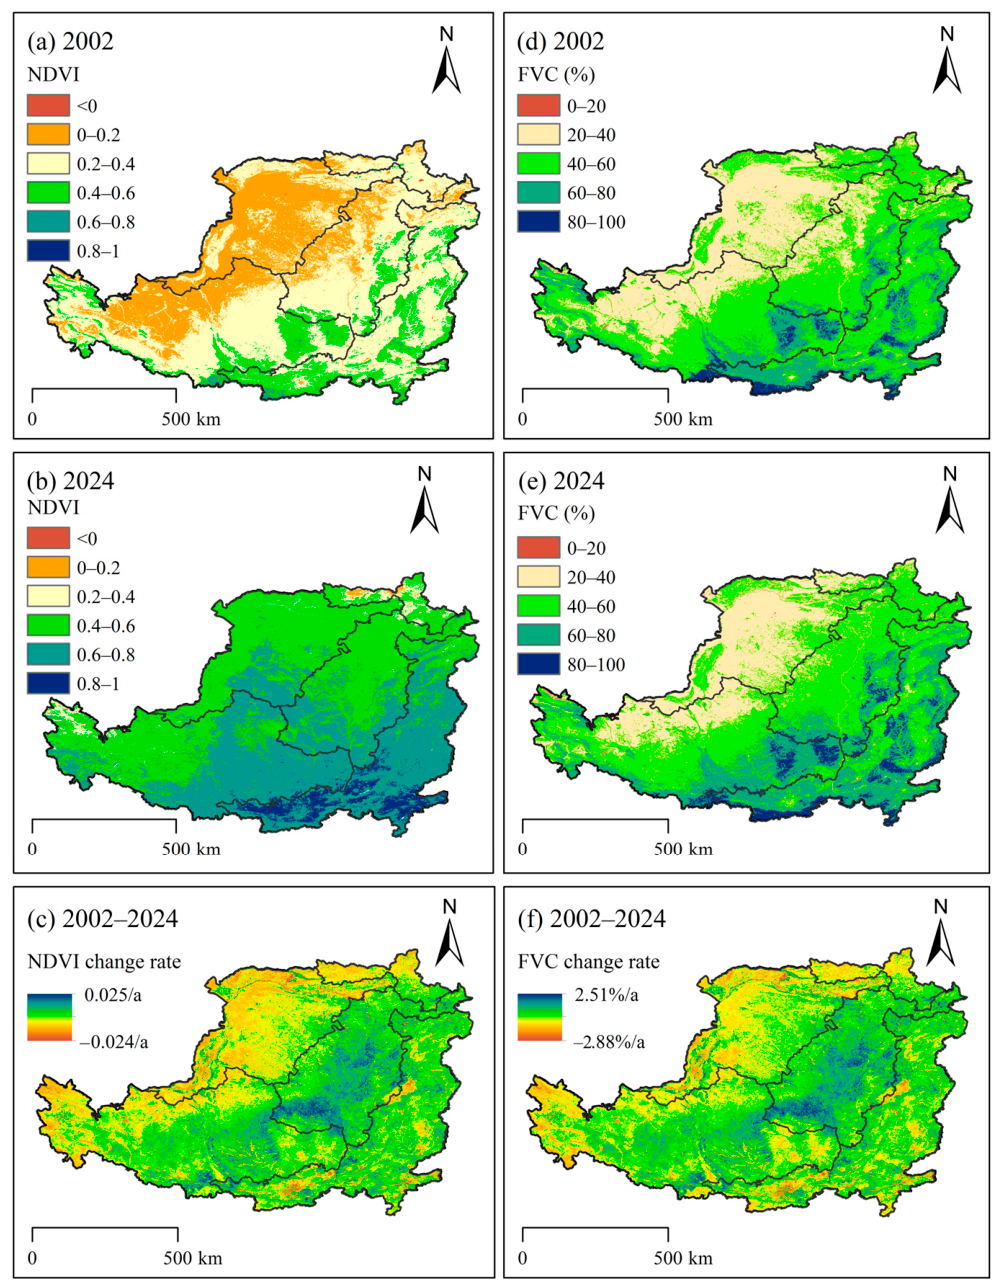
From 2002 to 2024, the NDVI of the Loess Plateau showed a significant overall upward trend (Figure 6). The regional average NDVI increased from 0.28 to 0.61, representing a substantial rise of 118%, indicating a marked improvement in vegetation coverage. Spatially, NDVI values were generally low in 2002. However, by 2024, the NDVI in most areas exceeded 0.6, with contiguous high-value zones forming particularly in the southern and southeastern regions. Sub-regional analysis revealed that Sub-region B experienced the most notable NDVI increase, rising from 0.26 to 0.58 with an average annual growth rate of 0.006 yr−1. In Sub-region A, NDVI increased from 0.29 to 0.61 (0.004 yr−1). Sub-region D showed an increase from 0.35 to 0.65 (0.004 yr−1). Although starting from a relatively lower base, Sub-region C exhibited a consistent upward trend, with the NDVI increasing from 0.18 to 0.55 (0.002 yr−1).
The trend in Fractional Vegetation Cover (FVC) was highly consistent with that of NDVI. The annual mean FVC for the Loess Plateau was 48.56% in 2002 and increased to 52.23% by 2024, resulting in an overall increase of 7.56% and an average annual growth rate of 0.228% yr−1. At the sub-regional level, Sub-region B showed the most significant improvement, with FVC increasing from 46.49% to 53.90% (0.413% yr−1). Sub-region A increased from 49.79% to 53.12% (0.220% yr−1). Although the increases in Sub-regions C and D were smaller, they demonstrated stable growth. The spatial pattern was generally characterized by “better conditions in the south and east, poorer conditions in the north and west,” which was highly consistent with the NDVI distribution.
The synchronous increase in the NDVI and FVC indicates significant vegetation recovery and enhanced ecosystem stability on the Loess Plateau from 2002 to 2024. Notably, Sub-regions A and B showed continuous increases in vegetation coverage. Although improvements were relatively slower in Sub-regions C and D, their persistent upward trends suggest considerable potential for ecological restoration. Overall, while spatial disparities in vegetation recovery across the Loess Plateau are evident, the ecological quality has shown a general improvement. This reflects the long-term effectiveness of ecological projects such as the Grain-for-Green Program, Grazing-for-Grassland Program, and desertification control measures.

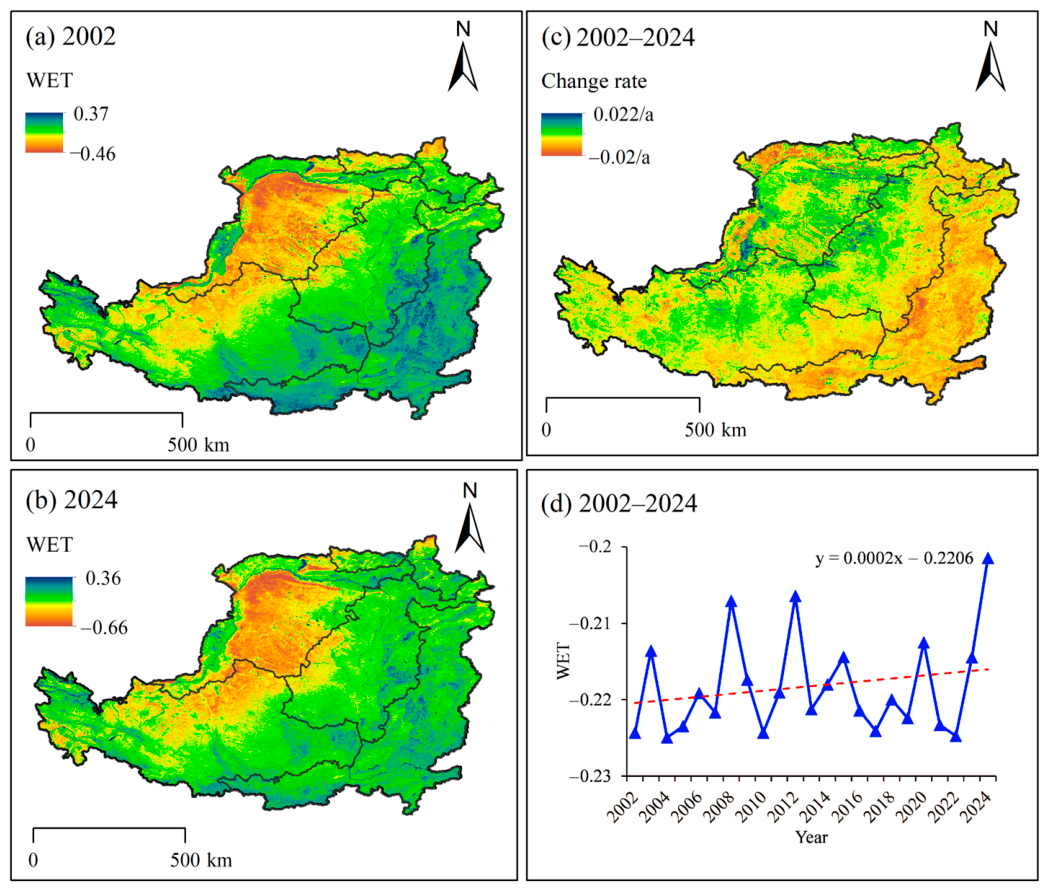
3.2.2. Spatiotemporal Changes in WET

From 2002 to 2024, WET component on the Loess Plateau exhibited an overall slight improving trend with considerable interannual fluctuations (Figure 7). The mean WET value increased from −0.22 in 2002 to −0.20 in 2024. Although still within the negative range, this represents an improvement of 10.2% in moisture conditions, providing a more favorable hydrological foundation for ecosystem water use and carbon cycle processes. Sub-region C showed the most significant improvement, with its mean WET increasing from −0.28 to −0.25. Sub-regions A and B also exhibited some improvement, rising from −0.23 to −0.21 and from −0.22 to −0.19, respectively. In contrast, Sub-region D experienced a very slight decreasing trend, from −0.18 to −0.17.

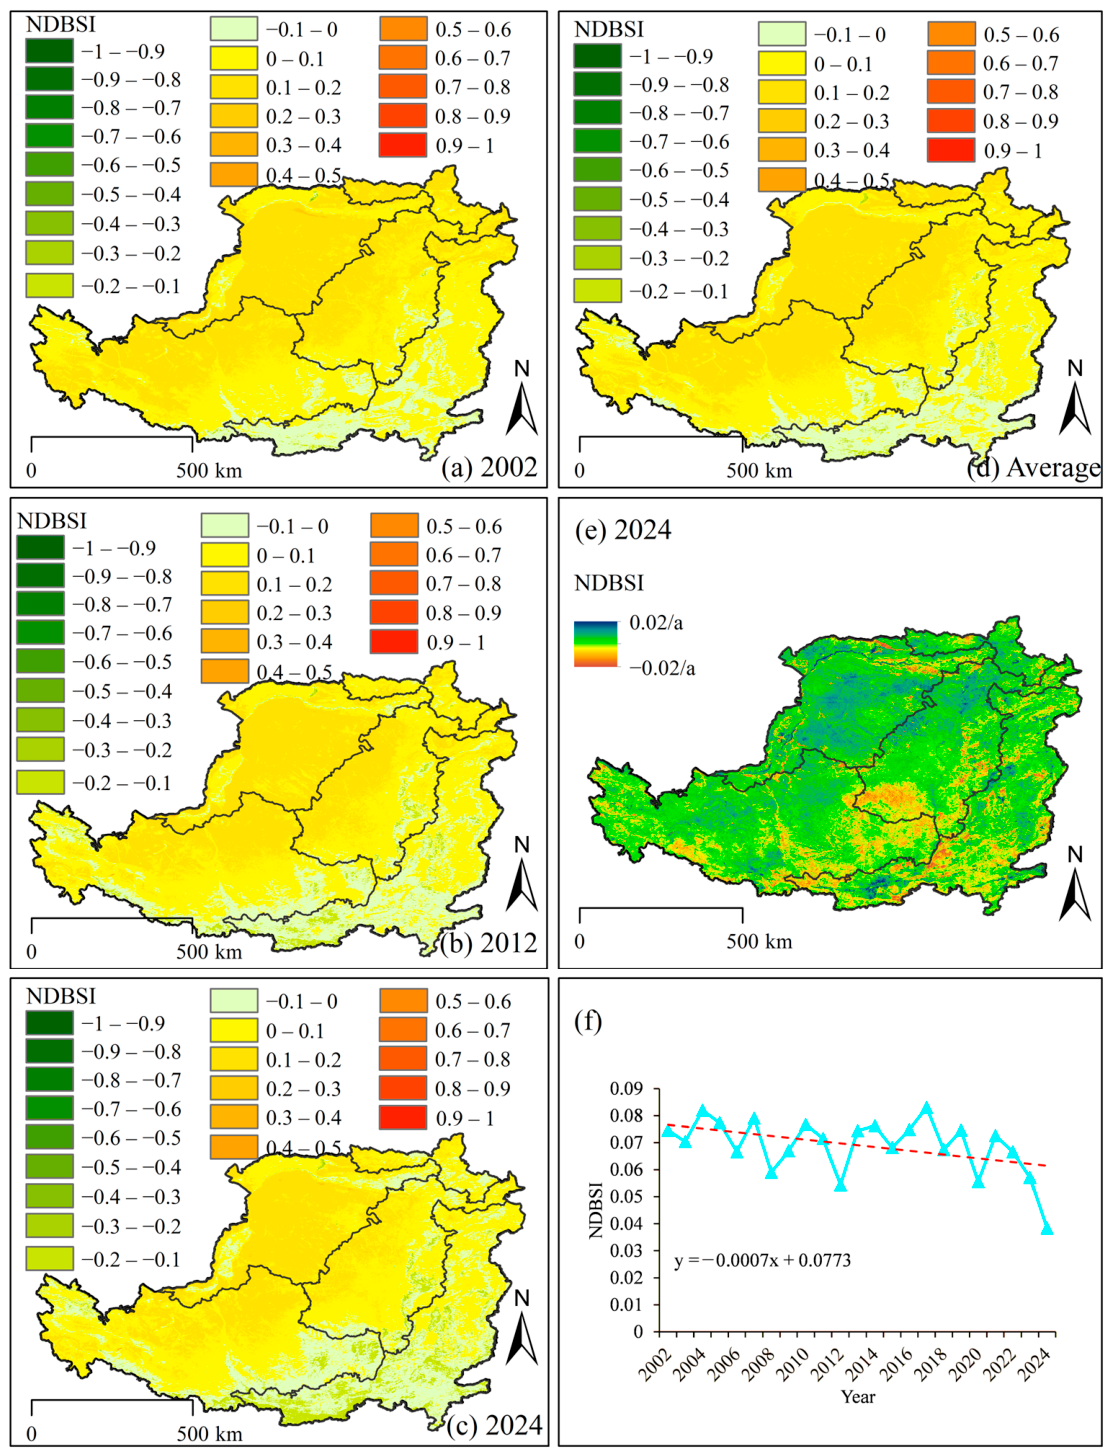
3.2.3. Spatiotemporal Changes in NDBSI

Between 2002 and 2024, NDBSI of the Loess Plateau showed a significant overall decreasing trend with substantial interannual fluctuations (Figure 8). The regional mean NDBSI decreased from 0.07 to 0.04, a reduction of 48.59%, indicating a notable decrease in the proportion of non-vegetated areas such as bare soil and built-up land, and consequently an improvement in ecological quality. Spatially, the decrease in NDBSI displayed a distinct regional gradient. The decline was most pronounced in Sub-region D, from 0.03 to −0.02. Sub-regions A and B also showed clear reductions, from 0.08 to 0.04 and from 0.09 to 0.05, respectively. Sub-region C had the smallest decrease, from 0.12 to 0.10.

3.2.4. Spatiotemporal Changes in LST

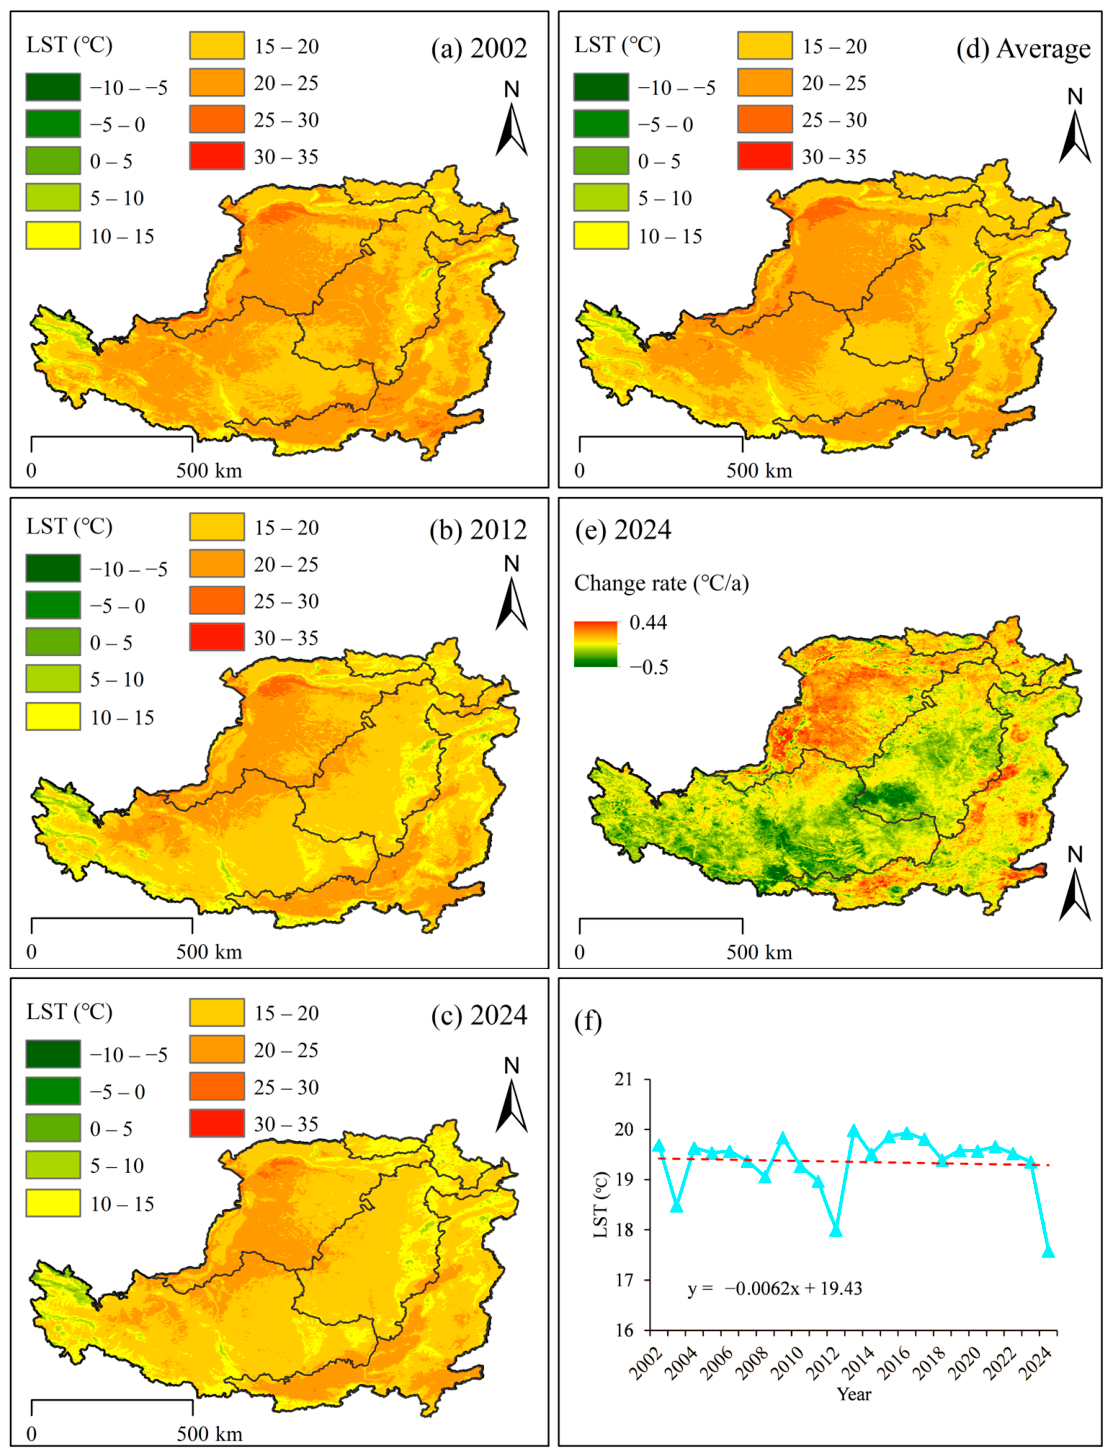
During the period 2002–2024, the LST on the Loess Plateau demonstrated a slow overall cooling trend (Figure 9), with a regional average cooling rate of 0.062 °C per decade. At the sub-regional level, Sub-region A experienced the most significant LST cooling, with an average rate of 1.11 °C per decade, followed by Sub-region B at 1.10 °C per decade. In comparison, Sub-regions C and D showed only minor cooling, with average rates of 0.63 °C per decade and 0.92 °C per decade, respectively. This discrepancy suggests that changes in land surface temperature across different regions may be modulated by factors such as human activities and variations in vegetation cover.

3.3. Analysis of Key Driving Factors of Ecological Quality and Carbon Cycle

3.3.1. Analysis of Key Driving Factors of Ecological Quality

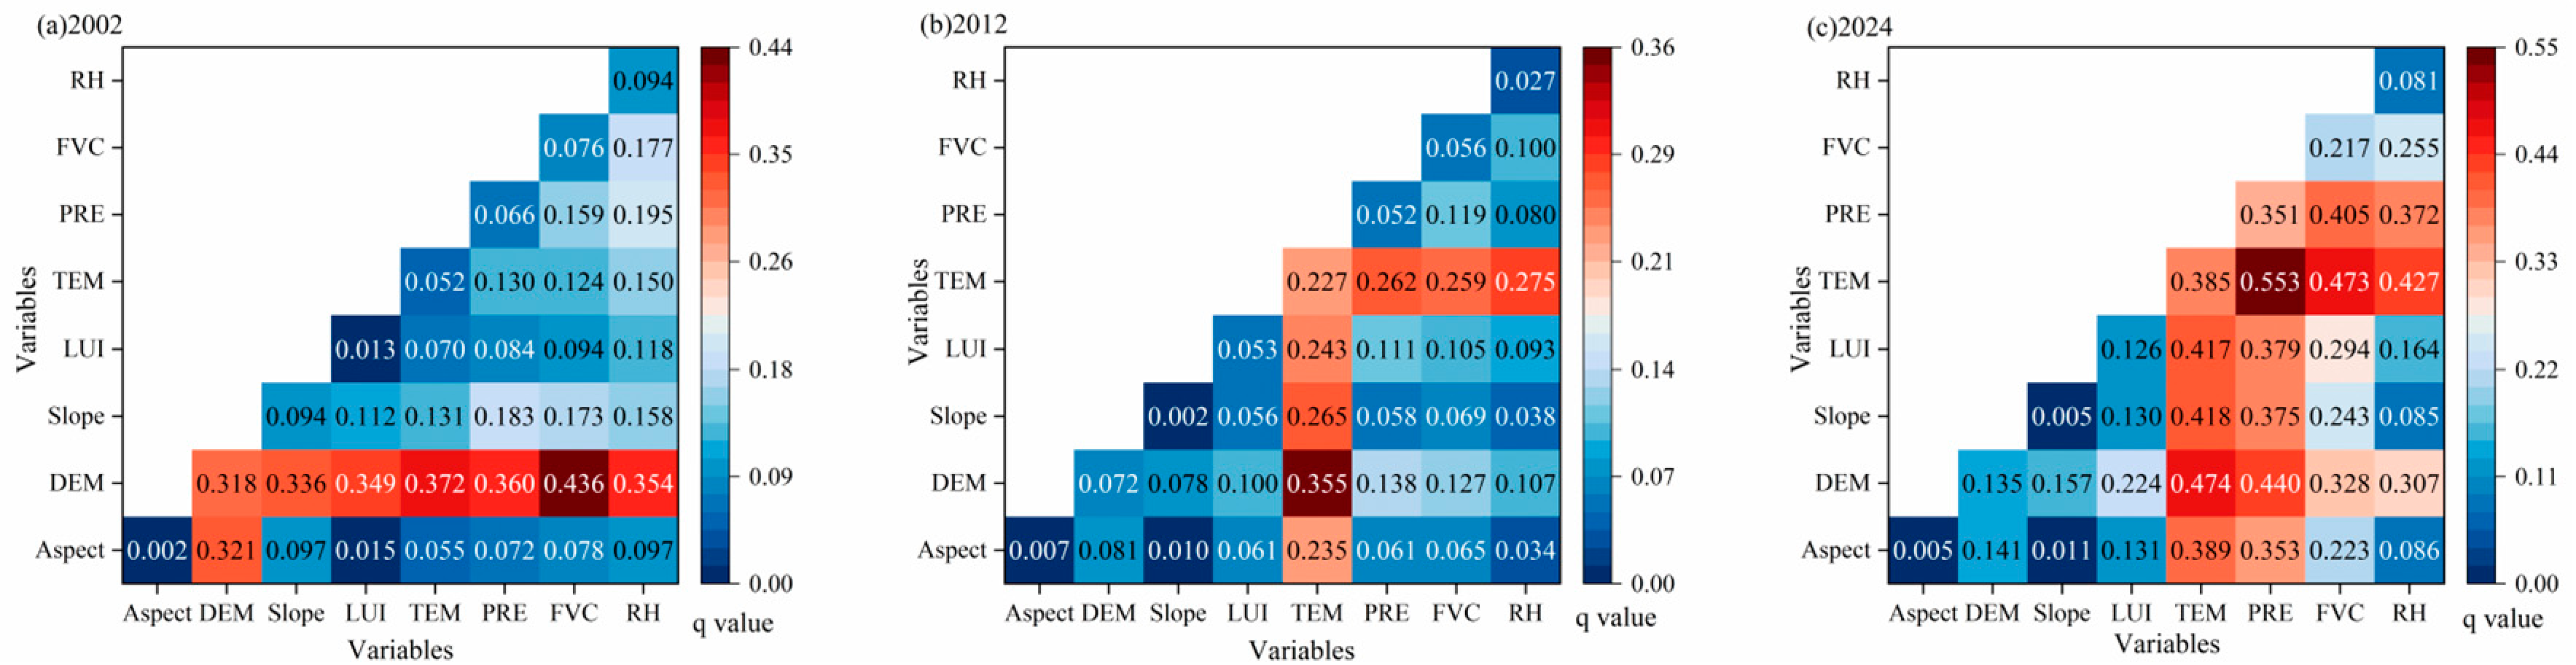
The ecological environment quality of the Loess Plateau is influenced by the combined effects of natural and anthropogenic factors (Figure 10). The single-factor detection results show that from 2002 to 2024, the dominant factors affecting the RSEI shifted from DEM, RH, and slope to temperature (TEM), precipitation (PRE), and FVC. The explanatory power (q value) of temperature and precipitation on RSEI increased from 0.05 and 0.07 in 2002 to 0.38 and 0.35 in 2024, respectively. Land use intensity (LUI) increased from 0.01 to 0.13, while the explanatory power of topographic factors decreased. The two-factor interaction detection results indicate that the interactive influence of any two factors on ecological environment quality is significantly greater than that of a single factor, exerting a stronger effect on the RSEI. In 2002, the interaction between the DEM and FVC had the highest q value (0.4364), followed by DEM ∩ TEM (0.3719); the q values of other factors interacting with the DEM were all above 0.3. In 2012, the highest q value was found for DEM ∩ TEM (0.3553), followed by RH ∩ TEM (0.2747). In 2024, the interaction between PRE and TEM had the highest q value (0.5532), followed by DEM ∩ TEM (0.4742); factors interacting with TEM and PRE all exhibited relatively high q values. Overall, from 2002 to 2024, elevation, climatic factors, and vegetation cover jointly influenced the ecological environment quality of the Loess Plateau, with the influence of climatic and vegetation cover factors increasing, and the impact of human activities (LUI) gradually becoming more pronounced.

3.3.2. Analysis of Driving Factors for Ecological Quality and Carbon Cycle

From 2002 to 2024, the surface environmental system of the Loess Plateau underwent significant positive evolution. Ecological quality continuously improved, and carbon sink capacity markedly strengthened. The overall spatial pattern of carbon sinks was characterized as “higher in the south and lower in the north, better in the east and poorer in the west.” This changing process was synergistically regulated by vegetation coverage, hydrothermal conditions, and surface dryness, and was closely related to the coupling effect of natural conditions and human activities.
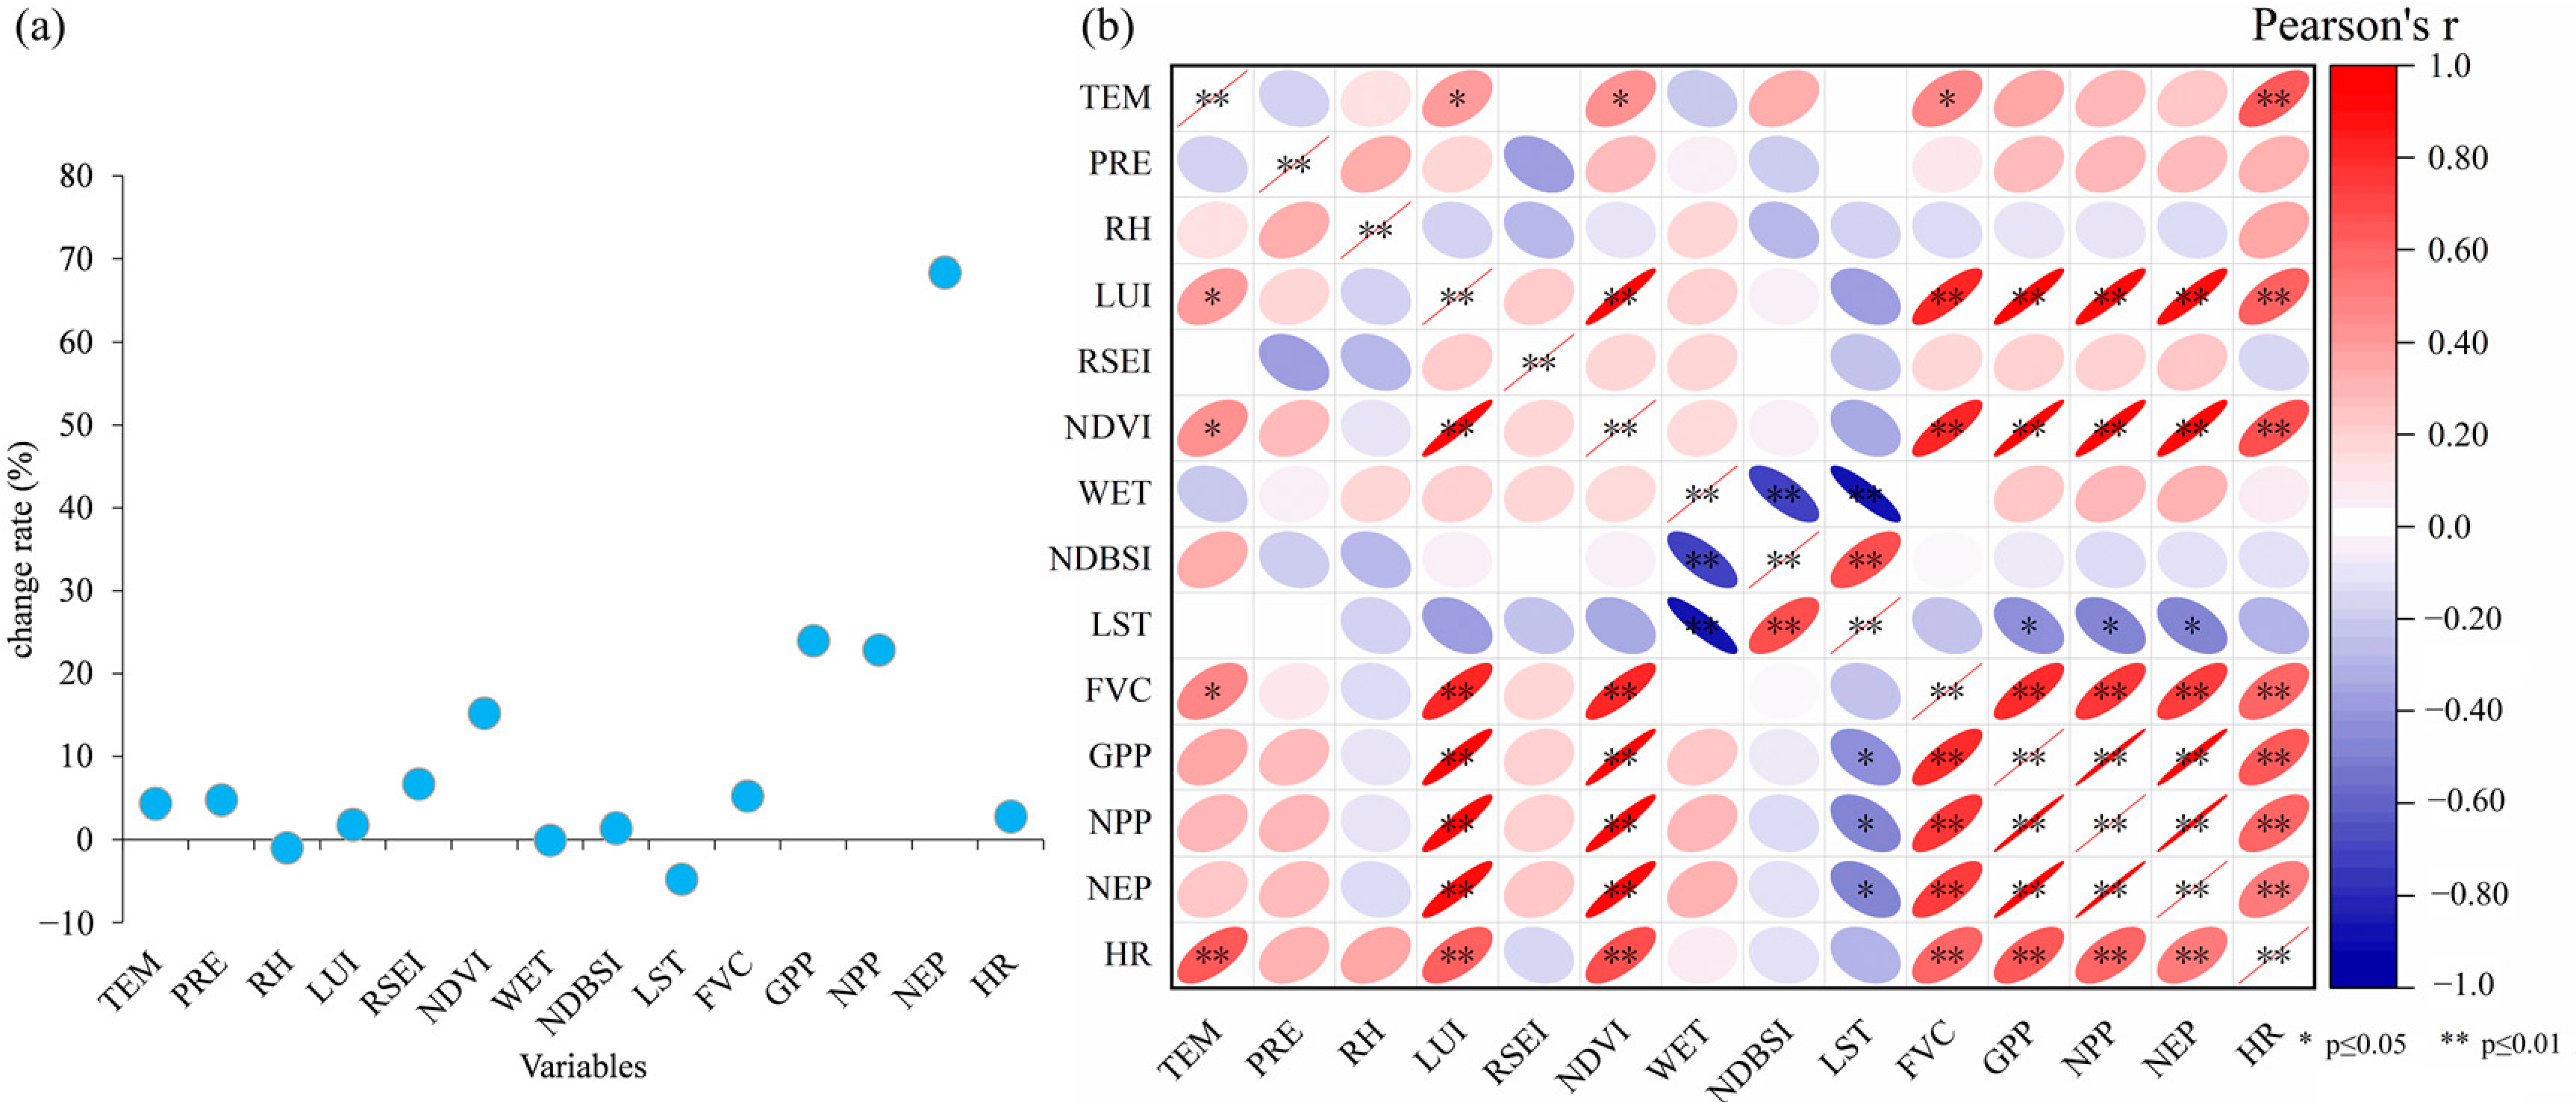
Vegetation coverage was the core factor enhancing carbon sinks on the Loess Plateau. The NDVI showed a highly significant positive correlation with GPP (r = 0.97, p < 0.01), NPP (r = 0.95, p < 0.01), and NEP (r = 0.94, p < 0.01). FVC also exhibited highly significant positive correlations with these three parameters (r = 0.80, 0.78, 0.76, respectively; p < 0.01). From 2002 to 2024, the NDVI increased by 118% and FVC grew by 7.56%. The enhancement of vegetation photosynthetic capacity, through increased Absorbed Photosynthetically Active Radiation (APAR) and optimized light use efficiency (ε), drove the growth of GPP and NPP, laying the foundation for the rise in NEP.
To examine whether the high correlations between vegetation indices and carbon productivity indicators are driven primarily by shared long-term trends, we performed detrended correlation analysis. Linear trends were removed from each time series (2002–2024) by regressing each variable against year and retaining the residuals. The detrended correlation between the NDVI and NEP was r = 0.62 (p < 0.01), which remains statistically significant although lower than the raw correlation (r = 0.94). Similarly, detrended correlations between the NDVI and GPP (r = 0.69, p < 0.01) and between NDVI and NPP (r = 0.64, p < 0.01) were also significant. These results confirm that the association between vegetation cover and carbon sink capacity is not merely an artifact of concurrent long-term trends, although the trends do contribute to the magnitude of the raw correlations.
Hydrothermal conditions were key supporting factors for carbon sinks: WET was positively correlated with NEP (r = 0.31) and highly significantly negatively correlated with LST (r = −0.87, p < 0.01). The mean WET increased by 10.20% from 2002 to 2024, which not only promoted vegetation growth but also reduced the temperature sensitivity of HR. Concurrently, LST decreased at a rate of 0.062 °C per decade (with significant cooling in Sub-regions A and B), mitigating the inhibitory effect of high temperatures on photosynthetic efficiency. This formed a virtuous cycle of ‘increased wetness–decreased temperature–enhanced carbon sink’. Furthermore, HR was positively correlated with both air temperature and precipitation (r = 0.65 and 0.34, respectively), with temperature having a more significant influence on HR. Although both temperature and precipitation have increased since 2002, GPP and NPP continued to grow, NEP increased significantly, and despite a notable rise in HR, the regional carbon sink capacity still persistently strengthened.
Surface dryness was a positive regulatory factor for carbon sink transformation. NDBSI showed negative correlations with ecosystem NDVI, GPP, NPP, NEP, and HR. It exhibited a particularly significant negative correlation with WET (r = −0.74, p < 0.01) but a highly significant positive correlation with LST (r = 0.67, p < 0.01). This indicates that a decrease in surface dryness enhances ecosystem wetness and the carbon sequestration capacity of the surface ecosystem. From 2002 to 2024, NDBSI decreased by 48.6%, leading to a contraction in the proportion of bare and degraded land. This reduction not only lowered surface albedo and optimized the heat balance but also minimized the loss of soil organic carbon caused by wind and water erosion, promoting the transformation of potential carbon source areas into carbon sink areas. This reflects the transition of the ecosystem from a “vulnerable type” to a “recovering type.” With ecological management on the Loess Plateau, including the Grain-for-Green and afforestation projects, the ecosystem has shown a positive development trend characterized by “reduced dryness and enhanced vegetation” since 2002.
The coupling of regional and topographic effects further intensified regional differences in carbon sinks (Figure 11). Sub-regions A (focus of Grain-for-Green) and D (focus of Natural Forest Protection), benefiting from long-term ecological projects, saw synchronized improvements in vegetation coverage (NDVI increased from 0.29 to 0.61 and from 0.35 to 0.65, respectively) and moisture conditions. The enhanced soil water retention capacity in the river–valley plains of Sub-region D further strengthened vegetation carbon sequestration efficiency. In Sub-region B, the high proportion of steep slopes (>35°) and severe soil erosion slowed the growth rate of carbon sinks. Sub-region C experienced slow improvement in carbon sink capacity due to its low base NDVI value (0.55 in 2024), a limited decrease in NDBSI (only 2%), combined with enhanced soil respiration driven by agricultural activities.

4. Discussion

4.1. Coupling Relationship Between Ecosystem Carbon Sink Function and Ecological Quality

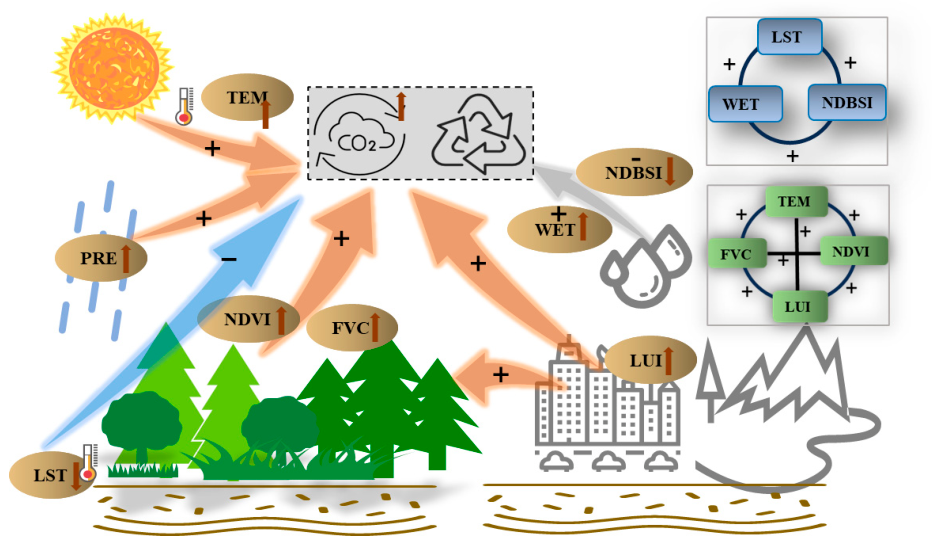
As a typical ecologically fragile region in China, the dynamics of vegetation carbon sources/sinks on the Loess Plateau are of great significance for regional and even national carbon balance. In recent decades, vegetation carbon storage in this region has shown a significant increasing trend [28]. Net Ecosystem Productivity (NEP) has been persistently growing, with carbon sink areas continuously expanding and exhibiting a distribution characteristic of “higher in the south, lower in the north”. This change is driven by multiple factors (Figure 12). Among them, ecological projects such as the Grain-for-Green Program and soil-water conservation have been key to improving ecological quality and increasing carbon storage in the region by enhancing vegetation coverage [14,28]. Concomitantly, increases in suitable precipitation and favorable temperature conditions have provided a beneficial natural environment for vegetation growth, promoting carbon sequestration [29,30].
Recent studies have further elucidated the mechanisms underlying this coupling. Ran et al. (2023) demonstrated that reduced terrestrial-aquatic carbon transfer through soil conservation substantially enhanced the landscape carbon sink in the Loess Plateau [23]. Our results corroborate this finding: we observed a 48.59% decrease in NDBSI and a 10.2% increase in WET from 2002 to 2024, jointly contributing to the observed carbon sink expansion. These changes indicate that soil and water conservation measures not only reduce erosion but also enhance the retention of organic carbon within the terrestrial system [8]. Similarly, Zhang et al. (2025) highlighted that vegetation greening driven by both natural and anthropogenic factors has significantly contributed to carbon sink enhancement on the Loess Plateau [18]. Our correlation analysis (NDVI vs. NEP: r = 0.94, p < 0.01) aligns with these findings, but we further extend the knowledge by quantifying the relative contributions of hydrothermal and surface factors using a geographical detector approach and by performing detrended correlation analysis to avoid spurious trends.
Notably, this study found that areas with high carbon sequestration spatially overlapped significantly with areas exhibiting high values of the RSEI and NDVI. These high-value areas were consistently located in Sub-region D, reflecting a tight coupling relationship between ecological quality and carbon sink function. Correlation analysis also revealed highly significant positive relationships between NDVI/FVC and GPP, NPP, and NEP. From 2002 to 2024, vegetation recovery on the Loess Plateau was remarkable. The synchronous increase in the NDVI and FVC, particularly the continuous rise in vegetation coverage in Sub-regions A and B, provided ecological support for the enhancement of regional carbon sinks. Although improvements were relatively slower in Sub-regions C and D, their persistent upward trends indicate considerable potential for ecological restoration. During the study period, the NDVI increased by 118%. The enhancement of vegetation photosynthetic capacity, achieved by increasing the absorption of photosynthetically active radiation and optimizing light use efficiency, directly drove the growth of ecosystem productivity. This confirms the fundamental pathway through which ecological projects strengthen carbon sink function via vegetation restoration.
From 2002 to 2024, the annual change rate of WET reached a maximum of 0.0217 yr−1 and a minimum of −0.02 yr−1, with a mean showing a slight increase of 0.0004 yr−1. This reflects an overall slow improvement in the supportive role of moisture conditions for carbon sinks on the Loess Plateau, albeit with significant regional disparities. The rate of moisture improvement in Sub-regions C, A, and B was much higher than in Sub-region D. Spatially, changes in wetness exhibited clear regional heterogeneity. In Sub-regions C, A, and B, where WET improved more noticeably, the limiting effect of water conditions on vegetation growth weakened, thereby strengthening carbon sink capacity. Conversely, the slight decrease in WET in Sub-region D may lead to water constraints on vegetation growth in localized areas, limiting the potential for carbon sink enhancement. The increase in WET coupled with the decrease in LST formed a virtuous cycle of ‘increased wetness–decreased temperature–enhanced carbon sink’. This synergy has been suggested in previous studies [31,32], but we provide the first quantitative characterization across a continuous 23-year period with annual resolution. On one hand, improved moisture and cooler temperatures directly promote vegetation growth [33]. On the other hand, they reduce the temperature sensitivity of heterotrophic respiration and alleviate high-temperature inhibition of photosynthesis [34]. Together, these effects ensure a continuous increase in the net ecosystem carbon sink, even though heterotrophic respiration has risen under the warming climate, because the increase in vegetation productivity outweighs the respiration loss [35].
The substantial decrease in NDBSI further optimized conditions for ecosystem carbon sinks. The significant correlations between NDBSI and both WET and LST indicate that reduced surface dryness helps maintain ecosystem wetness, alleviates thermal stress, and concurrently minimizes the loss of soil organic carbon. This promotes the transformation of potential carbon source areas into carbon sink areas, embodying a positive shift in the ecosystem from a ‘vulnerable type’ to a ‘recovering type’.

4.2. Validation of Driving Factors for Ecological Quality Evolution and Policy Implications

Understanding the factors that drive ecological quality and carbon sink dynamics is essential for adaptive ecosystem management. Our geographical detector analysis, expanded to include three time points (2002, 2012, 2024), reveals a gradual shift in dominant factors over the 22-year period. The q-value of elevation decreased from 0.32 in 2002 to 0.18 in 2024, while those of precipitation and temperature increased from 0.07 and 0.05 to 0.35 and 0.38, respectively. This monotonic trend indicates that while topography initially constrained ecological recovery, climatic factors have become increasingly important as vegetation cover improved [12,30]. This finding is consistent with recent studies in the Yellow River Basin, which have shown that climate change is playing a growing role in regulating vegetation dynamics and carbon cycling [30,36].
The increasing explanatory power of Land Use Intensity (LUI) (from 0.01 to 0.13) reflects the deepening impact of human activities on ecological patterns. This is particularly evident in Sub-region B, where, as shown in Figure 2, ecological conditions have improved; intensive soil and water conservation measures have been implemented, leading to substantial ecological improvement over the long term [8]. The Grain-for-Green Program, initiated in 1999, has been widely recognized as a key driver of vegetation recovery on the Loess Plateau [4,31]. Our results confirm that areas with higher LUI (i.e., cropland conversion to forest/grassland) show significantly greater improvement in RSEI and NEP. However, the interaction detection results indicate that the influence of human activities is often mediated by natural factors. For example, the interaction between LUI and precipitation showed a q-value of 0.48 in 2024, higher than either factor alone, suggesting that ecological projects are more effective in areas with favorable climatic conditions.
Detrended correlation analysis provides additional insights into the relationships between key variables. After removing long-term trends, the NDVI remained significantly correlated with GPP (r = 0.69, p < 0.01), NPP (r = 0.64, p < 0.01), and NEP (r = 0.62, p < 0.01), confirming that the association is not merely an artifact of concurrent greening and carbon sink trends. This finding is important because previous studies have been criticized for reporting inflated correlations due to shared trends [37]. Our results suggest that while trends amplify the correlation, a genuine mechanistic relationship exists between vegetation cover and carbon sequestration.
In summary, the evolution of ecological quality on the Loess Plateau from 2002 to 2024 resulted from the combined effects of natural recovery and human intervention. Early ecological restoration relied more on vegetation reconstruction under topographic constraints. As ecological projects advanced and climate change intensified, the influences of climatic factors and human activities have become increasingly prominent. Future strategies for ecological protection and restoration should focus on strengthening climate change adaptation management and rationally regulating land use intensity, based on consolidating the achievements in vegetation construction. This integrated approach is essential for enhancing the stability and sustainability of the ecosystem in a changing environment.

4.3. Uncertainties, Limitations, and Future Directions

While this study provides robust evidence for the coupling between ecological quality and carbon sink dynamics on the Loess Plateau, several limitations should be acknowledged. First, our carbon sink estimation using NEP = NPP − HR relies on empirical equations for HR that may not fully capture the complexity of soil carbon dynamics [15,16]. Heterotrophic respiration is influenced by multiple factors beyond temperature and precipitation, including soil texture, organic matter composition, and microbial community structure [29]. Future studies should incorporate more sophisticated soil carbon models or field measurements to improve accuracy. Another limitation concerns the comparability of RSEI across years when calculated separately for each period. To overcome this issue, we adopted a multi-temporal integrated PCA approach: the normalized indicators from all three periods (2002, 2012, 2024) were stacked into a single dataset, and PCA was performed once. This ensures that all years are projected onto the same feature space, with consistent loadings and component interpretation. Unified normalization was then applied using global minimum and maximum values, and fixed classification thresholds (0.2, 0.4, 0.6, 0.8) were used for ecological grading. These procedures guarantee that the observed temporal changes in the RSEI reflect genuine ecological dynamics rather than artifacts of varying PCA structures [38]. Nevertheless, future studies may further explore alternative strategies (e.g., using a longer reference period for normalization) to enhance robustness under different environmental contexts.
Second, the spatial resolution of 500 m may not capture fine-scale heterogeneity in ecological quality and carbon sinks, particularly in areas with complex topography [10,12]. Higher-resolution data like Landsat could reveal patterns that are obscured at MODIS resolution. However, the long-term (2002–2024) and continuous nature of our dataset would be difficult to replicate with higher-resolution sensors due to data availability and processing constraints. The GEE platform offers opportunities for integrating multi-sensor data, which could be explored in future research.
Third, the lack of explicit consideration of extreme climate events is a limitation. Recent studies have shown that extreme events can significantly affect carbon sink stability [39,40]. While our analysis captures interannual variability, a more focused examination of how extreme events alter the coupling between ecological quality and carbon sinks would be valuable. Similarly, the role of carbon emissions from soil erosion, which is particularly relevant on the Loess Plateau [8], was not directly quantified in our study.
Looking forward, several research directions emerge from this study. First, the development of early warning systems for carbon sink stability in the face of climate extremes is urgently needed. Second, the integration of remote sensing data with process-based ecosystem models could improve our ability to project future carbon sink trajectories under different climate and management scenarios. Third, the application of machine learning approaches could help disentangle the complex, non-linear interactions among driving factors [41]. Fourth, raw correlations are inflated by shared trends, and future lagged analyses could further explore temporal dynamics.
Despite these limitations, this study provides a comprehensive and methodologically rigorous assessment of the coupling between ecological quality and carbon sink dynamics on the Loess Plateau. The findings contribute to the scientific basis for ecological protection and high-quality development in the Yellow River Basin, and the methodological framework can be applied to other ecologically fragile regions globally.

5. Conclusions

Based on multi-source remote sensing data from 2002 to 2024, this study systematically analyzed the spatiotemporal dynamics of ecological quality and vegetation carbon sink capacity on the Loess Plateau. The main conclusions are as follows:
(1)
Ecological quality improved significantly, with Sub-regions A, B, and D all showing clear recovery, driven by a synergistic pattern of reduced surface dryness, increased wetness, and enhanced vegetation restoration.
(2)
Carbon sink capacity strengthened markedly, as reflected by the expansion of carbon sink areas from 64.40% to 84.51% and the sustained growth of GPP, NPP, and NEP.
(3)
The southeast regions (A and D) are core carbon sink zones, while the northwest (B and C) remains ecologically fragile. Ecological restoration projects, especially in key soil loss areas, have effectively driven the transition from a vulnerable to a recovering ecosystem.
The results of this study expand the carbon accounting database for the carbon storage capacity of forest and grassland ecosystems under different altitudes and vegetation types on the Loess Plateau. They provide scientific support for formulating targeted regional carbon enhancement initiatives and for improving the carbon sequestration potential of ecosystems.

Author Contributions

Conceptualization, Y.X. and Q.Z.; methodology, Y.X.; software, Q.Z.; validation, Y.L. (Yang Lu) and Y.L. (Yunfang Li); formal analysis, Y.X.; investigation, Y.X.; resources, Y.L. (Yang Lu); data curation, Y.L. (Yunfang Li); writing—original draft preparation, Y.X.; writing—review and editing, Q.Z.; visualization, Y.L. (Yang Lu); supervision, Q.Z.; project administration, Y.X.; funding acquisition, Y.X. and Q.Z. All authors have read and agreed to the published version of the manuscript.

Funding

This research was funded by the Philosophy and Social Sciences Research Project of Shanxi Province (2025YB092), Research Fund of Arid Meteorology (IAM202407); and the Fundamental Research Program of Shanxi Province (202203021212497).

Data Availability Statement

The original contributions presented in this study are included in the article. Further inquiries can be directed to the corresponding author.

Conflicts of Interest

The authors declare no conflicts of interest.

References

  1. Cui, Z.; Jiang, H.; Zou, L.; Wu, J.; Yin, H. Spatiotemporal evolution and driving mechanisms of habitat quality on the Loess Plateau. Sci. Rep. 2025, 15, 37771. [Google Scholar] [CrossRef] [Scilit]
  2. Sun, C.; Li, J.; Liu, Y.; Cao, L.; Zheng, J.; Yang, Z.; Ye, J.; Li, Y. Ecological quality assessment and monitoring using a time-series remote sensing-based ecological index (ts-RSEI). GIScience Remote Sens. 2022, 59, 1793–1816. [Google Scholar] [CrossRef] [Scilit]
  3. Zhang, Q.; Chen, Y.; Li, Z.; Sun, C.; Xiang, Y.; Liu, Z. Spatio-Temporal Development of Vegetation Carbon Sinks and Sources in the Arid Region of Northwest China. Int. J. Environ. Res. Public Health 2023, 20, 3608. [Google Scholar] [CrossRef] [Scilit]
  4. Zhang, L.; Li, X.; Liu, X.; Lian, Z.; Zhang, G.; Liu, Z.; An, S.; Ren, Y.; Li, Y.; Liu, S. Dynamic monitoring and drivers of ecological environmental quality in the Three-North region, China: Insights based on remote sensing ecological index. Ecol. Inform. 2025, 85, 102936. [Google Scholar] [CrossRef] [Scilit]
  5. Ruehr, S.; Keenan, T.F.; Williams, C.; Zhou, Y.; Lu, X.; Bastos, A.; Canadell, J.G.; Prentice, I.C.; Sitch, S.; Terrer, C. Evidence and attribution of the enhanced land carbon sink. Nat. Rev. Earth Environ. 2023, 4, 518–534. [Google Scholar] [CrossRef] [Scilit]
  6. Wang, A.; Zha, T.; Zhang, Z. Variations in soil organic carbon storage and stability with vegetation restoration stages on the Loess Plateau of China. Catena 2023, 228, 107142. [Google Scholar] [CrossRef] [Scilit]
  7. Liu, L.; Qiao, J.; Li, M.; Dun, Y.; Zhu, X.; Ji, X. Is soil an organic carbon sink or source upon erosion, transport and deposition? Eur. J. Soil Sci. 2023, 74, e13344. [Google Scholar] [CrossRef] [Scilit]
  8. Guan, Y.; Yang, S.; Wang, J.; Bai, J.; Liu, X.; Zhao, C.; Lou, H.; Chen, K. Effects of varying the spatial configuration and scale of terraces on water and sediment loss based on scenario simulation within the Chinese Loess Plateau. Sci. Total Environ. 2023, 880, 163182. [Google Scholar] [CrossRef] [Scilit] [PubMed]
  9. Qin, Z.; Zhu, Y.; Canadell, J.G.; Chen, M.; Li, T.; Mishra, U.; Yuan, W. Global spatially explicit carbon emissions from land-use change over the past six decades (1961–2020). One Earth 2024, 7, 835–847. [Google Scholar] [CrossRef] [Scilit]
  10. Liu, Q.; Qiao, J.; Li, M.; Dun, Y.; Zhu, X.; Ji, X. Spatiotemporal evolution of ecological environmental quality and its dynamic relationships with landscape pattern in the Zhengzhou Metropolitan Area: A perspective based on nonlinear effects and spatiotemporal heterogeneity. J. Clean. Prod. 2024, 480, 144102. [Google Scholar] [CrossRef] [Scilit]
  11. Qi, S.; Zhang, H.; Zhang, M. Net Primary Productivity Estimation of Terrestrial Ecosystems in China with Regard to Saturation Effects and Its Spatiotemporal Evolutionary Impact Factors. Remote Sens. 2023, 15, 2871. [Google Scholar] [CrossRef] [Scilit]
  12. Qin, G.; Wang, N.; Wu, Y.; Zhang, Z.; Meng, Z.; Zhang, Y. Spatiotemporal variations in eco-environmental quality and responses to drought and human activities in the middle reaches of the Yellow River basin, China from 1990 to 2022. Ecol. Inform. 2024, 81, 102641. [Google Scholar] [CrossRef] [Scilit]
  13. Yan, Y.; Zhuang, Q.; Zan, C.; Ren, J.; Yang, L.; Wen, Y.; Zeng, S.; Zhang, Q.; Kong, L. Using the Google Earth Engine to rapidly monitor impacts of geohazards on ecological quality in highly susceptible areas. Ecol. Indic. 2021, 132, 108258. [Google Scholar] [CrossRef] [Scilit]
  14. Zhang, C.; Wang, Z.; Wang, J.; Ding, X.; Peng, Y. Spatial Differentiation of Ecological Environment Quality and the Influencing Factors in Cities Within the Beijing–Tianjin–Hebei Region Based on LCZ and RSEI. IEEE J. Sel. Top. Appl. Earth Obs. Remote Sens. 2025, 18, 15477–15494. [Google Scholar] [CrossRef] [Scilit]
  15. Kan, A.; Xiang, Q.; Li, G.; Yang, X.; Dong, X.; Qimiciren; Dong, J. Quantifying ecosystem disturbances in nature reserves using satellite observational data and revealing their constraints on carbon sequestration potential. Hum. Ecol. Risk Assess. Int. J. 2025, 31, 718–734. [Google Scholar] [CrossRef] [Scilit]
  16. Zhu, S.; Gou, M.; Jian, Z.; Jiang, C.; Chen, H.; Hu, R.; Zhao, H.; Liu, C.; Xiao, W. Carbon stock assessment using machine learning based modeling in Pinus massoniana plantations. Trees For. People 2025, 22, 101043. [Google Scholar] [CrossRef] [Scilit]
  17. Eldhose, E.; Ghosh, S. Exploration of synergistic and redundant information sharing from hydrometeorological variables to net ecosystem exchange. Environ. Res. Lett. 2025, 20, 074024. [Google Scholar] [CrossRef] [Scilit]
  18. Zhang, Y.; Wang, Z.; Shi, X.; Sun, P.; Xiao, P.; Xu, J.; Shen, D. Impacts of climate change and vegetation greening driven by natural and anthropogenic factors on carbon sink in Chinese Loess Plateau after ecological restoration. Catena 2025, 258, 109310. [Google Scholar] [CrossRef] [Scilit]
  19. Liao, Z.; Zhou, B.; Zhu, J.; Jia, H.; Fei, X. A critical review of methods, principles and progress for estimating the gross primary productivity of terrestrial ecosystems. Front. Environ. Sci. 2023, 11, 1093095. [Google Scholar] [CrossRef] [Scilit]
  20. Wei, Q.; Xue, L.; Jia, Z.; Chen, Y.; Chen, P. Assessing net primary productivity variation and potential future impacts based on machine learning and contribution analysis in the Yangtze River Delta, China. Sci. Total Environ. 2025, 989, 179886. [Google Scholar] [CrossRef] [Scilit] [PubMed]
  21. Feng, Q.; Zhou, Z.; Chen, Q.; Zhu, C.; Zhu, M.; Luo, W.; Wang, J. Quantifying the extent of ecological impact from China’s poverty alleviation relocation program: A case study in Guizhou Province. J. Clean. Prod. 2024, 444, 141274. [Google Scholar] [CrossRef] [Scilit]
  22. Wang, M.; Hu, Z.; Wang, X.; Li, X.; Wang, Y.; Liu, H.; Han, C.; Cai, J.; Zhao, W. Spatio-Temporal Variation of Carbon Sources and Sinks in the Loess Plateau under Different Climatic Conditions and Land Use Types. Forests 2023, 14, 1640. [Google Scholar] [CrossRef] [Scilit]
  23. Ran, L.; Fang, N.; Wang, X.; Piao, S.; Chan, C.N.; Li, S.; Zeng, Y.; Shi, Z.; Tian, M.; Xu, Y.J.; et al. Substantially Enhanced Landscape Carbon Sink Due To Reduced Terrestrial-Aquatic Carbon Transfer Through Soil Conservation in the Chinese Loess Plateau. Earth’s Future 2023, 11, e2023EF003602. [Google Scholar] [CrossRef] [Scilit]
  24. National Geospatial-Intelligence Agency (NGA). Department of Defense World Geodetic System 1984: Its Definition and Relationships with Local Geodetic Systems; NGA Technical Report TR8350.2, 3rd ed.; National Geospatial-Intelligence Agency (NGA): Springfield, VA, USA, 2000.
  25. EPSG:32648; EPSG Geodetic Parameter Dataset: WGS 84/UTM zone 48N. EPSG Registry. Open Geospatial Consortium (OGC)/International Association of Oil & Gas Producers (IOGP): London, UK, 2011.
  26. Liu, Y.; Meng, Q.; Zhang, L.; Wu, C. NDBSI: A normalized difference bare soil index for remote sensing to improve bare soil mapping accuracy in urban and rural areas. Catena 2022, 214, 106265. [Google Scholar] [CrossRef] [Scilit]
  27. Wang, J.; Zhang, T.; Fu, B. A measure of spatial stratified heterogeneity. Ecol. Indic. 2016, 67, 250–256. [Google Scholar] [CrossRef] [Scilit]
  28. Yang, Y.; Liu, L.; Zhang, P.; Wu, F.; Wang, Y.; Xu, C.; Zhang, L.; An, S.; Kuzyakov, Y. Large-scale ecosystem carbon stocks and their driving factors across Loess Plateau. Carbon Neutrality 2023, 2, 5. [Google Scholar] [CrossRef] [Scilit]
  29. Liao, J.; Yang, X.; Dou, Y.; Wang, B.; Xue, Z.; Sun, H.; Yang, Y.; An, S. Divergent contribution of particulate and mineral-associated organic matter to soil carbon in grassland. J. Environ. Manag. 2023, 344, 118536. [Google Scholar] [CrossRef] [Scilit]
  30. Gou, F.; Liang, W.; Fu, B.; Chen, N.; Zhang, W.; Jin, Z.; Yan, J.; Lv, Y.; Mo, X.; Gao, N. Regional variations in vegetation greening and climate change impacts on gross primary productivity and evapotranspiration in the Loess Plateau. Agric. For. Meteorol. 2025, 373, 110757. [Google Scholar] [CrossRef] [Scilit]
  31. Chen, S.; Zhang, Q.; Chen, Y.; Zhou, H.; Xiang, Y.; Liu, Z.; Hou, Y. Vegetation Change and Eco-Environmental Quality Evaluation in the Loess Plateau of China from 2000 to 2020. Remote Sens. 2023, 15, 424. [Google Scholar] [CrossRef] [Scilit]
  32. He, J.; Zhou, W.; Qian, M.; Cao, A.; Zha, E.; Shi, X. Mechanisms of ecosystem function enhancement under land ecosystem restoration patterns and responses to multiple scenarios: A complex network approach. Land Use Policy 2025, 158, 107764. [Google Scholar] [CrossRef] [Scilit]
  33. Wang, Z.; Fu, B.; Wu, X.; Li, Y.; Feng, Y.; Wang, S.; Wei, F.; Zhang, L. Vegetation resilience does not increase consistently with greening in China’s Loess Plateau. Commun. Earth Environ. 2023, 4, 336. [Google Scholar] [CrossRef] [Scilit]
  34. Zhang, J.; Zhang, B.; Wang, X.; Yang, F.; Zhao, X.; Cheng, Y. Revegetation Rebalances Water Resources by Enhancing Rainwater to Increase Vegetation Carrying Capacity in China’s Loess Plateau. Water Resour. Res. 2026, 54, e2025WR040307. [Google Scholar] [CrossRef] [Scilit]
  35. Ding, Z.; Peng, J.; Qiu, S.; Zhao, Y. Nearly Half of Global Vegetated Area Experienced Inconsistent Vegetation Growth in Terms of Greenness, Cover, and Productivity. Earth’s Future 2020, 8, e2020EF001618. [Google Scholar] [CrossRef] [Scilit]
  36. Hou, X.; Zhang, B.; He, Q.; Shao, Z.; Yu, H.; Zhang, X. Spatial–Temporal Variations in the Climate, Net Ecosystem Productivity, and Efficiency of Water and Carbon Use in the Middle Reaches of the Yellow River. Remote Sens. 2024, 16, 3312. [Google Scholar] [CrossRef] [Scilit]
  37. Meng, H.; Qian, L. Performances of different yield-detrending methods in assessing the impacts of agricultural drought and flooding: A case study in the middle-and-lower reach of the Yangtze River, China. Agric. Water Manag. 2024, 296, 108812. [Google Scholar] [CrossRef] [Scilit]
  38. Tian, Y.; Wu, Z.; Liu, K.; Li, M. Dynamic assessment of ecological quality in China from 2000 to 2024 based on artificial intelligence. J. Hydrol. 2026, 666, 134849. [Google Scholar] [CrossRef] [Scilit]
  39. Gu, L.; Schumacher, D.L.; Fischer, E.M.; Slater, L.J.; Yin, J.; Sippel, S.; Chen, J.; Liu, P.; Knutti, R. Flash drought impacts on global ecosystems amplified by extreme heat. Nat. Geosci. 2025, 18, 709–715. [Google Scholar] [CrossRef] [Scilit]
  40. Shi, L.; He, H.; Zhang, L.; Wang, J.; Ren, X.; Yu, G.; Hou, P.; Gao, J.; Chen, B.; Qin, K.; et al. Stability of China’s terrestrial ecosystems carbon sink during 2000–2020. Resour. Conserv. Recycl. 2025, 212, 108007. [Google Scholar] [CrossRef] [Scilit]
  41. Zhang, Y.; Kasimu, A.; Song, N.; Tang, L. Analysis of spatiotemporal variations and driving mechanisms of ecosystem health in arid oasis urban agglomerations using machine learning. Ecol. Indic. 2026, 182, 114504. [Google Scholar] [CrossRef] [Scilit]
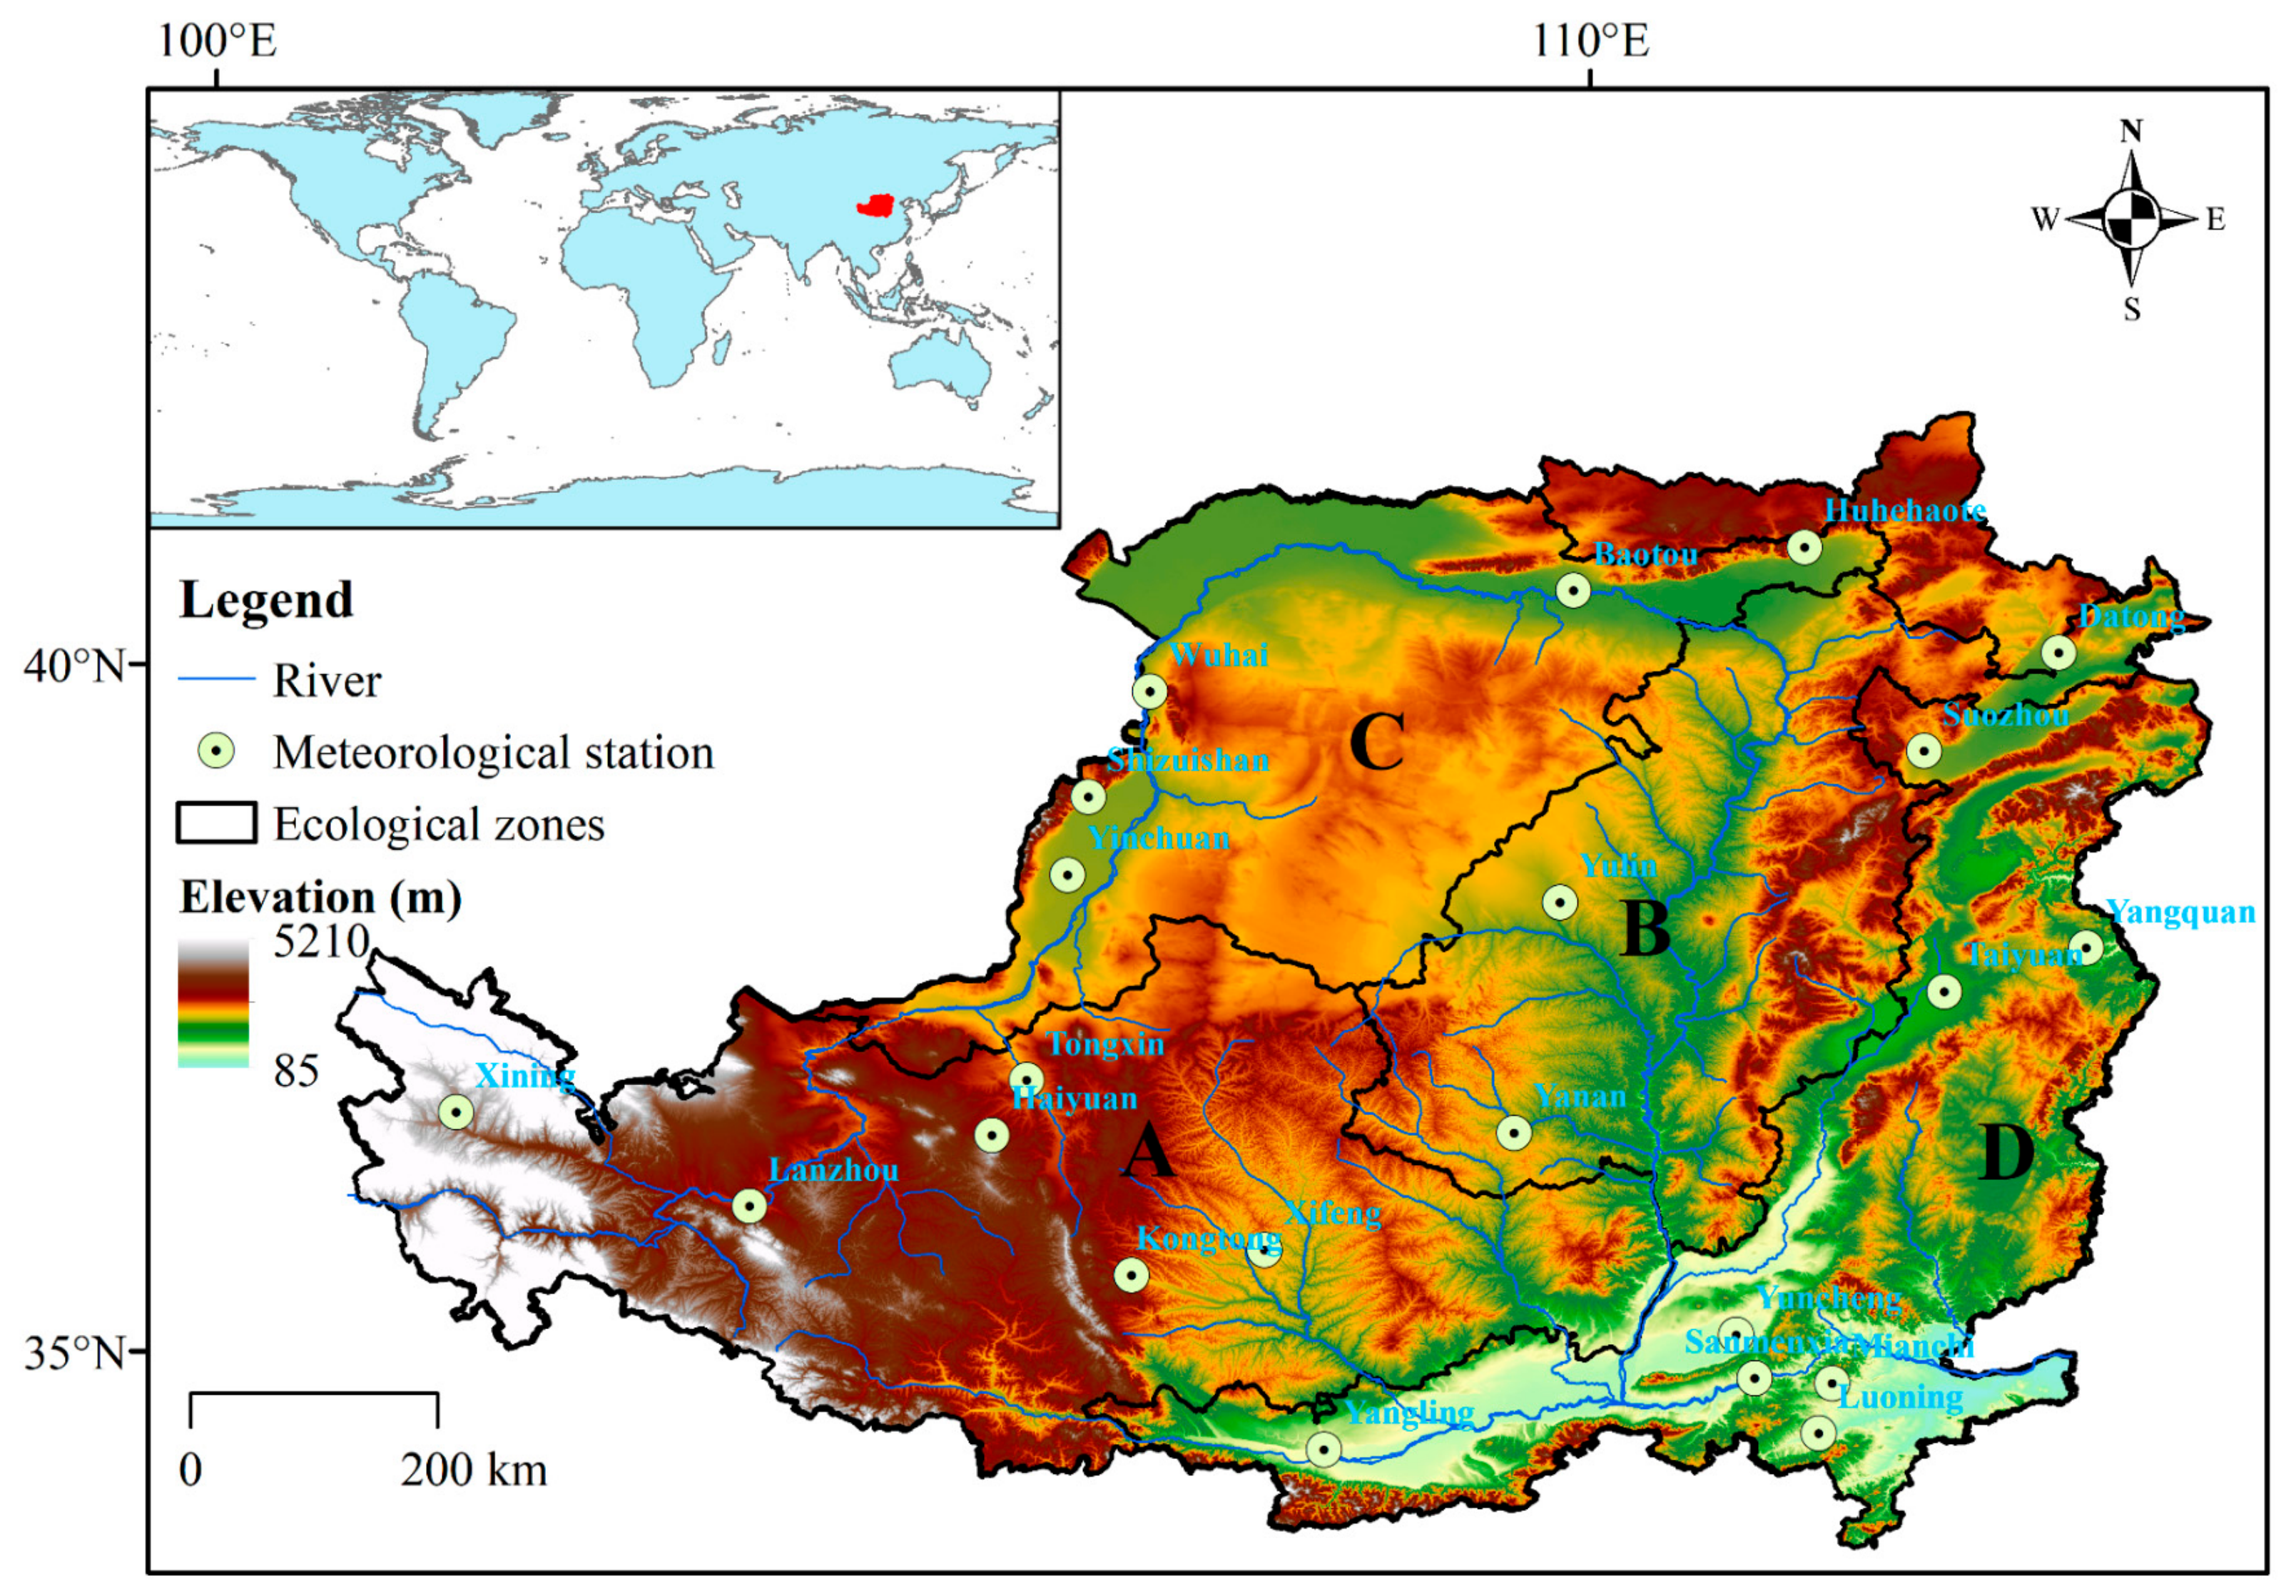
Figure 1. Location and geographic characteristics of the Loess Plateau. Note: A—loess tableland and gully region; B—loess hilly and gully region; C—sandy land and agricultural irrigation region; D—earth–rock mountainous and river–valley plain region.
Remotesensing 18 01412 g001
Figure 2. Spatial distribution and variation characteristics of the RSEI in the Loess Plateau from 2002 to 2024: RSEI spatial distribution in (a) 2002, (b) 2012, and (c) 2024.
Remotesensing 18 01412 g002
Figure 3. Temporal variations in GPP, NPP, NEP and HR in the Loess Plateau during 2002–2024. (a) temporal variations in GPP, NPP, NEP and HR; (b) distribution of annual average of GPP, NPP, NEP and HR during the periods of 2002–2012 and 2013–2024.
Remotesensing 18 01412 g003
Figure 4. Spatial distribution and variations in GPP, NPP, NEP and HR in the Loess Plateau during 2002–2024.
Remotesensing 18 01412 g004
Figure 5. Spatial distribution characteristics of NEP across different elevation (a) and slope gradients (b) in the Loess Plateau from 2002 to 2024.
Remotesensing 18 01412 g005
Figure 6. Spatial distribution and variations in the NDVI and FVC in the Loess Plateau during 2002–2024. (a,b) Spatial distribution of the NDVI during 2002 and 2024; (d,e) spatial distribution of FVC during 2002 and 2024; (c,f) spatial variations in the NDVI and FVC.
Remotesensing 18 01412 g006
Figure 7. Spatial distribution and variations in WET in the Loess Plateau during 2002–2024. (a,b) spatial distribution of WET during 2002 and 2024; (c) spatial trend of WET; (d) temporal variations in WET.
Remotesensing 18 01412 g007
Figure 8. Spatial distribution and variations in NDBSI in the Loess Plateau during 2002–2024. (ad) spatial distribution of NDBSI in 2002, 2012, 2024 and average; (e) spatial trend of NDBSI; (f) temporal variations in NDBSI.
Remotesensing 18 01412 g008
Figure 9. Spatial distribution and variations in LST in the Loess Plateau during 2002–2024. (ad) spatial distribution of LST in 2002, 2012, 2024 and average; (e) spatial trend of LST; (f) temporal variations in LST.
Remotesensing 18 01412 g009
Figure 10. Interactive detection results of geographic detector in the Loess Plateau in 2002 (a), 2012 (b), and 2024 (c).
Remotesensing 18 01412 g010
Figure 11. Variations and correlation of ecological and climatic variables in the Loess Plateau during 2002–2024. (a) Change rates and (b) correlation of TEM, PRE, RH, LUI, RSEI, NDVI, NDBSI, LST, FVC, GPP, NPP, NEP and HR.
Remotesensing 18 01412 g011
Figure 12. Schematic Diagram of Coupling Relationship between Ecosystem Carbon Sink Function and Ecological Quality. “+” indicates a positive correlation, while “−” indicates a negative correlation. The upward red arrow indicates an upward trend, while the downward red arrow indicates a downward trend.
Remotesensing 18 01412 g012
Table 1. Data product type and source.
DataVariableSpatial ResolutionTemporal ResolutionData Source
MOD13A1NDVI500 m16 dhttps://modis.gsfc.nasa.gov/
(accessed on 15 April 2025)
MOD09A1SR500 m8 dhttps://modis.gsfc.nasa.gov/
(accessed on 15 April 2025)
MOD11A2LST1 km8 dhttps://modis.gsfc.nasa.gov/
(accessed on 15 April 2025)
MCD12Q1LCT500 mYearlyhttps://modis.gsfc.nasa.gov/
(accessed on 15 April 2025)
MOD17A3HGPP500 mYearlyhttps://modis.gsfc.nasa.gov/
(accessed on 3 August 2025)
MOD17A3HNPP500 mYearlyhttps://modis.gsfc.nasa.gov/
(accessed on 3 August 2025)
CRU TSV4.08Pre/Tem0.5°Monthlyhttps://crudata.uea.ac.uk/cru/data/hrg/#info
(accessed on 3 July 2025)
TerraClimateVAP/VPD4 kmMonthlyhttps://www.climatologylab.org/terraclimate.html (accessed on 3 July 2025)
SRTMDEM30 m-https://glovis.usgs.gov/
(accessed on 5 September 2025)
Note: SR (surface reference); SOL (total solar radiation); Tem (temperature); Pre (precipitation); PET (potential evapotranspiration); LCT (land cover type); VAP (Vapor pressure); VPD (Vapor pressure deficit).
Disclaimer/Publisher’s Note: The statements, opinions and data contained in all publications are solely those of the individual author(s) and contributor(s) and not of MDPI and/or the editor(s). MDPI and/or the editor(s) disclaim responsibility for any injury to people or property resulting from any ideas, methods, instructions or products referred to in the content.