Article

Daily Nighttime Lights for Rapid Post-Earthquake Damage Assessment: Multi-Scale and Azimuthal Differences from the Mw 7.7 Myanmar Earthquake

1
Institute of Seismology, China Earthquake Administration, Wuhan 430064, China
2
Hubei Key Laboratory of Earthquake Early Warning, Wuhan 430071, China
*
Author to whom correspondence should be addressed.
Remote Sens. 2026, 18(9), 1371; https://doi.org/10.3390/rs18091371
Submission received: 16 February 2026 / Revised: 23 April 2026 / Accepted: 26 April 2026 / Published: 29 April 2026

Highlights

What are the main findings?
  • Daily VIIRS nighttime lights enable stable early post-earthquake mapping of impacted areas and reveal pronounced azimuthal asymmetry within intensity zones.
  • Multi-scale analyses are complementary, with patch-based mapping better aligning with built-up objects at 500 m resolution and showing higher agreement with CEMS in well-lit urban areas.
What are the implications of the main findings?
  • Incorporating intensity and azimuth information improves the sensitivity of rapid post-earthquake damage assessment to spatial heterogeneity.
  • The proposed framework supports timely identification of severely affected areas and priority-based allocation of emergency resources.

Abstract

On 28 March 2025, a Mw 7.7 earthquake struck central Myanmar, where rapid mapping of early impacts is crucial for post-earthquake assessment and emergency response. Existing nighttime light studies often emphasize single-scale brightness loss, with limited characterization of azimuthal differences within intensity zones and their coupling with population/building exposure, although these factors are essential for explaining spatially uneven earthquake impacts and for improving the interpretation of nighttime light loss patterns. This study integrates daily VIIRS nighttime lights (500 m) with USGS intensity and population/building density to build an intensity–azimuth framework with six directional sectors, quantify pre-/post-earthquake changes at county, patch, and pixel scales, apply bivariate LISA to detect local coupling patterns, and validate against CEMS Rapid Mapping. The results show clear scale complementarity: county aggregation robustly delineates the macro impact extent but smooths internal contrasts; pixel analysis captures fragmented disturbances yet is noise-sensitive; patch-based mapping best aligns with built-up areas at 500 m resolution and shows higher agreement with CEMS in well-lit urban areas. Azimuth–intensity patterns indicate more concentrated NTL reduction in north–south high-intensity zones (NTL = −0.53–−15.67 nW·cm−2·sr−1), with local rebounds in some east–west sectors. The framework provides interpretable support for rapid loss assessment and priority-based resource allocation.

1. Introduction

As one of the most destructive natural disasters, earthquakes frequently result in significant casualties and infrastructure damage, exerting sustained and profound impacts on regional socioeconomic development [1]. The rapid, effective and objective assessment of earthquake disaster losses is crucial for rational decision-making in post-earthquake emergency response and for the formulation of targeted earthquake disaster risk prevention and mitigation measures [2,3,4,5].
Traditional earthquake damage assessment methods primarily rely on post-earthquake field surveys and statistical analysis of historical seismic records [6,7,8,9]. While these methods can provide relatively accurate damage information, their limitations were particularly evident in the 2025 Myanmar earthquake, where the affected area extended across multiple regions, and early post-earthquake field verification and damage statistics were difficult to obtain in a timely and spatially consistent manner [8,10]. In such a context, historical seismic records alone are also insufficient to capture the real-time spatial heterogeneity of earthquake impacts. In contrast, remote sensing technology, leveraging its advantages of large-scale coverage, rapid acquisition, and multi-temporal repetitive monitoring, has become a crucial tool for disaster monitoring and loss assessment [11,12,13,14]. High-resolution optical imagery, radar imagery, and other satellite remote sensing data have been extensively utilized in earthquake disaster monitoring and analysis, providing robust data support for post-earthquake damage assessment [10,15]. Nighttime Light (NTL) data, due to its strong correlation with human activity, has been widely applied in urbanization process analysis, socioeconomic indicator estimation, and natural disaster assessment [16,17,18,19]. With the advancement of daily NTL observation products, it has become feasible to identify early-affected areas and assess post-earthquake losses based on differences in nighttime light before and after seismic events [20,21,22,23,24,25,26]. Compared with optical and radar imagery, daily VIIRS nighttime light data have the advantages of frequent repeated observations, broad regional coverage, and higher sensitivity to abrupt nighttime changes in human activity and electricity-related functioning. Thus, compared with optical and radar imagery that mainly captures physical surface changes, nighttime light data are particularly useful for tracking short-term functional disturbance after earthquakes. In recent years, VIIRS nighttime light data have been increasingly used to rapidly identify earthquake-affected areas, characterize post-earthquake urban light loss processes, and analyze spatial heterogeneity across different distances and directions [27]. For example, previous studies have demonstrated the applicability of daily NPP-VIIRS nighttime light data to rapid disaster assessment in general [28], while earthquake-focused studies based on the 2015 Nepal earthquake and the 2023 Turkey–Syria earthquake further showed that nighttime light changes can help identify affected built-up areas, describe short-term post-event dynamics, and exhibit a certain degree of spatial correspondence with independent damage-related information [29,30,31]. At the same time, nighttime light change is not a direct measurement of structural damage itself, but more often reflects the combined response of power outages, functional disruption, emergency activities, and subsequent recovery processes; however, in low-illumination areas, the detectability of such signals is often limited. Therefore, in post-earthquake loss assessment, nighttime light signals are more appropriately interpreted together with seismic intensity, exposure characteristics, and external validation information. Existing research indicates that post-earthquake declines in NTL can effectively reveal affected built-up areas, power supply disruptions, and spatially heterogeneous functional disturbance in densely populated regions [27,32,33], thereby providing useful support for rapid earthquake damage assessment and comparative loss analysis.
However, existing work still has the following shortcomings: First, although some nighttime light studies have explored multi-scale analysis, systematic multi-scale investigation specifically for earthquake damage assessment and emergency-oriented interpretation remains limited. In post-earthquake applications, multi-scale analysis is important because it can provide a more comprehensive understanding of affected-area patterns across different spatial units. However, current nighttime light-based earthquake assessments are still predominantly conducted at a single spatial scale. At coarser aggregation scales, signals indicating localized severe damage are easily diluted by spatial averaging. Conversely, at finer aggregation scales, areas with low illumination become more susceptible to daily-scale fluctuations and noise, leading to unstable interpretations. This dual challenge limits the identification of severe damage and the comparability of results [23,26]. Second, insufficient attention has been paid to the differential impacts across different orientations and intensity zones [27]. In reality, seismic hazards often exhibit significant spatial heterogeneity due to site conditions, topography, and other factors [8,20,34]. Third, most studies primarily focus on brightness reduction, neglecting the coupling between NTL changes and population/building density distribution. This approach struggles to reveal the underlying mechanisms linking seismic losses to population exposure and built environment characteristics [16,35,36,37].
Based on this, this study examines the 2025 Myanmar Mw 7.7 earthquake as its subject. Utilizing nighttime light data, it conducts earthquake disaster loss assessments across multiple scales—“county-to-patch-to-pixel”—and integrates population and building density data. By combining a “magnitude–azimuth” decomposition framework with seismic intensity distributions provided by the USGS, this study identifies the spatial distribution patterns of earthquake hazards. In this study, nighttime light change is used as a rapid remote sensing indicator of post-earthquake disturbance and loss-related signals, rather than as a direct substitute for field-based damage inventories.

2. Study Areas and Data

2.1. Study Area

On 28 March 2025, a magnitude 7.7 earthquake struck Myanmar, with its epicenter located near the border between Sagaing and Mandalay (22.05°N, 95.84°E) at a focal depth of approximately 10 km [38,39,40] (Figure 1). According to emergency reports from the United Nations Office for the Coordination of Humanitarian Affairs (OCHA) and the ASEAN Coordinating Centre for Humanitarian Assistance (AHA Centre), as of 31 December 2025, the earthquake resulted in over 5000 fatalities, more than 20,000 injuries, and economic losses estimated at approximately 1.57 billion dollars.

2.2. Data

This study employs NASA’s Black Marble Earth Observation System Data (BEMED) VNP46A2 global daily-scale nighttime light product as the nighttime illumination data source for pre-earthquake and post-earthquake comparisons. VNP46A2 is a globally available daily-scale NTL product that undergoes moonlight and atmospheric correction, BRDF correction, and gap-filled pixel filling. The output raster features a nominal spatial resolution of 500 m (15″ linear grid) with radiometric units of nW·cm−2·sr−1. It also provides quality indicators (cloud and snow indicators, retrieval quality, moonlight information, etc.) to support subsequent quality control and screening (https://ladsweb.modaps.eosdis.nasa.gov/missions-and-measurements/products/VNP46A2, accessed on 22 April 2025) [41,42].
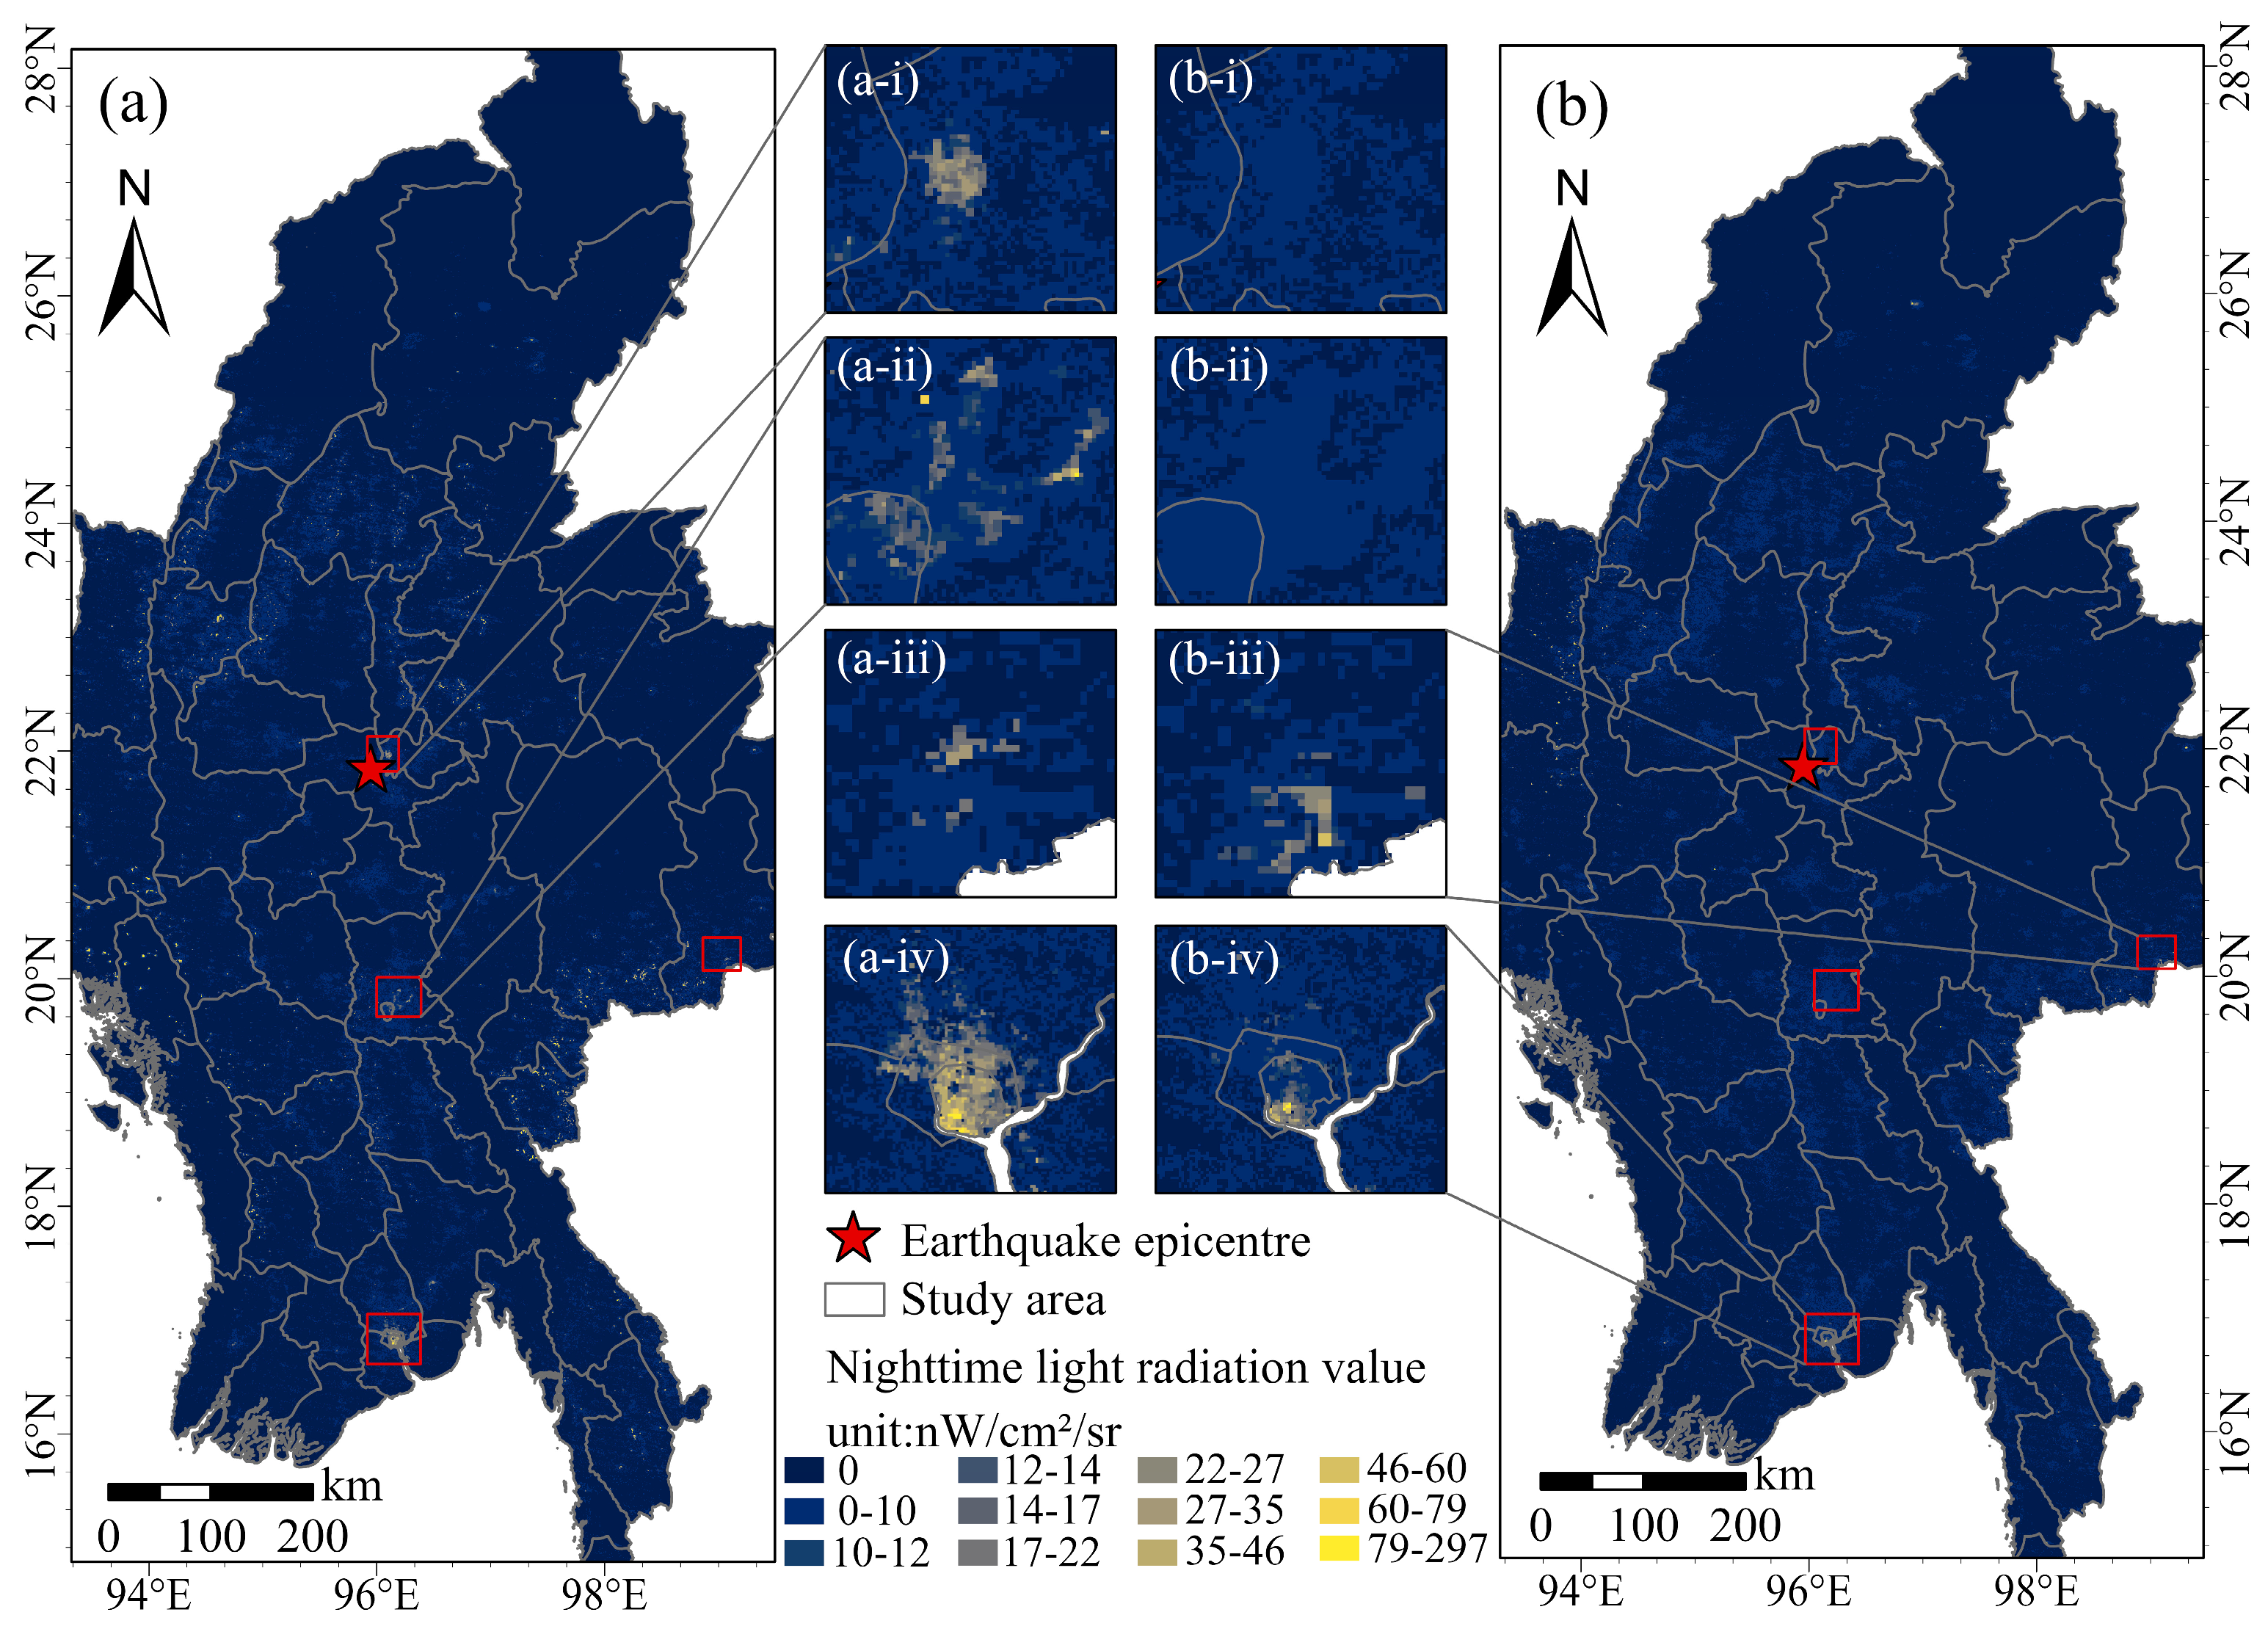
To mitigate the impact of cloud cover on disaster loss assessment, a comparative analysis was conducted on nighttime light data cloud coverage during the 15 days preceding the earthquake and the 3 days following it, prioritizing imagery with low cloud content. Accordingly, imagery from 22 March 2025 (six days prior to the earthquake) and 29 March 2025 (the first post-earthquake day) was selected for subsequent loss assessment studies (Figure 2).
Due to the presence of low-brightness background noise and abnormally high-value contaminated pixels in NPP-VIIRS nighttime light data, to enhance the reliability of evaluation and analysis, this study examines the lower-quantile distribution characteristics of the low-brightness segment in the radiation histogram of the study area and, together with commonly used Black Marble preprocessing strategies, determines the background threshold. Based on the lower-quantile distribution of the low-brightness histogram in the Gap-Filled DNB BRDF-Corrected NTL layer and the commonly used preprocessing strategy for Black Marble data, a background threshold of δr (δr = 2 nW/cm2/sr) was adopted. This threshold is not universally fixed, but was selected because it better matched the actual low-value background in the study area. Pixels with radiation values below δr are treated as background-like noise or non-real gap-filled low-radiance values and are therefore masked by assigning zero [38,40]. These pixels are not used as effective radiance values in the NCV/NCR radiance calculation, but are retained only when counting the total number of pixels within a spatial unit. Then, based on the empirical constraint that pixel nighttime luminance should not exceed the maximum radiation value in major urban core areas, pixels with abnormally high values exceeding the threshold undergo neighborhood replacement. The specific method is as follows: if the radiance value of a single pixel exceeds the threshold, it is assigned the maximum radiance value within its 8-neighborhood. If the replaced pixel still exceeds the threshold, the process continues outward along the 8-neighborhood, assigning the maximum radiance value within the expanded neighborhood until the replaced nighttime light intensity falls below the threshold.
The seismic intensity data for Myanmar were sourced from the Peak Ground Acceleration (PGA) values in the ShakeMap catalog published by the United States Geological Survey (USGS) (https://www.usgs.gov/news/featured-story/m77-mandalay-burma-myanmar-earthquake, accessed on 4 July 2025) [43]. Population data were sourced from the Copernicus GHSL GHS-POP 2025 Epoch (https://human-settlement.emergency.copernicus.eu/download.php?ds=pop, accessed on 15 July 2025) [44,45]. Building and administrative boundary data were sourced from OpenStreetMap (Geofabrik, https://download.geofabrik.de/asia/myanmar.html, accessed on 29 August 2025). All data were uniformly resampled to a 100 m spatial resolution for analysis. This study employs the post-disaster interpreted vector data product (https://rapidmapping.emergency.copernicus.eu/EMSR798, accessed on 17 December 2025) released by the Copernicus Emergency Management Service (CEMS) Rapid Mapping to validate nighttime remote sensing earthquake damage assessment results [46]. This product is generated through rapid visual interpretation of high-resolution satellite imagery captured before and after the earthquake, providing damage information on affected built-up areas and transportation infrastructure. The background imagery used for interpretation has a resolution of approximately 0.5 m.

3. Method

3.1. Multi-Scale Measurement of NTL Changes

To capture the multi-scale impacts of the earthquake on nighttime illumination, this study quantifies nighttime light (NTL) loss across three spatial scales: county-level administrative units, urban built-up patches, and image pixels. For patch-level analysis, urban built-up area boundary data are sourced from the 2024 annual synthetic nighttime light product VNP46A4 to mitigate the impact of diurnal nighttime light fluctuations on the stability of built-up area boundaries [47,48]. This annual composite may introduce a certain time-lag limitation relative to the March 2025 earthquake, although its overall influence on nationwide built-up patch delineation is expected to be limited. Specifically, the annual composite nighttime light image first undergoes threshold-based background screening and local replacement of isolated high-value outliers, followed by spatial smoothing to reduce noise. Subsequently, K-means binary clustering is applied to classify pixels into high-brightness and low-brightness categories. Based on this, threshold t1 is calculated as the mean of low-brightness samples plus N times the standard deviation, used to extract stable background interior regions and identify potential transition pixels. Simultaneously, threshold t2 is derived as the mean of high-brightness samples minus N times the standard deviation, employed to extract stable urban interior bright areas and delineate urban edge transition zones (where N = 1 in this study, adopted as an empirical compromise to balance stable class extraction and transition zone preservation) [49]. Transition zone pixels are further classified and merged into the urban area, ultimately yielding a binary mask of the built-up zone. Finally, 8-neighbor connectivity is used to mark independent patches, followed by small patch removal to reduce noise effects.
To quantify changes in nighttime light (NTL) before and after earthquakes, this study defines two metrics: the total nighttime light change (NCV) and the nighttime light change rate (NCR), calculated for the aforementioned spatial units. Let the total radiation before and after the earthquake at scale s for spatial unit U be as follows:
L s ( pre ) ( U ) = i U NTL ( pre ) ( i ) , L s ( post ) ( U ) = i U NTL ( post ) ( i )
The formulas for calculating NCV and NCR are as follows:
NCV s ( U ) = L s ( post ) ( U ) L s ( pre ) ( U )
NCR s ( U ) = L s ( post ) ( U ) L s ( pre ) ( U ) + ε 1 = NCV s ( U ) L s ( pre ) ( U ) + ε
Here, ε is a very small positive number (used to avoid proportional anomalies caused by individual near-zero baselines; in this study, it is set to 10 6 times the median value of L ( p r e ) across all scales). Pixel-level calculations can be regarded as a special case where U contains only a single pixel.
To test the statistical significance of NTL changes, this study employs a two-sample Kolmogorov–Smirnov (KS) test at the pixel set level. It compares the empirical cumulative distributions of pre-earthquake and post-earthquake NTL within the same spatial unit, calculates the KS statistic D, and determines its two-tailed p-value (significance level α = 0.05).

3.2. Directional Differences in NTL Changes Across Seismic Intensity Zones

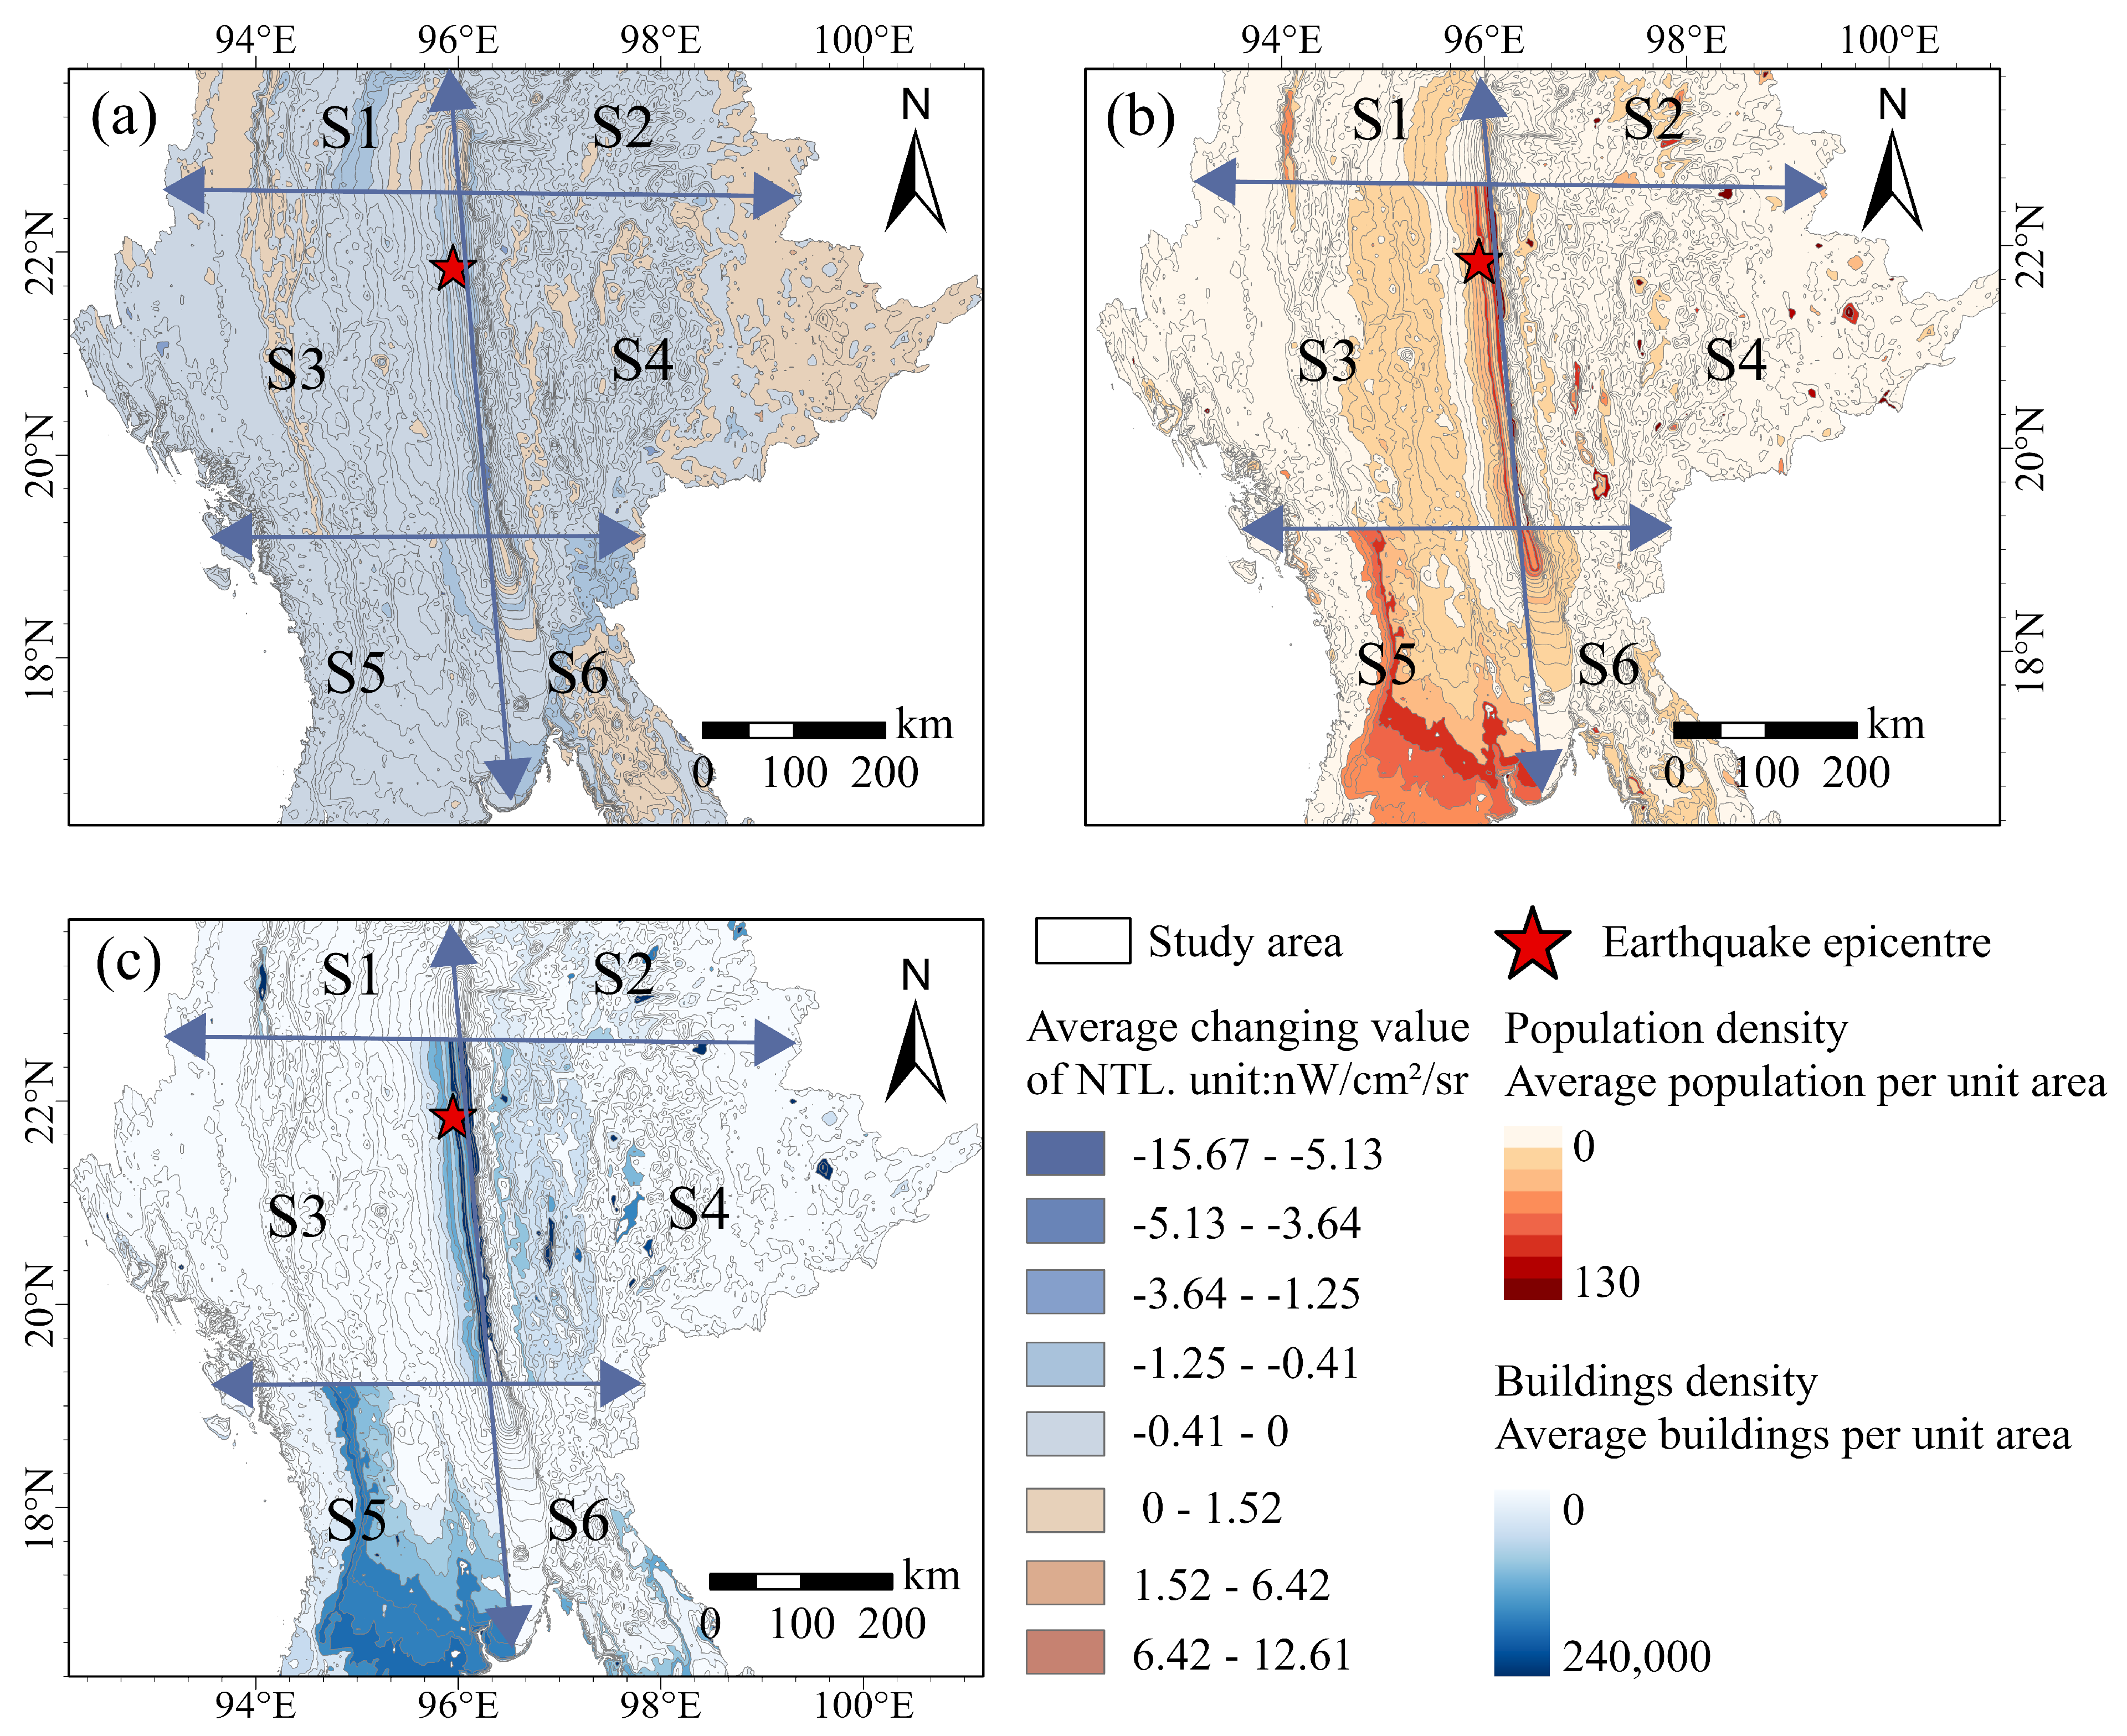
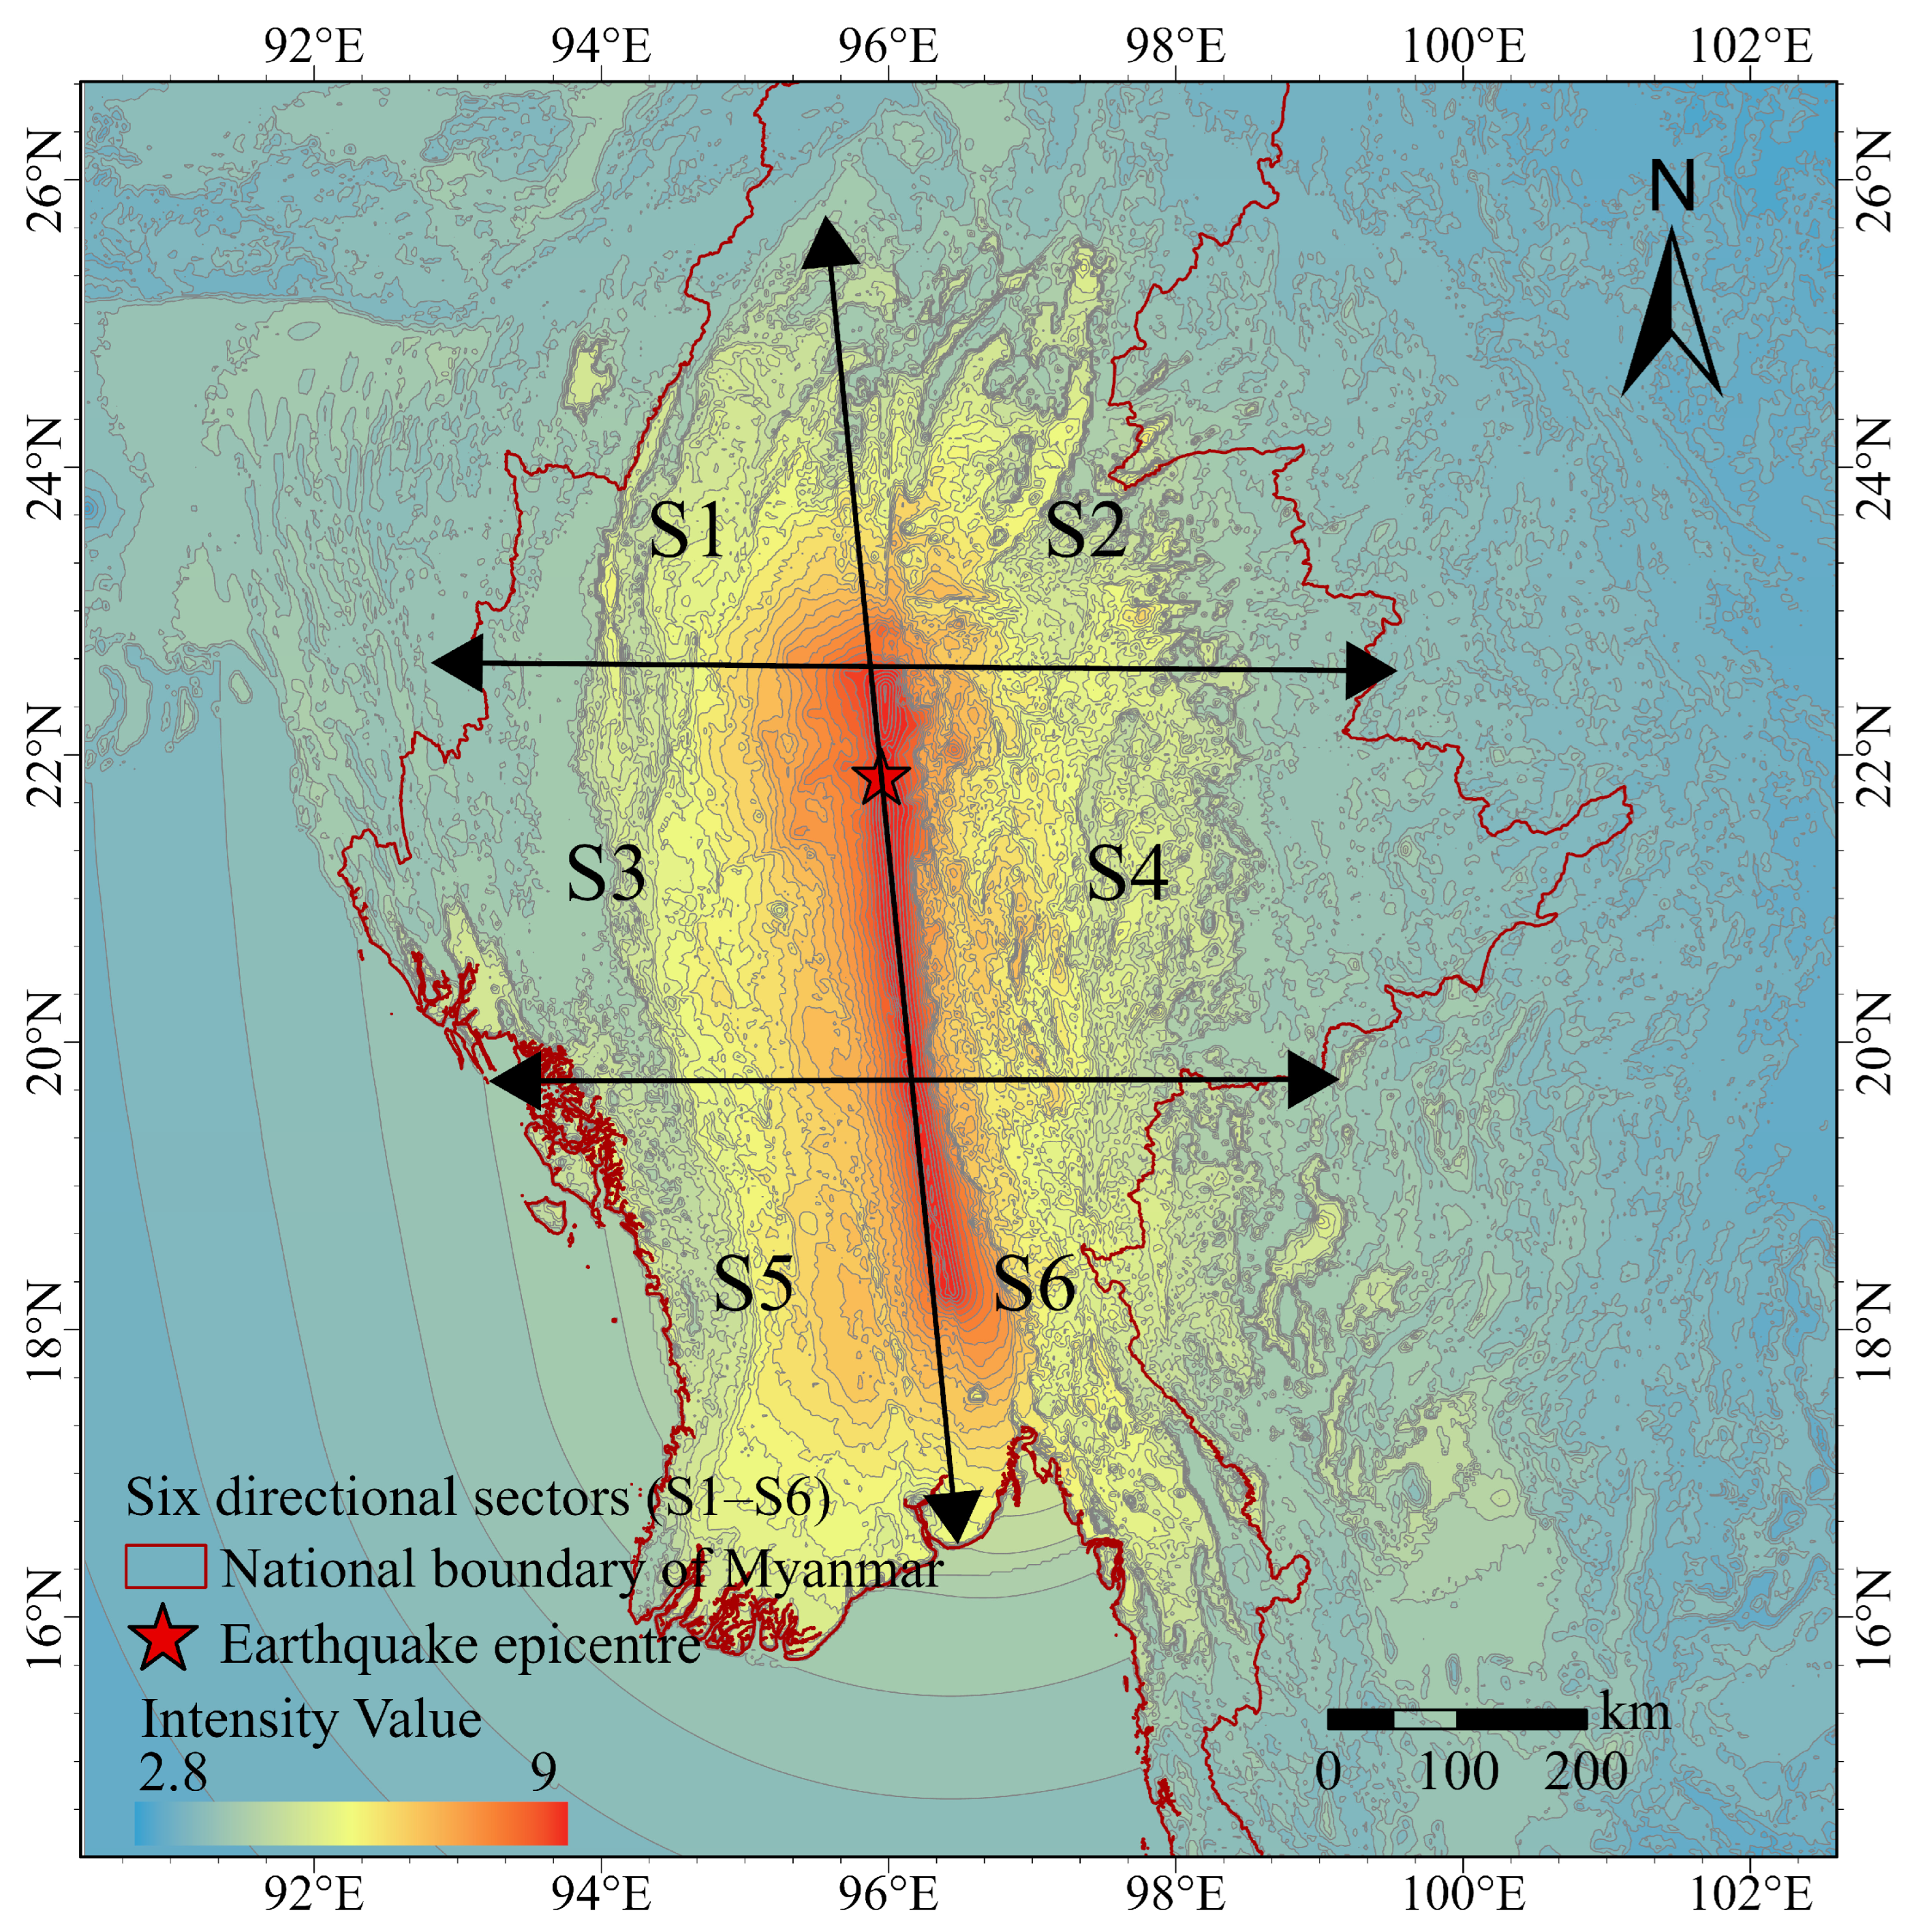
The extent of damage caused by earthquakes is often influenced by factors such as fault characteristics and rupture patterns. Consequently, traditional circular buffer zone analysis methods are not suitable for assessing earthquake disaster losses. Since the active fault in Myanmar’s earthquake runs nearly north–south, the seismic intensity distribution exhibits a distinct elliptical elongated shape—with the high-intensity zone stretching longer north–south than east–west. Accordingly, we used one vertical line along the fault orientation and two corresponding transverse lines to define the partition. To investigate the variation in nighttime light loss across different directions, this study divides the entire territory of Myanmar into six regions based on the spatial distribution characteristics of seismic intensity, as shown in Figure 3.
The six-direction scheme adopted in this study is intended as an analytical framework to summarize azimuthal differences under the north–south elongated intensity pattern of the Myanmar earthquake, rather than to indicate physically discrete boundaries of earthquake impacts. In reality, ground-motion propagation and post-earthquake functional disturbances are spatially continuous. Therefore, abrupt local changes near sector boundaries should not be directly interpreted as physical discontinuities, since these changes may partly result from manual partitioning.
Based on the above zoning, calculate the variation in nighttime light (NTL) across different intensity zones for each direction. First, compute the relative change in pixel-level nighttime light imagery before and after the earthquake. Then, perform regional averaging on the pixel sets for each direction i and intensity zone k to obtain the NTL variation for that direction and intensity zone.
Due to variations in population density and building exposure across different areas, it is necessary to standardize indicators such as NTL, population density, and building density for zones with differing intensities and orientations to facilitate the measurement of NTL changes.
N I v , i , k = x v , i , k min ( j , l ) D × K x v , j , l max ( j , l ) D × K x v , j , l min ( j , l ) D × K x v , j , l + ε
Here, ν { N T L , P O P , B L D } , i D , k K , and x ν , i , k represents the regional average value of variable v at direction i and intensity zone k (calculated by aggregating pixel weights under equal-area projection). When ν = N T L , NI denotes the normalized index of the average NTL variation value, where x N T L , i , k represents the average relative change in pixel-level NTL within the intensity zone along that direction. When ν = P O P , it corresponds to the average population density, with NI indicating the normalized index of the average population density. When ν = B L D , it relates to the average building density, where NI signifies the normalized index of the average building density. D { S 1 , S 2 , S 3 , S 4 , S 5 , S 6 } denotes the set of six directions; K denotes the set of intensity classifications; j and l are indices for variable ν across all directions and intensity regions, respectively; m a x ( j , l ) D × K x ν , j , l and m i n ( j , l ) D × K x ν , j , l denote the maximum and minimum average values of variable v across the entire domain. ε is a small positive number used to prevent instability caused by the denominator approaching zero when the global range is too small (in regions with very small sample sizes). In this study, ε = 10 6 × m e d i a n { x ν , j , l } is chosen to ensure numerical stability and comparability. Under this setting, N I ν , i , l [ 0,1 ] .

3.3. Spatial Associations Between NTL Changes and Population/Building Density

This study employs the Bivariate Local Moran’s Index (LISA) to capture the spatial correlation between NTL changes and population density as well as building density. The Bivariate LISA quantifies the spatial correlation between two variables, revealing their spatial dependence. The formula for the Bivariate Local Moran’s Index is as follows [50,51,52]:
I v , u = Z v i j = 1 n W i j Z u j
Here, ν denotes NTL variation, u denotes population density or building density, and Z ν i and Z u j represent the standardized values of these variables. Specifically, Z ν i and Z u j are defined as:
Z v i = X v i X ¯ v σ v , Z u j = X u j X ¯ u σ u
Here, X ν i and X u j denote the observed values of variables ν and u at positions i and j , respectively; X ¯ ν and X ¯ u represent the mean values of these variables; and σ ν and σ u denote their standard deviations. W i j is the spatial weight matrix, representing the spatial relationship between positions i and j . In this study, the weight matrix W i j is calculated using inverse distance weighting to ensure the influence of spatial proximity. That is to say, the closer the distance, the greater the weight.
The Bivariate LISA clustering results were categorized into five groups: High–High (H-H), High–Low (H-L), Low–High (L-H), Low–Low (L-L), and Not Significant (NS). This classification characterizes the relationship between nighttime light changes and population or building exposure at the local spatial scale, thereby distinguishing the magnitude of nighttime light variation and exposure context across different types of areas. In this study, the first letter refers to the value of the nighttime light change rate: L indicates a lower value of the nighttime light change rate, which usually corresponds to a larger decline in nighttime light, whereas H indicates a higher value of the nighttime light change rate, which usually corresponds to a smaller decline, relative stability, or even slight increases in nighttime light. Accordingly, H-H denotes areas where nighttime light shows limited decline or even slight increases and where population or building density is relatively high; H-L denotes areas where nighttime light shows limited decline or even slight increases and where population or building density is relatively low; L-H denotes areas where nighttime light declines more markedly and where population or building density is relatively high; and L-L denotes areas where nighttime light declines more markedly and where population or building density is relatively low.

4. Results

4.1. Multi-Scale Differences in Post-Earthquake NTL Changes

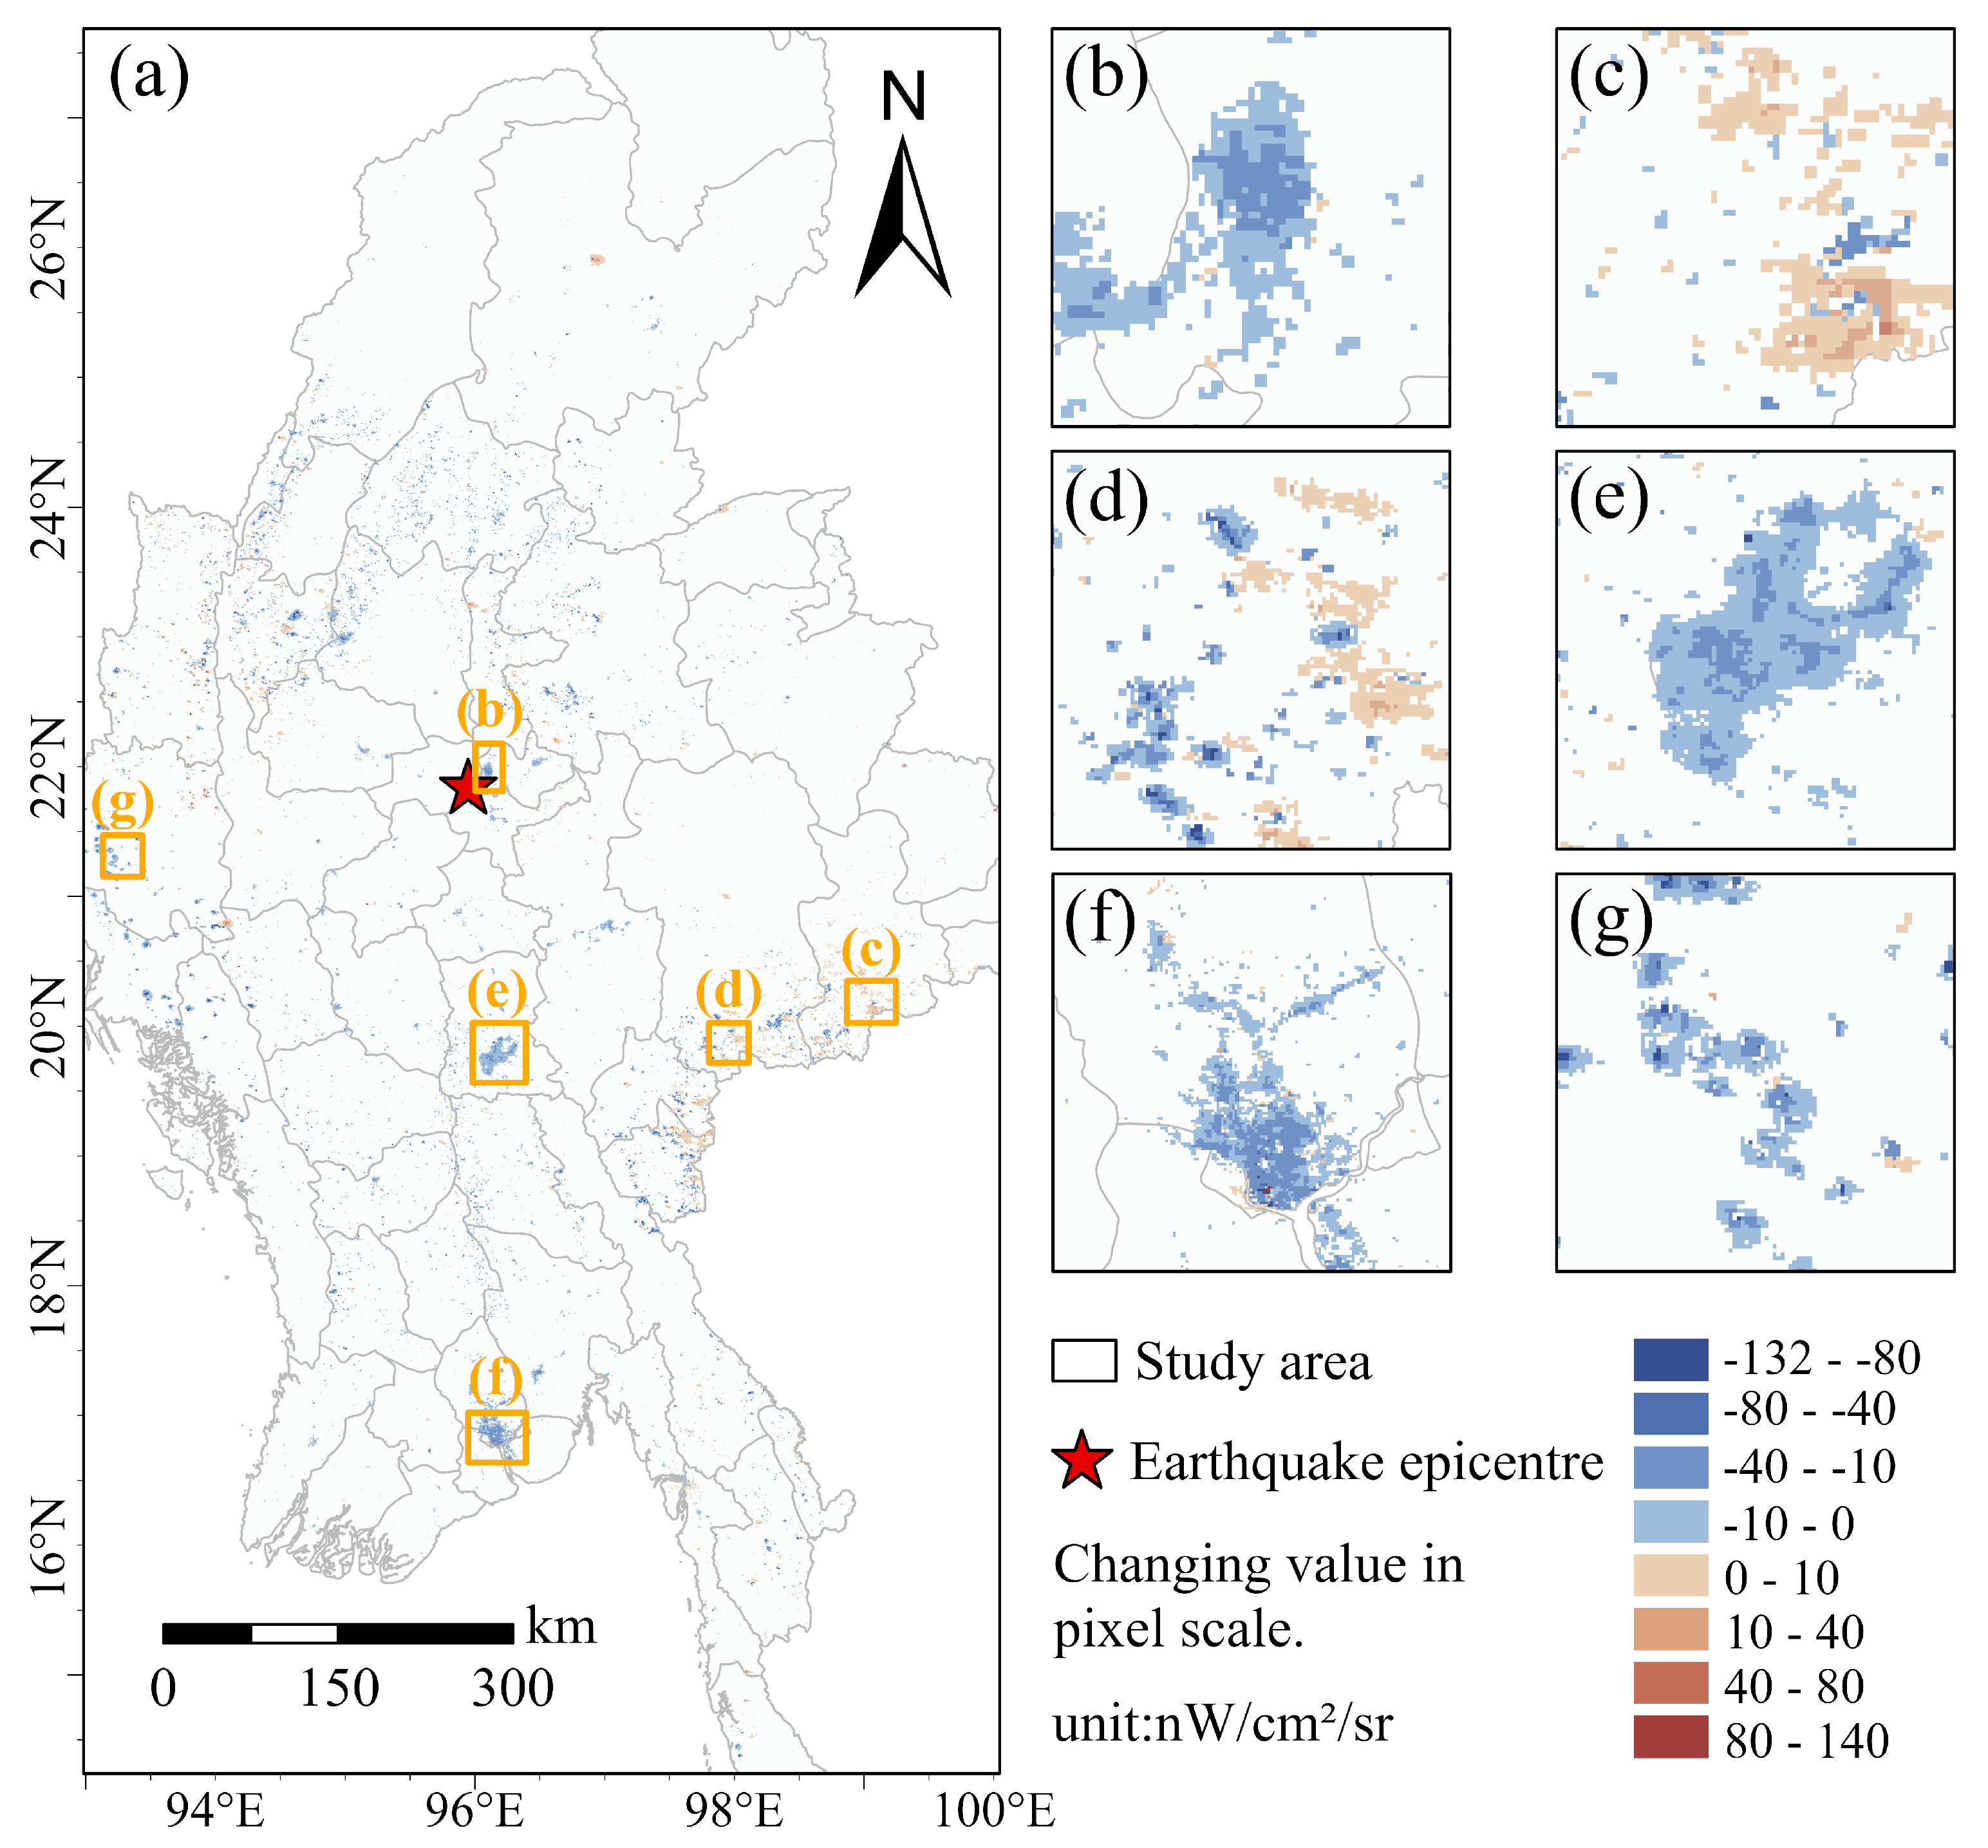
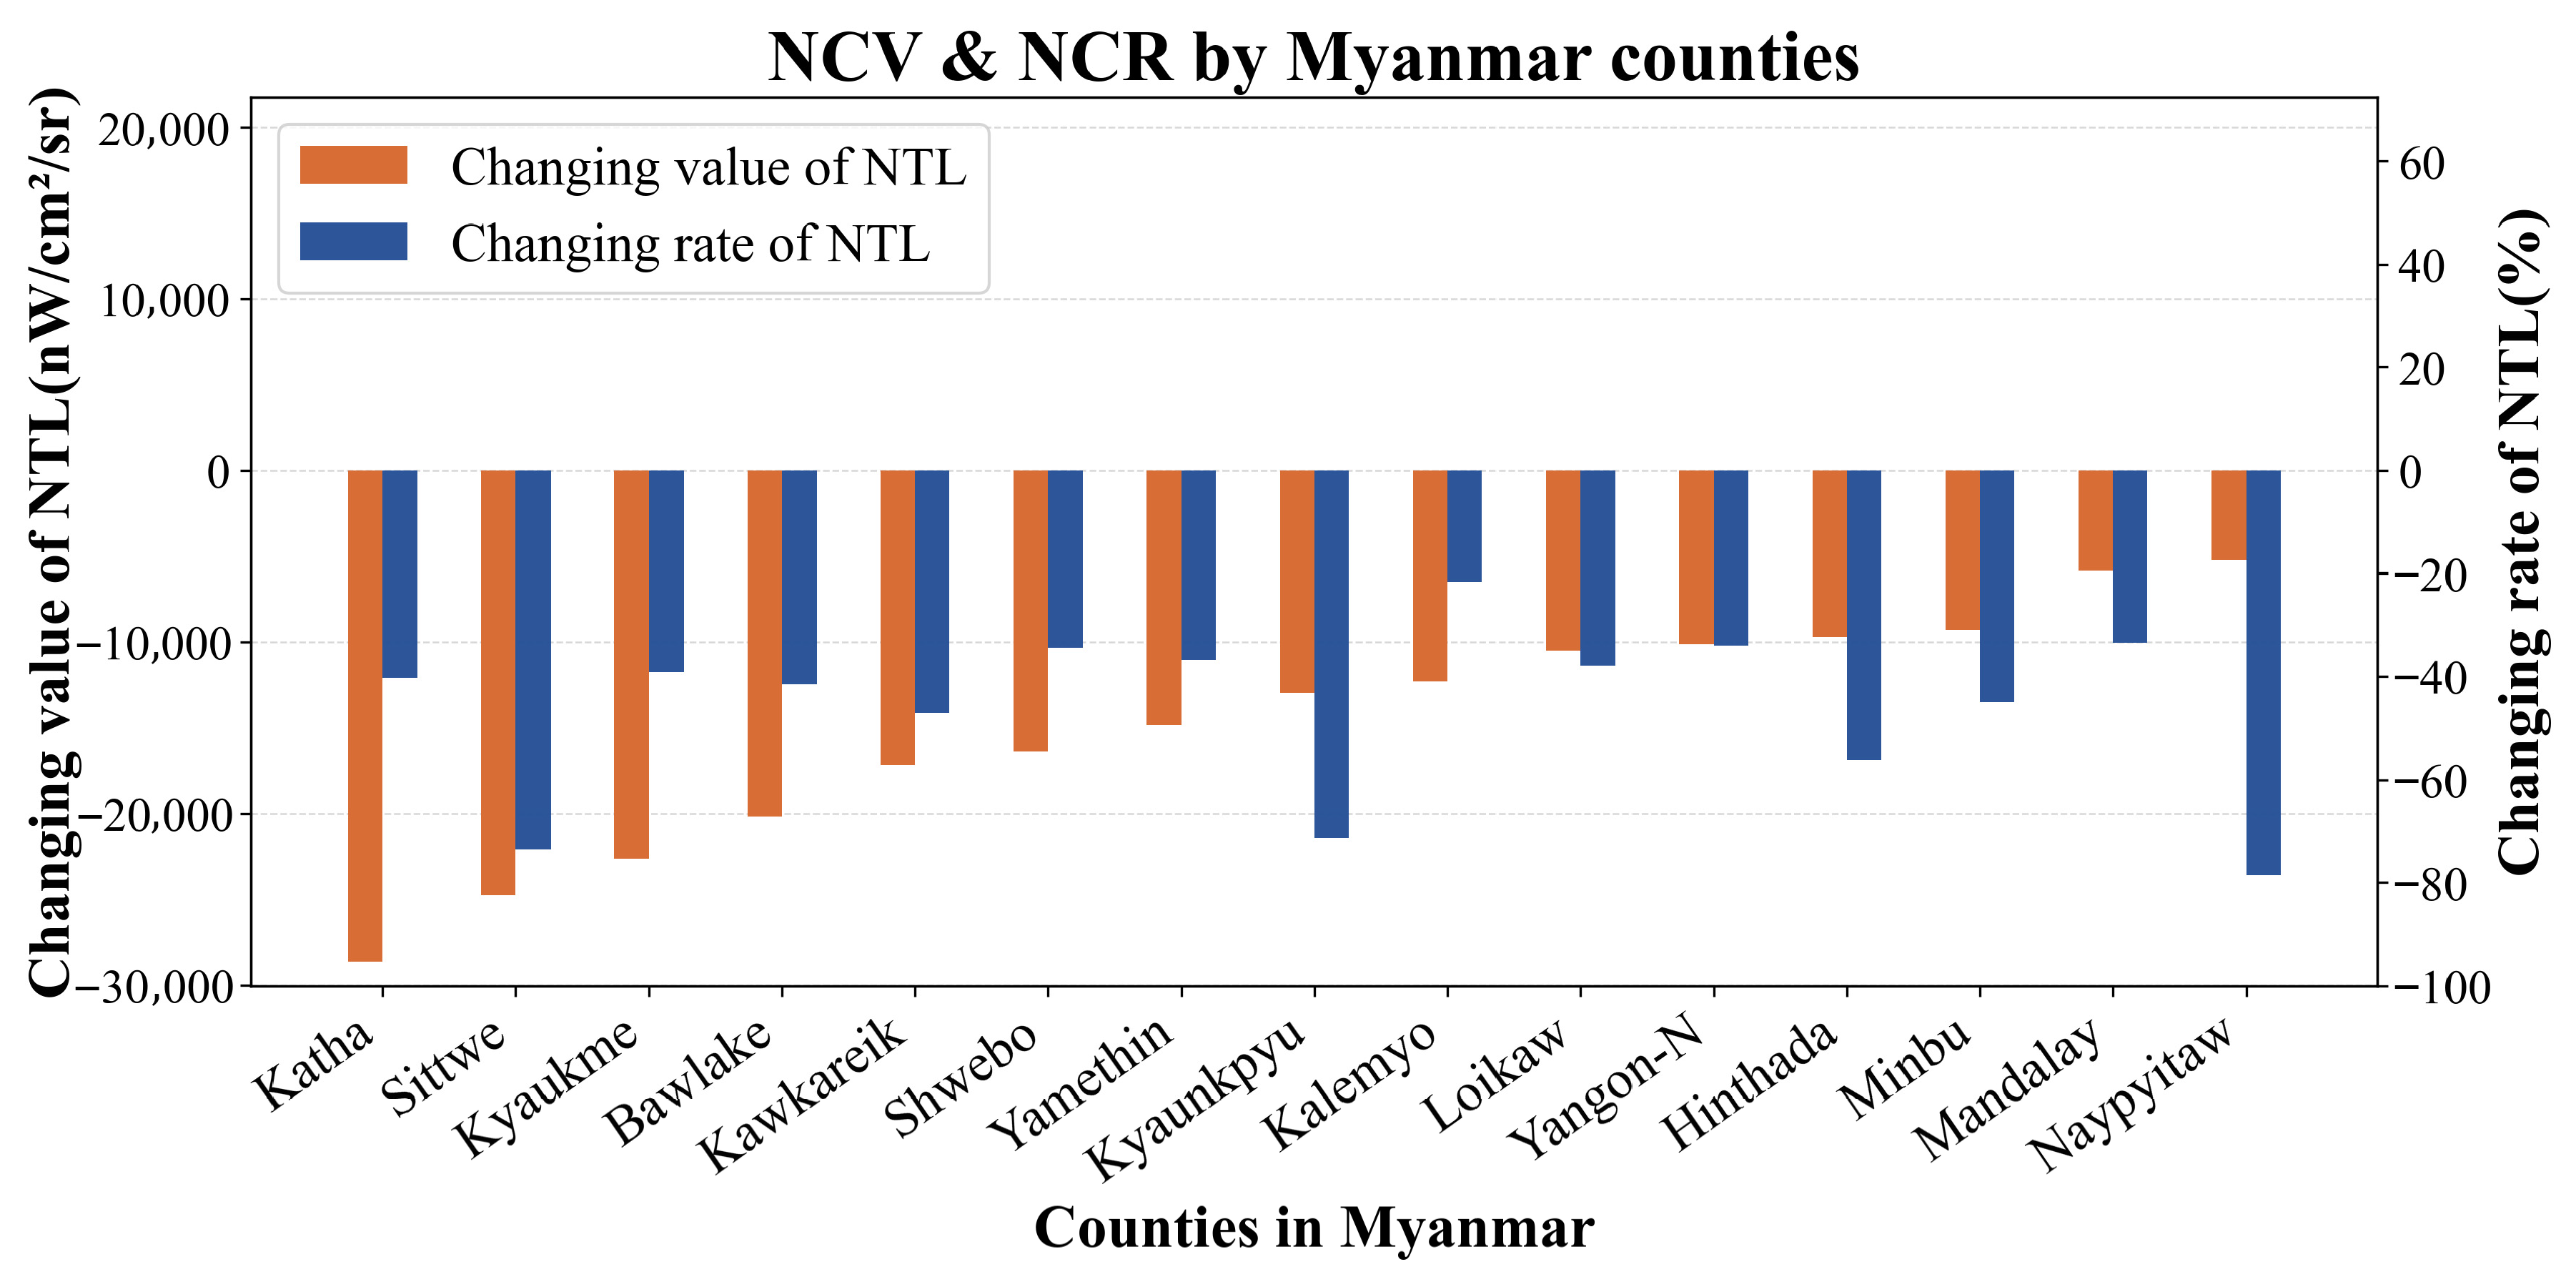
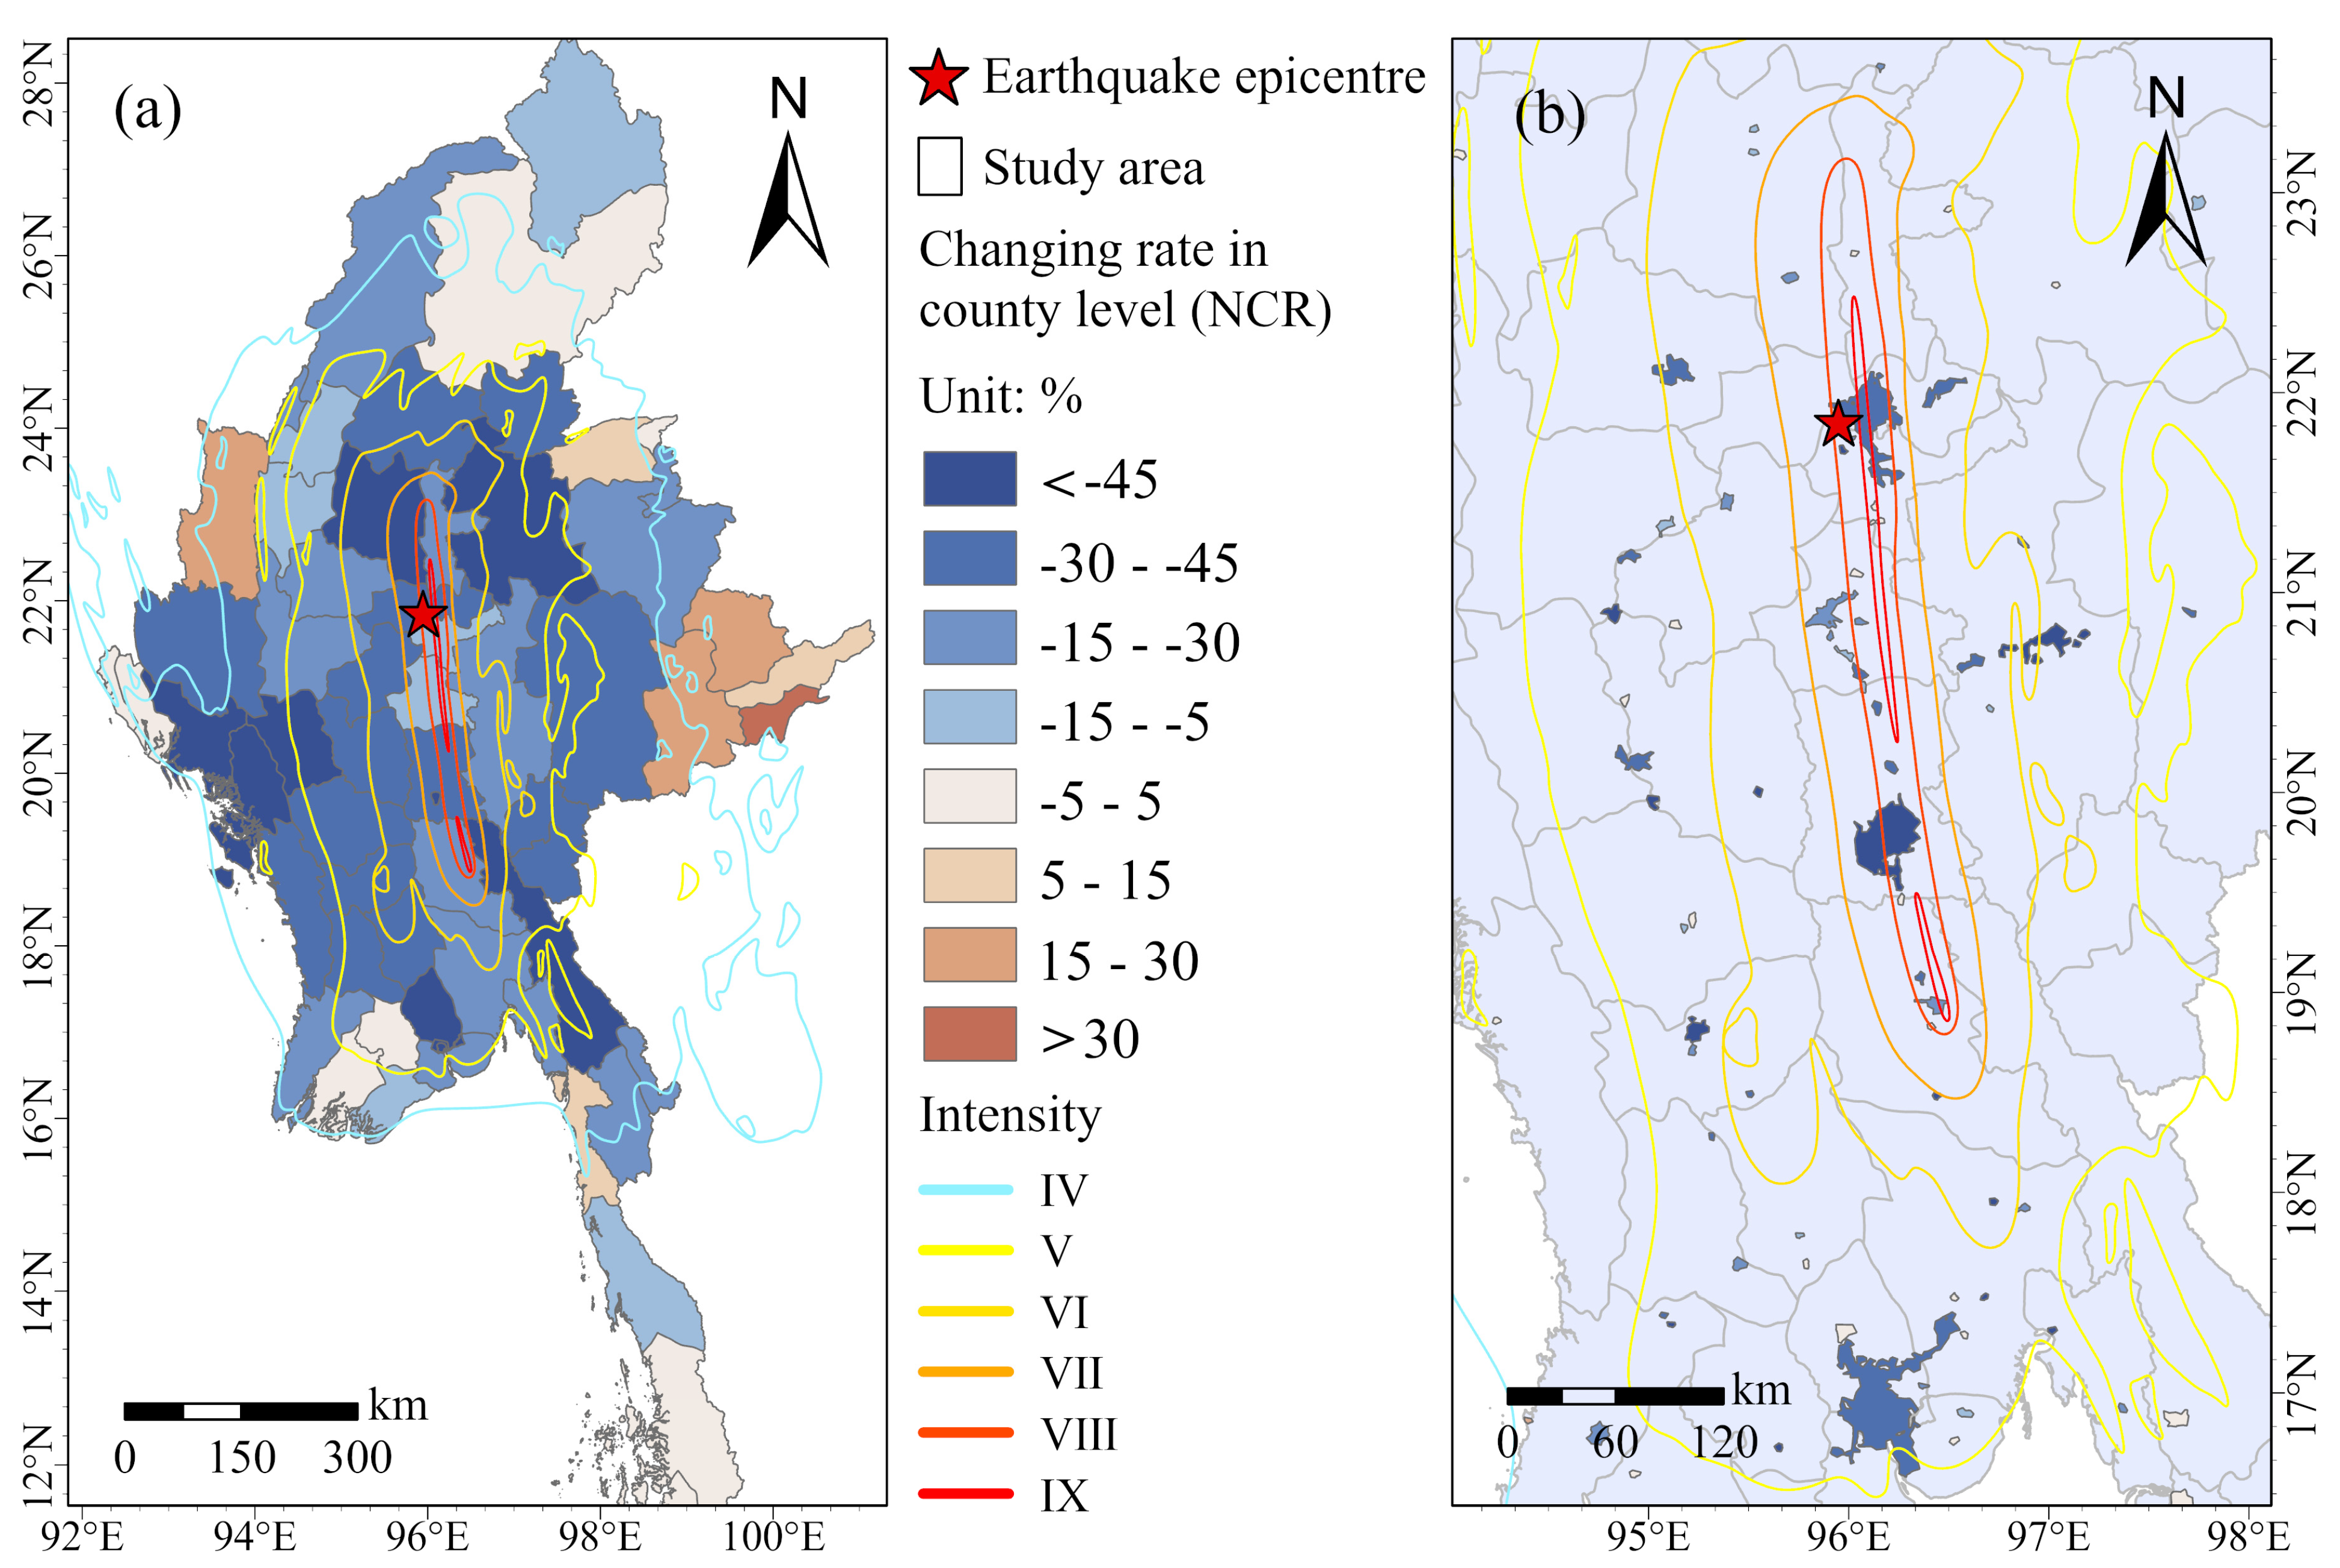
County-level results indicate that post-earthquake nighttime light primarily decreased: 71.5% of county-level units showed significant declines (NCR < −15%), 22.2% exhibited minimal changes (−15% ≤ NCR ≤ +15%), and only 6.3% demonstrated notable increases (NCR > +15%). Figure 4 displays the 15 county-level units with the most significant declines in nighttime light intensity and their corresponding rate of change characteristics. Measured by NCV, counties such as Katha, Sittwe, Kyaukme, and Bawlake exhibited more pronounced reductions in nighttime light. However, measured by NCR, Naypyitaw recorded the highest decline rate at −78.65%, with Kyaukme, Sittwe, and the county containing Sagaing city also showing significant decreases (Figure 5a). Meanwhile, a few counties in eastern Myanmar show slight brightening or recovery signals, such as MongHsat and Kengtung in eastern Shan State (Figure 5a). Overall, the decline is more concentrated in central Myanmar near the epicenter and its surrounding counties, while changes in peripheral areas farther from the epicenter are relatively moderate (NCR = −13.73% to +11.23%). At finer spatial scales, results at the patch and pixel levels (Figure 5b and Figure 6) reveal that areas with declining nighttime light are primarily concentrated within and around urban built-up zones such as Naypyitaw, Mandalay, and Yangon. The spatial distribution at the pixel level generally aligns with that observed at the patch level, while also revealing more pronounced local variations at finer scales.
To test the statistical significance of nighttime light distribution before and after the earthquake, this study conducted a KS test on the NTL distribution of pre-earthquake and post-earthquake pixel sets. The test results indicate a significant difference between the post-earthquake distribution and the pre-earthquake distribution (p < 0.01). This significance persists even after correction using the Benjamini–Hochberg method (q = 0.05). This demonstrates that the post-earthquake nighttime light distribution has undergone a systemic shift relative to the pre-earthquake distribution. This change exceeds the range of normal fluctuations and can be regarded as an anomalous nighttime light signal triggered by the seismic event, providing statistical support for subsequent analysis.
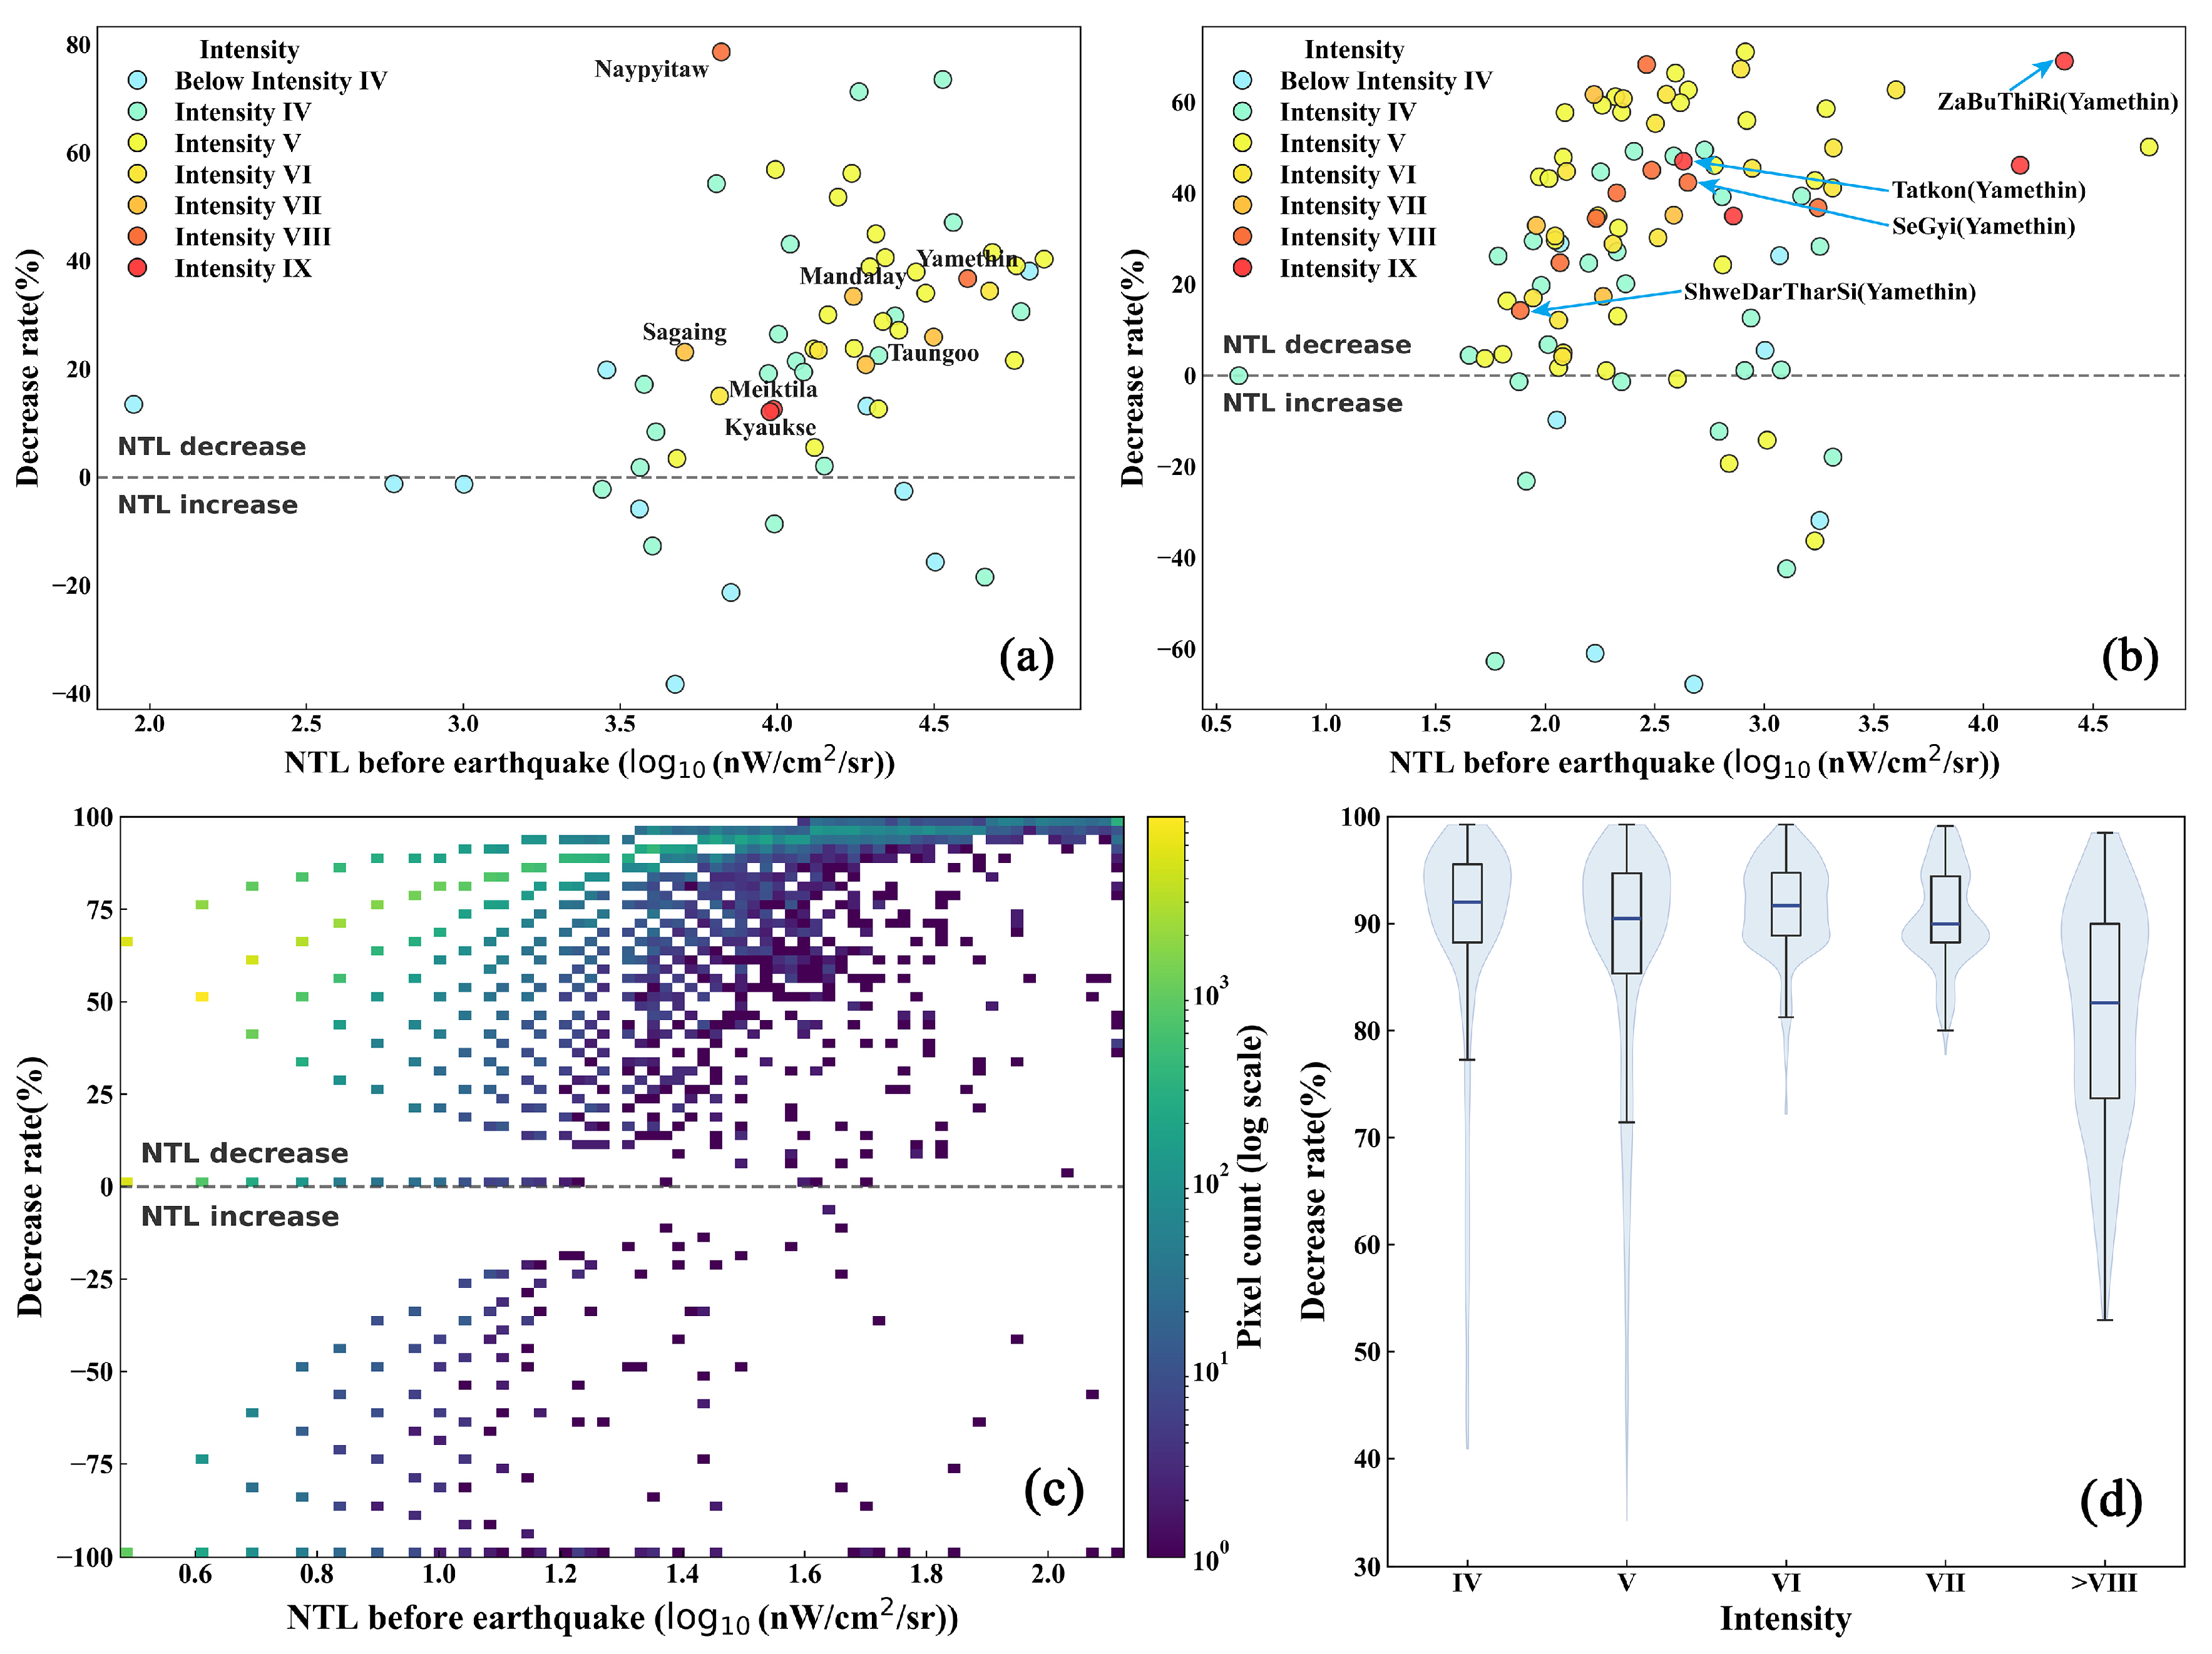
The relationship between pre-earthquake nighttime illumination levels and their decline rates at different scales, along with their coupling characteristics with seismic intensity, will be further discussed in Section 5.1.

4.2. NTL Changes and Exposure Patterns Across Seismic Intensity Zones and Directions

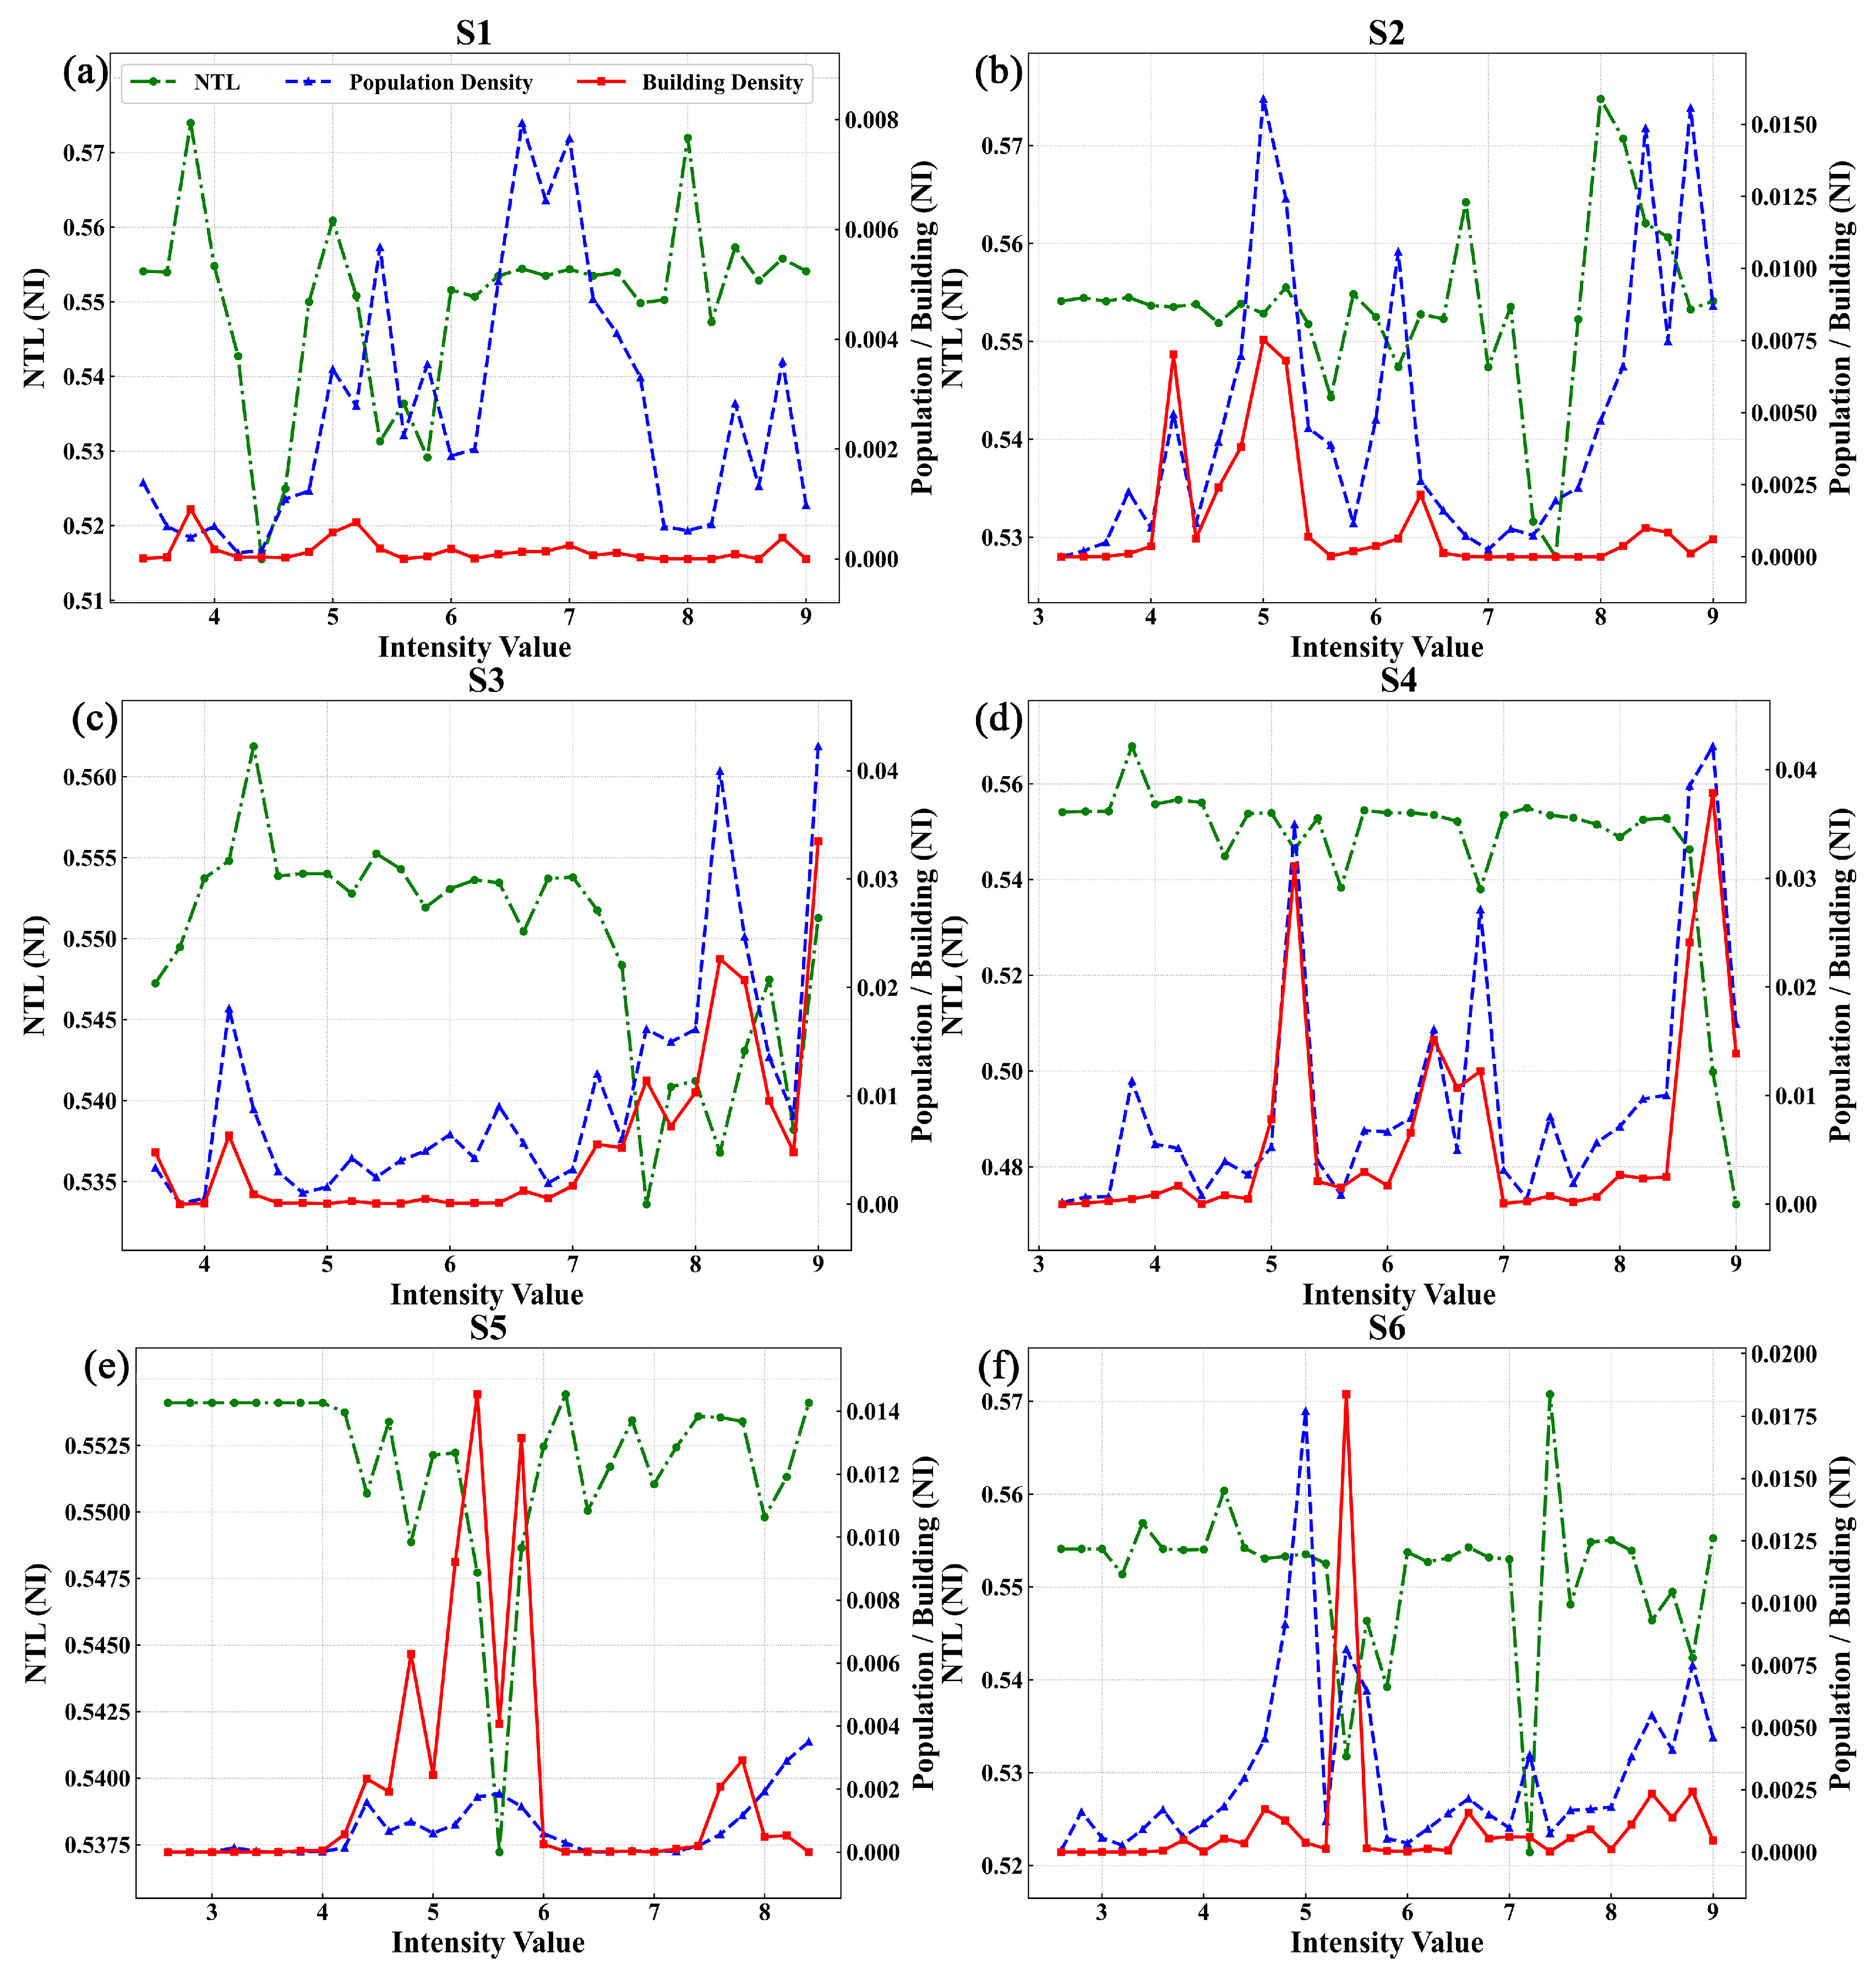
Significant spatial differences in nighttime light (NTL) variations were observed across different intensity zones within the six directional zones (Figure 7a). The units with the most pronounced NTL reduction were primarily concentrated in the moderate-intensity zones (MMI = 4–6) of the S5 and S6 directions, as well as in some high-intensity zones (MMI = 7–8). This pattern may reflect the combined influence of settlement distribution, building vulnerability, and functional resilience differences between moderate-intensity rural/township areas and some higher-intensity urban cores. Additionally, certain high-intensity zones in the S2 direction and high-intensity zones near the epicenter in the S3 and S4 directions also exhibited distinct nighttime light decline characteristics. The average NTL loss in these units ranged from 0.53 to 15.67 nW/cm2/sr.
From a spatial distribution perspective, the most concentrated areas of nighttime light decline are primarily located in Mandalay city and its surrounding northern and southern regions. Simultaneously, distinct patches of nighttime light reduction have also appeared in areas such as Naypyitaw Federal Territory and Yamethin. Additionally, a continuous band of degraded structure extending along the central region can be observed in areas including Sagaing, Magway, Bago, and Shan State.
In the same direction and intensity segmentation units as Figure 7a, the spatial distribution characteristics of population and building density are shown in Figure 7b,c, respectively. Population-dense units are primarily distributed in the following areas: high-intensity zones (MMI = 8–9) near the epicenter in the S4 direction, medium-to-low intensity zones (MMI = 4–6) in the S5 direction, and medium-to-high intensity zones (MMI = 6–9) in the S6 direction. However, from a national perspective, high-density population areas remain primarily concentrated in cities such as Mandalay, Naypyitaw, and Yangon, while other regions generally exhibit lower population densities. Building clusters are predominantly distributed in the moderate-to-high intensity zones (MMI = 5–9) along the S3 and S4 directions, as well as the moderate intensity zone (MMI = 4–5) along the S5 direction, showing a certain degree of spatial consistency with population distribution.
After area-standardizing NTL change values, population density, and building density, their composite distribution characteristics are shown in Figure 8. The results indicate that units with significant NTL reduction and high population/building density are primarily concentrated in high-intensity zones along S3 and S4 directions, as well as medium-intensity zones along S5 and S6 directions (Figure 8c–f). In contrast, units exhibiting increased NTL with relatively lower population and building densities were predominantly distributed in the high-intensity zone along the S1 direction, the medium-intensity zone along the S2 direction, and the low-intensity zone along the S3 direction (Figure 8a–c).

4.3. Spatial Coupling Patterns Between NTL Changes and Population/Building Density

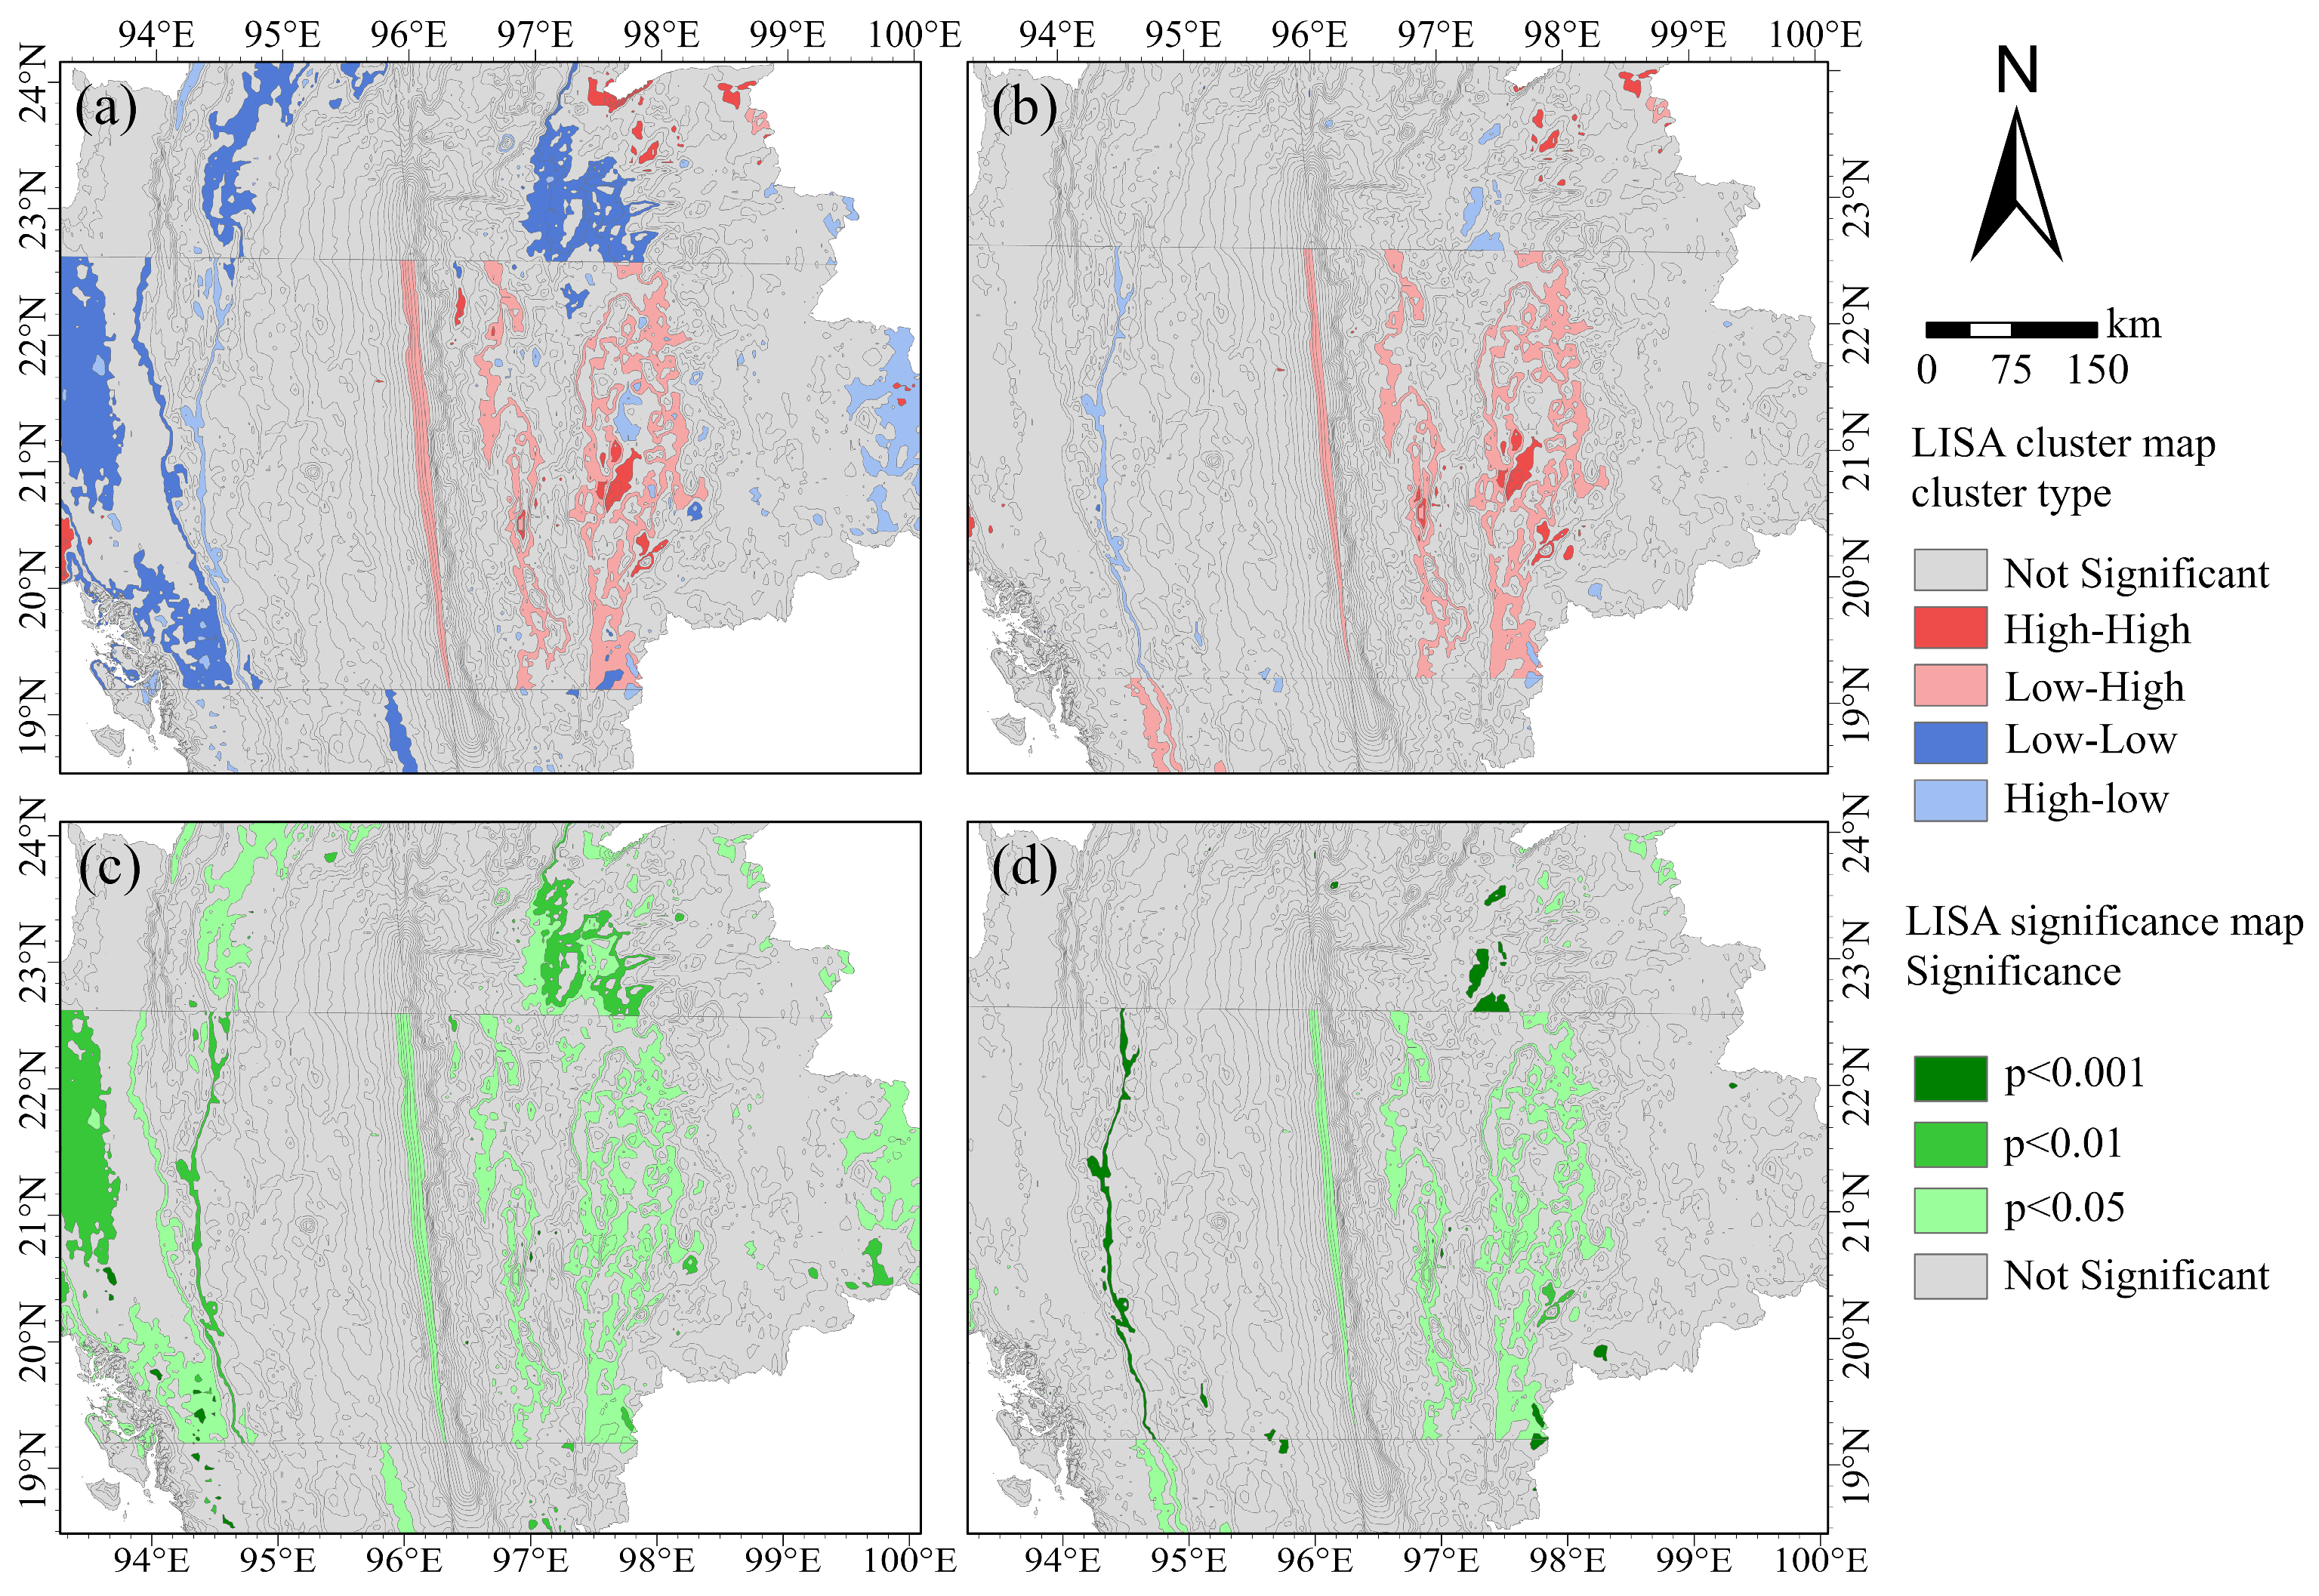
Based on directional and intensity segmentation units, this study conducted Bivariate LISA spatial clustering analyses of average nighttime light (NTL) variations with population density and building density, respectively. The results are shown in Figure 9. Significance tests indicate that in most directional and intensity units, the spatial association between NTL variation and both population density and building density reached statistical significance (two-tailed p < 0.05; Figure 9c,d). This demonstrates a clear spatial coupling relationship between nighttime light variation and social exposure characteristics. It should be noted that the bivariate LISA results in Figure 9 were derived from the direction and intensity analytical units. Therefore, some local abrupt changes near adjacent sector boundaries may partly arise from the hard partition of the regional units, rather than fully corresponding to actual discontinuities in earthquake impacts.
From the perspective of cluster composition, four typical coupling patterns emerged within the study area, with low–high (L–H) units dominating while high–high (H–H) units remained relatively scarce. Post-earthquake assessments revealed distinct loss states and functional performances across different clustering patterns.
L–H type clustering units exhibit significantly reduced nighttime brightness and higher population or building density. Spatially, they are primarily distributed in medium-to-high intensity zones near the epicenter and its adjacent north–south areas. These units correspond to regions with concentrated populations, dense built environments, and markedly diminished nighttime activity levels. They reflect the spatially concentrated spatial characteristics of post-earthquake damage to urban functions and infrastructure, representing one of the most prominent disaster loss patterns in this earthquake.
H–L type clustering units exhibit relatively limited or even rebounding nighttime light changes, coupled with lower population and building densities. These units are predominantly distributed in low-to-moderate intensity zones or urban peripheries, where nighttime light changes did not show a significant decline commensurate with seismic intensity. This reflects the functional capacity of these areas to maintain or rapidly restore nighttime activity levels post earthquake, indicating relatively limited damage and loss.
L–L-type clustering units exhibit reduced nighttime brightness but overall lower levels of population and building exposure. Spatially, they are predominantly located on the periphery of high-intensity zones or at regional margins. The diminished nighttime brightness in these areas indicates some impact on infrastructure or energy systems. However, due to limited societal exposure, the overall scale of losses remains relatively small. These areas thus present a pattern of functional impairment coupled with comparatively low overall exposure.
H–H type clusters exhibit the lowest number of units, characterized by negligible or increasing noctilucent changes alongside higher population or building density. These units are predominantly scattered across certain urban or secondary center areas, indicating sustained or enhanced nighttime activity even under high exposure conditions. Their post-earthquake functional status demonstrates certain resilience characteristics.
From the distribution of cluster types, low–high (L-H) clusters dominated both in the NTL–population density and NTL–building density Bivariate LISA results for the Myanmar earthquake, while high–high (H-H) clusters accounted for a relatively smaller proportion. L-H units primarily exhibited significant declines in nighttime light emissions alongside relatively high population or building densities. Spatially, they were concentrated in medium-to-high intensity zones near the epicenter and its adjacent northern and southern regions. In contrast, L-L and H-L units were more prevalent in areas with lower intensity or limited population and building exposure.
Comparing the two sets of Bivariate results reveals that the clustering boundaries between NTL and building density are generally clearer than those between NTL and population density. The number of units passing significance tests is also relatively higher, indicating that building exposure provides a more stable indicator for capturing the spatial heterogeneity of nighttime light changes. Overall, the Bivariate LISA analysis reveals a significant and directional spatial coupling pattern between post-earthquake nighttime light changes and population density as well as building exposure. This provides a spatial evidence foundation for subsequent discussions on earthquake damage heterogeneity and its implications for risk assessment.

5. Discussion

5.1. Applicability of Multi-Scale NTL Characterization for Post-Earthquake Assessment

At larger scales (county-level statistics, Figure 4), NTL variations reliably delineate the overall affected area near Myanmar’s epicenter, facilitating rapid assessment of the macro-level distribution of primary disaster zones. However, spatial aggregation at such scales inevitably averages out local variations, diminishing the intensity differences within regions and making it particularly challenging to identify localized damaged patches or intra-urban disparities. For example, Yamethin county exhibited a decline rate of 36.73% at the county level, which was not prominent among all county-level units. However, the corresponding urban built-up patch, Pyinmana, showed a much larger decline rate of 69.04%, ranking as the highest among all patches at the patch level. In comparison, patch-level and pixel-level analyses (Figure 5b and Figure 6) make it possible to identify damaged patches and their boundaries within built-up areas, thereby revealing the non-uniform distribution of earthquake impacts within counties. This enhances the ability to identify potential high-risk disaster units. Simultaneously, refining the scale increases sensitivity to short-term disturbances and observational noise: at the patch and pixel scales, the proportion of local brightening or abnormal fluctuations increases in areas distant from high-intensity zones. For example, MongHsat and Kengtung in eastern Shan State exhibited varying degrees of increased brightness after the earthquake (Figure 6), potentially reflecting the combined effects of non-direct earthquake damage factors such as the deployment of rescue resources, increased emergency lighting, and short-term population gatherings [53,54,55,56,57,58]. Therefore, fine-scale results are better suited for locating and characterizing local heterogeneity, but their interpretation requires mutual constraints with macro-scale patterns and externally validated information.
As pre-earthquake nighttime illumination levels often reflect regional lighting activity intensity and the built environment, thereby influencing the magnitude of post-earthquake nighttime light signal changes, this study examines variations in these changes across different scales. Focusing on the relationship between pre-earthquake illumination levels and post-earthquake decline rates, this study compares spatial performance differences at three scales: county, patch, and pixel (Figure 10). At the county level (Figure 10a), counties with medium-to-high intensity (Intensity ≥ VI) generally cluster in areas with higher pre-earthquake illumination levels and larger decline rates. This indicates that post-earthquake nighttime light decay tends to occur first in urban counties with stronger pre-earthquake illumination activity. Thus, the county scale is suitable for rapidly identifying spatial units experiencing more pronounced functional disturbances. At the patch level scale (Figure 10b), it is evident that the patches of ZaBuThiRi, Tatkon, SeGyi, and ShweDarTharSi urban areas are all located within Yamethin county and fall within the high-intensity zone (Intensity ≥ VIII). However, the decline rates for these urban areas show significant variation. Specifically, the decline rate for the ZaBuThiRi urban area was −69.04%, while that for the ShweDarTharSi urban area was only −14.29%. This indicates that under similar intensity conditions, decline signals within the same county are often not uniformly distributed but concentrated in specific built-up patch areas. This suggests that county-level statistics may exhibit an averaging effect, obscuring the concentrated distribution of damaged patches within counties. Therefore, the patch level helps supplement this spatial heterogeneity information. At the pixel scale (Figure 10c), due to the predominance of low-illumination pixels across Myanmar, the two-dimensional density distribution is more concentrated in low-illumination areas. However, clusters dominated by decreasing values remain observable in high-illumination regions, indicating that post-earthquake attenuation signals exhibit clearer spatial expression in well-lit zones. Simultaneously, relative change rates exhibit greater dispersion and extreme values under low illumination conditions, suggesting that relying solely on pixel-level metrics may exaggerate background fluctuations and reduce interpretation robustness. Furthermore, this study selected high-illumination pixels with pre-earthquake nighttime brightness values exceeding 15 nW/cm2/sr at the pixel level and compared decline rate distributions across different intensity groups (Figure 10d). The results indicate that the rate of decline does not exhibit a monotonically increasing trend with increasing seismic intensity. This suggests that post-earthquake nighttime light attenuation is not solely governed by seismic intensity but is also jointly influenced by factors such as pre-earthquake illumination levels, built environment characteristics, and the resilience of the power system.
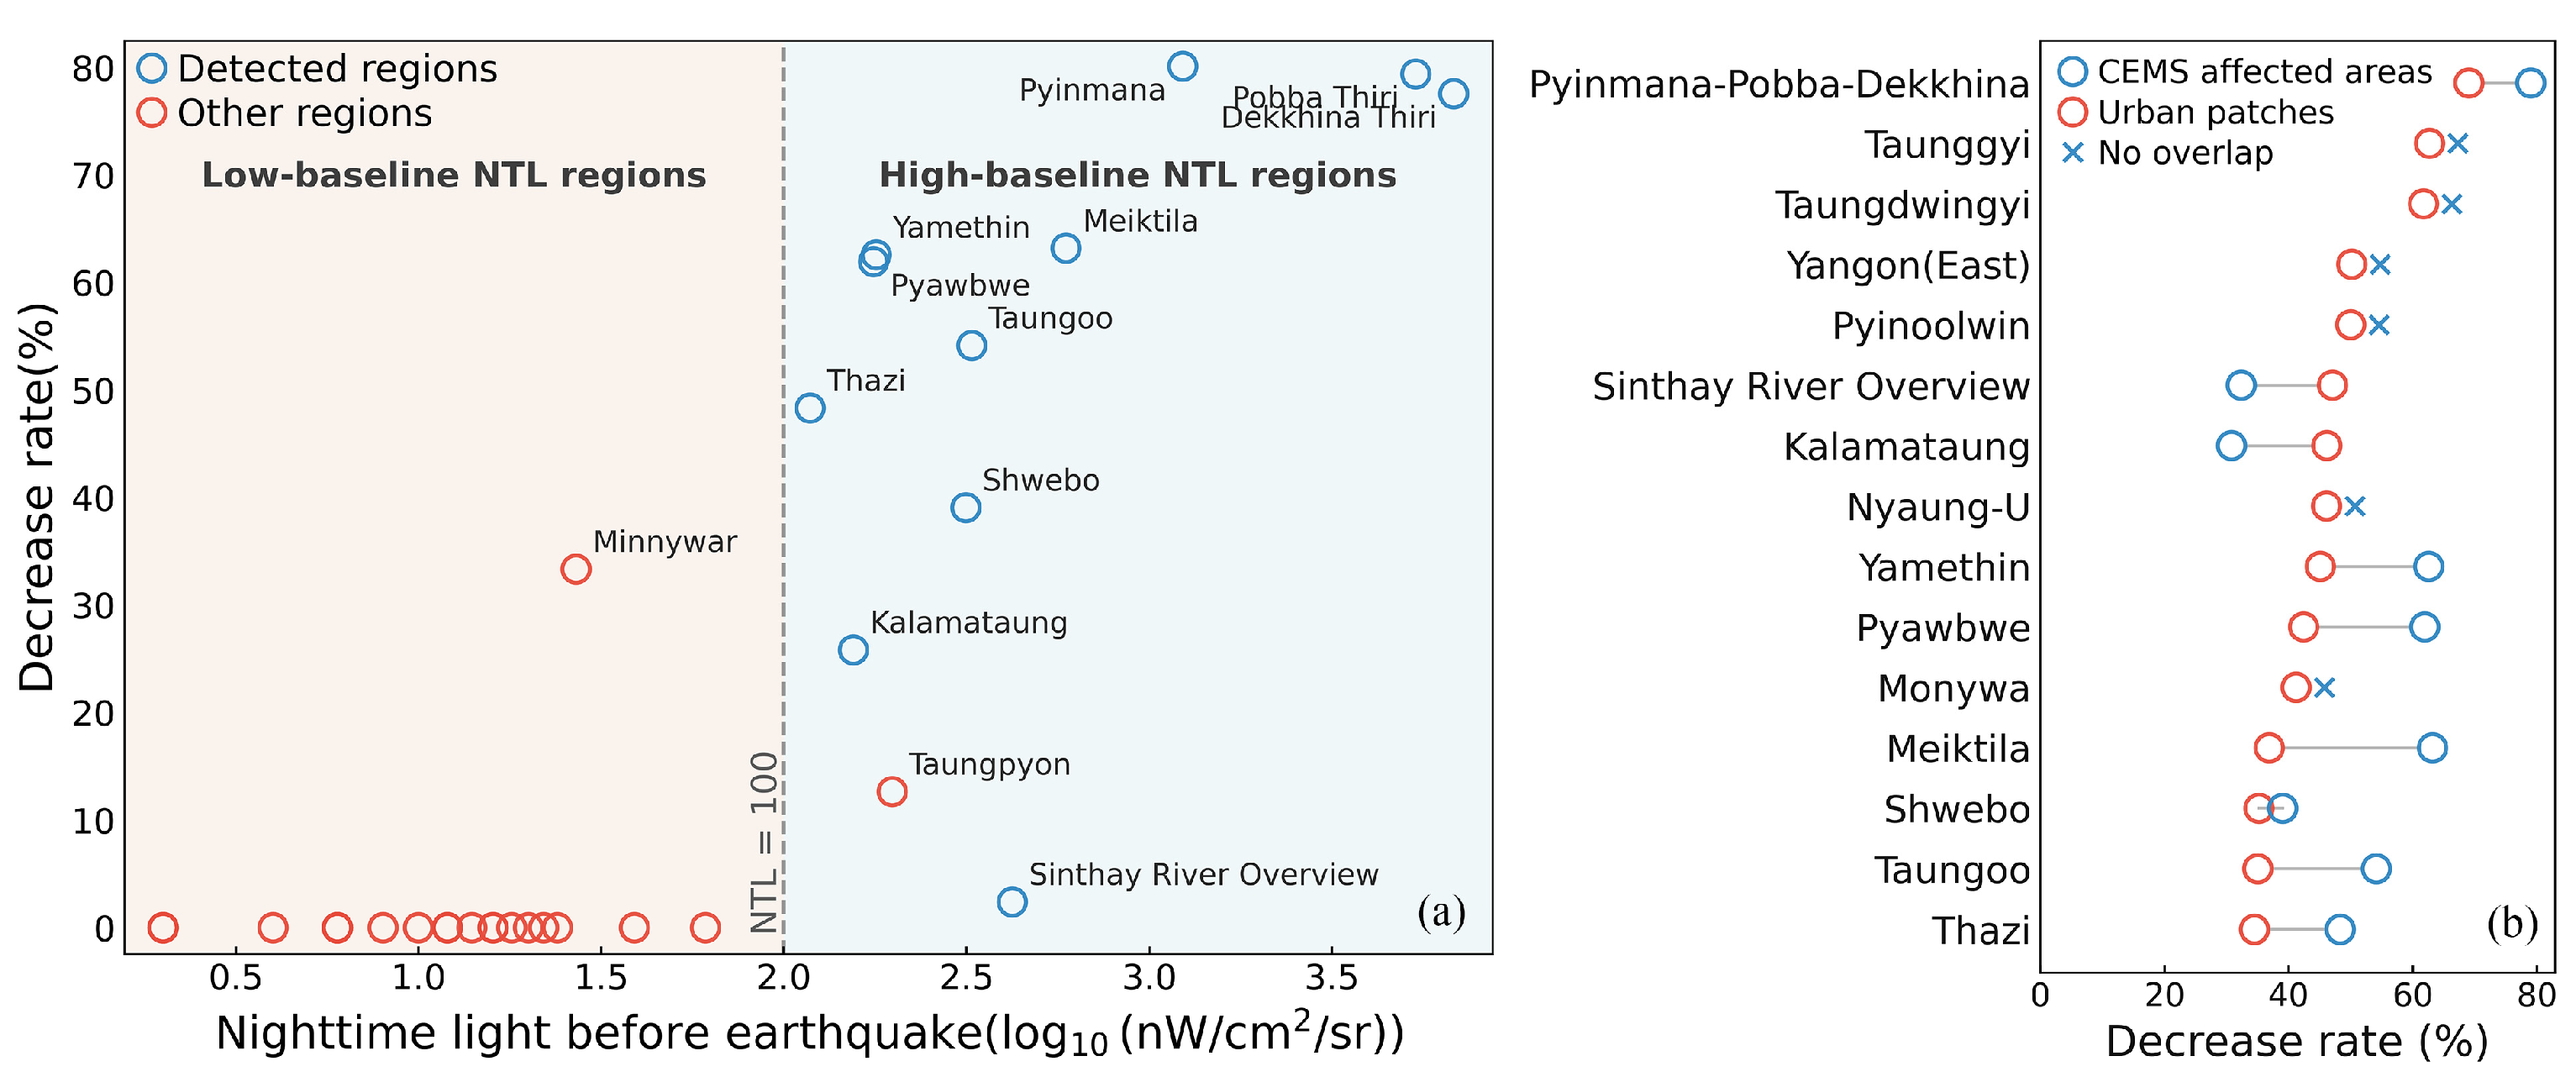
Based on the aforementioned scale difference analysis, to test the external consistency of nighttime radiance identification results in spatial localization and loss intensity characterization, this study conducted a spatial comparison analysis between the post-disaster affected areas released by CEMS Rapid Mapping and the patch-level nighttime radiance loss assessment results [59]. The comparison results are shown in Figure 11a. It can be observed that in post-disaster affected areas with higher pre-earthquake nighttime illumination levels, the vast majority of regions exhibit spatial overlap or significant intersection with the high-decline patches identified in this study. This indicates that when an area possesses high nighttime illumination levels and electricity activity intensity, the patch-level method can reliably capture functional disturbance signals triggered by earthquakes. Conversely, in validation areas with low pre-earthquake nighttime illumination, changes in nighttime glow may be closer to background levels or exhibit minimal variation, resulting in relatively limited detection capability. Consequently, even if post-disaster impact signs exist, it is difficult to form clear, stable decline signals in nighttime illumination data, rendering them ineffective for identification at the patch-level scale. This phenomenon reflects the limited sensitivity of nighttime illumination methods in areas with low illumination levels. This limitation requires additional attention in subsequent risk classification. It indicates that although H-L and H-H types may show limited nighttime light decline or even slight local increases, they do not necessarily represent light earthquake damage, because some of these areas may belong to low-baseline-illumination regions, which is one of the inherent limitations of nighttime light data in disaster loss identification. At the same time, we also found that Yangon was not identified within the major affected areas in the CEMS product, whereas its nighttime light decline remained relatively pronounced in our results. This suggests that nighttime light decline may reflect not only hard physical damage such as building collapse, but also disturbances in urban functional systems, including power supply, transport operation, communication, and commercial activity.
Figure 11b highlights the 15 regions with the steepest decline rates at the image patch level, comparing them with the nighttime light decline rates in the corresponding post-disaster affected areas. The calculated decline rates show broadly similar magnitudes, with differences primarily stemming from statistical discrepancies due to non-identical spatial boundaries. This result indicates that under high nighttime illumination conditions, the patch-level scale not only exhibits spatial consistency but also provides comparable characterization of post-earthquake nighttime light attenuation.
In summary, multi-scale integrated analysis achieves complementarity between identifying macro-level patterns and characterizing local heterogeneity: the county-level scale facilitates rapid identification of primary affected areas, while patch and pixel scales supplement critical spatial details and pinpoint locally high-loss patches. Comparative validation with CEMS data further demonstrates that this method exhibits greater stability in highly illuminated built-up areas, whereas in low-illumination zones, it requires cross-validation with post-disaster interpretation or other multi-source data.

5.2. Spatial Interpretation of NTL Changes Under Different Seismic Intensities and Directions

The directional differences presented in Section 4.2 suggest that nighttime light attenuation was not spatially uniform, but was more concentrated in the north–south direction of the intensity belt. The observed directional differences are closely related to the geometric morphology of the seismic rupture and the propagation characteristics of seismic motion. The rupture zone of this Mw 7.7 Myanmar earthquake exhibited an overall near-north–south orientation. Seismic energy propagated and attenuated relatively slowly along this direction, whereas attenuation was significantly faster in the east–west direction. This led to pronounced spatial asymmetry in seismic damage distribution. This feature was particularly pronounced in the directional units distributed along the epicenter trend, showing good consistency with the pattern of concentrated nighttime light reduction revealed in Section 4.2. Overall, the spatiotemporal variations in NTL following an earthquake serve as a remote sensing indicator of urban functional disruption, reflecting impacts such as power outages, infrastructure damage, and changes in residential activity. When combined with seismic intensity and ground motion data, they collectively characterize the spatial distribution of earthquake damage and its attenuation gradient.
Urban exposure characteristics and post-earthquake human activities also significantly influenced changes in nighttime light. The results indicate that units experiencing the most pronounced NTL reduction typically exhibit high population and building density, primarily concentrated in Mandalay, Naypyitaw and their surrounding areas, as well as certain densely populated zones along the S5 direction (Figure 7b,c and Figure 8). This indicates that the decline in nighttime light reflects not only direct infrastructure damage caused by the earthquake but also the combined effects of concentrated urban functional nodes, damage to critical facilities, and post-earthquake power grid dispatch and load switching. In contrast, the increase in nighttime brightness observed in certain directions and intensity units was predominantly distributed in areas with relatively lower population and building densities, such as MongHsat and Kengtung in eastern Shan State, and Mawlamyine in Mon State. Although these areas fall within zones of certain seismic intensity, the nighttime light changes are not entirely driven by direct earthquake damage. Instead, they are more likely associated with post-earthquake emergency response deployments, increased temporary lighting, and phased transfers of power resources. This phenomenon indicates that in post-earthquake assessments, nighttime light changes contain both signals of disaster losses and interference information superimposed by human response behaviors.
Therefore, the decomposition of intensity and azimuth provides a crucial supplement to the application of nighttime light data in post-earthquake loss assessment. This method helps reveal spatially non-uniform earthquake impacts under similar intensity conditions. Further integrating nighttime light variations with population and building exposure data also provides a more informative basis for identifying post-earthquake response-priority areas. Changes in nighttime light in these regions are more likely to reflect earthquake-related functional disruption and possible infrastructure impacts, but at the same time should not be fully equated with the severity of physical damage. Conversely, in areas with higher seismic intensity but lower population and building exposure levels, changes in nighttime light are more likely influenced by post-earthquake emergency response activities or temporary electricity usage. This approach helps interpret nighttime light change together with exposure conditions, which is particularly useful in short-term post-earthquake decision-making rather than relying on nighttime light alone.
It should also be noted that the six-direction partition is essentially an analytical representation for comparing azimuthal differences and does not imply that earthquake impacts are spatially discrete. Some local abrupt changes near boundaries in results such as those in Figure 9 may partly be influenced by truncation effects introduced by the hard partition, rather than fully representing true discontinuities in the disaster process. Future studies may reduce this boundary effect by using overlapping directional sectors, moving-window azimuth statistics, or continuous weighting methods, thereby better capturing the continuous spatial gradient of post-earthquake impacts.
More broadly, the present “intensity–azimuth” decomposition framework was designed mainly for rapid post-earthquake assessment, with priority given to data availability, indicator consistency, methodological simplicity, and time efficiency, so as to capture the directional heterogeneity of nighttime light changes and their relationship with exposure characteristics. Limited by data conditions, manuscript scope, and the time cost of constructing a more complex composite zoning framework, this study did not further incorporate additional regional attributes into the same scheme, such as topographical environment, administrative functional hierarchy, economic development level, or the distinction between urban cores and rural areas. In fact, these factors may further influence the spatial distribution of earthquake damage, the pace of functional recovery, and the spatial expression of nighttime light responses. Future studies could build upon the current “intensity–azimuth” framework by further integrating terrain conditions, administrative functions, economic development levels, urban–rural structural differences, and key infrastructure characteristics, thereby refining the zoning units and generating more actionable post-earthquake functional zoning and emergency response indications.

5.3. Implications and Risk Indications of the Coupled Patterns Between NTL and Population/Building Exposure

5.3.1. Implications of the Coupling Between NTL Changes and Social Exposure for Earthquake Damage Assessment

Building on the coupling patterns identified in Section 4.3, this section focuses on their implications for interpreting post-earthquake disturbance under different exposure contexts.
In the recent Mw 7.7 earthquake in Myanmar, Low Nighttime Luminance Change–High Exposure (L-H) units vividly illustrated the direct impact of seismic damage on urban functional systems. These units exhibited a significant decline in nighttime luminance overlapping with areas of high population or building density, typically supporting high levels of nighttime electricity demand and urban activity. When infrastructure is damaged or power systems fail, their nighttime light response becomes more sensitive, forming spatially contiguous low-brightness patches. Cities like Mandalay, Naypyitaw, and Yangon exhibited these characteristics during this earthquake [60,61,62,63]. Thus, L-H clusters may serve as useful indicators of concentrated post-earthquake disturbance in high-exposure contexts, although their interpretation still requires external corroboration and should not be treated as a direct equivalent of damage severity.
Meanwhile, the findings also indicate that not all high-exposure units exhibited significant nighttime light attenuation following the earthquake. Some units showed limited changes in nighttime light, with certain areas even experiencing a rebound (H-H, H-L). For instance, nighttime light rebounded in some cities in Rakhine State after the earthquake [62]. This reflects variations in infrastructure resilience, functional specialization, and post-earthquake emergency response capabilities across different regions within highly exposed contexts. It indicates that high societal exposure does not necessarily lead to a significant decline in nighttime light, and that the spatial distribution of earthquake damage exhibits marked heterogeneity.
For areas with lower population and building exposure levels, the disaster implications reflected by nighttime light responses require more cautious interpretation. L-L units indicate relatively more negative nighttime light responses under low-exposure conditions, which may reflect disturbances to local infrastructure or energy systems [61]. However, H-L units indicate relatively stable or positive nighttime light responses under similarly low-exposure conditions, and in low-baseline illumination areas such responses do not necessarily imply light earthquake damage. In rural areas or regions with weak power infrastructure, even when physical damage is substantial, the post-earthquake nighttime light signal may remain close to the background level or show only limited variation, thereby reducing detectability. The external consistency validation results in Section 5.1 support this point. Therefore, areas characterized by H-L or H-H should not be uniformly and simply classified as lightly damaged or safe areas, but should instead be interpreted comprehensively in combination with satellite imagery, official disaster statistics, and other external evidence.
Overall, the spatial coupling results between nighttime brightness and social exposure reveal typological differences in post-earthquake functional responses: L-H units are more likely to indicate concentrated high-loss states, L-L units reflect detectable negative responses under low exposure, while H-L and H-H units may represent functional maintenance, response-related enhancement, or reduced detectability in low-baseline areas. Therefore, these clustering types should be interpreted in conjunction with baseline illumination conditions and external evidence, rather than being treated as direct equivalents of damage severity. This finding indicates that post-earthquake changes in nighttime light do not merely depict the “magnitude of loss”, but rather reflect the combined effects of disaster impact, societal exposure, and functional recovery processes. By explicitly incorporating population and building exposure data into the analysis, the interpretive depth and reliability of nighttime light data in identifying post-earthquake losses can be significantly enhanced.

5.3.2. Risk Classification and Disaster Prevention Measures

Building upon the aforementioned spatial coupling framework, this study further attempts to conduct preliminary risk classification of the study area based on the Bivariate LISA clustering types (Figure 12), exploring the potential application value of combined nighttime light and social exposure analysis in rapid post-earthquake assessment. Based on the clustering results, the study area is preliminarily categorized into three reference-oriented risk levels: high-risk (L–H), medium-risk (L–L), and candidate low-risk or support zones (H–L or H–H).
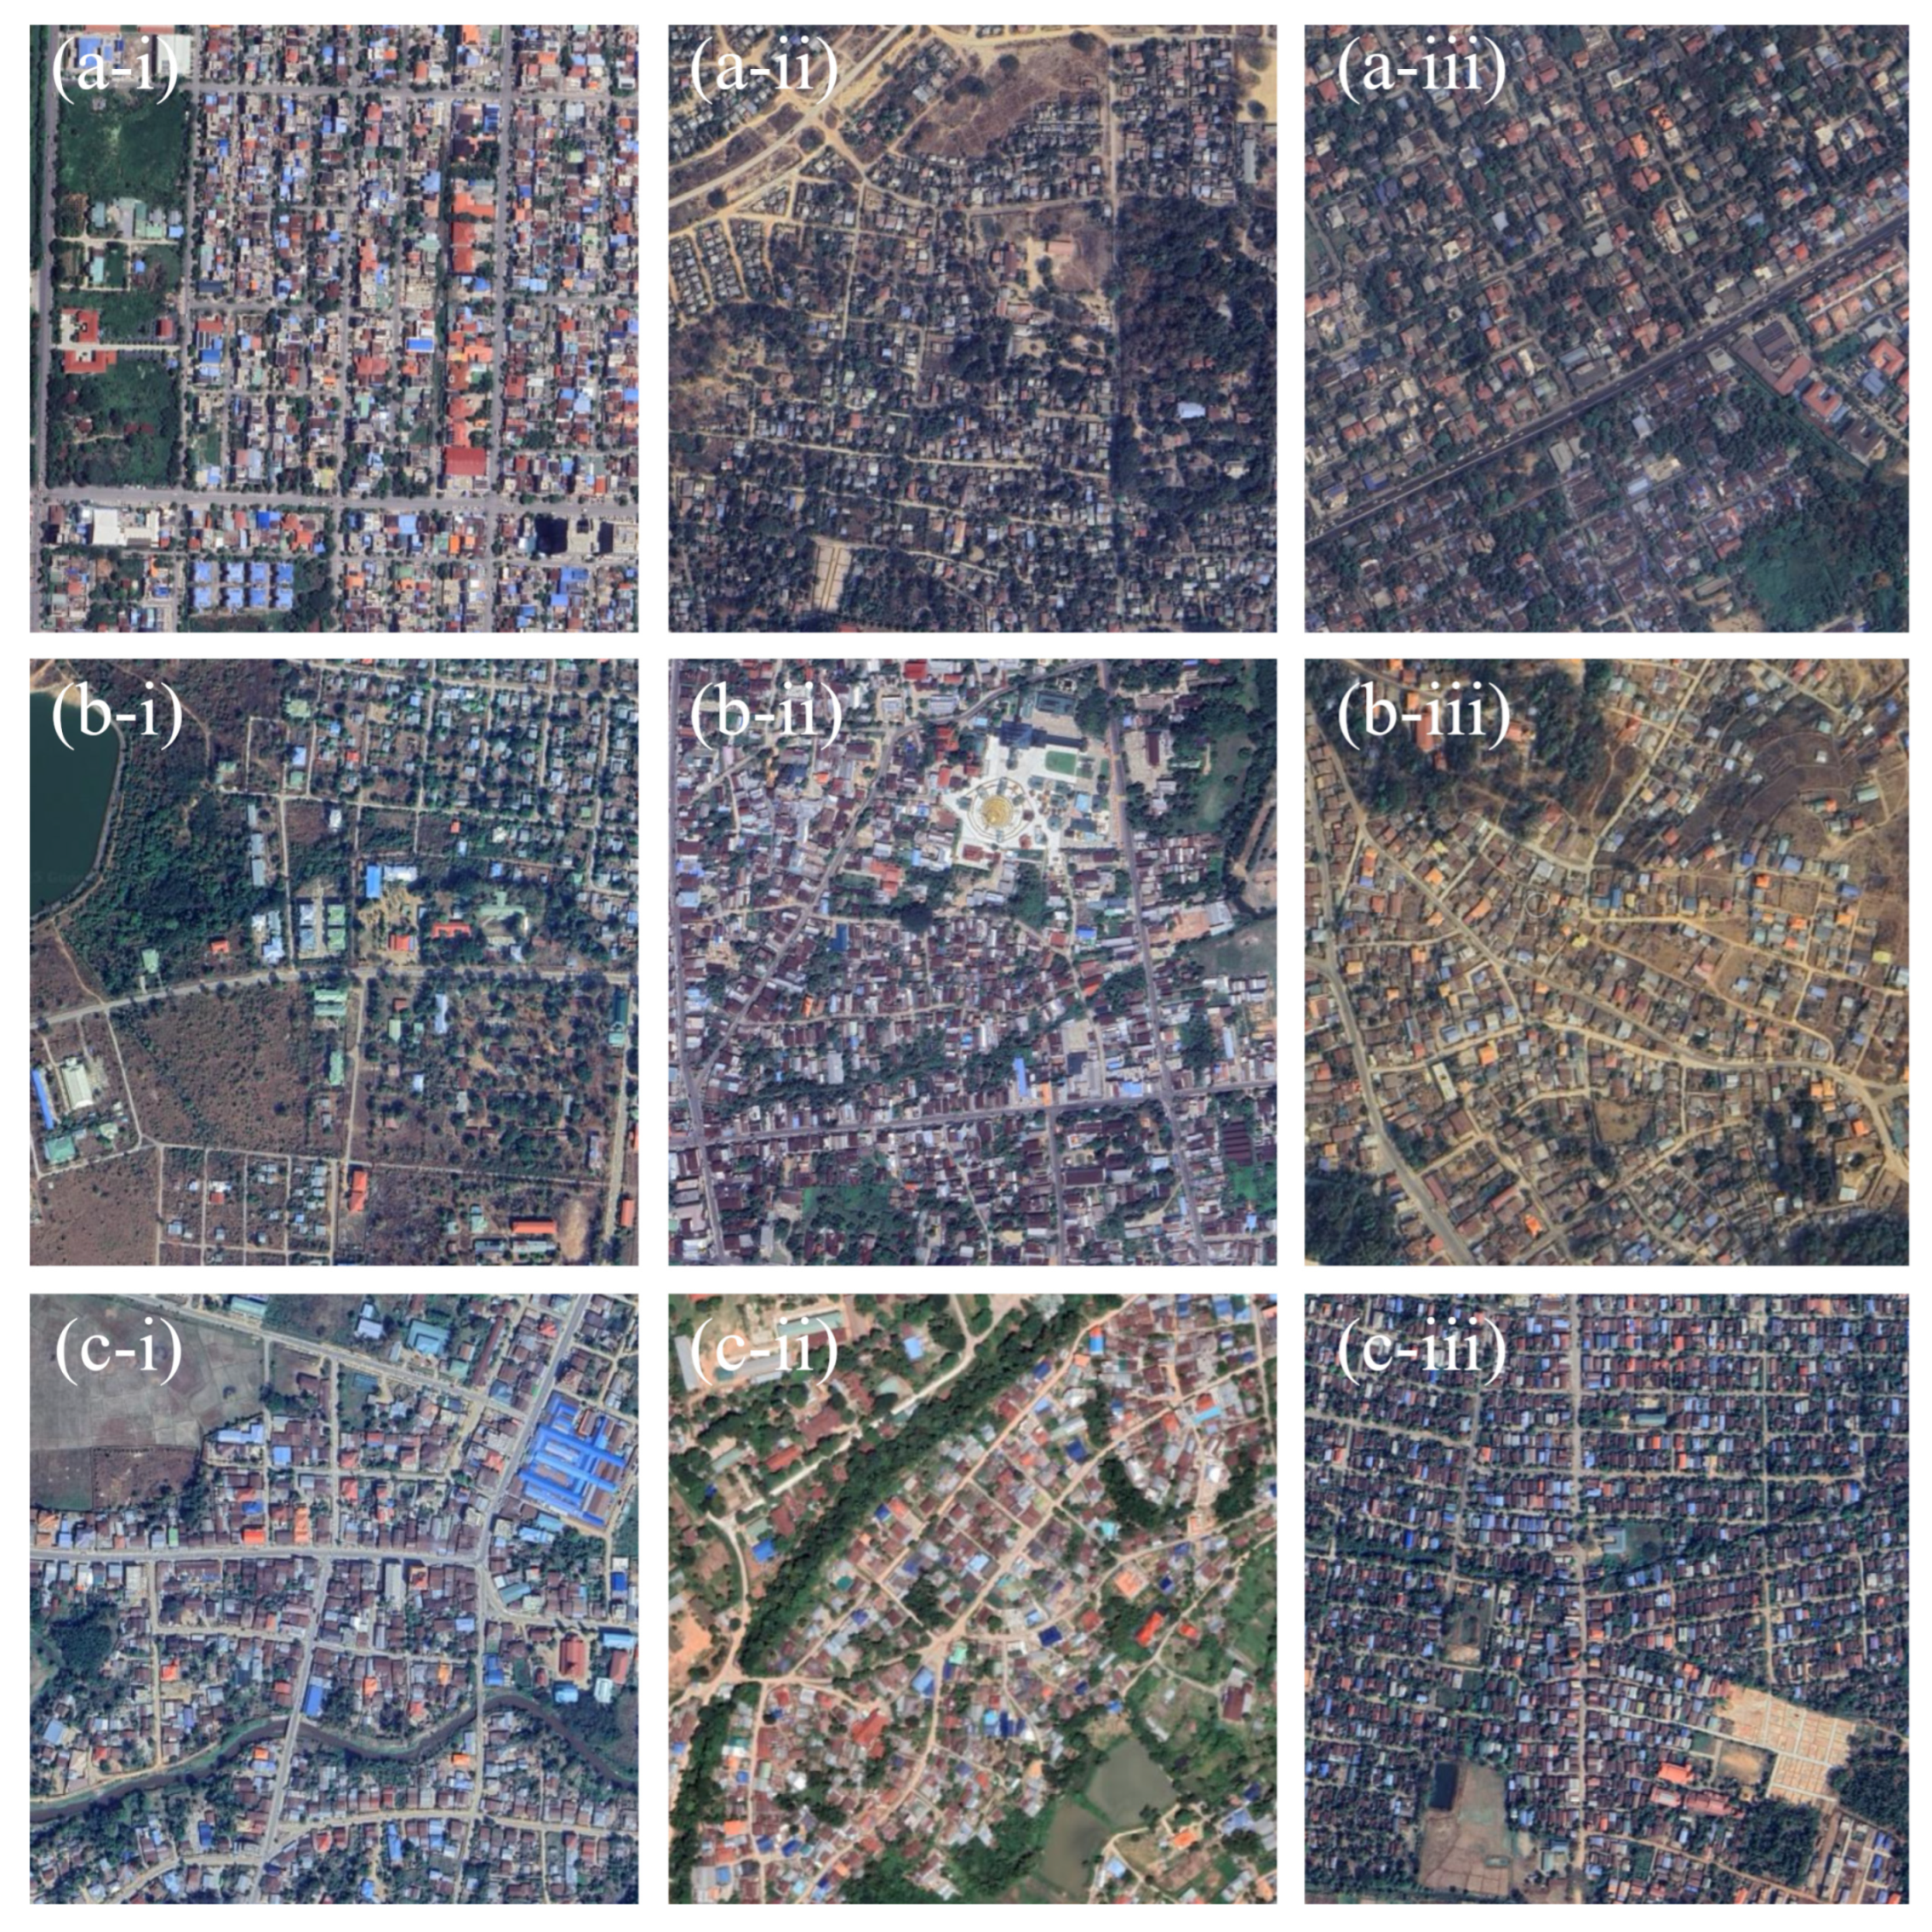
High-risk zones (L–H types), as shown in Figure 12(a-i,a-ii,a-iii), primarily correspond to urban units exhibiting significant declines in nighttime brightness alongside high concentrations of population or buildings. Typical examples include Mandalay (Figure 12a-i), Naypyitaw (Figure 12a-ii), and Yangon (Figure 12a-iii). These cities exhibited high population and built environment density prior to the earthquake, with post-earthquake nighttime brightness showing marked reduction. This indicates concentrated impacts on urban nighttime activities and functional levels, with spatial distribution exhibiting strong agglomeration. For such high-risk areas, post-earthquake emergency response and disaster prevention efforts should prioritize the rapid restoration of core urban functions. This includes ensuring power and communication services, repairing critical infrastructure, and maintaining lifeline systems in high-density residential and employment zones. Pre-earthquake preparations should focus on enhancing infrastructure resilience and refining emergency response plans for highly exposed urban units.
Representative cities in medium-risk zones (L–L type) include Bawlake (Figure 12b-i), Dawei (Figure 12b-ii) and Kyaukme (Figure 12b-iii). These areas also experience a decline in nighttime brightness, but population and building exposure levels remain relatively low. They are predominantly distributed along the peripheries of urban belts or regional margins, exhibiting an overall dispersed pattern. Disaster impacts in these areas manifest as localized functional disruptions rather than concentrated high losses. Accordingly, disaster prevention and emergency response efforts focus on safeguarding the basic operational capacity of critical nodes, such as town centers, transport hubs and regional service facilities, by ensuring phased supply and maintaining connectivity, rather than on large-scale repairs.
Candidate low-risk or support zones (H-L or H-H types), as shown in Figure 12(c-i,c-ii,c-iii), include representative cities such as MongHsat (Figure 12c-i), Kengtung (Figure 12c-ii), and Mawlamyine (Figure 12c-iii). These areas exhibit sustained or periodically enhanced nighttime brightness following the earthquake and are relatively scattered in spatial distribution. The nighttime light response in these areas is more likely to reflect the combined effects of emergency response deployment, functional relocation, temporary lighting, and local infrastructure resilience [61], rather than simply indicating lower disaster-loss severity. In this study, these three cities are regarded as relatively low-risk cases only after combined interpretation using satellite imagery and official post-earthquake statistics. Therefore, H-L and H-H types should be treated as candidate low-risk or support zones requiring external verification, rather than direct evidence of limited damage. Accordingly, for such areas, post-earthquake response should focus not only on maintaining their operational stability as emergency support or transitional functional zones, but also on avoiding direct underestimation of disaster losses based solely on nighttime light patterns.
It should be noted that this risk classification emphasizes a relative risk indicator, serving to assist in the rapid identification of potential functional impairment levels and emergency response priorities across different areas following an earthquake. It is not intended to replace on-site investigations or detailed loss assessments. Nighttime light changes carry varying implications across different societal exposure contexts. Their interpretation must be comprehensively validated by integrating the operational status of infrastructure, traffic conditions, and multi-source remote sensing or field data to enhance the reliability and applicability of risk assessments.

6. Conclusions

This study uses the 2025 Myanmar Mw 7.7 earthquake as a case example. Based on daily-scale nighttime light data, it characterizes pre-earthquake and post-earthquake nighttime light changes at three spatial scales: county level, patch level, and pixel level. Furthermore, a spatial analysis framework integrating “intensity zones–azimuth” was developed. By incorporating population and building density data and applying the Bivariate LISA method, the spatial coupling between nighttime light changes and societal exposure was demonstrated. Concurrently, CEMS Rapid Mapping post-disaster interpretation products were introduced for external consistency validation, thereby establishing a repeatable and scalable rapid assessment analysis workflow for post-earthquake scenarios.
Research findings indicate the following: (1) Nighttime light loss exhibits a pronounced scale effect: coarse scales are more effective at identifying affected areas but tend to obscure damaged cores within counties; fine scales better highlight damaged clusters within built-up areas but are susceptible to diurnal fluctuations and noise interference in low-illuminance zones. Therefore, multi-scale integration simultaneously captures both the extent of affected areas and the core damage zones, enhancing the consistency of interpreting loss signals in highly illuminated built-up areas. This approach achieves a better balance between assessment speed and accuracy. (2) The decline in nighttime light exhibits spatial directional asymmetry: discernible differences exist in the reduction rates of units at different orientations within the same intensity zone, with attenuation being more concentrated along the primary rupture trend. Concurrently, a few low-to-medium intensity units showed phased rebounds, indicating that nighttime light variations reflect not only direct seismic damage but also superimposed signals from human activities such as emergency response and short-term functional relocation. (3) The relationship between nighttime light changes and social exposure exhibits complex spatial coupling rather than a simple linear correlation: cities with high exposure are more likely to experience significant declines in nighttime light after earthquakes, indicating more concentrated functional damage. Conversely, increases in nighttime light in some low-exposure areas primarily reflect the clustering of emergency response and support activities. However, the results also show that high exposure does not necessarily correspond to severe damage, as nighttime light responses are further influenced by factors such as building seismic resistance and infrastructure resilience.
Building upon this foundation, this paper employs Bivariate LISA clustering results to conduct a preliminary risk classification of the study area. Regions are preliminarily categorized into three tiers: high risk (L-H), medium risk (L-L) and candidate low-risk or support zones (H-L/H-H). The findings reveal that high-risk cities such as Mandalay, Naypyidaw and Yangon, which are characterized by high population density and concentrated built environments, exhibited significantly diminished nighttime light intensity following the earthquake. Consequently, these cities should be prioritized for post-earthquake emergency repairs, power supply assurance and resource allocation. Although medium-risk areas demonstrate lower overall exposure, attention must still be paid to the phased recovery capacity of critical nodes. Some low-risk areas assumed emergency assembly and transportation functions post earthquake. However, for low-baseline illumination areas, H-L and H-H types should not be directly interpreted as indicating limited damage, and their identification still requires comprehensive verification using external evidence.
Overall, this study demonstrates the feasibility of using daily-scale nighttime light data for rapid identification of post-earthquake spatial disturbance patterns. It also demonstrates that integrating nighttime light variations with social exposure factors within a multi-scale, multidirectional analytical framework facilitates a more comprehensive revelation of the spatial heterogeneity of earthquake damage. This approach provides valuable insights for post-disaster assessments and emergency decision-making. Future studies may further incorporate regional attributes such as topographical setting, administrative function, economic development level, and urban—rural differences, so as to improve the practical applicability of post-earthquake zoning results in emergency management.

Author Contributions

Methodology, Z.W.; Software, Z.W.; Validation, Z.W.; Data curation, Z.W., X.H. and Y.H.; Writing—original draft preparation, Z.W.; Writing—review and editing, X.L. and X.H.; Supervision, X.L. and X.H.; Project administration, X.L.; Funding acquisition, X.L. All authors have read and agreed to the published version of the manuscript.

Funding

This research was funded by the General Program of the National Natural Science Foundation of China, Spatiotemporal Changes and Impact Effects of Exposure of Earthquake Disaster-Bearing Elements in the North–South Seismic Belt (Grant No. 42477504); the Scientific Research Fund from the Institute of Seismology, CEA and National Institute of Natural Hazards, Ministry of Emergency Management of China, Optimization of Intelligent Visual Perception and Scenario Construction Models for Urban Disaster-Bearing Elements (Grant No. IS202456364); the Directed Project of Hubei Key Laboratory of Earthquake Early Warning, Application of Key Technologies for Rapid Refined Assessment (Grant No. 2025CSA113); and the Youth Project from the Hubei Research Center for Basic Disciplines of Earth Sciences (Grant No. HRCES-202509).

Data Availability Statement

The data presented in this study are openly available in the NASA Black Marble VNP46A2 repository at: https://ladsweb.modaps.eosdis.nasa.gov/missions-and-measurements/products/VNP46A2 (accessed on 22 April 2025).

Conflicts of Interest

The authors declare no conflicts of interest. The funders had no role in the design of the study; in the collection, analyses, or interpretation of data; in the writing of the manuscript; or in the decision to publish the results.

References

  1. Aksoy, C.G.; Chupilkin, M.; Koczan, Z.; Plekhanov, A. Unearthing the impact of earthquakes: A review of economic and social consequences. J. Policy Anal. Manag. 2024, 44, 1450–1471. [Google Scholar] [CrossRef] [Scilit]
  2. Li, T.H. Risk assessment and management of geological disasters in geo-disaster prevention and control. Urban Constr. Plan. 2024, 1, 143–145. (In Chinese) [Google Scholar] [CrossRef] [Scilit]
  3. Mehtab, M. Earthquakes in the Tibet Region and Their Socioeconomic Impacts. Prev. Treat. Nat. Disasters 2023, 2, 24–31. [Google Scholar] [CrossRef] [Scilit]
  4. Thapa, R.K. Analyzing the Impacts and Challenges of Natural Disasters: A Comprehensive Study of Nepal’s 2072 Earthquake. Tri-Chandra J. Anthropol. 2025, 2, 122–140. [Google Scholar] [CrossRef] [Scilit]
  5. Wu, Y.; Liu, M.; Tian, B.; Tian, R.; Hu, Y. Disaster Resilience Evaluation of Mountainous Rural Communities: A Case Study of Representative Villages in the Anning River Basin, Liangshan Prefecture. Trop. Geogr. 2025, 45, 704–718. [Google Scholar] [CrossRef]
  6. Al Shafian, S.; Hu, D. Integrating machine learning and remote sensing in disaster management: A decadal review of post-disaster building damage assessment. Buildings 2024, 14, 2344. [Google Scholar] [CrossRef] [Scilit]
  7. Khan, S.M.; Shafi, I.; Butt, W.H.; Diez, I.d.l.T.; Flores, M.A.L.; Galán, J.C.; Ashraf, I. A Systematic Review of Disaster Management Systems: Approaches, Challenges, and Future Directions. Land 2023, 12, 1514. [Google Scholar] [CrossRef] [Scilit]
  8. Shafapourtehrany, M.; Batur, M.; Shabani, F.; Pradhan, B.; Kalantar, B.; Özener, H. A Comprehensive Review of Geospatial Technology Applications in Earthquake Preparedness, Emergency Management, and Damage Assessment. Remote Sens. 2023, 15, 1939. [Google Scholar] [CrossRef] [Scilit]
  9. Song, Y.; Li, Z.; Zhang, X.; Zhang, M. Study on Indirect Economic Impacts and Their Causes of the 2008 Wenchuan Earthquake. Nat. Hazards 2021, 108, 1971–1995. [Google Scholar] [CrossRef] [Scilit]
  10. An, L.Q.; Zhang, J.F.; Monteiro, R.; Zhang, L. A Review and Prospect of Earthquake Damage Assessment and Remote Sensing. Natl. Remote Sens. Bull. 2024, 28, 860–884. [Google Scholar] [CrossRef] [Scilit]
  11. Zhang, Q.; Zhao, C.Y.; Chen, X.R. Technical Progress and Development Trend of Geological Hazards Early Identification with Multi-Source Remote Sensing. Acta Geod. Cartogr. Sin. 2022, 51, 885–896. [Google Scholar]
  12. Kumari, S.; Agarwal, S.; Agrawal, N.K.; Agarwal, A.; Garg, M.C. A Comprehensive Review of Remote Sensing Technologies for Improved Geological Disaster Management. Geol. J. 2025, 60, 223–235. [Google Scholar] [CrossRef] [Scilit]
  13. Ye, P. Remote Sensing Approaches for Meteorological Disaster Monitoring: Recent Achievements and New Challenges. Int. J. Environ. Res. Public Health 2022, 19, 3701. [Google Scholar] [CrossRef] [Scilit]
  14. Jia, J.; Ye, W. Deep Learning for Earthquake Disaster Assessment: Objects, Data, Models, Stages, Challenges, and Opportunities. Remote Sens. 2023, 15, 4098. [Google Scholar] [CrossRef] [Scilit]
  15. Tatar, C.O.; Cabuk, S.N.; Ozturk, Y.; Kurkcuoglu, M.A.S.; Ozenen-Kavlak, M.; Ozturk, G.B.; Dabanli, A.; Kucukpehlivan, T.; Cabuk, A. Impacts of Earthquake Damage on Commercial Life: A RS and GIS Based Case Study of Kahramanmaraş Earthquakes. Int. J. Disaster Risk Reduct. 2024, 107, 104464. [Google Scholar] [CrossRef] [Scilit]
  16. Liu, L.C.; Zhang, Q.; Wu, F. Applications of Nighttime Light Remote Sensing in Emergency Studies: Cases and Progress. Remote Sens. Technol. Appl. 2025, 40, 14–24. Available online: http://www.rsta.ac.cn/CN/PDF/10.11873/j.issn.1004-0323.2025.1.0014 (accessed on 8 November 2025).
  17. Fu, B.; Xue, B. Temporal and Spatial Evolution Analysis and Correlation Measurement of Urban-Rural Fringes Based on Nighttime Light Data. Remote Sens. 2023, 16, 88. [Google Scholar] [CrossRef] [Scilit]
  18. Wang, F.; Miao, C.H.; Liu, F.G.; Chen, X.P.; Mi, W.B.; Hai, C.X.; Duan, D.G.; Wang, J.P.; Zhang, Z.C.; Wang, C.X. The Locality and Adaptability of Human Settlements in the Yellow River Basin: Challenges and Opportunities. J. Nat. Resour. 2021, 36, 1–26. Available online: https://www.jnr.ac.cn/EN/10.31497/zrzyxb.20210101 (accessed on 13 November 2025). [CrossRef] [Scilit]
  19. Yu, J.; Liu, L.; Ban, Y.; Zhang, Q. Evaluating Urban Development and Socio-Economic Disparity in India through Nighttime Light Data. J. Geogr. Sci. 2024, 34, 2440–2456. [Google Scholar] [CrossRef] [Scilit]
  20. Bo, J.; Li, Q.; Qi, W.; Wang, Y.; Zhao, X.; Zhang, Y. Research Progress and Discussion of Site Condition Effect on Ground Motion and Earthquake Damage. J. Jilin Univ. Earth Sci. Ed. 2021, 51, 1295–1305. [Google Scholar] [CrossRef]
  21. Li, F.; Liao, S.; Fu, X.; Liu, T. NPP-VIIRS Nighttime Lights Illustrate the Post-Earthquake Damage and Subsequent Economic Recovery in Hatay Province, Turkey. ISPRS Int. J. Geo-Inf. 2025, 14, 149. [Google Scholar] [CrossRef] [Scilit]
  22. Pan, Y.; Jiang, L.; Wang, J.; Ma, J.; Bao, S.; Lin, Y.; Shi, K. Mapping and Evaluating Spatiotemporal Patterns of Urban Expansion in Global Earthquake-Affected Areas: A Nighttime Light Remote Sensing Perspective. Int. J. Digit. Earth 2024, 17, 2419938. [Google Scholar] [CrossRef] [Scilit]
  23. Mu, T.; Zheng, Q.; He, S.Y. Robust Disaster Impact Assessment with Synthetic Control Modeling Framework and Daily Nighttime Light Time Series Images. IEEE Trans. Geosci. Remote Sens. 2025, 63, 4400712. [Google Scholar] [CrossRef] [Scilit]
  24. Wang, L.; Lei, H.; Xu, H. Analysis of Nighttime Light Changes and Trends in the 1-Year Anniversary of the Russia-Ukraine Conflict. IEEE J. Sel. Top. Appl. Earth Obs. Remote Sens. 2024, 17, 4084–4099. [Google Scholar] [CrossRef] [Scilit]
  25. Pan, G.Y.; Yu, H.Y.; Ren, Y.; Xia, B.; Ye, Q. Progress and Prospects of Mobile Observation for Earthquake Emergency Response. Earthq. Sci. Adv. 2025, 55, 311–321. Available online: https://www.gjdzdt.cn/article/doi/10.19987/j.dzkxjz.2024-113 (accessed on 22 October 2025).
  26. Wang, L.; Li, Z.; Han, J.; Fan, K.; Chen, Y.; Wang, J.; Fu, J. A Cost-Effective Earthquake Disaster Assessment Model for Power Systems Based on Nighttime Light Information. Appl. Sci. 2024, 14, 2325. [Google Scholar] [CrossRef] [Scilit]
  27. Yuan, Y.; Wang, C.; Liu, S.; Chen, Z.; Ma, X.; Li, W.; Zhang, L.; Yu, B. The Changes in Nighttime Lights Caused by the Turkey-Syria Earthquake Using NOAA-20 VIIRS Day/Night Band Data. Remote Sens. 2023, 15, 3438. [Google Scholar] [CrossRef] [Scilit]
  28. Zhao, X.; Yu, B.; Liu, Y.; Yao, S.; Lian, T.; Chen, L.; Yang, C.; Chen, Z.; Wu, J. NPP-VIIRS DNB Daily Data in Natural Disaster Assessment: Evidence from Selected Case Studies. Remote Sens. 2018, 10, 1526. [Google Scholar] [CrossRef] [Scilit]
  29. Gao, S.; Chen, Y.; Liang, L.; Gong, A. Post-Earthquake Night-Time Light Piecewise (PNLP) Pattern Based on NPP/VIIRS Night-Time Light Data: A Case Study of the 2015 Nepal Earthquake. Remote Sens. 2020, 12, 2009. [Google Scholar] [CrossRef] [Scilit]
  30. Tveit, T.; Skoufias, E.; Strobl, E. Using VIIRS Nightlights to Estimate the Impact of the 2015 Nepal Earthquakes. Geoenviron. Disasters 2022, 9, 2. [Google Scholar] [CrossRef] [Scilit]
  31. Levin, N. Using Night Lights from Space to Assess Areas Impacted by the 2023 Turkey Earthquake. Remote Sens. 2023, 15, 2120. [Google Scholar] [CrossRef] [Scilit]
  32. Yang, H.F.; Zhai, G.F. Spatial assessment and driving mechanism of urban safety from the perspective of disaster risk: A case study of Chuzhou central city. J. Nat. Resour. 2021, 36, 2368–2381. [Google Scholar] [CrossRef] [Scilit]
  33. Tang, L.; Zhang, Y. Monitoring Post-Earthquake Recovery and Conducting Impact Factor Analyses Based on Nighttime Light Data. Hum. Settl. Sustain. 2025, 1, 77–90. [Google Scholar] [CrossRef] [Scilit]
  34. Basile, R.; Centofanti, F.; Giallonardo, L.; Licari, F. Migration Responses to Earthquakes: Evidence from Italy. Ital. Econ. J. 2024, 10, 269–291. [Google Scholar] [CrossRef] [Scilit]
  35. Li, X.; Cao, H.R.; Gong, Y. Earthquake Damage Assessment of the Turkey-Syria Earthquake Using High-Resolution Nighttime Light Imagery. Geomat. Inf. Sci. Wuhan Univ. 2023, 48, 31–42. [Google Scholar] [CrossRef]
  36. Yu, B.; Chen, F.; Wang, N.; Wang, L.; Guo, H. Assessing Changes in Nighttime Lighting in the Aftermath of the Turkey-Syria Earthquake Using SDGSAT-1 Satellite Data. Innovation 2023, 4, 151. [Google Scholar] [CrossRef] [Scilit]
  37. Luenam, A.; Puttanapong, N. Spatial Association between COVID-19 Incidence Rate and Nighttime Light Index. Geospat. Health 2022, 17, 1066. [Google Scholar] [CrossRef] [Scilit] [PubMed]
  38. Hao, X.; Liu, J.; Heiskanen, J.; Maeda, E.E.; Gao, S.; Li, X. A robust gap-filling method for predicting missing observations in daily Black Marble nighttime light data. GIScience Remote Sens. 2023, 60, 2282238. [Google Scholar] [CrossRef] [Scilit]
  39. Li, T.; Zhu, Z.; Wang, Z.; Roman, M.O.; Kalb, V.L.; Zhao, Y. Continuous Monitoring of Nighttime Light Changes Based on Daily NASA’s Black Marble Product Suite. Remote Sens. Environ. 2022, 282, 113269. [Google Scholar] [CrossRef] [Scilit]
  40. Martinez, J.F.; MacManus, K.; Stokes, E.C.; Wang, Z.; de Sherbinin, A. Suitability of NASA’s Black Marble Daily Nighttime Lights for Population Studies at Varying Spatial and Temporal Scales. Remote Sens. 2023, 15, 2611. [Google Scholar] [CrossRef] [Scilit]
  41. Román, M.O.; Wang, Z.; Sun, Q.; Kalb, V.; Miller, S.D.; Molthan, A.; Schultz, L.; Bell, J.; Stokes, E.C.; Pandey, B.; et al. NASA’s Black Marble Nighttime Lights Product Suite. Remote Sens. Environ. 2018, 210, 113–143. [Google Scholar] [CrossRef] [Scilit]
  42. NASA’s Land Science Investigator-Led Processing System. VIIRS/NPP Gap-Filled Lunar BRDF-Adjusted Nighttime Lights Daily L3 Global 15 Arc-Second Linear Lat Lon Grid; NASA EOSDIS Land Processes DAAC: Sioux Falls, SD, USA, 2024. [CrossRef]
  43. Wald, D.J.; Worden, C.B.; Thompson, E.M.; Hearne, M. ShakeMap Operations, Policies, and Procedures. Earthq. Spectra 2022, 38, 756–777. [Google Scholar] [CrossRef] [Scilit]
  44. Schiavina, M.; Freire, S.; Carioli, A.; MacManus, K. GHS-POP R2023A—GHS Population Grid Multitemporal (1975–2030); European Commission, Joint Research Centre (JRC): Brussels, Belgium, 2023. [Google Scholar] [CrossRef]
  45. Pesaresi, M.; Schiavina, M.; Politis, P.; Freire, S.; Krasnodębska, K.; Uhl, J.H.; Carioli, A.; Corbane, C.; Dijkstra, L.; Florio, P.; et al. Advances on the Global Human Settlement Layer by Joint Assessment of Earth Observation and Population Survey Data. Int. J. Digit. Earth 2024, 17, 2390454. [Google Scholar] [CrossRef] [Scilit]
  46. Joubert-Boitat, I.; Wania, A.; Dalmasso, S. Manual for CEMS-Rapid Mapping Products; EUR 30370 EN; Publications Office of the European Union: Luxembourg, 2020. [Google Scholar] [CrossRef]
  47. Wang, Z.; Shrestha, R.M.; Román, M.O.; Kalb, V.L. NASA’s Black Marble Multiangle Nighttime Lights Temporal Composites. IEEE Geosci. Remote Sens. Lett. 2022, 19, 2505105. [Google Scholar] [CrossRef] [Scilit]
  48. NASA VIIRS Land Science Investigator-Led Processing System. VIIRS/NPP Lunar BRDF-Adjusted Nighttime Lights Yearly L3 Global 15 Arc-Second Linear Lat Lon Grid; NASA EOSDIS Land Processes DAAC: Sioux Falls, SD, USA, 2025. [CrossRef]
  49. Dou, Y.; Liu, Z.; He, C.; Yue, H. Urban Land Extraction Using VIIRS Nighttime Light Data: An Evaluation of Three Popular Methods. Remote Sens. 2017, 9, 175. [Google Scholar] [CrossRef] [Scilit]
  50. Chen, Y. An Analytical Process of Spatial Autocorrelation Functions Based on Moran’s Index. PLoS ONE 2021, 16, e0249589. [Google Scholar] [CrossRef] [Scilit] [PubMed]
  51. Chen, Y. Spatial Autocorrelation Equation Based on Moran’s Index. Sci. Rep. 2023, 13, 19296. [Google Scholar] [CrossRef] [Scilit] [PubMed]
  52. Keshavarzi, A.; Bhunia, G.S.; Shit, P.K.; Ertunc, G.; Zeraatpisheh, M. Spatial Pattern Analysis and Identifying Soil Pollution Hotspots Using Local Moran’s I and GIS at a Regional Scale in Northeast of Iran. In Soil Health and Environmental Sustainability: Application of Geospatial Technology; Springer: Berlin/Heidelberg, Germany, 2022; pp. 283–307. [Google Scholar] [CrossRef] [Scilit]
  53. Sun, B.; Yan, J.; Yang, Y.; Chen, X.; Sun, M. Assessment of Seismic Intensity and Seismic Performance of Buildings in the M7.9 Myanmar Earthquake. Earthq. Eng. Eng. Vib. 2025, 24, 641–652. [Google Scholar] [CrossRef] [Scilit]
  54. Cai, J.; Xi, N.; Han, G.; Deng, W.; Sun, L. Rapid Report of the March 28, 2025 Mw 7.9 Myanmar Earthquake. Earthq. Res. Adv. 2025, 5, 100396. [Google Scholar] [CrossRef] [Scilit]
  55. Liu, R.; Li, Z.; Zhang, Z.; Wang, Z.; Zhang, Y. On the Source Mechanism and Radiated Energy Determination of the 2025 MS7.9 Myanmar Earthquake. SSRN 5253292. 2025. Available online: https://papers.ssrn.com/sol3/papers.cfm?abstract_id=5253292 (accessed on 28 October 2025).
  56. Xiwei, X.; Wenjun, K.; Tao, W.; Xianbing, Z.; Yuzhuo, L.; Yuxuan, Z.; Jizhen, Z.; Kang, L.; Qixin, W.; Jia, C. The Mw7.7 Myanmar Earthquake: A Continental Longest Surface-Rupturing Supershear Cascading Event. npj Nat. Hazards 2025, 2, 73. [Google Scholar] [CrossRef] [Scilit]
  57. Ye, L.; Lay, T.; Kanamori, H. The 28 March 2025 Mw 7.8 Myanmar Earthquake: Preliminary Analysis of an ~480 km Long Intermittent Supershear Rupture. Seism. Rec. 2025, 5, 260–269. [Google Scholar] [CrossRef] [Scilit]
  58. Laosunthara, A.; Krutphong, K.; Leelawat, N.; Wararuksajja, W.; Sukulthanasorn, N.; Suppasri, A.; Thongthip, R.; Chintanapakdee, C. Initial Observations and Immediate Lessons Learned from Thailand’s Response to the 2025 Mandalay Earthquake. Int. J. Disaster Risk Reduct. 2025, 127, 105675. [Google Scholar] [CrossRef] [Scilit]
  59. Xu, N.; Zhang, Z.; Li, Q.; Ou, Y.; Tu, W.; Yang, C.; Zhu, C.; Gong, P.; Lu, H.; Chen, D. Remote Sensing Enables Rapid Assessment of the March 28, 2025 Myanmar Earthquake. Sci. Bull. 2025, in press. [Google Scholar] [CrossRef] [Scilit]
  60. Gunay, S.; Tlau, R.; Archbold, G.J.; Kumar, H.; Arteta, G.C.; Caballero, J.; Fields, R.; Fischer, E.; Lwin, H.W.A.; Thawng, Z. M7.7 Myanmar Earthquake. 2025. Available online: https://earthquake.usgs.gov/earthquakes/eventpage/us7000pn9s/executive (accessed on 4 July 2025).
  61. Phattharapornjaroen, P.; Burivong, R.; Khorram-Manesh, A. Myanmar Earthquake Aftermath-Critical Update and Expanded Analysis. Disaster Med. Public Health Prep. 2025, 19, e125. [Google Scholar] [CrossRef] [Scilit]
  62. Wang, T.; Zhou, Y.; Chen, J.; Wang, X.; Bi, H.; Wang, X. Field Survey of Building Damage at Mandalay during the 2025 Myanmar Mw 7.7 Earthquake. Earthq. Eng. Eng. Vib. 2025, 24, 613–627. [Google Scholar] [CrossRef] [Scilit]
  63. Than, Z.M.; Oo, H.M.; Aung, T.; Kyi, T.T.; Oo, S.S.; Mar, W.L.; Willkomm, M.; Miller, C.; Martini, S.; Myint, Z.N. Critical Infrastructure in Yangon, Myanmar, in Case of Disaster: The Readiness of Providers. J. Myanmar Acad. Arts Sci. 2022, 125–139. Available online: https://maas.edu.mm/Research/Admin/pdf/9.%20%20Daw%20Zin%20Mar%20Than%20(125-140).pdf (accessed on 12 December 2025).
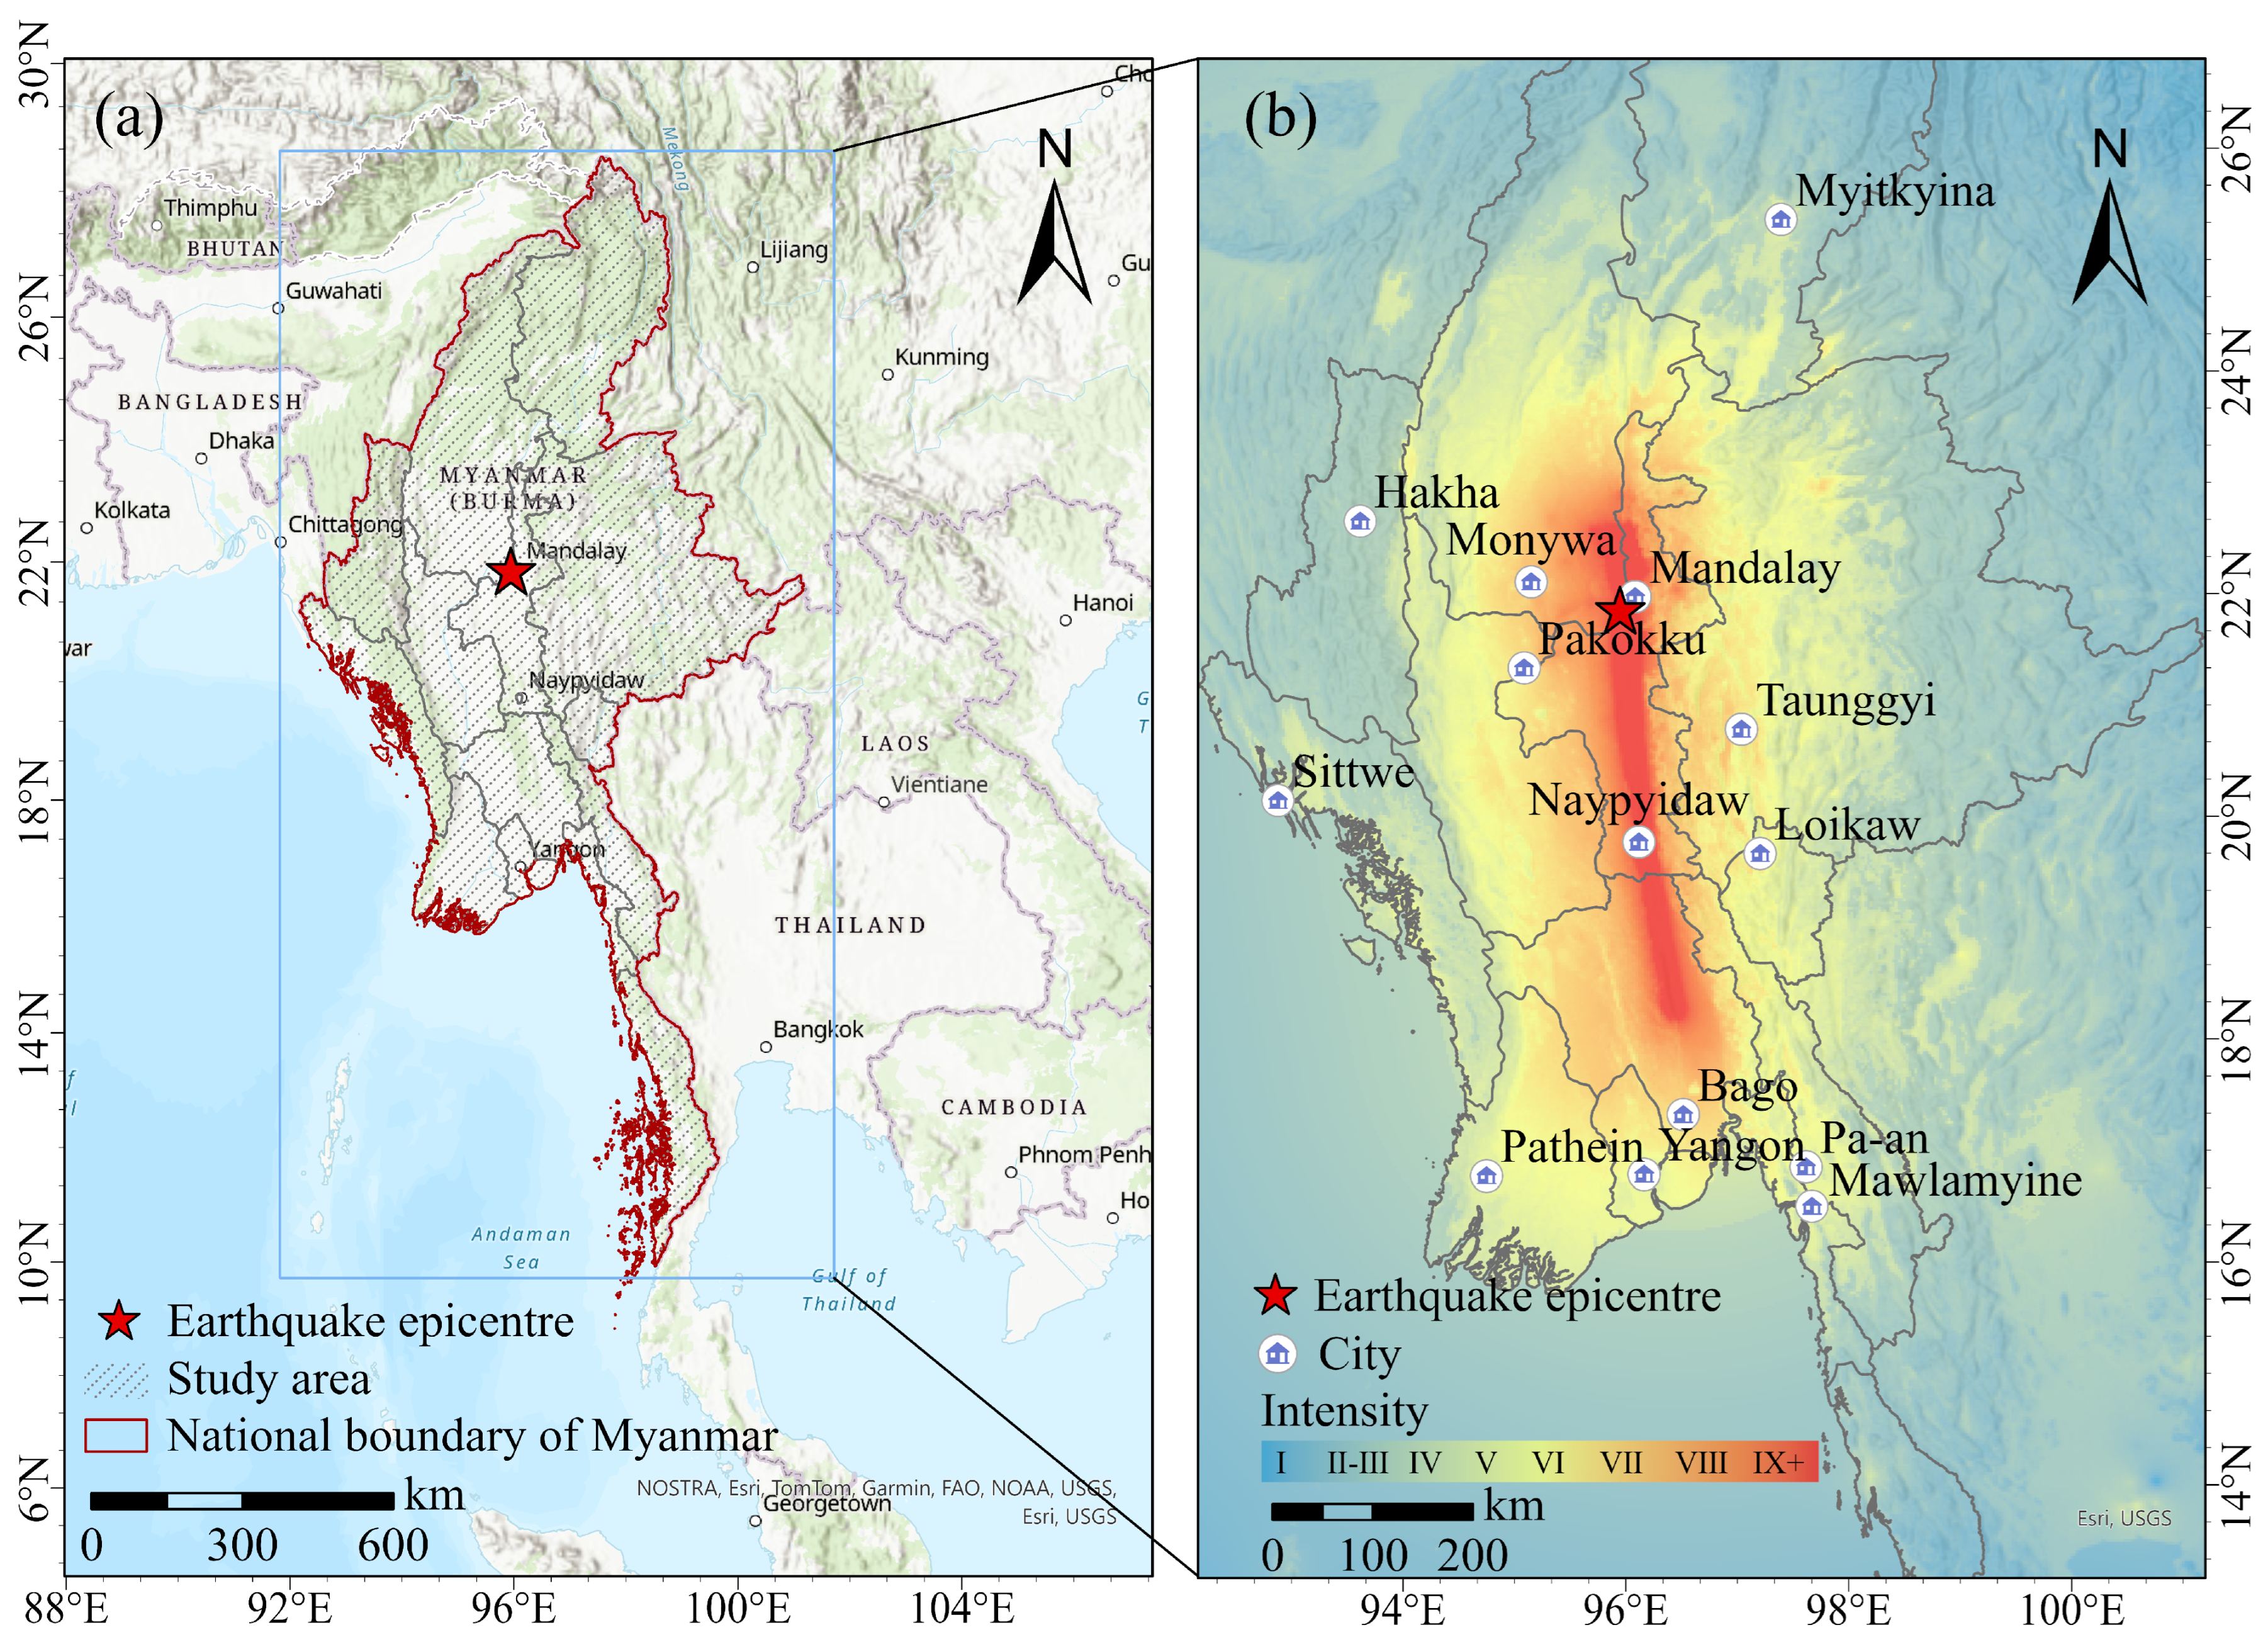
Figure 1. (a) Study area; (b) spatial distribution of seismic intensity for Myanmar earthquake and provincial administrative divisions with provincial capitals.
Remotesensing 18 01371 g001
Figure 2. Nighttime light imagery of the study area. (a) Nighttime light data for 22 March 2025; (b) nighttime light data for 29 March 2025 (the red rectangles in the figure represent nighttime light intensity for Mandalay (a-i,b-i), Naypyitaw (a-ii,b-ii), MongHsat (a-iii,b-iii), and Yangon (a-iv,b-iv) on 22 March 2025, and 29 March 2025, respectively).
Remotesensing 18 01371 g002
Figure 3. Intensity distribution and six-directional zoning diagram for Mw 7.7 earthquake in Myanmar (data source: USGS; intensity intervals of 0.2).
Remotesensing 18 01371 g003
Figure 4. The top 15 Myanmar counties with the largest declines in NTL and their respective change rates (counties listed in ascending order based on NTL change values).
Remotesensing 18 01371 g004
Figure 5. (a) Variations in NTL intensity at the county level in Myanmar and (b) variations in NTL intensity within the urban built-up patches area.
Remotesensing 18 01371 g005
Figure 6. Variations in NTL intensity at the pixel scale. (a) Study area; (b) Mandalay; (c) MongHsat; (d) Loilen County; (e) Naypyitaw; (f) Yangon; (g) Sittwe County.
Remotesensing 18 01371 g006
Figure 7. (a) Average variation in NTL intensity across regional units defined by seismic intensity and six cardinal directions, (b) building density within each unit, and (c) population density.
Remotesensing 18 01371 g007
Figure 8. Comparison of population density, building density, and average nighttime light variation values (all data normalized). These six subplots comprise dual-y-axis graphs depicting population density, building density, and average nighttime light variation values across six different directions: (a) S1, (b) S2, (c) S3, (d) S4, (e) S5, and (f) S6.
Remotesensing 18 01371 g008
Figure 9. LISA cluster map: (a) relationship between average nighttime light intensity variation and population; (b) relationship between average nighttime light intensity variation and building density; LISA significance map: (c) relationship between average nighttime light intensity variation and population; (d) relationship between average nighttime light intensity variation and building density.
Remotesensing 18 01371 g009
Figure 10. Relationship between pre-earthquake NTL illumination levels and decline rates at different spatial scales. (a) County scale; (b) patch scale; (c) two-dimensional density distribution at pixel scale (pixel counts on logarithmic scale); (d) distribution of decline rates for pixels with higher pre-earthquake nighttime illumination across different seismic intensities.
Remotesensing 18 01371 g010
Figure 11. Comparison of urban built-up patches identification results with CEMS-affected areas. (a) Distribution of urban built-up patches hits within high/low nighttime light levels in CEMS-affected regions; (b) regional comparison of typical urban spot decline rates versus CEMS impact coverage.
Remotesensing 18 01371 g011
Figure 12. Google Earth imagery of the representative city segments under the three reference-oriented classes. High-risk areas: (a-i) Mandalay, (a-ii) Naypyitaw, and (a-iii) Yangon. Medium-risk areas: (b-i) Bawlake Region, (b-ii) Dawei Region, and (b-iii) Kyaukme Region. Candidate low-risk or support zones: (c-i) MongHsat, (c-ii) Kengtung, and (c-iii) Mawlamyine.
Remotesensing 18 01371 g012
Disclaimer/Publisher’s Note: The statements, opinions and data contained in all publications are solely those of the individual author(s) and contributor(s) and not of MDPI and/or the editor(s). MDPI and/or the editor(s) disclaim responsibility for any injury to people or property resulting from any ideas, methods, instructions or products referred to in the content.