Article

Evaluating SAR-Derived Phenological Metrics for Monsoon (Kharif) Crop Monitoring in Diversified Agricultural Systems: Insights from Central India

by
Meghavi Prashnani
* and
Chris Justice
Department of Geographical Sciences, University of Maryland, College Park, MD 20742, USA
*
Author to whom correspondence should be addressed.
Remote Sens. 2026, 18(8), 1238; https://doi.org/10.3390/rs18081238
Submission received: 25 August 2025 / Revised: 6 April 2026 / Accepted: 7 April 2026 / Published: 19 April 2026

Highlights

What are the main findings?
  • Phenological convergence among monsoon-aligned cereal and legume crops represents a fundamental constraint on multi-crop discrimination using Sentinel-1 SAR alone. Cotton showed the most distinctive phenological signatures and highest classification performance, while rice demonstrated the strongest cross-district consistency; cereal–legume crops (soybean, urad, maize) exhibited substantial overlap due to shared monsoon-aligned phenology.
  • Classification models showed good transferability in single/double-cropping districts but degraded substantially in intensive triple-cropping systems like those found in Hoshangabad, where compressed phenological windows and elevated baseline backscatter reduced metric reliability.
What is the implication of the main finding?
  • Findings emphasize the need for multi-sensor or higher-resolution strategies to overcome cereal–legume separability limitations for monsoon crop mapping in smallholder systems.
  • SAR phenological metrics should be applied cautiously in regions with intensive multi-cropping, where compressed fallow periods and residual biomass from adjacent crops obscure crop-specific signatures.

Abstract

Effective crop monitoring during monsoon growing seasons in Central India faces challenges from persistent cloud cover that limits optical remote sensing during critical agricultural periods. This study presents the first attempt to develop a novel set of SAR-derived phenological metrics organized into five thematic categories for monsoon crop discrimination in smallholder agricultural systems. Five major monsoon crops (cotton, rice, maize, soybean, and urad) were analyzed across five different agroclimatic zones in Central India using Sentinel-1 data for the 2021 growing season. Phenological features were extracted from VV, VH polarizations, and their ratio, including seasonal extrema, threshold crossings, duration measures, curve shape descriptors, and area under the curve. Distinct crop-specific signatures were observed, with cotton showing extended phenology and cereal–legume crops displaying compressed, overlapping growth patterns. VV polarization achieved the highest statistical discrimination for intensity-based metrics, with 75% thresholds (VV_HP75V: F = 1287) providing higher separability than other thresholds by capturing near-peak biomass differences. VH performed best for duration and integration-based metrics, while VH/VV provided limited additional separability across metric types. For area-under-the-curve metrics, AUC25 outperformed AUC50 and AUC75 by capturing cumulative backscatter across the broader growing season while remaining robust to soil- and residue-dominated backscatter variability at sowing and harvest. Multiclass classification achieved 48.3% overall accuracy with systematic cereal–legume confusion, reflecting fundamental phenological convergence among monsoon-aligned crops. Cotton achieved the highest performance (F1: 0.79), with VH polarization dominating feature importance (65% of top 20 features). Binary classification revealed crop-specific discrimination patterns: cotton was best separated using VV intensity metrics, maize using the VH/VV ratio, and rice using timing-based features. Cross-district transferability showed the highest mean overall accuracy for rice (74%) and cotton (72%), while the remaining crops showed lower accuracy due to their phenological similarity. These findings highlight both the potential and limitations of SAR phenological metrics for monsoon crop discrimination, with effective results for structurally distinct crops but persistent cereal–legume confusion, requiring further investigation with multi-sensor approaches.

1. Introduction

Agriculture is the backbone of India’s economy, with monsoon (Kharif) crops playing a critical role in ensuring food security. Monsoon crops are highly dependent on seasonal rains, making them vulnerable to climate variability and extremes, e.g., rainfall amount and timing, droughts, and floods [1]. These climatic risks, coupled with the limitations of traditional, labor-intensive, field-based crop monitoring methods, create an urgent need for more effective, near real-time solutions. Traditional monitoring methods are often unable to provide timely insights during crucial crop growth stages, limiting farmers’ ability to respond swiftly to these climatic challenges.
Monsoon crops, also known as Kharif crops in India, are typically sown at the onset of the monsoon season (June) and harvested after the monsoon ends (October). Monsoon crops account for more than 50% of India’s total agriculture production, making reliable and timely monitoring critical for managing crop health, predicting yields, and responding to natural disasters like droughts and floods [2]. These crops rely heavily on monsoon rains, and changes in monsoon patterns, such as delayed onset, early withdrawal, and erratic distribution of rainfall, can directly affect crop yields. Furthermore, fluctuating weather conditions often lead to increased pest and disease outbreaks, threatening crop production and food security [3].
Remote sensing technologies have the potential for efficient agricultural monitoring by enabling large-scale, real-time observations of crop development [4,5]. However, conventional optical remote sensing faces significant limitations during the monsoon season due to persistent cloud cover that severely hampers data availability and reliability. Optical sensors are rendered ineffective during the critical monsoon period when most Kharif crops undergo their major phenological transitions, with cloud cover often exceeding 80% from June to September. By the time cloud-free optical data becomes consistently available in October, most monsoon crops are ready for harvest or have already been harvested, making optical remote sensing inadequate for operational crop monitoring during the growing season.
Indian agriculture is dominated by significantly smaller field sizes compared to many western countries. While remote sensing studies in regions like North America or Europe benefit from large contiguous agricultural plots, 82% of Indian farmers are smallholders, managing less than two hectares of land [6]. These fragmented landscapes present difficulties in accurately monitoring crops using conventional remote sensing techniques, which are typically designed for larger, homogeneous fields [7]. Therefore, understanding the SAR response in the context of smallholder farming is critical for building robust remote sensing based operational crop monitoring systems for Indian monsoon crops.
Synthetic Aperture Radar (SAR) technology offers a compelling solution to overcome these limitations. SAR, being weather-independent and capable of penetrating cloud cover, provides reliable and consistent observations throughout the monsoon season [8]. Sentinel-1 SAR data offers unique insights into crop phenology, providing key information on biomass, canopy structure, and moisture levels through its multi-polarization capabilities [9,10]. The all-weather, day–night imaging capability of SAR makes it particularly valuable for monitoring monsoon crops when optical sensors fail to deliver adequate temporal coverage.
Globally, SAR data has been successfully explored for major commodity crops such as wheat [11], maize [12], and rice [13], successfully tracking crop phenology under diverse weather conditions. However, the use of SAR for monitoring multiple monsoon crops in complex smallholder systems remains relatively underexplored. While some SAR studies have focused on rice in India [14,15], other important monsoon crops have received limited attention. Recent studies have demonstrated the potential of Sentinel-1 SAR temporal profiles for characterizing crop phenological stages. Veloso et al. (2017) [10] analyzed VV, VH, and VH/VV temporal behavior for wheat and other crops in France, demonstrating that the VH/VV ratio is particularly sensitive to crop biomass and phenological transitions during vegetative and reproductive stages. Nasrallah et al. (2019) [16] used Gaussian fitting on VV, VH, and VH/VV time series to detect wheat phenological stages including germination, heading, and soft dough phases in Lebanon. Schlund and Erasmi (2020) [11] showed that breakpoints in VH/VV ratio time series have high potential for detecting wheat shooting and harvesting dates in Germany. For rice, studies have tracked phenological stages from transplanting through maturity using SAR backscatter profiles, with VH polarization showing strong sensitivity to canopy development [17]. Khabbazan et al. (2019) [18] demonstrated SAR-based crop monitoring for multiple crops in the Netherlands. These studies have primarily focused on temperate crops in Europe and North America. SAR-based phenological characterization in tropical monsoon smallholder cropping systems remains limited and fragmented.
Monitoring monsoon crops is essential not only for predictive yield analysis and resource management but also for disaster mitigation during droughts and floods, as these crops are highly vulnerable to monsoon-led disasters. SAR-based crop monitoring has proven to be an effective solution for assessing crop health, predicting yields, and managing resources, especially in remote or inaccessible areas during weather-constrained periods [19]. However, in India, monsoon crops pose unique challenges due to small field sizes, multi-cropping and complex landscapes, which limit the efficacy of medium resolution (10 to 30 m) remote sensing data [20].
While there have been some remote sensing-based studies on a few Indian monsoon crops, most of these focus on a single crop at a time or limited geographic areas, often lacking a comprehensive, multi-crop, multi-regional approach [15,21,22,23,24]. In the Indian context, SAR-based studies during the Kharif season have predominantly focused on rice mapping and area estimation. Singha et al. (2019) [15] mapped paddy rice in cloud-prone Bangladesh and Northeast India using Sentinel-1 VH backscatter profiles with Random Forest classification. Kushwaha et al. (2022) [24] assessed rice biophysical parameters in Gujarat using Sentinel-1 VV, VH, VH/VV, and RVI, finding strong correlations during early vegetative stages. For Kharif rice in the Indian Sundarbans, Ghosh et al. (2025) [25] documented bell-shaped RVI profiles with VH backscatter increasing from transplanting through peak growth. Beyond rice, limited studies have examined other Kharif crops. Kumaraperumal et al. (2017) [26] characterized temporal backscatter signatures of maize and cotton in Tamil Nadu. Kumar et al. (2021) [27] documented maize VH backscatter profiles in Telangana. Verma et al. (2019) [28] characterized paddy, maize, and finger millet in Jharkhand using combined SAR–optical approaches. For multi-crop classification, Neetu et al. (2021) [29] evaluated Sentinel-1 and RADARSAT-2 for rice and soybean classification in Hoshangabad, Madhya Pradesh. However, these studies have primarily focused on crop area estimation and classification rather than detailed phenological metric extraction and evaluation. Furthermore, most are constrained by limited ground truth covering a single crop or specific geographic area, lacking the multi-crop, multi-region framework necessary for systematic inter-crop phenological comparison across diverse agroclimatic conditions. To the best of our knowledge, no prior study has systematically extracted and evaluated comprehensive SAR-derived phenological metrics and examined the temporal dynamics of key Indian monsoon crops across multiple regions and crop types using exclusively SAR data within a unified framework. This research aims to fill this gap by conducting a detailed analysis of the phenological response of multiple crops using SAR time-series data across varied geographic regions, providing a holistic understanding of monsoon crop phenology through weather-independent observations and informing crop classification.
Several SAR-based vegetation indices, such as the Radar Vegetation Index (RVI), Dual Polarization SAR Vegetation Index (DPSVI), and other combinations of VV and VH backscatter from individual acquisitions [17,22,24,30,31] have been used in previous studies for crop mapping and vegetation characterization. While these indices can also be constructed as time series from multi-temporal SAR acquisitions to characterize seasonal crop dynamics, this study takes a different approach by deriving season-integrated phenological metrics such as peak timing, growth duration, threshold crossings, and area under the curve directly from multi-date backscatter values (VH, VV) and their ratio (VH/VV) across the entire growing season. In principle, similar phenological metrics could also be extracted from time series of RVI or other SAR indices, but a comparative assessment of different index formulations falls beyond the scope of the present study, which focuses on characterizing phenological signatures from the fundamental backscatter measurements and their ratio. Recent studies have also demonstrated the potential of full time-series deep learning approaches, such as Long Short-Term Memory (LSTM) networks, to exploit subtle temporal patterns in SAR data for crop classification [32,33,34]. While such approaches can achieve high classification performance, they typically require dense, continuous time series, larger training datasets, and higher computational complexity. Moreover, these data-driven models function as opaque learning systems that do not yield explicit, interpretable representations of phenological behavior. These limitations are particularly pronounced in monsoon smallholder contexts, where fragmented and small field sizes (often <2 ha), asynchronous sowing dates driven by variable rainfall onset and practices, and limited georeferenced training data constrain the applicability of data-intensive approaches. In such systems, understanding crop dynamics is essential for interpreting classification accuracy. Since the primary objective of this study is to understand and characterize monsoon crop phenology through SAR observations, we adopt a phenological metrics-based framework rather than single-date SAR indices or pixel-level time-series classifiers. Our approach derives season-integrated metrics from the complete Sentinel-1 VV, VH, and VH/VV time series over the monsoon growing season, summarizing crop behavior through interpretable features such as peak backscatter intensity, sowing and harvest minima, threshold-based durations, and cumulative measures (e.g., area under the curve). These metrics explicitly encode growth trajectory, timing, and persistence, enabling both phenological interpretation and evaluation of crop separability across monsoon-driven agroclimatic regions.
To address the above-mentioned research gaps, this study is structured around the following key objectives:
  • Analyze SAR-derived temporal profiles (VV, VH, VH/VV) to understand crop-specific phenological behavior across agroclimatic zones.
  • Extract and evaluate phenological metrics, including key thresholds, duration measures, phenological curve shapes, and peak signal values, to identify robust features for crop separation and phenological interpretation.
  • Assess classification performance and cross-regional transferability of phenological metrics using Random Forest classifiers, highlighting both operational potential and limitations in smallholder systems.
In this study, we explore the phenology of five major monsoon crops: soybean, rice, urad (black gram), maize, and cotton, across five distinct agroclimatic zones in Central India using exclusively Sentinel-1 SAR data. Our objective is to compare the sowing and harvesting dates, as well as the key phenological stages of these crops, with the temporal profiles obtained from SAR observations. This will provide valuable insights into how SAR metrics capture the variations in different crops across varied agroclimatic conditions, contributing to the development of a more robust, weather-independent crop monitoring framework for monsoon-dependent regions.
The study is divided into three main sections. In the first section, we analyze the phenology of each crop individually, observing the temporal progression of phenological stages as captured by SAR data across different geographical regions. In the second section, we take a more holistic view by examining the phenology of all five crops together through inter-crop comparison, focusing on comparing various SAR-derived phenological metrics including local extrema values, threshold crossing metrics, duration metrics, curve shape descriptors, and area-under-the-curve features across crops and districts. In the third section, we evaluate the operational utility of these SAR-derived phenological metrics for crop classification applications, providing a comprehensive analysis of how these weather-independent metrics can be used for practical agricultural monitoring in different agroclimatic zones. Ultimately, this study aims to lay the groundwork for advancements in crop monitoring and management by demonstrating the potential of SAR-derived phenological metrics during the challenging monsoon period.

2. Study Area

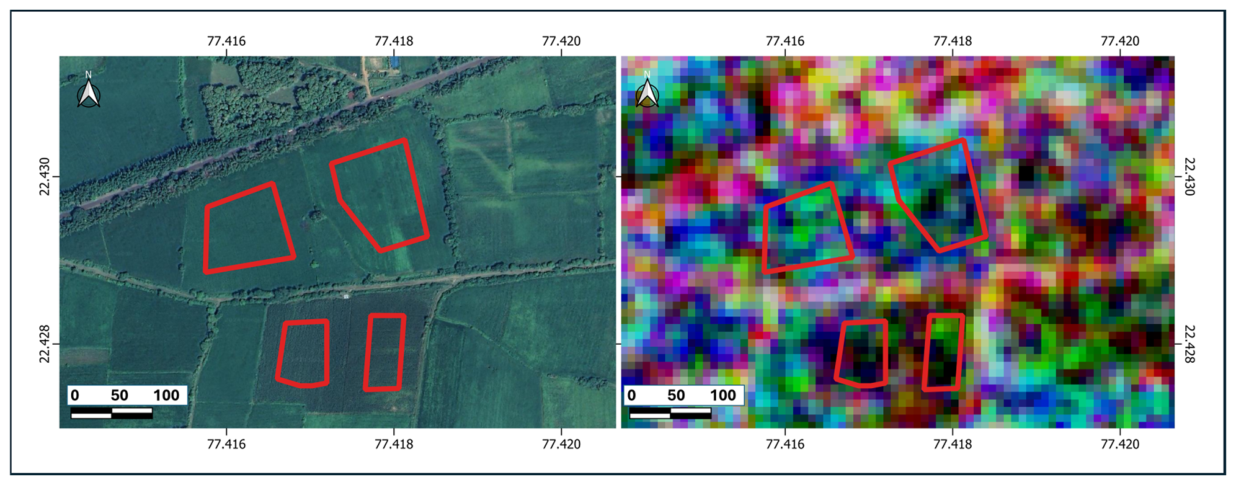
Madhya Pradesh agriculture is highly dependent on the southwest monsoon, with rainfall ranging between ~800 mm in the west to ~1500 mm in the east. The rainfed nature of farming makes it vulnerable to variability in onset and distribution of rainfall, as well as extreme weather events such as drought and floods. Previous studies in Madhya Pradesh have also documented farmers’ perceptions of increasing climate variability and the need for adaptive measures [35]. Our study was conducted across five districts in Madhya Pradesh, India, each located in a distinct agroclimatic zone (ACZ): Vidisha (Vindhyan Plateau), Hoshangabad (Central Narmada Valley), Chhindwara (Satpura Plateau), Dhar (Malwa Plateau), and Khargone (Nimar Valley), as shown in Figure 1. These zones were chosen to represent a diverse range of climatic and soil conditions, enabling a comprehensive understanding of crop performance across different regions. The predominant soil type in these zones is black soil (Vertisols), and the annual rainfall ranges from 800 mm to 1300 mm. The five key crops selected for this study, namely, soybean, rice, urad, maize, and cotton, collectively account for approximately 90% of the total Kharif cropped area in Madhya Pradesh (2021–2022), with soybean being the dominant crop (38%), followed by rice (25%), maize (14%), urad (9%), and cotton (4%). Based on the latest five-year estimates, Madhya Pradesh makes significant contributions to India’s agricultural production, accounting for 45% of the national soybean output [36], 20% of Kharif maize, 5% of Kharif rice, 38% of Kharif urad, and 5% of total cotton production as reported by Directorate of Economics and Statistics (DES), Department of Agriculture and Farmer’s Welfare, Government of India. For this study, field surveys were conducted during the Kharif season of 2021 across these five agroclimatic zones by selecting a 20 × 20 km block in each district to cover the major crop types. Using district and sub-district level statistics and insights from local experts, the study ensured a well-distributed sampling. This study area includes 289 agricultural fields across five districts, with each district having a minimum of 50 fields, and a minimum of 10 fields per crop per district to ensure robust representation and sampling. The fields represent major crops with 74 soybean fields, 72 maize fields, 58 rice fields, 56 cotton fields, and 29 urad fields. Each field polygon was delineated at least 10 m inside the actual field boundaries to avoid edge effects, as shown in Figure 2, ensuring the precision of the data collection process.
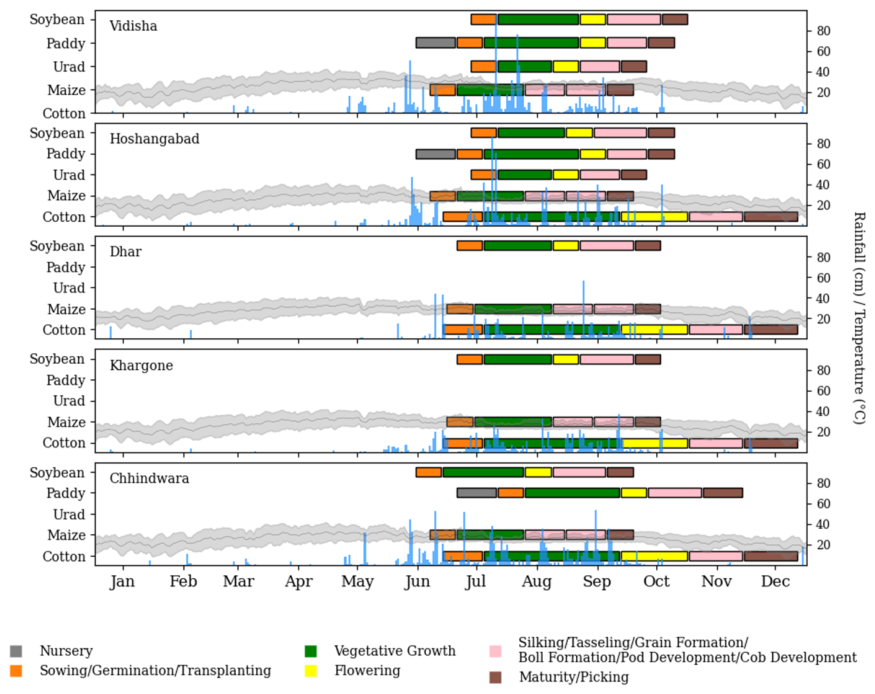
Figure 3 provides the crop calendars for five crops across the five districts, based on field surveys and district crop calendars. Each crop’s growth stages are depicted with color-coded bars representing different phenological phases, from nursery to maturity. The rainfall trends (blue vertical lines) and temperature variations (gray shaded areas) are plotted in the background, showing the weather trend during crop growth. Average temperatures during monsoon season across these districts range from 23 °C to 32 °C, with cooler conditions observed in July and August due to peak monsoon rainfall. Vidisha, Hoshangabad, and Dhar see temperatures between 25 °C and 31 °C, while Khargone and Chhindwara experience slightly lower averages, with Chhindwara remaining relatively cooler at 25 °C to 27 °C. The heavy rainfall during July and August moderates the temperatures, followed by a gradual increase in warmth as the monsoon season concludes. The selected crop stages align with the monsoon season, with sowing generally beginning in late June to early July. Most crops have overlapping vegetative growth stages, as represented by a green horizontal bar for each crop. The harvest period begins from October to December, with crops like soybean and urad maturing by October, while cotton continues to mature until December/January.

3. Data and Methods

3.1. SAR Time Series Processing

For SAR data, we utilized C-band Sentinel-1 Ground Range Detected (GRD) products, operating at a frequency of 5.404 GHz and a wavelength of 5.55 cm. The data were acquired from Sentinel-1A and Sentinel-1B in Interferometric Wide (IW) swath mode from descending orbits, providing dual-polarization (VV and VH) imagery with a nominal 12-day revisit cycle. While both satellites were included, acquisitions were predominantly from Sentinel-1A. Only descending orbits were selected as ascending coverage was spatially inconsistent and unavailable for most of the study area. Pre-processed in Google Earth Engine (GEE), the GRD products included thermal noise removal and calibration to generate ortho-corrected backscatter coefficients (σ0). The ratio of VH to VV in the decibel scale (dB) was computed as the difference between the VH and VV backscattering coefficients, expressed as:
σ0VH/VV [dB] = σ0VH [dB] − σ0VV [dB]
where σ0VH and σ0VV are backscattering coefficient values in VH and VV polarizations, respectively. This formulation follows from the logarithmic property where the ratio of two values in dB equals their difference [10,37,38].
To correct for incidence angle effects on backscatter values, angle normalization was applied to the Sentinel-1 coefficients using a reference incidence angle (θ_ref = 38.2°) derived from the mean incidence angle across all study districts. The normalized backscatter was calculated as:
σ0_norm = σ0_obs × [cos(θ_ref)/cos(θ_obs)]
where σ0_obs is the observed backscatter value, θ_obs is the observed incidence angle, and θ_ref is the reference incidence angle [39].
The exclusive use of SAR data was necessitated by persistent cloud cover during the monsoon season, which severely limits optical data availability. The Sentinel-1 GRD products were used to extract VV and VH backscatter time series over the 2021 monsoon season, spanning from January to December, with a 12-day revisit cycle. For each pixel, backscatter values in dB were extracted for the VV and VH bands. The VH/VV ratio was also computed at each date to capture polarization contrast [11,40]. To reduce speckle and temporal noise, a Savitzky–Golay (SG) filter was applied to each pixel’s time series. Multiple parameter combinations were tested, including window sizes of 3, 5, 7, and 9, and polynomial orders of 2, 3, and 4. The optimal parameters (window size = 5, polynomial order = 3) were selected based on visual evaluation of smoothness, preservation of phenological peaks and minima, and retention of phenological curve shape characteristics. Smaller windows (3) retained excessive noise, while larger windows (7, 9) over-smoothed the signal and attenuated phenologically significant peaks. A third-order polynomial adequately captured the non-linear growth and senescence dynamics without overfitting. The selected parameters fall within the commonly adopted range (window 3–7, polynomial order 2–4) in SAR and remote sensing time-series smoothing literature for crop monitoring [13,41,42,43]. These smoothed values were then interpolated to daily temporal resolution using cubic interpolation, enabling extraction of time-integrated phenological metrics. Outliers were implicitly handled during the Savitzky–Golay filtering step. The SG-filtered and interpolated values were validated by comparing raw backscatter values against interpolated values at acquisition dates across all fields covering the five study districts. The average RMSE was 1.77 dB for VH and 1.41 dB for VV (range: 1.66–2.02 dB for VH; 1.27–1.59 dB for VV across districts), with missing data rates of 0–3.4%. While temporal smoothing validation using SG filtering is well established for optical NDVI time series [44], comparable quantitative benchmarks for SAR backscatter temporal profiles in dB remain unreported to our knowledge.

3.2. SAR Phenological Metrics

To account for variability in sowing and harvest dates across different fields and districts, we derived a comprehensive set of time-integrated SAR metrics from the smoothed and interpolated time series of SAR backscatter bands (VV, VH, VH/VV). These features were computed using a custom Python (version 3.12) pipeline designed to capture the temporal dynamics of each pixel’s response curve.
The extracted features were organized into five thematic sets (A–E), each targeting a specific aspect of crop phenology or signal shape:
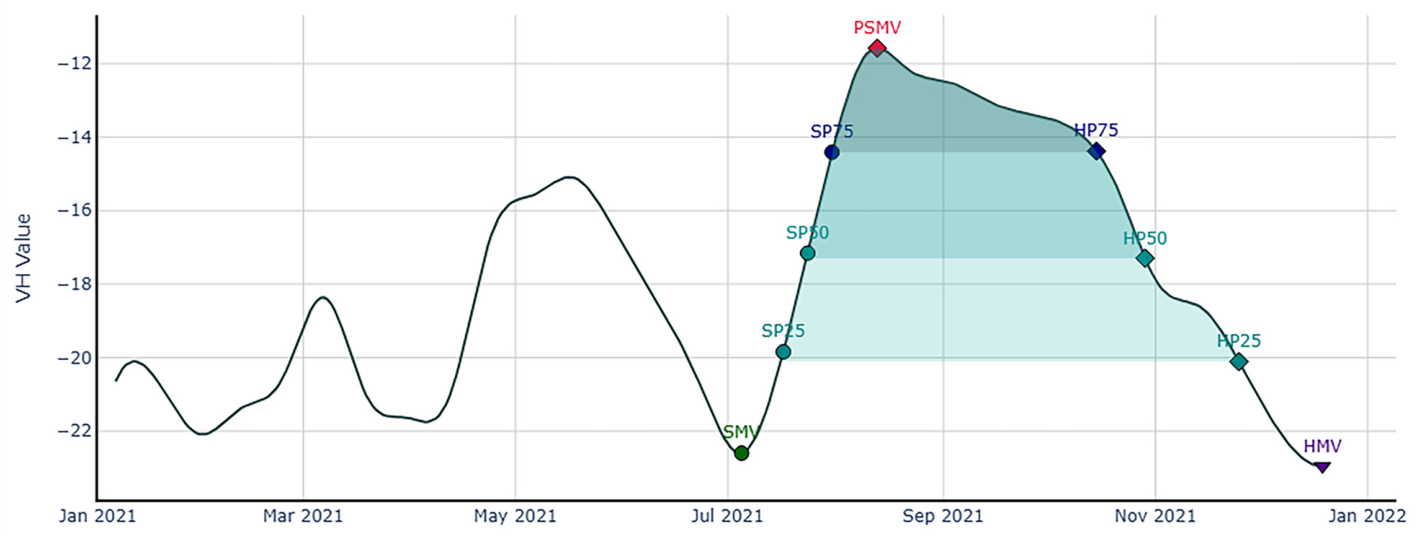
  • Set A (Seasonal Extremes): Peak season maximum value (PSMV), sowing period minimum value (SMV), harvest period minimum value (HMV), and their corresponding dates (PSMD, SMD, HMD). Local minima and maxima were identified from the daily time series, with SMV and HMV selected as minima near the sowing and harvesting periods based on monsoon crop calendars, and PSMV as the maximum during peak vegetation growth.
  • Set B (Threshold Crossings): Dates and values when the signal crossed 25%, 50%, and 75% of peak amplitude during both rising (sowing phase, SP) and declining (harvest phase, HP) limbs. Threshold values were computed as:
SP_t_V = SMV + t × (PSMV − SMV)
HP_t_V = HMV + t × (PSMV − HMV)
where t = 0.25, 0.50, or 0.75. Corresponding dates (SP_t_D, HP_t_D) represent the DOY when the signal crossed these thresholds.
  • Set C (Duration Metrics): Duration (days) between threshold crossings at 25%, 50%, and 75% levels:
D_t = HP_t_D − SP_t_D
  • Set D (Curve Shape Descriptors): Growth and decline slopes, symmetry index, and peak intensity:
Slope_Grow = (PSMV − SP25V)/(PSMD − SP25D)
Slope_Decline = (HP25V − PSMV)/(HP25D − PSMD)
Symmetry = (HP25D − PSMD)/(PSMD − SP25D)
Peak Intensity = (PSMV − SP50V) + (PSMV − HP50V)
  • Set E (Area Under the Curve): Integrated signal measures between matching threshold dates (AUC25, AUC50, AUC75), computed using trapezoidal integration on the baseline-adjusted signal within each interval. For example, AUC25 represents the area under the curve from SP25D to HP25D.
AUC_t = ∫(SP_t_D to HP_t_D) [σ0(DOY) − σ0_min] dDOY
where t = 25%, 50%, or 75%, SP_t_D and HP_t_D are the corresponding threshold crossing dates, and σ0_min is the minimum backscatter value within the integration window.
Each feature is computed independently for the three SAR bands (VV, VH, VH/VV), with band prefixes (VV_, VH_, VHbyVV_) prepended to maintain consistency. All date-based metrics are expressed as Day of Year (DOY), where DOY 1 = January 1 and DOY 365 = December 31, 2021. For outlier cases where local extrema could not be reliably identified due to weak signal amplitude or noise, a fallback strategy was applied. The sowing minimum (SMV) and harvest minimum (HMV) were defined as the minimum backscatter values at the beginning and end of the monsoon season, respectively, while the peak season maximum (PSMV) was defined as the maximum backscatter value within the monsoon period, and corresponding dates were calculated. Since all remaining phenological metrics are derived from these three anchor points (SMV, HMV, PSMV) and their corresponding dates (SMD, HMD, PSMD), they were inherently handled through the same fallback approach, ensuring consistent metric extraction across all temporal profiles. Together, these metrics offer a compact, interpretable, and computationally efficient way to capture crop dynamics and field conditions using exclusively weather-independent SAR observations (Figure 4).

3.3. Statistical Analysis and Classification

Statistical analysis was performed to evaluate the discriminative power of SAR-derived phenological metrics across the five crop types. Analysis of variance (ANOVA) F-statistics were computed to assess overall crop separation capability, while Tukey Honestly Significant Difference (HSD) tests [45] evaluated pairwise mean differences between crops. Jeffries–Matusita (J-M) distance [46] was calculated to quantify pairwise class separability. For crop classification, a Random Forest classifier was implemented using scikit-learn with 100 trees and class balancing to address unequal sample sizes. Data were split into training (70%) and testing (30%) subsets using stratified sampling to preserve class proportions, with field-level assignment ensuring all pixels from individual fields remained in the same subset to prevent spatial autocorrelation [47]. Both multiclass (all five crops simultaneously) and binary (individual crop vs. all others) classification approaches were evaluated. Cross-district transferability analysis was conducted to assess model generalization across different agroclimatic zones, simulating real-world deployment scenarios where models trained in one district are applied to other districts within the state. Classification performance was evaluated using standard metrics including overall accuracy, user accuracy, producer accuracy, and F1-scores. Feature importance analysis was conducted to identify the most discriminative SAR phenological metrics for operational crop monitoring applications.

4. Results

4.1. Crop-Specific Phenology Analysis

4.1.1. Soybean

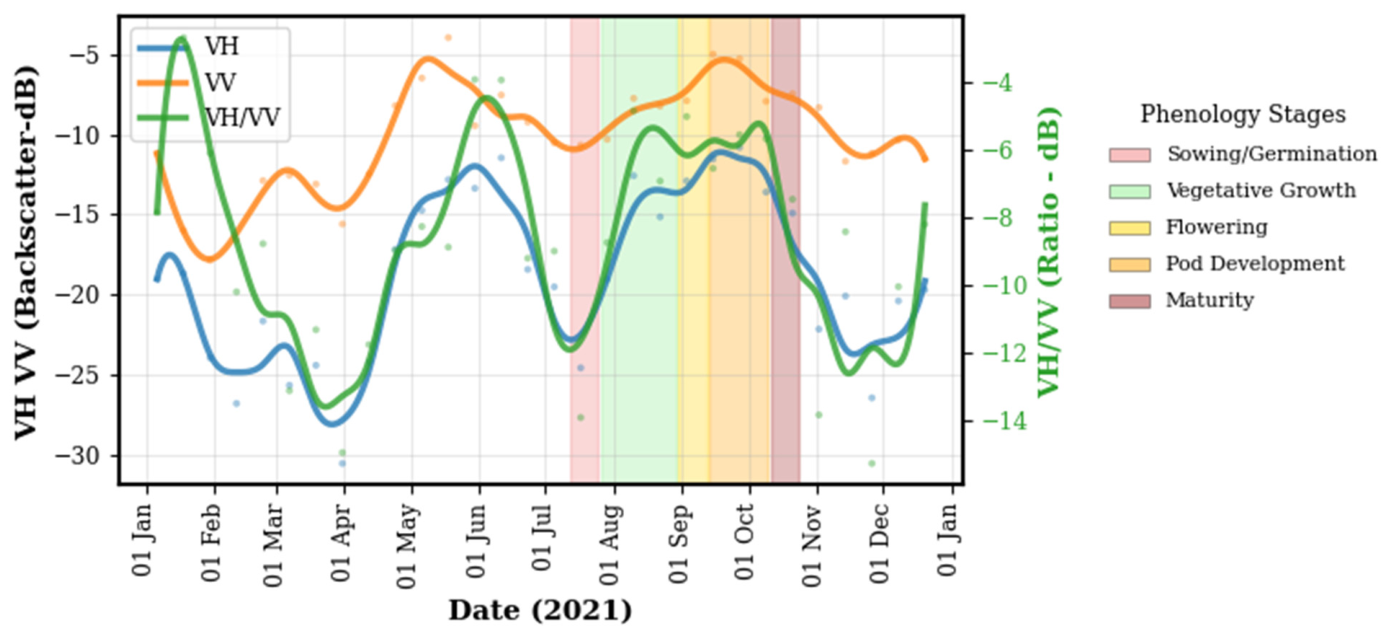
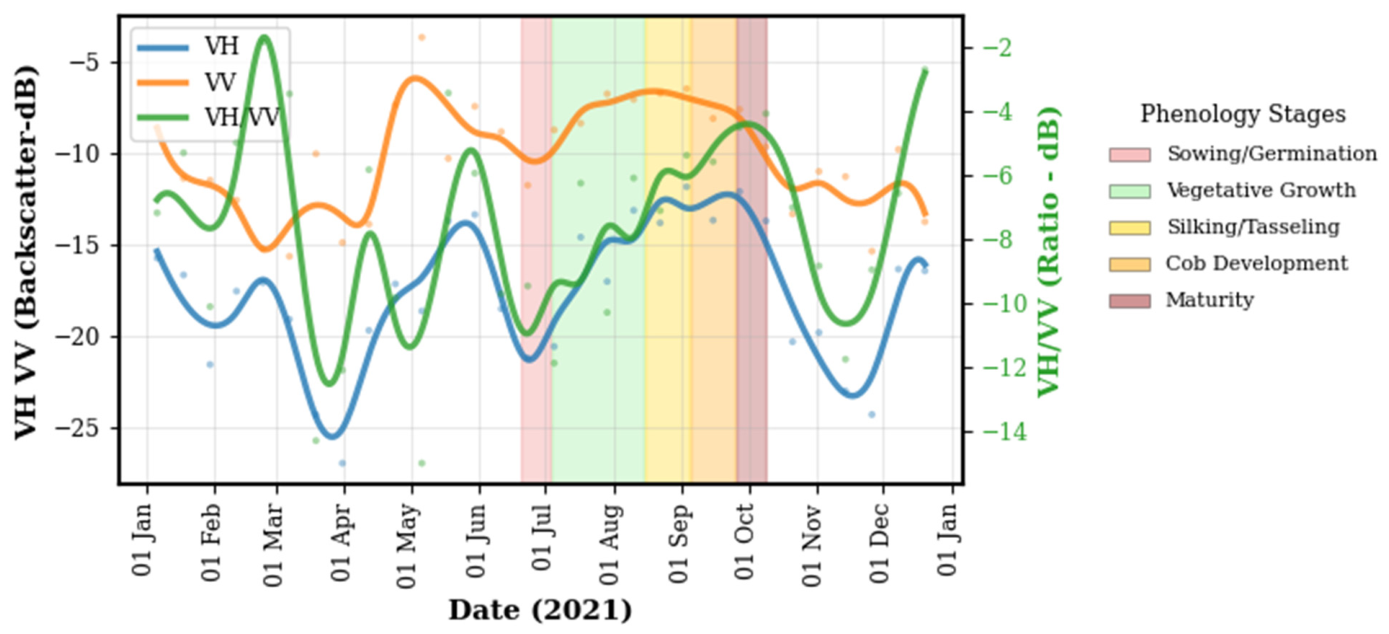
The temporal profiles of C-band SAR backscatter coefficients (VV and VH) and their ratio (VH/VV) for soybean in Hoshangabad, India, reveal distinct phenological transitions throughout the 2021 growing season, consistent with established crop calendars. Despite the broad range of dates of critical crop stages from the district crop calendar (colored vertical bars in Figure 5), the specific inflection points and trends in the SAR time series provide finer temporal insights into soybean phenology, allowing for more precise demarcation of growth stages. Following sowing and early germination (coral, mid-July), both VH and VH/VV exhibit a sharp increase, indicative of rapid biomass accumulation and increasing canopy complexity during the vegetative growth phase (green, late July to late August). Biomass buildup is captured through a steady rise in VH and VV from sowing to early pod development. The peak in VH, VV and VH/VV around the flowering stage (gold, late August to mid-September) suggests maximum canopy development and volumetric scattering dominance and suggests its utility in detecting phenological turning points.
Subsequently, during pod development (orange, mid-September to early October), a marked decrease in VH and VH/VV is observed, primarily attributed to leaf senescence and a reduction in canopy moisture content. This trend continues through the maturity stage (brown, mid-October), where VH and VH/VV reach their minima, reflecting the diminishing volume scattering from the senesced canopy and a greater contribution from the underlying dry soil and plant residues. The maturity phase shows a synchronized drop in all three metrics, consistent with structural collapse [48]. Post-maturity backscatter signatures return to bare soil levels, indicating immediate field clearing practices typical of the intensive cropping systems in central India. Post-maturity signal drop confirms field clearing, providing indirect evidence of harvest timing. These distinct backscatter responses across polarizations provide robust indicators for delineating key soybean phenological stages.

4.1.2. Rice

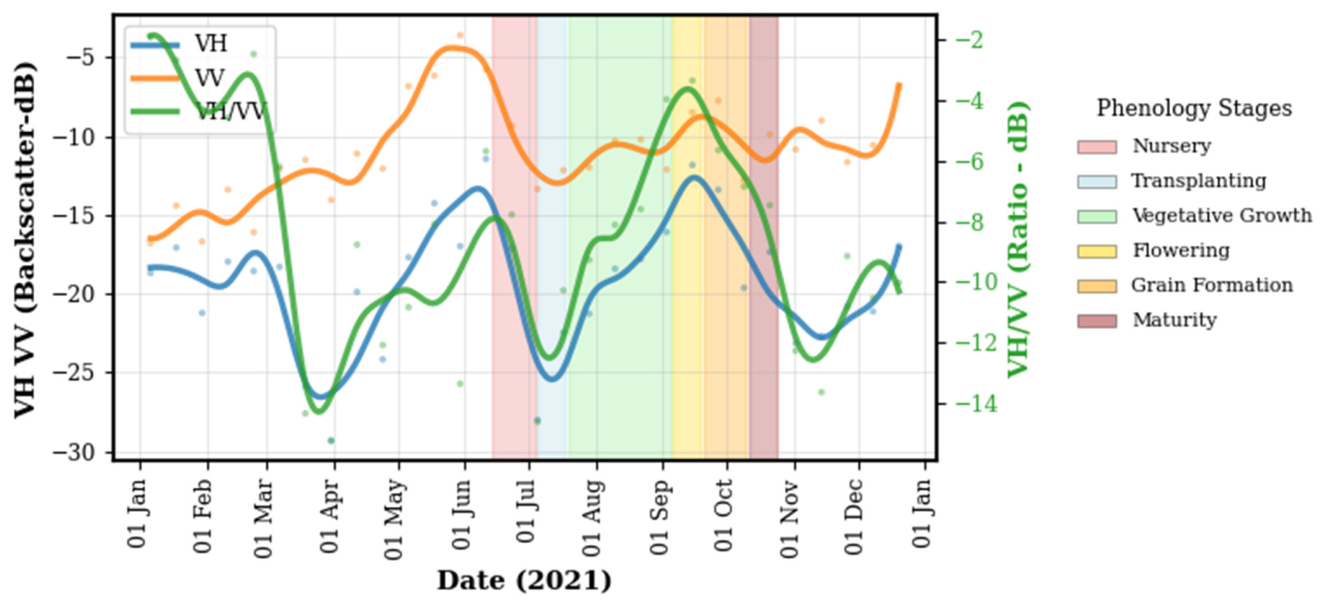
The phenological profile of rice in Hoshangabad, as observed from Sentinel-1 SAR backscatter (VH, VV) and VH/VV ratio for the 2021 season, shows distinct trends aligned with ground-reported crop stages (Figure 6). The transplanting phase exhibits characteristic low backscatter values due to field flooding, with VH reaching minimum values around −25 dB and VV around −13 dB, consistent with established literature showing that flooded rice fields produce low radar returns due to specular reflection from smooth water surfaces [49]. Following transplanting, both polarizations demonstrate an upward trajectory during vegetative growth, with VH showing particularly strong sensitivity, increasing from −25 dB to −8 dB as reported in previous studies where VH polarization responds effectively to increasing plant biomass and canopy structural complexity [50]. Peak backscatter occurs during flowering, with VH reaching approximately −8 dB, aligning with research findings that maximum vegetation development produces the highest SAR returns due to optimal volume scattering conditions. The subsequent decline during grain formation and maturity shows VH dropping to around −22 dB, reflecting the senescence pattern where reduced plant water content and structural changes decrease backscatter intensity. The graph demonstrates excellent correspondence with established SAR–rice phenology relationships, particularly the pronounced VH sensitivity and the effectiveness of VH/VV ratio in enhancing phenological discrimination, while the relatively muted VV response aligns with literature observations of reduced VV dynamic range for rice [51,52].

4.1.3. Urad (Black Gram)

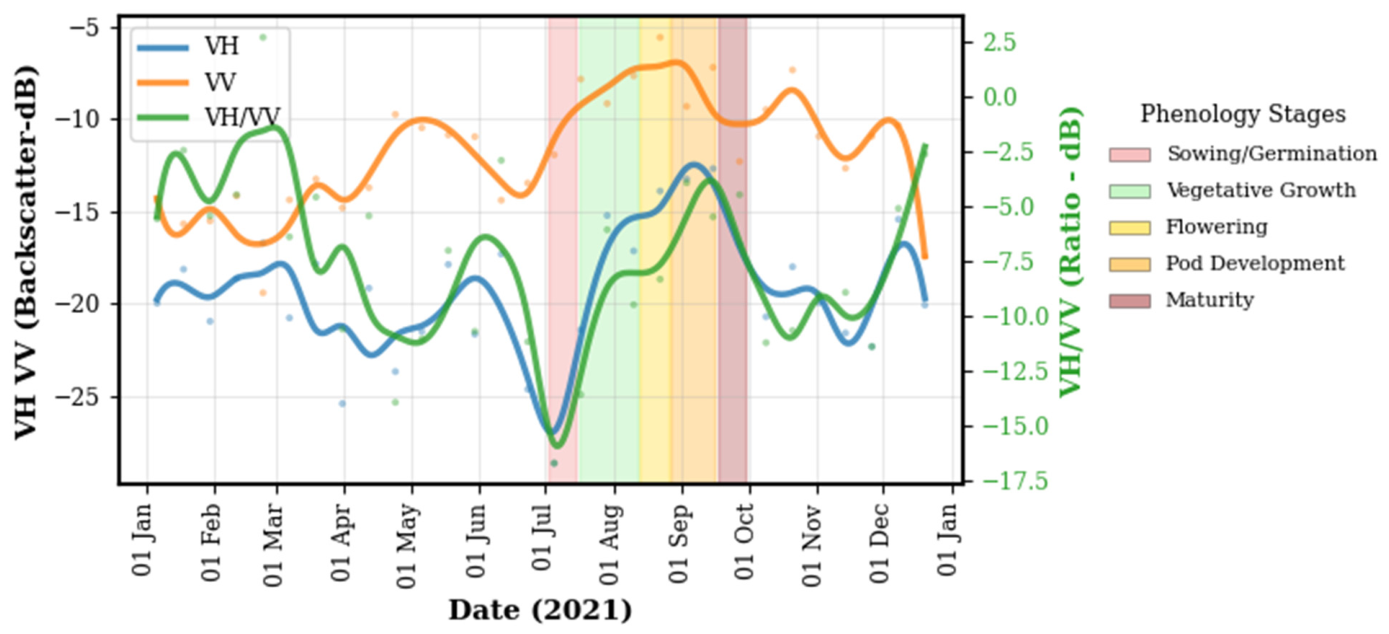
The SAR time series analysis of urad (black gram) in Vidisha district from July onwards reveals characteristic phenological responses across C-band polarizations during the 2021 Kharif season, following the harvest of the preceding rabi crop. The sowing/germination phase (early to mid-July) shows the lowest values for VH (blue) and the VH/VV ratio (green), at approximately −27 dB and −8 dB, respectively, when the SAR signal primarily interacts with the soil surface during early crop establishment [10]. VV is relatively high just before the VH rise, likely due to soil preparation and increased moisture content in the soil (Figure 7). During vegetative growth (mid-July to mid-August), all polarimetric measures show a sustained increase, reflecting the characteristic canopy development of leguminous crops. The flowering stage (mid to late August) exhibits synchronized peaks in VV (orange) and VH, reaching maximum values of approximately −7 dB and −12 dB, respectively. VV begins to decline earlier as crop moisture reduces before the canopy structure becomes sparse, which explains the subsequent drop in VH during maturity and post-flowering stages. Pod development is characterized by a gradual decrease in both polarizations, with VV declining earlier and more sharply than VH, as urad plants dry out and bare soil becomes increasingly visible through the senescing canopy (Figure 1 and Figure 7), highlighting VV’s higher sensitivity moisture and soil interactions. During the maturity phase (mid to late September), VH and VH/VV both decline significantly, and the post-maturity flattening of signals at low levels confirms harvest and field clearance, validating SAR’s utility for end-of-season detection for urad. Notably, there is no significant dip at the end of the curve, and a rapid increase is observed immediately after maturity, indicating the prompt sowing and germination of a subsequent post-monsoon crop. This suggests that the field was quickly replanted, and due to the 12-day SAR revisit interval, the transient bare-soil signal post-urad harvest was not fully captured.

4.1.4. Maize

The temporal profiles of C-band SAR backscatter coefficients (VV and VH) and their ratio (VH/VV) for Maize in Hoshangabad, India, during the 2021 growing season distinctly illustrate the crop’s phenological development (Figure 8). The sowing/germination phase (late June to early July) demonstrates the lowest backscatter values for VH and VH/VV ratio, at approximately −21 dB and −11 dB, respectively, reflecting minimal vegetation cover and dominant ground interaction [10]. During the extended vegetative growth phase (early July to mid-August), all polarimetric parameters show pronounced increases, with VV exhibiting the steepest rise from −10 dB to −7 dB, reflecting rapid biomass accumulation characteristic of C4 photosynthesis and tall stature development in maize. VV reaches its peak early during the late vegetative growth phase around mid-August, at approximately −7 dB, potentially due to maximum canopy height and biomass accumulation, then remains relatively stable at these elevated levels throughout the silking/tasseling and cob development stages, while VH shows a delayed response, continuing to increase progressively through the cob development phase (early to late September) and reaching its peak at approximately −12 dB as grain filling enhances volume scattering from the increasingly complex three-dimensional canopy structure with developing cobs [12]. The VH and VH/VV ratio exhibits a continuous increase until cob development, reflecting the enhanced contribution of volume scattering relative to surface scattering as grain-filled cobs mature within the canopy. The maturity phase (late September to early October) shows a gradual decline in all parameters, VV exhibits an earlier decline as the plants desiccate, and bare ground becomes increasingly visible beneath the senescing canopy approaching harvest readiness. Following maturity, VH demonstrates continued decrease while VV drops early, reflecting progressive structural biomass reduction and enhanced soil surface exposure through the deteriorating canopy. The distinctive SAR temporal signatures confirm that C-band polarimetric backscatter effectively discriminates maize phenological transitions and captures post-maturity field dynamics associated with natural senescence and harvest preparation [53].

4.1.5. Cotton

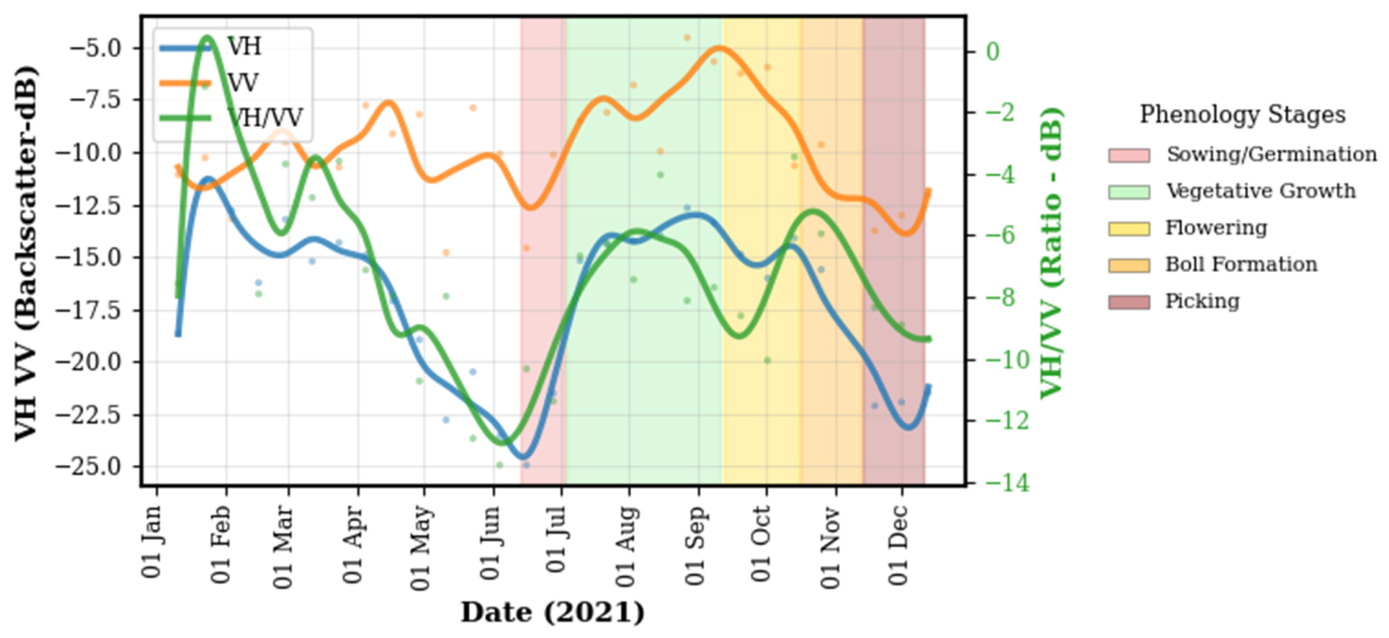
The temporal profiles of C-band SAR backscatter coefficients (VV and VH) and their ratio (VH/VV) for cotton in Khargone, India, during the 2021 growing season distinctly illustrate the crop’s extended phenological progression, aligning with its long cultivation duration sometimes extending into January for some fields depending on variety and sowing. During the sowing and germination phase, both VH and VV are at their seasonal minima, with SAR backscatter dominated by soil response (Figure 9). As the crop enters vegetative growth, VH rises rapidly and then stabilizes early, reflecting sustained canopy volume and structural development typical of cotton. VV, however, continues to grow more gradually and consistently until flowering, showing a sharper and more pronounced peak, a pointed rise rather than a broad plateau. The flowering phase is marked by this distinct VV peak, while VH remains relatively flat, having already stabilized during earlier vegetative growth. This divergence causes the VH/VV ratio to dip around the flowering stage for some of the fields as observed in this study scope, a pattern also reported by similar studies [10,54], where a sharp VV increase during flowering led to a corresponding dip in VH/VV. Following flowering, VV begins earlier decline during boll formation while VH maintains stability, causing the VH/VV ratio to rise again. The prolonged maturation period extends through December and sometimes was observed continuing through January, depending on variety, demonstrating cotton’s extended growing season compared to determinate crops. These SAR signal patterns, especially the sharp VV flowering peak combined with stabilized VH, create a reliable phenological signature, highlighting the utility of multi-polarization SAR for tracking crop structure and timing in long-duration crops like cotton.

4.2. Inter-Crop Phenology Comparison

In the preceding section, a detailed analysis of individual crop phenologies was conducted. In this section, we extend the analysis to a multi-crop comparison. Specifically, we examine the values and corresponding dates at local extrema, focusing on local minima near sowing and harvesting periods, and local maxima during the growing stages, evaluating which crop growth stages most closely align with the observed local maxima. We then assess multiple categories of SAR-derived metrics, including variability of local extrema, threshold-crossing values, duration-based indicators, curve-shape descriptors, and area-under-curve measures, to determine their relative discriminative power. Together, these analyses provide a systematic evaluation of how different feature families capture crop-specific phenological patterns and enable robust multi-crop separation.

4.2.1. Variability of Local Extrema Values and Corresponding Dates

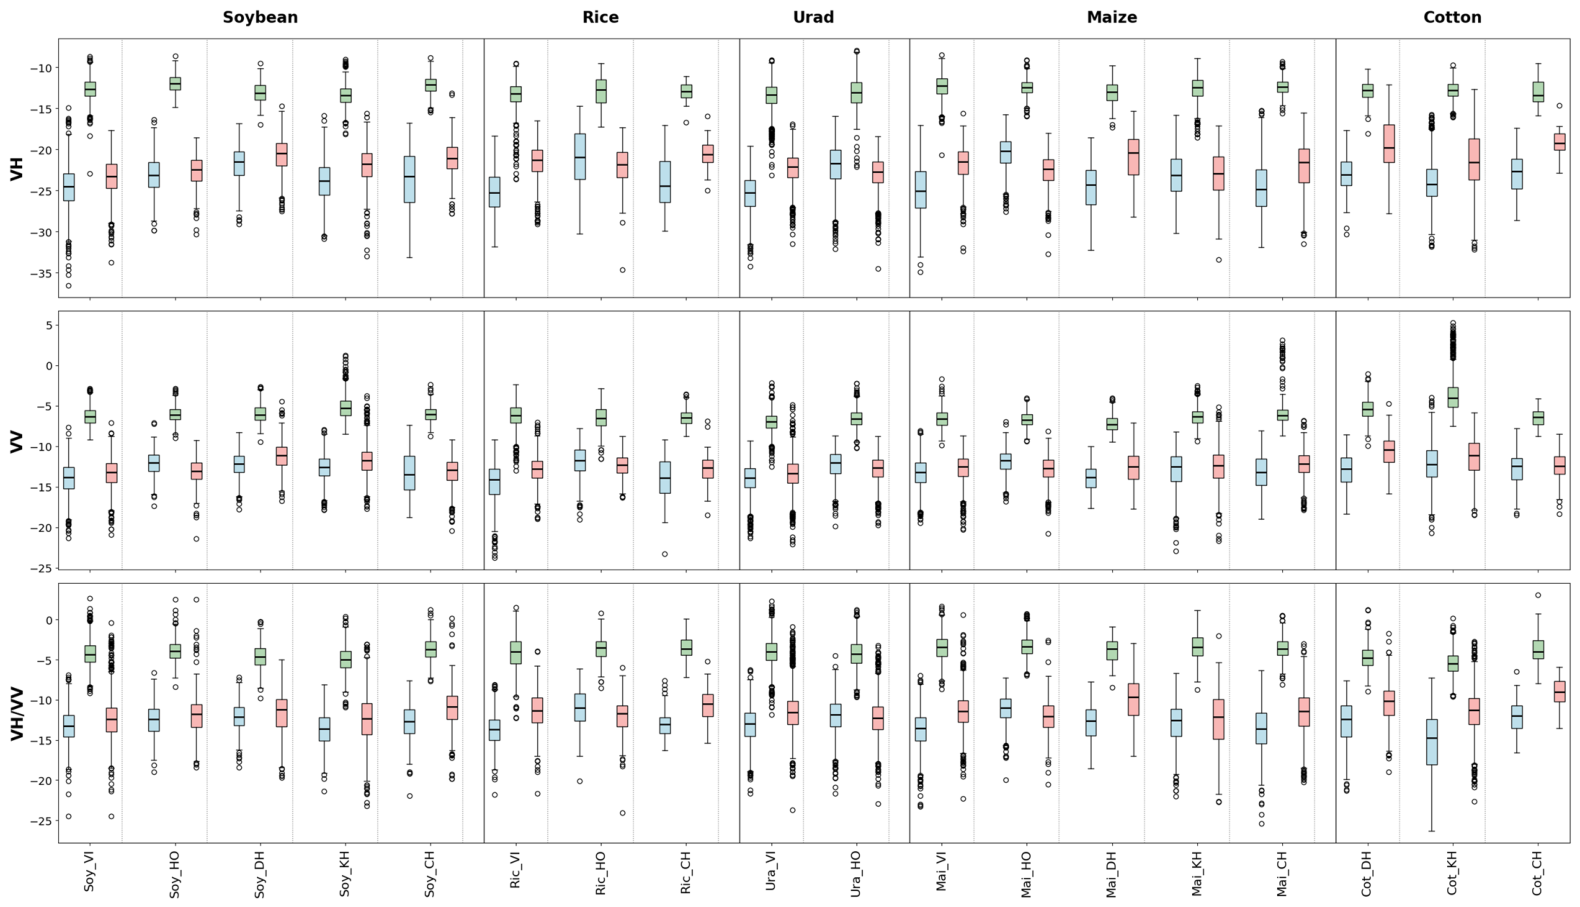
This section presents a combined analysis of Sentinel-1 C-band SAR backscatter values (Figure 10) and their corresponding Day of Year (DOY) occurrences (Figure 11) at key phenological stages: minima near sowing (SMV/SMD), maxima during peak season (PSMV/PSMD), and minima near harvest (HMV/HMD).
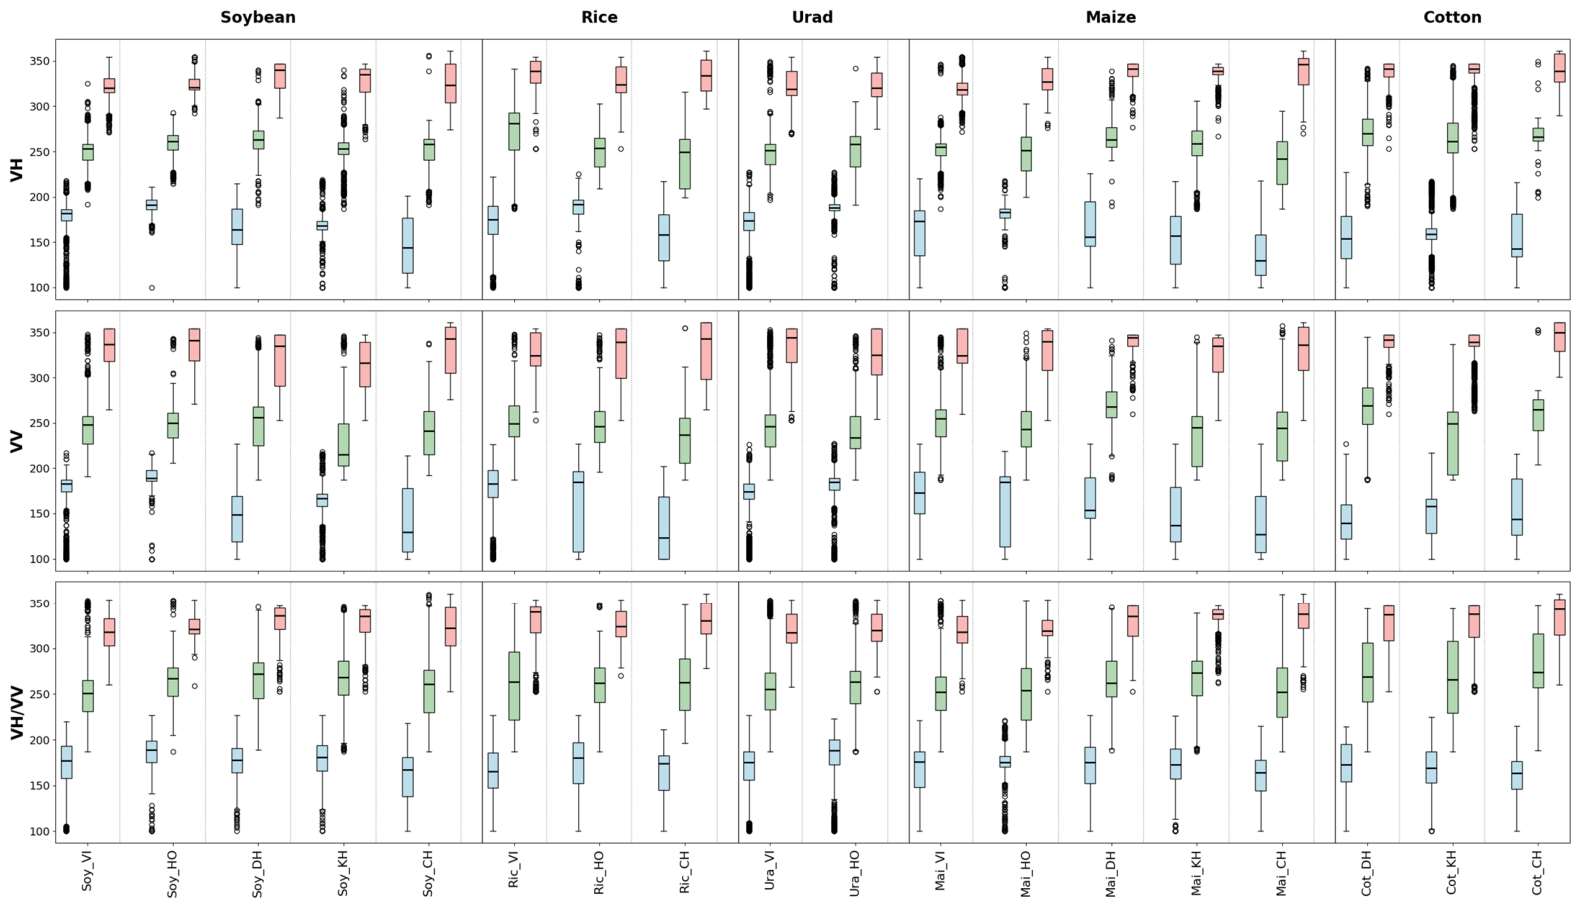
Among the studied crops, cotton emerges as the most distinctive, exhibiting the longest phenological cycle of approximately 180 days with consistently late PSMD and HMD values across all polarizations and districts, typically beyond DOY 300. Cotton also stands out with the highest SAR backscatter values at peak season across VH, VV, and VH/VV, with PSMV reaching the highest ranges across nearly all districts. These high peak values are attributed to its dense canopy and moisture-rich structure, which enhance double-bounce scattering in VV polarization [10]. Rice shows greater phenological variability across districts, generally maturing later than soybean and urad but earlier than cotton. District-level variability likely reflects diverse cultivation practices. Rice also demonstrates moderately high VH backscatter values at peak, indicative of a dense, moisture-rich canopy. Maize consistently demonstrates early phenological development, with peak season timing typically between DOY 240–260, earlier than cotton and often earlier than rice. It shows moderate-to-strong SAR backscatter signals at peak, particularly in the VV and VH/VV bands, generally exceeding those of urad and, in many cases, soybean, though remaining below cotton. Urad consistently shows the earliest harvest timing, accompanied by remarkably tight spread in timing variability across all districts and polarizations. The crop demonstrates the lowest VV backscatter values at peak season, with PSMV consistently lower than all other crops, indicating sparse canopy structure or shorter plant height. Soybean exhibits moderate phenological characteristics with notable consistency in certain parameters. Soybean shows the least spread in VH peak values, with narrow interquartile ranges compared to other crops. The crop’s peak and harvest timing generally fall between DOY 250-280, positioning it earlier than cotton and rice but a little later than urad (Figure 11). Soybean also demonstrates the second-highest VV backscatter values after cotton in many districts, suggesting substantial biomass development during peak growth.
Polarization-specific patterns provide valuable insights into crop discrimination. Cotton exhibits the highest SAR backscatter values at peak season in VH and VV polarizations, while maize shows the highest values in VH/VV ratio. The VH band demonstrates the largest dynamic range between SMV and PSMV (~10 dB), confirming its strong sensitivity to biomass accumulation and canopy development. Its DOY timings for soybean and urad show higher consistency, reflecting their more uniform growth. The VV band, while less dynamic in tracking growth and having relatively less dynamic values over time, provides valuable insights into surface conditions, but its interpretation can be more complex than for VH due to its dual sensitivity to both soil conditions and vegetation structure [24]. VV shows good discrimination for certain crops (cotton has very high VV PSMV; urad has very low VV PSMV), suggesting that VV has value for specific crop types. The VH/VV ratio, being a normalized metric, offers a more stable view of structural changes over time by minimizing environmental and surface effects. It shows distinct crop separation at peak (especially for rice and maize), and its elevated HMV values for cotton and maize suggest the presence of persistent post-harvest residues. Harvest minima values and timing show good separation across different crops, with some crops maintaining higher residual backscatter values than others. Cotton exhibits the highest harvest residuals, while urad and soybean show comparatively low values, potentially reflecting different post-harvest field conditions or crop residue management practices.

4.2.2. Threshold Crossing Metrics

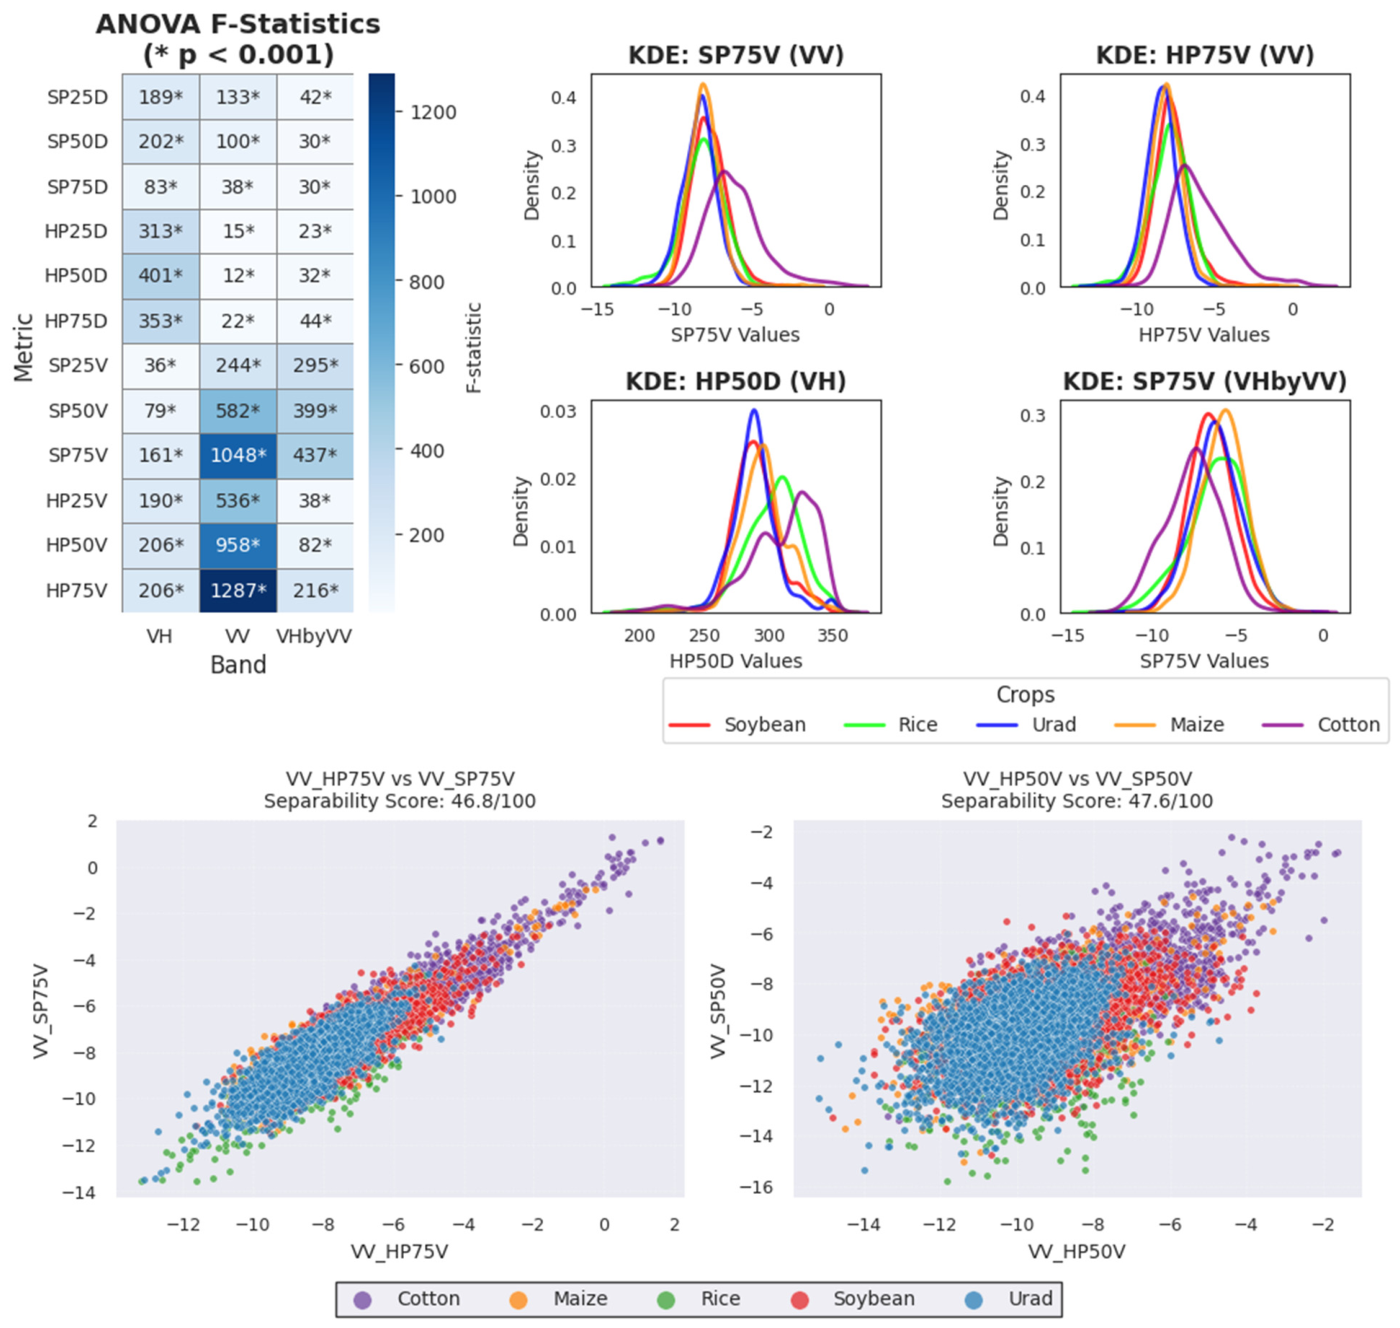
A multi-faceted statistical analysis of 12 SAR threshold-crossing metrics was performed to determine their efficacy in separating the five crop types. The analysis used ANOVA F-statistics to assess overall five-crop discrimination, Tukey HSD tests to evaluate pairwise mean differences, and Jeffries–Matusita (J-M) distance to quantify pairwise class separability. For overall five-crop discrimination, HP75V in VV polarization yielded the highest F-statistic (F = 1287), followed by SP75V (F = 1048) and HP50V (F = 958), also in the VV band, while date-based metrics showed significantly lower F-statistics (Figure 12). The 75% threshold metrics outperformed 50% thresholds by nearly 2-fold (SP75V: F = 1048 vs. SP50V: F = 582), indicating that near-peak biomass periods provide optimal discrimination windows. The KDE plots for HP75V and SP75V in the VV band (Figure 12, top) reveal that cotton’s distribution is distinctly separate from those of the other four crops. Tukey HSD results for HP75V (VV) show the largest mean difference between cotton and urad (Mean Diff = 2.54 dB), supported by a J-M distance of 0.32, the highest among all crop pairs. In contrast, the cereal–legume cluster (soybean, maize, urad, rice) shows persistent overlapping distributions with mean differences typically <0.5 dB. The feature space diagrams (Figure 12 bottom) confirm this pattern, with bivariate combinations yielding separability scores of approximately 47/100, and cotton (purple) appearing as the only distinctly separable cluster, while other crops show dense overlap.

4.2.3. Duration Metrics

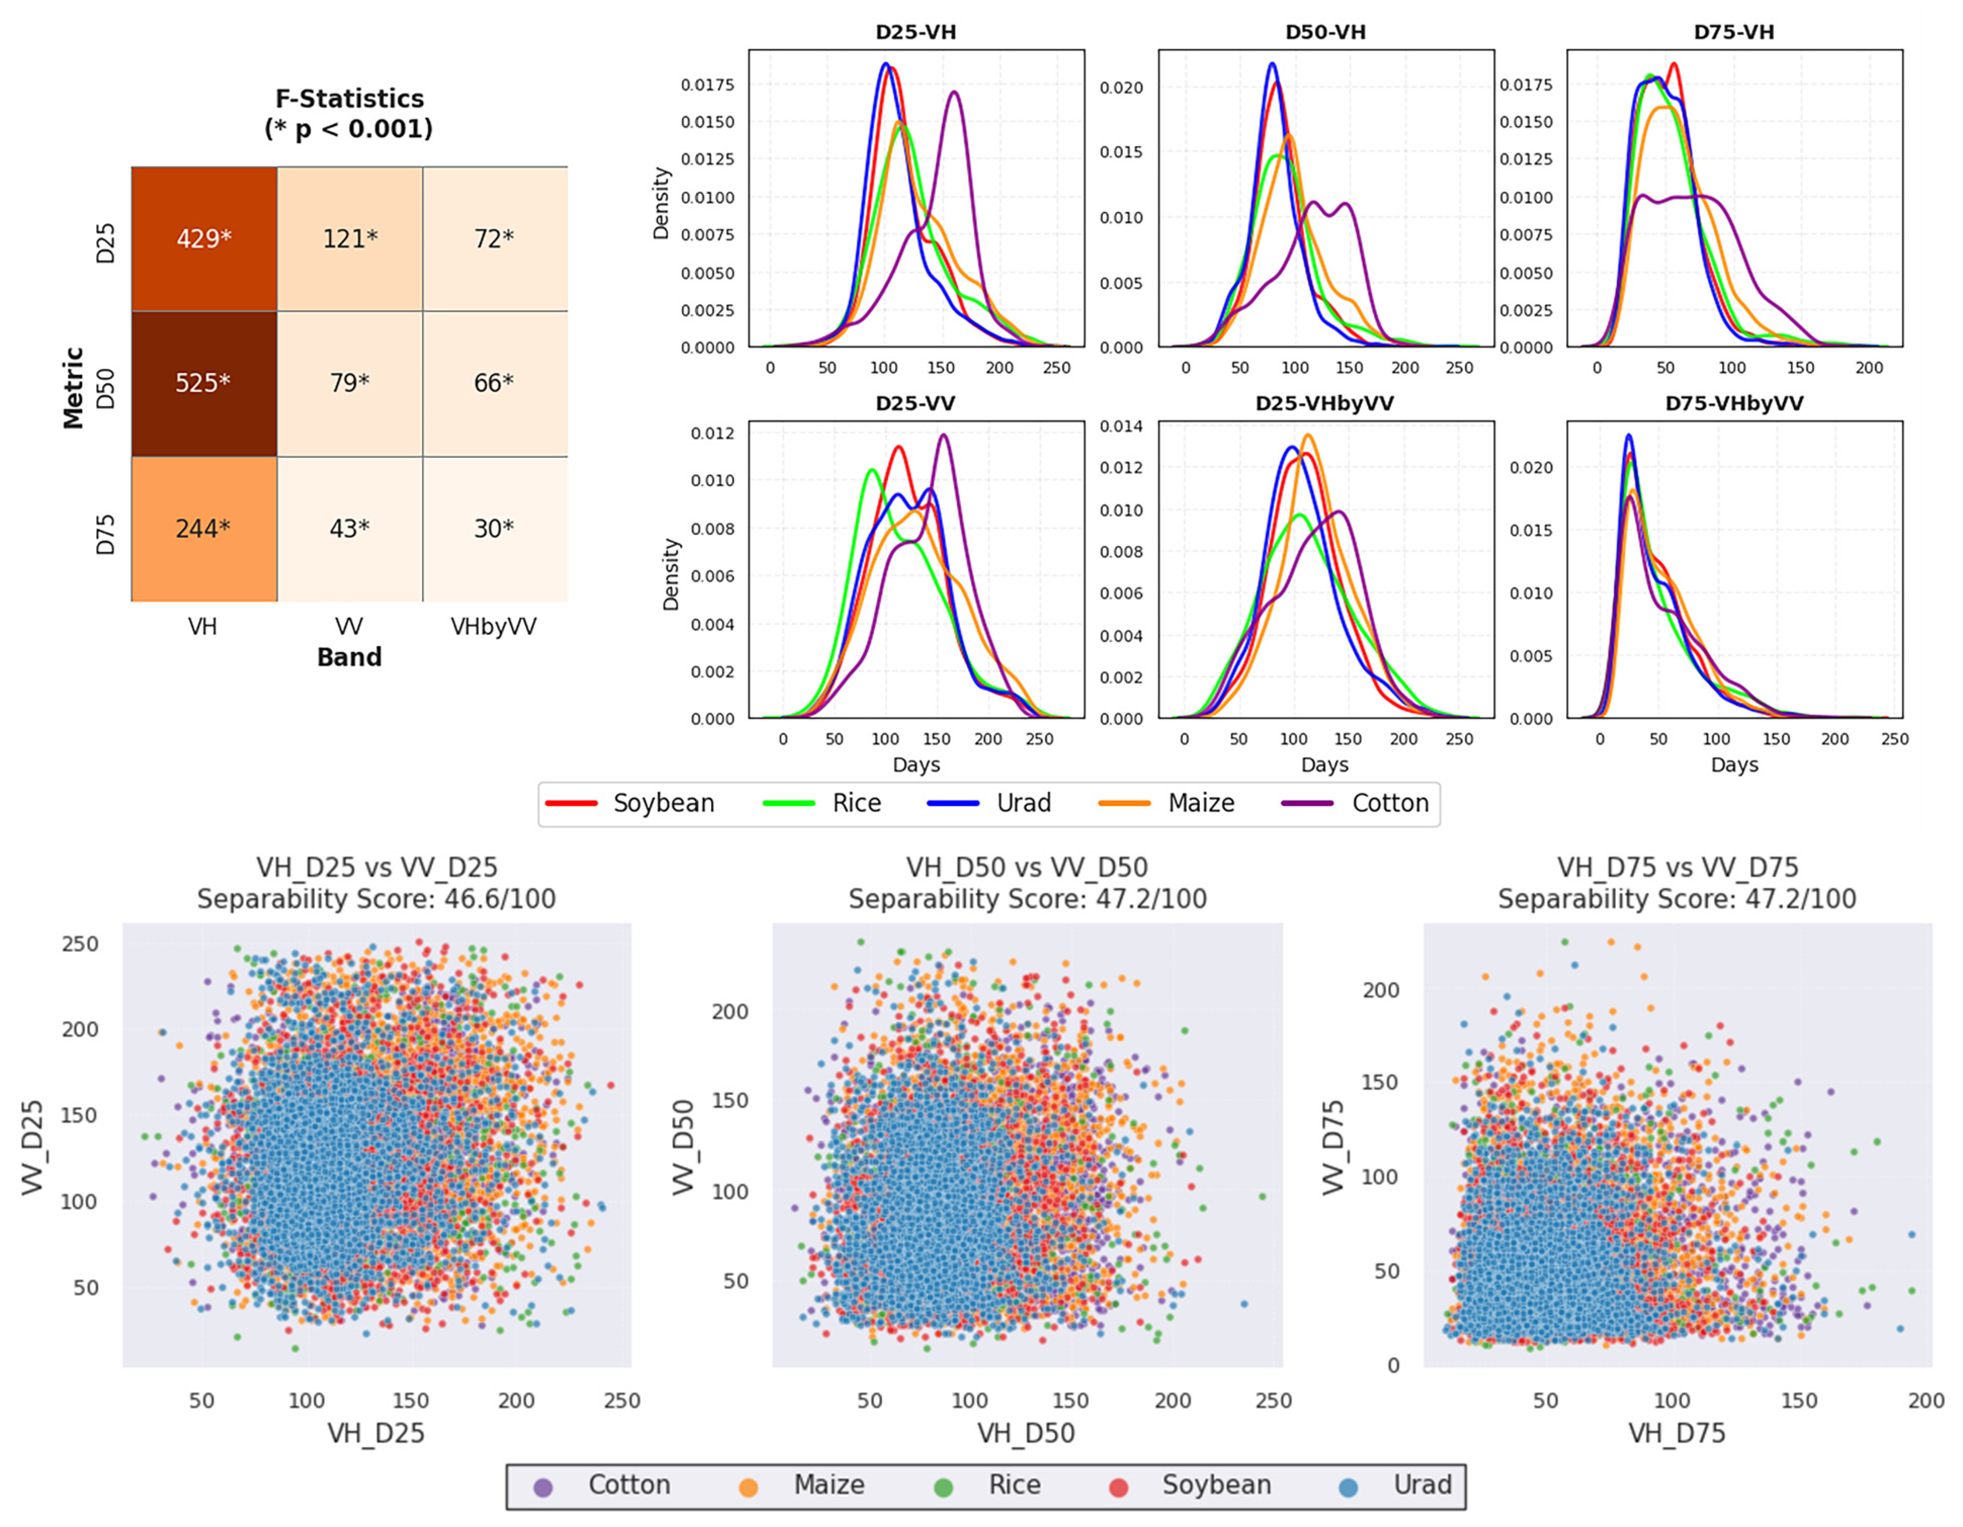
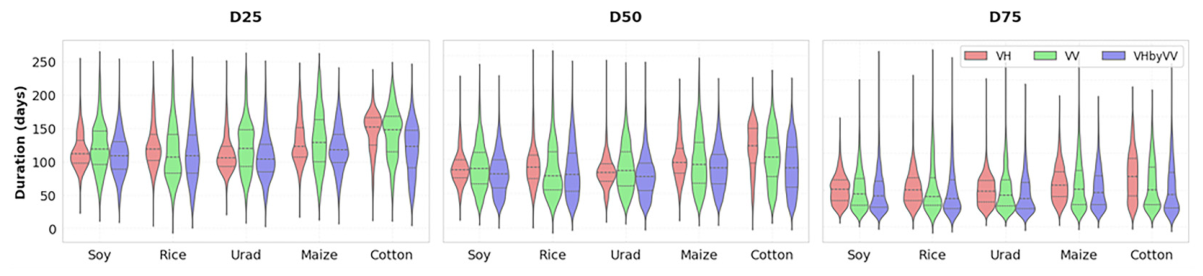
Duration metrics (D25, D50, D75), which measure the time elapsed between corresponding growth and senescence thresholds, were evaluated for crop differentiation based on phenological cycle length. D50 (VH) achieved the highest F-statistic (F = 525), followed by D25 (VH, F = 429) and D75 (VH, F = 244), with VH polarization consistently outperforming VV and VH/VV by 3–6-fold across all duration metrics (Figure 13). While statistically significant, these metrics are generally less powerful for overall crop separation than intensity-based threshold metrics.
Cotton exhibited distinctly longer growing seasons across all duration metrics (Figure 14). Tukey HSD results for D50 (VH) show mean differences of ~34 days between cotton and urad, and ~29 days between cotton and soybean. The violin plots (Figure 13) confirm that cotton’s median duration (~140–150 days for D25) is markedly higher than other crops, while urad shows the lowest values. However, rice, soybean, maize, and urad show considerable overlap with J-M distance values < 0.2, indicating poor separability within this group. The KDE distributions (Figure 14) show that D25-VH and D50-VH provide clean cotton separation, while D75-VH/VV demonstrates poor discrimination, with all crops clustering tightly. Feature space scatter plots (Figure 14 bottom) yield separability scores of 46.6–47.2/100 across duration–polarization combinations, confirming moderate overall discrimination.

4.2.4. Phenology Curve Shape Descriptors

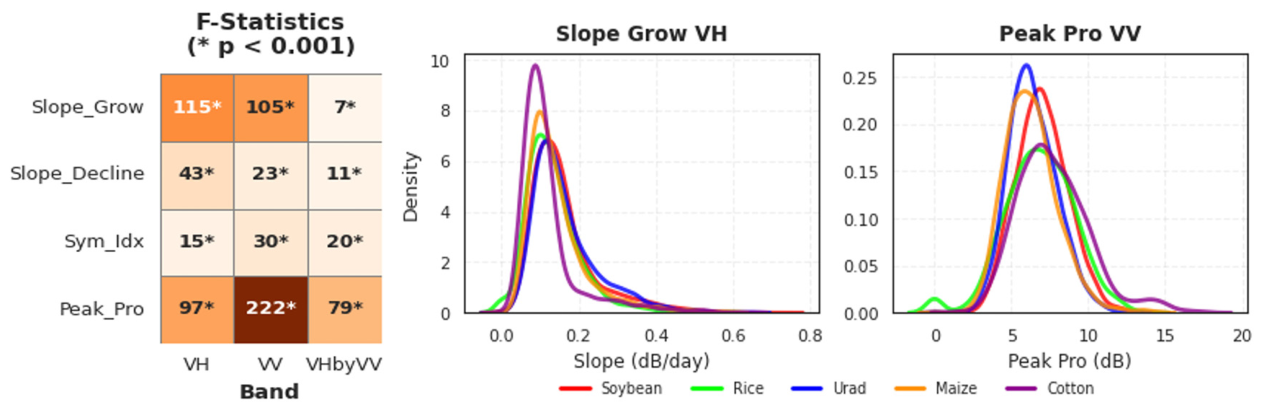
Phenology curve shape descriptors characterize the geometric and temporal properties of seasonal SAR backscatter profiles. Peak Prominence (= (PSMV − SP50V) + (PSMV − HP50V)) quantifies signal intensity contrast by measuring how much the peak stands out from surrounding 50% threshold levels. Slope Growth captures canopy development velocity from 25% threshold to peak biomass, Slope Decline quantifies senescence speed from peak to 25% threshold, and Symmetry Index measures temporal balance between growth and senescence phases.
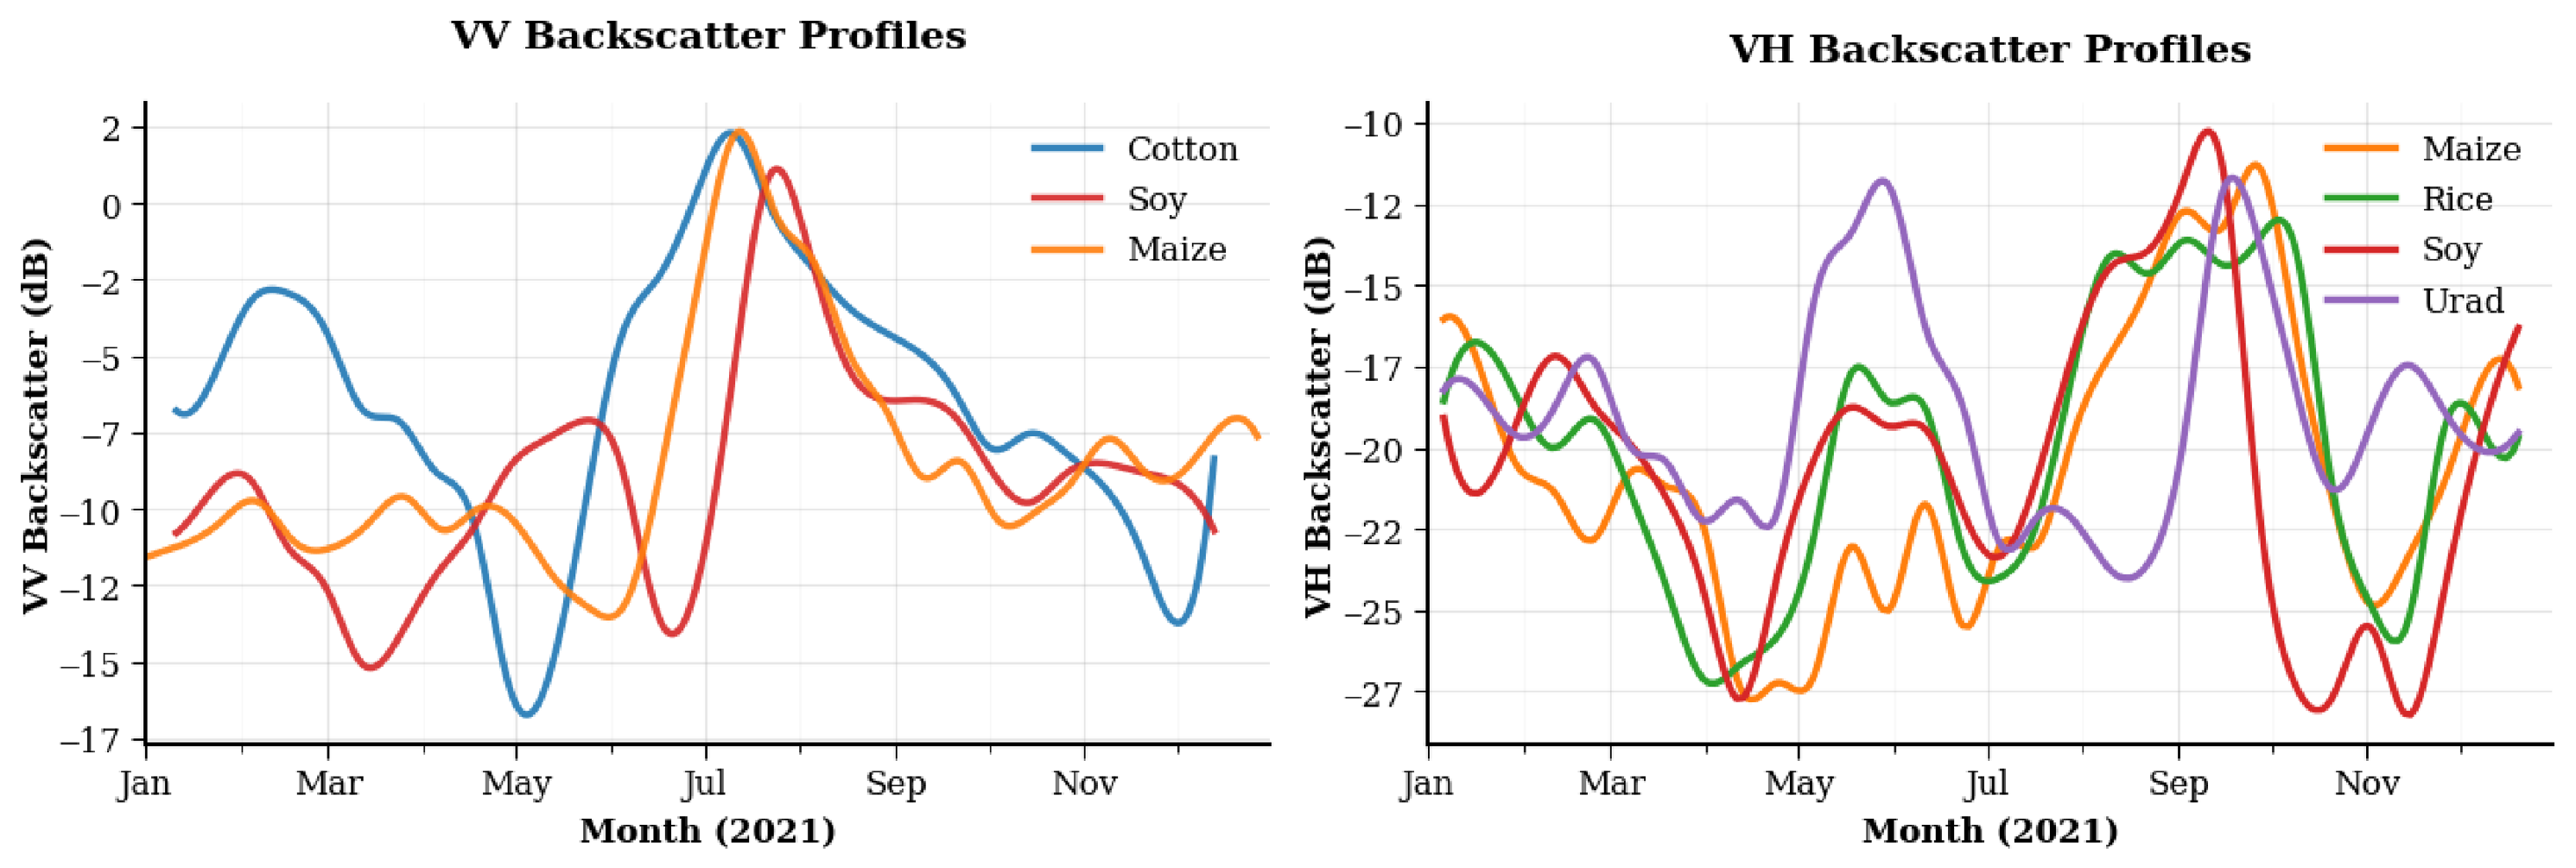
Peak Prominence (VV) demonstrated the highest discriminative power among curve shape descriptors (F = 222), followed by Slope Growth in the VH (F = 115) and VV (F = 105) bands (Figure 15). Slope Decline showed moderate performance (VH: F = 43, VV: F = 23), while Symmetry Index yielded the lowest F-statistics (VH: F = 15, VV: F = 30). The KDE plots reveal cotton as distinctly separated in Peak Prominence VV (~12–18 dB), while other crops cluster between 4–8 dB. For Slope Growth, all crops show similar distributions around 0.1–0.2 dB/day with substantial overlap. The temporal backscatter profiles (Figure 16) illustrate these patterns: cotton exhibits a signal contrast in VV with a pronounced peak and deep trough, whereas soybean and maize show more moderate seasonal variations. In VH, all crops display monsoon-aligned growth patterns, with rice showing a distinctive profile shape.

4.2.5. Area Under the Curve

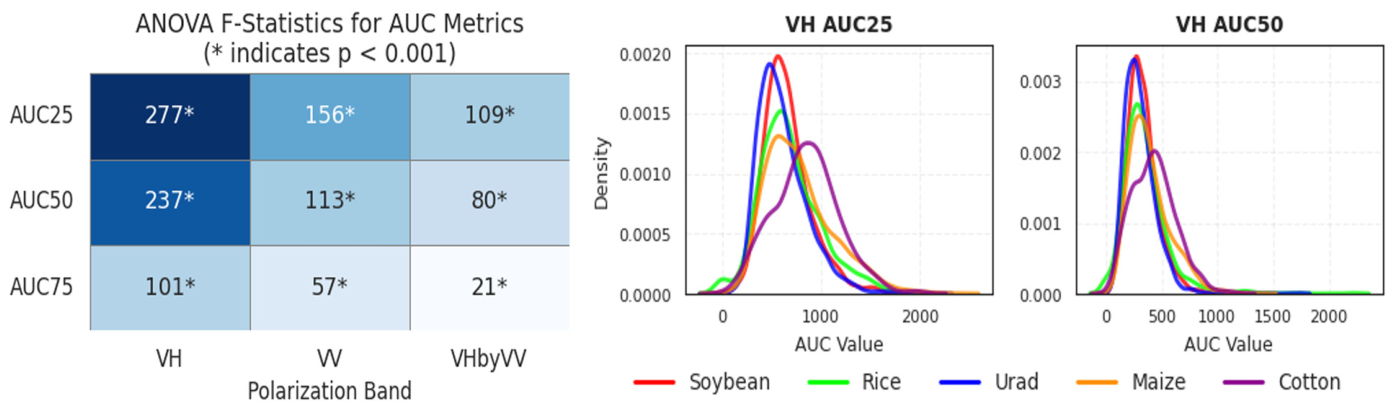
Area Under the Curve (AUC) metrics represent the cumulative SAR signal energy integrated between corresponding threshold crossing dates, providing a holistic measure of crop canopy persistence and biomass accumulation throughout the growing season. Unlike point-based metrics that capture specific phenological moments, AUC features quantify the total signal contribution over extended periods, making them particularly valuable for distinguishing crops with different canopy architectures, biomass densities, and seasonal persistence patterns [55]. The three AUC variants (25%, 50%, 75%) capture progressively refined portions of the growth cycle: AUC25 encompasses the broadest seasonal window from early emergence to late senescence, AUC50 focuses on the core growing period, while AUC75 isolates the peak biomass phase.
AUC25 (VH) achieved the highest discriminative power (F = 277), followed by AUC50 (VH, F = 237) and AUC75 (VH, F = 101), with VH polarization consistently outperforming VV and VH/VV across all threshold levels (Figure 17). The KDE distributions show cotton distinctly separated with higher AUC values (~1500–2500 for AUC25) compared to other crops (~500–1000). The hierarchical pattern where AUC25 > AUC50 > AUC75 indicates that broader temporal windows provide stronger crop discrimination. However, cereal–legume crops (soybean, rice, urad, maize) show substantial overlap across all AUC variants, with cotton as the only distinctly separable crop.

4.3. Crop Classification Using Phenological Metrics

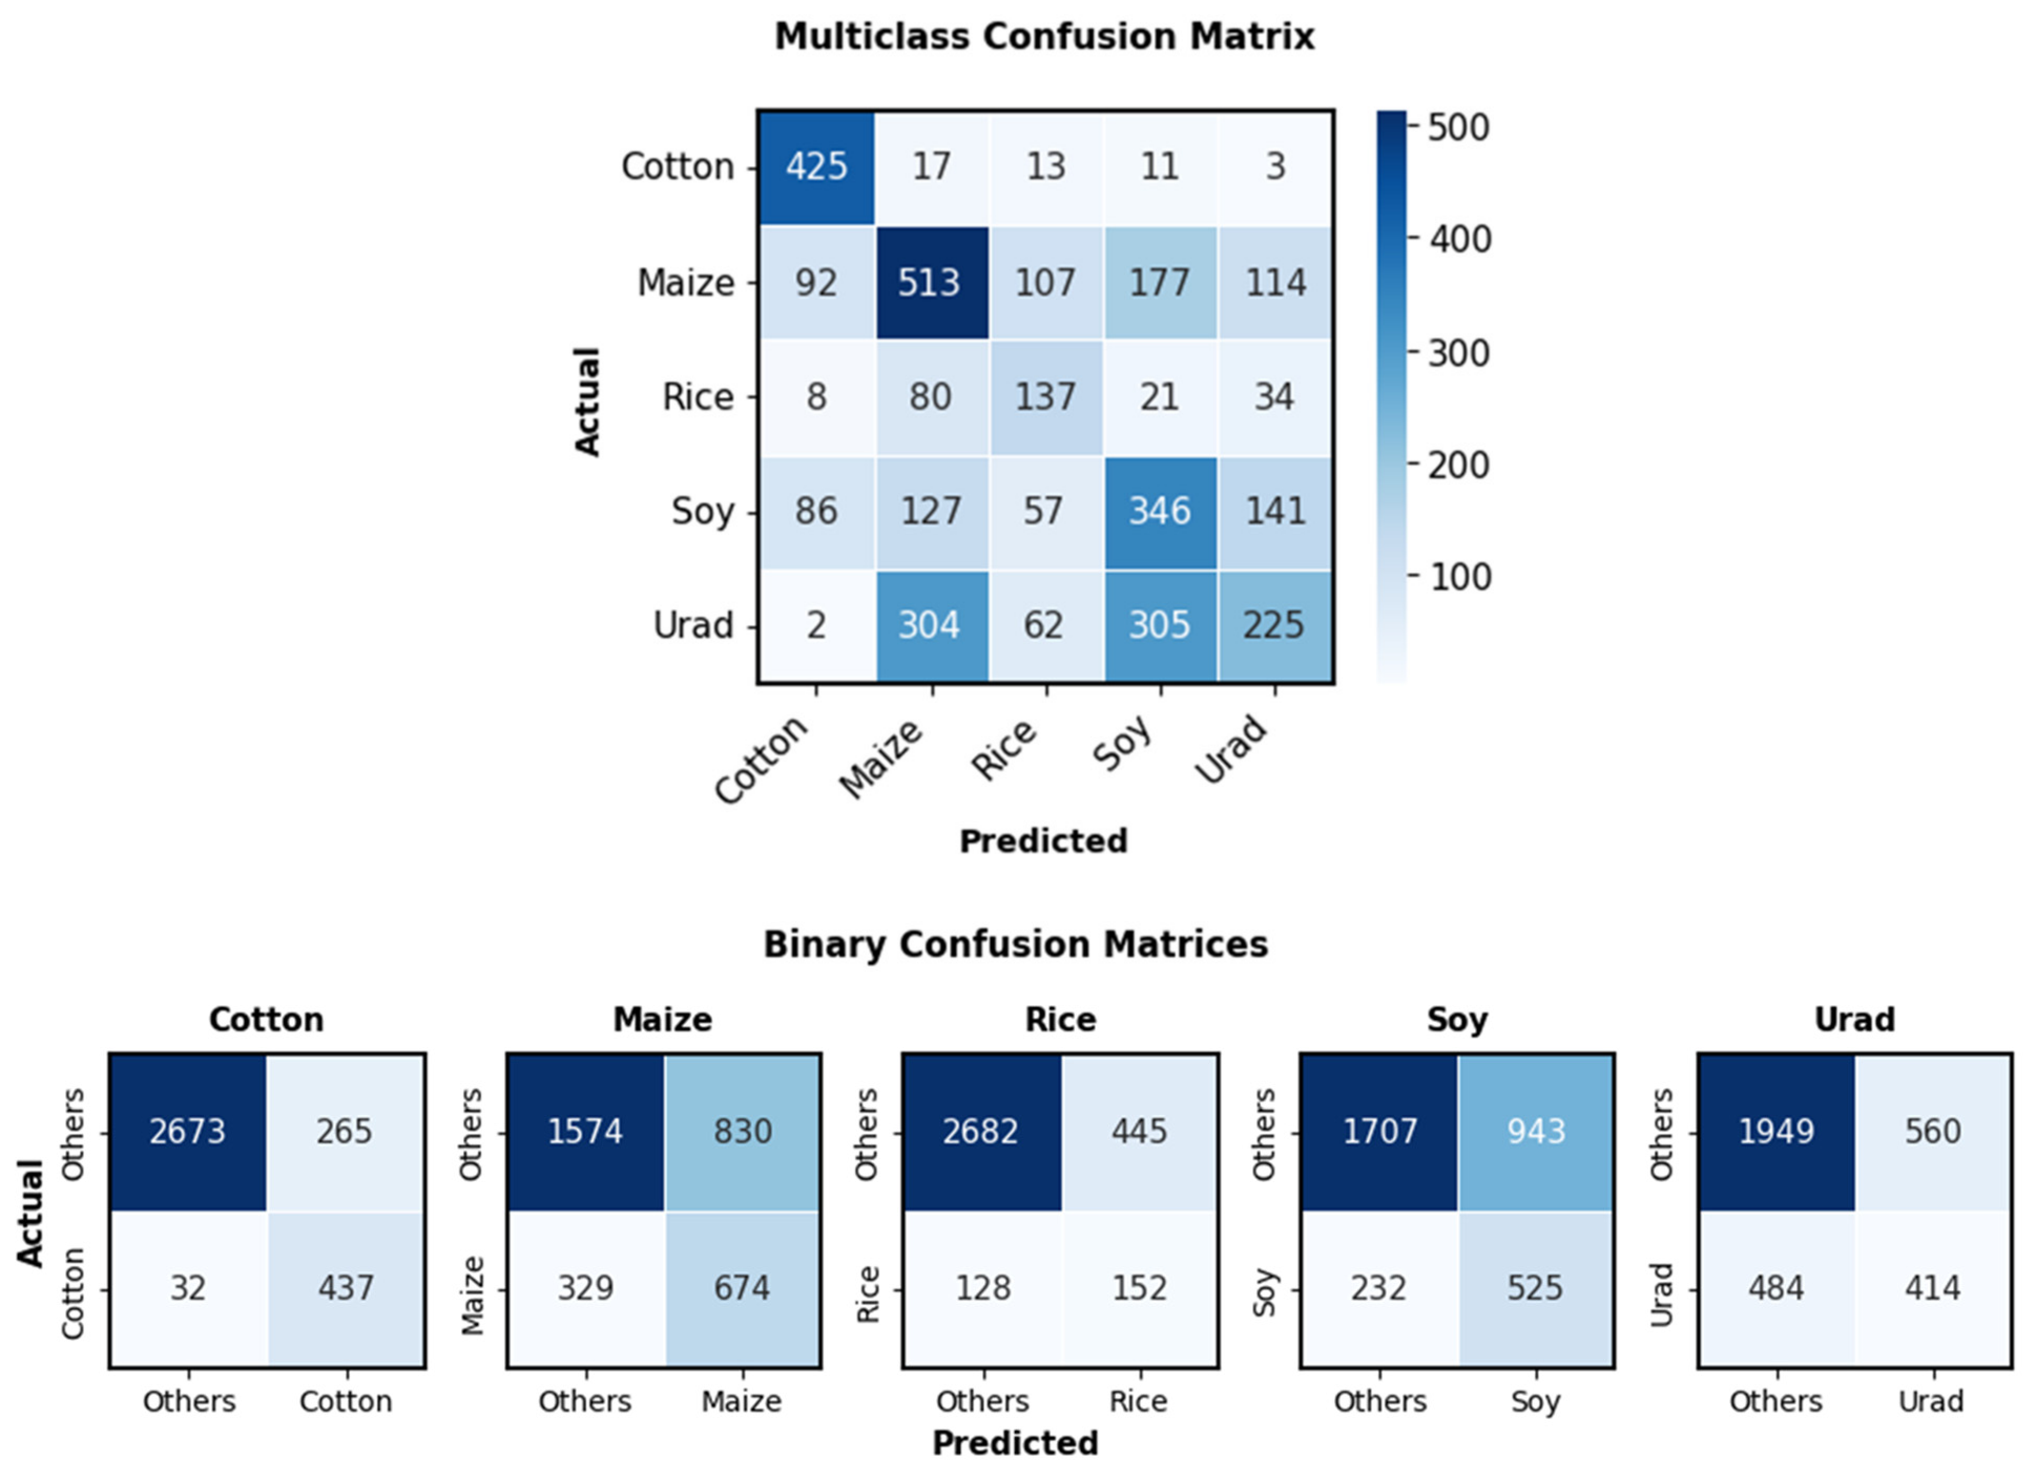
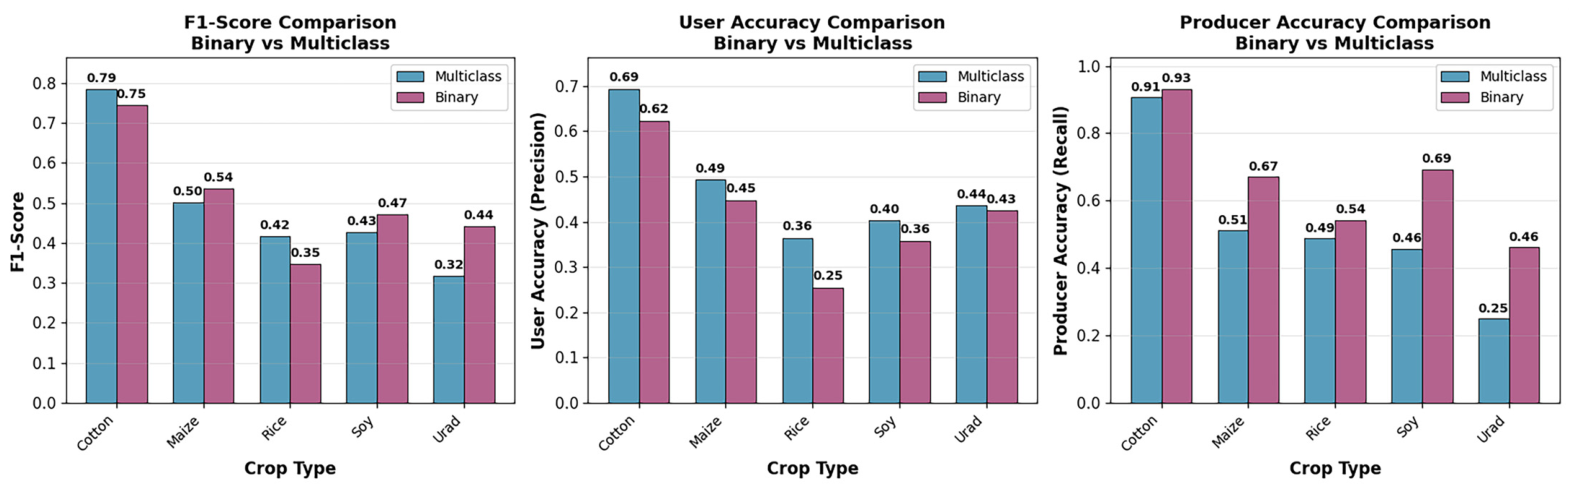
To evaluate the operational utility of the phenological metrics derived in Section 4.2, we performed comprehensive crop classification analysis using balanced Random Forest with field-level data splitting to prevent spatial autocorrelation [47]. Multiclass classification achieved an overall accuracy of 48.3%, with cotton demonstrating the highest performance (F1: 0.79, UA: 69%, PA: 91%), followed by maize (F1: 0.54), soy (F1: 0.43), rice (F1: 0.42), and urad (F1: 0.32) (Figure 18).
The confusion matrix (Figure 19) reveals that moderate overall accuracy stems from systematic misclassifications within the cereal–legume cluster. Urad showed the highest confusion, being misclassified as soy (305 instances) and maize (304 instances). Similarly, soy was frequently confused with urad (141) and maize (127), while maize was confused with soy (177). In contrast, cotton achieved 425 correct classifications with minimal confusion (17 misclassified as maize). Binary classification confirmed these patterns: cotton showed excellent detection (437 TP, 32 FP), while urad exhibited poor recall (414 TP, 484 FN).
Binary vs. multiclass comparison (Figure 18) showed cotton with superior multiclass performance (F1: 0.79 vs. 0.75 binary), while urad and soy showed improved binary performance (urad: 0.44 vs. 0.32; soy: 0.47 vs. 0.43), suggesting that these crops are better detected individually than in multi-crop scenarios. Feature importance analysis revealed VH polarization dominating 65% of top 20 features, with peak value features (PSMV, SP75V, HP75V) outperforming timing features. Crop-specific feature preferences emerged: cotton relied on VV intensity features (VV_HP75V, VV_SP75V), maize favored VH/VV ratio (VHbyVV_PSMV), and rice depended on timing features (VV_SMD, VV_SP25D).

4.4. Inter-District Generalization

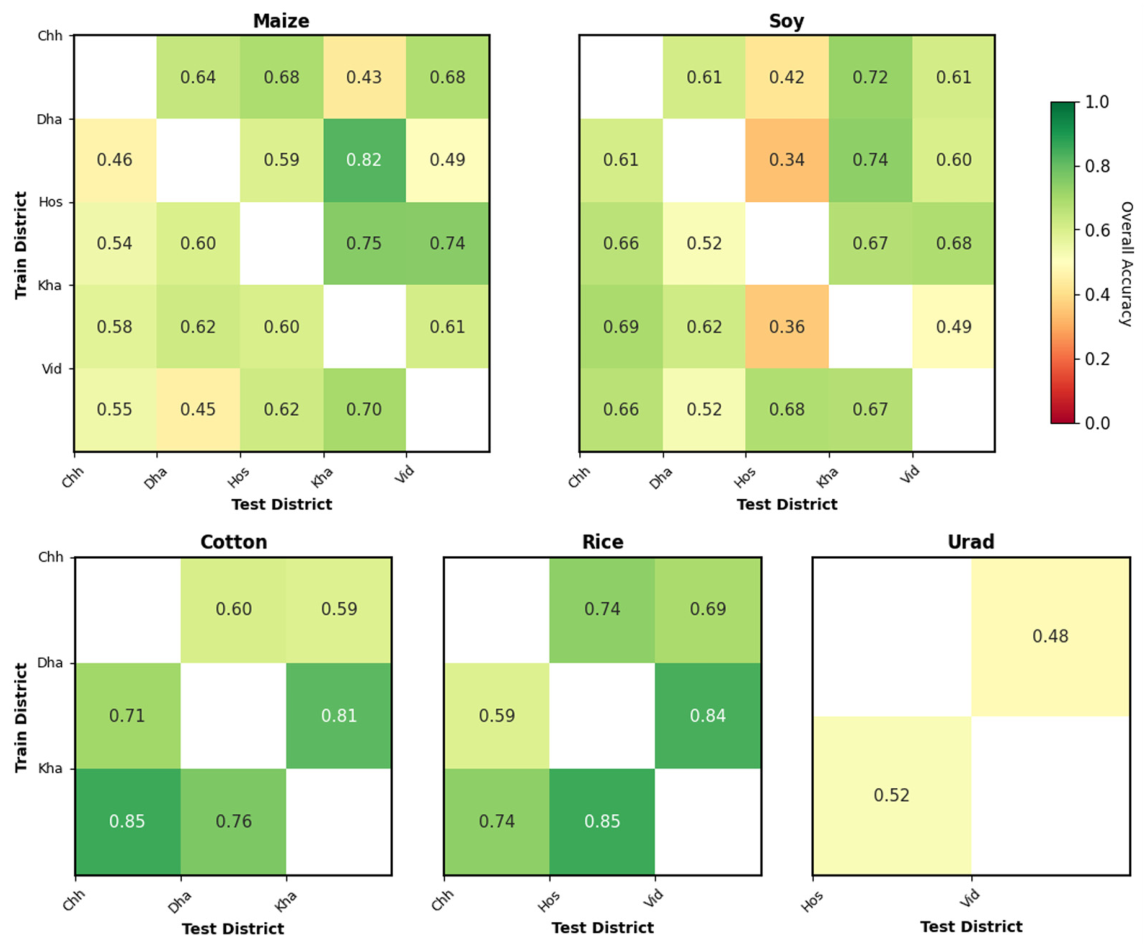
To assess model transferability among different agroclimatic zones, we conducted binary cross-district testing analysis for each crop individually. For this analysis, we trained Random Forest models for binary classification (target crop vs. others) on individual districts and evaluated their performance when applied to test data from districts where the target crop was present, creating crop-specific transferability matrices. This approach simulates real-applied scenarios where models developed for specific crop monitoring in one agroclimatic zone are deployed across different regions, while accounting for region-specific crop distributions and varying soil, climate, and management practices. Binary cross-district testing assessed model transferability by training on individual districts and testing on others (Figure 20). Rice achieved the highest mean transferability (~74%), with the best performance from Vidisha→Hoshangabad (0.85). Cotton showed strong transferability (~72%) with Khargone→Chhindwara achieving 0.85. Maize demonstrated moderate consistency (~60%) across all district combinations, with Hoshangabad→Khargone reaching 0.82. Soybean exhibited variable performance (~58%) with notably poor results when tested on Hoshangabad (0.34–0.52). Urad’s transferability (~50%) could not be adequately assessed due to presence in only two districts.

5. Discussion

This study presents the first attempt to develop and evaluate a novel set of SAR-derived phenological metrics for monsoon crop discrimination in smallholder agricultural systems, tested across five agroclimatic zones in Central India for five monsoon crops. The integration of 45 time-integrated features across five thematic categories provides systematic insights into both the potential and inherent constraints of Sentinel-1 SAR-based crop monitoring in smallholder systems.

5.1. Phenological Signatures and Metric Performance

The temporal SAR profiles revealed a fundamental dichotomy between structurally distinct crops and phenologically convergent crop groups. Cotton’s extended phenology (~180 days) and late harvest timing created temporal separation from other crops, while the legume group (soybean, urad) exhibited compressed, monsoon-synchronized growth patterns with peak biomass occurring within a narrow 30–40-day window (DOY 240-280). This temporal convergence is not coincidental but reflects the agronomic reality of monsoon-dependent agriculture, where sowing is triggered by rainfall onset and harvest is constrained by post-monsoon field operations.
A key finding is that metrics capturing backsatter intensity during peak biomass periods achieved the highest discriminative power, outperforming metrics based on phenological timing. This indicates that structural biomass differences during peak growth phases provide better discriminative power than phenological timing variations, a finding that aligns with Veloso et al. (2017) [10] and Harfenmeister et al. (2019) [37], who reported that C-band backscatter intensity during peak biomass effectively captures crop-specific canopy characteristics. Another important insight is that AUC25 achieved the better discriminative power compared to AUC50 and AUC75. These results validate the approach of computing AUC and duration within threshold boundaries, avoiding phenology curve endpoints defined by sowing and harvest minima. In practice, the true minima at sowing and harvest are often poorly captured in Sentinel-1 time series due to the 12-day revisit interval [43]. Additionally, fields may exhibit elevated backscatter from residual biomass of preceding crops or from early establishment of subsequent crops before a transient bare-soil condition can be observed. This issue is particularly pronounced in intensive cropping systems such as Hoshangabad, where double- and triple-cropping compress phenological windows and obscure clean endpoint signals. In contrast, districts with single- or double-cropping patterns retain longer fallow periods, allowing clearer minima detection. This disparity likely explains the poor cross-district transferability of classification models when trained or tested on Hoshangabad (0.34–0.52 accuracy for soybean), as phenological metrics calibrated under different cropping intensities do not generalize well. By computing AUC within 25% threshold boundaries rather than absolute minima, these metrics effectively avoid the ambiguous endpoint regions where external field dynamics obscure the intrinsic crop signal. Similarly, peak season metrics (PSMV, PSMD) emerged as more reliable indicators than sowing/harvest minima, as they are less affected by cropping system intensity and better aligned with each crop’s intrinsic growth characteristics.

5.2. Classification Performance and Crop Separability

The moderate multiclass accuracy (48.3%) warrants careful interpretation. Confusion matrix analysis reveals that systematic misclassifications occur predominantly within the cereal–legume cluster: urad was misclassified as soy and maize while soy–maize confusion contributed additional errors. This pattern is not unique to our methodology but reflects fundamental phenological convergence among multicropping systems. Belgiu et al. (2021) [56] documented similar challenges, reporting that similarities in temporal profiles (using optical data) for maize, cereals, soybeans, and other crops led to large misclassification. Skakun et al. (2016) [57] specifically noted that maize and soybean share a common crop calendar and highly similar spectral characteristics, leading to confusion in classification. Studies in semi-arid Morocco combined barley and wheat into a single “cereal” class because “both crops have similar phenology and plant structure” that precluded reliable separation (Moumni & Lahrouni, 2021) [58]. These observations collectively suggest that cereal–legume discrimination challenges are inherent to crops sharing similar canopy architectures and monsoon-aligned growing seasons, rather than limitations of specific methodologies or sensors.
Our classification accuracies are comparable to other SAR-based studies in tropical monsoon contexts. Research in South India using Sentinel-1 for monsoon crop detection reported F-scores of 0.33–0.45 for rice during Kharif season using SAR alone, improving to around 0.60 with Sentinel-2 optical data fusion during Kharif, and reaching 0.82–0.98 during the cloud-free Rabi season [59]. Studies achieving higher accuracies typically focused on single-crop detection, such as rice mapping studies routinely reporting higher accuracy using rule-based approaches that leverage rice’s distinctive flooding signature [60] or operated in temperate regions with distinct crop calendars. Furthermore, many papers focusing on European agriculture systems achieved higher accuracies [61] but European cropping systems feature longer growing seasons and bigger fields that fundamentally differ from monsoon-dependent smallholder agriculture in tropical regions [62,63,64,65]. The dominance of VH polarization in feature importance (65% of top 20 features) reflects its sensitivity to volume scattering from accumulated canopy biomass, consistent with the established sensitivity of cross-polarized SAR signals to volume scattering and biomass accumulation [10,24,37]. Notably, crop-specific feature preferences emerged from binary classification analysis: cotton relied heavily on VV polarization intensity features (VV_HP75V, VV_SP75V), and maize favored VH/VV ratio features, while rice accuracy showed strong dependence on timing features (VV_SMD, VH_PSMD). These distinct preferences suggest that differentiated monitoring strategies, rather than a universal feature set, may be more effective for operational single-crop detection in monsoon systems. Cotton’s superior performance across all analyses stems from its distinctive phenological characteristics: extended growing season late harvest timing and high peak backscatter attributable to dense canopy structure during fiber development [26]. The high F-statistics observed for top-performing metrics across categories are largely driven by cotton’s distinct separation from other crops. The improved binary performance for urad and soy compared to multiclass results indicates that these crops possess distinguishable signatures when isolated from multi-crop scenarios, but mutual confusion degrades overall classification. This suggests that targeted single-crop detection systems may exhibit better classification performance than comprehensive multi-crop classification in monsoon smallholder systems.

5.3. Cross-District Transferability

Cross-district transferability analysis provides insights into regional robustness. Rice achieved the highest mean transferability (74%), indicating phenological consistency across agroclimatic zones despite variations in soil type, rainfall distribution, and management practices. Cotton maintained strong transferability (72%) with Khargone→Chhindwara achieving 85% accuracy, demonstrating that its distinctive extended phenology translates reliably across regions. However, soybean exhibited notably poor transferability when tested on Hoshangabad (0.34–0.52 accuracy), highlighting how intensive triple-cropping systems compress phenological windows, elevate baseline backscatter from adjacent crops, and reduce the discriminative power of phenological metrics. This regional variability underscores the challenge of developing universally applicable models for smallholder systems with diverse cropping intensities [64,66,67].

5.4. Limitations and Future Directions

The results should be interpreted in light of several important limitations. First, reliance on single-year (2021) observations limits assessment of temporal robustness. Interannual variability in monsoon onset, rainfall distribution, and temperature can shift phenological timing by 1–3 weeks. However, intensity-based metrics capturing structural biomass differences may be more robust to such temporal shifts, as relative backscatter magnitudes during peak growth are primarily determined by crop-specific canopy characteristics rather than absolute timing. Second, the 12-day Sentinel-1 revisit interval may miss rapid phenological transitions critical for discriminating crops with compressed growing seasons [11,68,69,70]. While combined Sentinel-1A/1B observations can reduce this to 6 days in some regions, combining with future SAR missions and commercial constellations (e.g., ICEYE, Capella) offering 1–3 day revisit times could potentially enable more precise phenological characterization [71,72,73,74]. Additionally, the recent NISAR mission’s L-band capability may complement existing C-band observations by providing different scattering sensitivity to crop structure, potentially enabling similar phenological metric frameworks to be tested across multiple wavelengths [72,75]. Third, SAR alone appears insufficient for comprehensive multi-crop discrimination in monsoon systems. Multiple studies have demonstrated that SAR–optical fusion generally improves classification accuracy compared to single-sensor approaches [76], with optical data providing complementary spectral information on chlorophyll content and vegetation health that SAR’s structural sensitivity cannot [58,77,78].

6. Conclusions

This study developed and evaluated unique set of Sentinel-1 SAR-derived phenological metrics across five thematic categories for monsoon crop discrimination in smallholder systems. The central finding is that phenological convergence among monsoon-aligned cereal and legume crops represents a fundamental constraint on multi-crop discrimination using Sentinel-1 SAR alone. Among the metrics evaluated, intensity-based features during peak biomass consistently outperformed timing-based features. Crop-specific discrimination patterns suggest that targeted single-crop detection may be more practical than comprehensive multi-crop classification in monsoon smallholder systems. Rice and cotton showed strong cross-district transferability, while soybean performed poorly due to phenological similarity with maize and urad. Additionally, transferability degraded in intensive triple-cropping systems like Hoshangabad, where compressed fallow periods and the 12-day revisit interval limit reliable metric extraction. Future research should prioritize expanding this framework to additional agroclimatic zones and crop types, multi-year validation to assess temporal robustness, and multi-sensor fusion with optical data to resolve cereal–legume confusion. Formal comparison between condensed phenological metrics and full time-series classifiers would further help evaluate trade-offs between interpretability and classification performance.

Author Contributions

Conceptualization, M.P. and C.J.; methodology, M.P.; software, M.P.; validation, M.P.; formal analysis, M.P.; investigation, M.P.; resources, M.P. and C.J.; data curation, M.P.; writing—original draft preparation, M.P.; writing—review and editing, M.P. and C.J.; visualization, M.P.; supervision, C.J.; project administration, C.J.; funding acquisition, C.J. All authors have read and agreed to the published version of the manuscript.

Funding

The work was supported by the NASA Land-Cover and Land-Use Change (LCLUC) Program (NNX16AH98G).

Data Availability Statement

The Sentinel-1 SAR imagery used in this study can be downloaded from the ESA Copernicus Data Space (https://dataspace.copernicus.eu (accessed date 5 April 2026)). Ground truth data and code are available upon request from the corresponding author. The original contributions presented in this study are included in the article, and further inquiries can be directed to the corresponding author.

Acknowledgments

We gratefully acknowledge the feedback and constructive input provided by mentors and colleagues from the NASA LCLUC and NASA Harvest programs, which greatly contributed to strengthening this work. We also sincerely thank the farmers and local communities for their support and assistance during ground data collection.

Conflicts of Interest

The authors declare no conflicts of interest.

References

  1. Dhillon, B.S.; Sohu, V.S. Climate Change Shocks and Crop Production: The Foodgrain Bowl of India as an Example. Indian J. Agron. 2024, 69, 1–10. [Google Scholar] [CrossRef] [Scilit]
  2. Rasid, N.; Prashnani, M.; Goswami, J.; Raju, P.L.N. Crop Damage Assessment in Flood Inundated Area of Morigaon District of Assam. Int. Arch. Photogramm. Remote Sens. Spat. Inf. Sci. 2019, XLII-3/W6, 489–491. [Google Scholar] [CrossRef] [Scilit]
  3. Singh, B.K.; Delgado-Baquerizo, M.; Egidi, E.; Guirado, E.; Leach, J.E.; Liu, H.; Trivedi, P. Climate Change Impacts on Plant Pathogens, Food Security and Paths Forward. Nat. Rev. Microbiol. 2023, 21, 640–656. [Google Scholar] [CrossRef] [Scilit] [PubMed]
  4. Ray, S.S.; Mamatha, S.; Gupta, S. Use of Remote Sensing in Crop Forecasting and Assessment of Impact of Natural Disasters: Operational Approaches in India. Crop Monit. Improv. Food Secur. 2014, 111–121. Available online: https://www.researchgate.net/publication/270023174_Use_of_Remote_Sensing_in_Crop_Forecasting_and_Assessment_of_Impact_of_Natural_Disasters_Operational_Approaches_in_India/citations (accessed on 5 April 2026).
  5. McNairn, H.; Shang, J. A Review of Multitemporal Synthetic Aperture Radar (SAR) for Crop Monitoring. In Multitemporal Remote Sensing: Methods and Applications; Ban, Y., Ed.; Springer International Publishing: Cham, Switzerland, 2016; pp. 317–340. [Google Scholar]
  6. Bisht, I.S.; Rana, J.C.; Pal Ahlawat, S. The Future of Smallholder Farming in India: Some Sustainability Considerations. Sustainability 2020, 12, 3751. [Google Scholar] [CrossRef] [Scilit]
  7. Khan, H.R.; Gillani, Z.; Jamal, M.H.; Athar, A.; Chaudhry, M.T.; Chao, H.; He, Y.; Chen, M. Early Identification of Crop Type for Smallholder Farming Systems Using Deep Learning on Time-Series Sentinel-2 Imagery. Sensors 2023, 23, 1779. [Google Scholar] [CrossRef] [Scilit]
  8. Uday, G.; Purse, B.V.; Kelley, D.I.; Vanak, A.; Samrat, A.; Chaudhary, A.; Rahman, M.; Gerard, F.F. Radar versus Optical: The Impact of Cloud Cover When Mapping Seasonal Surface Water for Health Applications in Monsoon-Affected India. PLoS ONE 2025, 20, e0314033. [Google Scholar] [CrossRef] [Scilit] [PubMed]
  9. Meroni, M.; d’Andrimont, R.; Vrieling, A.; Fasbender, D.; Lemoine, G.; Rembold, F.; Seguini, L.; Verhegghen, A. Comparing Land Surface Phenology of Major European Crops as Derived from SAR and Multispectral Data of Sentinel-1 and -2. Remote Sens. Environ. 2021, 253, 112232. [Google Scholar] [CrossRef] [Scilit]
  10. Veloso, A.; Mermoz, S.; Bouvet, A.; Le Toan, T.; Planells, M.; Dejoux, J.-F.; Ceschia, E. Understanding the Temporal Behavior of Crops Using Sentinel-1 and Sentinel-2-like Data for Agricultural Applications. Remote Sens. Environ. 2017, 199, 415–426. [Google Scholar] [CrossRef] [Scilit]
  11. Schlund, M.; Erasmi, S. Sentinel-1 Time Series Data for Monitoring the Phenology of Winter Wheat. Remote Sens. Environ. 2020, 246, 111814. [Google Scholar] [CrossRef] [Scilit]
  12. Wang, Y.; Fang, S.; Zhao, L.; Huang, X.; Jiang, X. Parcel-Based Summer Maize Mapping and Phenology Estimation Combined Using Sentinel-2 and Time Series Sentinel-1 Data. Int. J. Appl. Earth Obs. Geoinformation 2022, 108, 102720. [Google Scholar] [CrossRef] [Scilit]
  13. Ma, H.; Wang, L.; Sun, W.; Yang, S.; Gao, Y.; Fan, L.; Yang, G.; Wang, Y. A New Rice Identification Algorithm under Complex Terrain Combining Multi-Characteristic Parameters and Homogeneous Objects Based on Time Series Dual-Polarization Synthetic Aperture Radar. Front. Ecol. Evol. 2023, 11, 1093454. [Google Scholar] [CrossRef] [Scilit]
  14. Neetu; Prashnani, M.; Singh, D.K.; Joshi, R.; Ray, S.S. Understanding Crop Growing Pattern in Bardhaman District of West Bengal Using Multi-Date RISAT 1 MRS Data. Int. Arch. Photogramm. Remote Sens. Spat. Inf. Sci. 2014, XL-8, 861–864. [Google Scholar] [CrossRef] [Scilit]
  15. Singha, M.; Dong, J.; Zhang, G.; Xiao, X. High Resolution Paddy Rice Maps in Cloud-Prone Bangladesh and Northeast India Using Sentinel-1 Data. Sci. Data 2019, 6, 26. [Google Scholar] [CrossRef] [Scilit]
  16. Nasrallah, A.; Baghdadi, N.; El Hajj, M.; Darwish, T.; Belhouchette, H.; Faour, G.; Darwich, S.; Mhawej, M. Sentinel-1 Data for Winter Wheat Phenology Monitoring and Mapping. Remote Sens. 2019, 11, 2228. [Google Scholar] [CrossRef] [Scilit]
  17. Vreugdenhil, M.; Wagner, W.; Bauer-Marschallinger, B.; Pfeil, I.; Teubner, I.; Rüdiger, C.; Strauss, P. Sensitivity of Sentinel-1 Backscatter to Vegetation Dynamics: An Austrian Case Study. Remote Sens. 2018, 10, 1396. [Google Scholar] [CrossRef] [Scilit]
  18. Khabbazan, S.; Vermunt, P.; Steele-Dunne, S.; Arntz, L.R.; Marinetti, C.; van der Valk, D.; Iannini, L.; Molijn, R.; Westerdijk, K.; van der Sande, C. Crop Monitoring Using Sentinel-1 Data: A Case Study from The Netherlands. Remote Sens. 2019, 11, 1887. [Google Scholar] [CrossRef] [Scilit]
  19. Hong, Y.; Zhang, S.; Li, L. Research Progresses of Crop Growth Monitoring Based on Synthetic Aperture Radar Data. Smart Agric. 2024, 6, 46–62. [Google Scholar] [CrossRef]
  20. Wang, L.; Ma, H.; Gao, Y.; Chen, S.; Yang, S.; Lu, P.; Fan, L.; Wang, Y. Small- and Medium-Sized Rice Fields Identification in Hilly Areas Using All Available Sentinel-1/2 Images. Plant Methods 2024, 20, 25. [Google Scholar] [CrossRef] [Scilit] [PubMed]
  21. Kumari, M.; Murthy, C.S.; Pandey, V.; Bairagi, G.D. Soybean Cropland Mapping Using Multi-Temporal Sentinel-1 Data. Int. Arch. Photogramm. Remote Sens. Spat. Inf. Sci. 2019, XLII-3/W6, 109–114. [Google Scholar] [CrossRef] [Scilit]
  22. Shastri, B.; Haldar, D.; Mohan, S. Temporal Monitoring of SAR Polarimetric Parameters and Scattering Mechanism for Major Kharif Crops and Surrounding Land Use. Int. J. Sci. Eng. Technol. Res. 2015, 4, 416–424. [Google Scholar]
  23. Kothapalli Venkata, R.; Poloju, S.; Mullapudi Venkata Rama, S.S.; Gogineni, A.; Prabir Kumar, D.; Allakki Venkata, R.; Nagaraju, A.; Diwakar, P.G.; Dadhwal, V.K.; Singh, K.R.P. Multi-Incidence Angle RISAT-1 Hybrid Polarimetric SAR Data for Large Area Mapping of Maize Crop—A Case Study in Khagaria District, Bihar, India. Int. J. Remote Sens. 2017, 38, 5487–5501. [Google Scholar] [CrossRef] [Scilit]
  24. Kushwaha, A.; Dave, R.; Kumar, G.; Saha, K.; Khan, A. Assessment of Rice Crop Biophysical Parameters Using Sentinel-1 C-Band SAR Data. Adv. Space Res. 2022, 70, 3833–3844. [Google Scholar] [CrossRef] [Scilit]
  25. Ghosh, A.; Nanda, M.K.; Sarkar, D.; Sarkar, S.; Brahmachari, K.; Mainuddin, M. Kharif Rice Growth and Area Monitoring in Gosaba CD Block of Indian Sundarbans Region Using Multi-Temporal Dual-Pol SAR Data. Environ. Dev. Sustain. 2025, 27, 6331–6348. [Google Scholar] [CrossRef] [Scilit]
  26. Kumaraperumal, R.; Shama, M.; Kannan, B.; Ragunath, K.P.; Jagadeeswaran, R. Sentinel 1A SAR Backscattering Signature of Maize and Cotton Crops. Madras Agric. J. 2017, 104, 54–57. [Google Scholar] [CrossRef] [Scilit]
  27. Kumar, D.A.; Srikanth, P.; Neelima, T.L.; Devi, M.U.; Suresh, K.; Murthy, C.S. Monitoring of Spectral Signatures of Maize Crop Using Temporal SAR and Optical Remote Sensing Data. Int. J. Bio-Resour. Stress Manag. 2021, 12, 745–750. [Google Scholar] [CrossRef] [Scilit]
  28. Verma, A.; Kumar, A.; Lal, K. Kharif Crop Characterization Using Combination of SAR and MSI Optical Sentinel Satellite Datasets. J. Earth Syst. Sci. 2019, 128, 230. [Google Scholar] [CrossRef] [Scilit]
  29. Neetu; Meshram, P.; Ray, S.S. Field-Level Crop Classification Using an Optimal Dataset of Multi-Temporal Sentinel-1 and Polarimetric RADARSAT-2 SAR Data with Machine Learning Algorithms. J. Indian Soc. Remote Sens. 2021, 49, 2945–2958. [Google Scholar] [CrossRef] [Scilit]
  30. Kim, Y.; Jackson, T.; Bindlish, R.; Lee, H.; Hong, S. Radar Vegetation Index for Estimating the Vegetation Water Content of Rice and Soybean. IEEE Geosci. REMOTE Sens. Lett. 2012, 9, 564–568. [Google Scholar] [CrossRef] [Scilit]
  31. Nasirzadehdizaji, R.; Sanli, F.B.; Abdikan, S.; Cakir, Z.; Sekertekin, A.; Ustuner, M. Sensitivity Analysis of Multi-Temporal Sentinel-1 SAR Parameters to Crop Height and Canopy Coverage. Appl. Sci. 2019, 9, 655. [Google Scholar] [CrossRef] [Scilit]
  32. Rußwurm, M.; Körner, M. Temporal Vegetation Modelling Using Long Short-Term Memory Networks for Crop Identification from Medium-Resolution Multi-Spectral Satellite Images. In Proceedings of the 2017 IEEE Conference on Computer Vision and Pattern Recognition Workshops (CVPRW), Honolulu, HI, USA, 21–26 July 2017; pp. 1496–1504. [Google Scholar]
  33. Crisóstomo de Castro Filho, H.; Abílio de Carvalho Júnior, O.; Ferreira de Carvalho, O.L.; Pozzobon de Bem, P.; dos Santos de Moura, R.; Olino de Albuquerque, A.; Rosa Silva, C.; Guimarães Ferreira, P.H.; Fontes Guimarães, R.; Trancoso Gomes, R.A. Rice Crop Detection Using LSTM, Bi-LSTM, and Machine Learning Models from Sentinel-1 Time Series. Remote Sens. 2020, 12, 2655. [Google Scholar] [CrossRef] [Scilit]
  34. Ndikumana, E.; Ho Tong Minh, D.; Baghdadi, N.; Courault, D.; Hossard, L. Deep Recurrent Neural Network for Agricultural Classification Using Multitemporal SAR Sentinel-1 for Camargue, France. Remote Sens. 2018, 10, 1217. [Google Scholar] [CrossRef] [Scilit]
  35. Bhan, M.; Sahu, R.; Agrawal, K.K.; Dubey, A.; Tiwari, D.K.; Singh, P.P. Farmers Perception on Climate Change and Its Impact on Agriculture in East Central India; AICRPAM—NICRA Department of Physics & Agrometeorology: Hyderabad, India, 2014. [Google Scholar]
  36. Prashnani, M.; Dupare, B.; Vadrevu, K.P.; Justice, C. Towards Food Security: Exploring the Spatio-Temporal Dynamics of Soybean in India. PLoS ONE 2024, 19, e0292005. [Google Scholar] [CrossRef] [Scilit]
  37. Harfenmeister, K.; Spengler, D.; Weltzien, C. Analyzing Temporal and Spatial Characteristics of Crop Parameters Using Sentinel-1 Backscatter Data. Remote Sens. 2019, 11, 1569. [Google Scholar] [CrossRef] [Scilit]
  38. Najem, S.; Baghdadi, N.; Bazzi, H.; Zribi, M. Incidence Angle Normalization of C-Band Radar Backscattering Coefficient over Agricultural Surfaces Using Dynamic Cosine Method. Remote. Sens. 2024, 16, 3838. [Google Scholar] [CrossRef] [Scilit]
  39. Feng, Z.; Zheng, X.; Li, L.; Li, B.; Chen, S.; Guo, T.; Wang, X.; Jiang, T.; Li, X.; Li, X. Dynamic Cosine Method for Normalizing Incidence Angle Effect on C-Band Radar Backscattering Coefficient for Maize Canopies Based on NDVI. Remote Sens. 2021, 13, 2856. [Google Scholar] [CrossRef] [Scilit]
  40. Eisfelder, C.; Boemke, B.; Gessner, U.; Sogno, P.; Alemu, G.; Hailu, R.; Mesmer, C.; Huth, J. Cropland and Crop Type Classification with Sentinel-1 and Sentinel-2 Time Series Using Google Earth Engine for Agricultural Monitoring in Ethiopia. Remote Sens. 2024, 16, 866. [Google Scholar] [CrossRef] [Scilit]
  41. Luo, J.; Xie, M.; Wu, Q.; Luo, J.; Gao, Q.; Shao, X.; Zhang, Y. Early Crop Identification Study Based on Sentinel-1/2 Images with Feature Optimization Strategy. Agriculture 2024, 14, 990. [Google Scholar] [CrossRef] [Scilit]
  42. Franch, B.; Moletto-Lobos, I.; Tarín-Mestre, J.; Mascolo, L.; Vermote, E.; Kalecinski, N.; Becker-Reshef, I.; San-Bautista, A.; Rubio, C.; San Francisco, S.; et al. The Yield Strikes Back: Enhancing the Transferability of Field Scale Wheat and Barley Yield Models by Leveraging Sentinel-1/2. Int. J. Appl. Earth Obs. Geoinf. 2026, 146, 105140. [Google Scholar] [CrossRef] [Scilit]
  43. Flores, L.; Nendel, C.; Bookhagen, B.; Oviedo Reyes, J.A.; Smith, T.; Ghazaryan, G. The Potential of Sentinel-1 Time Series for Large-Scale Assessment of Maize and Wheat Phenology across Germany. GIScience Remote Sens. 2025, 62, 2531593. [Google Scholar] [CrossRef] [Scilit]
  44. Chen, J.; Jönsson, P.; Tamura, M.; Gu, Z.; Matsushita, B.; Eklundh, L. A Simple Method for Reconstructing a High-Quality NDVI Time-Series Data Set Based on the Savitzky–Golay Filter. Remote Sens. Environ. 2004, 91, 332–344. [Google Scholar] [CrossRef] [Scilit]
  45. Steinbach, S.; Hentschel, E.; Hentze, K.; Rienow, A.; Umulisa, V.; Zwart, S.J.; Nelson, A. Automatization and Evaluation of a Remote Sensing-Based Indicator for Wetland Health Assessment in East Africa on National and Local Scales. Ecol. Inform. 2023, 75, 102032. [Google Scholar] [CrossRef] [Scilit]
  46. Hao, P.; Tang, H.; Chen, Z.; Liu, Z. Early-Season Crop Mapping Using Improved Artificial Immune Network (IAIN) and Sentinel Data. PeerJ 2018, 6, e5431. [Google Scholar] [CrossRef] [Scilit]
  47. Ahmed, Z.; Nalley, L.; Brye, K.; Steven Green, V.; Popp, M.; Shew, A.M.; Connor, L. Winter-Time Cover Crop Identification: A Remote Sensing-Based Methodological Framework for New and Rapid Data Generation. Int. J. Appl. Earth Obs. Geoinf. 2023, 125, 103564. [Google Scholar] [CrossRef] [Scilit]
  48. Bao, X.; Zhang, R.; Lv, J.; Wu, R.; Zhang, H.; Chen, J.; Zhang, B.; Ouyang, X.; Liu, G. Vegetation Descriptors from Sentinel-1 SAR Data for Crop Growth Monitoring. ISPRS J. Photogramm. Remote Sens. 2023, 203, 86–114. [Google Scholar] [CrossRef] [Scilit]
  49. Yang, H.; Pan, B.; Li, N.; Wang, W.; Zhang, J.; Zhang, X. A Systematic Method for Spatio-Temporal Phenology Estimation of Paddy Rice Using Time Series Sentinel-1 Images. Remote Sens. Environ. 2021, 259, 112394. [Google Scholar] [CrossRef] [Scilit]
  50. Wang, M.; Wang, J.; Chen, L.; Du, Z. Mapping Paddy Rice and Rice Phenology with Sentinel-1 SAR Time Series Using a Unified Dynamic Programming Framework. Open Geosci. 2022, 14, 414–428. [Google Scholar] [CrossRef] [Scilit]
  51. Lasko, K.; Vadrevu, K.P.; Tran, V.T.; Justice, C. Mapping Double and Single Crop Paddy Rice with Sentinel-1A at Varying Spatial Scales and Polarizations in Hanoi, Vietnam. IEEE J. Sel. Top. Appl. Earth Obs. Remote Sens. 2018, 11, 498–512. [Google Scholar] [CrossRef] [Scilit]
  52. Xiao, W.; Xu, S.; He, T. Mapping Paddy Rice with Sentinel-1/2 and Phenology-, Object-Based Algorithm—A Implementation in Hangjiahu Plain in China Using GEE Platform. Remote Sens. 2021, 13, 990. [Google Scholar] [CrossRef] [Scilit]
  53. Ma, Y.; Jiang, G.; Huang, J.; Shen, Y.; Guan, H.; Dong, Y.; Li, J.; Hu, C. Evaluating the Ability of the Sentinel-1 Cross-Polarization Ratio to Detect Spring Maize Phenology Using Adaptive Dynamic Threshold. Remote Sens. 2024, 16, 826. [Google Scholar] [CrossRef] [Scilit]
  54. Villarroya-Carpio, A.; Lopez-Sanchez, J.M.; Engdahl, M.E. Sentinel-1 Interferometric Coherence as a Vegetation Index for Agriculture. Remote Sens. Environ. 2022, 280, 113208. [Google Scholar] [CrossRef] [Scilit]
  55. Tefera, A.T.; Banerjee, B.P.; Pandey, B.R.; James, L.; Puri, R.R.; Cooray, O.; Marsh, J.; Richards, M.; Kant, S.; Fitzgerald, G.J.; et al. Estimating Early Season Growth and Biomass of Field Pea for Selection of Divergent Ideotypes Using Proximal Sensing. Field Crops Res. 2022, 277, 108407. [Google Scholar] [CrossRef] [Scilit]
  56. Belgiu, M.; Bijker, W.; Csillik, O.; Stein, A. Phenology-Based Sample Generation for Supervised Crop Type Classification. Int. J. Appl. Earth Obs. Geoinf. 2021, 95, 102264. [Google Scholar] [CrossRef] [Scilit]
  57. Skakun, S.; Kussul, N.; Shelestov, A.Y.; Lavreniuk, M.; Kussul, O. Efficiency Assessment of Multitemporal C-Band Radarsat-2 Intensity and Landsat-8 Surface Reflectance Satellite Imagery for Crop Classification in Ukraine. IEEE J. Sel. Top. Appl. Earth Obs. Remote Sens. 2016, 9, 3712–3719. [Google Scholar] [CrossRef] [Scilit]
  58. Moumni, A.; Lahrouni, A. Machine Learning-Based Classification for Crop-Type Mapping Using the Fusion of High-Resolution Satellite Imagery in a Semiarid Area. Scientifica 2021, 2021, 8810279. [Google Scholar] [CrossRef] [Scilit] [PubMed]
  59. Ferrant, S.; Selles, A.; Le Page, M.; Herrault, P.-A.; Pelletier, C.; Al-Bitar, A.; Mermoz, S.; Gascoin, S.; Bouvet, A.; Saqalli, M.; et al. Detection of Irrigated Crops from Sentinel-1 and Sentinel-2 Data to Estimate Seasonal Groundwater Use in South India. Remote. Sens. 2017, 9, 1119. [Google Scholar] [CrossRef] [Scilit]
  60. Sellaperumal, P.; Kaliaperumal, R.; Dhanaraju, M.; Sudarmanian, N.S.; Shanmugapriya, P.; Satheesh, S.; Manikandan, S.; Tamil Mounika, R.; Sivamurugan, A.P.; Marimuthu, R.; et al. Time Series Analysis of Sentinel 1 A SAR Data to Retrieve Annual Rice Area Maps and Long-Term Dynamics of Start of Season. Sci. Rep. 2025, 15, 8202. [Google Scholar] [CrossRef] [Scilit]
  61. d’Andrimont, R.; Verhegghen, A.; Lemoine, G.; Kempeneers, P.; Meroni, M.; van der Velde, M. From Parcel to Continental Scale—A First European Crop Type Map Based on Sentinel-1 and LUCAS Copernicus in-Situ Observations. Remote Sens. Environ. 2021, 266, 112708. [Google Scholar] [CrossRef] [Scilit]
  62. Rao, P.; Zhou, W.; Bhattarai, N.; Srivastava, A.K.; Singh, B.; Poonia, S.; Lobell, D.B.; Jain, M. Using Sentinel-1, Sentinel-2, and Planet Imagery to Map Crop Type of Smallholder Farms. Remote Sens. 2021, 13, 1870. [Google Scholar] [CrossRef] [Scilit]
  63. Löw, F.; Duveiller, G. Defining the Spatial Resolution Requirements for Crop Identification Using Optical Remote Sensing. Remote Sens. 2014, 6, 9034–9063. [Google Scholar] [CrossRef] [Scilit]
  64. Inglada, J.; Arias, M.; Tardy, B.; Hagolle, O.; Valero, S.; Morin, D.; Dedieu, G.; Sepulcre, G.; Bontemps, S.; Defourny, P.; et al. Assessment of an Operational System for Crop Type Map Production Using High Temporal and Spatial Resolution Satellite Optical Imagery. Remote Sens. 2015, 7, 12356–12379. [Google Scholar] [CrossRef] [Scilit]
  65. Estes, L.D.; Ye, S.; Song, L.; Luo, B.; Eastman, J.R.; Meng, Z.; Zhang, Q.; McRitchie, D.; Debats, S.R.; Muhando, J.; et al. High Resolution, Annual Maps of Field Boundaries for Smallholder-Dominated Croplands at National Scales. Front. Artif. Intell. 2022, 4, 744863. [Google Scholar] [CrossRef] [Scilit]
  66. Zhao, J.; Zhong, Y.; Hu, X.; Wei, L.; Zhang, L. A Robust Spectral-Spatial Approach to Identifying Heterogeneous Crops Using Remote Sensing Imagery with High Spectral and Spatial Resolutions. Remote Sens. Environ. 2020, 239, 111605. [Google Scholar] [CrossRef] [Scilit]
  67. Khan, W.; Minallah, N.; Sher, M.; Khan, M.A.; Rehman, A.U.; Al-Ansari, T.; Bermak, A. Advancing Crop Classification in Smallholder Agriculture: A Multifaceted Approach Combining Frequency-Domain Image Co-Registration, Transformer-Based Parcel Segmentation, and Bi-LSTM for Crop Classification. PLoS ONE 2024, 19, e0299350. [Google Scholar] [CrossRef] [Scilit]
  68. Schlund, M. Potential of Sentinel-1 Time-Series Data for Monitoring the Phenology of European Temperate Forests. ISPRS J. Photogramm. Remote Sens. 2025, 223, 131–145. [Google Scholar] [CrossRef] [Scilit]
  69. Löw, J.; Conrad, C.; Hill, S.; Thiel, M.; Ullmann, T.; Otte, I. A Novel Approach to Assessing the Tracking Accuracy of Crop Phenology for Multi-Orbit and Multi-Feature Sentinel-1 Time Series. Sci. Remote Sens. 2026, 13, 100370. [Google Scholar] [CrossRef] [Scilit]
  70. Dronova, I.; Taddeo, S. Remote Sensing of Phenology: Towards the Comprehensive Indicators of Plant Community Dynamics from Species to Regional Scales. J. Ecol. 2022, 110, 1460–1487. [Google Scholar] [CrossRef] [Scilit]
  71. Liu, C.; Chen, Z.; Shao, Y.; Chen, J.; Hasi, T.; Pan, H. Research Advances of SAR Remote Sensing for Agriculture Applications: A Review. J. Integr. Agric. 2019, 18, 506–525. [Google Scholar] [CrossRef] [Scilit]
  72. Shang, J.; Liu, J.; Chen, Z.; McNairn, H.; Davidson, A. Recent Advancement of Synthetic Aperture Radar (SAR) Systems and Their Applications to Crop Growth Monitoring. In Recent Remote Sensing Sensor Applications—Satellites and Unmanned Aerial Vehicles (UAVs); IntechOpen: London, UK, 2022. [Google Scholar] [CrossRef] [Scilit]
  73. Paek, S.W.; Balasubramanian, S.; Kim, S.; Weck, O. de Small-Satellite Synthetic Aperture Radar for Continuous Global Biospheric Monitoring: A Review. Remote Sens. 2020, 12, 2546. [Google Scholar] [CrossRef] [Scilit]
  74. Ignatenko, V.; Laurila, P.; Radius, A.; Lamentowski, L.; Antropov, O.; Muff, D. ICEYE Microsatellite SAR Constellation Status Update: Evaluation of First Commercial Imaging Modes; IEEE: New York, NY, USA, 2021. [Google Scholar]
  75. Kraatz, S.; Torbick, N.; Jiao, X.; Huang, X.; Robertson, L.D.; Davidson, A.; McNairn, H.; Cosh, M.H.; Siqueira, P. Comparison between Dense L-Band and C-Band Synthetic Aperture Radar (SAR) Time Series for Crop Area Mapping over a NISAR Calibration-Validation Site. Agronomy 2021, 11, 273. [Google Scholar] [CrossRef] [Scilit]
  76. Blickensdörfer, L.; Schwieder, M.; Pflugmacher, D.; Nendel, C.; Erasmi, S.; Hostert, P. Mapping of Crop Types and Crop Sequences with Combined Time Series of Sentinel-1, Sentinel-2 and Landsat 8 Data for Germany. Remote Sens. Environ. 2022, 269, 112831. [Google Scholar] [CrossRef] [Scilit]
  77. Orynbaikyzy, A.; Gessner, U.; Mack, B.; Conrad, C. Crop Type Classification Using Fusion of Sentinel-1 and Sentinel-2 Data: Assessing the Impact of Feature Selection, Optical Data Availability, and Parcel Sizes on the Accuracies. Remote Sens. 2020, 12, 2779. [Google Scholar] [CrossRef] [Scilit]
  78. El Imanni, H.S.; El Harti, A.; Hssaisoune, M.; Velastegui-Montoya, A.; Elbouzidi, A.; Addi, M.; El Iysaouy, L.; El Hachimi, J. Rapid and Automated Approach for Early Crop Mapping Using Sentinel-1 and Sentinel-2 on Google Earth Engine; A Case of a Highly Heterogeneous and Fragmented Agricultural Region. J. Imaging 2022, 8, 316. [Google Scholar] [CrossRef] [Scilit] [PubMed]
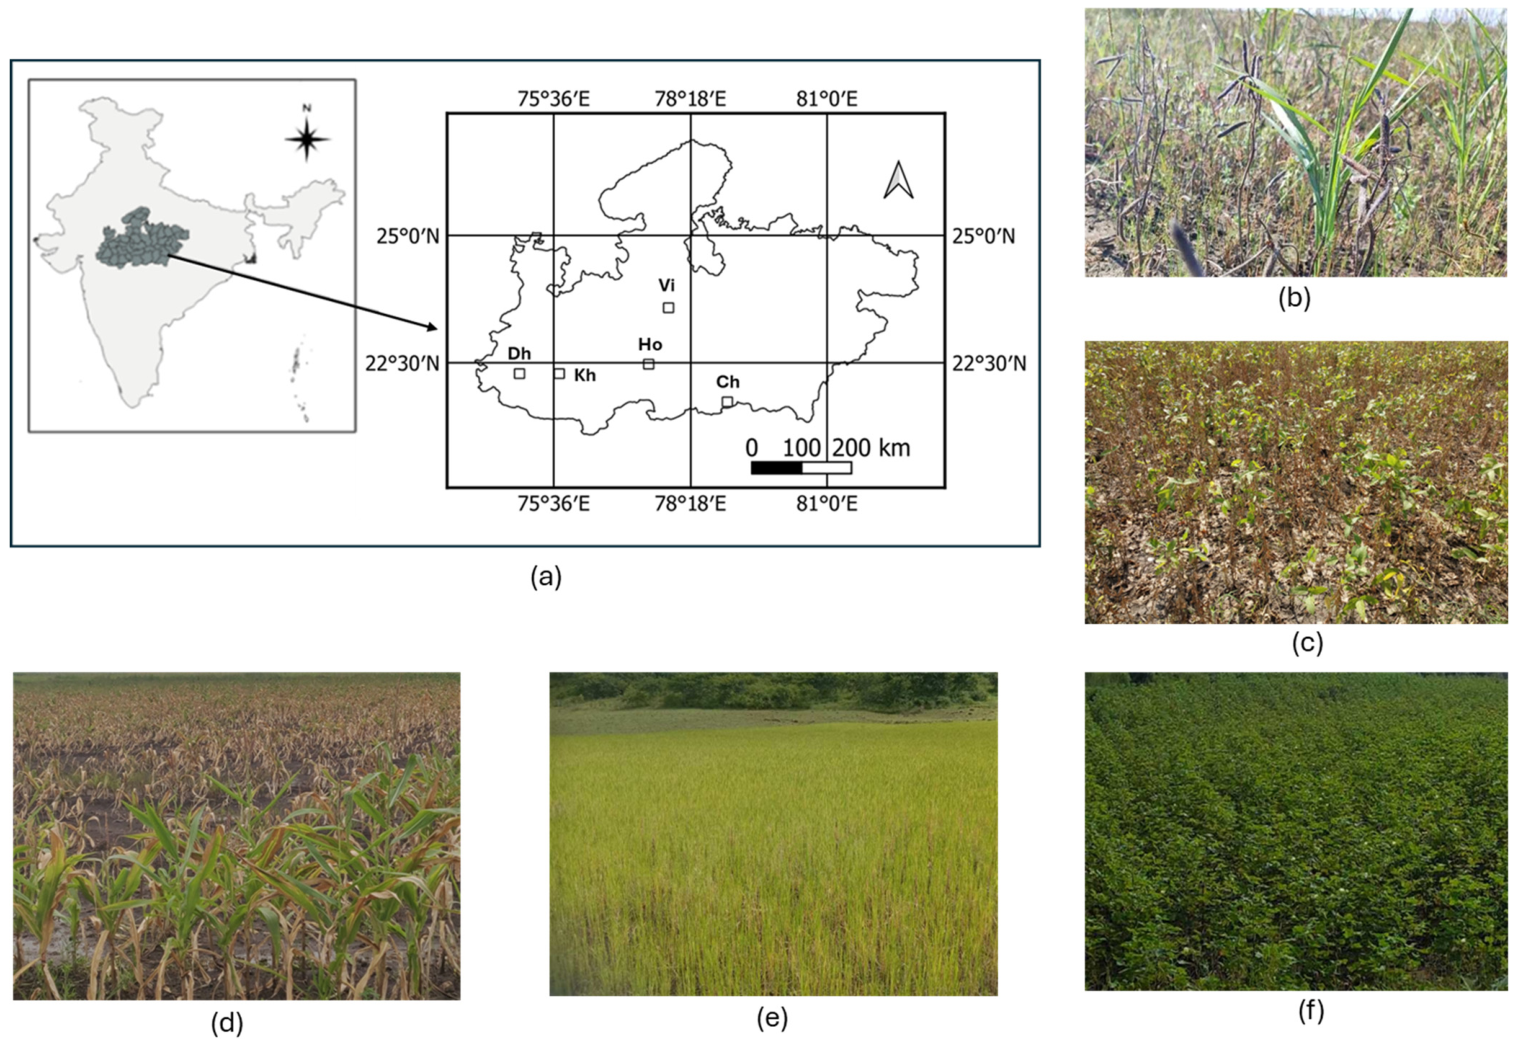
Figure 1. (a) Map showing the study area covering five districts across five agroclimatic zones in Madhya Pradesh, India. The districts are Vidisha (Vindhyan Plateau), Hoshangabad (Central Narmada Valley), Chhindwara (Satpura Plateau), Dhar (Malwa Plateau), and Khargone (Nimar Valley), each labeled with their first two letters. Field photographs during the first week of October: (b) Urad, (c) Soybean, (d) Maize, (e) Paddy, (f) Cotton.
Remotesensing 18 01238 g001
Figure 2. An example of the fields used in this study marked in red, overlaid on a Google Earth image (left) and a SAR RGB composite (right) created using VH backscatter for 29 July 2021 (Red), 22 August 2021 (Green), and 27 September 2021 (Blue).
Remotesensing 18 01238 g002
Figure 3. Crop calendar for five different crops (Soybean, Paddy, Urad, Maize, Cotton) across five districts in Madhya Pradesh: Vidisha, Hoshangabad, Dhar, Khargone, and Chhindwara. The colored bars represent different crop growth stages from nursery/sowing through maturity/picking for each crop. Rainfall (blue bars) and daily temperature trends (black line with grey shaded region covering minimum–maximum temperatures) for 2021 are shown for each district throughout the year.
Remotesensing 18 01238 g003
Figure 4. Illustration of SAR phenological metrics extracted from a smoothed VH backscatter time series. Key phenological points are marked, including peak season maximum value (PSMV), sowing period minimum value (SMV), harvest period minimum value (HMV), and threshold crossings at 25%, 50%, and 75% levels during sowing phase (SP) and harvest phase (HP). The shaded area represents the area under the curve (AUC) between threshold levels.
Remotesensing 18 01238 g004
Figure 5. Temporal profiles of Sentinel-1 SAR backscatter time series for a representative soybean field in Hoshangabad district, India, during the 2021 monsoon season. The solid lines represent VH and VV backscatter (in dB) and VH/VV ratio (in dB) obtained using Savitzky–Golay filtering with daily interpolation, while the dots represent the raw backscatter and ratio values at actual SAR acquisition dates in corresponding colors. Colored background vertical bars indicate major phenological stages derived from district-level crop calendars: sowing/germination (coral), vegetative growth (green), flowering (gold), pod development (orange), and maturity (brown).
Remotesensing 18 01238 g005
Figure 6. Sentinel-1 SAR backscatter time series for a representative rice field in Hoshangabad district during the 2021 monsoon season. The solid lines represent VH and VV backscatter (in dB) and VH/VV ratio (in dB) obtained using Savitzky–Golay filtering with daily interpolation, while the dots represent the raw backscatter and ratio values at actual SAR acquisition dates in corresponding colors. Colored vertical bands indicate crop growth stages based on district-reported calendar: nursery (light-coral), transplanting (light-blue), vegetative growth (light-green), flowering (gold), grain formation (orange), and maturity (brown).
Remotesensing 18 01238 g006
Figure 7. Temporal profiles of C-band SAR backscatter time series for a representative urad (black gram) field in Vidisha district during the 2021 Kharif season. The solid lines represent VH and VV backscatter (in dB) and VH/VV ratio (in dB) obtained using Savitzky–Golay filtering with daily interpolation, while the dots represent the raw backscatter and ratio values at actual SAR acquisition dates in corresponding colors. Colored background vertical bands represent key phenological stages sowing/germination (coral), vegetative growth (green), flowering (gold), pod development (orange), and maturity (brown).
Remotesensing 18 01238 g007
Figure 8. Temporal profiles of C-band SAR backscatter time series for maize cultivation in Hoshangabad district during the 2021 Kharif season. The solid lines represent VH and VV backscatter (in dB) and VH/VV ratio (in dB) obtained using Savitzky–Golay filtering with daily interpolation, while the dots represent the raw backscatter and ratio values at actual SAR acquisition dates in corresponding colors. Colored vertical bands indicate phenological stages: sowing/germination (coral), vegetative growth (green), silking/tasseling (gold), cob development (orange), and maturity (brown).
Remotesensing 18 01238 g008
Figure 9. Temporal profiles of C-band SAR backscatter time series for cotton cultivation in Khargone district during the 2021 growing season. The solid lines represent VH and VV backscatter (in dB) and VH/VV ratio (in dB) obtained using Savitzky–Golay filtering with daily interpolation, while the dots represent the raw backscatter and ratio values at actual SAR acquisition dates in corresponding colors. Colored bands indicate phenological stages: sowing/germination (coral), vegetative growth (green), flowering (gold), boll formation (orange), and picking/maturity (brown).
Remotesensing 18 01238 g009
Figure 10. Range of the local minima values observed near the sowing and harvesting stages (SMV: sowing minima value—Blue, HMV: harvest minima value—Red) and local maxima values (PSMV: peak season maxima value—Green) across three SAR indices (VH, VV, VH/VV) for five major monsoon crops (soybean, rice, urad, maize, cotton) in five different districts. District names are represented by their initial two letters: Ho (Hoshangabad), Vi (Vidisha), Dh (Dhar), Ch (Chhindwara), and Kh (Khargone). The y-axis represents the metric values in dB, and the x-axis denotes the crop and district combinations.
Remotesensing 18 01238 g010
Figure 11. DOY of observed local minima near the sowing and harvesting stages (SMD: sowing minima DOY—Blue, HMD: harvest minima DOY—Red) and local maxima’s (PSMD: peak season maxima DOY—Green) across three SAR indices (VH, VV, VH/VV) for multiple crops (soybean, rice, urad, maize, cotton) across different districts. District names are represented by their initial two letters: Ho (Hoshangabad), Vi (Vidisha), Dh (Dhar), Ch (Chhindwara), and Kh (Khargone). Shaded regions represent the distribution of DOY around the mean: distribution of observed local minima DOY near sowing (blue), distribution of observed local maxima DOY (green), and spread of local minima nearest to harvest date (red). The y-axis represents the day of the year (DOY), and the x-axis denotes the crop and district combinations.
Remotesensing 18 01238 g011
Figure 12. ANOVA F-statistics heatmap (top left), Kernel Density Estimation (KDE) plots (top right), and feature space scatter plots (bottom) for SAR-based threshold-crossing metrics across five crop types. Metrics are shown for different thresholds (25%, 50%, and 75% of peak, on both sowing and harvesting sides) for different polarization bands and ratios (VH, VV, VHbyVV). Feature space plots display bivariate relationships between corresponding metrics with separability scores quantifying two-dimensional class separation.
Remotesensing 18 01238 g012
Figure 13. Violin plots showing crop-wise distribution of duration metrics (D25, D50, D75) for each crop across all three SAR feature types (VH, VV, VH/VV). Duration is measured as the number of days between growth and senescence thresholds (25%, 50%, 75%) for each feature type.
Remotesensing 18 01238 g013
Figure 14. F-statistics heatmap (top left), Kernel Density Estimation (KDE) plots (top right), and feature space scatter plots (bottom) for duration metrics (D25, D50, D75) across five crop types. Metrics are shown for three polarization combinations (VH, VV, VHbyVV), with durations computed as days between SAR-based threshold crossings. Feature space plots display VH versus VV relationships for each duration metric with corresponding separability scores.
Remotesensing 18 01238 g014
Figure 15. F-statistics heatmap (left) and KDE plots (right) for curve shape descriptors across five crop types. Metrics include slope during growth, slope during decline, symmetry index, and peak prominence across VH, VV, and VH/VV bands.
Remotesensing 18 01238 g015
Figure 16. Temporal backscatter profiles of selected crop fields in 2021. (left) VV backscatter profiles for Cotton, Soybean, and Maize illustrating seasonal peak dynamics. (right) VH backscatter profiles for Maize, Rice, Soybean, and Urad.
Remotesensing 18 01238 g016
Figure 17. ANOVA F-statistics heatmap (left) and KDE plots (right) for area-under-the-curve (AUC) metrics across three SAR bands (VH, VV, VH/VV) and five crop types. AUC25 and AUC50 metrics are shown, representing cumulative signal energy over broad and mid-season growth periods, respectively.
Remotesensing 18 01238 g017
Figure 18. Comparison of F1-score, User Accuracy (Precision), and Producer Accuracy (Recall) between binary and multiclass classification for five crop types using SAR phenological metrics.
Remotesensing 18 01238 g018
Figure 19. Confusion matrices for multiclass and binary crop classification using SAR phenological metrics. The multiclass confusion matrix (top) shows classification results across all five crops, while binary confusion matrices (bottom) show individual crop detection performance (crop vs. others).
Remotesensing 18 01238 g019
Figure 20. Cross-district binary classification accuracy matrices for Maize, Soy, Cotton, and Rice. Each matrix shows the performance of models trained on one district and tested on another to evaluate transferability across agro-climatic zones.
Remotesensing 18 01238 g020
Disclaimer/Publisher’s Note: The statements, opinions and data contained in all publications are solely those of the individual author(s) and contributor(s) and not of MDPI and/or the editor(s). MDPI and/or the editor(s) disclaim responsibility for any injury to people or property resulting from any ideas, methods, instructions or products referred to in the content.