Next Article in Journal
Integrating InSAR and Channel Steepness for AI-Based Coseismic Landslide Modeling in the Nepal Himalaya
Next Article in Special Issue
UGDMoE: An Uncertainty-Guided Mixture-of-Experts Decoder for Open-Vocabulary Remote Sensing Segmentation
Previous Article in Journal
Physics-Prior-Guided Feature Pyramid Network for Unified Multi-Angle Spectral–Polarimetric Cloud Detection
Previous Article in Special Issue
Spatiotemporal Prediction of Wind Fields in Coastal Urban Environments Using Multi-Source Satellite Data: A GeoAI Approach
 
 
remotesensing-logo
Article Menu
Article

Morphological and Entropy Analysis of Urban Change in Six European Metropolitan Areas Based on Copernicus Land Monitoring Service Products


by
Ines Marinosci
1,*,
Angela Cimini
1,
Luca Congedo
1,
Benedetta Cucca
2,
Paolo De Fioravante
1,
Pasquale Dichicco
1,
Annalisa Minelli
1,
Michele Munafò
1,
Nicola Riitano
1,
Michał Krupiński
3,
Stanisław Lewiński
3,
Szymon Sala
3,
Kamil Drejer
3,
Krzysztof Gryguc
3,
Marek Ruciński
3,
Agris Brauns
4,
Dainis Jakovels
4,
Zlatomir Dimitrov
5,
Lachezar Filchev
5,
Mariana Zaharinova
5,
Daniela Avetisyan
5,
Kamelia Radeva
5,
Georgi Jelev
5,
Lyubomir Filipov
6,
Juan Manuel López Torralbo
7,
Ana Silió Calzada
7,
Jose M. Álvarez-Martínez
8,9,
David López Trullén
10,
Hugo Costa
11,12,
Pedro Benevides
11 and
Mário Caetano
11,12
add Show full author list remove Hide full author list
1
Italian Institute for Environmental Protection and Research (ISPRA), Via Vitaliano Brancati, 48, 00144 Rome, Italy
2
Agenzia Regionale per lo Sviluppo e l’Innovazione dell’Agricoltura nel Lazio (ARSIAL), Via Rodolfo Lanciani, 38, 00162 Rome, Italy
3
Centrum Badań Kosmicznych Polskiej Akademii Nauk (CBK PAN), ul. Bartycka 18a, 00-716 Warsaw, Poland
4
Institute for Environmental Solutions (IES), Izstades Street 2, Priekuli, LV-4126 Cesis County, Latvia
5
Space Research and Technology Institute, Bulgarian Academy of Sciences (SRTI-BAS), Str. “Acad. Georgy Bonchev” bl. 1, 1113 Sofia, Bulgaria
6
Geo Application Planning and Consulting (GAP Consult Ltd.), 1000 Sofia, Bulgaria
7
Environmental Hydraulics Institute (IHCantabria), C. Isabel Torres, 15, 39011 Santander, Cantabria, Spain
8
Biodiversity Research Institute (IMIB), University of Oviedo–CSIC–Principality of Asturias, 33600 Mieres, Asturias, Spain
9
Department of Organismal and Systems Biology, University of Oviedo, 33071 Oviedo, Asturias, Spain
10
ITD Medioambiente S.L., 39011 Santander, Cantabria, Spain
11
Direção-Geral do Território, Rua Artilharia 1, 107, 1099-052 Lisbon, Portugal
12
NOVA Information Management School (NOVA IMS), University NOVA of Lisbon, 1070-312 Lisbon, Portugal
*
Author to whom correspondence should be addressed.
Remote Sens. 2026, 18(8), 1149; https://doi.org/10.3390/rs18081149
Submission received: 4 March 2026 / Revised: 3 April 2026 / Accepted: 7 April 2026 / Published: 12 April 2026
(This article belongs to the Special Issue Remote Sensing Applied in Urban Environment Monitoring)

Highlights

What are the main findings?
  • Integrating Copernicus Imperviousness Change data, Urban Atlas, MSPA, and entropy metrics provides a robust, reproducible framework to quantify urban structural change, distinguishing compaction, fragmentation, and internal reorganization across six European metropolitan regions.
  • The analysis reveals contrasting results among cities: pronounced fragmentation and spatial disorder in Sofia, clear compaction in Milan, Warsaw, Riga, and Santander, and localized densification without major expansion in Viseu.
What are the implications of the main findings?
  • The methodology enables operational, comparable monitoring of urban morphology using only open Copernicus data and tools, supporting planners and researchers in tracking land take, connectivity loss, and forms of urban growth.
  • These indicators directly inform EU policy targets—including Zero Net Land Take 2050 and the EU Soil Strategy—by offering scalable evidence for sustainable spatial planning and urban resilience strategies.

Abstract

Urban areas across Europe are undergoing rapid morphological transformations driven by densification, redevelopment, and infrastructure expansion. Monitoring these urban changes requires operational, harmonized, and reproducible approaches grounded in Earth Observation. This study presents a Copernicus use case demonstrating how the High-Resolution Layer Imperviousness Change (2015–2018) and Urban Atlas datasets can be integrated with the Guidos Toolbox (GTB) to quantify structural urban change across six metropolitan areas (Milan, Sofia, Riga, Warsaw, Viseu, Santander). Morphological Spatial Pattern Analysis (MSPA) and entropy-based indicators were applied to characterize land take, fragmentation, compaction, and internal reorganization of impervious surfaces. The combined framework captured both configurational morphology and spatial disorder, revealing divergent development patterns: pronounced heterogeneity and fragmentation in Sofia, stabilization or compact growth in Milan, Warsaw, and Santander, controlled densification in Riga, and localized intensification without outward expansion in Viseu. All analyses rely on openly accessible Copernicus data and open-source tools, ensuring full reproducibility and transferability. Outputs were disseminated through a FAIR-compliant geoportal developed within a Copernicus FPCUP project, supporting transparency and reuse. The findings underscore the value of Copernicus services for operational urban monitoring and provide a scalable methodology to support European land-use policies, including the Zero Net Land Take 2050 target and the EU Soil Strategy.

1. Introduction

Landscape ecology is defined as the study of the pattern and interaction between ecosystems within a specific region, and how these interactions affect ecological processes, particularly recognizing the unique effects of spatial heterogeneity, and is described as a relatively young ecological discipline that emerged in the 1980s [1]. It provides a spatially explicit framework for understanding the structure, function, and changes of heterogeneous environments, emphasizing the ecological implications of spatial pattern across scales [2]. Landscape Metrics are measures describing the characteristics of a landscape, in particular the structure, function, and changes of patches in the space, and their interpretation depends on the scale of data and the boundaries of the landscape [3]; therefore, it is crucial to define the framework of the analysis to understand the results of the metrics.
Early ecological models often treated ecosystems as homogeneous equilibrium systems; advances in computation, remote sensing, GIS, and spatial statistics enabled explicit treatment of spatial heterogeneity and non-equilibrium situations, catalyzing the emergence of landscape ecology as a distinct field.
Landscape metrics subsequently became central tools for quantifying composition and configuration, supporting assessments of fragmentation, connectivity, and structural complexity in both natural and urban systems. Their interpretation, however, is scale-dependent and sensitive to spatial delineation, underscoring the importance of harmonized, high-resolution geospatial datasets [4].
The Copernicus Land Monitoring Service (CLMS) provides harmonized, pan-European land-cover and land-use products suitable for multi-scale characterization of urban changes. The regular update cycle and methodological consistency of High-Resolution Layers (HRLs) and Urban Atlas support both compositional and configurational analyses. Within this context, we present an applied Copernicus use case tailored for local administrations that integrates HRL Imperviousness Change (2015–2018) and Urban Atlas with GTB’s MSPA and entropy modules to monitor urban landscape changes in six metropolitan areas. The approach operationalizes landscape-ecological indicators with free, repeatable Earth Observation data and supports European spatial planning objectives related to land-take reduction, ecological connectivity, climate adaptation, and urban resilience.
The six metropolitan areas were intentionally selected to represent a wide spectrum of European urban conditions, including large and consolidated regions, rapidly transforming post-socialist contexts, and medium-small cities with lower degrees of imperviousness. This diversity is consistent with the purpose of the study, which aims to demonstrate the applicability of a harmonized Copernicus-based workflow across contrasting geographical, demographic, and morphological settings. Rather than seeking to normalize cities by population or size, the analysis focuses on structural indicators derived from MSPA and entropy, which are inherently scale-independent and therefore suitable for cross-city comparison. The comparison is not meant to establish a unified development model but to offer an informative interpretation of how different urban systems express compaction, fragmentation, and internal reorganization under a common, reproducible analytical framework.

2. Materials and Methods

2.1. Overview of the Analytical Framework

The methodological workflow integrates Earth Observation data from the Copernicus Land Monitoring Service (CLMS) with spatial analytical tools implemented in the Guidos Toolbox (GTB) to assess changes in urban landscape structure between 2015 and 2018. The approach relies on two complementary components: (1) Morphological Spatial Pattern Analysis (MSPA), based on mathematical morphology, to quantify the spatial configuration of impervious surfaces; and (2) entropy-based metrics to describe spatial heterogeneity and fragmentation processes.
GTB provides a neutral, scalable environment for processing categorical raster data [2] and supports reproducible assessments of fragmentation, connectivity, and morphological transformations across diverse landscape contexts. MSPA has gained wide application in ecological network evaluation, conservation planning, and urban morphology studies. Its ability to identify structural components such as cores, edges, bridges, and islets makes it suited to characterizing the configuration of impervious surfaces in rapidly urbanizing regions.
Entropy metrics complement MSPA by quantifying spatial disorder and providing a measure of how landscape elements diverge from compact or homogeneous patterns. They have been applied in urban sprawl monitoring, green space assessment, and spatial complexity analysis, offering insight into whether transitions occur through compact growth or fragmented, dispersed development.

2.2. CLMS Imperviousness Data and Preprocessing

The analysis of urban landscape was conducted using the Imperviousness Density Change 2015–2018 dataset (https://land.copernicus.eu/en/technical-library/hrl-imperviousness-2018-user-manual/@@download/file) (accessed 8 April 2026) [4], a 20 m resolution grid covering 39 EEA countries and reporting impervious surface change from −100% to +100%. To obtain binary imperviousness layers suitable for MSPA processing, the Imperviousness Density Change 2015–2018 dataset was reclassified following the semantics of the original CLMS product. Since the change layer encodes imperviousness variation using values from −100 to +100, pixels were grouped according to the direction of change: values 0–99 were assigned to re-naturalized or decreasing-imperviousness areas, the value 100 represented unchanged pixels, and values 101–200 indicated increases in imperviousness. This procedure does not reconstruct absolute imperviousness values—something the change product does not provide—but generates two coherent binary layers aligned to the original 20 m CLMS grid. This reclassification represents the standard, reproducible approach required to convert the change dataset into MSPA-compatible inputs while avoiding inconsistencies that would arise from directly mixing the 2015 (20 m) and 2018 (10 m) imperviousness status layers.
Both rasters were clipped to the study area, converted to binary impervious/non-impervious maps, and transformed to byte format for subsequent processing in the MSPA module of the Guidos Toolbox (GTB 3.3), ensuring exact spatial alignment with the original CLMS grid.
Notably, the 2018 HRL Imperviousness product uses 10 m resolution Sentinel-2 data, while the 2015 product is at 20 m; direct comparison of the two status layers would have introduced resolution-based artefacts. Therefore, only the harmonized Change layer was used for all analyses even if potential artefacts, especially affecting fragmentation and edge effects, could persist and should be considered while reading these results.

2.3. Morphological Spatial Pattern Analysis (MSPA)

The first analytical stage used Morphological Spatial Pattern Analysis (MSPA), configured with eight-pixel foreground connectivity (FGConn = 8) and an edge width of five pixels. The Transition and Intext parameters were disabled to preserve closed perimeters and treat the background as a single category, respectively (Table 1). At 20 m resolution, an edge width of five pixels corresponds to a 100 m buffer. This width is widely used in MSPA applications on anthropogenic and urban landscapes because it captures meaningful edge effects while avoiding excessive sensitivity to small artefacts. Likewise, we selected eight-cell connectivity because urban impervious structures frequently include diagonal and elongated forms—such as roads, linear built-up strips, and diagonally aligned parcels—that would be artificially fragmented under 4-neighbor rules. This setting is also consistent with standard MSPA practice for analyzing human-modified landscapes, as recommended in the Guidos Toolbox literature.
The goal of this study was not to optimize MSPA for each city individually but to apply a harmonized, reproducible configuration that remains robust across diverse urban forms—an essential requirement for cross-city Copernicus-based monitoring.
MSPA produces (i) a raster assigning each pixel to a morphological class—Core, Edge, Bridge, Islet, and Urban Voids, and (ii) summary indices quantifying spatial structure, allowing for comparison of cities, regions, or years without relying solely on maps (Table 2). In this study, Urban Voids were interpreted as unsealed or semi-natural patches embedded within Core urban fabric. Among the indices, Edge Density (ED) indicates fragmentation intensity, while Pcore expresses the proportion of interior habitat free from edge effects.
The distribution of morphological classes and the derived indices was computed based on a pixel-derived surface area and summarized via descriptive statistics.

2.4. Entropy-Based Spatial Analysis

Entropy analysis was conducted using GTB that quantifies spatial disorder in raster data as an indicator of fragmentation. Instead of counting changed pixels, it evaluates how differences among neighboring cells are spatially distributed, distinguishing concentrated from scattered or heterogeneous change. Using a Shannon-based metric computed per tile with eight-cell connectivity, entropy reaches low values in compact, homogeneous areas and high values in highly fragmented patterns such as checkerboards. Binary imperviousness maps for 2015 and 2018 were used as inputs, applying 8-neighbor adjacency rules.
Entropy values were computed for all pixels and reflect the spatial dispersion of neighboring classes: low entropy indicates compact, internally coherent structures; high entropy indicates scattered, heterogeneous patterns characteristic of fragmented expansion.
Entropy change was computed by subtracting the 2015 entropy surface from the 2018 surface, yielding three categories: positive values (increased fragmentation), negative values (increased compaction), and zero (no structural change). To interpret entropy changes in functional terms, entropy differences were spatially intersected with Urban Atlas 2018 land-use classes, enabling quantification of compaction or fragmentation rates within specific classes and identification of hotspots of structural transformation.

2.5. Study Areas

To study the urban and metropolitan landscape, six diverse NUTS-2 level European metropolitan areas from six different EU Sate Members have been chosen. These cities were chosen for their representation of EU spatial diversity: climate zones (oceanic to continental), development stages (mature Milan/Warsaw vs. emerging Sofia/Viseu), and urbanization pressures (sprawl in Sofia/Riga, compaction in Warsaw). Moreover, they vary in the context of size and population density. Figure 1 presents their geographical location.
Table 3 contains the main characteristics of the selected study areas. To facilitate further results descriptions, each area will be described by dedicated abbreviations, e.g., RMA will stand for Riga Metropolitan Area.

2.6. Copernicus Land Monitoring Service Data Used in the Study

By leveraging Copernicus Land Monitoring Service (CLMS) datasets, this study operationalizes a comparative analysis of urban landscape metrics, highlighting the divergent environmental results observed between the 2015 and 2018 assessment periods.
CLMS provides standardized, spatially consistent datasets that support multi-scale landscape characterization and spatial planning. The analysis employed two inputs: the High-Resolution Layer (HRL) Imperviousness and Urban Atlas.
The HRL Imperviousness suite offers pan-European information on sealed surfaces for applications in urban planning, environmental monitoring, infrastructure assessment, and climate adaptation (https://land.copernicus.eu/en/products/high-resolution-layer-imperviousness?tab=overview) (accessed 8 April 2026). It includes reference/calibration layers, primary imperviousness maps (per-pixel values 0–100%), and derived change products (https://land.copernicus.eu/en/technical-library/hrl-imperviousness-technical-document-prod-2015/@@download/file) (accessed 8 April 2026). HRL Imperviousness is generated from multi-temporal Sentinel-2 imagery, complemented by NDVI metrics and Sentinel-1 backscatter, processed through supervised classification and manual refinement (https://land.copernicus.eu/en/technical-library/hrl-imperviousness-2018-user-manual/@@download/file) (accessed 8 April 2026).
Because the 2018 product uses higher-resolution data (10 m instead of 20 m in 2015), it captures finer sealed structures that were not detectable previously, making the two status layers unsuitable for direct comparison. Therefore, only the Imperviousness Change 2015–2018 dataset was used. This derived product provides imperviousness variation at 20 m and 100 m resolution, generated from Sentinel-2, Landsat, SPOT, and IRS-P6/Resourcesat-2 imagery. Change values range from 0 to 99 for decreases and 101–200 for increases, enabling detailed assessments of land sealing processes.
The second dataset is the Urban Atlas Land Cover/Land Use 2018 [5], which supplies harmonized high-resolution LU/LC information for European Functional Urban Areas. Developed within the Copernicus Land Monitoring Service, it integrates Very-High-Resolution imagery and ancillary data to produce detailed urban LC/LU layers. Since its launch in 2006, coverage has expanded substantially: the first version mapped over 300 cities (>100,000 inhabitants), while later editions (2012, 2018) extended to ~800 cities by lowering the threshold to 50,000 inhabitants (https://www.eea.europa.eu/data-and-maps/data/copernicus-land-monitoring-service-urban-atlas, https://due.esrin.esa.int/muas2015/files/presentation40.pdf, https://land.copernicus.eu/en/products/urban-atlas/urban-atlas-2012, https://www.copernicus.eu/en/access-data/copernicus-services-catalogue/urban-atlas-land-coverland-use-change-2012-2018-vector) (accessed 8 April 2026).
Together, the HRL Imperviousness Change layer and Urban Atlas provide a consistent basis for quantifying patterns of sealing, fragmentation, and urban development between 2015 and 2018.

3. Results

3.1. MSPA-Derived Urban Morphological Patterns

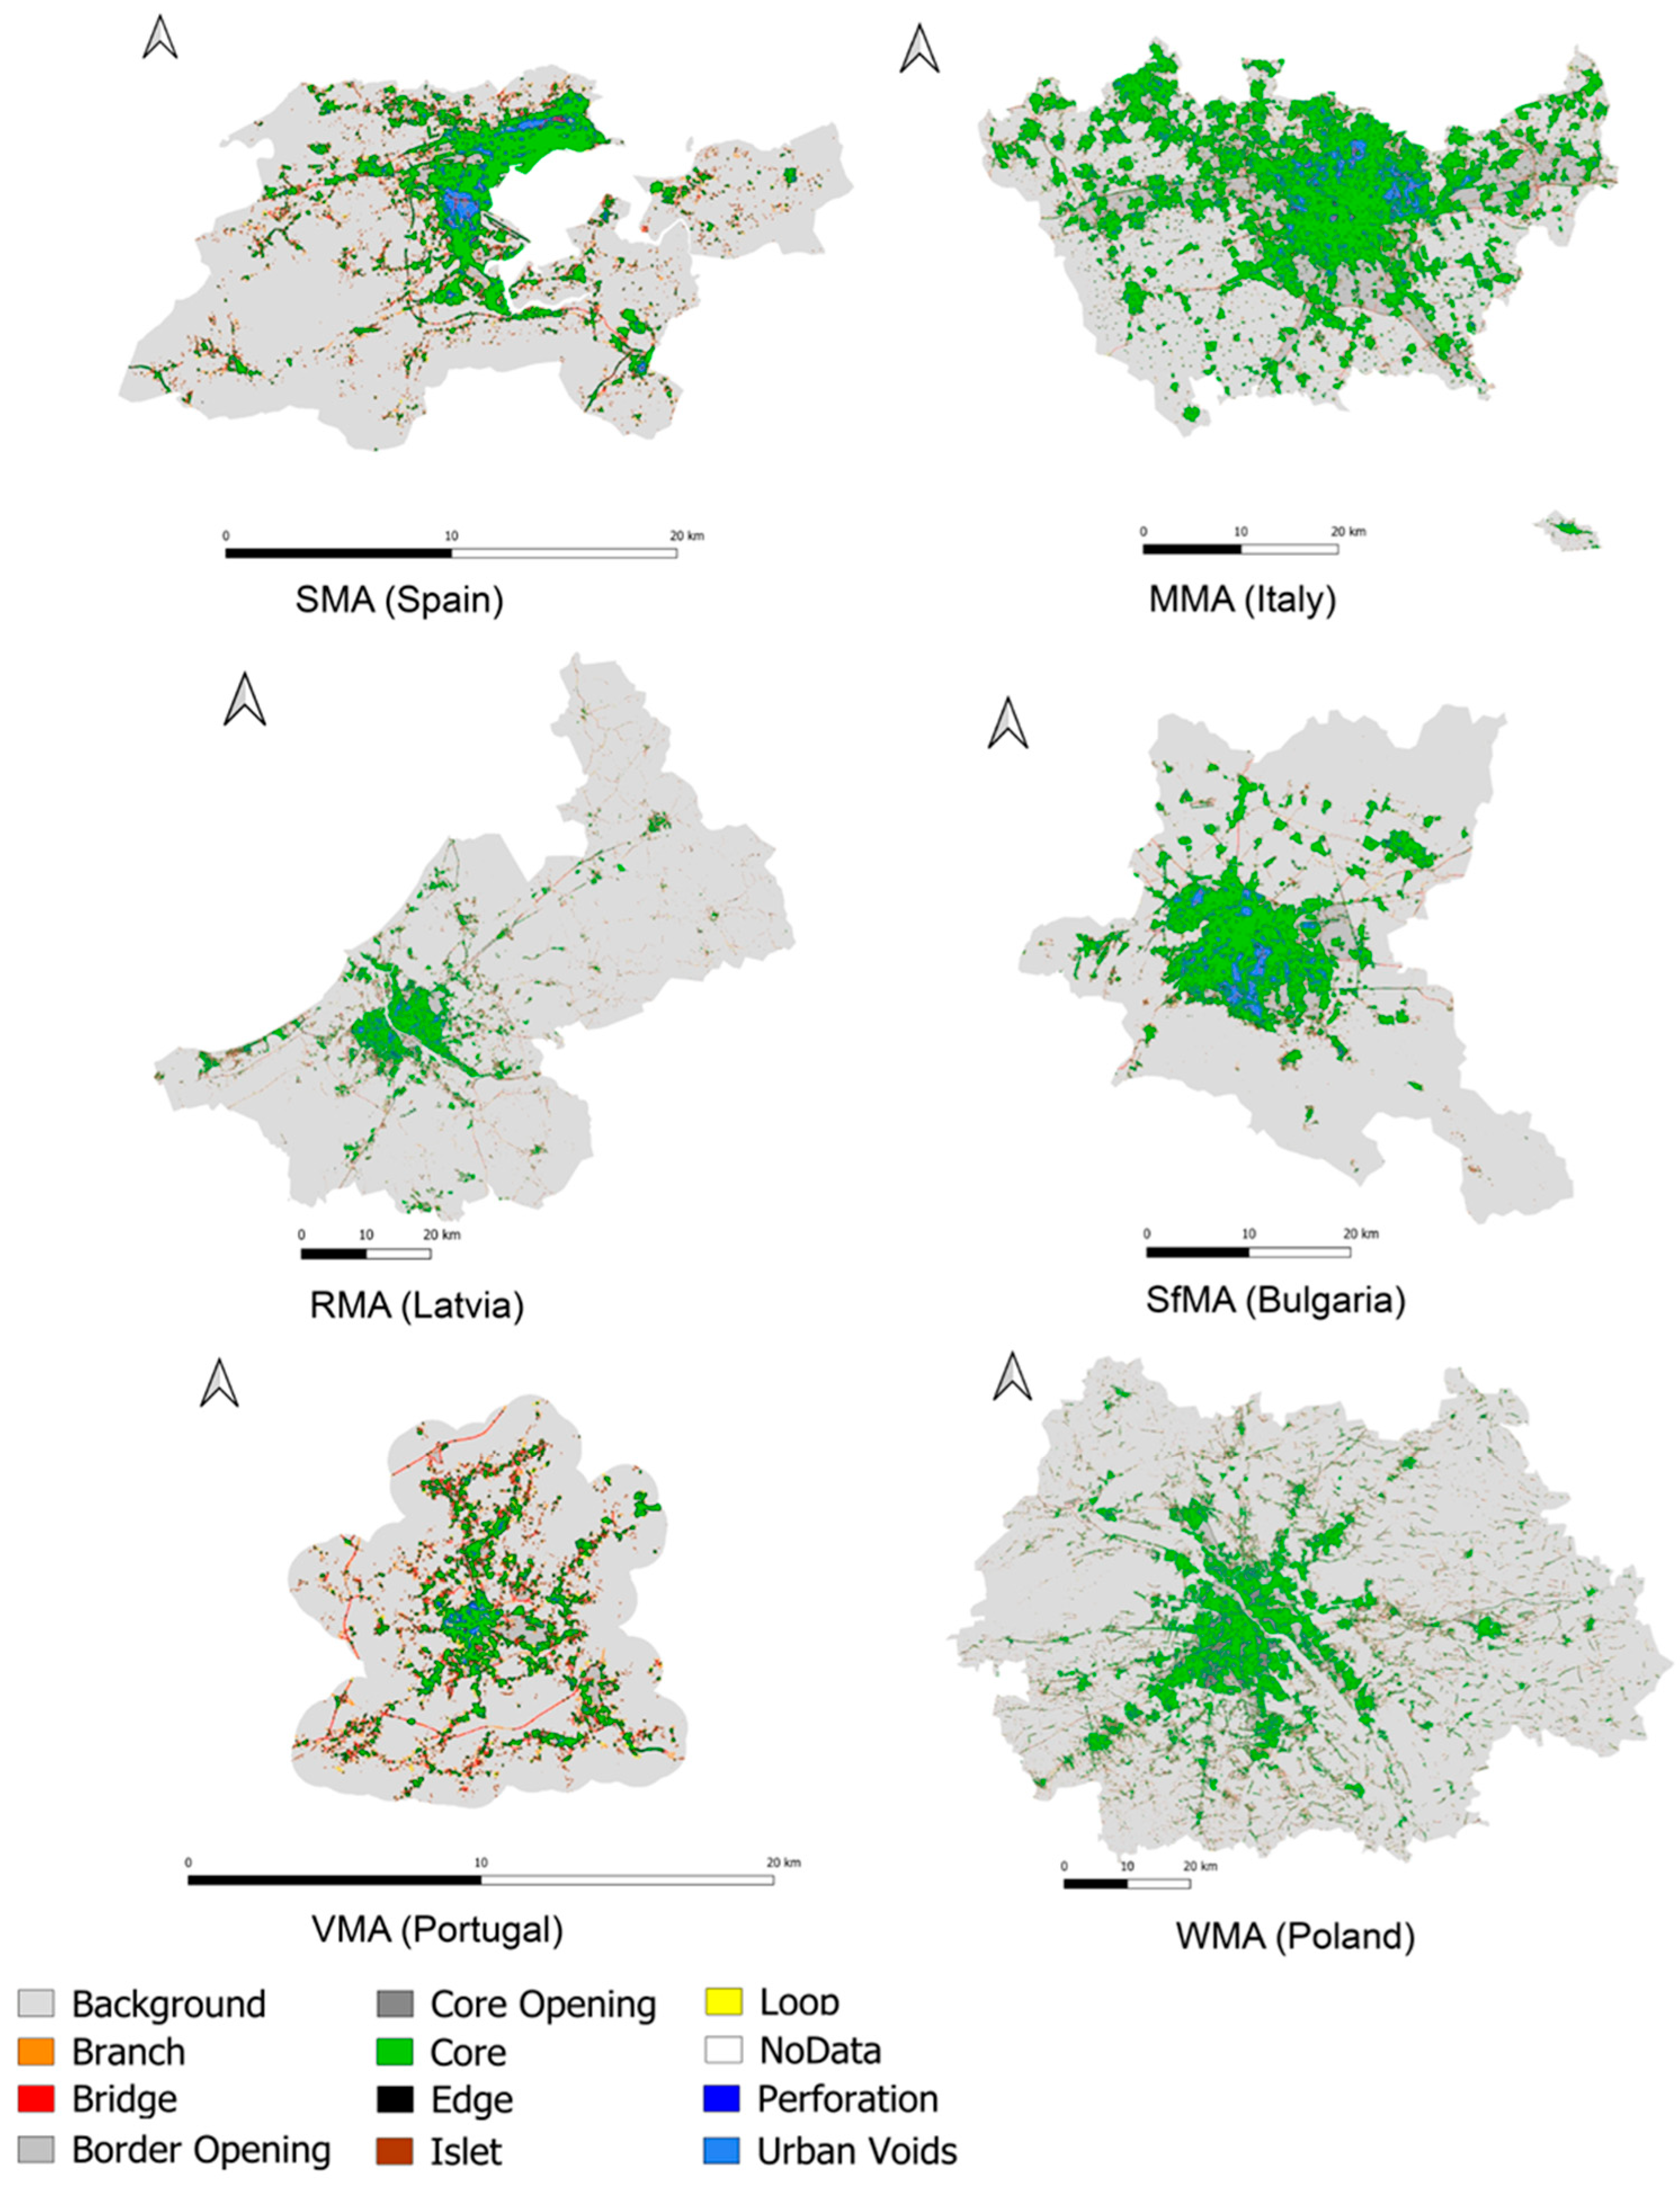
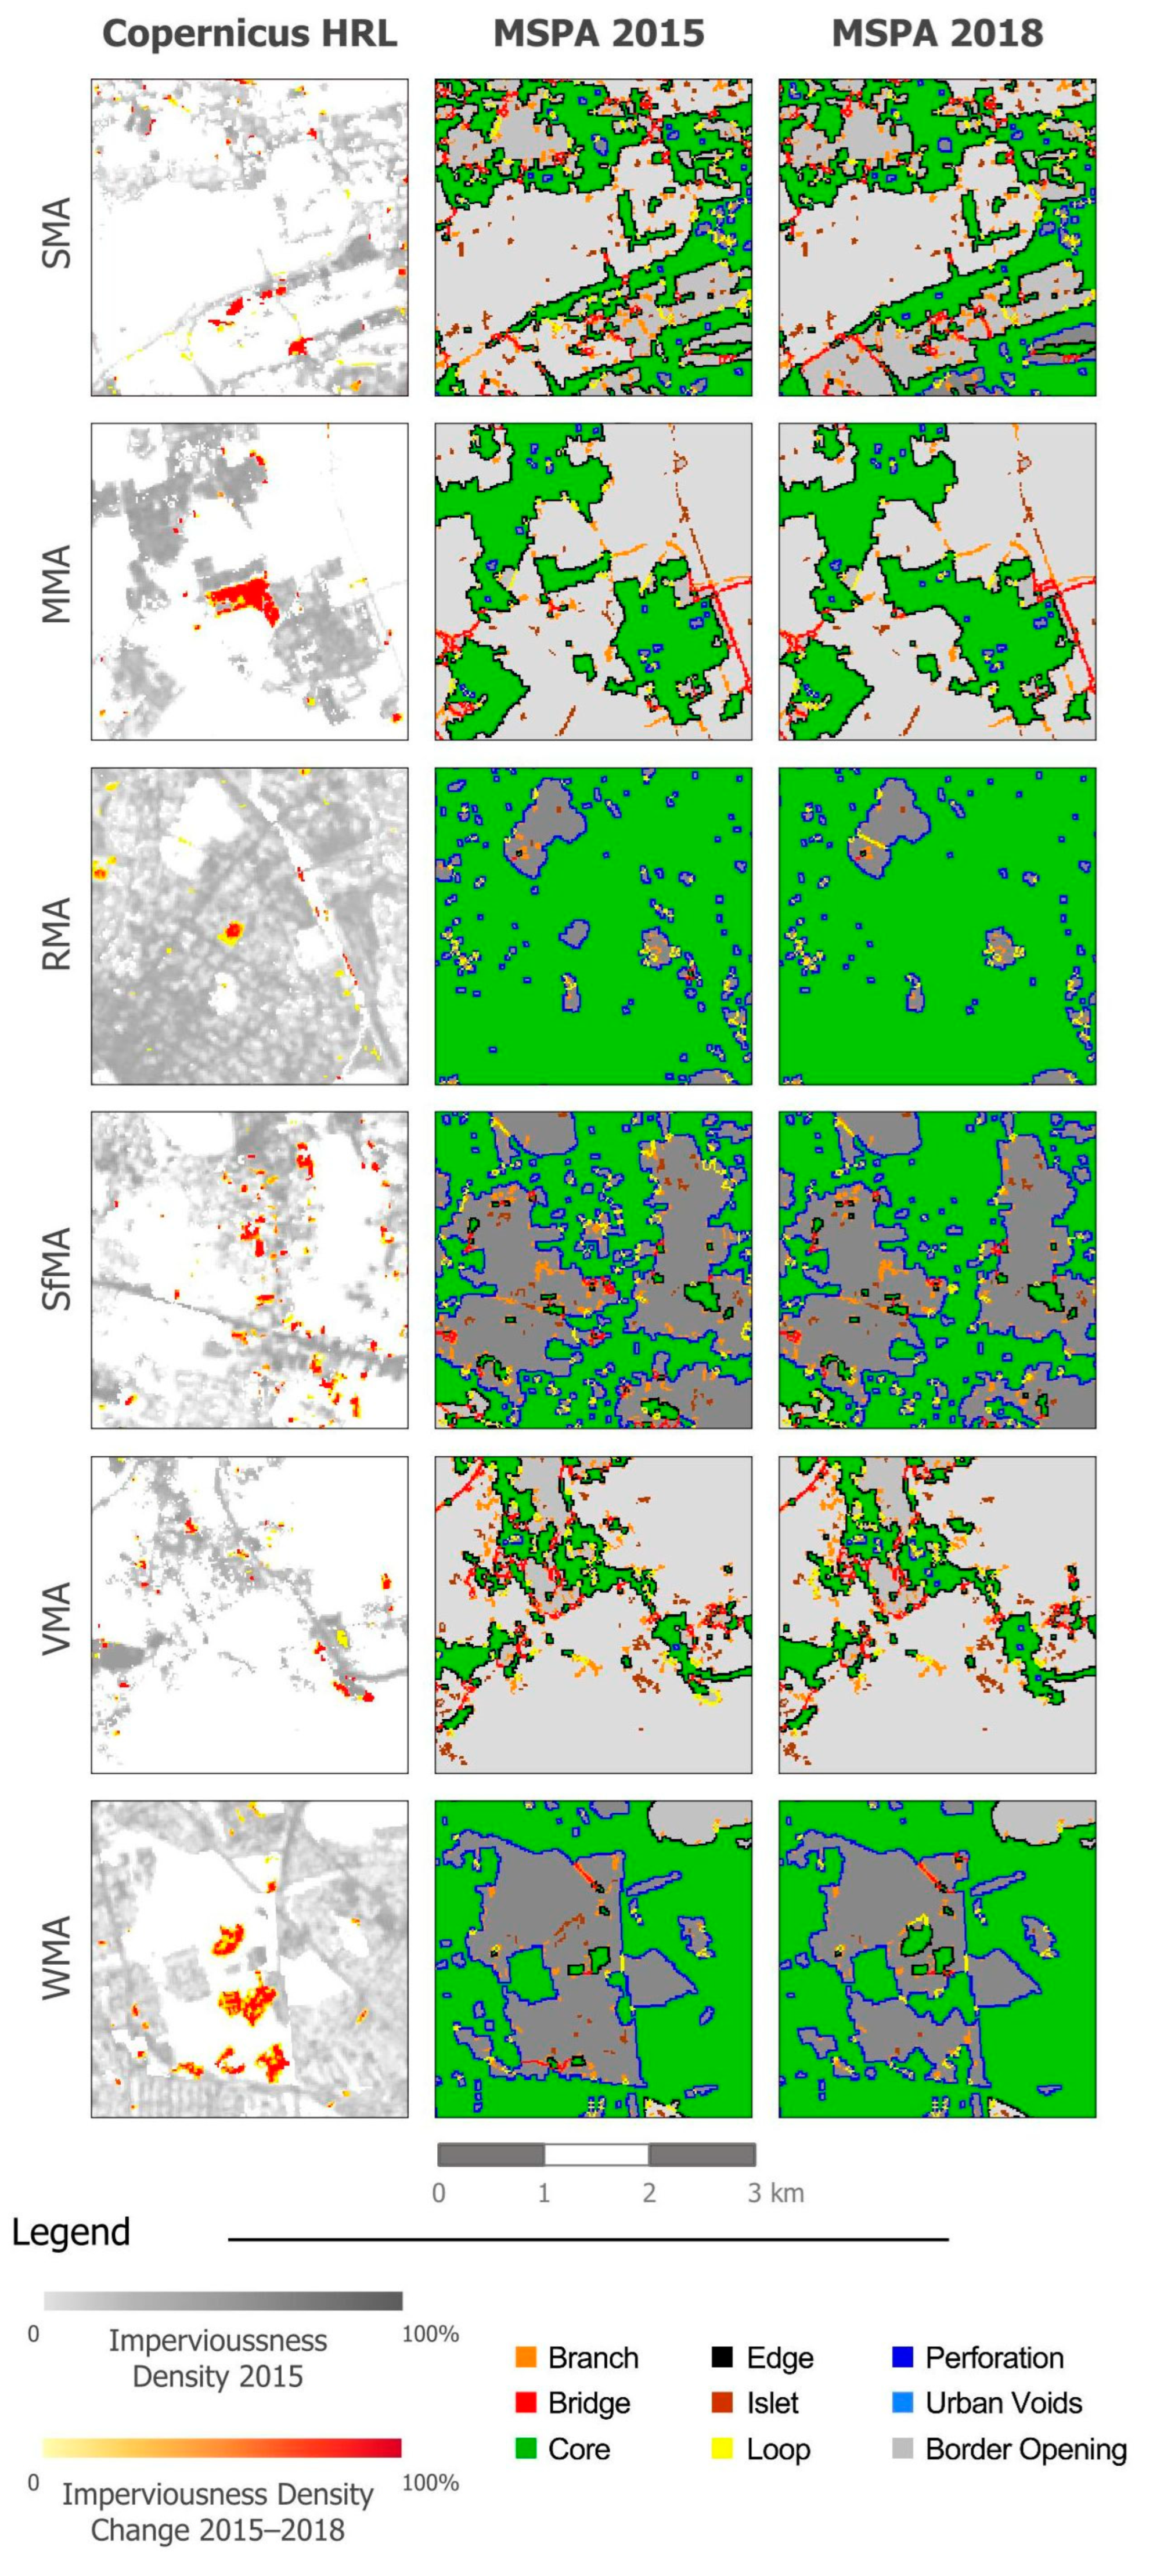
The MSPA conducted with GTB provides a comprehensive overview of landscape structure and its evolution between 2015 and 2018. Figure 2 presents the MSPA outputs for the selected metropolitan areas in 2015, while Figure 3 shows the comparison among Copernicus Imperviousness Density Change (2015–2018) and MSPA maps for both years.
For the Santander Metropolitan Area (SMA) in both 2015 and 2018, only a limited portion of SMA appears as impervious, with most of the territory covered by forest. Several well-defined Urban Voids occur within the urbanized zone, corresponding to green areas, wetlands, and marshes; examples include Parque de las Llamas (~11 ha) and the Parque del Canal de Raos–Marismas de Alday complex. MSPA reveals a clear increase in impervious surfaces, especially around the Parque Científico y Tecnológico de Cantabria (Figure 3), expressed as an expansion of Core areas. Similar peripheral growth patterns are visible in nearby settlements.
In the Milan Metropolitan Area (MMA), Core areas dominate both temporal snapshots. The portion of the territory represented in Figure 3 (southern Milan suburbs) includes consolidated built-up areas forming large Core patches. Between 2015 and 2018, several of these cores exhibit increased imperviousness. Within the continuous urban fabric, small Urban Voids remain detectable and correspond to green spaces embedded in the built matrix.
The Riga Metropolitan Area (RMA) Core class delineates the central urban area of Riga and several smaller towns connected to it. Core openings identify parks and vegetated areas, whereas forests and larger green parks appear as border openings. Linear MSPA classes such as Bridges and Branches correspond mainly to road infrastructure. A distinct example of landscape change is shown in Figure 3, where a core parcel visible in 2015 becomes impervious after redevelopment into an active recreation area (opened in 2017).
The Sofia Metropolitan Area (SfMA) shows high representation of the Core class in both years. However, rapid urban development between 2015 and 2018 leads to increased Branches and Loops, particularly in northern areas undergoing road construction. In zones experiencing accelerated densification—around Sofia Airport and southern suburbs—Urban Voids appear enclosed within expanding Core areas, reflecting replacement of vegetated spaces with business and residential structures.
The Viseu Metropolitan Area (VMA) shows low imperviousness overall, with MSPA classes representing minority components (Figure 2). Core and Edge areas appear as small, scattered patches, and Urban Voids are rare. The 2015–2018 comparison (Figure 3) indicates a stable landscape with only localized expansions of preexisting impervious patches.
In Warsaw Metropolitan Area (WMA), Core areas form the predominant MSPA class with a slight increase, which, combined with stability in other classes, suggests a largely continuous urban fabric with limited fragmentation.

3.2. Quantification of MSPA Classes

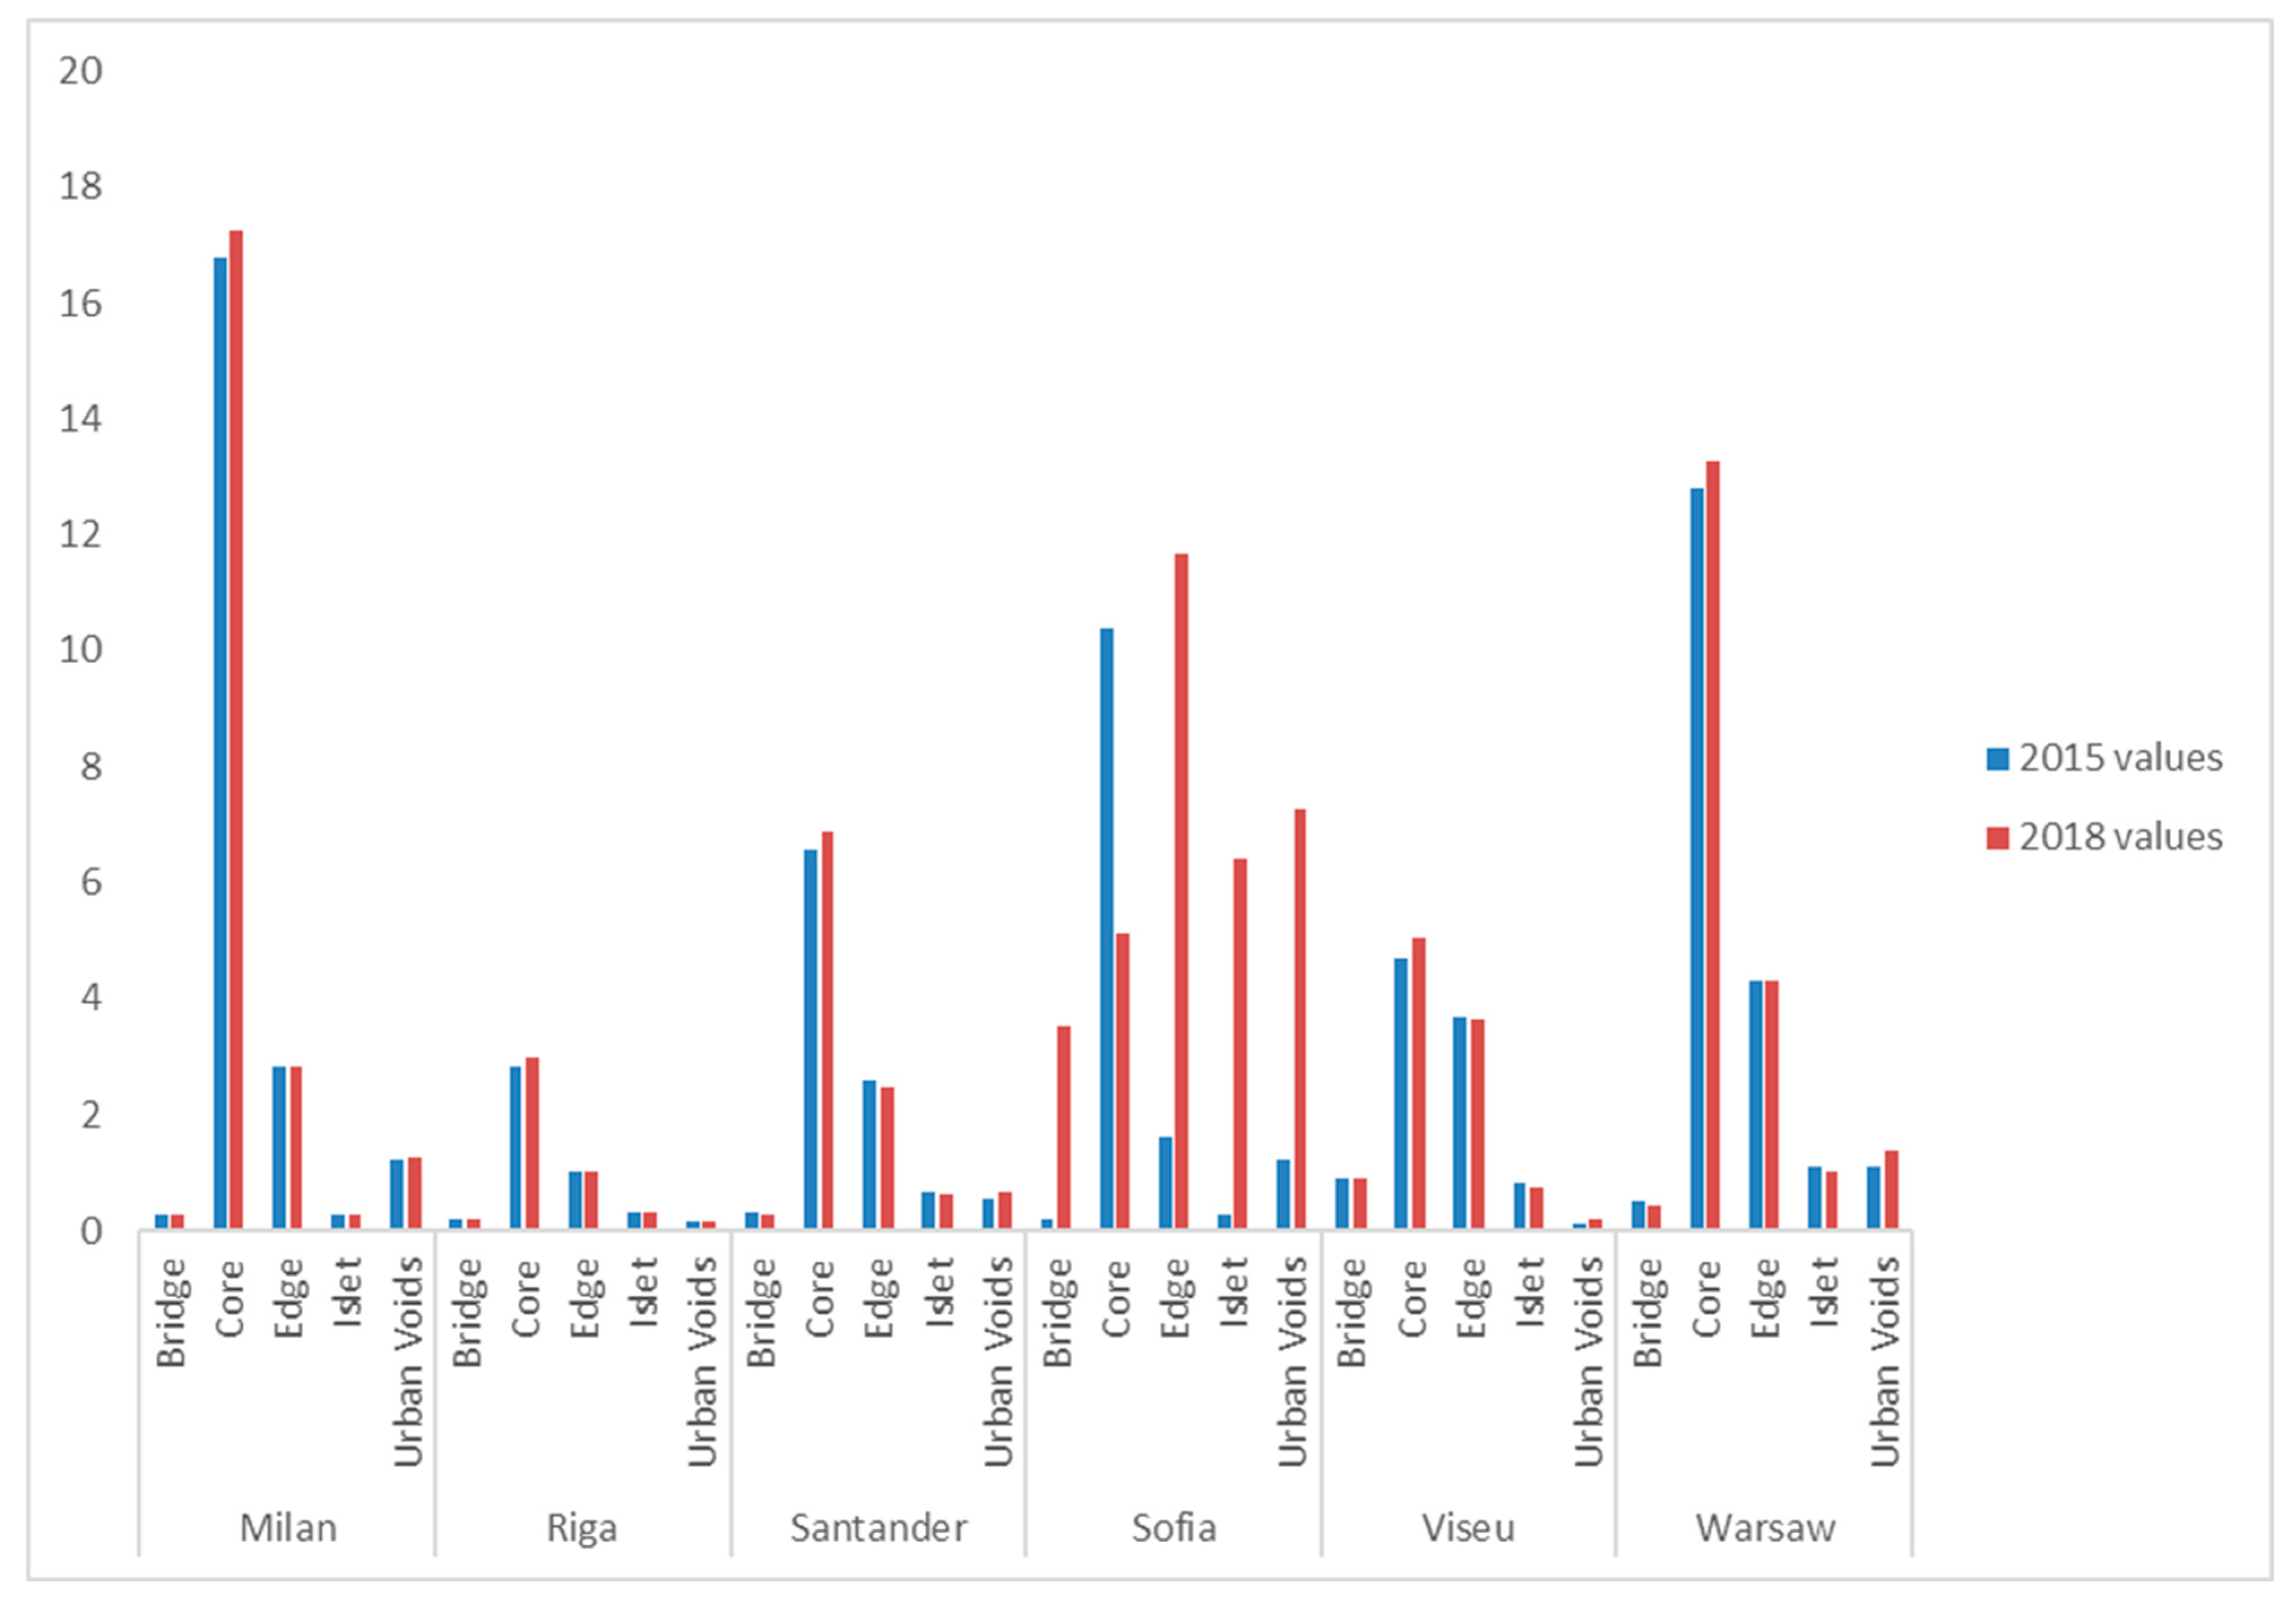
Figure 4 summarizes the percentage distribution of MSPA classes for each metropolitan area in 2015 and 2018.
  • MMA shows minor increases in Core (16.8%→17.25%) and Urban Voids (1.23%→1.27%), with marginal fluctuations in Edge (2.80%→2.82%) and stable Bridge/Islet values.
  • SMA records slight increases in Core (6.58%→6.88%) and Urban Voids (0.56%→0.68%), accompanied by a reduction in Edge (2.57%→2.47%), indicating decreased fragmentation.
  • RMA exhibits a 5% increase in Core and stable Edge and Islet areas. Urban Voids decline by 11%, mainly due to infilling within existing Core areas.
  • SfMA displays the most significant morphological transformations, with Edge increasing by >10%, Urban Voids by >7%, and Islets rising from ~1% to >7%, largely driven by road construction and industrial expansion supported by EU and municipal investment.
  • VMA demonstrates minor compaction: Core increases (4.7%→5.1%), Urban Voids slightly expand (0.12%→0.19%), while Islets, Edges, and Bridges decrease.
  • WMA shows moderate Core growth (12.75%→13.27%), slight declines in Edge and Bridge, and a notable increase in Urban Voids (1.12%→1.39%), suggesting greater internal Porosity within a largely stable urban framework.

3.3. MSPA-Derived Structural Metrics

Landscape metrics derived from MSPA are reported in Table 4 by means of the indices Pcore, Edge Density, and Porosity, calculated for 2015 and 2018.
  • SMA shows an increase in Porosity (0.086→0.099), a decrease in Edge Density (0.391→0.360), and a rise in Pcore (6.58%→6.92%), indicating reduced fragmentation and increased openness.
  • MMA indices confirm stability, with slight Pcore growth and minimal changes in Edge-related metrics.
  • RMA registers a 5% increase in Pcore, a 5% decrease in Edge Density (0.37→0.35), and a 17% decrease in Porosity (0.06→0.05), signaling internal compaction.
  • SfMA exhibits the strongest shifts, with Porosity rising from 0.117 to 2.060 and Edge Density from 0.154 to 2.277. These increases reflect intense construction and restructuring of the urban fabric during the study period.
  • VMA shows increased Pcore and reduced Edge and Porosity, in line with slight ompaction trends observed in the MSPA classes.
  • WMA presents increased Pcore (12.75→13.27), reduced Edge Density (0.34→0.32), and a higher Porosity index (0.088→0.105), indicating intensified Core consolidation with modest internal fragmentation.

3.4. Entropy Analysis of Spatial Disorder

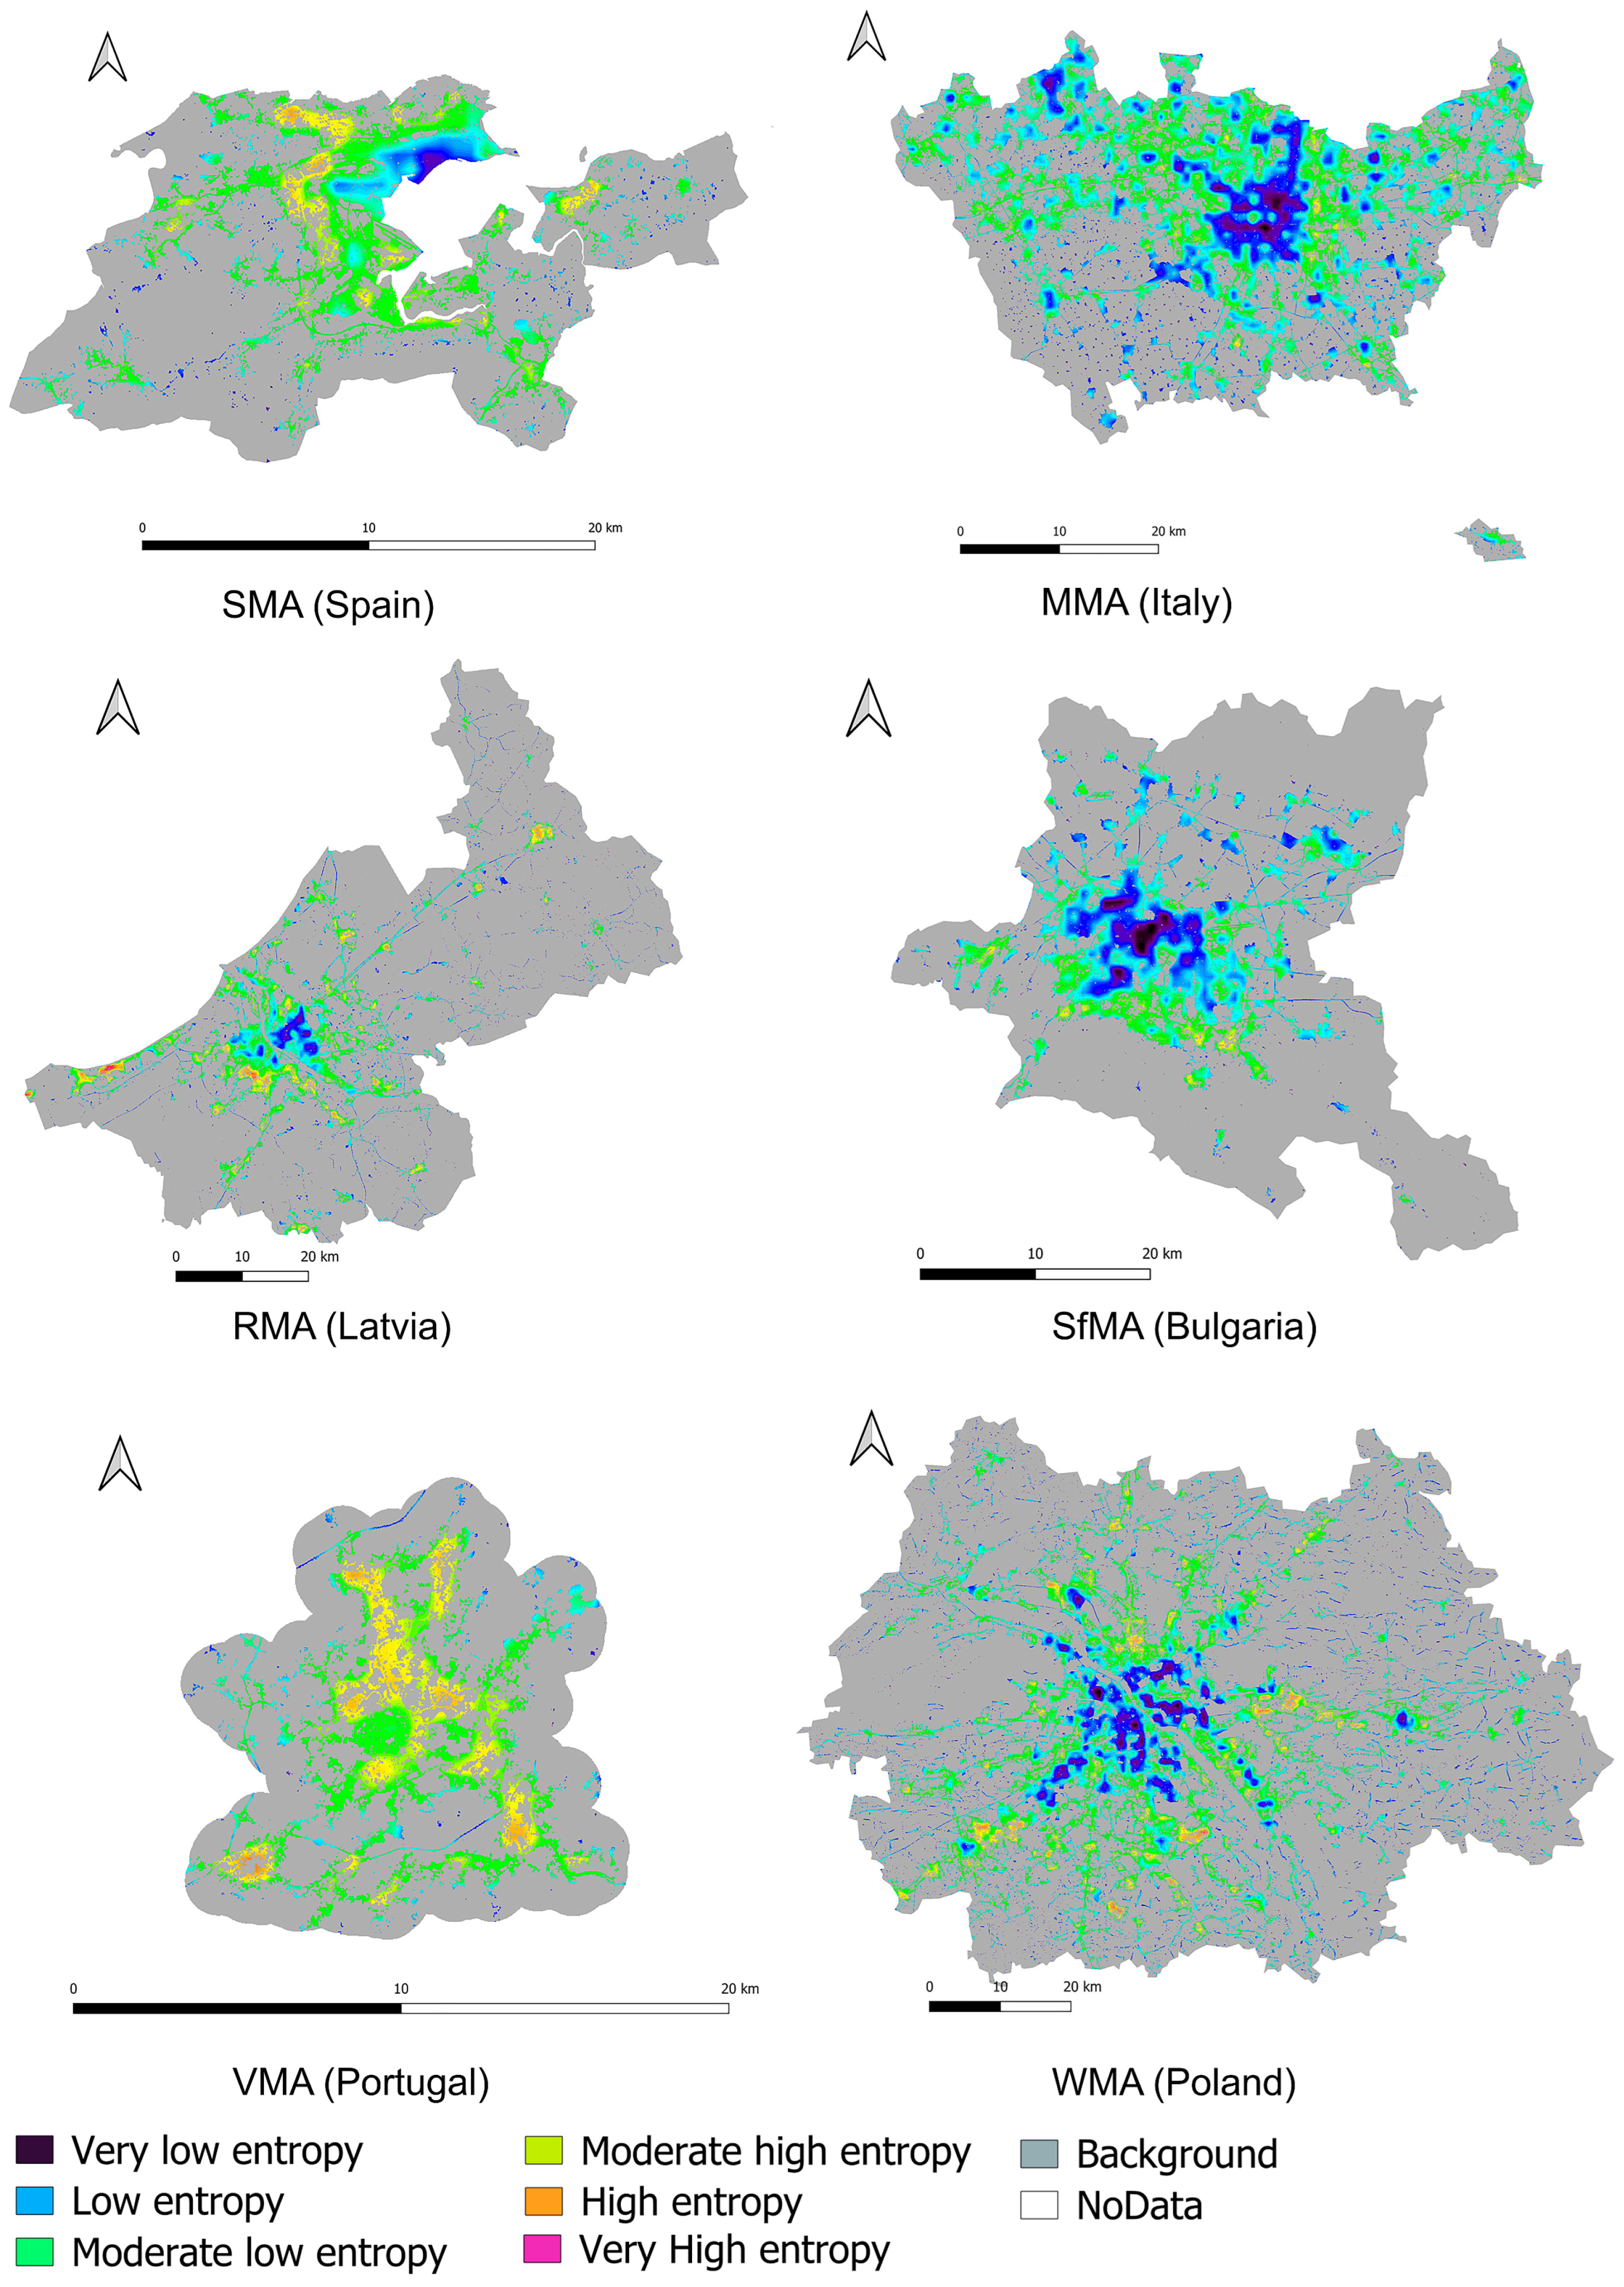
The Entropy analysis provides a complementary assessment of spatial disorder in imperviousness patterns. Figure 5 displays the entropy maps for all study areas in 2015. The entropy difference maps (2015–2018) identify whether changes in imperviousness occurred through compact growth or fragmented dispersion.
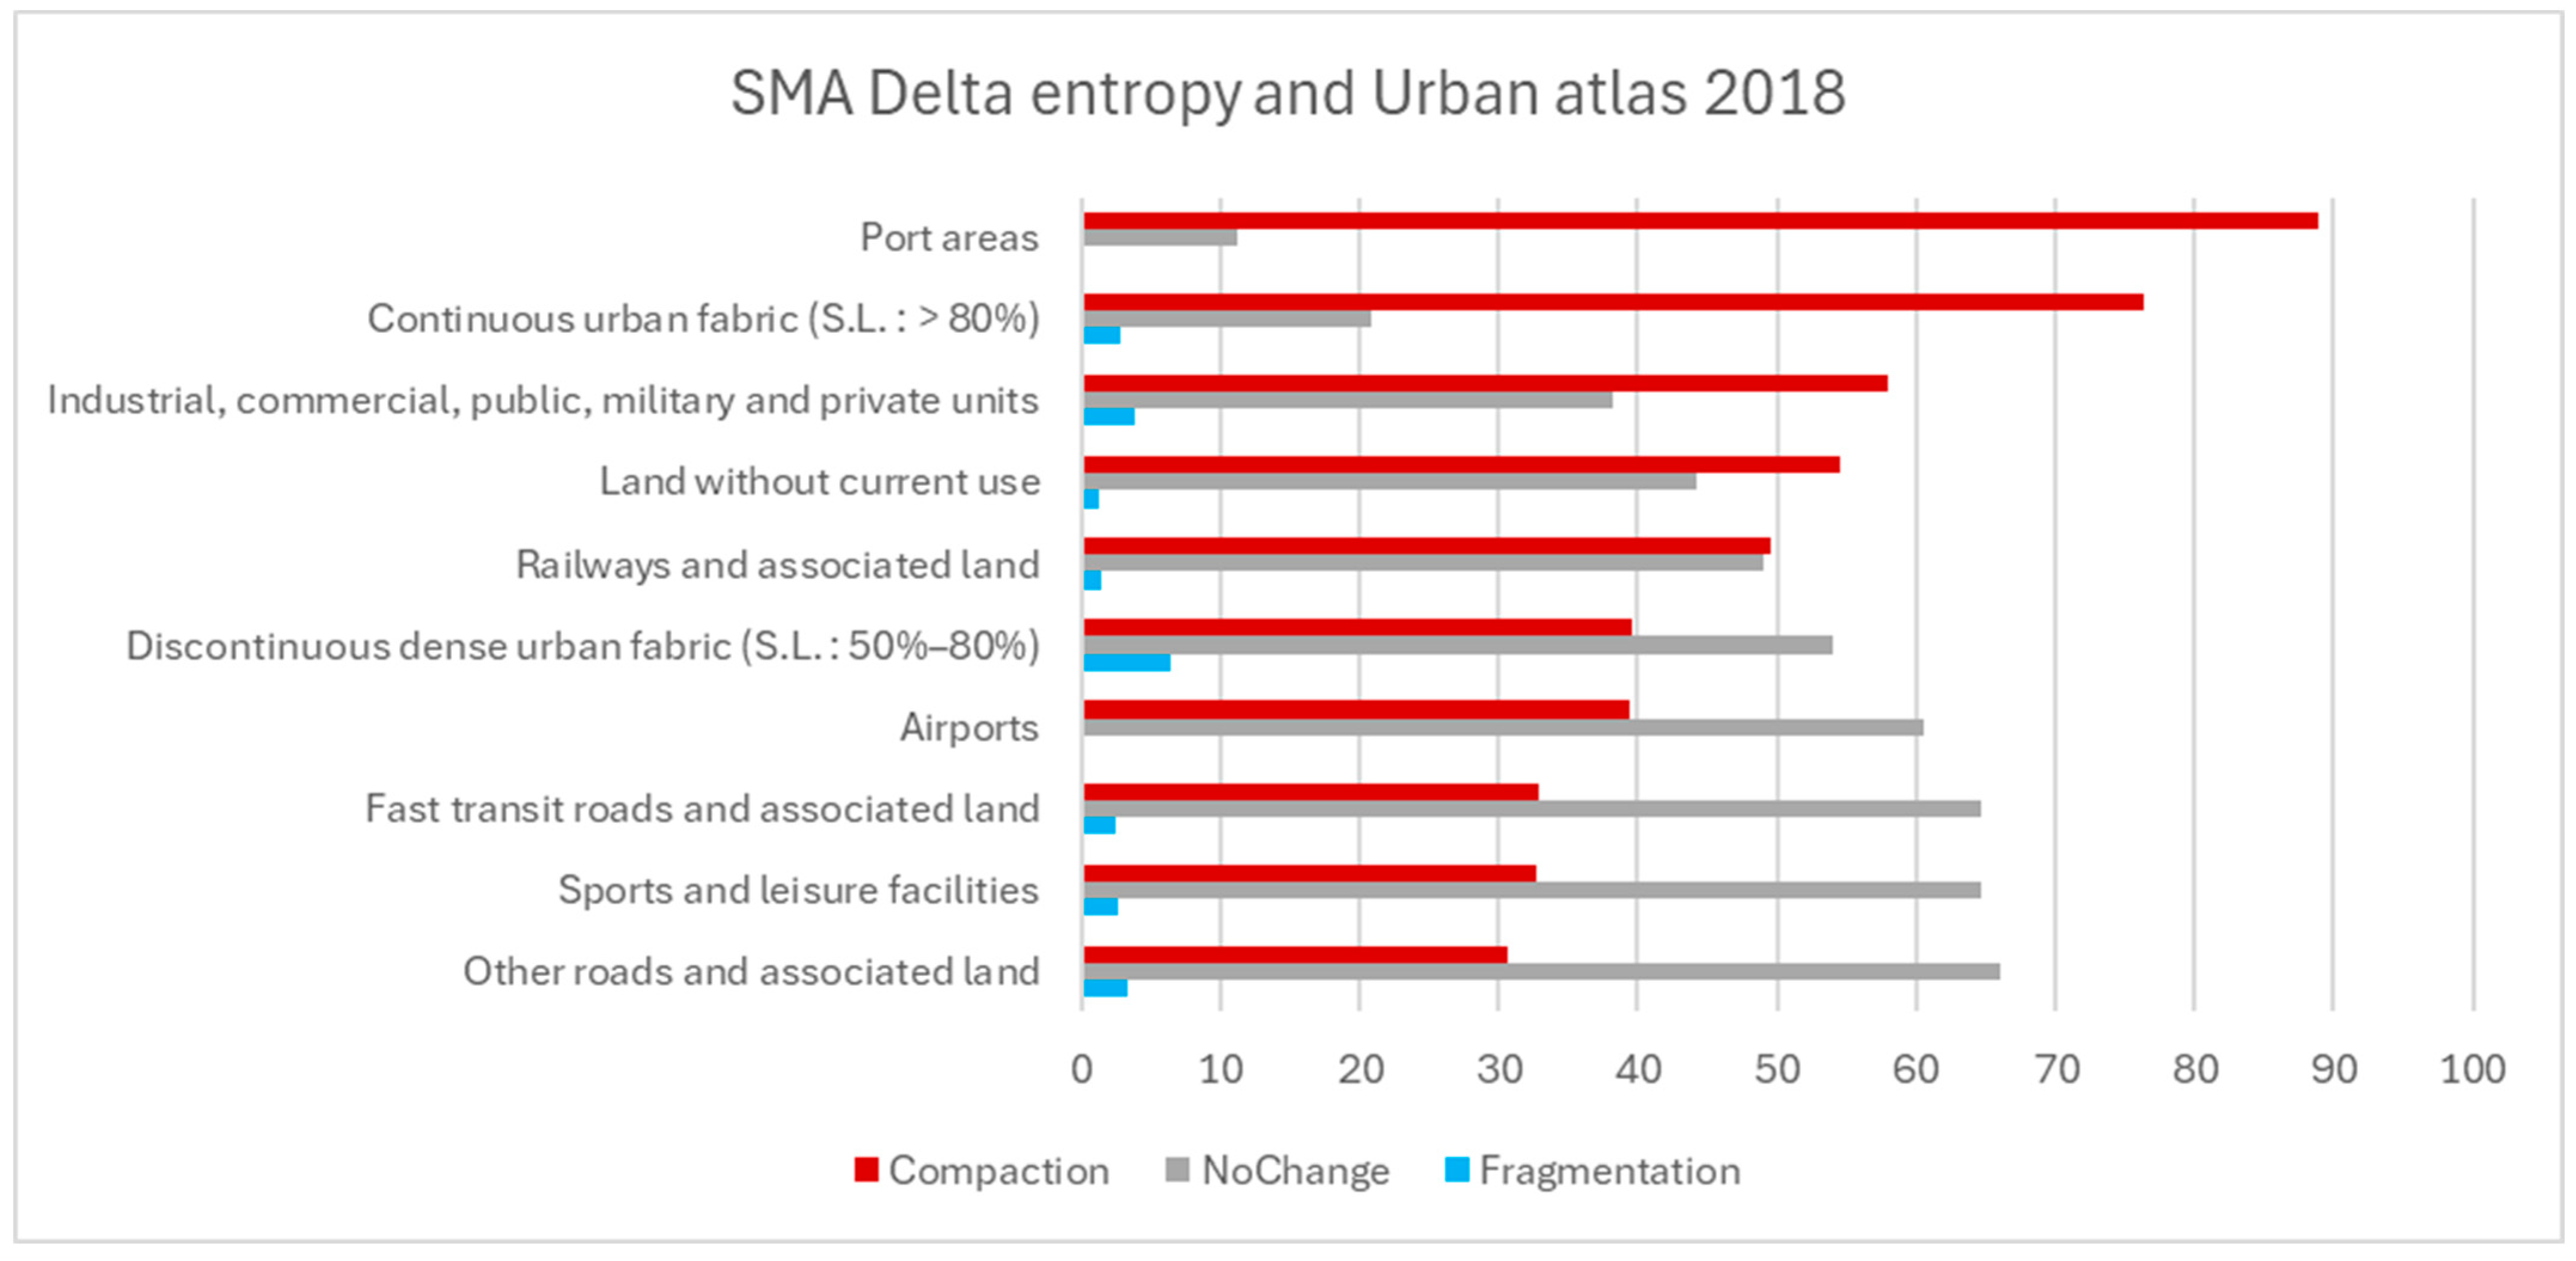
To integrate entropy changes with land-use information, Urban Atlas 2018 classes were intersected with the entropy difference output. The 10 classes with the lowest share of “no change” were selected and ranked by compaction rate, enabling evaluation of how spatial structure evolved in relation to functional land use. This combined analysis highlights areas where urbanization progressed in a concentrated manner versus those where fragmentation increased.
The intersection between entropy surfaces and Urban Atlas classes was used with the purpose of providing an informative yet effective overview of where compaction and fragmentation processes occur within the functional structure of each metropolitan area. This analysis is not intended as an exhaustive quantitative model, but rather as a simplified interpretative layer that helps identify which land-use categories are most affected by structural change. By combining entropy with Urban Atlas, we offer a clear and easily comparable indication of the sectors experiencing the strongest transformations, without introducing unnecessary methodological complexity. Although simplified, this approach effectively supports cross-city comparison and contributes to a transparent operational understanding of urban structural change.

3.5. Country-Level Entropy Highlights

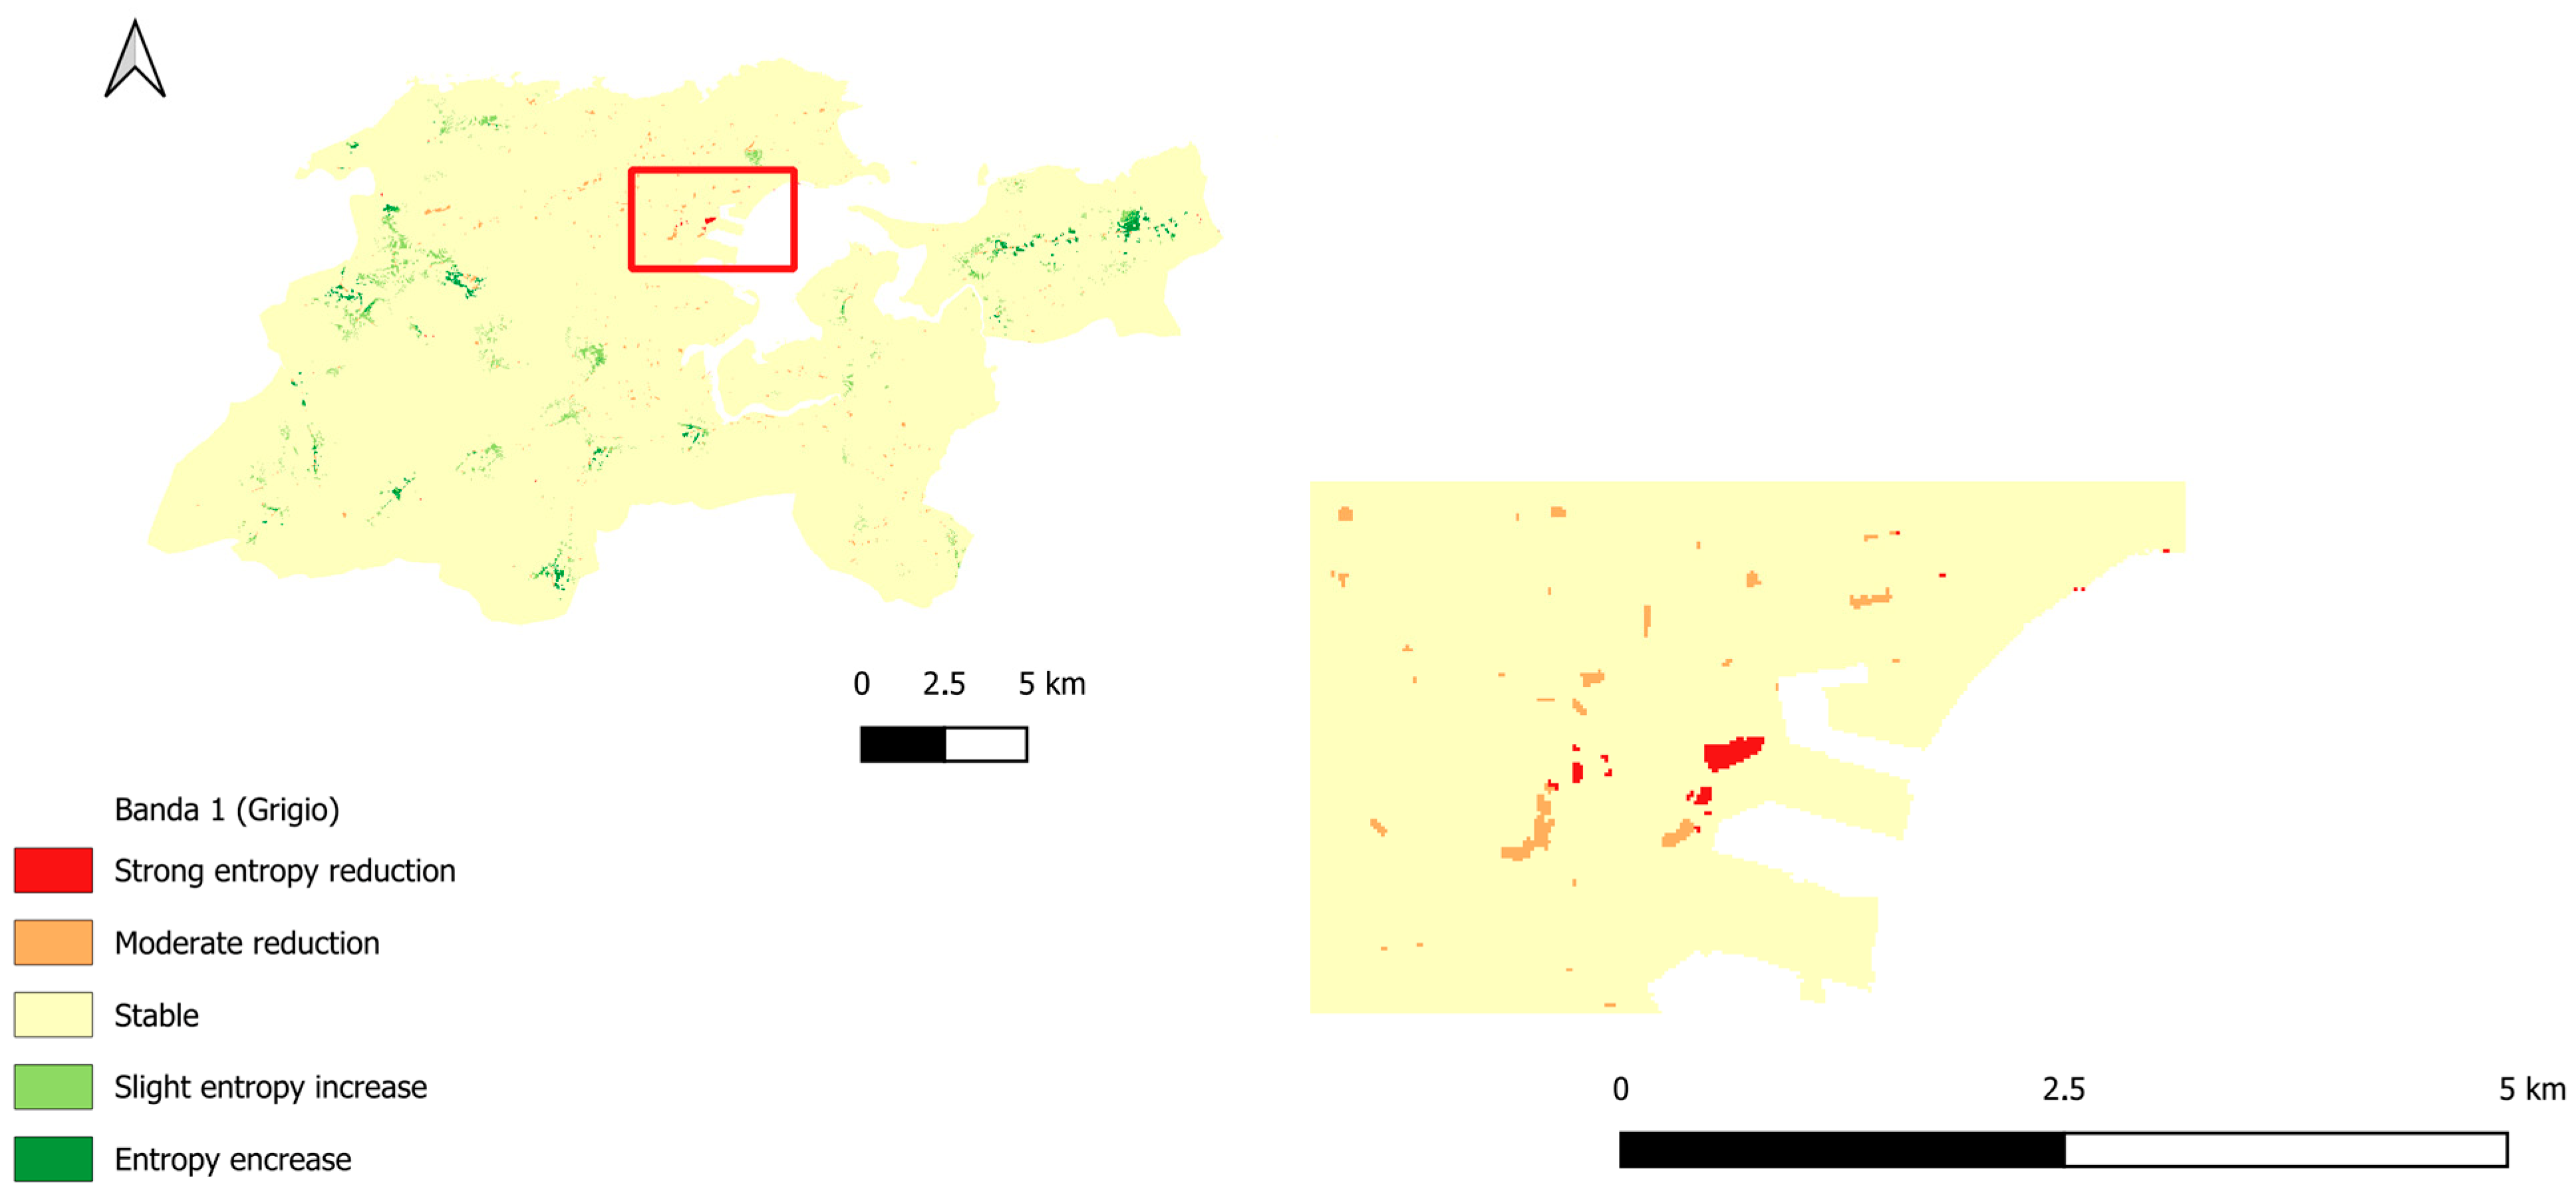
The entropy change analysis for the Santander Metropolitan Area (SMA) (Figure 6) highlights a set of areas showing negative entropy values between 2015 and 2018. These green-coded zones correspond to reduced spatial disorder and therefore increased compaction, mainly in locations that transitioned from undeveloped land in 2015 to continuous built-up surfaces in 2018. This pattern indicates consolidation of previously vacant parcels into coherent urban fabric.
The cross-comparison of entropy differences with Urban Atlas classes (Figure 7) shows that port areas experienced the highest compaction (88.86%) and no fragmentation, indicating strong infilling and near-complete structural consolidation. Continuous urban fabric (S.L. > 80%) similarly displays high compaction (76.42%) and minimal fragmentation (2.71%), with nearly four-fifths of its extent undergoing structural change.
Industrial, commercial and logistics areas also show substantial compaction (58.01%) and low fragmentation (3.76%), reflecting ongoing industrial park expansion accompanied by limited discontinuities. Railway areas follow a comparable trend, with 49.53% compacted and only 1.38% fragmented, while fast transit roads show moderate expansion (32.89%) and very low fragmentation (2.48%).
Within dense discontinuous urban fabric (S.L. 50–80%), compaction reaches 39.60%, accompanied by a larger share of fragmentation (6.40%), suggesting peripheral neighborhoods consolidating into more cohesive—but still partially discontinuous—patterns. Sports and leisure facilities present 32.77% compaction and 2.54% fragmentation, consistent with facility expansion within existing complexes.
Overall, these patterns indicate that SMA’s most pronounced structural transformations occurred in the most urbanized and infrastructure-intensive classes (ports, continuous fabric, industry, transport), whereas discontinuous fabrics and urban natural areas exhibit more moderate change, reinforcing a trend of peripheral densification combined with partial retention of internal green “voids.”
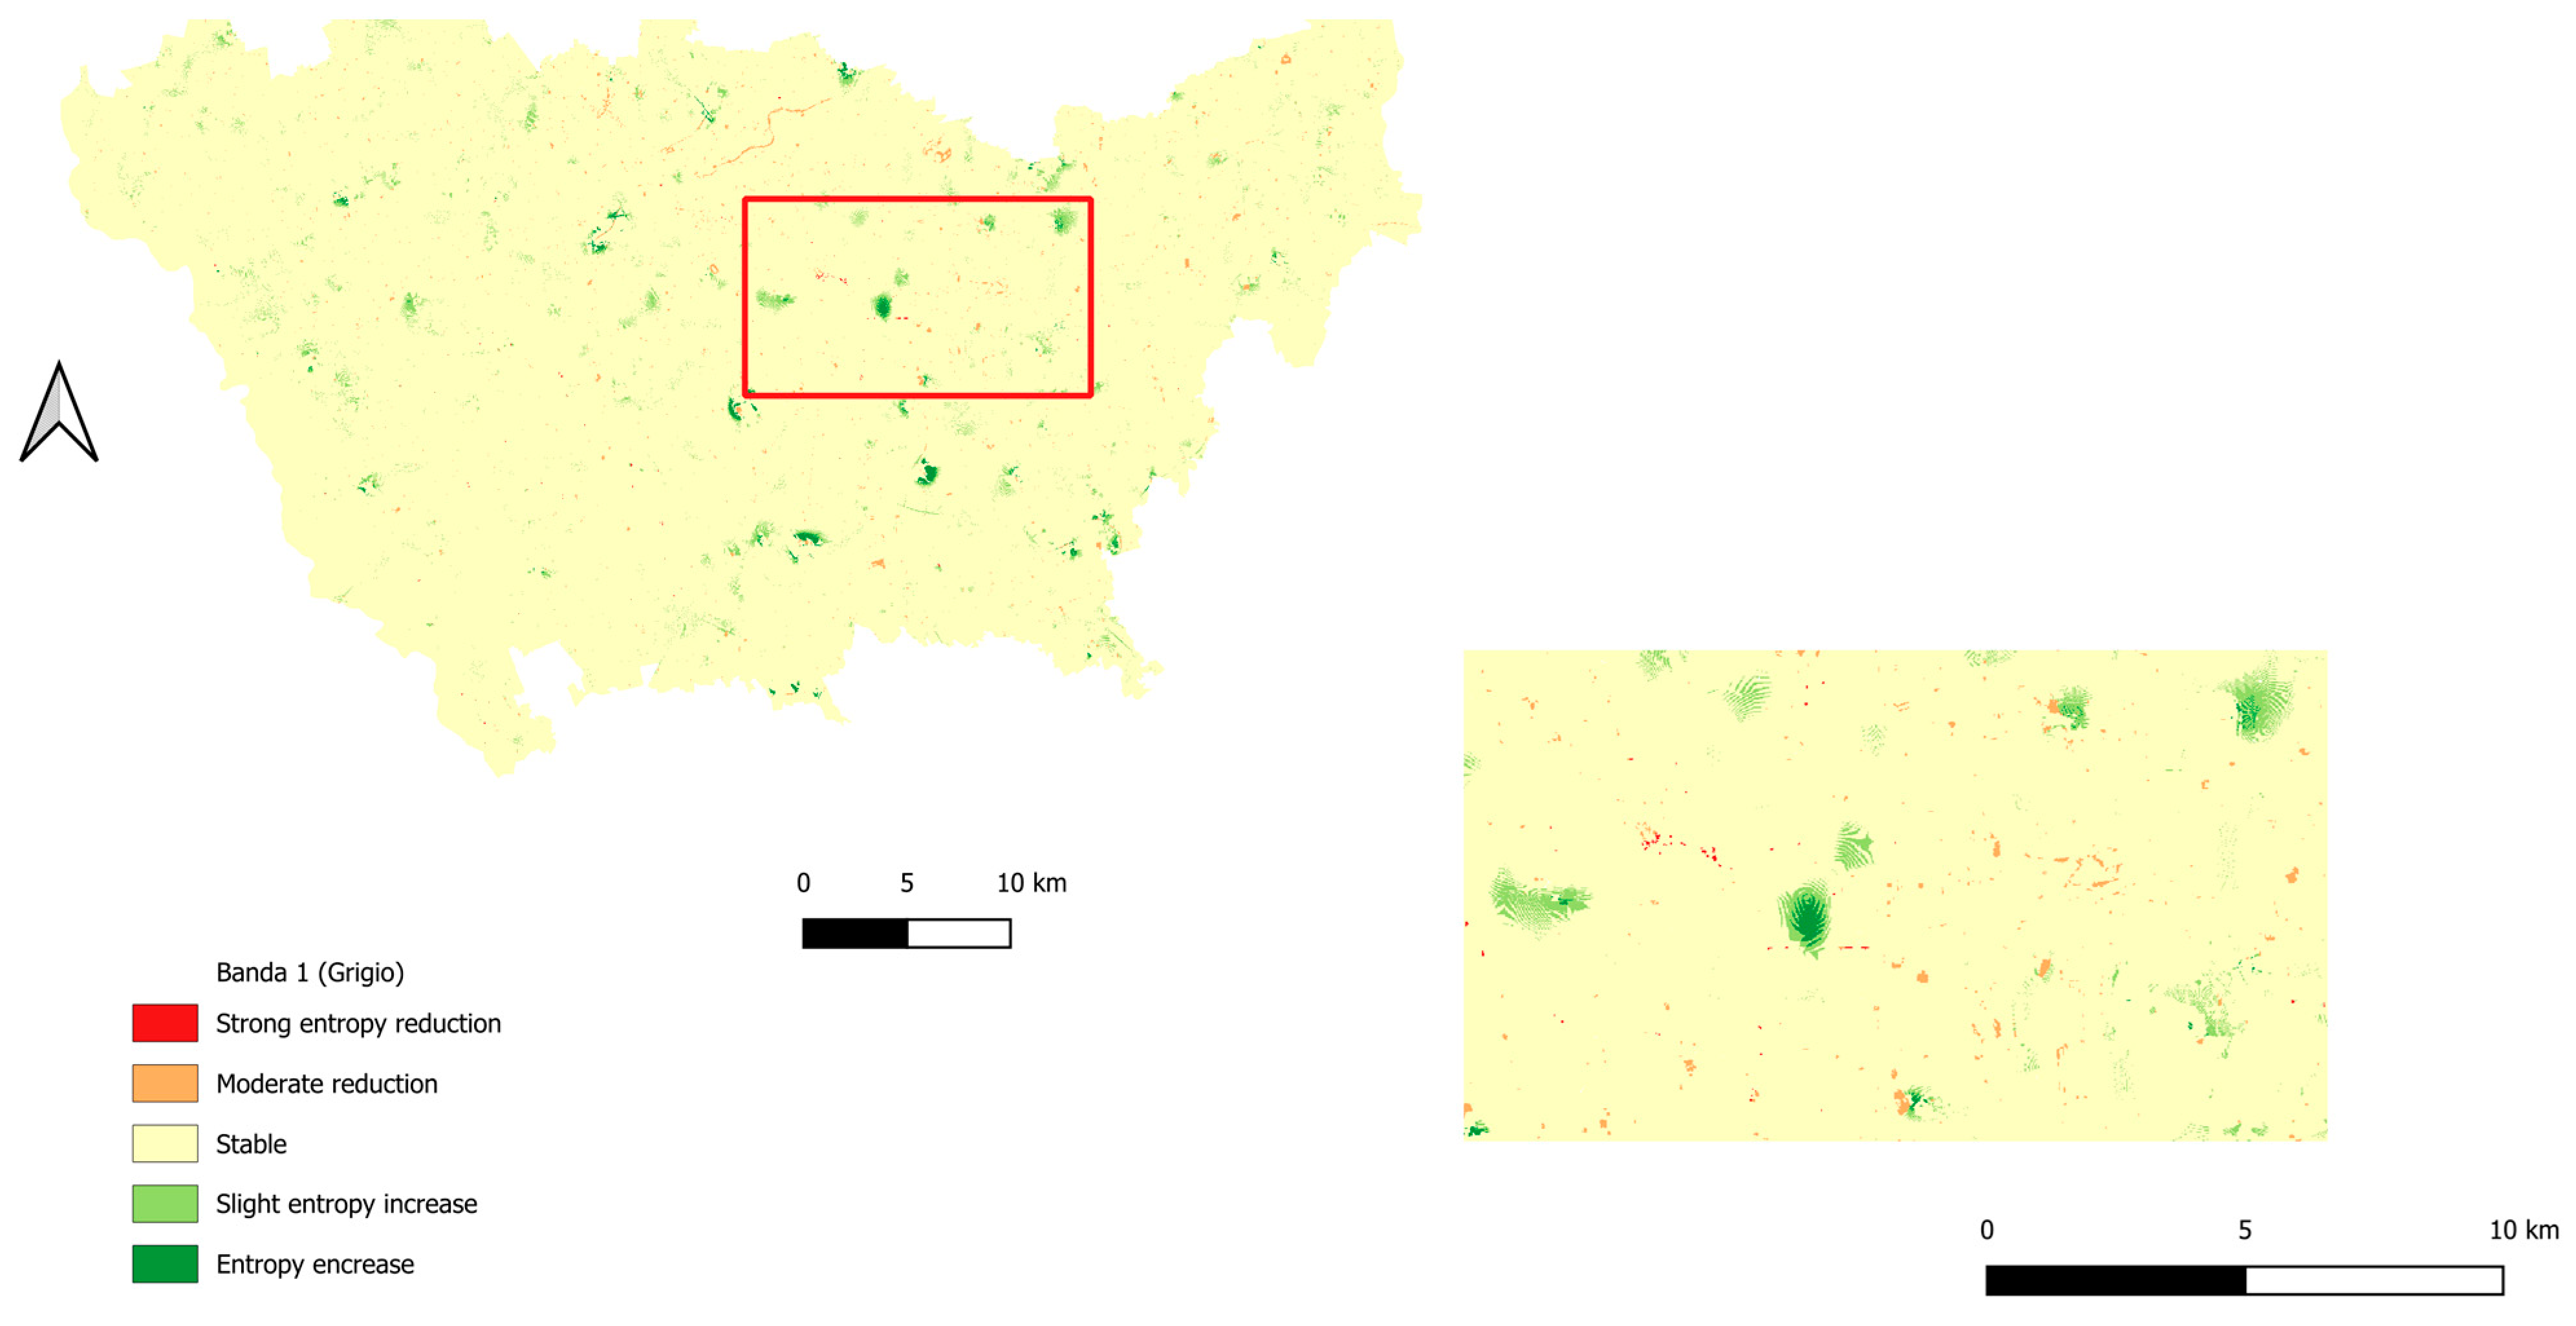
The entropy change map in the Milan Metropolitan Area (MMA) (Figure 8) shows generally stable entropy values between 2015 and 2018. As the central area is already almost fully sealed, additional changes are minimal and spatial disorder remains low. Moderate entropy increases are visible in peripheral zones, where scattered new developments, industrial expansions, and infrastructure works create more heterogeneous adjacency patterns. The zoomed area in Figure 8 illustrates localized negative values linked to the aggregation of newly urbanized elements, consistent with dispersed growth and metropolitan sprawl.
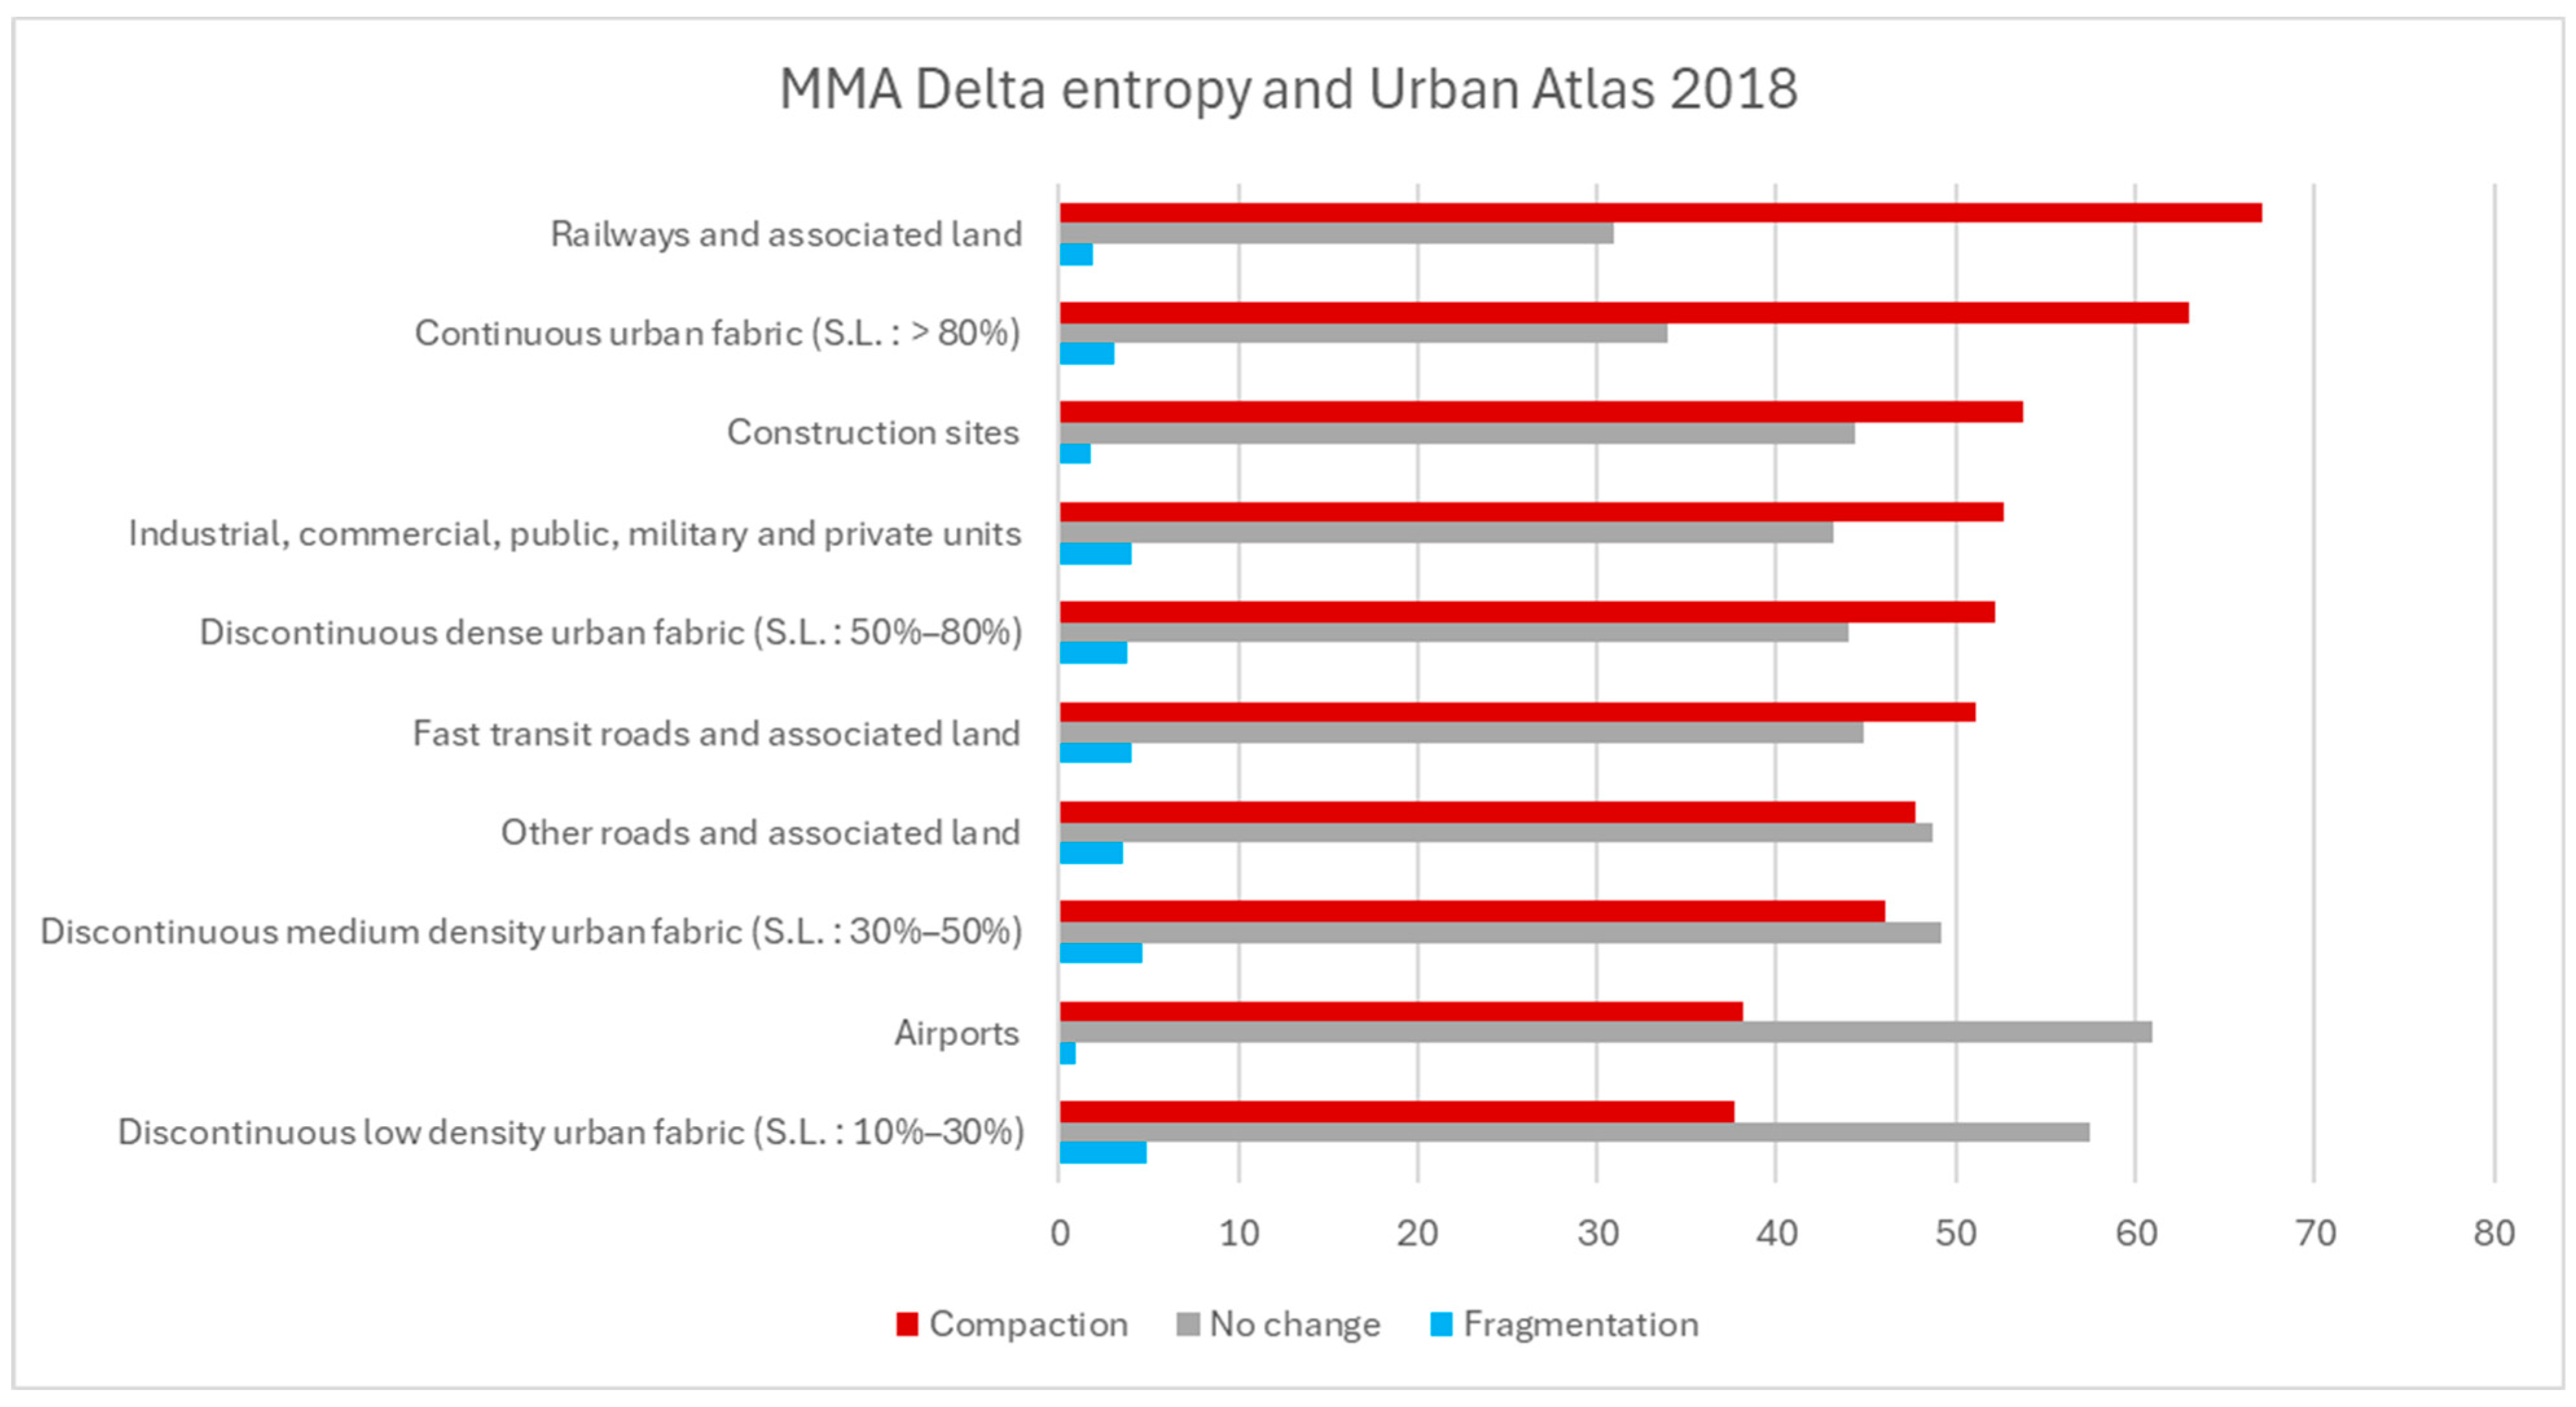
The integration of entropy change with Urban Atlas 2018 classes (Figure 9) identifies which land-use categories experienced the largest structural modifications. Railways and associated land show the highest compaction (67.12%) and minimal fragmentation (1.9%). Continuous urban fabric (S.L. > 80%) also displays strong compaction (63.03%) and low fragmentation (3.06%). Values above 50% compaction also characterize construction sites, industrial and commercial areas, discontinuous dense urban fabric (S.L. 50–80%), and fast transit roads, indicating ongoing densification or the saturation of peripheral areas.
Higher fragmentation occurs in isolated structures (6.06%), discontinuous low-density fabric (S.L. 10–30%) (4.85%), and discontinuous medium-density fabric (S.L. 30–50%) (4.68%). Green urban areas show moderate compaction (25.64%) and only 1.30% fragmentation. Most classes remain largely unchanged, confirming overall landscape stability. These results contribute to understanding the effects of urban form, particularly in relation to densification processes and the redevelopment of brownfield areas through new green spaces [6,7]. Densification is notably concentrated in high-density residential, industrial, and commercial areas. Identifying residual Urban Voids and quantifying their distribution supports sustainable planning decisions, including whether to transform such spaces into green areas or preserve them as potential buffers against urban shrinkage.
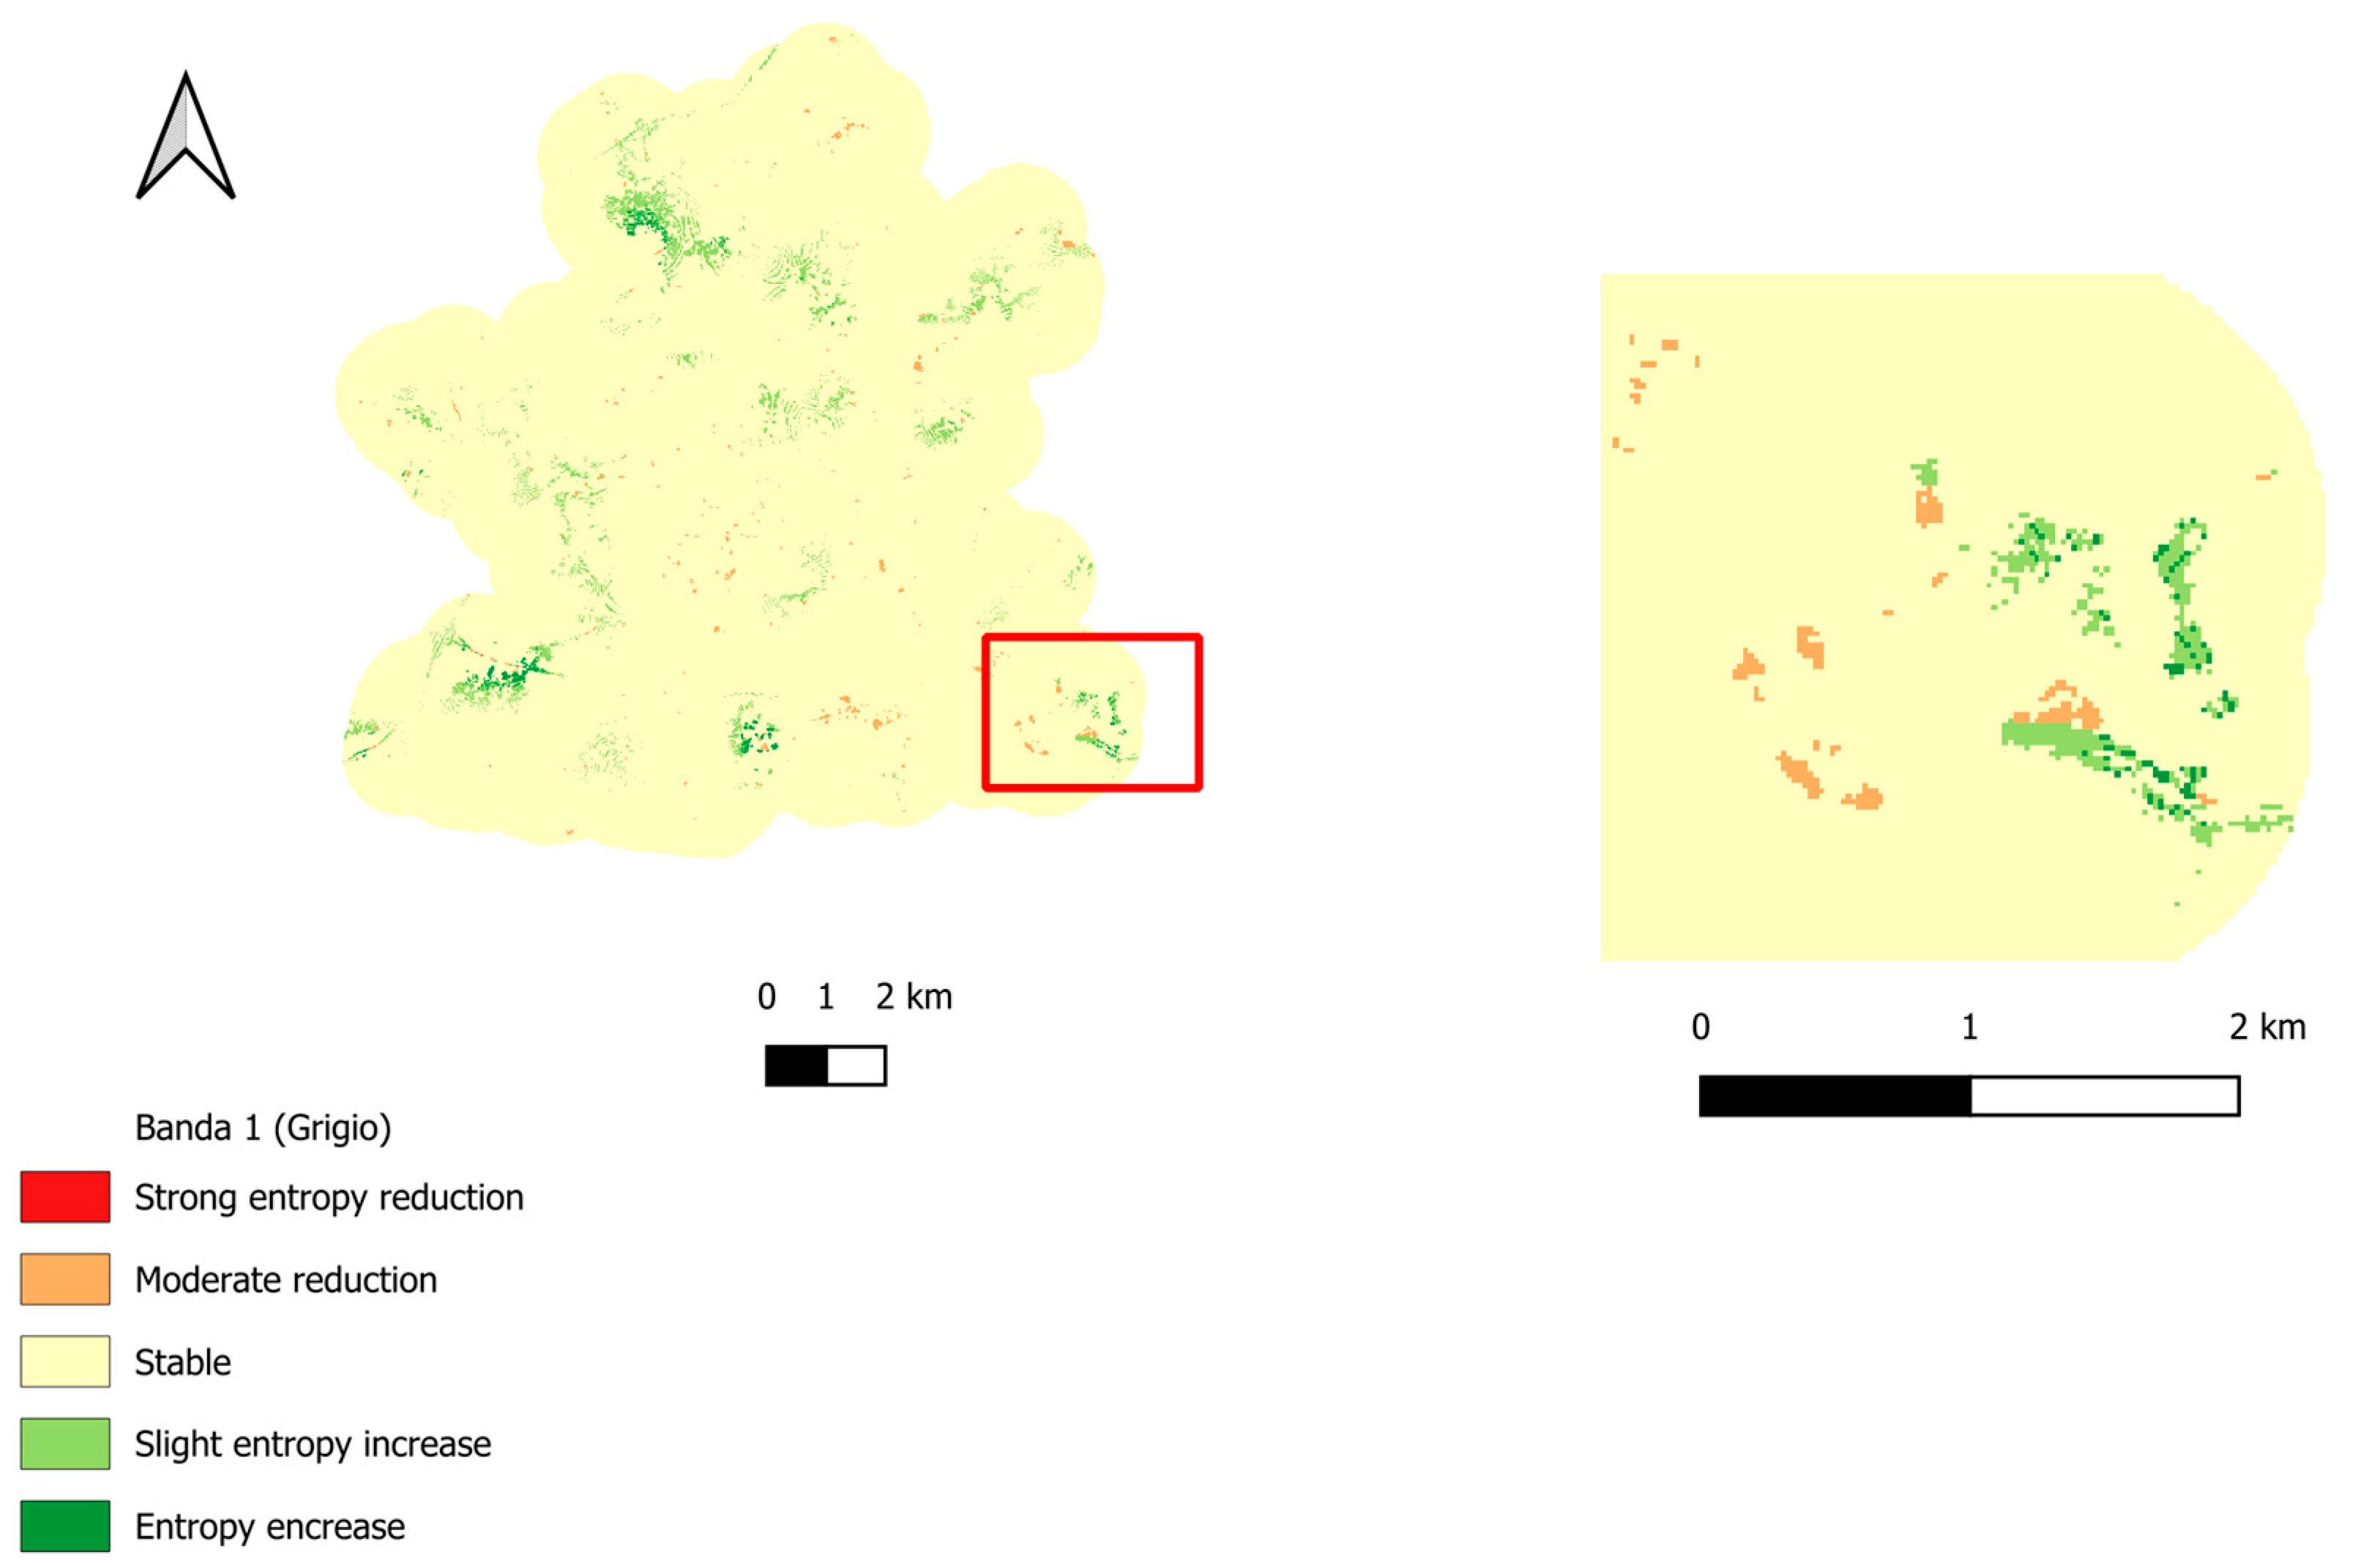
Entropy changes for the Riga Metropolitan Area (RMA) between 2015 and 2018 are shown in Figure 10. Most of the region remains stable, with no significant modifications in spatial disorder. Slight entropy reduction occurs mainly within the city of Riga, where previously undeveloped parcels were urbanized, indicating further compaction of the urban fabric. The redevelopment example highlighted earlier (Figure 3), where a green area was replaced by an active recreation site, also appears as an area with marked entropy decline (zoom area). Slight entropy increases are found only in suburban zones.
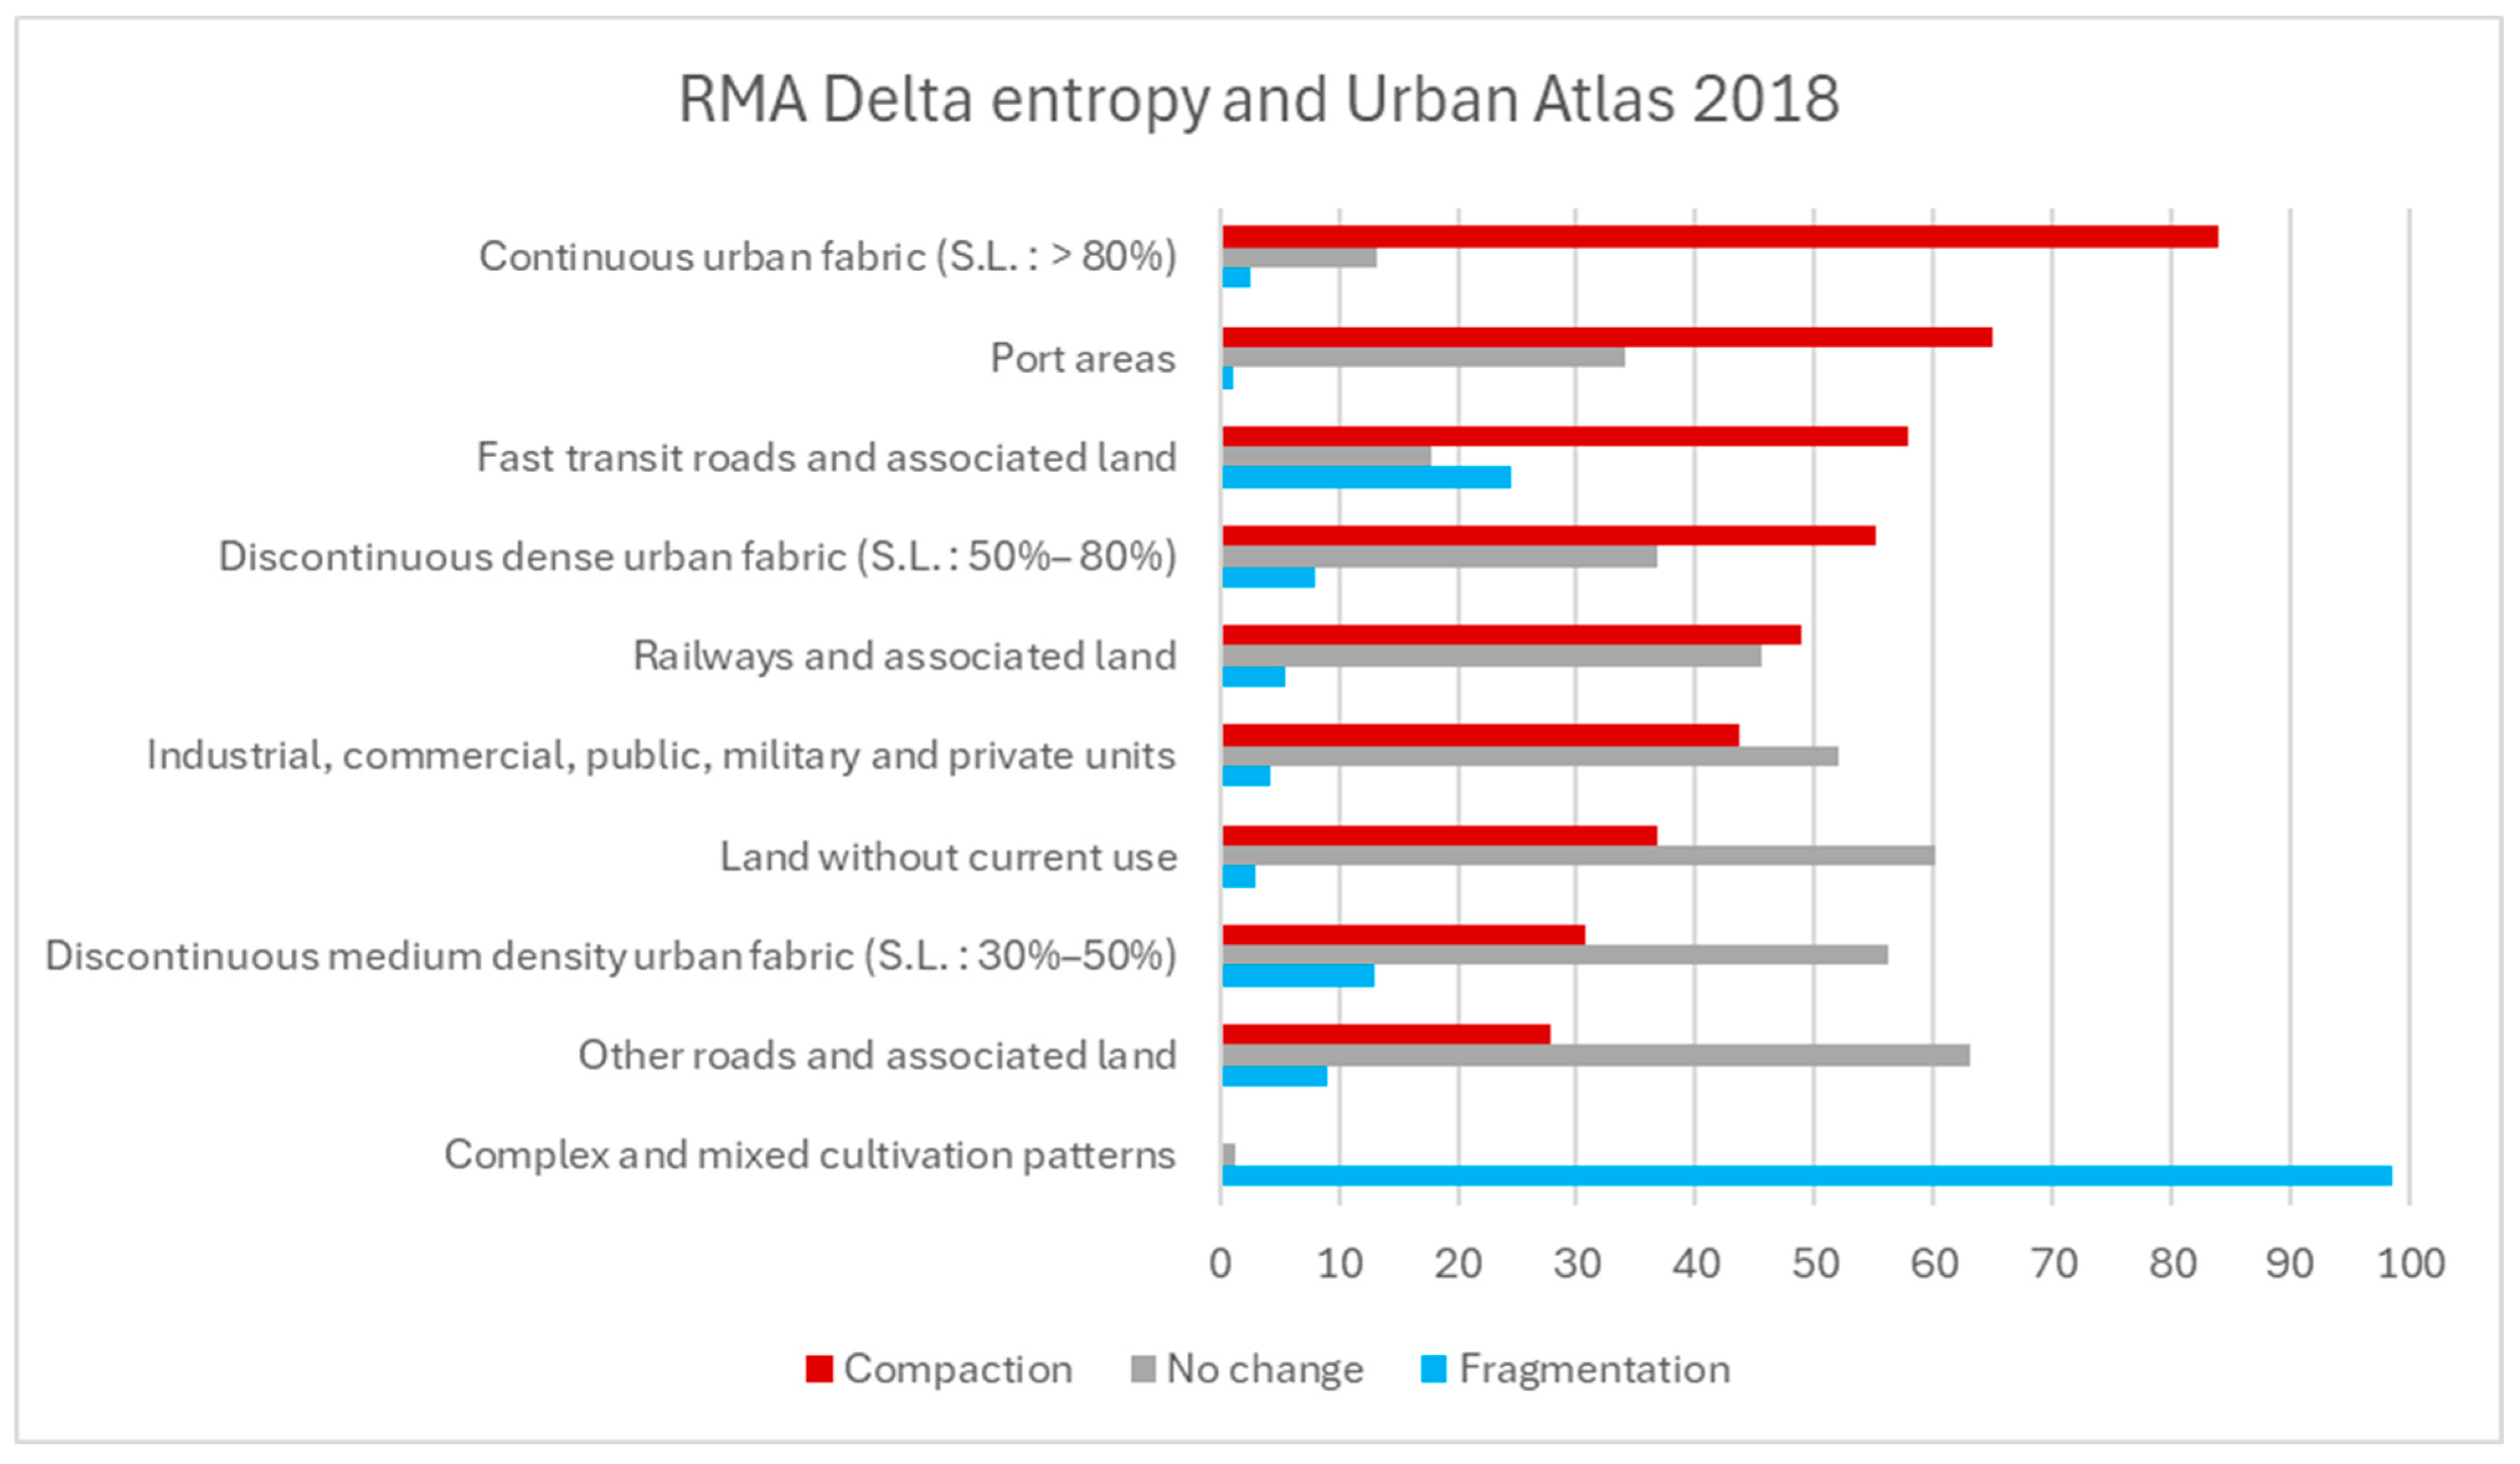
Analysis of entropy changes across Urban Atlas classes (Figure 11) shows that continuous urban fabric (S.L. > 80%) exhibits the highest compaction rate (84%), followed by port areas (67%), fast transit roads and associated land (58%), and discontinuous dense urban fabric (S.L. 50–80%). In each case, compaction is associated with construction projects replacing undeveloped land with new built-up areas. Among the 10 Urban Atlas classes with the most change, only complex and mixed cultivation patterns show a predominance of fragmentation (99%), occurring mainly in rural parts of the RMA.
A considerable fragmentation value (24%) is also observed in fast transit roads and associated land. Overall, compaction is concentrated within urbanized zones, whereas fragmentation appears primarily in suburban and rural areas.
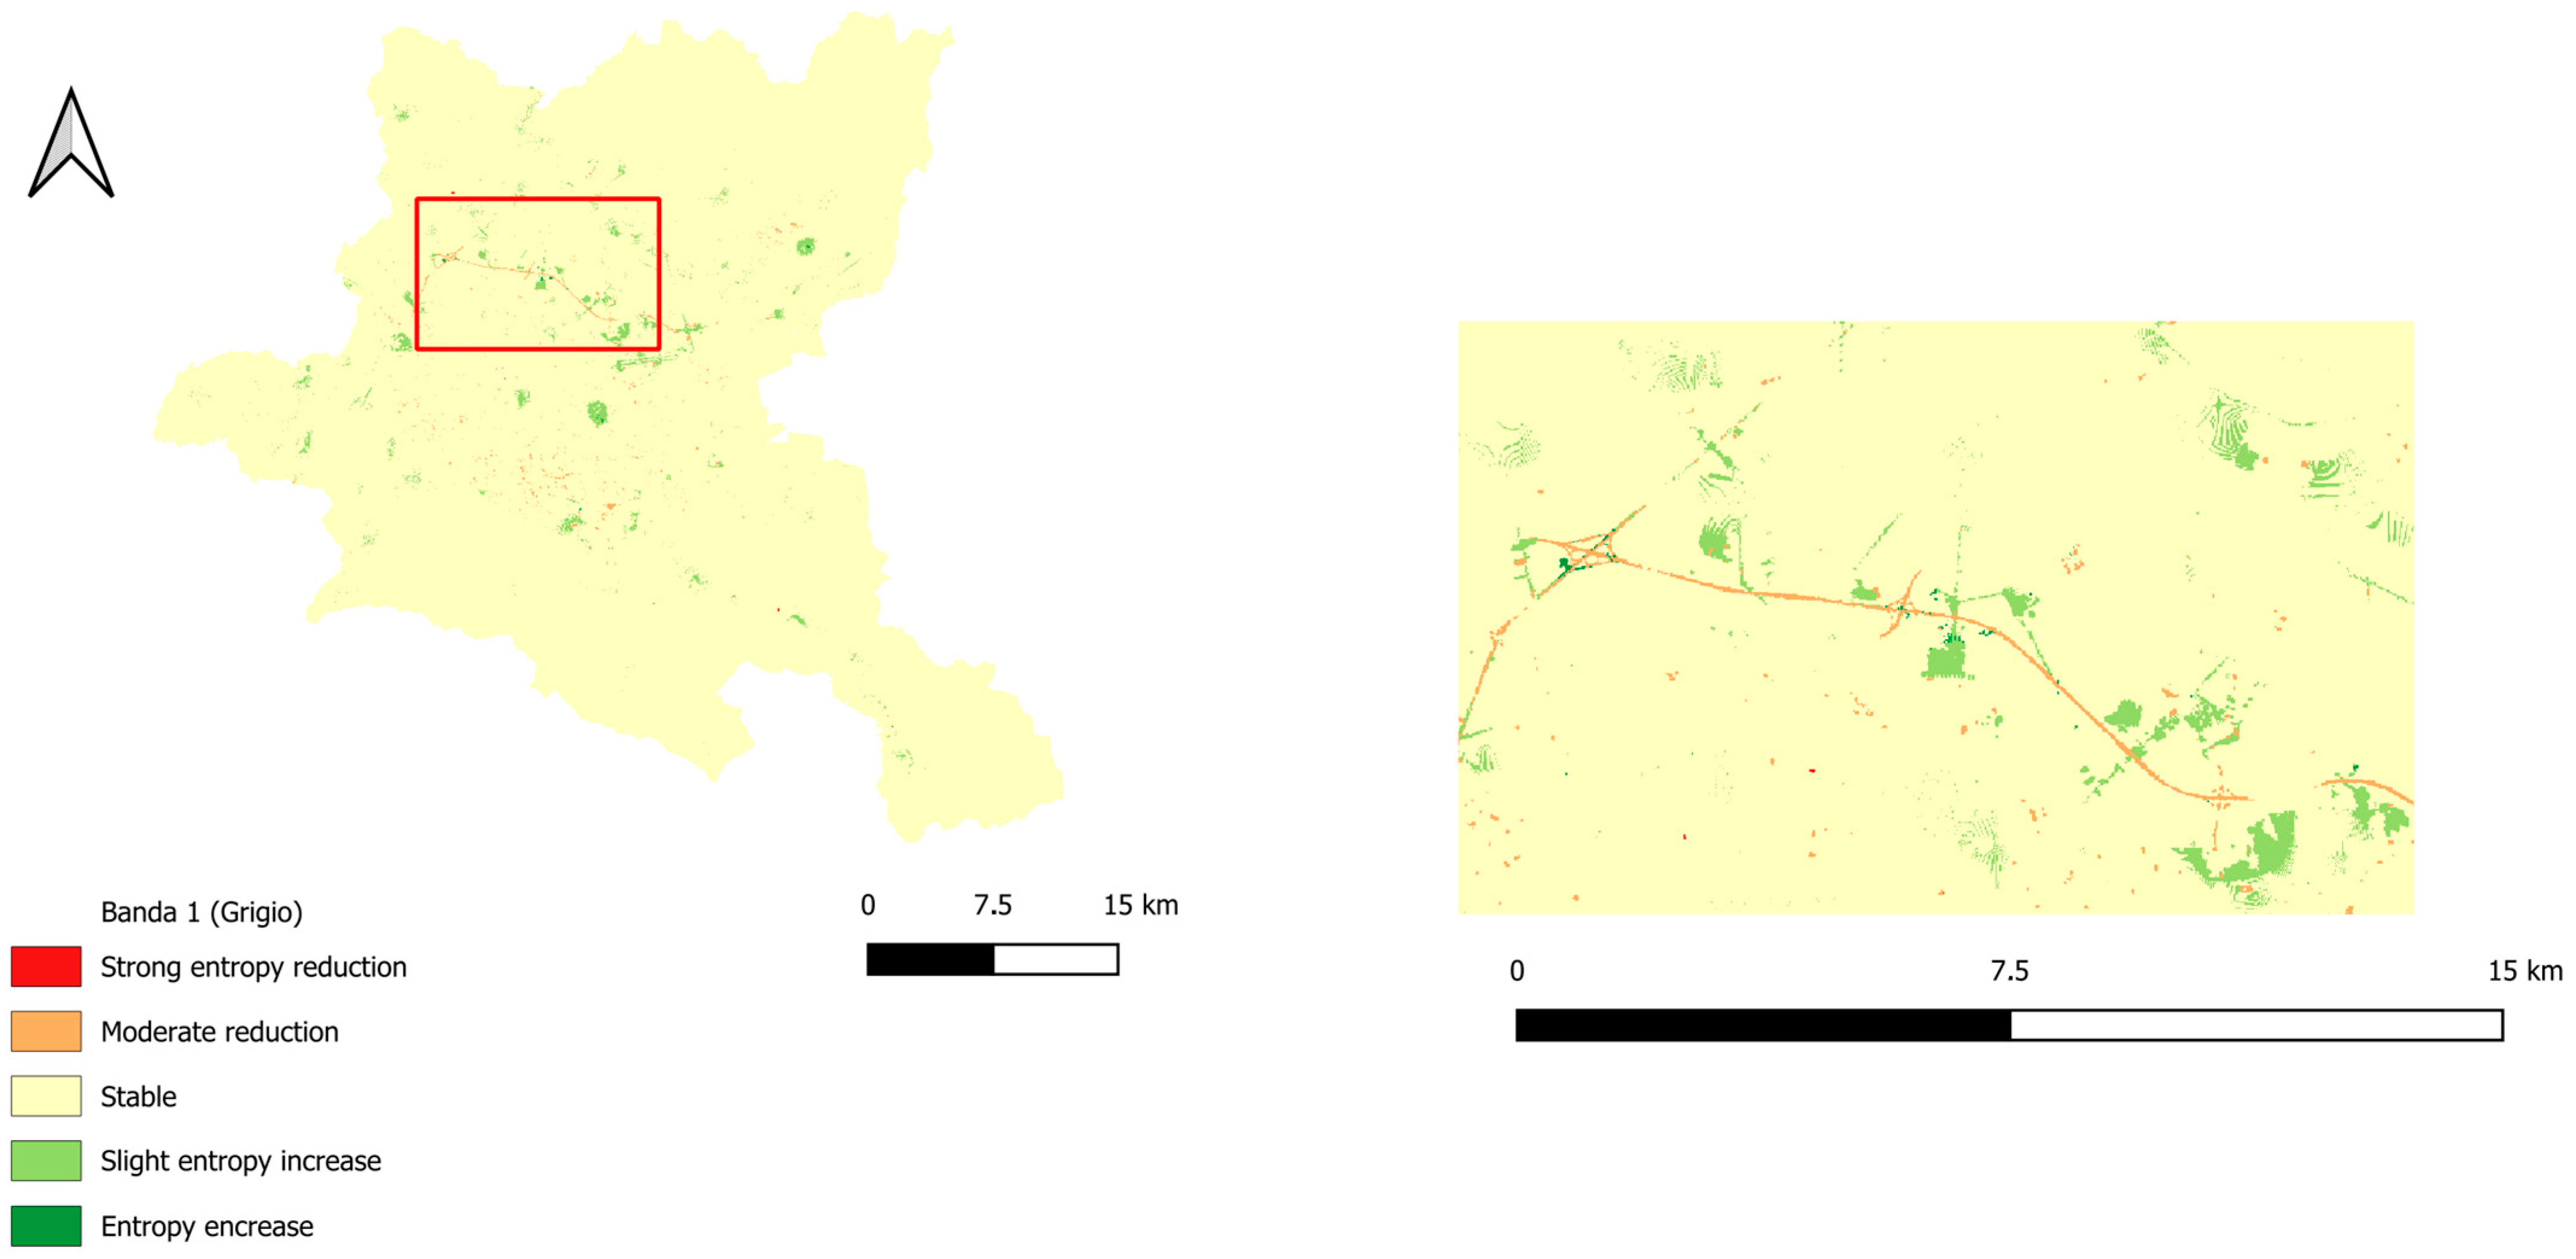
Entropy values in the Sofia Metropolitan Area (SfMA) increased markedly between 2015 and 2018, rising from 0.563 to 0.878, the largest change observed among the metropolitan areas studied. This increase reflects intensified spatial heterogeneity and fragmentation linked to rapid construction, densification, and infill development, particularly along the northern transport tangent and around Sofia Airport, where major business and infrastructure projects expanded (Figure 12).
A localized entropy reduction is visible where the Northern Speed Tangent was constructed, corresponding to the replacement of undeveloped land with new road infrastructure.
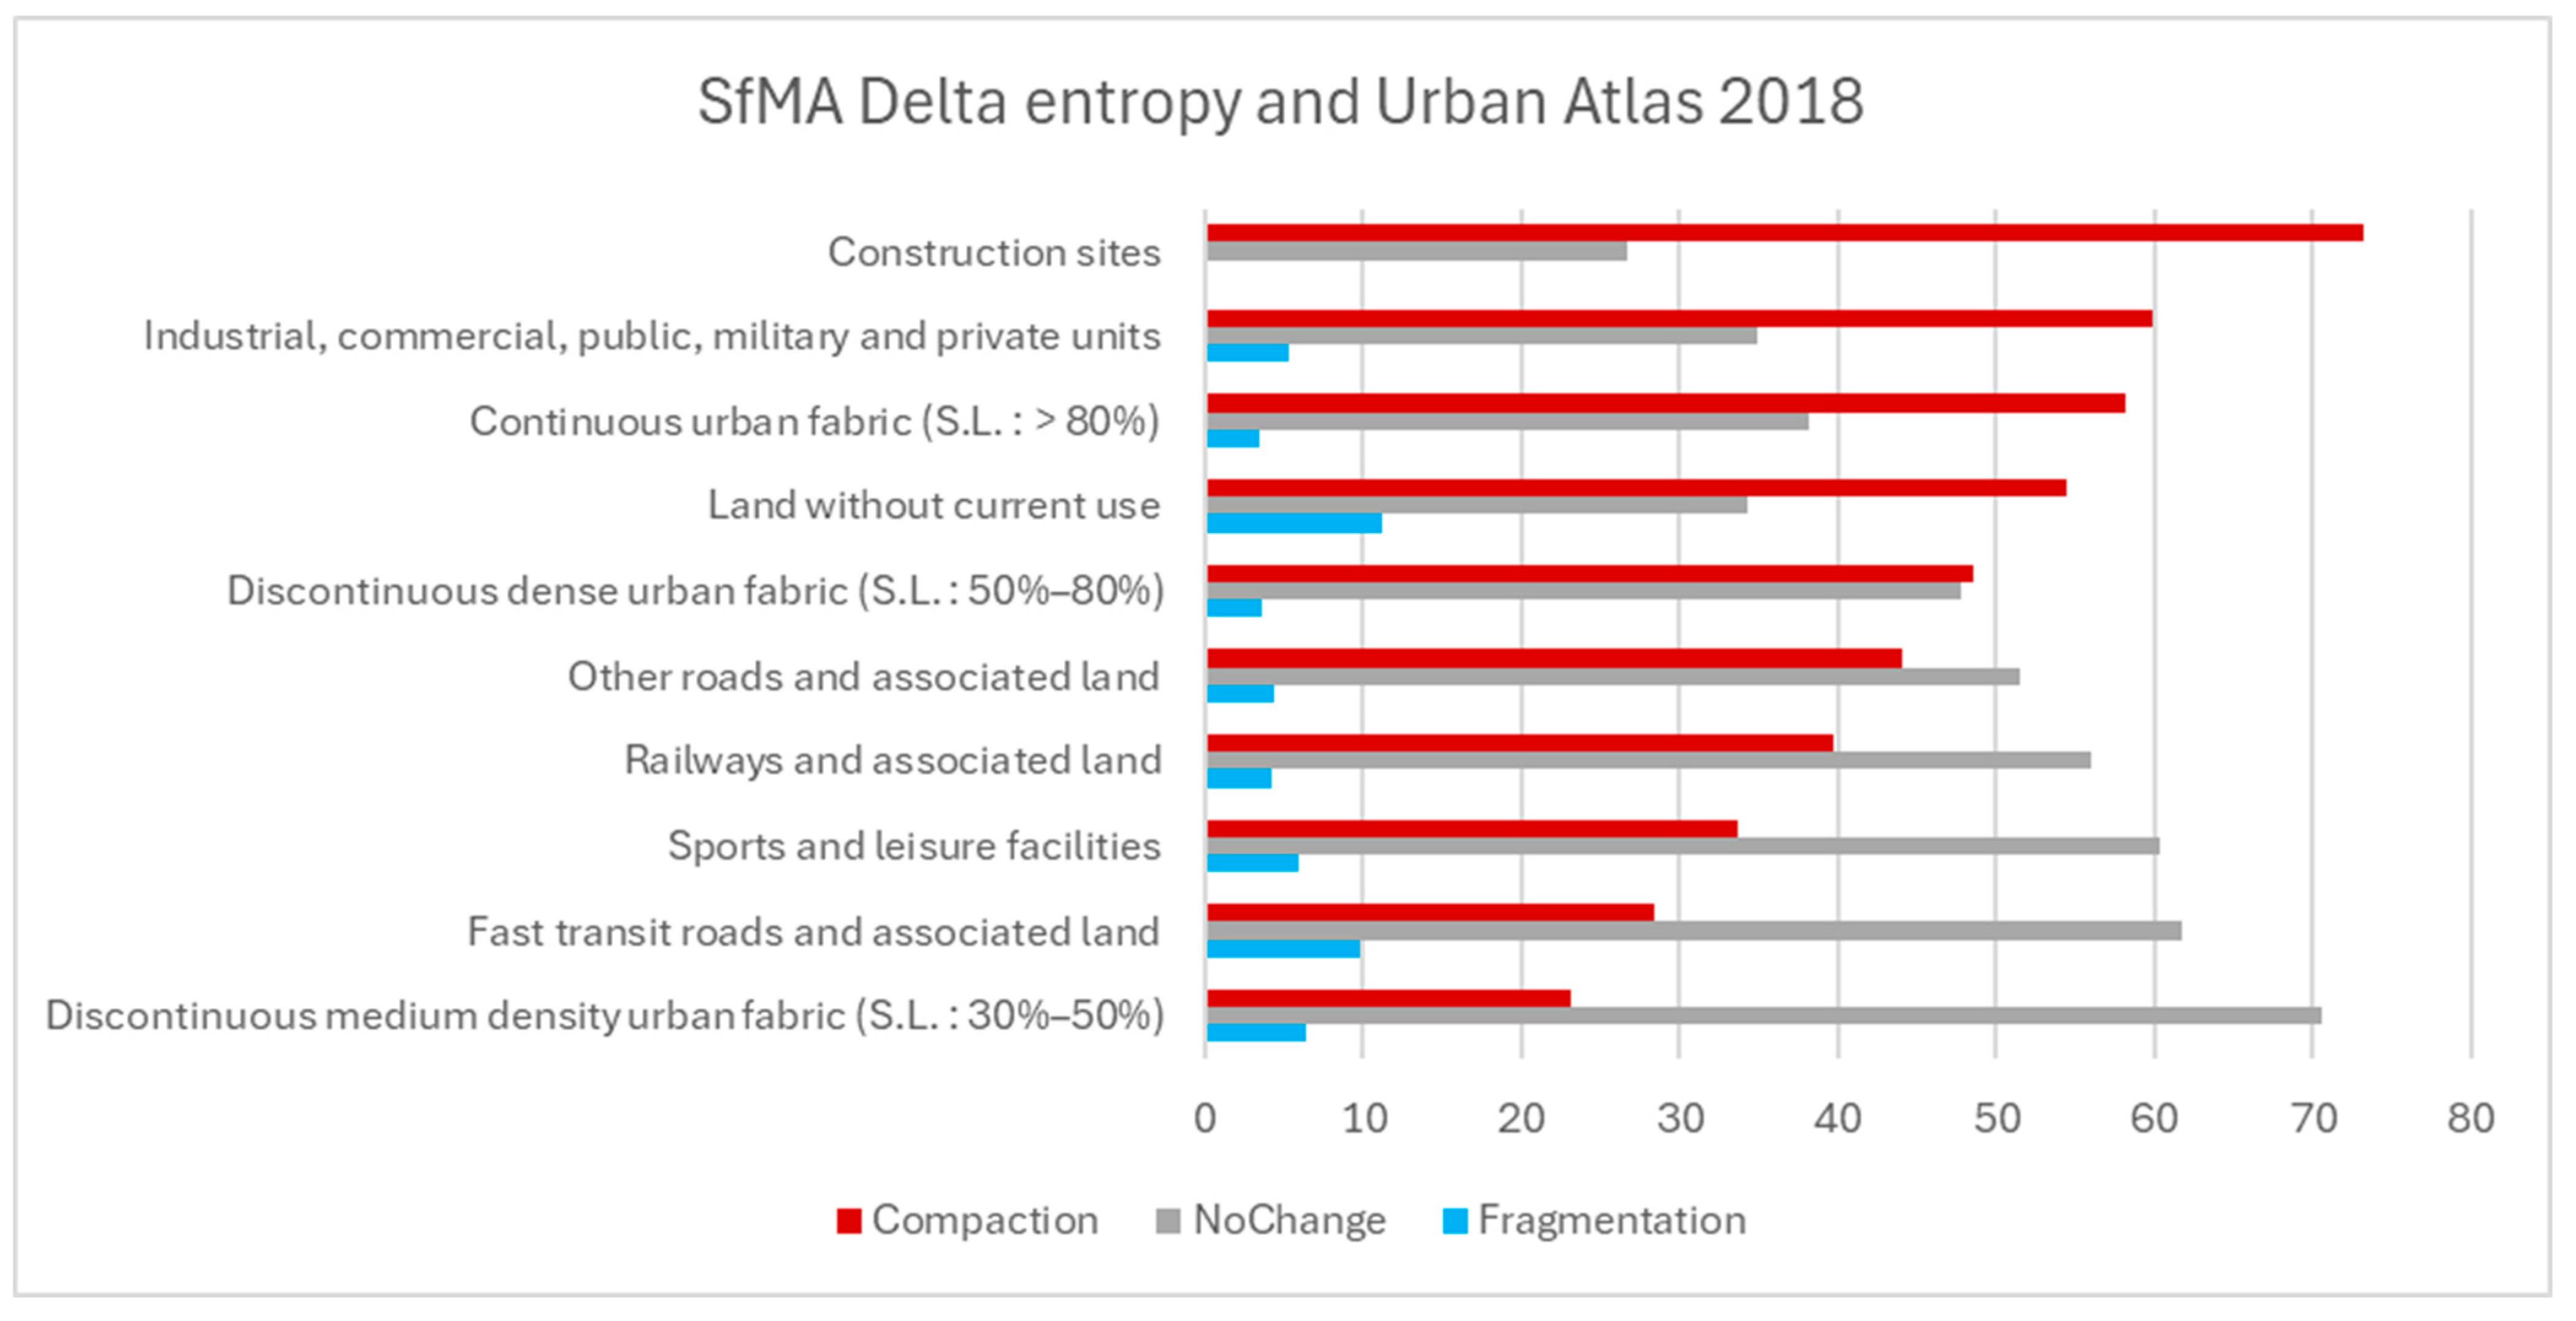
Analysis of entropy change across Urban Atlas classes (Figure 13) shows limited transformation in isolated structures and discontinuous low- and medium-density fabrics, where stability exceeds 70–80% in suburban and peri-urban zones. In contrast, the strongest compaction affects construction sites, industrial and commercial units, and continuous urban fabric. Construction sites exhibit the highest compaction rate (73.24%), with most of these classes showing values above 50%, reflecting active urban growth and infilling within developed or transitioning areas.
Fragmentation remains low overall, below 10% in most Urban Atlas categories. The highest value occurs in the airports class (13.62%), associated with industrial development inside the airport area. Fragmentation above 10% is also observed in discontinuous very-low-density fabric (S.L. < 10%) and land without current use.
Overall, SfMA shows strong densification and consolidation in transitioning and intensively urbanized zones, while low-density and peripheral areas remain largely stable. The limited entropy variation across most land-use classes suggests that morphological change, although significant in key sectors, is spatially selective rather than widespread.
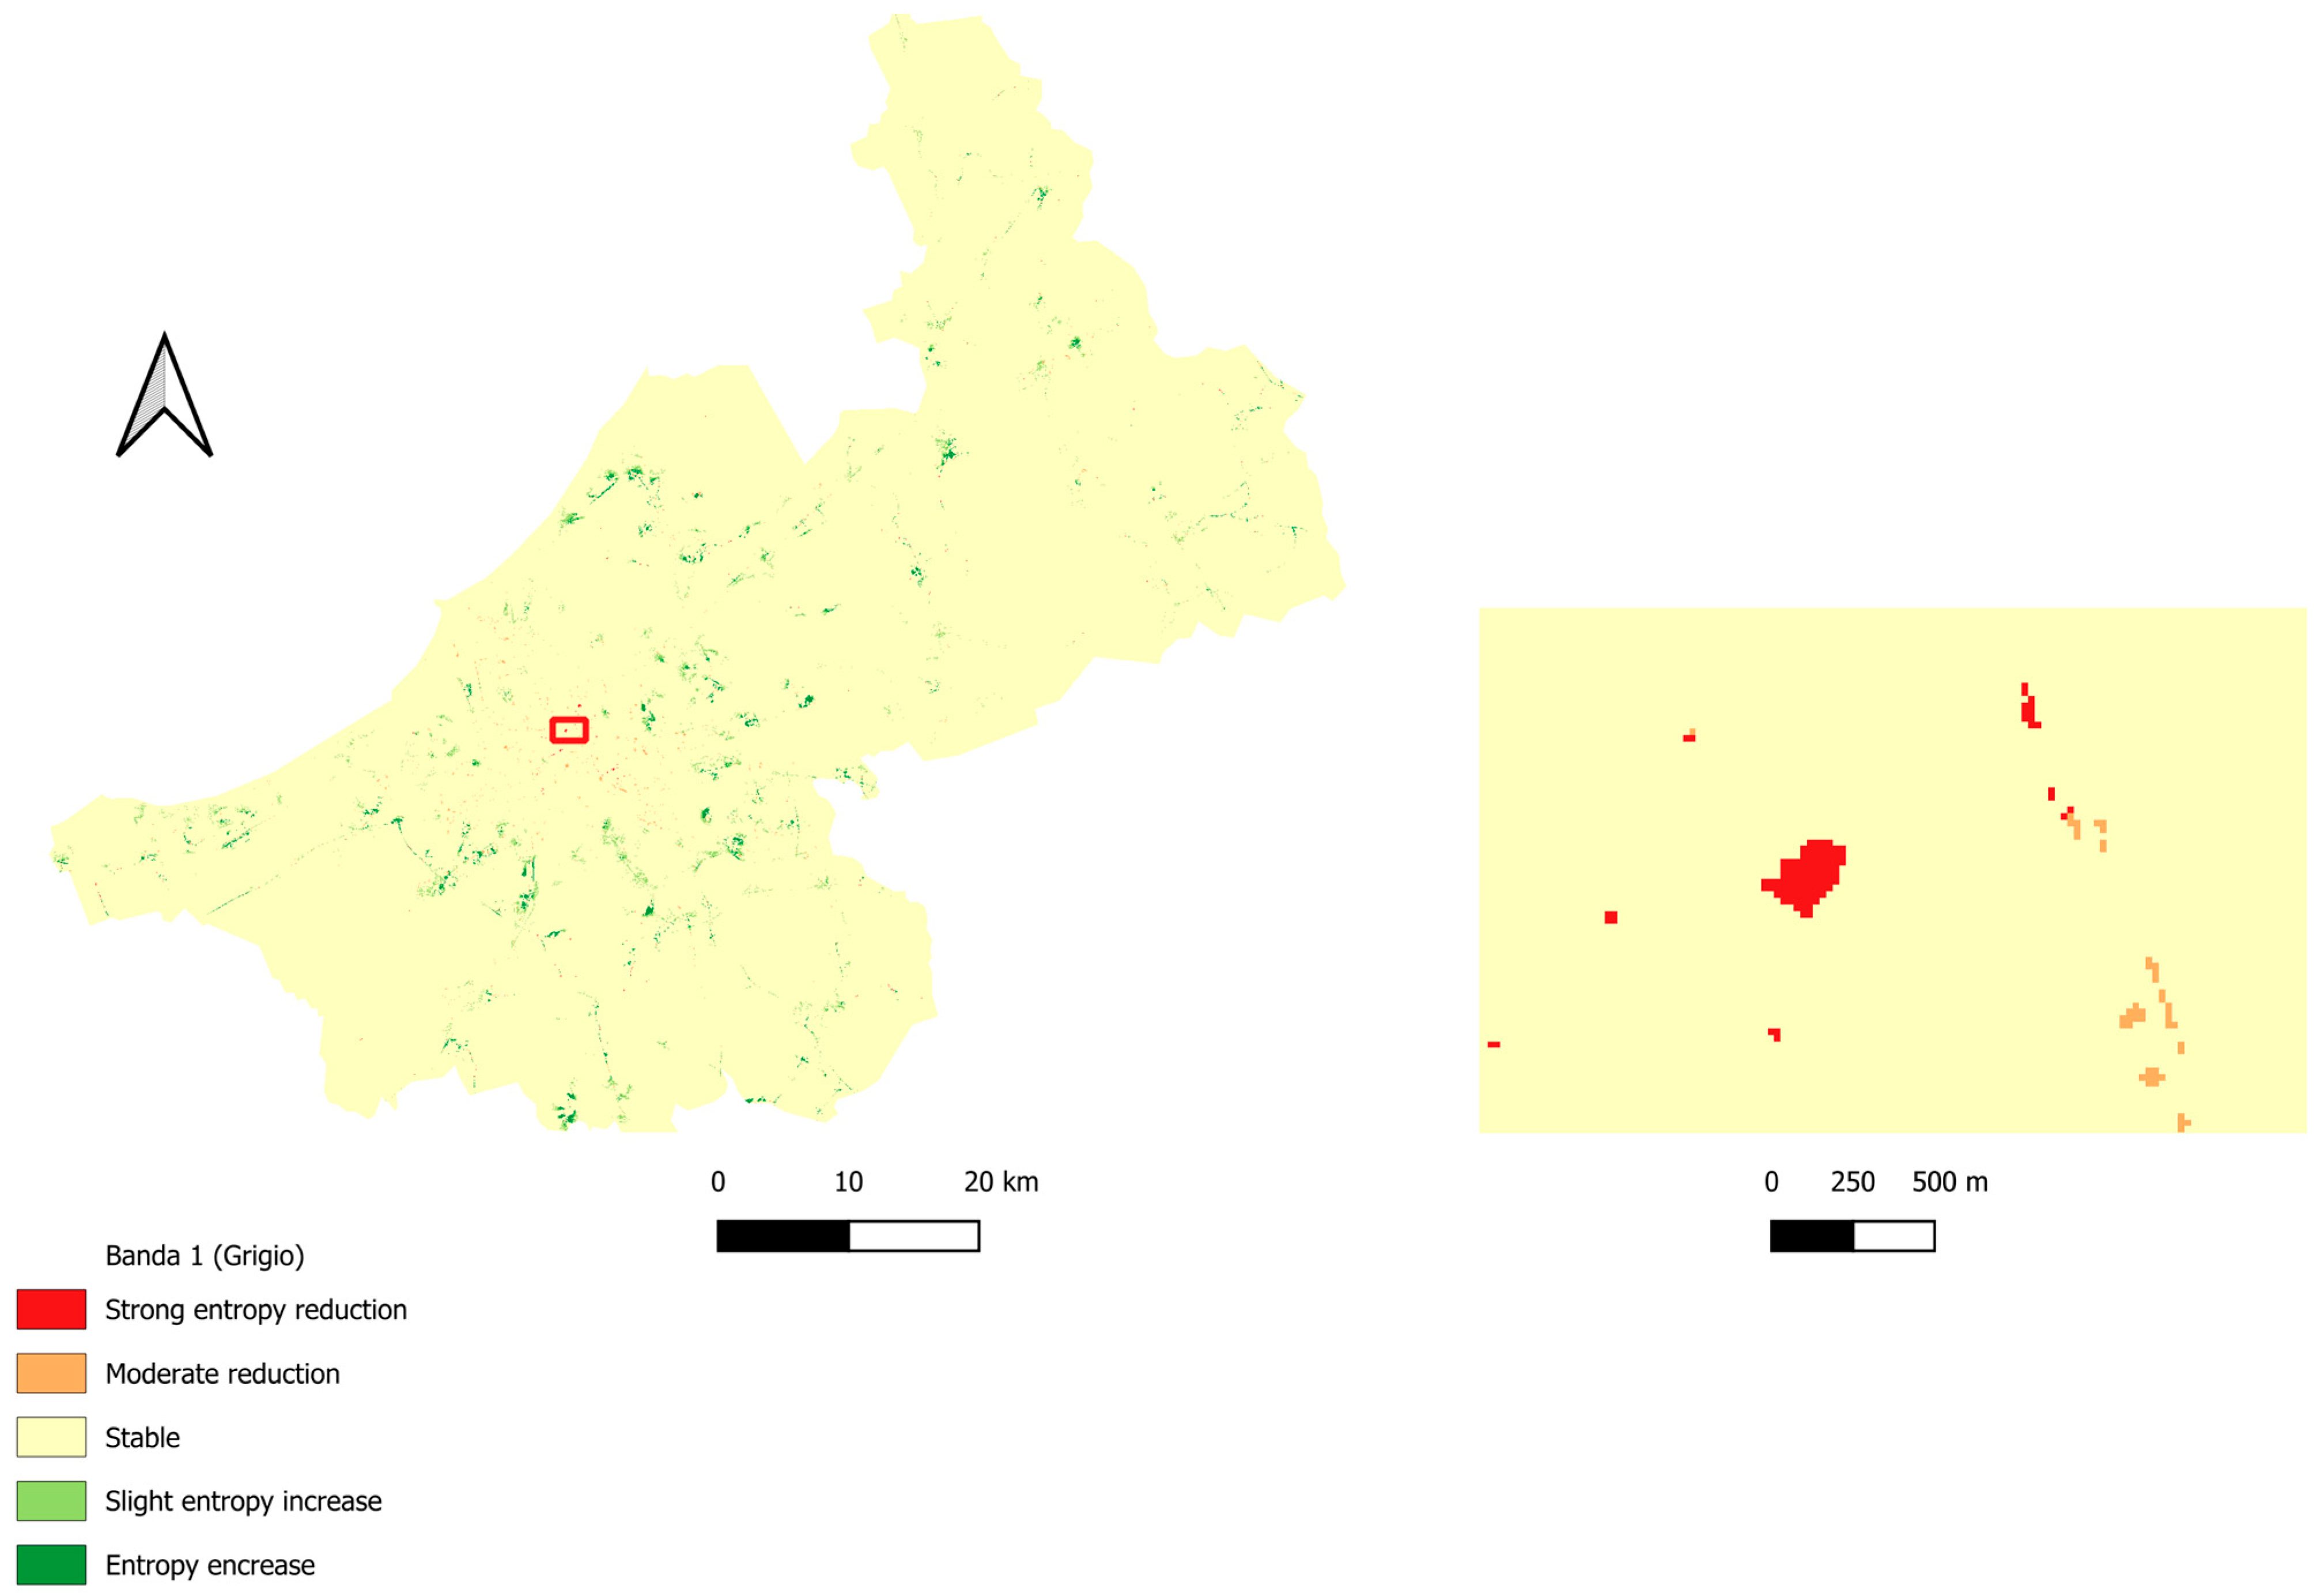
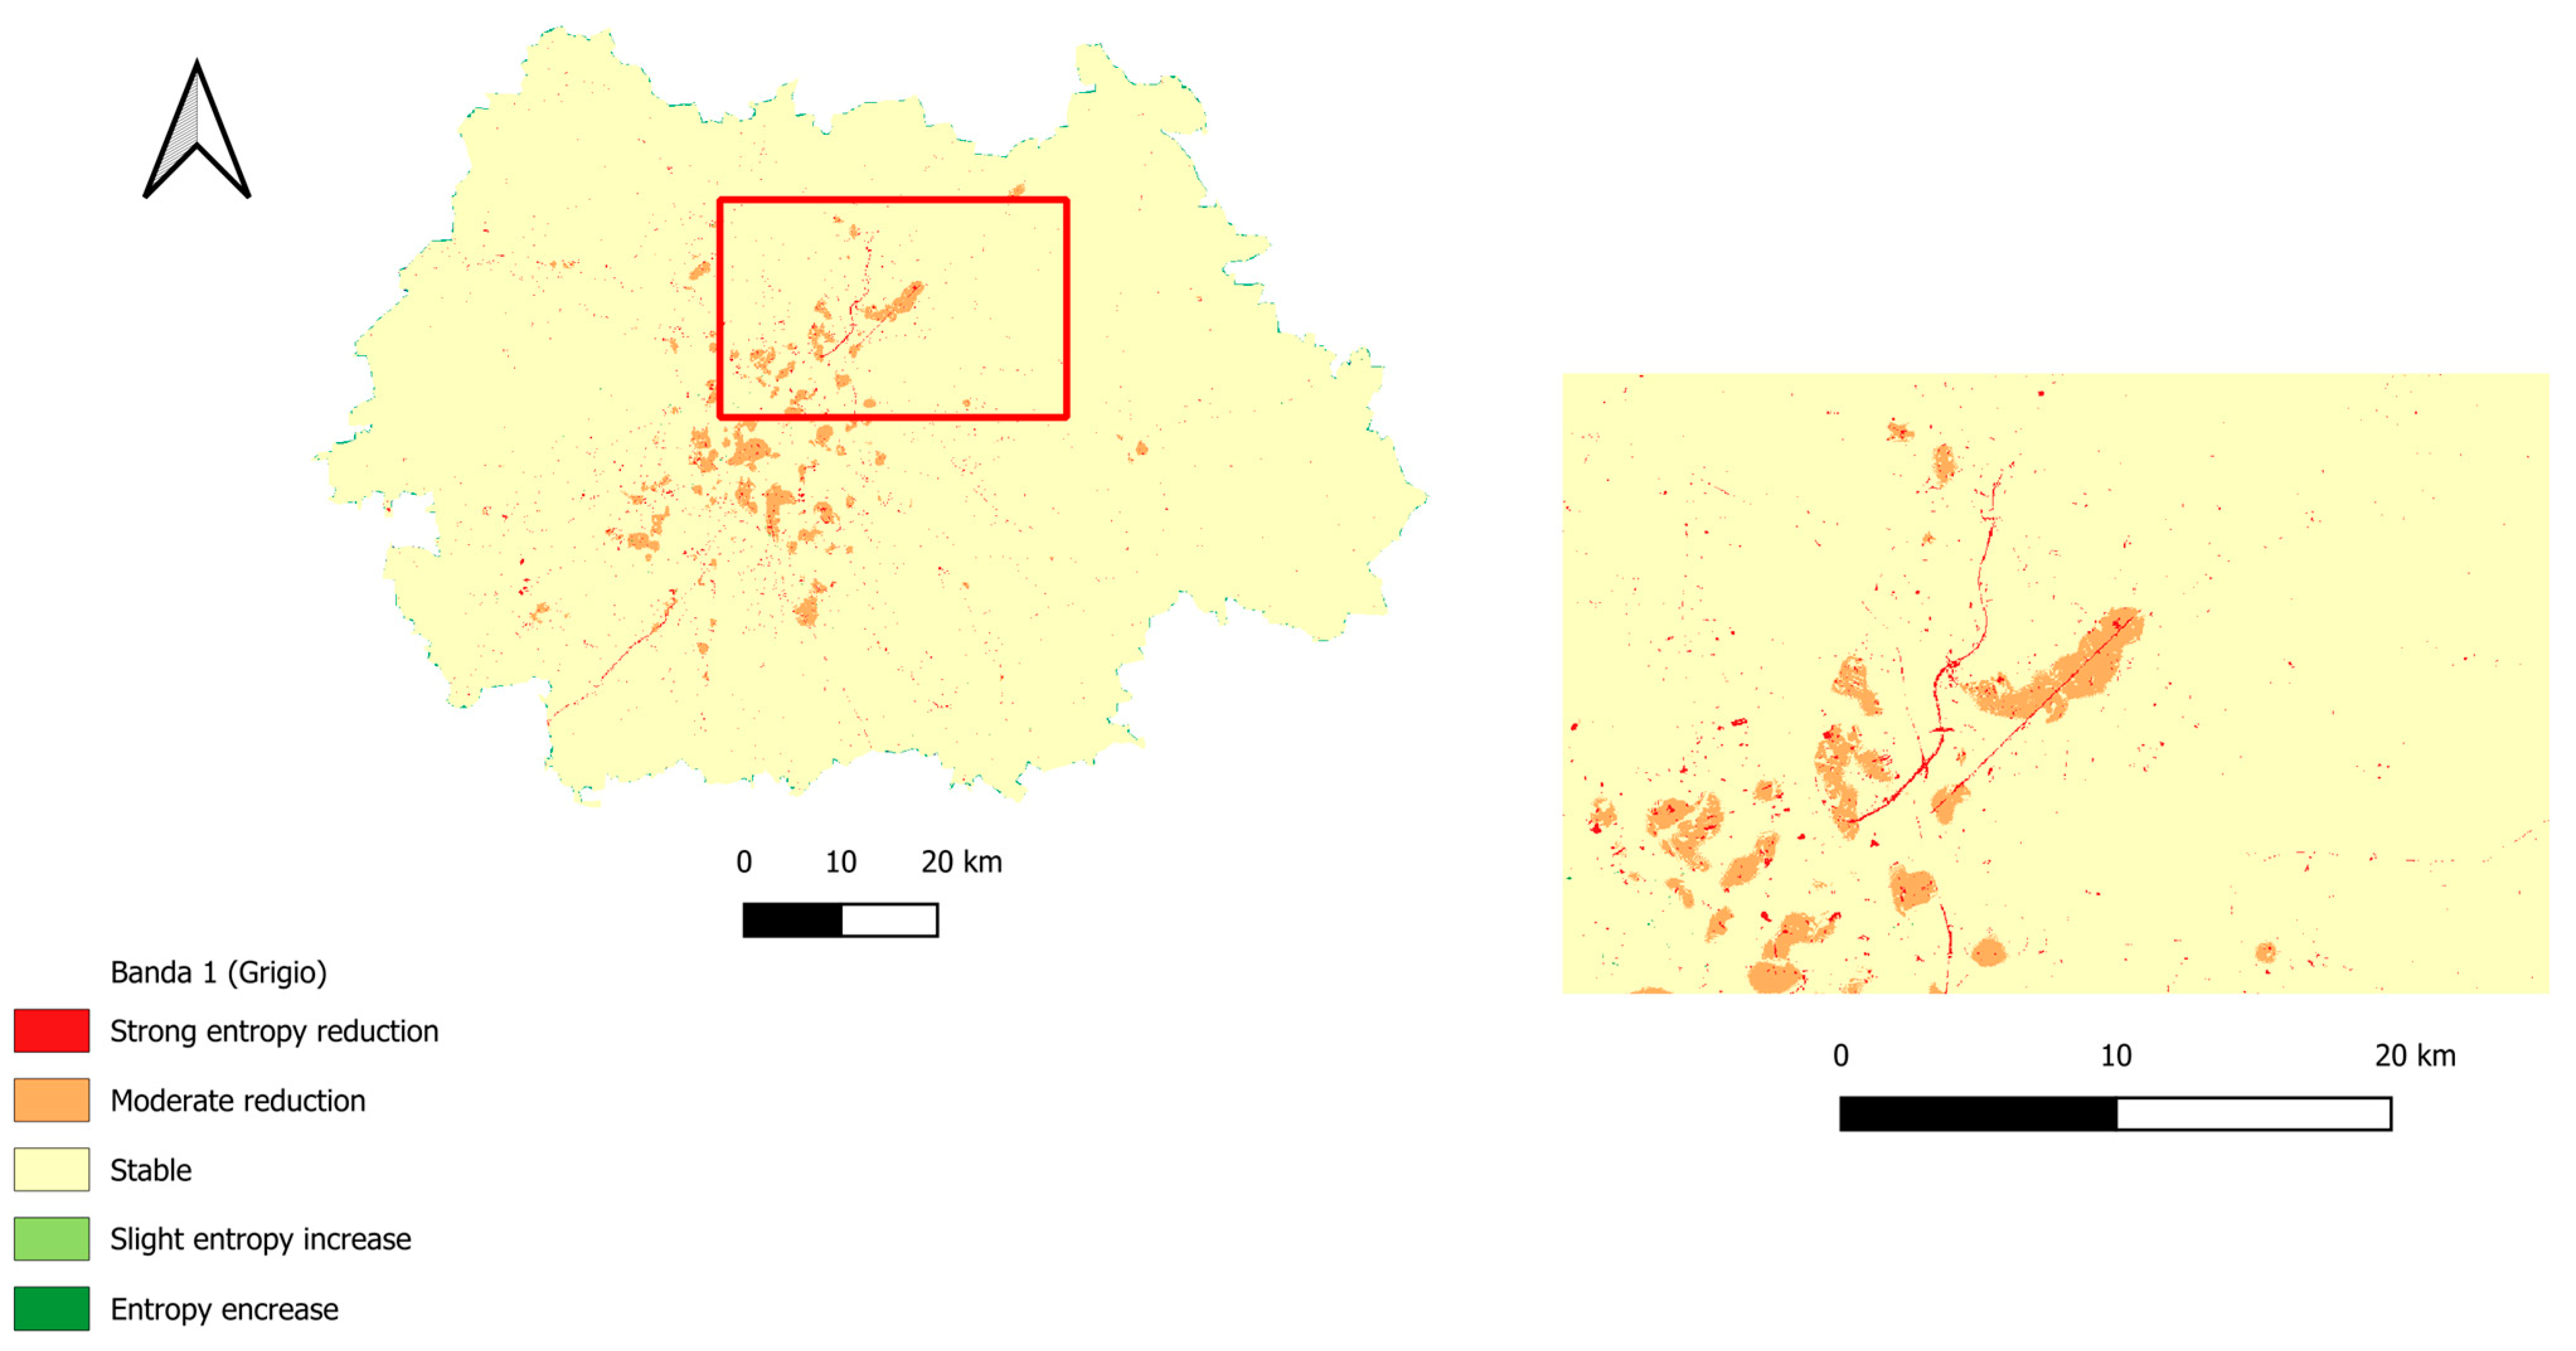
The Viseu Metropolitan Area (VMA) displays relatively high entropy values across large portions of its territory, distinguishing it from the other metropolitan areas (Figure 5). This pattern reflects the overall low degree of imperviousness in Viseu, the smallest city in the study. Between 2015 and 2018, the city shows entropy increases slightly around the central area, corresponding to less consolidated urban zones, with a moderate decrease in entropy, indicating an increase in impervious surfaces (Figure 14) consistent with the emergence of new impervious land observed in Figure 3, the area in the southeast of the center (zoom in Figure 14).
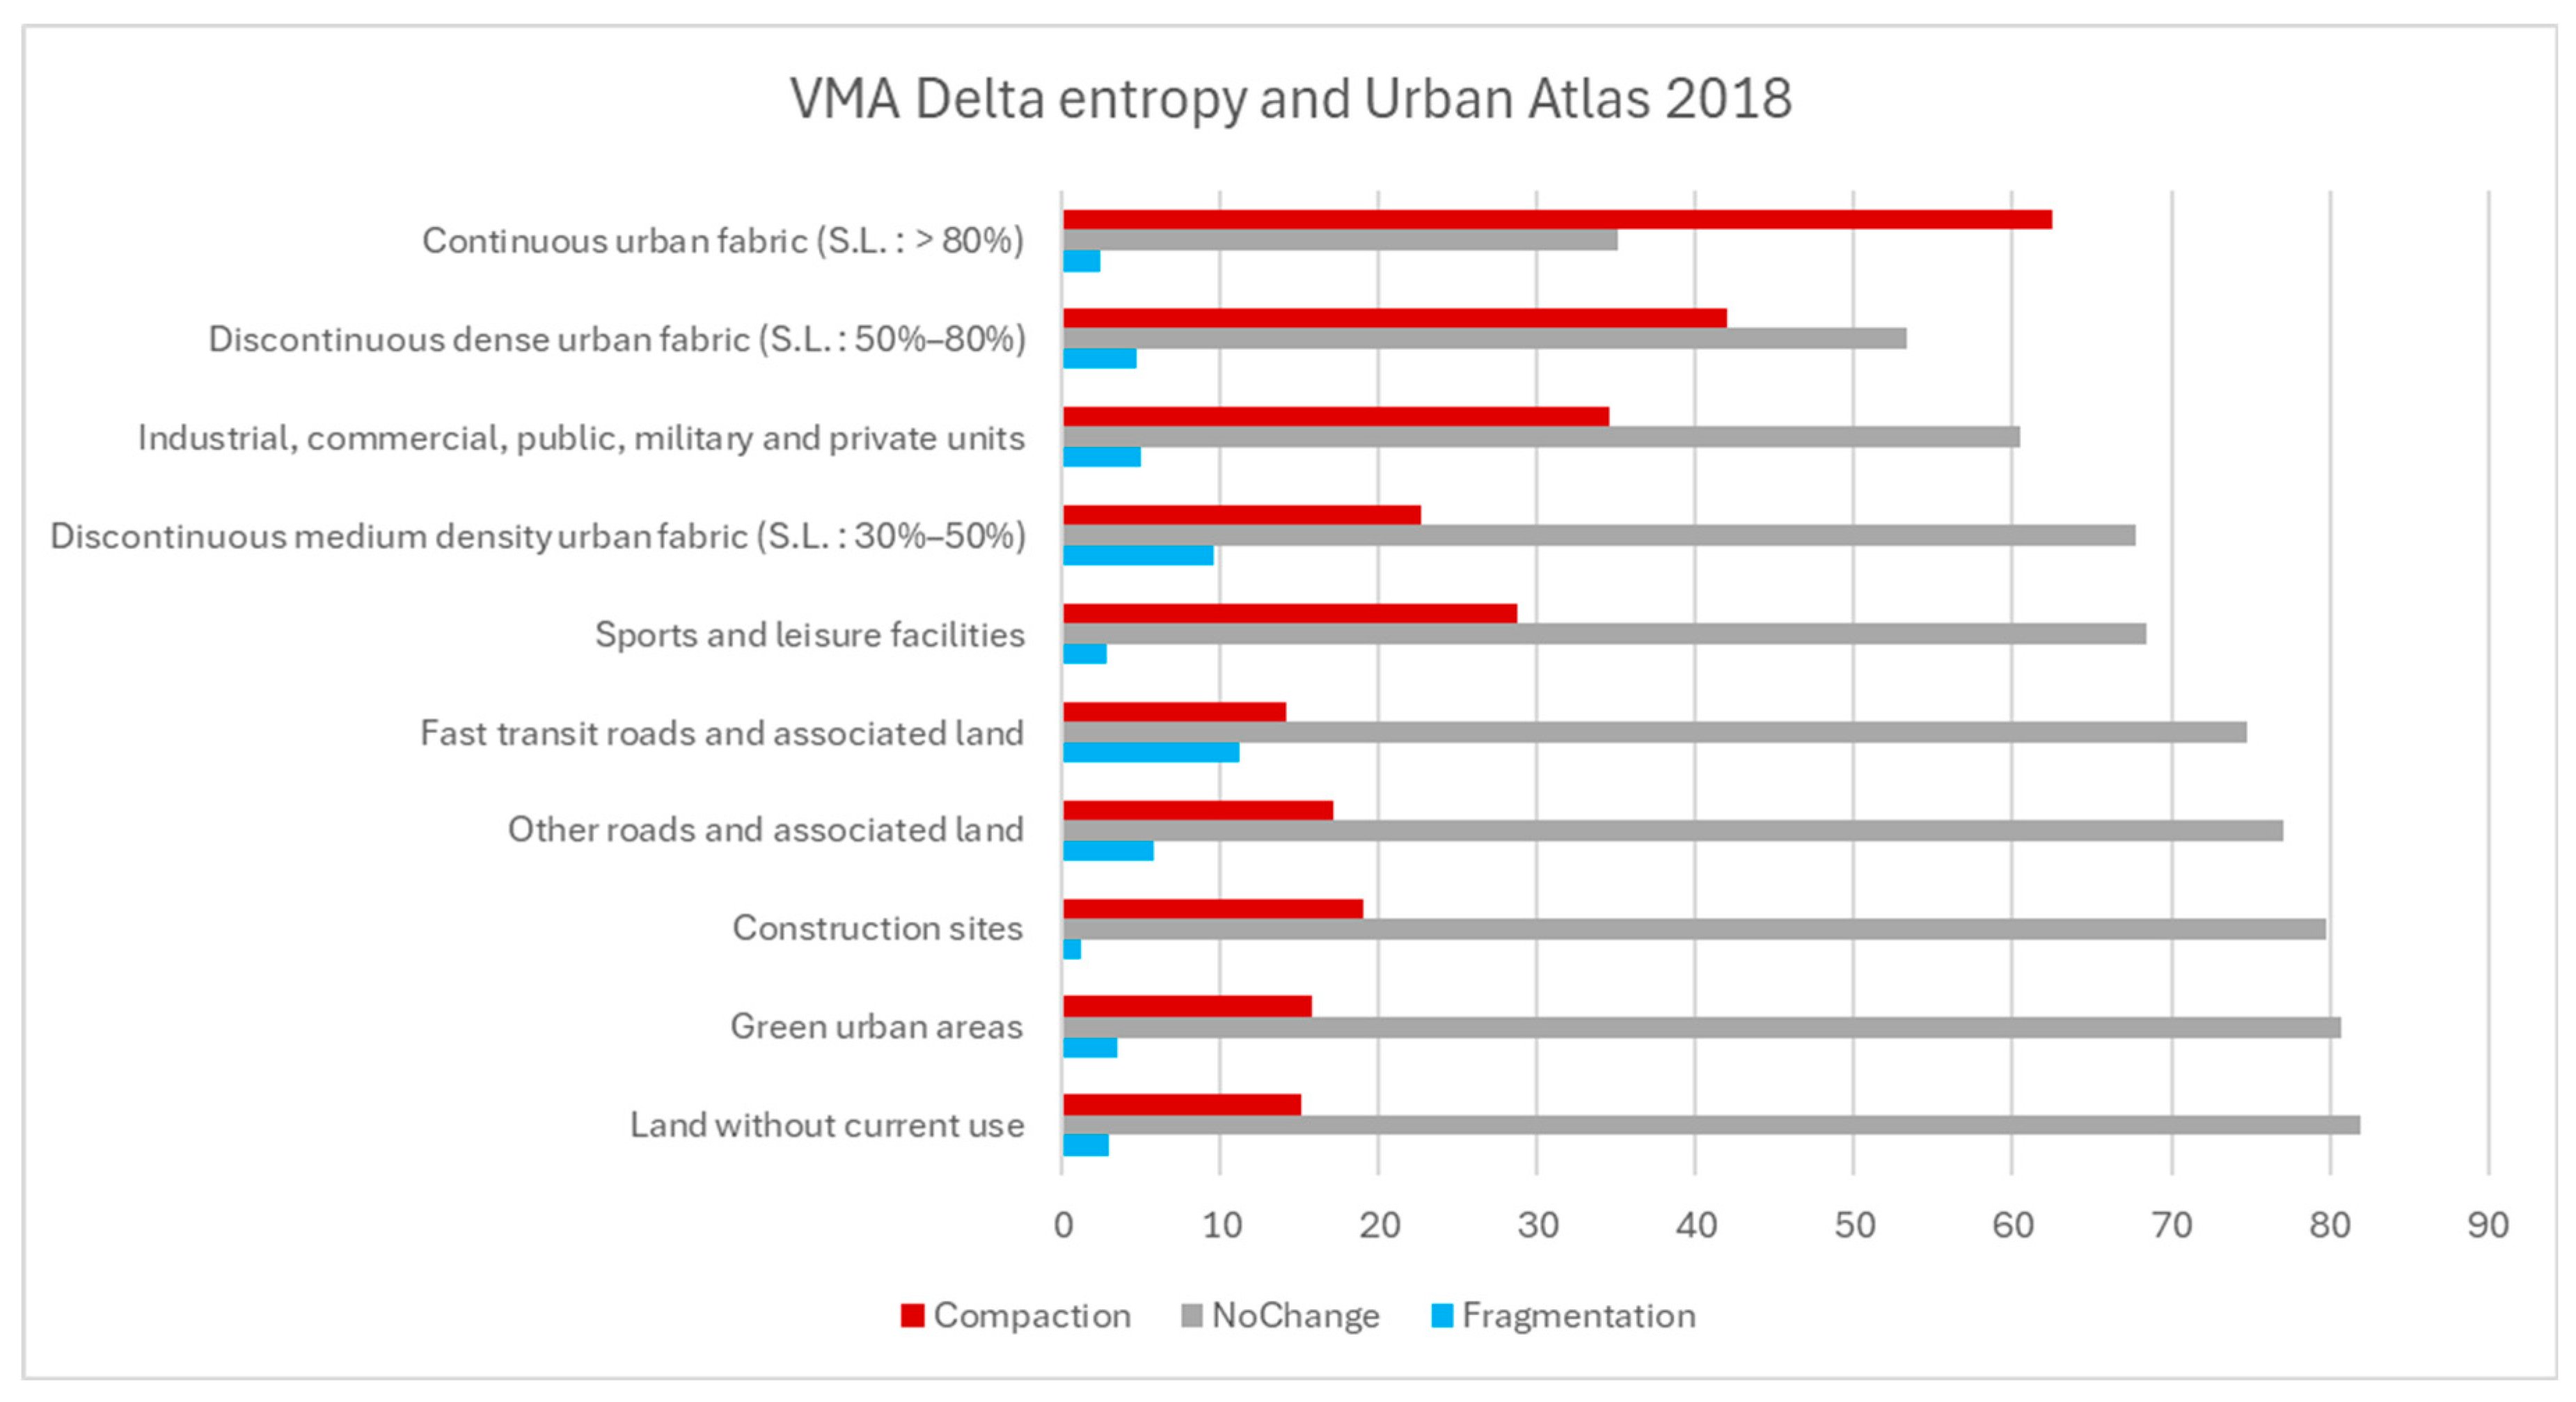
Analysis of Urban Atlas classes (Figure 15) shows that changes occur mainly through compaction in continuous urban fabric (S.L. > 80%), discontinuous dense fabric (S.L. 50–80%), and industrial, commercial, public, military, and private units, each with compaction values of around 35% or higher. Fragmentation, however, is more pronounced in fast transit roads and related land, discontinuous medium-density fabric (S.L. 30–50%), and discontinuous low-density fabric (S.L. 10–30%), each exceeding 10%. These results indicate that VMA has experienced compaction within the most urbanized areas—particularly in the city center and in residential and commercial zones—while its external boundaries remain largely stable. Urban development appears to progress mainly through intensification of already urbanized land rather than outward expansion.
The entropy change map for the Warsaw Metropolitan Area (WMA) shows that most of the region remained stable between 2015 and 2018, with notable zones of moderate entropy reduction in the central areas (Figure 16). These orange-colored patches indicate consolidation where previously fragmented structures became more spatially ordered. Scattered green areas of moderate entropy increase appear across both central and peripheral locations, reflecting localized development or infrastructure interventions that introduced additional spatial heterogeneity. The overall pattern suggests simultaneous but uneven processes of compaction and fragmentation, with consolidation dominating in Core and infrastructure-related zones. Strong entropy reductions (dark green) correspond mainly to newly developed highways and upgraded railway corridors.
A closer view of WMA (Figure 16, zoom) highlights extensive areas of entropy reduction forming contiguous bands, including the diagonal alignment of the S8 expressway, indicating infrastructure-driven compaction. Patches of entropy increase adjacent to these consolidating axes point to dispersed new construction or infill around transportation corridors.
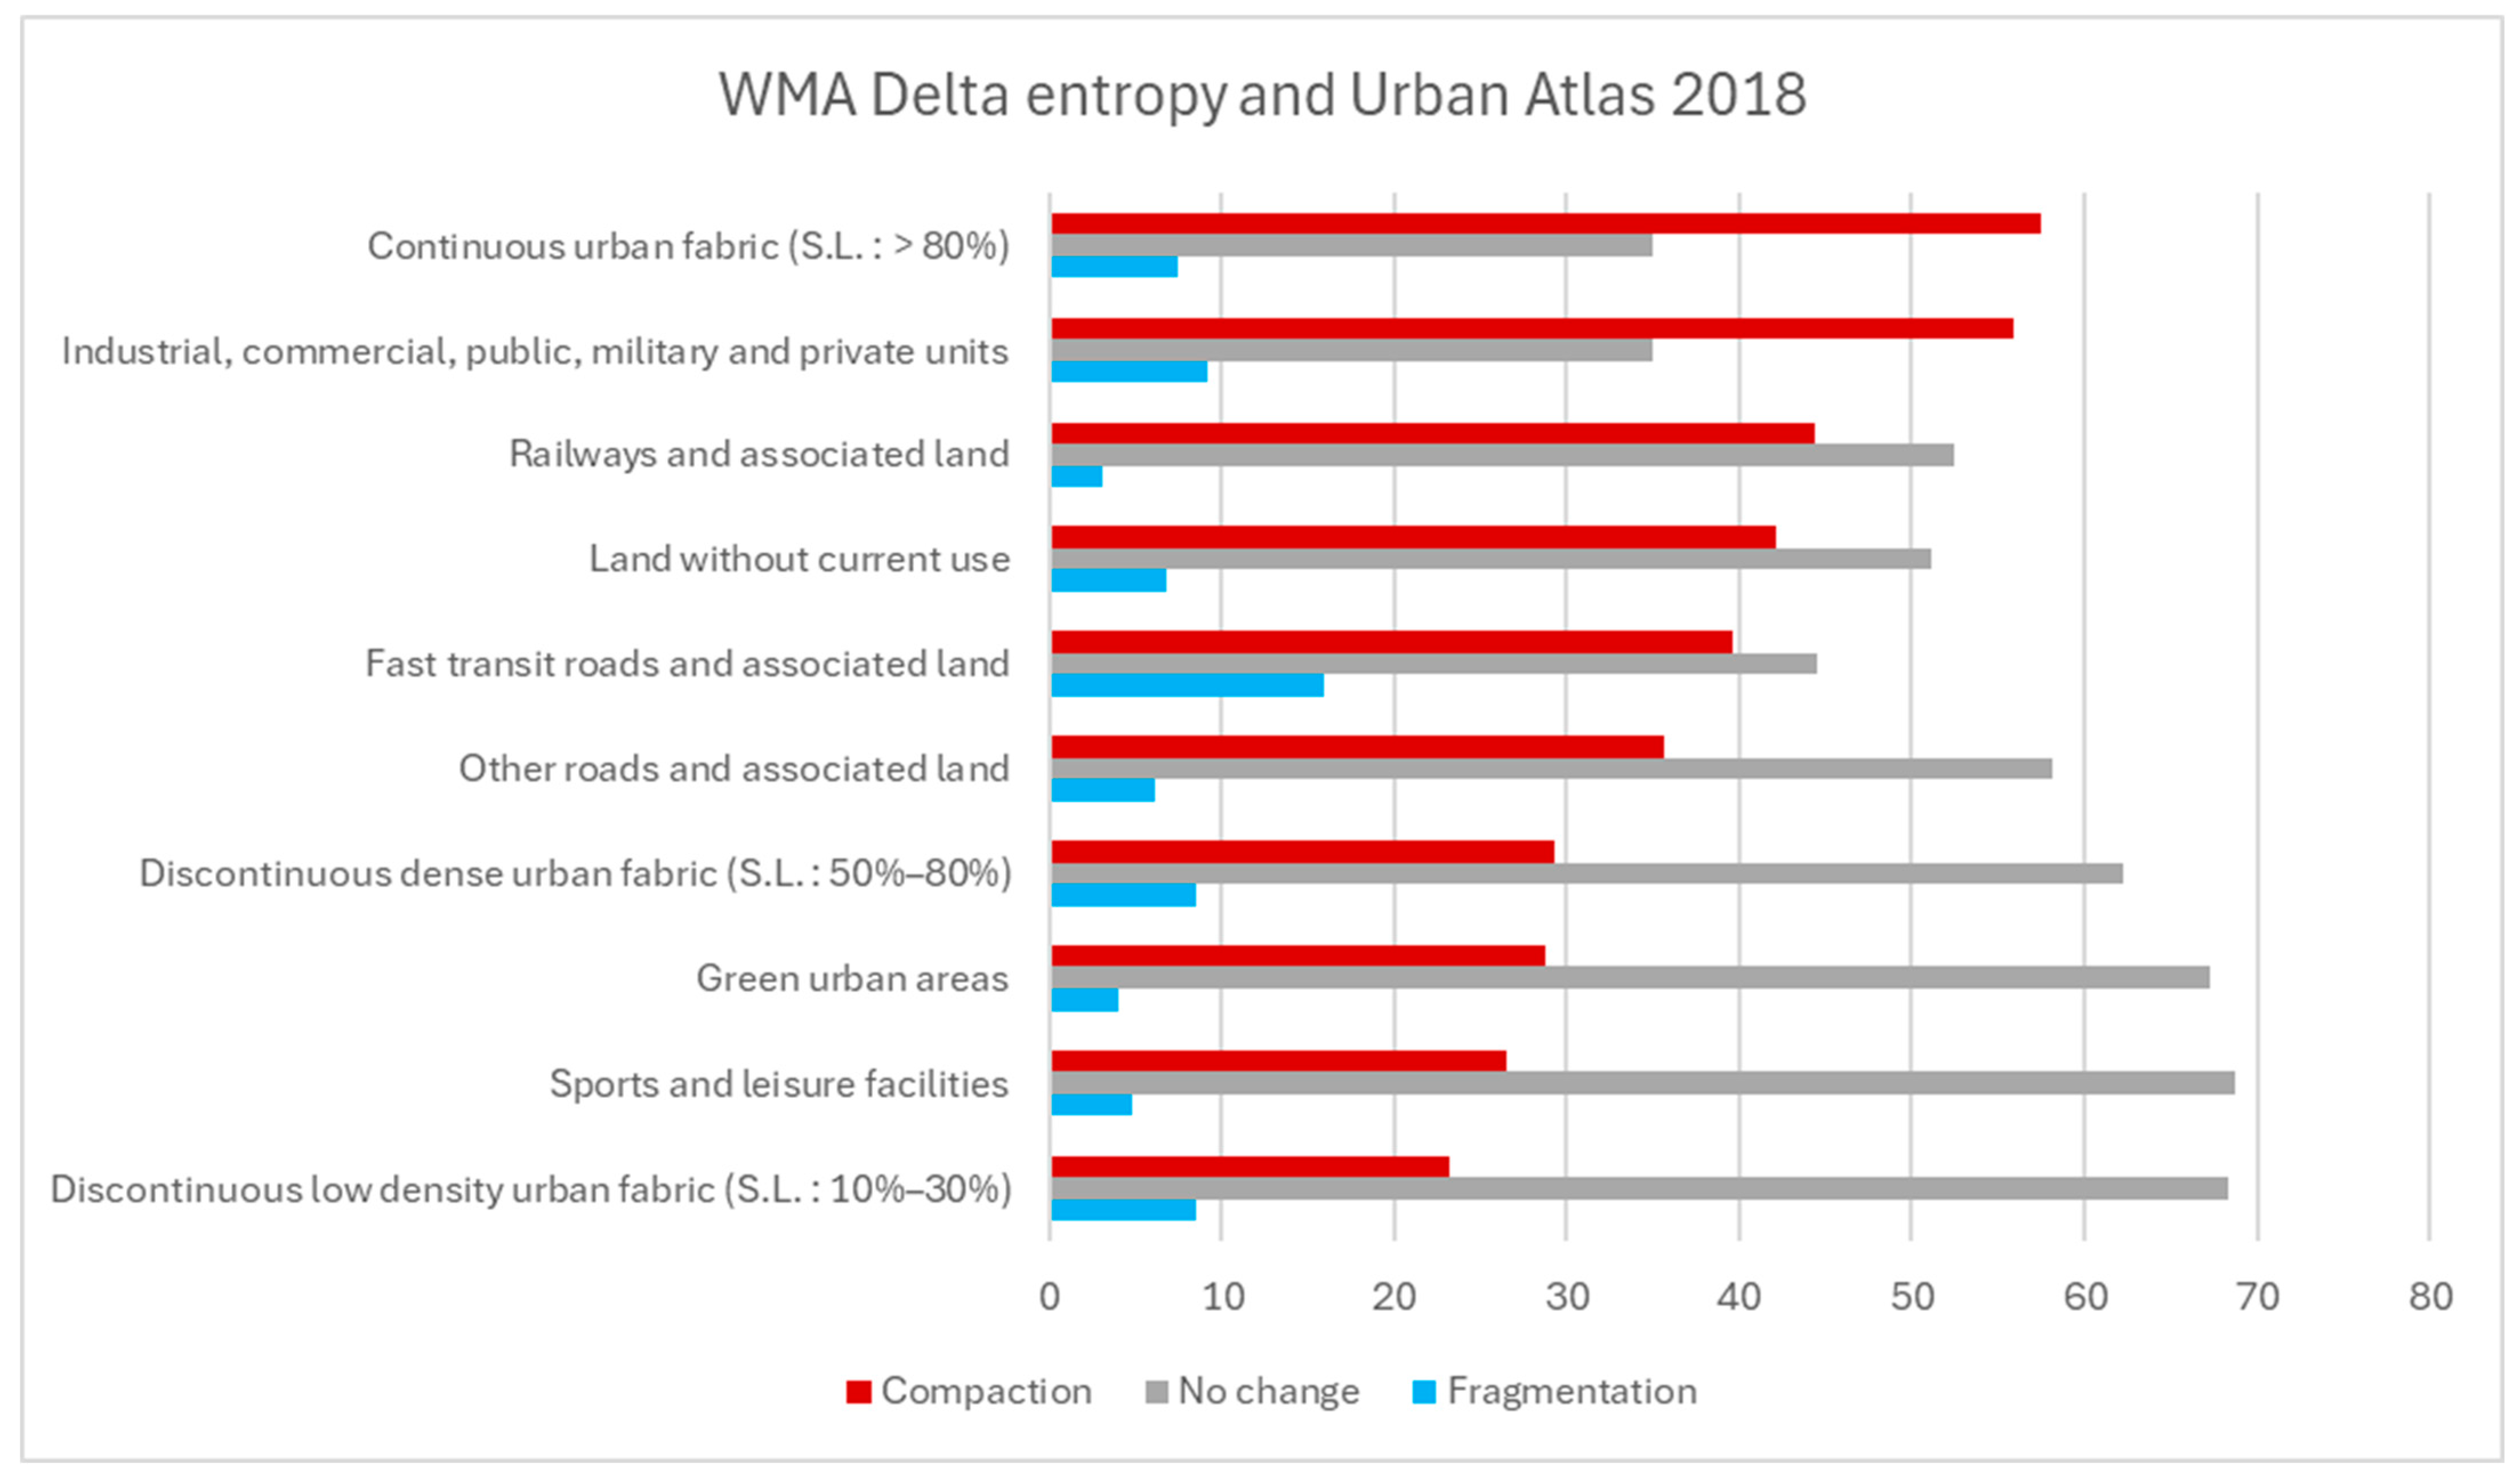
Urban Atlas-based analysis (Figure 17) shows that most land across classes experienced no change. Where changes occurred, compaction was more prevalent than fragmentation. Continuous urban fabric (S.L. > 80%) displays the highest compaction (57.55%), followed by industrial, commercial, public, military, and private units (55.88%). Railways and associated land also show strong compaction (44.43%) with little fragmentation (3.08%). Land without current use demonstrates 42.15% compaction, consistent with redevelopment or consolidation. Fast transit roads exhibit the most complex changes, with 39.67% compaction but also the highest fragmentation (15.87%), reflecting expanding infrastructure networks. Among residential classes, discontinuous dense urban fabric records 29.23% compaction, while green urban areas reach 28.80% with minimal fragmentation. Suburban categories such as discontinuous low-density fabric and sports and leisure facilities show moderate compaction and low fragmentation, indicating selective densification without extensive structural disruption.

4. Data Sharing After FAIR Data Management Principles

This work applies the FAIR data principles (Findable, Accessible, Interoperable, Reusable) [8,9] as a foundation for its data management framework, ensuring dataset FAIRness is increasingly recognized as essential for effective research dissemination and scientific transparency [8,10]. Findability and Accessibility facilitate wider data use, while Interoperability supports integration within distributed geospatial infrastructures. Reusability enables replicability and long-term value creation, aligning with the objectives of initiatives such as FPCUP, which emphasize wider uptake of methods and data products.
Within this framework (Action 2021 2 38, SGA#20 project “LAND”, Specific Grant Agreement N°20–2022/SI2.879178 SI2.879180/20), the FPCUP geoportal was developed to comply with FAIR requirements. Built on a GeoServer–GeoNode architecture, it supports the publication of datasets accompanied by standardized metadata. Geospatial information is served via OGC-compliant WMS and WFS services, while metadata follow ISO 19115 [11] for spatial datasets and Dublin Core for documentation. A comprehensive list of all the layers served is reachable at the following address: https://landscapemetrics.eu/geoserver/web/wicket/bookmarkable/org.geoserver.web.demo.MapPreviewPage?1 (accessed 8 April 2026); WMS (view) services are available at https://landscapemetrics.eu/geoserver/ows?service=WMS&version=1.3.0&request=GetCapabilities (accessed 8 April 2026); and download services (WFS) are available at https://landscapemetrics.eu/geoserver/ows?service=WFS&acceptversions=2.0.0&request=GetCapabilities (accessed 8 April 2026). Dataset download can also be executed (both for raster and vector layers) directly from the user interface of the geoportal, while visualizing the information of the single layer. In the case where download (WFS) services are not available, the layers are made available for download upon request from the respective national research centers. All components of the platform (GeoServer, GeoNode, GeoWebCache, OpenLayers, Django CMS, Pycsw) are open source, ensuring transparency and reproducibility. The geoportal, accessible at https://landscapemetrics.eu/catalogue/ (accessed 8 April 2026), was developed by SRTI BAS with GAP Consult Ltd., supported by a cross-partner working group focused on data dissemination and visual communication.
Because data availability differs between countries, landscape metrics were computed using harmonized Areas of Interest (AOIs). Outputs include raster layers representing metric values and vector datasets defining AOI boundaries. Processing was carried out by SRTI BAS, and resulting products were delivered either as files or as interoperable WMS services, then made accessible through a local Spatial Data Infrastructure (SDI). The geoportal currently hosts 108 resources: 83 datasets (14 remote services, 21 vector layers, 48 raster layers), 15 maps, seven documents, and one geostory. The MSPA and Entropy maps for 2015 and 2018 are directly accessible at:
All datasets are released under the Open Data Commons Attribution License (ODC BY 1.0), requiring attribution to the data authors.

5. Discussion

The integration of Morphological Spatial Pattern Analysis (MSPA) and entropy metrics proved effective for characterizing urban change and fragmentation across the six metropolitan areas examined (Milan, Sofia, Riga, Warsaw, Viseu, Santander). The results confirm the usefulness of Copernicus Land Monitoring Service (CLMS) products for analyzing urban sprawl, ecological connectivity, and structural landscape transformations.

5.1. Temporal Limitations and Interpretation of Short-Term Change

The objective of the analysis is not to reconstruct decade-scale or structural trajectories of urban form, but rather to demonstrate how a Copernicus-based methodological workflow can detect short-term morphological signals of change within a harmonized, reproducible framework.
The 2015–2018 period analyzed in this study represents a short temporal window relative to the typical pace of urban morphological transformation, and the results should therefore be interpreted as short-term structural signals rather than as long-term trajectories. While the MSPA- and entropy-based indicators successfully highlight localized patterns of compaction, fragmentation, or internal reorganization, we acknowledge that some observed variations—particularly in metropolitan areas with low initial levels of imperviousness—may fall within the sensitivity range or uncertainty of the Imperviousness Change product. We also acknowledge that some of the percentage-based changes detected in cities with low initial imperviousness—such as Viseu—may fall within the uncertainty range of the Imperviousness Change product. This is particularly relevant given the known noise levels of the 20 m change grid and the differing native resolutions of the 2015 (20 m) and 2018 (10 m) imperviousness layers, which can affect the detectability of small or highly localized modifications. For this reason, certain fluctuations may reflect detection sensitivity rather than meaningful structural transitions. Nevertheless, percentage-based indicators remain essential for enabling a consistent comparison across metropolitan areas of very different sizes, densities, and morphological structures; absolute values alone would not allow cross-city analysis within a harmonized Copernicus-based framework.
As such, these metrics should not be interpreted as statistically significant trends, but rather as qualitative markers of spatial dynamics detectable within the available Copernicus data. Future updates of the CLMS imperviousness layers, providing longer time series, will enable more rigorous temporal assessments and more robust evaluations of the persistence and directionality of the morphological processes observed here.

5.2. Limitations Related to the Imperviousness Change Layer

A methodological limitation concerns the heterogeneous spatial resolution of the input imperviousness layers (20 m in 2015 and 10 m in 2018) used to generate the Copernicus Imperviousness Change product. Although the harmonized Change layer provides a consistent 20 m grid and represents the only CLMS product suitable for cross-year comparison, its derivation from inputs of differing native resolutions may introduce resolution-driven artefacts, particularly in the detection of fine-grained edges and small impervious features. As a result, the Change layer reliably captures medium- to large-scale transformations—such as expansion of continuous built-up zones, block-level densification, and major infrastructure development—but may be less sensitive to micro-fragmentation processes, narrow linear features, or very small internal voids that fall below the effective mapping resolution. Consequently, MSPA- and entropy-based metrics should be interpreted at the metropolitan scale, where morphological trends clearly exceed the minimum detectable unit, while caution is warranted when assessing highly localized structural changes. This clarification delineates the analytical scope of the dataset and ensures an appropriate interpretation of the observed patterns of urban form reconfiguration.

5.3. Operational Value of Copernicus Derived MSPA and Entropy

This study shows that combining MSPA and entropy yields a robust framework for monitoring urban spatial changes using CLMS data. MSPA captures configurational properties of impervious surfaces—such as compaction, edge proliferation, connectivity, and internal voids—by classifying pixels into morphometric categories [2]. Entropy, in turn, quantifies spatial disorder and heterogeneity [12], clarifying whether changes follow compact intensification or dispersed fragmentation. Even if the joint comparison of MSPA and entropy could have some limitations, such as areas with high entropy and high Edge Density, which may reflect a different urban process than areas with high entropy and high Islet proportion, this approach aligns with Copernicus User Uptake priorities, which promote transforming CLMS data into operational indicators for planning authorities [13]. The FPCUP action specifically identified the need for tools capable of translating HRL and Urban Atlas updates into landscape structure indicators; the methodology applied here directly meets that requirement by generating comparable metrics for different European cities.

5.4. Contrasting Urban Development Patterns Across European Metropolitan Areas

Starting from the assumption that the six chosen metropolitan areas also differ in size, population, economic context and sometimes climatic setting, the MSPA and entropy results revealed distinct development patterns. Sofia showed by far the most intense restructuring, with a major rise in Edge Density and Porosity Index, reflecting rapid construction, major transport projects (e.g., the Northern Speed Tangent), and post-socialist expansion [14]. Entropy increased by 56%, indicating substantial spatial disorder and uncoordinated infill.
By contrast, Warsaw and Milan displayed more controlled densification. Increased Pcore values and reduced Edge Density suggest consolidation of built-up zones, while entropy patterns reflected moderate internal reorganization. Santander also showed consolidation, with compaction dominating in port areas (88.86%) and continuous urban fabric (76.42%). Riga showed further compaction within Core areas, with a marked decrease in Porosity and high compaction rates in continuous urban fabric and port areas, consistent with infill oriented planning [15]. Viseu, though small and less impervious, experienced compaction in central and residential areas, while fragmentation remained mostly associated with transit corridors and discontinuous fabrics.
Entropy provided an essential complement to MSPA, distinguishing compact development from fragmented, heterogeneous growth. Entropy decreases identified areas undergoing consolidation, whereas increases signaled dispersed and uneven expansion. Cross analysis with Urban Atlas classes enabled identification of functional areas most affected by structural change, offering insights into densification processes and infrastructure-driven transformation. The sharp entropy rise in Sofia highlights the challenges posed by rapid, spatially uneven growth, with implications for ecological connectivity and urban quality of life.
To aid interpretation, it is important to note that both Porosity and Edge Density are unitless density-based indicators derived directly from the MSPA classification. They are not normalized across cities but express the relative prevalence of Voids and Edge pixels per unit area within each metropolitan region. As a result, high values—such as those observed for Sofia—reflect genuine morphological characteristics of the urban fabric, including strong fragmentation, perforation, and the proliferation of small discontinuous patches, rather than artefacts related to scaling or metric design.

5.5. Policy Relevance and Methodological Limitations in Relation to EU Land-Take Frameworks

Although MSPA-derived indicators and entropy are not direct measurements of land take, they capture key structural components—such as expansion of impervious cores, internal perforation, and spatial disorder—that underpin land-take dynamics. The aim of the analysis is therefore not to reproduce the formal accounting frameworks used for monitoring the Zero Net Land Take 2050 target or the EU Soil Strategy, but to provide an operational, spatially explicit set of indicators that highlight where compaction or fragmentation processes are occurring. These structural signatures offer an informative complement to official land-take metrics by revealing how urban growth reorganizes the spatial configuration of sealed surfaces, supporting early detection of trends relevant to policy implementation. In this sense, the approach is designed to be policy-relevant—not by quantifying land take directly, but by offering a reproducible method to interpret the morphological processes that contribute to it.
The relevance to policy frameworks such as the Zero Net Land Take 2050 target and the EU Soil Strategy therefore lies in the complementary diagnostic value of these structural metrics, which help reveal whether sealing evolves in compact, fragmented, or transitional forms. These indicators can support planning, early detection of critical patterns, and spatial prioritization, but they are not intended for compliance monitoring and cannot replace the quantitative land-take metrics produced within the Copernicus Land Monitoring Service. Acknowledging this distinction ensures a realistic framing of the methodological contribution and clarifies the scope within which the proposed workflow can inform policy discussions.

6. Conclusions

This study provides a Copernicus-based use case showcasing how Copernicus services, specifically the Copernicus Land Monitoring Service (CLMS), can be operationally applied to analyze urban landscape changes across Europe. By integrating the Guidos Toolbox with the Copernicus Imperviousness Density Change product, we demonstrated that freely available European Earth Observation data can be transformed into actionable, comparable, and spatially explicit indicators describing land-take processes, fragmentation patterns, and structural landscape change.
The combined application of Morphological Spatial Pattern Analysis and entropy-based metrics enabled us to capture both quantitative and configurational aspects of urban development, extending beyond traditional area-based assessments. This methodological framework illustrates how Copernicus datasets can effectively detect and differentiate contrasting urban development patterns —from compact growth to diffuse sprawl—with clear implications for soil sealing, ecological connectivity, and urban resilience.
The results highlight the strong policy relevance of Copernicus products for supporting European strategies such as the Zero Net Land Take 2050 objective, the EU Soil Strategy, and the EU Biodiversity Strategy. Because the analyses rely exclusively on openly accessible CLMS datasets, the approach is fully reproducible and transferable to other regions, making it suitable for operational monitoring and long-term planning.
In accordance with FPCUP goals, all derived layers and indicators were made available through a FAIR-compliant geoportal, ensuring that datasets are Findable, Accessible, Interoperable and Reusable. This facilitates transparent documentation, reproducibility, and future uptake by local administrations, researchers, and policy practitioners.
Overall, this work demonstrates the added value of Copernicus services as a foundation for operational landscape intelligence. By showing how CLMS products can be combined with open analytical tools to monitor the spatial structure of urbanization, this study reinforces the role of Copernicus data in guiding sustainable spatial planning and managing the evolution of European urban regions.

Author Contributions

Conceptualization, I.M., M.K., D.J., M.M., L.F. (Lachezar Filchev), J.M.Á.-M., and H.C.; methodology, I.M., A.C., P.D.F. and N.R.; software, B.C.; validation, I.M., L.C., A.M., M.K., D.J., L.F. (Lyubomir Filipov), J.M.Á.-M., P.B., M.C. and H.C.; formal analysis, P.D., B.C., S.S., K.G., M.R., M.K., D.J., L.F. (Lachezar Filchev), J.M.Á.-M., P.B., M.C. and H.C.; investigation, G.J., A.S.C., D.L.T., P.B., S.L., K.D., J.M.L.T., and Z.D.; resources, I.M., A.B., M.Z., D.A., K.R., M.K., D.J., Lyubomir Filipov, J.M.Á.-M., P.B., M.C. and H.C.; data curation, I.M., A.M., M.C. and M.K.; writing—original draft preparation, I.M., B.C., M.K., Z.D., J.M.Á.-M. and H.C.; writing—review and editing, I.M., M.K., S.L., Z.D., D.J., L.F. (Lachezar Filchev), J.M.Á.-M., and H.C.; visualization, A.M., Z.D., I.M., S.L. and J.M.Á.-M.; supervision, I.M., L.C and M.K.; project administration, M.K.; funding acquisition, I.M. All authors have read and agreed to the published version of the manuscript.

Funding

This work is supported by European Union’s Caroline Herschel Framework Partnership Agreement on Copernicus User Uptake under grant agreement No FPA 275/G/GRO/COPE/17/10042, project FPCUP (Framework Partnership Agreement on Copernicus User Uptake), Action 2021-2-38. User Uptake of Copernicus Services for Landscape and Spatial Planning Stakeholders (Specific Grant Agreement N°20–2022/SI2.879178-SI2.879180/20) and Memorandum of Understanding (MoU), grant number A0NCP003, and the APC was funded by project CUP I59B24000190006 by the Italian Institute for Environmental Protection and Research (ISPRA).

Data Availability Statement

All datasets and derived layers are available via the project geoportal (Section 6) and, where applicable, as interoperable WMS services through the institutional SDI. Licensing: ODC-BY 1.0.

Acknowledgments

We thank the FPCUP partnership and the cross-partner working group for inputs on data dissemination and visual communication. We acknowledge the Copernicus Land Monitoring Service for the datasets used in this study. The participation of H.C and M.C was co-supported by national funds through FCT (Fundação para a Ciência e a Tecnologia), under the project—UIDB/04152/2020 (DOI: 10.54499/UIDB/04152/2020)—Centro de Investigação em Gestão de Informação (MagIC)/NOVA IMS).

Conflicts of Interest

Author Lyubomir Filipov was employed by the company GAP Consult Ltd. The remaining authors declare that the research was conducted in the absence of any commercial or financial relationships that could be construed as a potential conflict of interest.

References

  1. Gökyer, E. Understanding Landscape Structure Using Landscape Metrics. In Advances in Landscape Architecture; IntechOpen: London, UK, 2013. [Google Scholar] [CrossRef]
  2. Vogt, P.; Riitters, K. GuidosToolbox: Universal digital image object analysis. Eur. J. Remote Sens. 2017, 50, 352–361. [Google Scholar] [CrossRef]
  3. McGarigal, K. FRAGSTATS: Spatial Pattern Analysis Program for Quantifying Landscape Structure; U.S. Department of Agriculture, Forest Service, Pacific Northwest Research Station: Portland, OR, USA, 1995.
  4. European Environment Agency. Imperviousness Change 2015–2018 (Raster 20 m), Europe, 3-Yearly, Aug. 2020; European Environment Agency: Copenhagen, Denmark, 2020. [Google Scholar] [CrossRef]
  5. European Environment Agency. Urban Atlas Land Cover/Land Use Change 2012–2018 (Vector), Europe, 6-Yearly, Jan. 2021; European Environment Agency: Copenhagen, Denmark, 2020. [Google Scholar] [CrossRef]
  6. Pili, S.; Grigoriadis, E.; Carlucci, M.; Clemente, M.; Salvati, L. Towards sustainable growth? A multi-criteria assessment of (changing) urban forms. Ecol. Indic. 2017, 76, 71–80. [Google Scholar] [CrossRef]
  7. Wolff, M.; Haase, D.; Priess, J.; Hoffmann, T.L. The Role of Brownfields and Their Revitalisation for the Functional Connectivity of the Urban Tree System in a Regrowing City. Land 2023, 12, 333. [Google Scholar] [CrossRef]
  8. Clark, T.; De Waard, A.; Herman, I.; Hovy, E. The Future of Research Communication (Dagstuhl Perspectives Workshop 11331); Schloss Dagstuhl—Leibniz-Zentrum für Informatik: Wadern, Germany, 2011. [Google Scholar] [CrossRef]
  9. Wilkinson, M.D.; Dumontier, M.; Aalbersberg, I.J.; Appleton, G.; Axton, M.; Baak, A.; Blomberg, N.; Boiten, J.W.; da Silva Santos, L.B.; Bourne, P.E.; et al. The FAIR Guiding Principles for scientific data management and stewardship. Sci. Data 2016, 3, 160018. [Google Scholar] [CrossRef] [PubMed]
  10. Marín-González, E.; Malmusi, D.; Camprubí, L.; Borrell, C. The Role of Dissemination as a Fundamental Part of a Research Project: Lessons Learned from SOPHIE. Int. J. Health Serv. 2017, 47, 258–276. [Google Scholar] [CrossRef] [PubMed]
  11. ISO 19115-1:2014; Geographic information — Metadata. Part 1: Fundamentals. ISO: Vernier, Switzerland, 2014.
  12. Yeh, A.; Li, X. Measurement and monitoring of urban sprawl in a rapidly growing region using entropy. Photogramm. Eng. Remote Sens. 2001, 67, 83–90. [Google Scholar]
  13. Kissling, W.D.; Shi, Y.; Wang, J.; Walicka, A.; George, C.; Moeslund, J.E.; Gerard, F. Towards consistently measuring and monitoring habitat condition with airborne laser scanning and unmanned aerial vehicles. Ecol. Indic. 2024, 169, 112970. [Google Scholar] [CrossRef]
  14. Stanilov, K. (Ed.) The Post-Socialist City: Urban Form and Space Transformations in Central and Eastern Europe After Socialism; The GeoJournal Library; Springer: Dordrecht, The Netherlands, 2007; Volume 92. [Google Scholar] [CrossRef]
  15. OECD. OECD Economic Outlook, Volume 2020 Issue 2: Preliminary Version; OECD Publishing: Paris, France, 2020. [Google Scholar] [CrossRef]
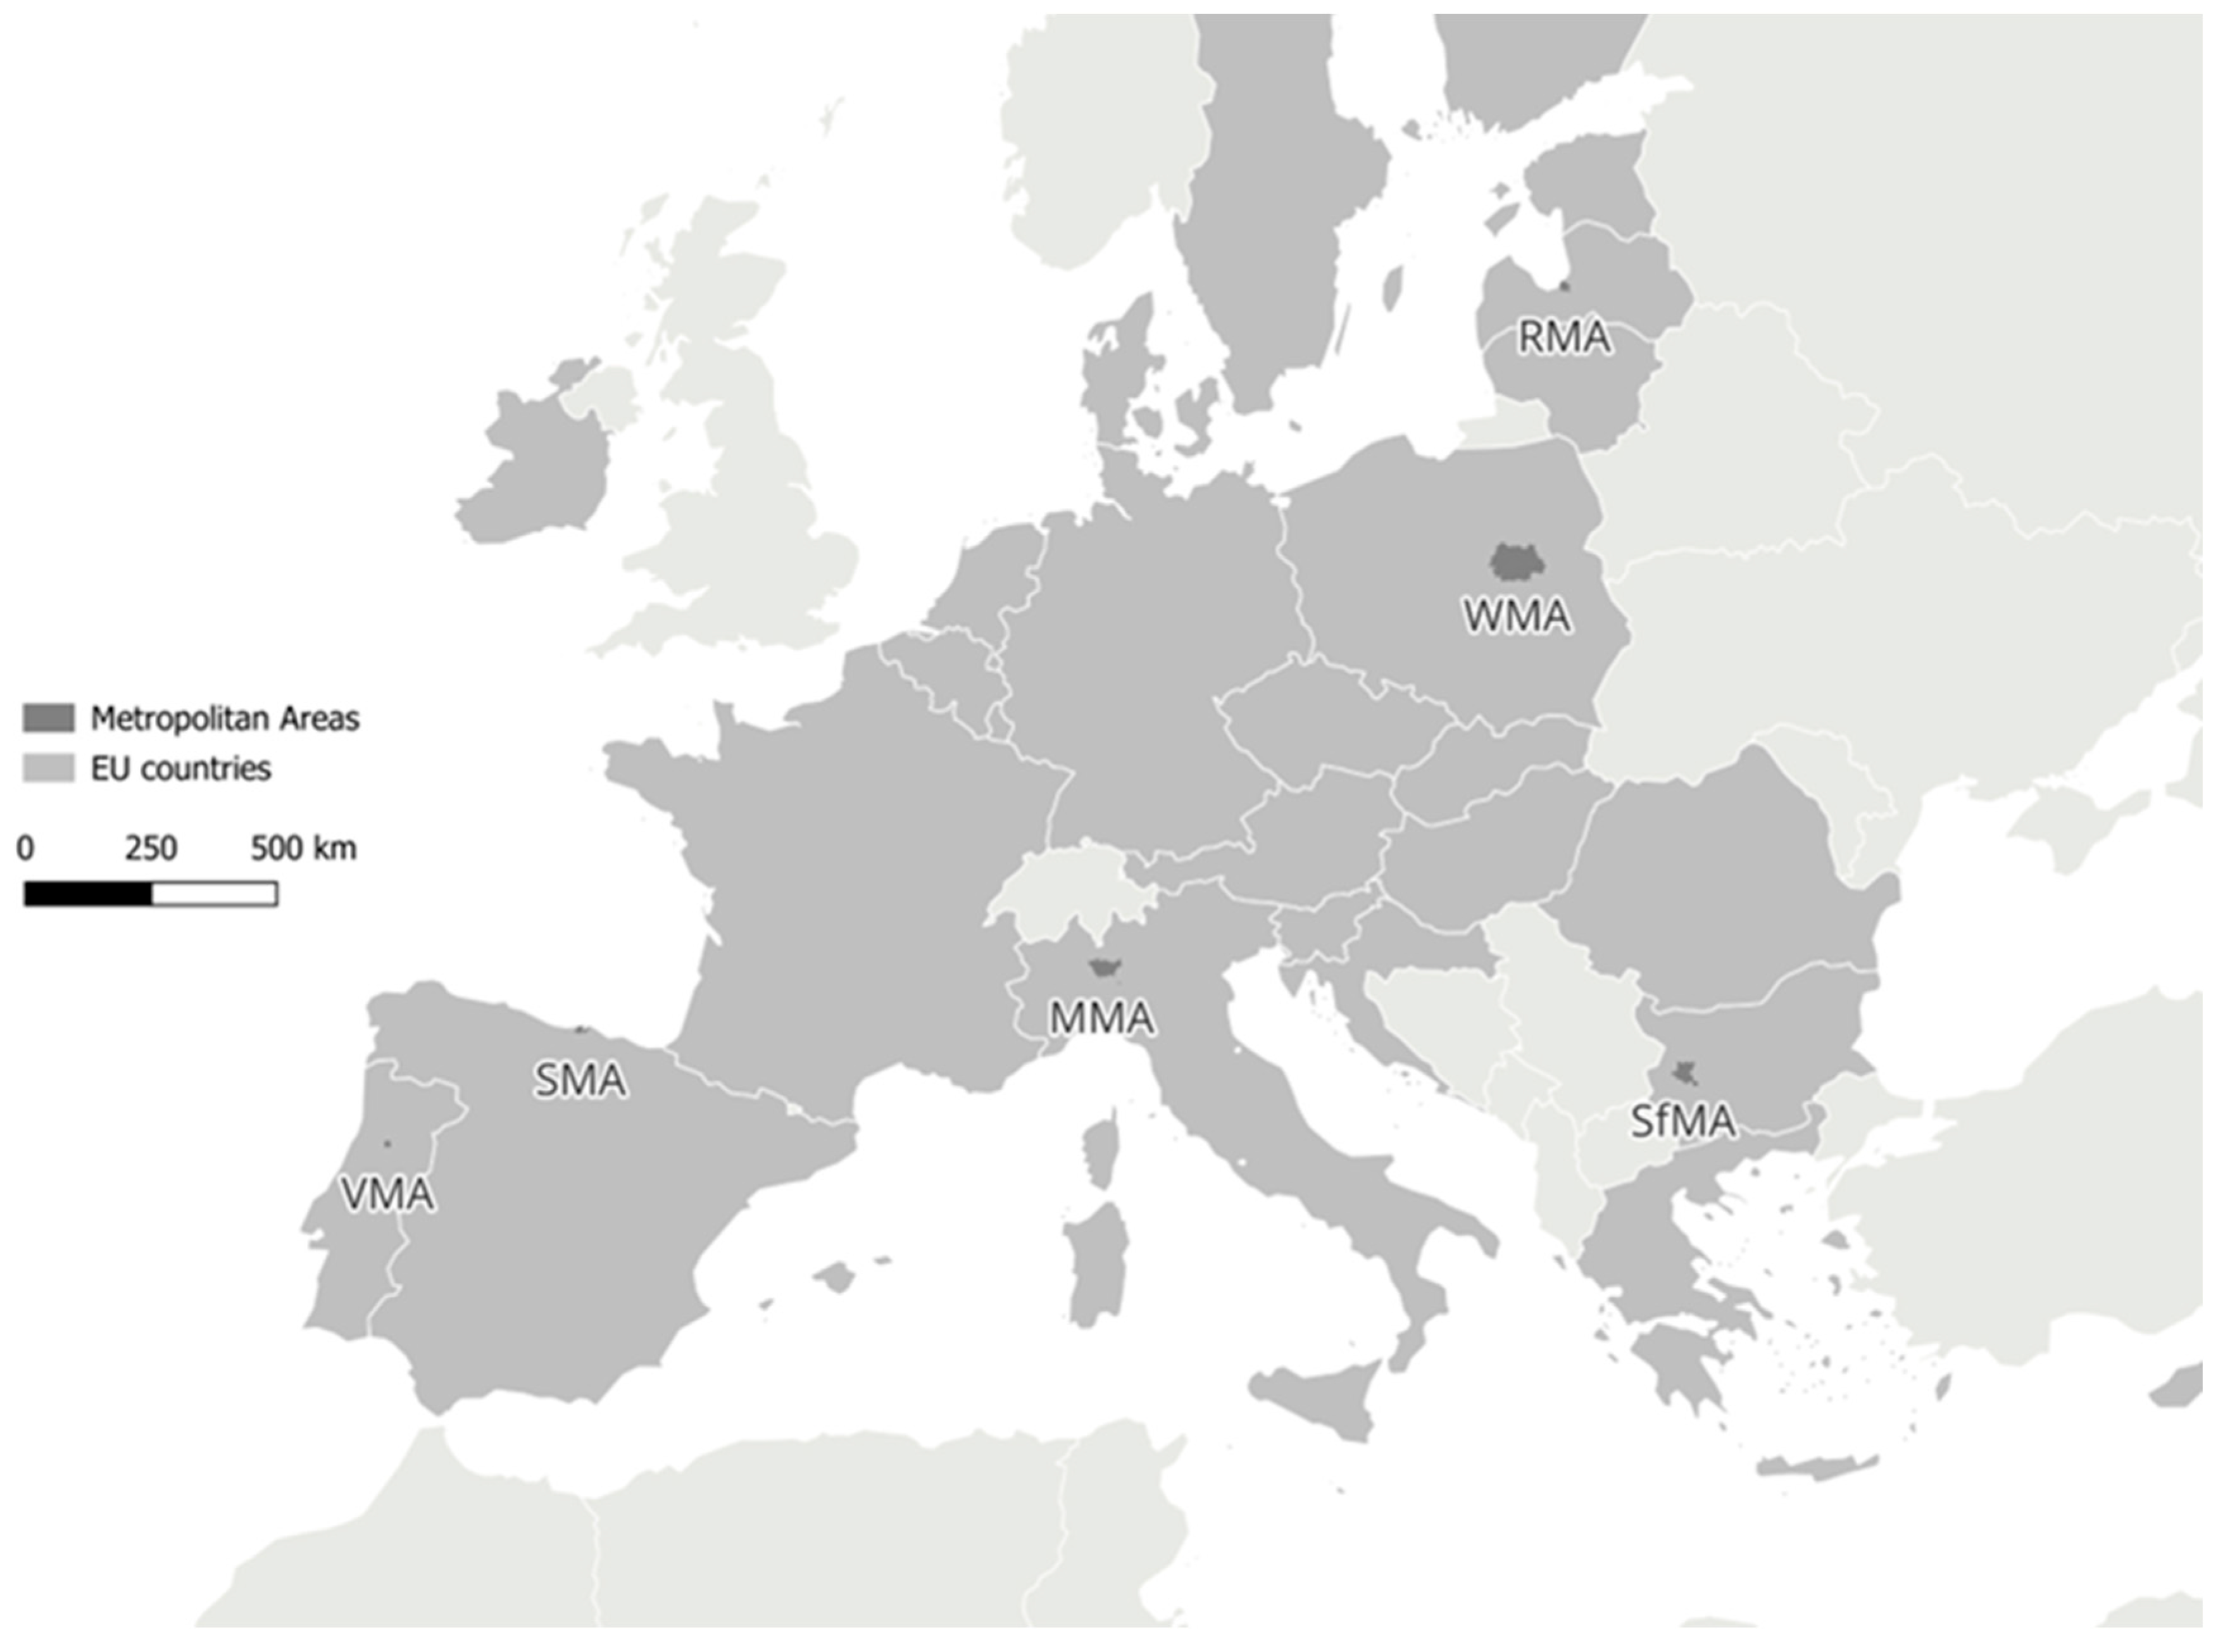
Figure 1. Location of areas of interest—six metropolitan areas within six EU State Member.
Remotesensing 18 01149 g001
Figure 2. MSPA maps for selected areas in 2015, from the top left: Santander (SP), Milan (IT), Riga (LT), Sofia (BG), Viseu (PT) and Warsaw (PL).
Remotesensing 18 01149 g002
Figure 3. Comparison of Copernicus HRL IMP data from 2015 and 2018 (left column) and MSPA maps for 2015 (middle column) and 2018 (right column) for selected regions within six different study areas in Spain, Italy, Latvia, Bulgaria, Portugal and Poland.
Remotesensing 18 01149 g003
Figure 4. Comparison of morphological classes expressed as a percentage over the study areas for 2015 (blue)–2018 (red).
Remotesensing 18 01149 g004
Figure 5. Entropy maps for selected areas in 2015, from the top left: Santander (SP), Milan (IT), Riga (LT), Sofia (BG), Viseu (PT) and Warsaw (PL).
Remotesensing 18 01149 g005
Figure 6. Entropy change map for the SMA (2015–2018) (green: fragmentation; yellow: no change; red–orange: compaction). Bottom-right: detail of an area exhibiting compaction.
Remotesensing 18 01149 g006
Figure 7. Percentage of most fragmented or compacted areas for the Urban Atlas classes in the SMA.
Remotesensing 18 01149 g007
Figure 8. Map of Entropy Changes for the Milan Metropolitan Area between 2015 and 2018 (green: fragmentation; yellow: no change; red–orange: compaction). Bottom-right: zoom of an area where fragmentation has occurred.
Remotesensing 18 01149 g008
Figure 9. Percentage of the most fragmented or compacted area for Urban Atlas classes in the Milan Metropolitan Area.
Remotesensing 18 01149 g009
Figure 10. Map of Entropy Changes for the Riga Metropolitan Area (2015–2018) (green: fragmentation; yellow: no change; red–orange: compaction). Bottom-right: zoom of an area where compaction has occurred.
Remotesensing 18 01149 g010
Figure 11. Percentage of the most fragmented or compacted area for Urban Atlas classes in the Metropolitan City of Riga.
Remotesensing 18 01149 g011
Figure 12. Map of Entropy Changes for the Sofia Metropolitan Area (2015–2018). Red–orange: fragmentation; yellow: no change; green: compaction. Bottom-right: zoom highlighting fragmentation near the Northern Speed Tangent and adjacent industrial areas.
Remotesensing 18 01149 g012
Figure 13. Percentage of fragmented or compacted area for Urban Atlas classes in the Metropolitan City of Sofia.
Remotesensing 18 01149 g013
Figure 14. Map of Entropy Changes for the Viseu Metropolitan Area (2015–2018). Red–orange: fragmentation; yellow: no change; green: compaction.
Remotesensing 18 01149 g014
Figure 15. Percentage of compacted or fragmented area for Urban Atlas classes in the Metropolitan City of Viseu.
Remotesensing 18 01149 g015
Figure 16. Map of entropy changes for the WMA (2015–2018). Top-right: zoom showing areas of both fragmentation and compaction.
Remotesensing 18 01149 g016
Figure 17. Percentage of compacted or fragmented area for Urban Atlas classes in the WMA.
Remotesensing 18 01149 g017
Table 1. Parameter settings used in the MSPA tool.
ParametersSetting
FGConn[8/4]8
Edge Width[pix]5
TransitionOff
IntextOff
Table 2. Comparative table: MSPA classes vs. indices.
MSPA ClassDescriptionRelevant IndexInterpretation of the Index
CoreInternal part of compact areas, distant from edgesPcorePercentage of “core” area over the total: higher values indicate larger, less fragmented patches.
EdgeOuter fringe surrounding coresEdge DensityEdge length per unit area: higher values correspond to stronger fragmentation and increased edge influence.
BridgeLinear structures connecting cores(no direct index, but contributes to Connectivity)Presence enhances structural connectivity among habitat patches.
IsletSmall isolated patches not large enough to be cores(no direct index, but reduces Pcore)Presence of many islets indicates higher fragmentation and lower continuity.
Urban Voids/
Perforations
Internal holes within coresPorosity IndexPercentage of voids relative to total area: higher values indicate greater internal fragmentation.
Table 3. Main characteristics of six analyzed study areas.
Study AreaAbbreviationCountryPopulation
[Million]
Area
[km2]
Climatic Driven Type
MilanMMAItaly8.213,110Humid subtropical
SofiaSfMABulgaria1.31345Continental valley
RigaRMALatvia1.110,438Cold continental
WarsawWMAPoland3.1–3.56100Cold continental
ViseuVMAPortugal0.45000Mediterranean
SantanderSMASpain0.65345 Oceanic
Table 4. Set of indices derived from MSPA maps for 2015 and 2018.
SMARMASfMAVMAMMAWMA
201520182015201820152018201520182015201820152018
Porosity Index0.0860.0990.060.050.1172.0600.0270.0370.0730.0730.0880.105
Edge Density0.3910.3600.370.350.1542.2770.7890.7190.1690.1630.3400.324
Pcore6.5806.8762.822.9610.3865.1314.6765.05516.84417.25112.75213.270
Disclaimer/Publisher’s Note: The statements, opinions and data contained in all publications are solely those of the individual author(s) and contributor(s) and not of MDPI and/or the editor(s). MDPI and/or the editor(s) disclaim responsibility for any injury to people or property resulting from any ideas, methods, instructions or products referred to in the content.