Article

Numerical Simulation of a Heavy Rainfall Event in Sichuan Using CMONOC Data Assimilation

1
School of Remote Sensing and Geomatics Engineering, Nanjing University of Information Science and Technology, Nanjing 210044, China
2
College of Civil Aviation, Nanjing University of Aeronautics and Astronautics, Nanjing 211106, China
*
Author to whom correspondence should be addressed.
Remote Sens. 2026, 18(8), 1126; https://doi.org/10.3390/rs18081126
Submission received: 16 February 2026 / Revised: 28 March 2026 / Accepted: 8 April 2026 / Published: 10 April 2026

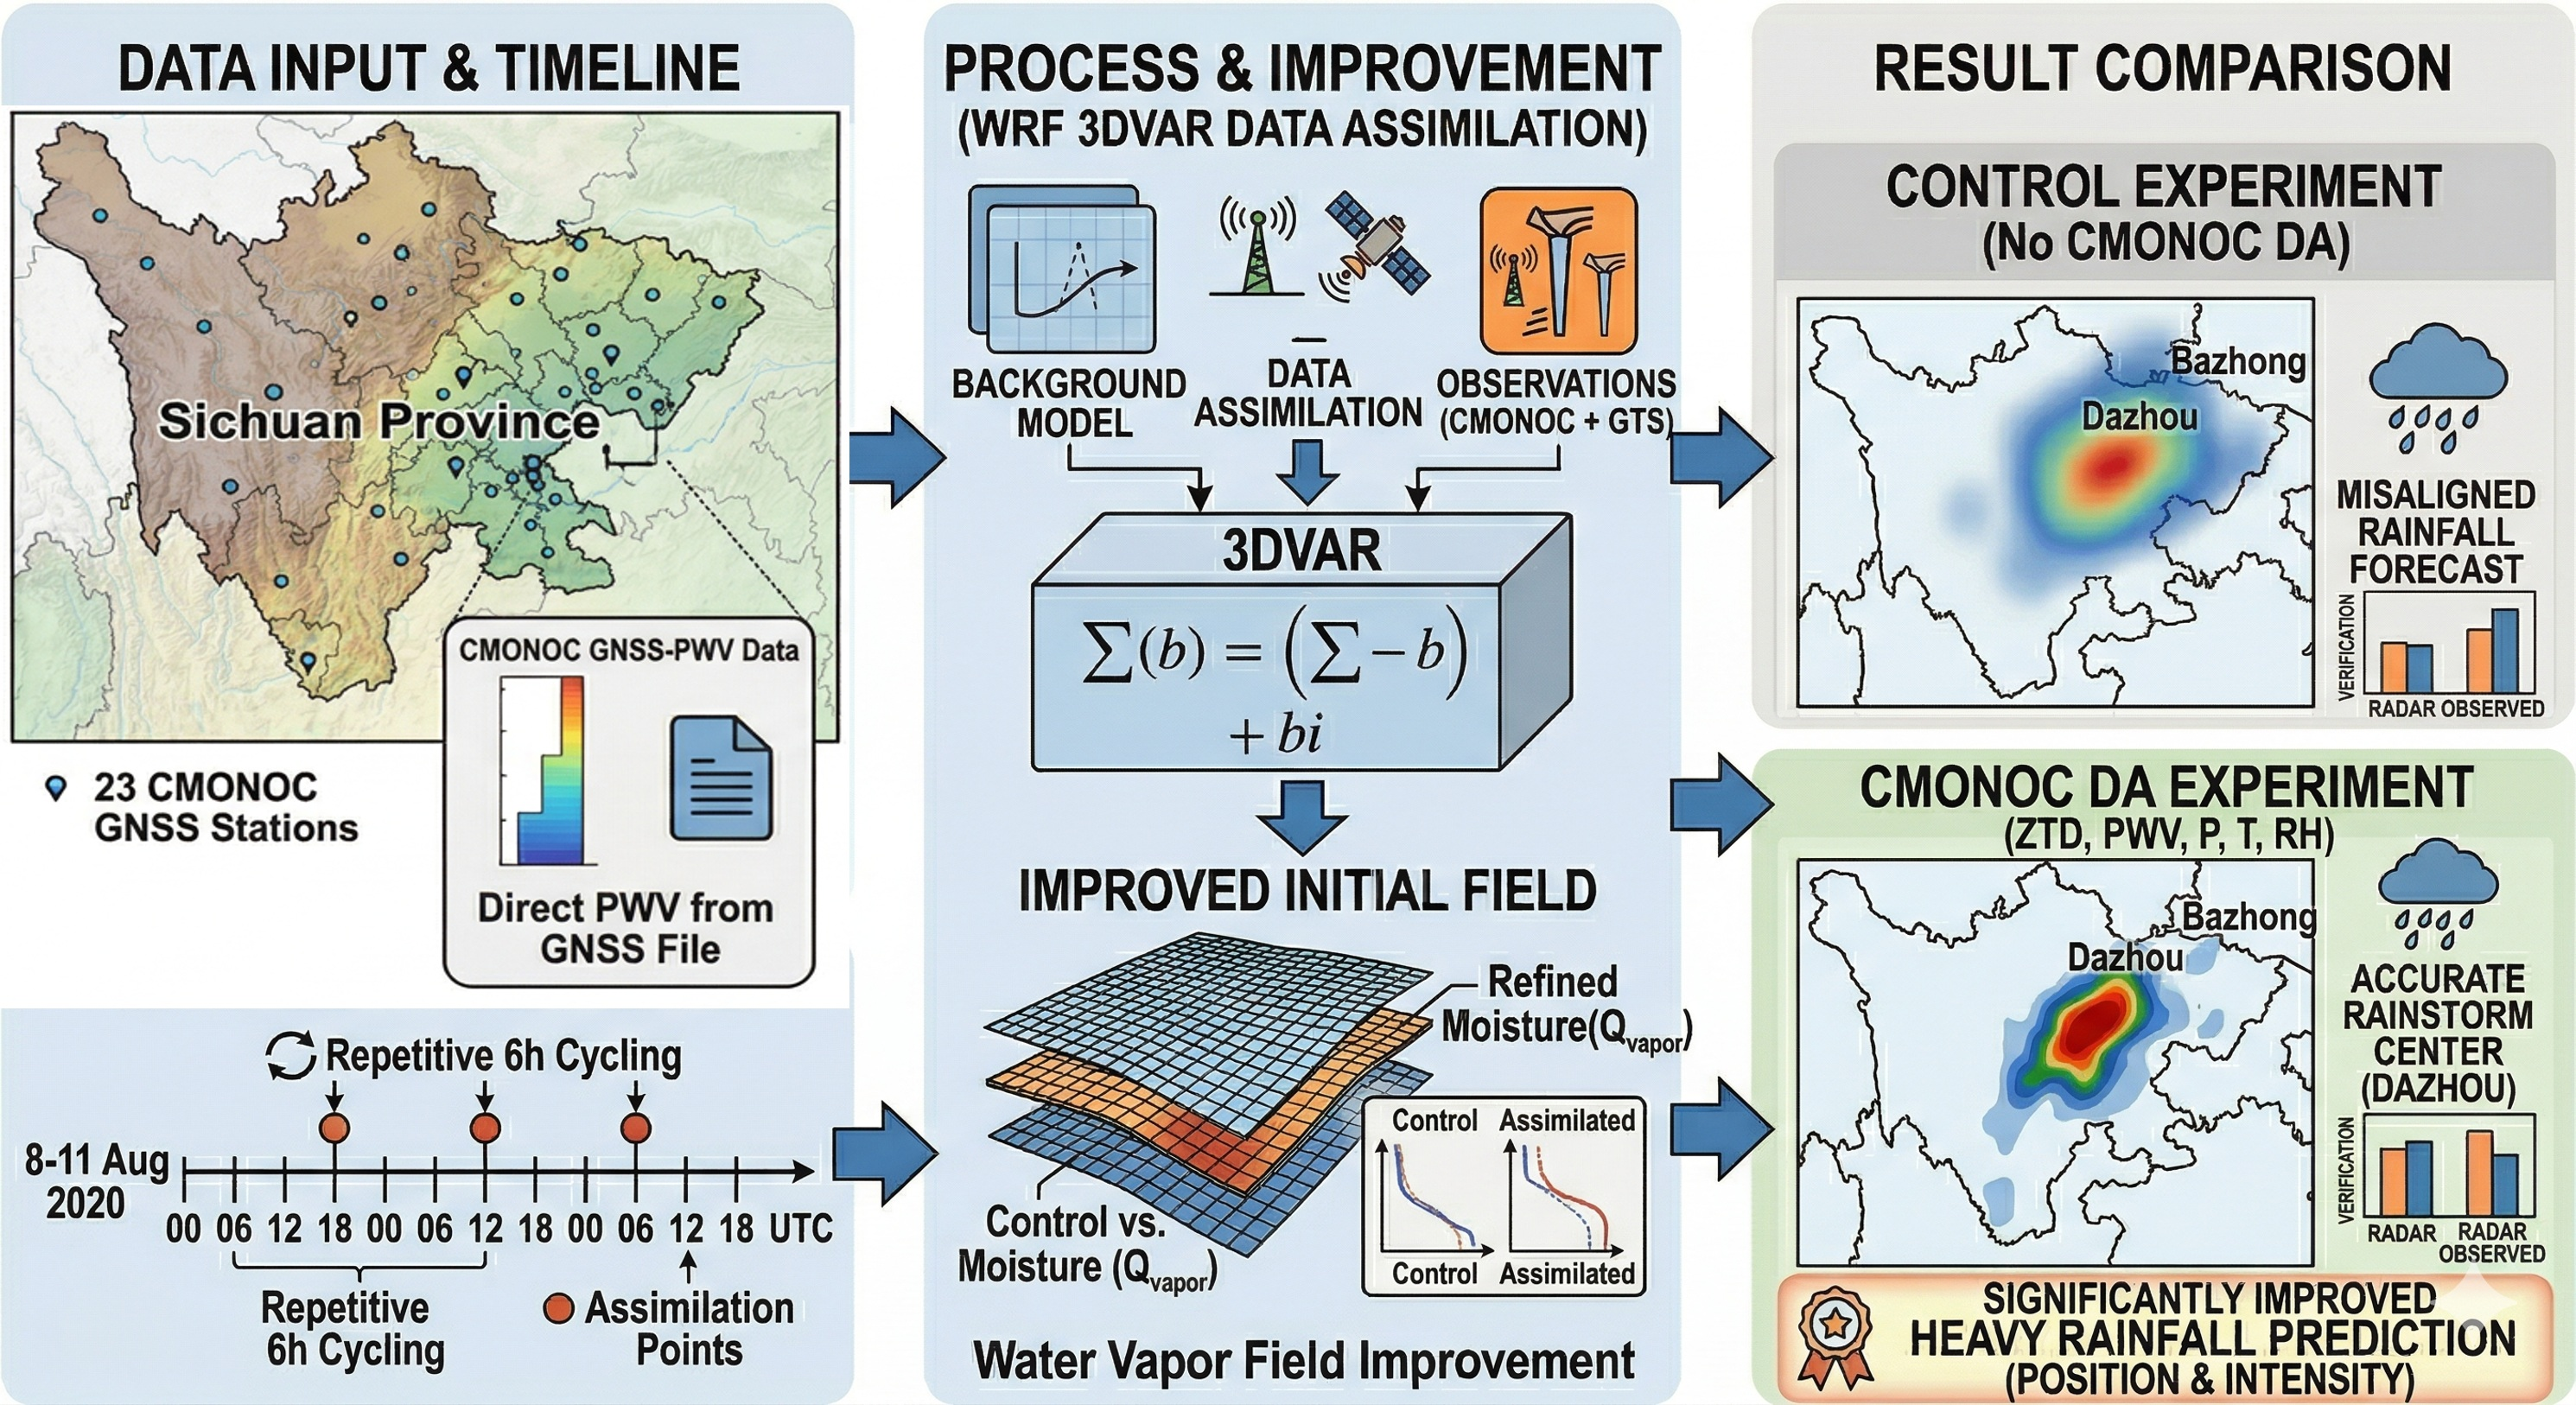
Highlights

What are the main findings?
  • A 6 h cycling WRFDA-3DVar experiment assimilating CMONOC GNSS ZTD/PWV was conducted for the 10–12 August 2020 Sichuan Basin rainstorm.
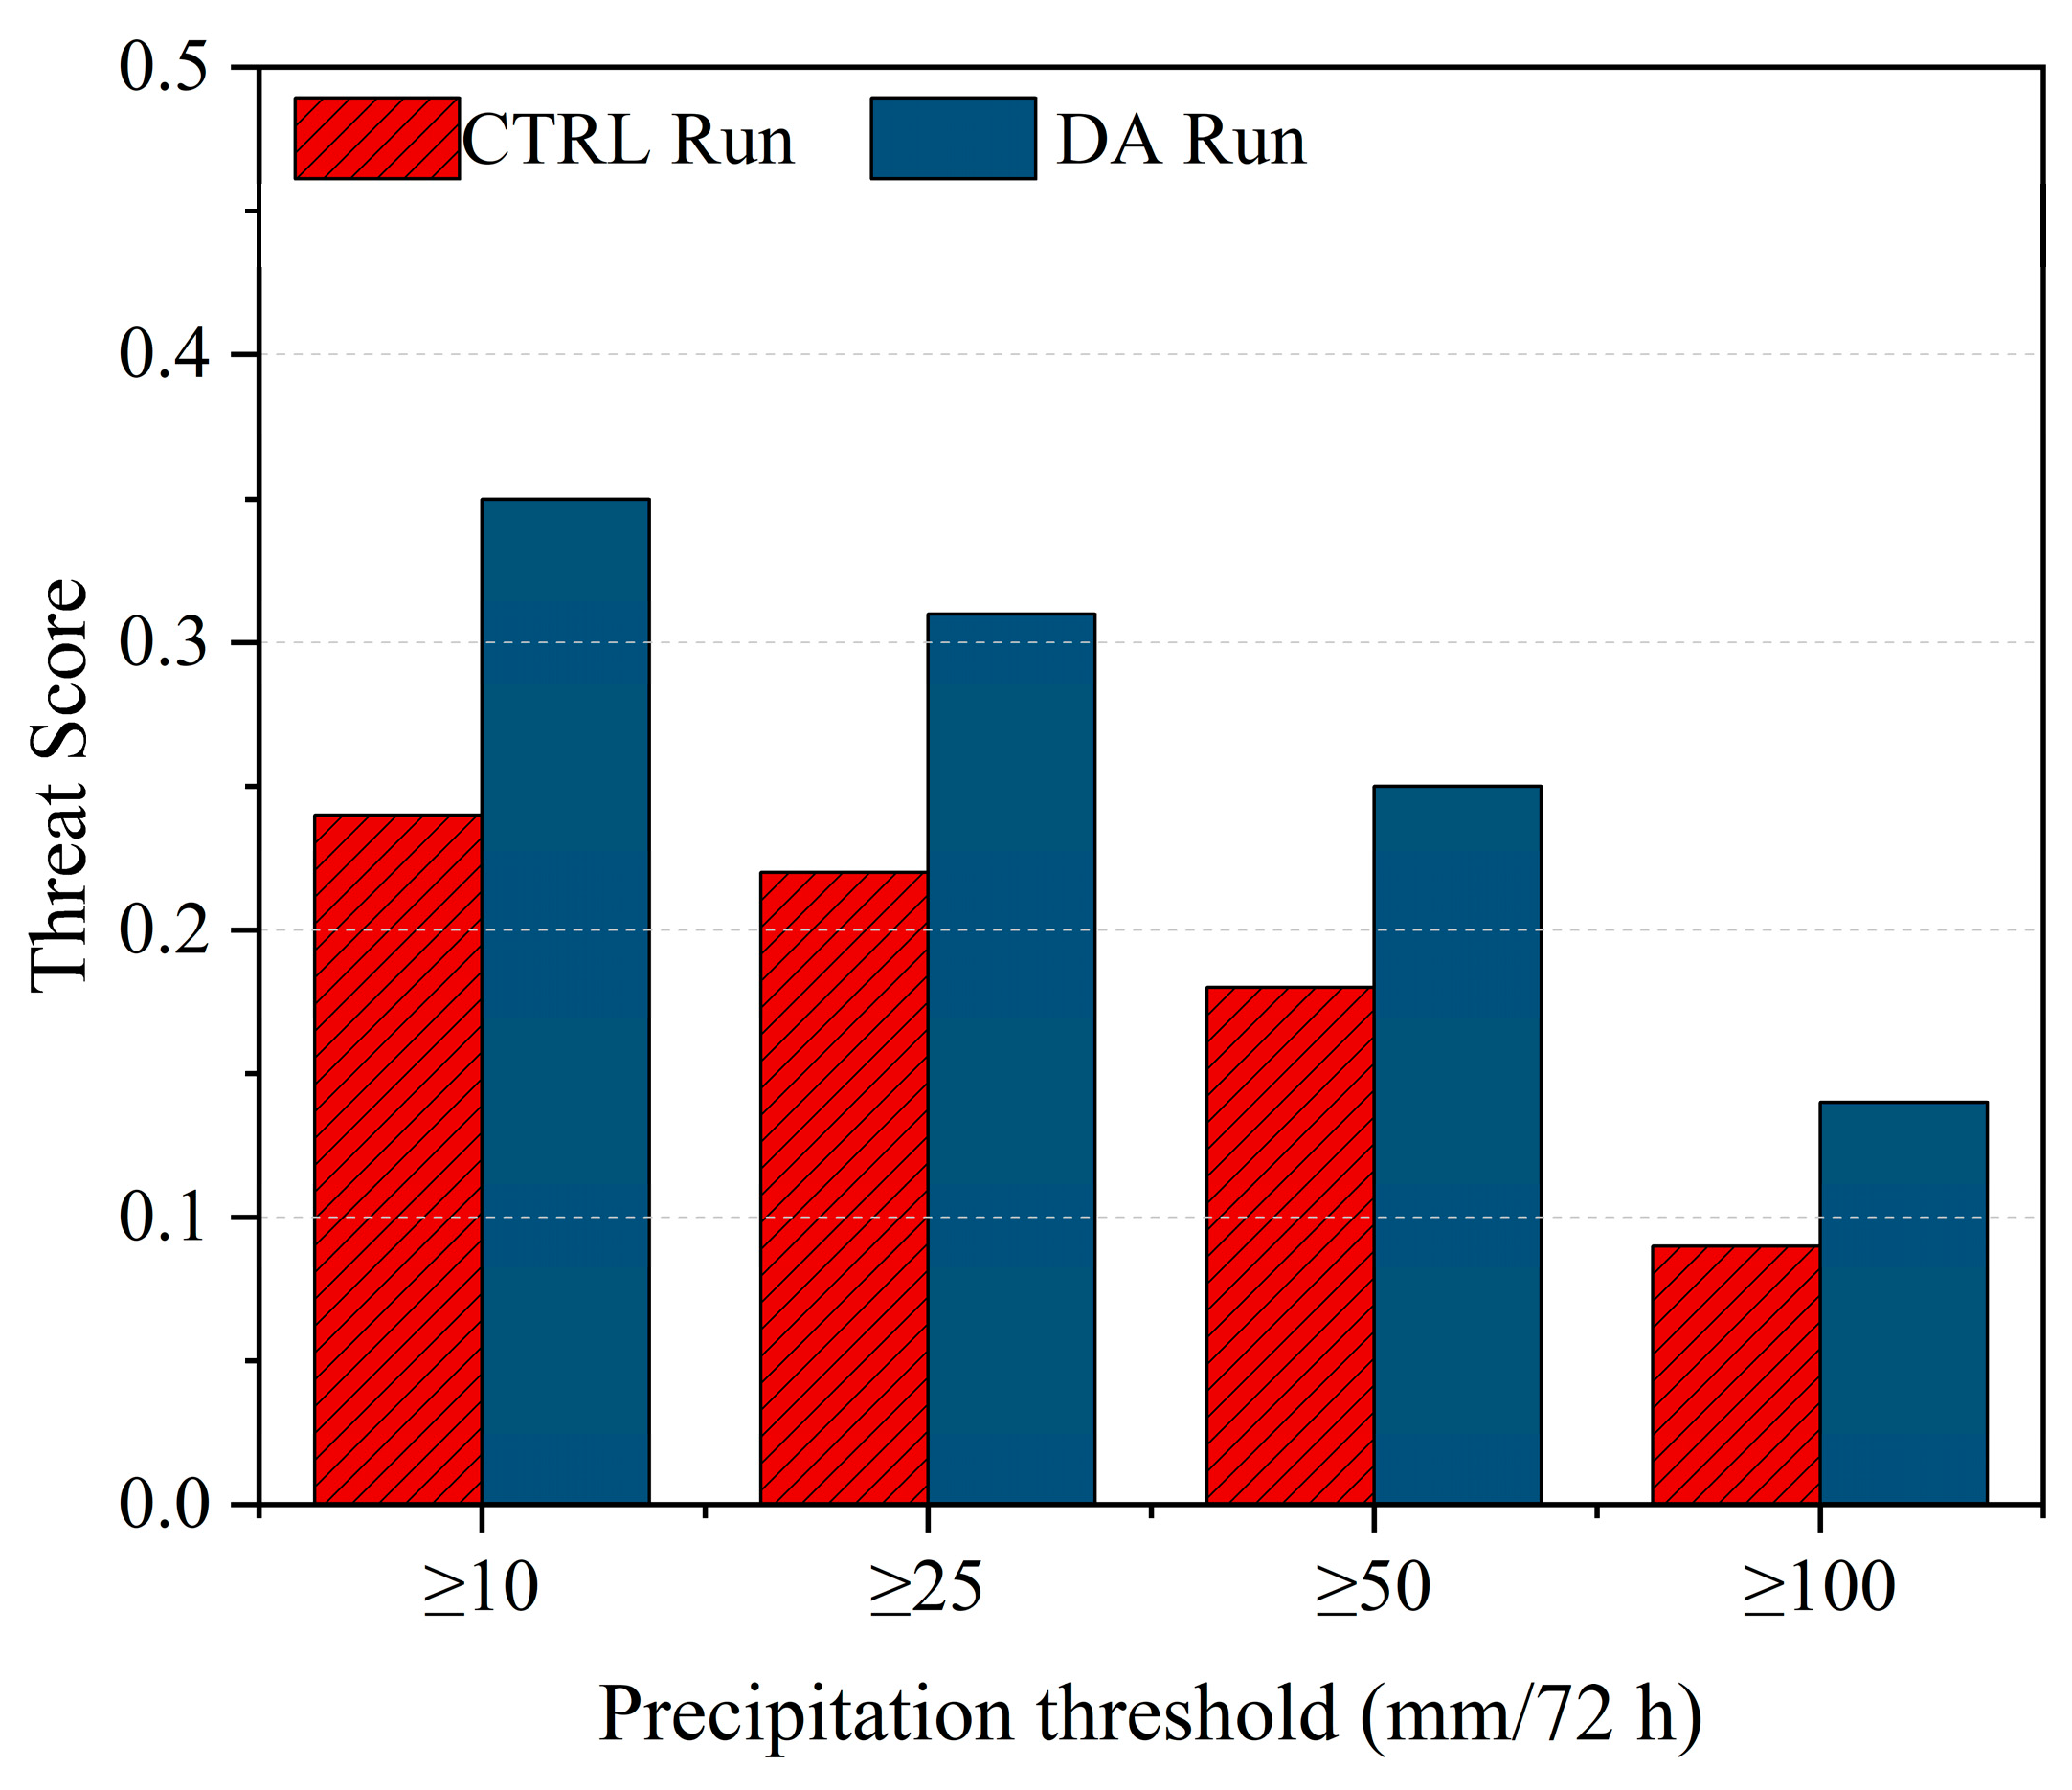
  • GNSS assimilation improves rainband placement and increases Threat Scores for 72 h accumulated precipitation, with the largest gains for heavy rainfall (≥50 mm and ≥100 mm).
What are the implications of the main findings?
  • Increment diagnostics indicate enhanced low-level moisture and convergence, providing a physical explanation for the improved precipitation simulation.
  • CMONOC GNSS tropospheric products offer an effective moisture constraint for heavy-rainfall simulations over complex terrain, supporting regional forecasting and risk reduction.

Abstract
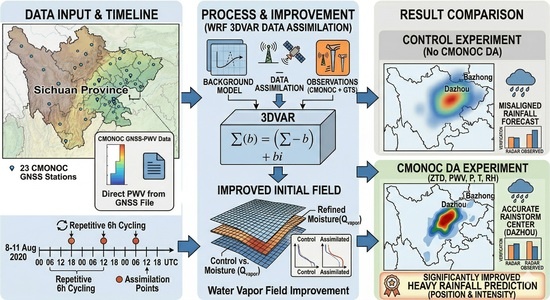
This study evaluates the impact of assimilating the Crustal Movement Observation Network of China (CMONOC) global navigation satellite system (GNSS) tropospheric products on heavy-rainfall simulation over the complex terrain of the Sichuan Basin. Using the Weather Research and Forecasting model with the WRF Data Assimilation (WRF/WRFDA) three-dimensional variational (3DVar) system, we conducted a control (CTRL) experiment and a data-assimilation (DA) experiment for a primary heavy-rainfall event during 10–12 August 2020. The DA experiment applied 6 h cycling assimilation of station-based zenith total delay (ZTD) and precipitable water vapor (PWV). Compared with CTRL, DA improved the placement of the primary rainband and the depiction of peak rainfall. On 10 August, the observed rainfall core (~40 mm) over the northwestern basin was underestimated in CTRL (~15 mm) but was strengthened in DA (~25 mm). Hourly verification at a threshold of 2 mm h−1 showed a higher maximum Threat Score (TS) in DA (0.292) than in CTRL (0.250), and the largest instantaneous gain reached 0.061. For 72 h accumulated precipitation, TS was higher in DA across multiple thresholds (≥10, ≥25, ≥50, and ≥100 mm), with the most pronounced improvement for heavier rainfall categories. Diagnostic analysis indicates that GNSS assimilation introduces dynamically consistent low-level moistening and strengthened convergence at 850 hPa, together with a better-aligned vertical ascent structure during the key stage of the event. An additional heavy-rainfall event during 21–23 August 2021 was further examined as a compact robustness test, and the results showed a generally consistent improvement in precipitation distribution and TS after GNSS assimilation. Overall, the present results suggest that cycling assimilation of CMONOC GNSS ZTD/PWV products can provide effective moisture constraints and improve heavy-rainfall simulation over the Sichuan Basin in the examined cases.

1. Introduction

The Sichuan Basin is surrounded by steep mountain ranges, resulting in pronounced topographic relief and strong terrain constraints on regional circulation. Under such conditions, low-level flow tends to converge and channel within and along the basin margins, and when combined with orographic lifting and sufficient moisture supply, heavy rainfall can be readily initiated and maintained. These persistent rainstorms often induce secondary hazards such as flooding, landslides, and debris flows, posing sustained pressure on regional disaster prevention and mitigation [1].
In operational forecasting, numerical weather prediction (NWP) remains the primary technical basis for rainstorm prediction; however, precipitation forecasts over complex terrain commonly exhibit notable biases in rainfall location and intensity [2]. For basin-scale heavy rainfall, errors such as rainband displacement, inaccurate peak intensity, and timing biases remain frequent, reflecting the difficulty of representing multi-scale interactions among terrain, moisture transport, and mesoscale dynamics [3].
A key factor limiting short-range precipitation prediction is uncertainty in the model initial conditions. Errors in moisture and dynamical structures at analysis time—such as low-level humidity gradients, convergence lines, and vertical motion patterns—can grow rapidly and translate into substantial displacement and amplitude errors in simulated precipitation [4]. This sensitivity is often amplified in terrain-affected environments where mesoscale forcing interacts nonlinearly with moisture transport, making accurate representation of moisture–dynamics coupling in the initial field essential for improving heavy-rainfall prediction. Data assimilation addresses these limitations by incorporating observations into the model analysis in a dynamically consistent way, thereby reducing initial-field errors and improving the subsequent evolution of key variables controlling precipitation development [5].
For heavy rainfall, observations that constrain atmospheric moisture are particularly valuable because water vapor is both a necessary ingredient for precipitation and a major source of uncertainty in models. Conventional humidity observations are limited by spatial coverage and temporal frequency, while satellite retrievals may be degraded under clouds and precipitation, especially during high-impact events [6]. In this context, global navigation satellite system (GNSS) tropospheric products provide continuous and stable moisture constraints that are less dependent on weather conditions. GNSS-derived zenith total delay (ZTD) and precipitable water vapor (PWV) have been widely used to characterize moisture variability and its relationship to precipitation, and they show potential utility for monitoring and forecasting heavy rainfall [7]. Assimilation studies further indicate that introducing GNSS ZTD and PWV can improve humidity analyses and, in many cases, precipitation simulations and short-range precipitation forecasts, particularly when cycling assimilation is applied to continuously correct the evolving moisture field [8,9,10]. Nevertheless, the impact of GNSS assimilation remains case- and region-dependent, and for regions with strong relief and complex precipitation organization such as the Sichuan Basin, the extent of improvement in rainband location, intensity, and evolution—as well as the physical mechanisms responsible—still requires targeted verification and additional case-based evidence [4,11,12].
In parallel, recent GNSS-oriented studies have also explored diverse strategies for exploiting GNSS tropospheric information to support heavy-rainfall applications. Li et al. proposed an anomaly-based percentile-threshold method using predictors derived from GNSS-PWV to detect heavy rainfall [13], demonstrating that PWV anomaly characteristics prior to events can be translated into an objective detection framework with high detection skill and a manageable false-alarm rate. Wang et al. investigated high-resolution (1 km) forecasting of PWV and ZTD over China based on the Pangu-Weather system and introduced an MLP-based bias-correction approach to improve near-surface estimation and better capture seasonal variability [14]; their case analysis further confirmed that the corrected PWV product can depict moisture accumulation during severe weather. In addition, Wei et al. conducted real-time prediction experiments for extreme rainfall events using WRF multi-source data assimilation, comparing baseline forecasts with optimized WRFDA-based schemes that assimilate multiple observation types [15]; their results indicate that data assimilation can enhance the prediction accuracy of PWV/ZTD evolution during heavy-rainfall periods. Collectively, these studies suggest that GNSS-informed approaches—ranging from statistical detection and bias correction to variational data assimilation—can provide valuable moisture-related constraints for monitoring and forecasting heavy rainfall, while also highlighting the need for region- and event-specific assessments of the precipitation response and its underlying physical mechanisms [16].
Motivated by this gap, this study investigates a major heavy-rainfall event over Sichuan in August 2020 using the WRF modeling system coupled with the WRFDA three-dimensional variational (3DVar) framework. We conduct a control (CTRL) experiment and a data-assimilation (DA) experiment with cycling assimilation of GNSS ZTD/PWV observations from the Crustal Movement Observation Network of China (CMONOC). By comparing precipitation simulations and moisture-related diagnostics between CTRL and DA, we quantify the impact of assimilating CMONOC tropospheric products on rainband placement, rainfall intensity, and event evolution, and we diagnose the associated adjustments in low-level moisture and dynamical fields that help explain the precipitation response [4,5,17,18,19,20].
Despite the growing use of GNSS tropospheric observations in numerical weather prediction, their impact on heavy-rainfall simulation over the complex terrain of the Sichuan Basin remains insufficiently documented. In particular, it is still unclear to what extent the assimilation of CMONOC GNSS-derived ZTD/PWV can improve the location, spatial extent, and intensity of heavy precipitation in this region. Therefore, this study aims to evaluate the impact of assimilating CMONOC GNSS tropospheric products on the numerical simulation of a persistent heavy-rainfall event over the Sichuan Basin in August 2020 using the WRF/WRFDA 3DVar cycling framework. In addition to the primary case, an additional heavy-rainfall event during 21–23 August 2021 is further used as a compact robustness test to examine whether the positive impact of GNSS assimilation is case-specific. The results are expected to provide case-based evidence for the application of ground-based GNSS data assimilation in heavy-rainfall forecasting over complex terrain. Specifically, this study aims to address the following scientific questions: (1) To what extent can the high-frequency assimilation of CMONOC GNSS ZTD/PWV correct the initial moisture and dynamic biases over the complex terrain of the Sichuan Basin? (2) How do these initial condition adjustments physically propagate to improve the simulation of the location, intensity, and vertical structure of heavy rainbands?

2. Materials and Methods

2.1. GNSS PWV Retrieval Principles

When GNSS signals pass through the troposphere, atmospheric refractivity alters the propagation speed of electromagnetic waves [2,21,22,23], resulting in a tropospheric delay. Projecting this delay onto the zenith direction and converting it into an equivalent path length yields the Zenith Total Delay (ZTD). The ZTD can be decomposed into the Zenith Hydrostatic Delay (ZHD) and the Zenith Wet Delay (ZWD):
Z T D = Z H D + Z W D
here, ZHD is mainly determined by surface pressure and is commonly estimated using station pressure together with empirical models such as the Saastamoinen formulation, whereas ZWD is directly related to atmospheric water vapor content and provides the key information for retrieving precipitable water vapor.
Precipitable Water Vapor (PWV) represents the column-integrated water vapor content from the surface to the top of the troposphere, typically expressed in millimeters. A linear conversion relationship generally exists between PWV and ZWD:
P W V = Π Z W D
where Π is the conversion factor, which is influenced by the weighted mean temperature of the atmosphere ( T m ), and can be expressed as:
Π = 10 6 ρ w R v k 2 + k 3 T m
in this equation, ρ w is the density of liquid water, R v is the specific gas constant for water vapor, and k 2 and k 3 are atmospheric refractivity constants. T m represents the weighted mean thermodynamic state of the water vapor column and is typically estimated from near-surface air temperature using an empirical relationship or computed from model fields. Because GNSS observations are continuous and are less sensitive to weather conditions, the retrieved PWV can capture moisture variations from minute-to-hour time scales and is therefore widely used for regional water vapor monitoring and for numerical model analysis and data assimilation studies [24].
The above decomposition and conversion relationships provide the theoretical link between GNSS-derived moisture information and the model humidity field, forming the basis for assimilating ZTD and PWV as observations. It should be noted that this study does not involve precise point positioning (PPP) or network processing of raw GNSS observations. Instead, the cycling assimilation experiments directly use station ZTD and PWV products released by CMONOC, together with the accompanying station pressure and temperature information, which are used for auxiliary constraints and consistency checks during assimilation input preparation [23,25,26].

2.2. WRFDA-3DVAR Assimilation System

This study employs the three-dimensional variational assimilation system (WRFDA-3DVAR) to fuse background fields with observational information at the assimilation time t a , generating the analysis field x a . This analysis field x a is defined as the state vector x that minimizes the scalar cost function J x :
x a = a r g m i n x J x
The cost function J x is defined as:
J x = 1 2 x x b T B 1 x x b + 1 2 y 0 H x T R 1 y 0 H x
where x is the model state vector (including wind, temperature, humidity, and surface pressure), and x b is the background field. The vector y 0 contains the observations (including surface temperature, pressure, and GNSS-related observations). H is the observation operator that maps the model state x from the model space to the observation space. The matrices B and R represent the background error covariance and observation error covariance, respectively; they determine the spatial spreading of analysis increments and the relative weights of the observations. The minimization process is driven by the observation innovation vector is
d = y o H x b
In this study, station-based PWV and ZTD are assimilated, and the observation operator H constructs the model-equivalent observations at the station locations through horizontal interpolation and vertical integration. For PWV assimilation, the observation operator corresponds to the column integration of the model water vapor profile. The model-equivalent PWV ( P W V b ) is calculated as:
P W V b = 1 ρ w g p t o p p s q p d p     1 ρ w g k = 1 K q k p k
where q k is the specific humidity at layer k , p k is the pressure thickness of that layer, p s is the surface pressure, ρ w is the density of liquid water, and g is gravitational acceleration. Similarly, for ZTD assimilation, the background equivalent ( Z T D b ) is derived from the vertical integration of atmospheric refractivity ( N ):
Z T D b = N z d z k N k z k
refractivity N is calculated from model pressure, temperature, and water vapor. Relevant model variables are horizontally interpolated to the station location before the vertical integration is performed [27].
Prior to entering the assimilation system, the observational data undergo pre-processing and quality control. Hourly ZTD and PWV records from CMONOC within a ± 3 h window centered on the analysis time are selected for assimilation, while records with missing data or obvious numerical anomalies are discarded. Crucially, the observation error variances in matrix R are configured using the uncertainty information provided directly in the CMONOC product files, ensuring that the assimilation weights reflect the quality of the observations. Additionally, the accompanying station pressure and temperature observations are used to constrain surface meteorological conditions, thereby ensuring consistency between the assimilated GNSS products and the thermodynamic state used in the observation operators [28]. The background error covariance matrix ( B ) was estimated using the National Meteorological Center (NMC) method. The control variable option CV3 was utilized, which defines the variables in physical space, including physical wind components ( u   a n d   v ), temperature ( T ), pseudo-relative humidity ( q ), and surface pressure ( p s ).

2.3. Model Configuration

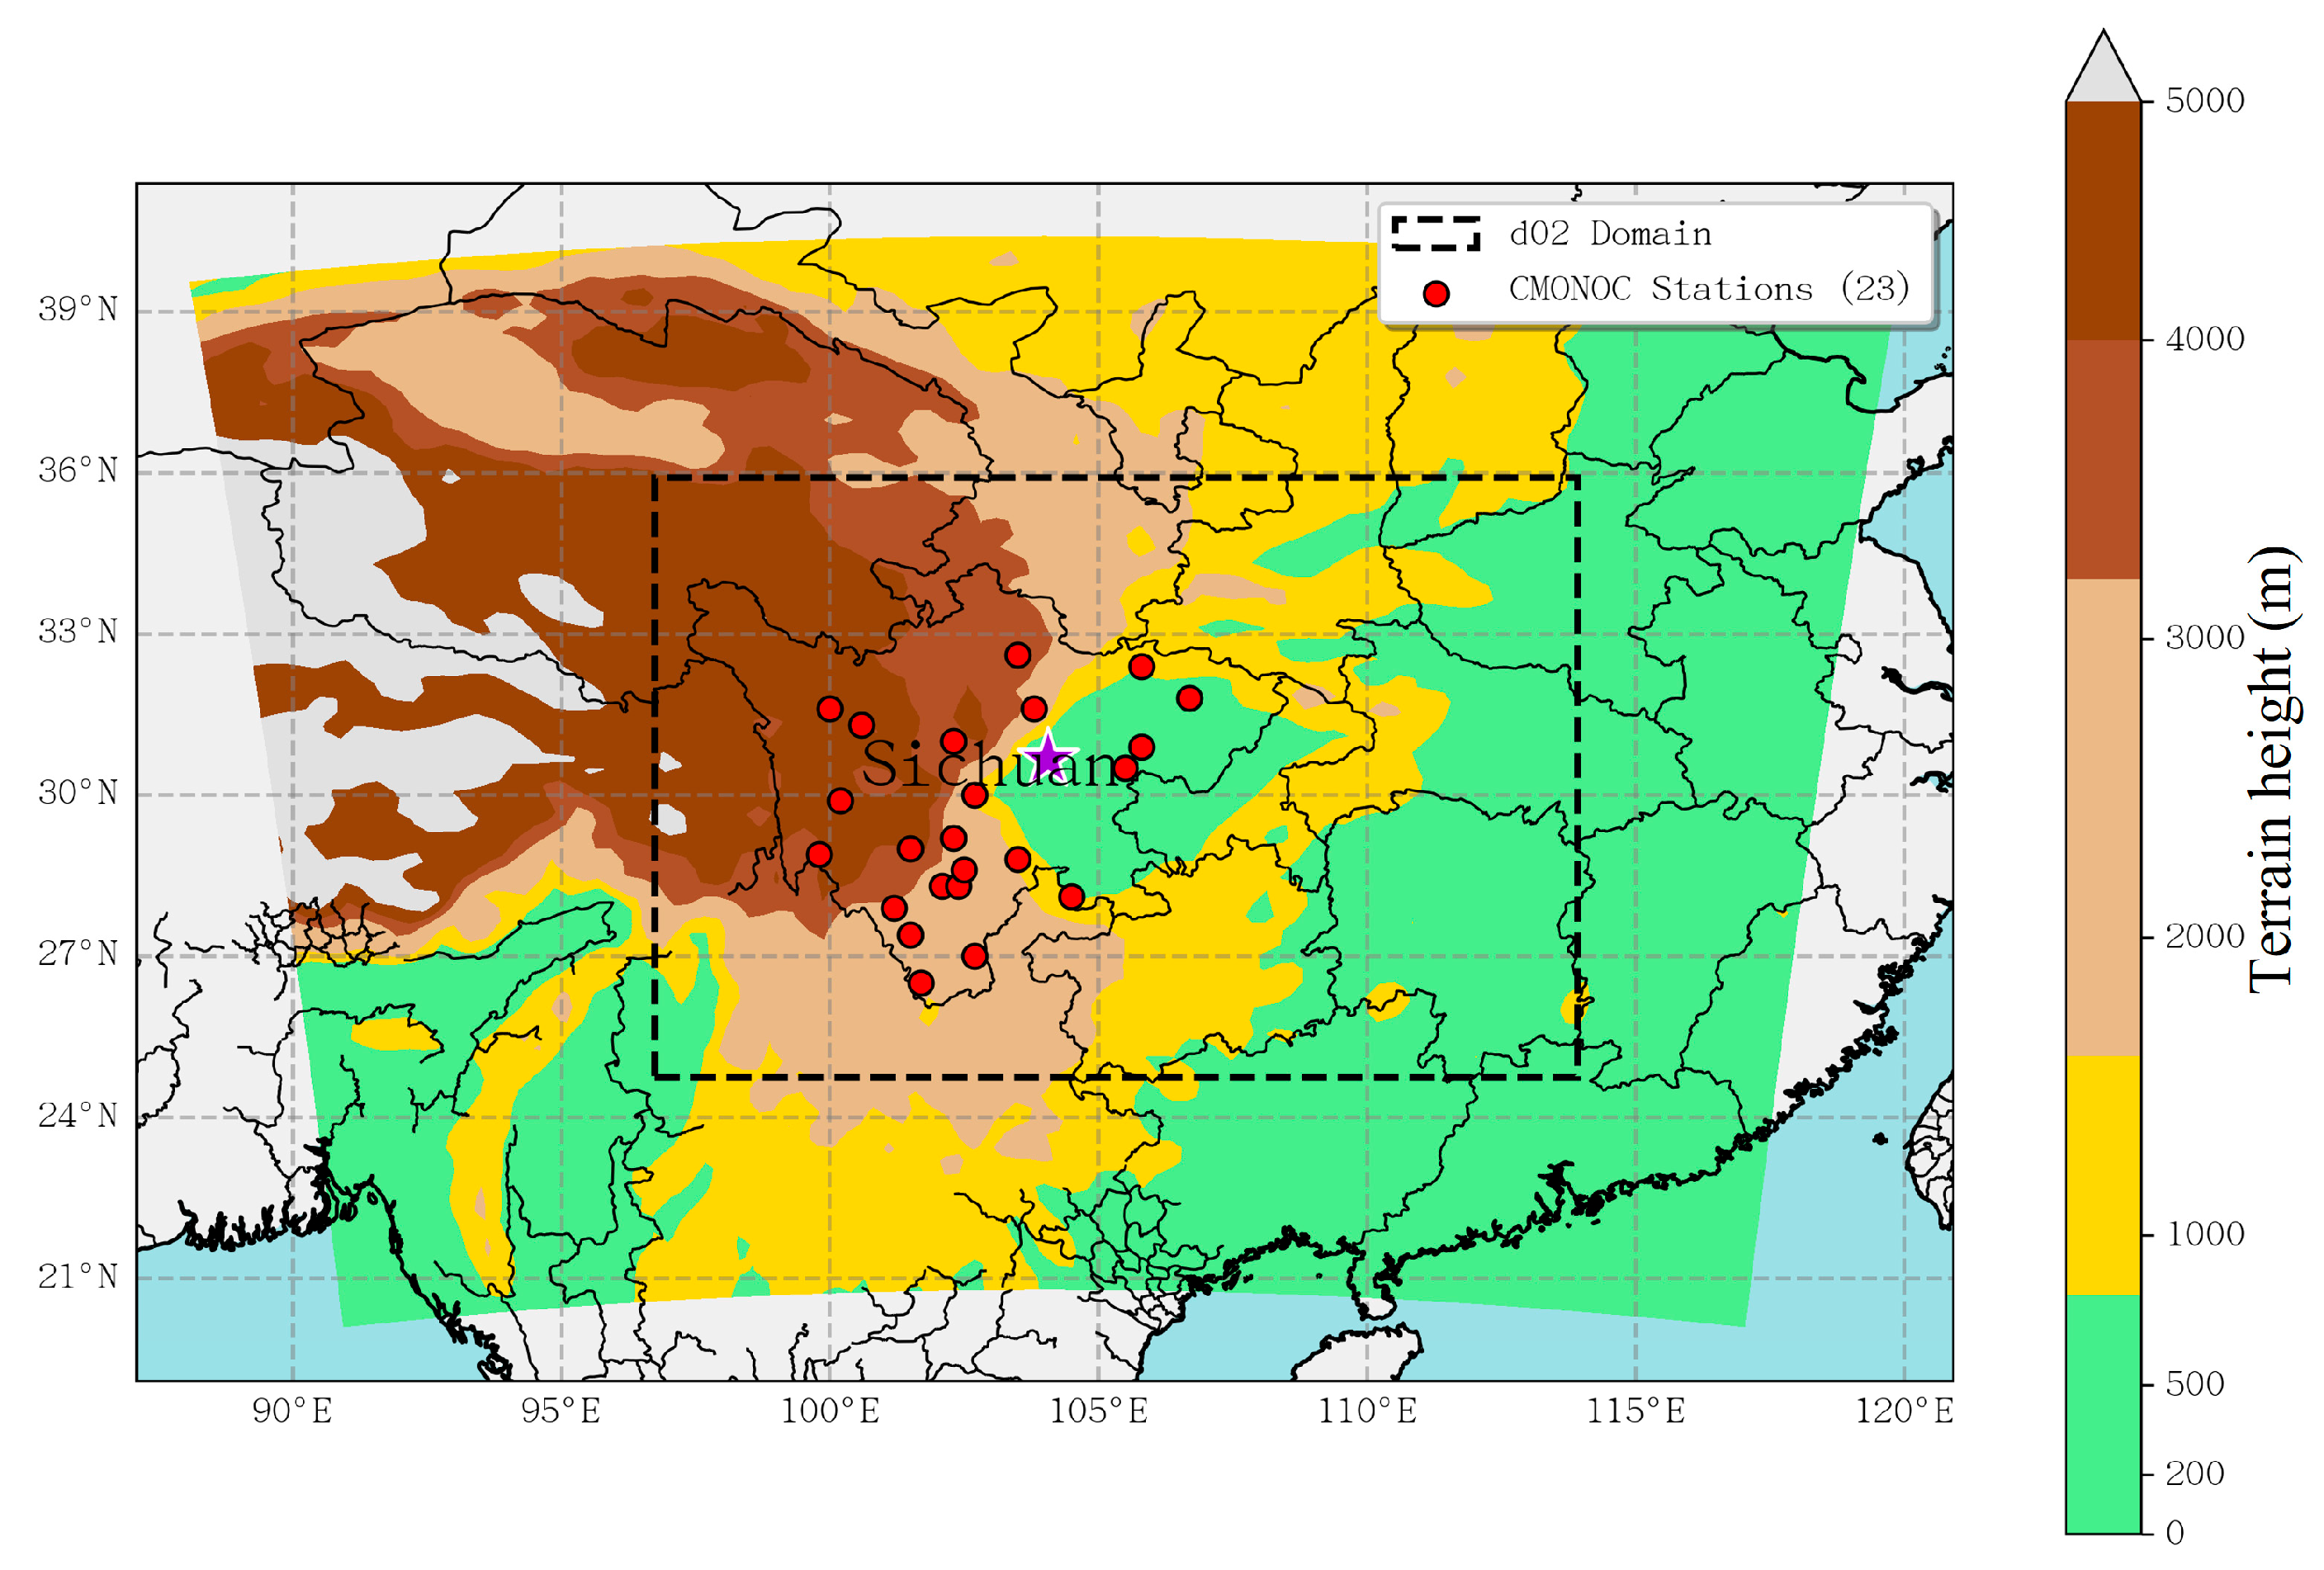
The numerical simulations were conducted using the WRF model (Version 4.2) for the persistent heavy rainfall event over the Sichuan Basin during 10–12 August 2020. The integration period spans from 00:00 UTC on 10 August to 00:00 UTC on 13 August 2020 (72 h). A two-way nested domain configuration was employed (Figure 1), with an outer domain at 27 km resolution and an inner domain at 9 km resolution focusing on the Sichuan Basin. The model center was set at 104.0°E, 30.0°N. The time steps were 120 s and 40 s for the outer and inner domains, respectively. The model used 45 vertical levels with the model top at 50 hPa. Detailed domain coverage and parameter settings are summarized in Table 1.
The main physical parameterization schemes included the WSM6 microphysics scheme, the RRTM longwave and Dudhia shortwave radiation schemes, the YSU planetary boundary layer scheme, the Noah land surface model, and the Kain–Fritsch cumulus parameterization scheme.

2.4. Data Description and Processing

2.4.1. Observations and Reanalysis Data

The datasets used in this study are categorized into three groups based on their application: assimilation observations, model initial and boundary conditions, and independent verification datasets.
Station-based GNSS tropospheric products from the Crustal Movement Observation Network of China (CMONOC) were used as the assimilated observations. In the study region (Sichuan and adjacent areas), CMONOC stations are relatively dense and provide hourly (60 min) products. The CMONOC files include ZTD, ZWD, and PWV together with associated uncertainty information [29]; auxiliary variables such as station pressure, air temperature, and ZHD are also provided, which supports assimilation input preparation and uncertainty specification.
The model initial conditions and lateral boundary conditions were taken from the NCEP Final (FNL) Analysis reanalysis. The FNL dataset has a spatial resolution of 0.25° × 0.25° and a temporal resolution of 6 h, providing three-dimensional atmospheric fields and surface variables as a consistent background source for mesoscale simulations.
Independent precipitation verification was conducted using the Integrated Multi-satellitE Retrievals for Global Precipitation Measurement (GPM) (IMERG) Final Run (V06B), released via NASA Earthdata. This product has a spatial resolution of 0.1° × 0.1° and a temporal resolution of 30 min; in this study, hourly IMERG precipitation from 00:00 UTC 10 August to 00:00 UTC 13 August 2020 was bilinearly interpolated to the WRF grids for consistent comparison.
In addition, upper-air sounding temperature observations at Chongqing (Shapingba) were used to evaluate the simulated vertical thermal structure by interpolating model temperature profiles to the station location and corresponding times.

2.4.2. Pre-Assimilation Background–Observation Difference Assessment

Prior to data assimilation, background–observation differences between the NCEP FNL fields and CMONOC GNSS observations were assessed to characterize potential biases in the initial moisture-related field [2,3,8,30,31]. The 6-hourly FNL atmospheric variables (temperature, relative humidity, and pressure) were bilinearly interpolated to the GNSS station locations. Using these interpolated fields, a background-equivalent ZTD, Z T D F N L , was derived following the same forward-operator logic as adopted in the assimilation system (Section 2.2) and compared with the observed ZTD, Z T D O B S .
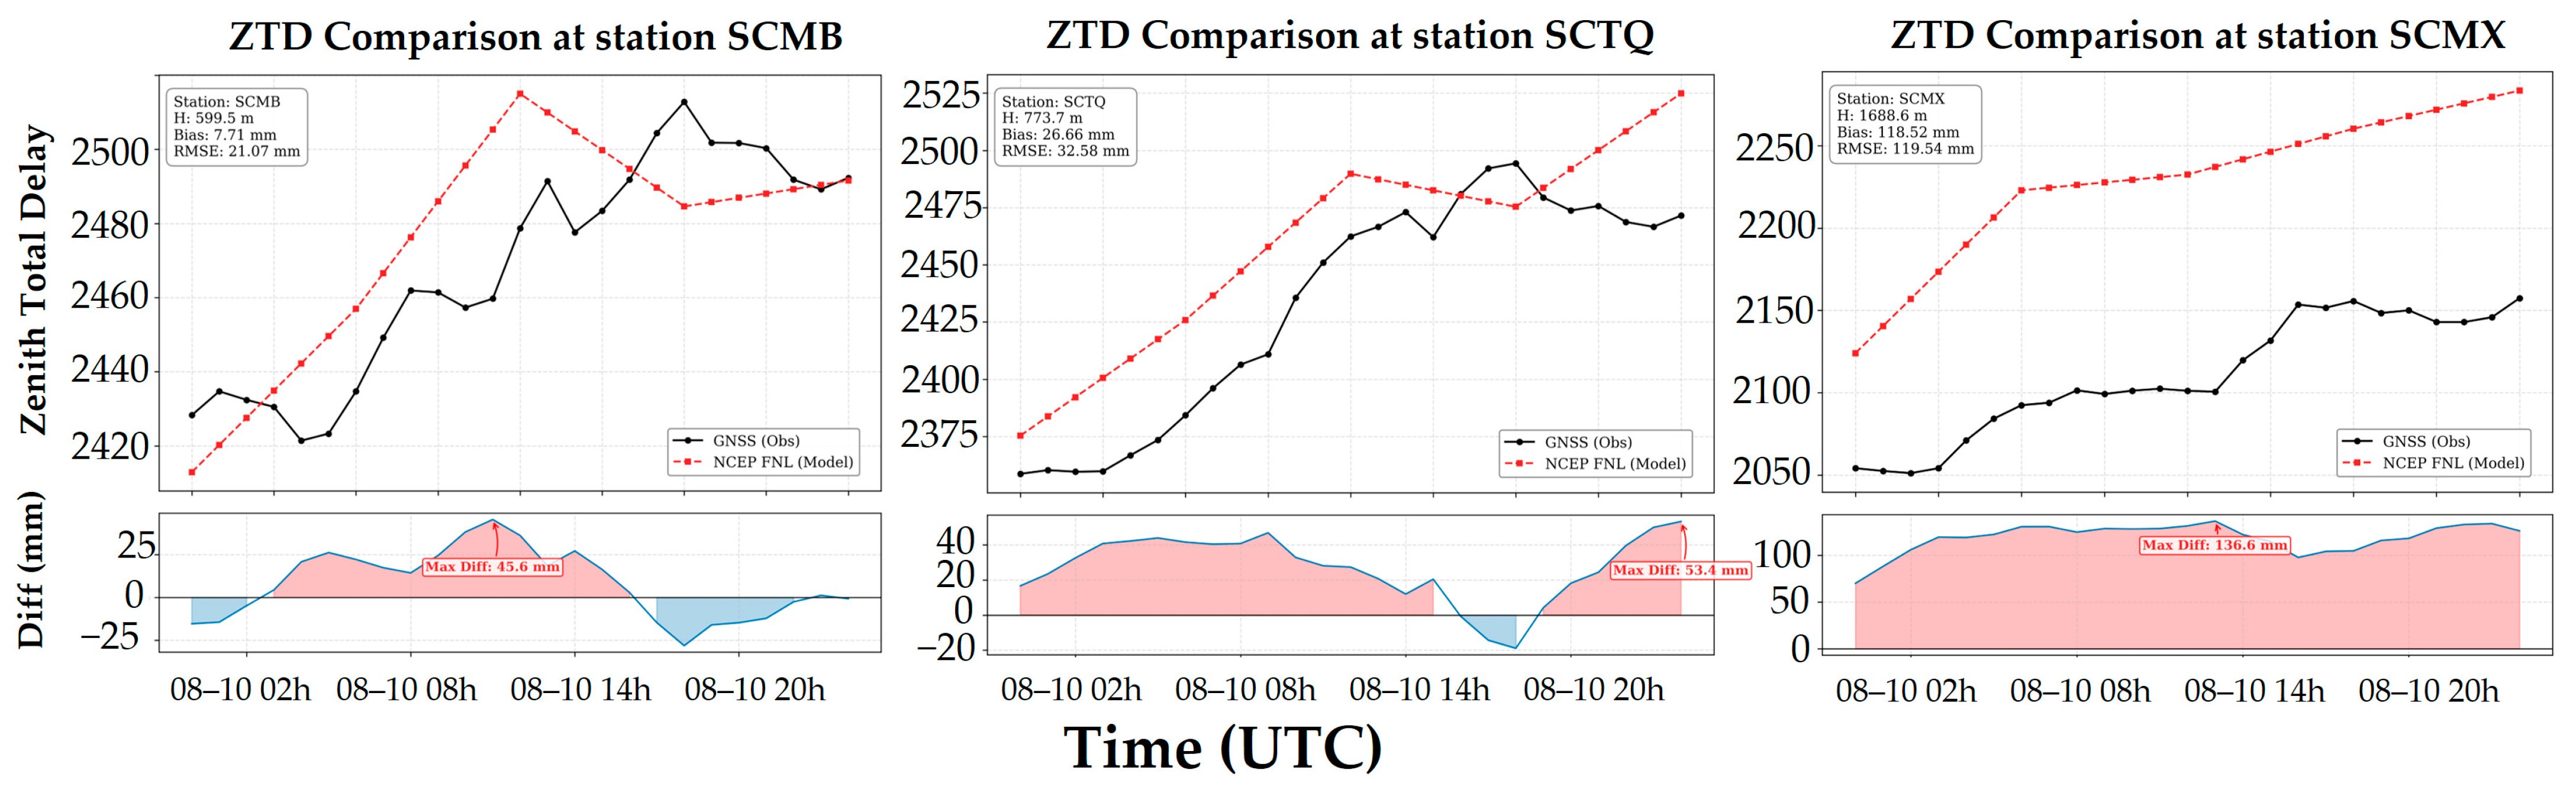
Figure 2 shows ZTD time series at three representative stations with different elevations: SCMB (low altitude), SCTQ (medium altitude), and SCMX (high altitude). While the FNL background captures the overall temporal evolution, systematic deviations are evident. At SCMB, the discrepancy is relatively small (mean bias ≈ 7.7 mm; RMSE ≈ 21.1 mm). At SCTQ, FNL tends to overestimate ZTD during the convective development stage (mean bias ≈ 26.7 mm; RMSE ≈ 32.6 mm). The deviation is most pronounced at SCMX, where FNL consistently overestimates ZTD throughout the period (mean bias ≈ 118.5 mm), with a maximum instantaneous difference of approximately 136.6 mm.
Overall, statistics from the 23 CMONOC stations indicate a general positive bias in the FNL-derived ZTD over this region, especially at high-elevation sites in complex terrain. These systematic background errors provide a strong motivation for assimilating GNSS-derived ZTD and PWV observations to improve the initial analysis before numerical integration. The practical implementation of the assimilation procedure used in this study is described in Section 2.5.

2.5. Experimental Design

To evaluate the impact of assimilating Crustal Movement Observation Network of China (CMONOC) GNSS tropospheric products on the simulation of this heavy-rainfall event, two numerical experiments were conducted: a Control (CTRL) experiment and a Data Assimilation (DA) experiment. The two experiments shared identical model domains, physical parameterization schemes, and lateral boundary conditions (updated every 6 h from NCEP FNL) in order to isolate the effect of GNSS data assimilation.
The CTRL experiment was initialized at 00:00 UTC on 10 August 2020 using the FNL analysis as the initial condition (cold start) and was integrated continuously for 72 h until 00:00 UTC on 13 August 2020, without assimilating any additional observations. This experiment provides the baseline performance of WRF for this event in the absence of GNSS moisture constraints.
In contrast, the DA experiment employed a 6 h cycling assimilation strategy using the WRFDA 3DVar system. The assimilation window was set to ±3 h centered on each analysis time, and cycling assimilation was performed every 6 h at 00:00, 06:00, 12:00, and 18:00 UTC throughout the simulation period. At the initial time (00:00 UTC on 10 August), the FNL analysis was used as the background field, whereas for all subsequent cycles, the 6 h short-term forecast from the previous cycle served as the background field. At each analysis step, CMONOC station ZTD and PWV observations from 23 stations within the assimilation window were assimilated to update the background field and generate a new analysis field, which was then used to restart the model for the next 6 h integration. Standard WRFDA quality control was applied before assimilation to remove missing and grossly inconsistent observations. This cycling scheme ensures that the model moisture and dynamical fields are continuously constrained by the high-temporal-resolution GNSS observations throughout the evolution of the rainfall event. The same experimental setup was also applied to an additional heavy-rainfall event during 21–23 August 2021, and the corresponding results are presented in Section 4.4.

3. Results and Verification

This section evaluates how well the model reproduces the observed rainfall evolution over the Sichuan Basin, focusing on spatial distribution and quantitative verification against satellite-based precipitation and independent observations.

3.1. Overview of the Heavy Rainfall Event

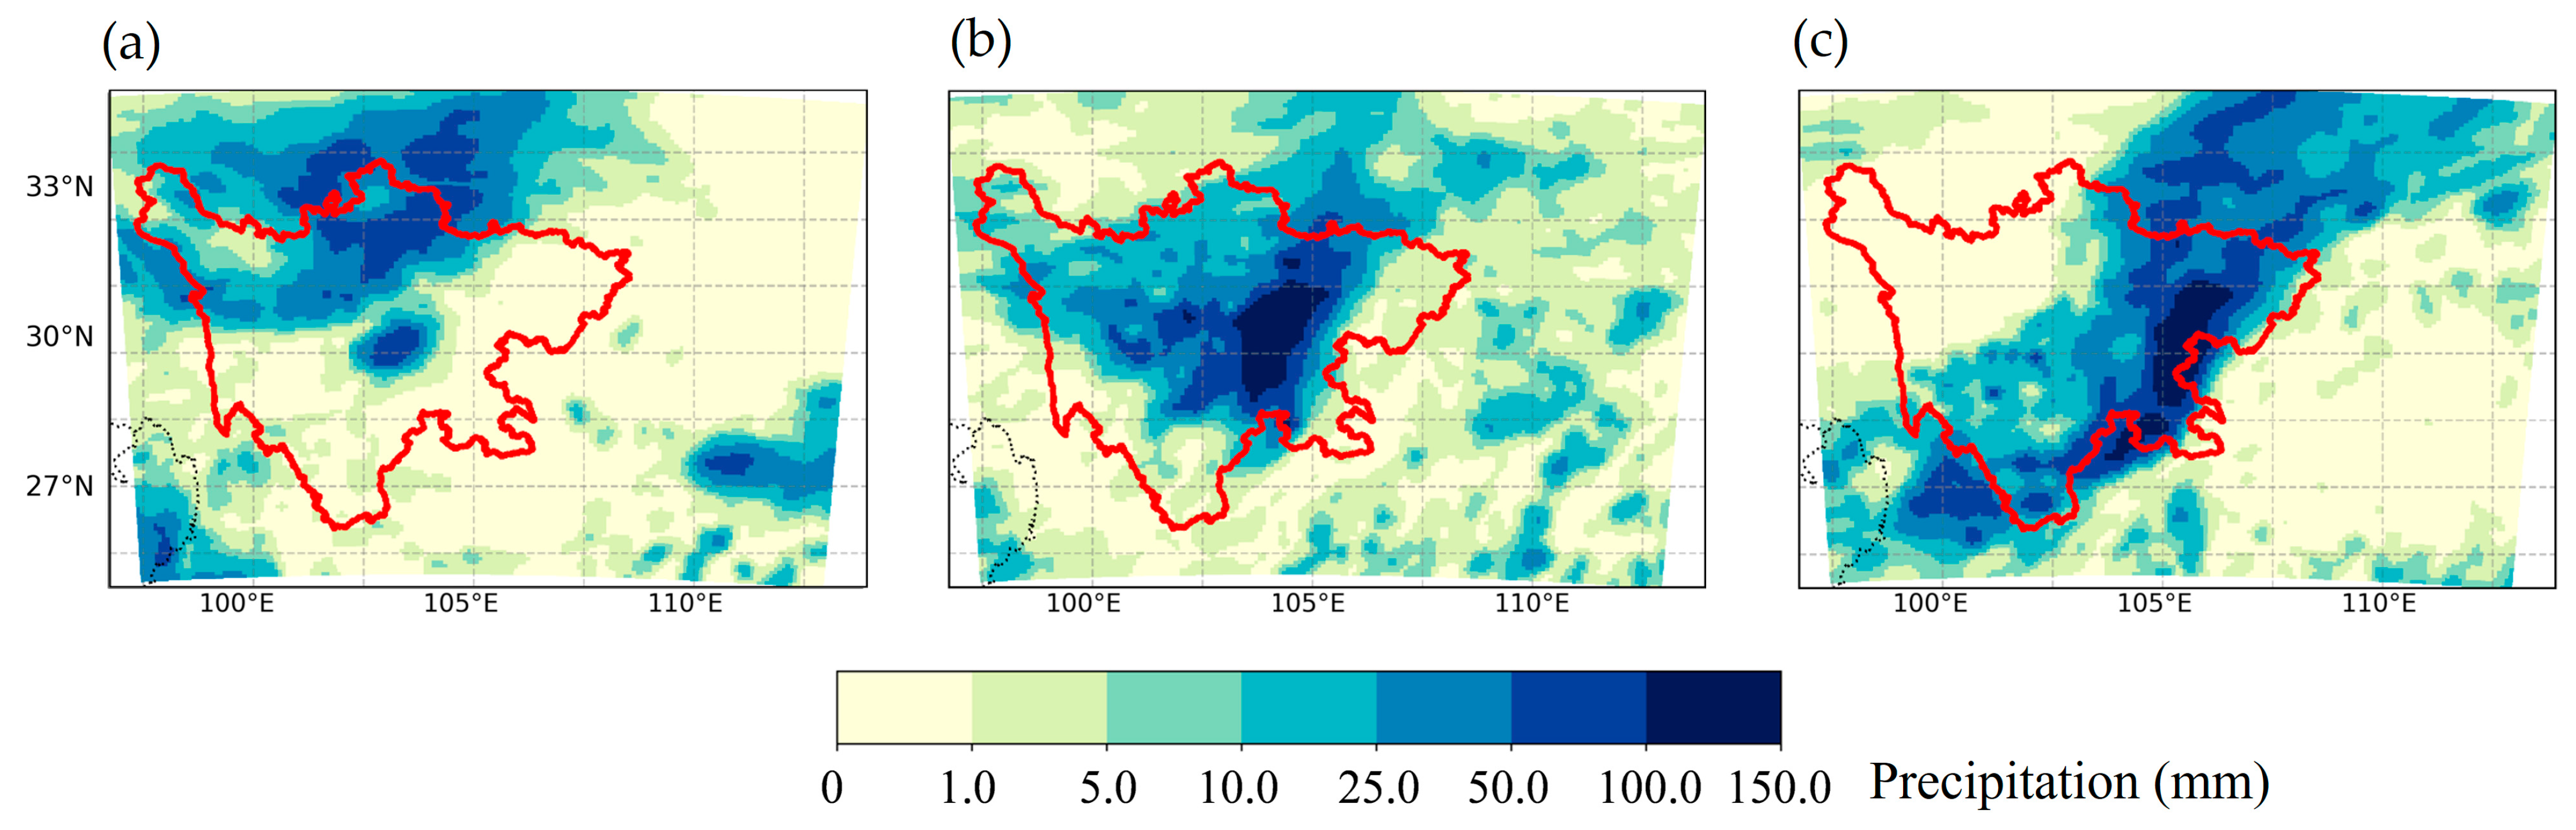
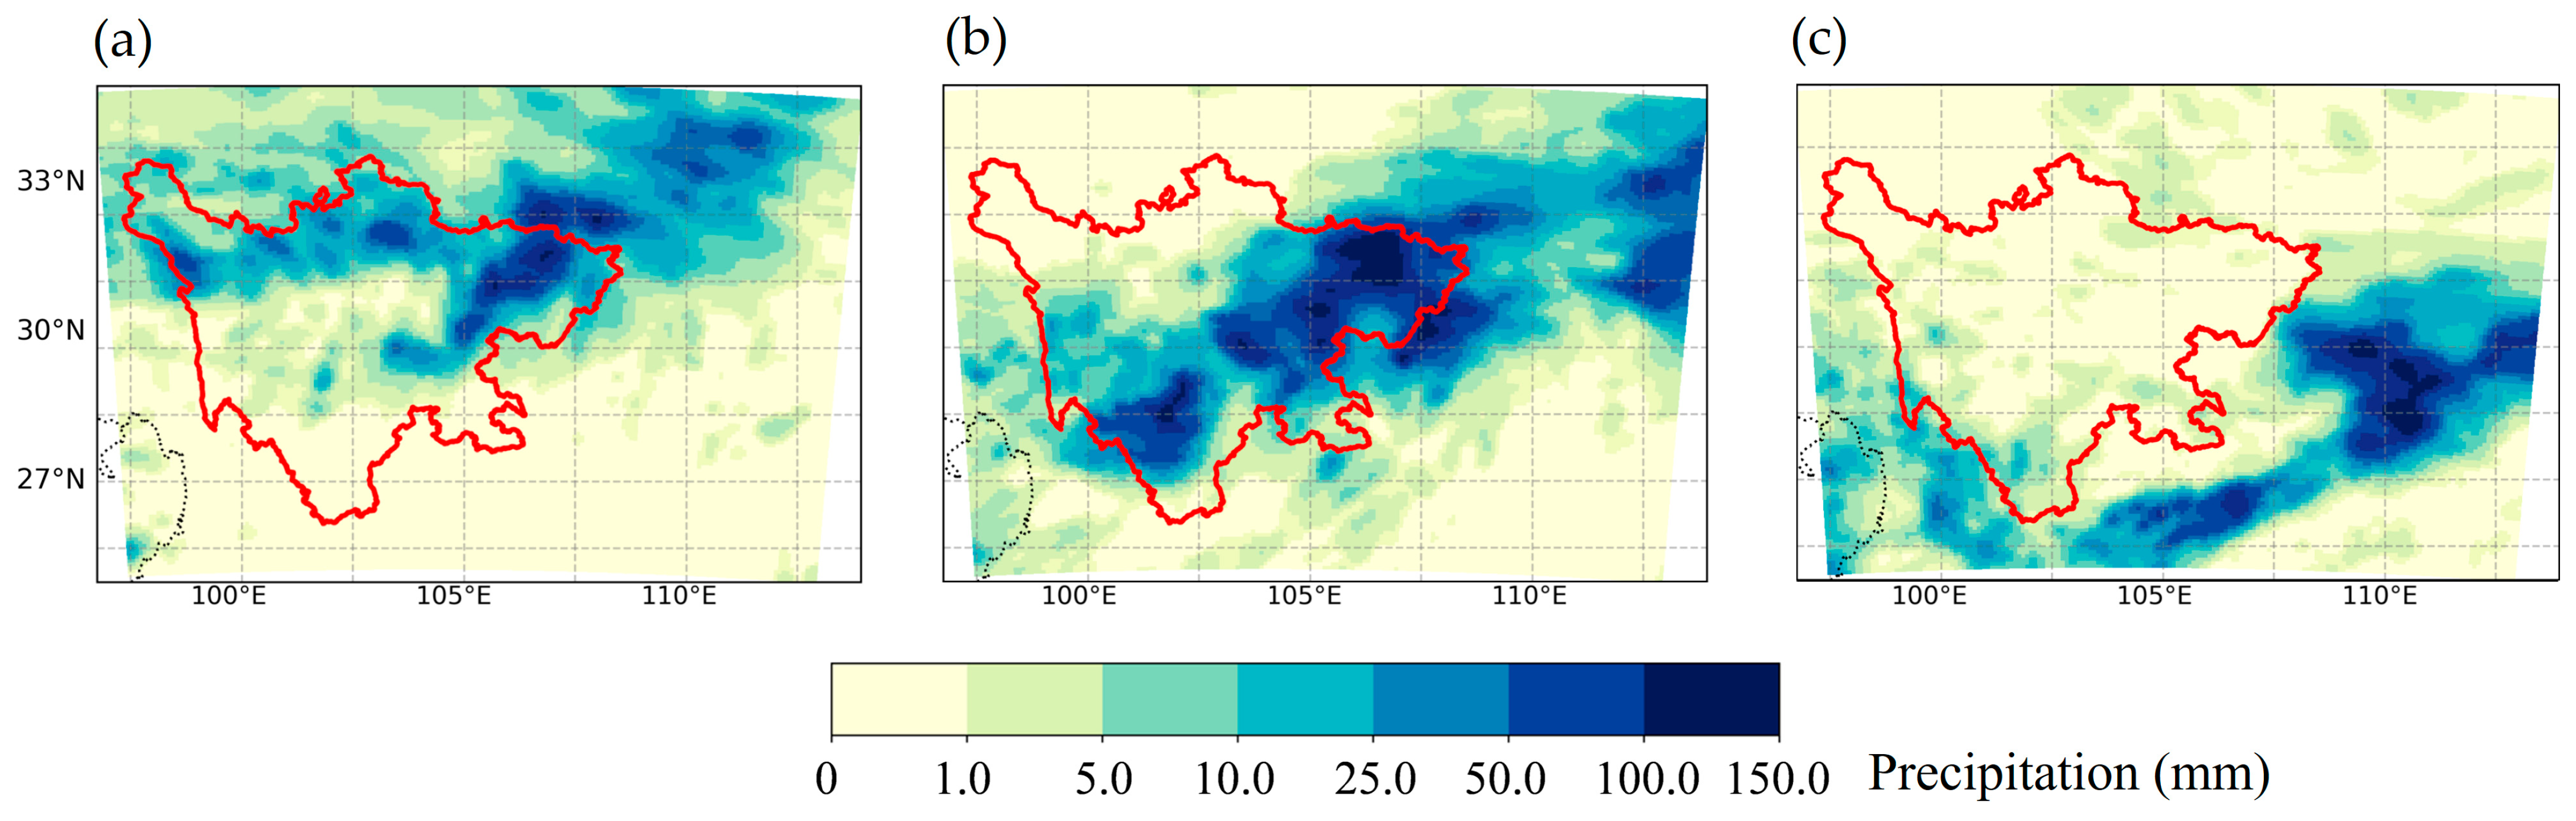
The study region is centered on the main impacted area of this heavy rainfall event, covering the Sichuan Basin and its surrounding areas. To provide an observational reference for subsequent model evaluation, this study uses the Global Precipitation Measurement (GPM) IMERG Final Run (V06B) multi-source merged precipitation product (0.1° spatial resolution and 30 min temporal resolution) to derive daily accumulated precipitation for 10–12 August 2020 (00–24 UTC) and to map the corresponding spatial distributions (Figure 3).

3.2. Spatial Distribution of Precipitation

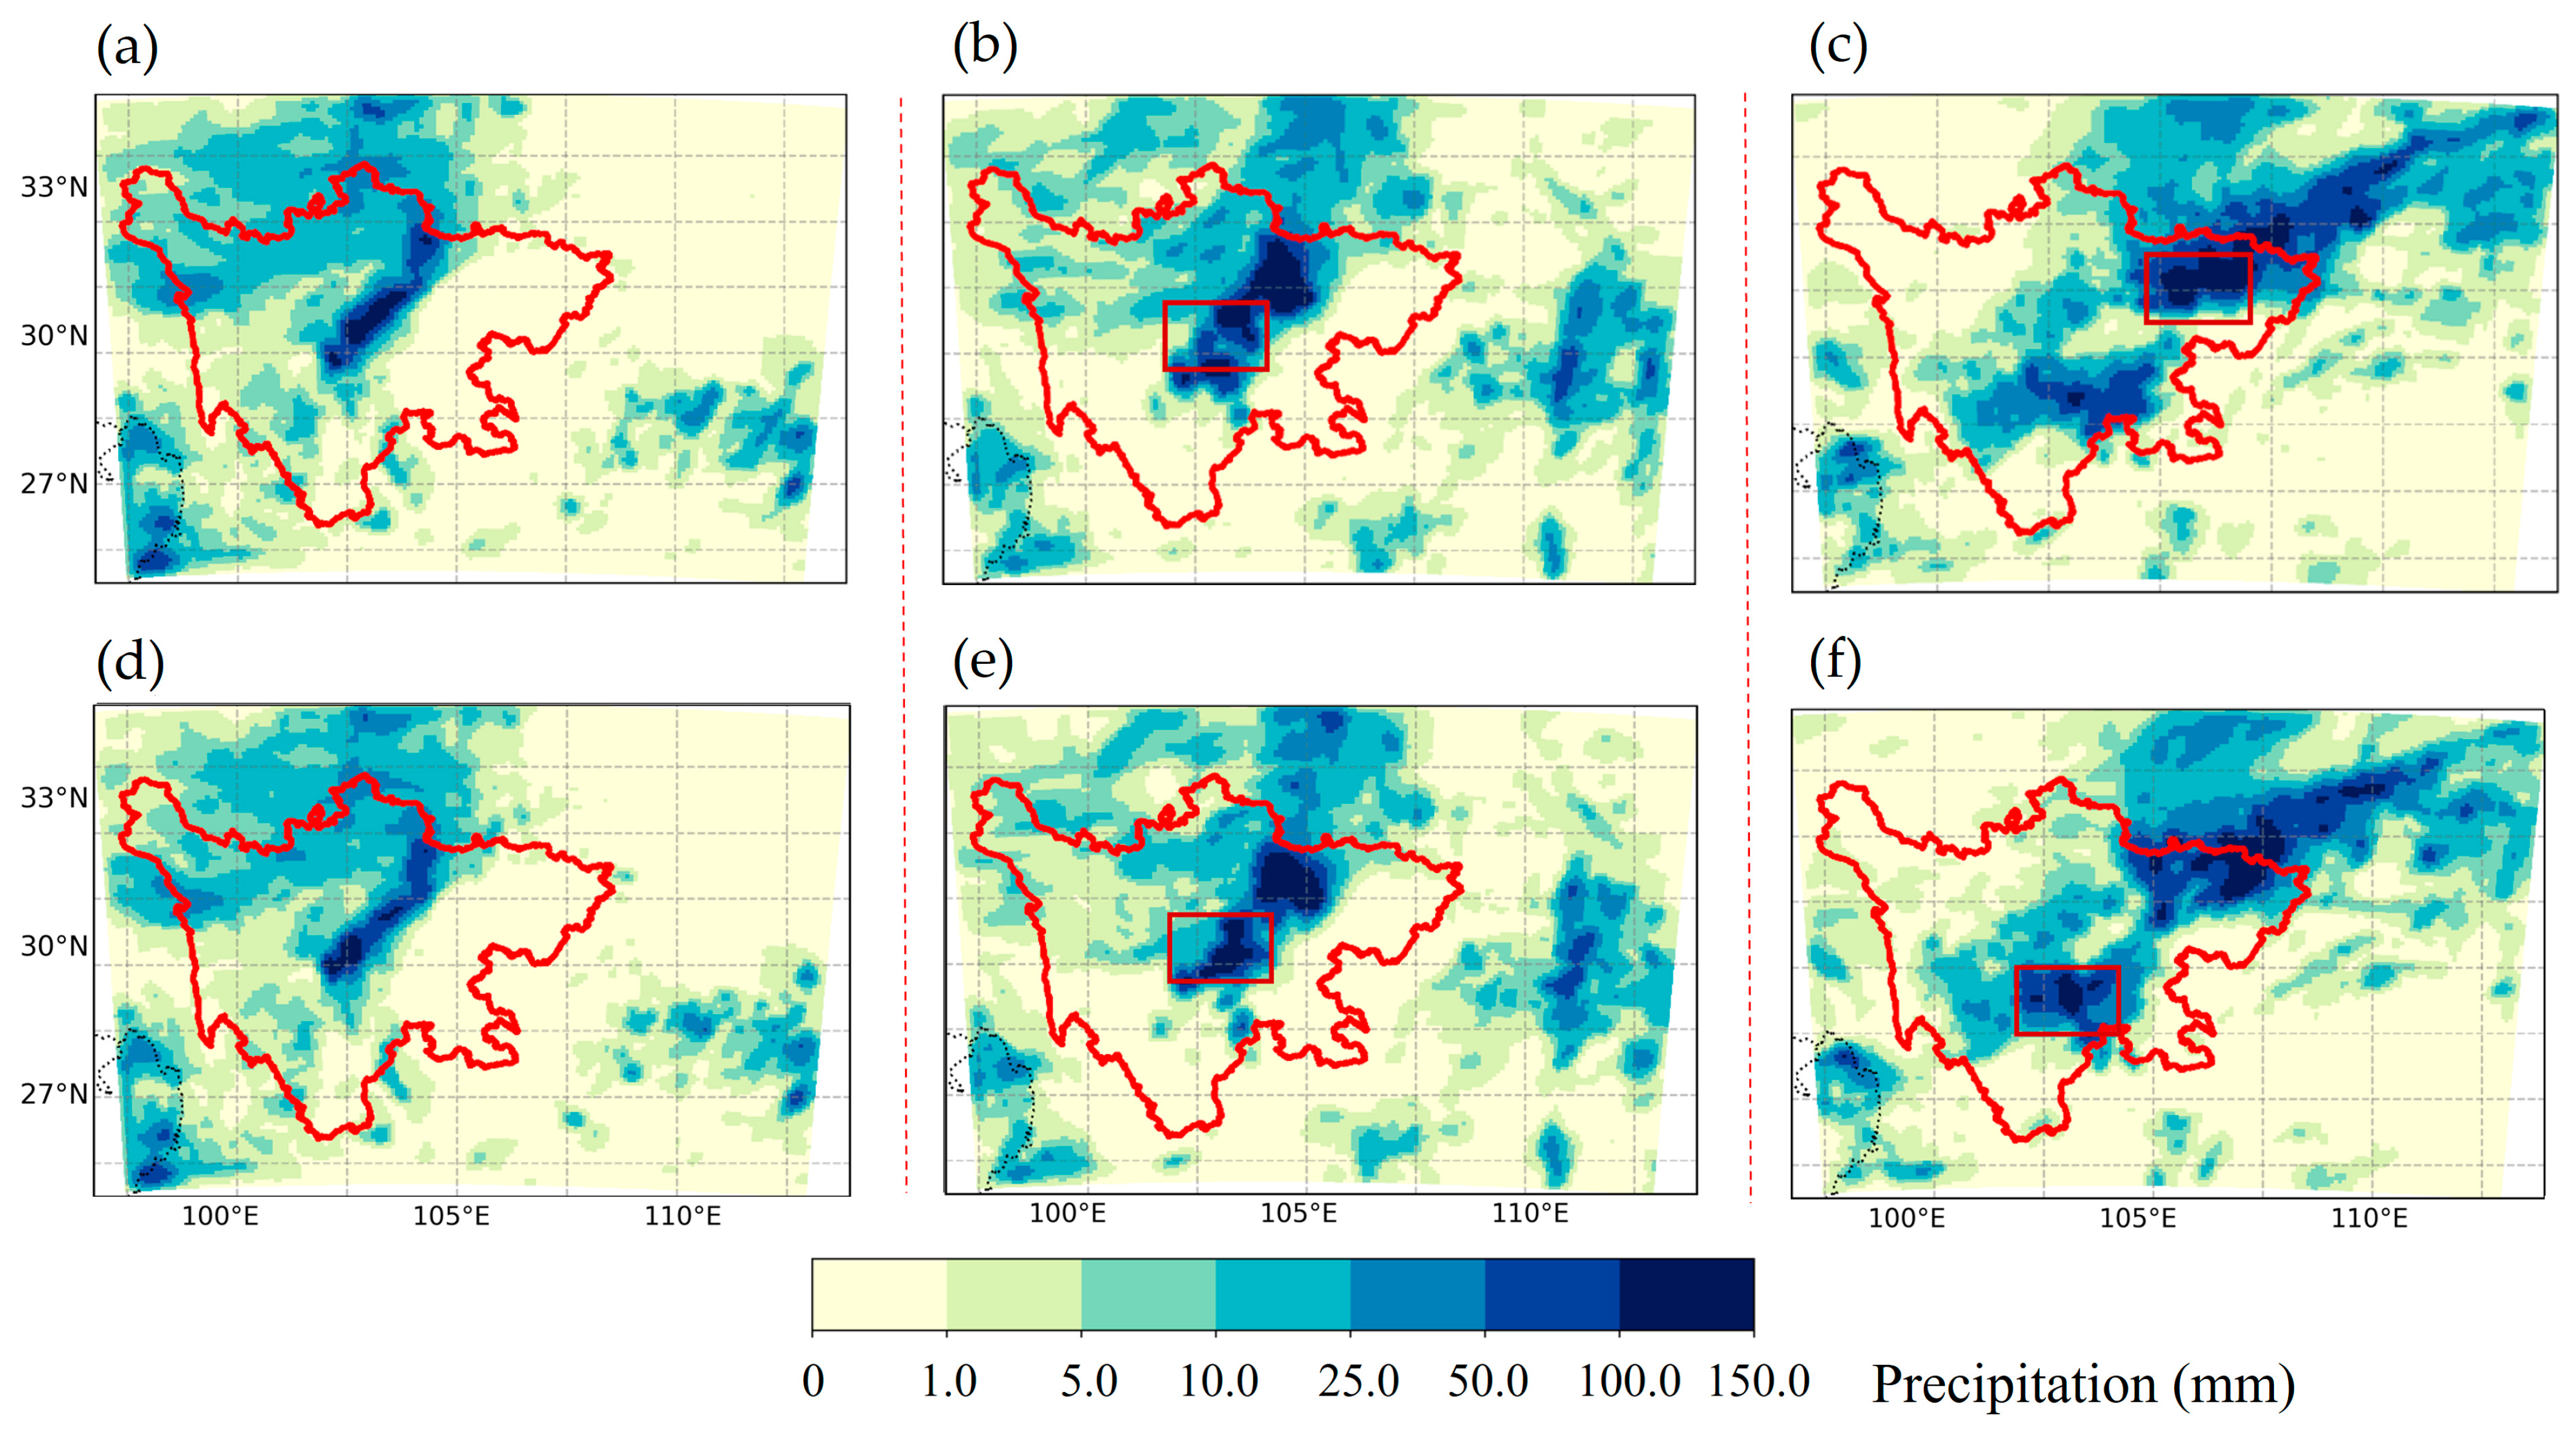
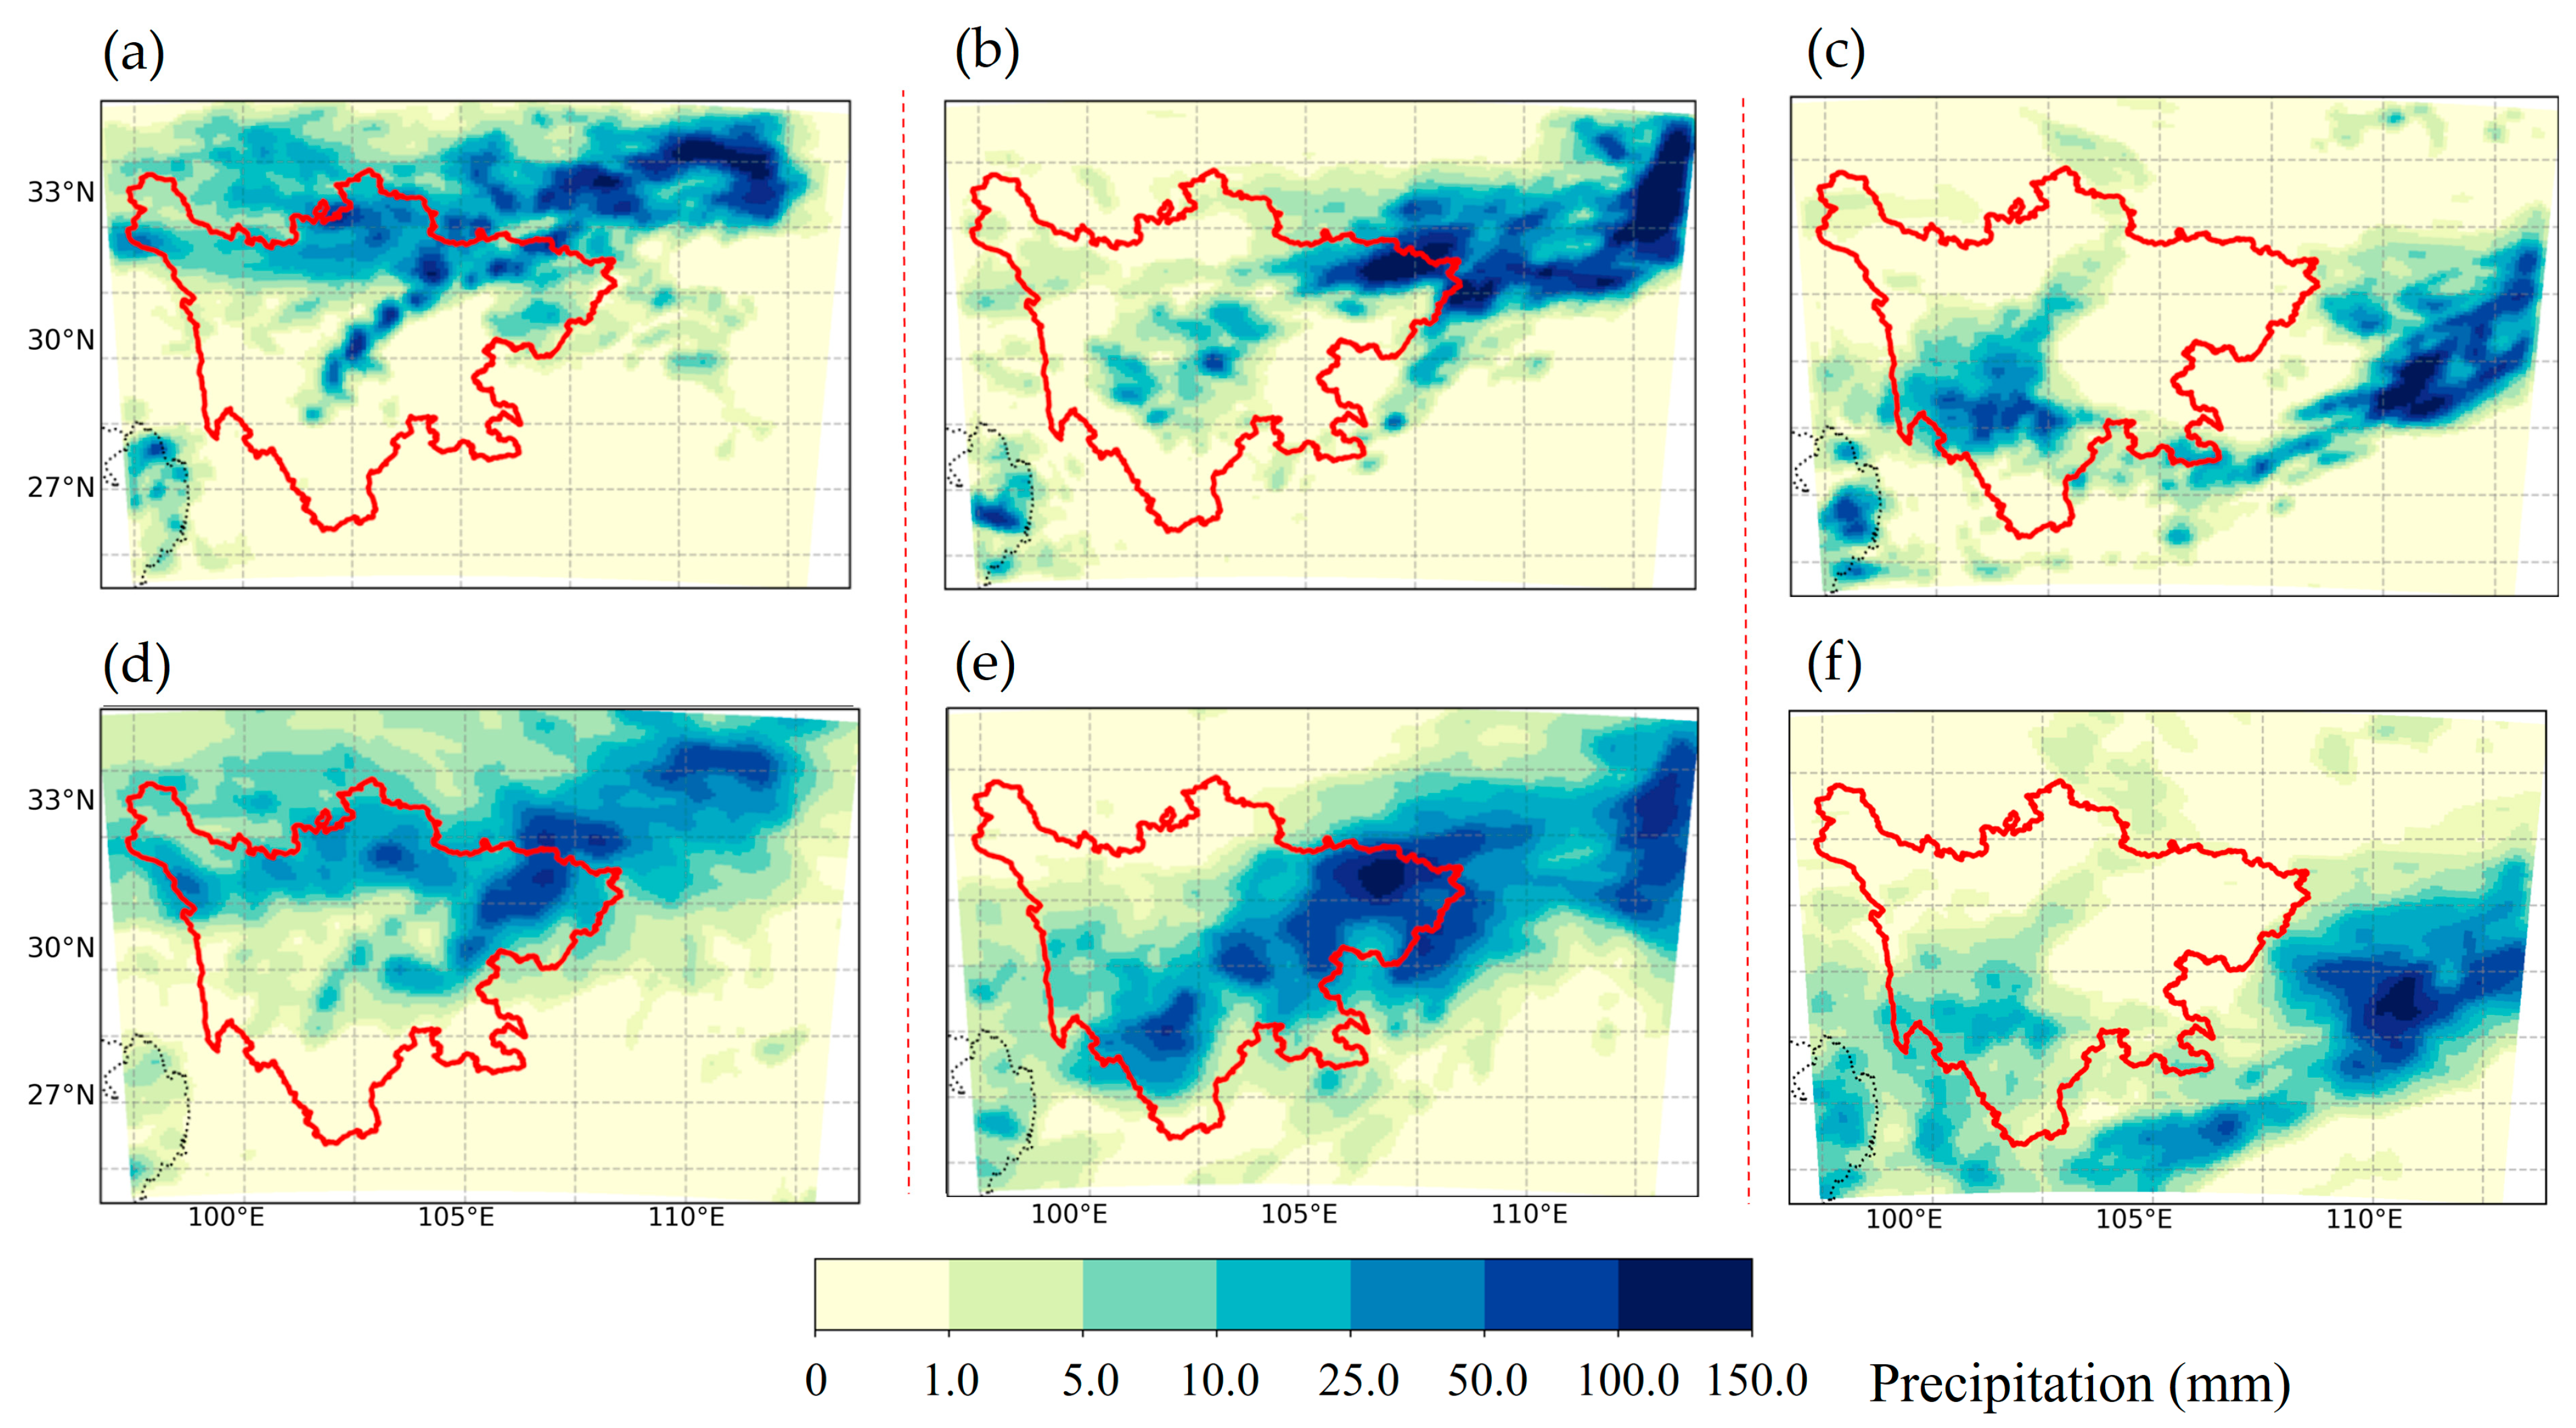
Figure 4 presents the simulated daily accumulated precipitation (24 h) for both the CTRL and DA experiments from 10 to 12 August 2020. The top row (Figure 4a–c) shows the results for the CTRL experiment, while the bottom row (Figure 4d–f) displays those for the DA experiment. To facilitate comparison, key heavy rainfall areas exhibiting significant differences are marked with red rectangles.
For the CTRL experiment, the simulation generally underestimates the rainfall extent and intensity. On 10 August (Figure 4a), precipitation is localized in the northwestern basin with a relatively small coverage area. By 11 August (Figure 4b), although the rainfall intensity increases, the heavy rainfall center is displaced northward compared to the observations (refer to Figure 3b). On 12 August (Figure 4c), the rainband remains situated to the north, failing to fully capture the observed southeastward propagation of the system. In contrast, the DA experiment better reproduces the “strengthen–sustain–advance” evolution of the rainfall event. On 10 August (Figure 4d), the simulated rainband morphology is more consistent with observations. On 11 August (Figure 4e), the heavy rainfall center is more concentrated and correctly positioned in the western basin. On 12 August (Figure 4f), the DA experiment successfully captures the southeastward movement of the rainband, showing a clear advancement trend that aligns well with the observed evolution.
A detailed comparison of the key regions further highlights the improvements brought by data assimilation. On 10 August, the observed rainfall center in the northwestern basin reached approximately 40 mm (Figure 3a). The CTRL experiment significantly underestimated this, producing only about 15 mm (Figure 4a), whereas the DA experiment adjusted the intensity to approximately 25 mm (Figure 4d), bringing it closer to reality. During the peak phase on 11 August, observations indicated a heavy rainfall center exceeding 100 mm in the western basin (Figure 3b). The CTRL experiment simulated a peak of only ~45 mm with a notable northward displacement (Figure 4b). The DA experiment, however, captured the location accurately and simulated a peak intensity of ~80 mm (Figure 4e), significantly reducing the underestimation. Finally, on 12 August, while the CTRL experiment continued to place the rainband too far north (Figure 4c), the DA experiment correctly reproduced the heavy rainfall structure in the southeastern basin (Figure 4f). Overall, the comparison demonstrates that the DA experiment outperforms the CTRL experiment in characterizing the spatial distribution, intensity, and temporal evolution of the heavy-rainfall event.

3.3. Quantitative Verification (Threat Score)

To provide a quantitative assessment of precipitation skill for CTRL and DA, the Threat Score (TS) was computed by comparing model precipitation against the reference Global Precipitation Measurement (GPM) IMERG precipitation field on the same grid. TS is defined as:
T S = H H + M + F
where H denotes “hits” (both model and reference exceed a specified threshold), M denotes “misses” (reference exceeds the threshold but the model does not), and F denotes “false alarms” (model exceeds the threshold but the reference does not). TS ranges from 0 to 1, with higher values indicating better agreement in the precipitation area for the given threshold.
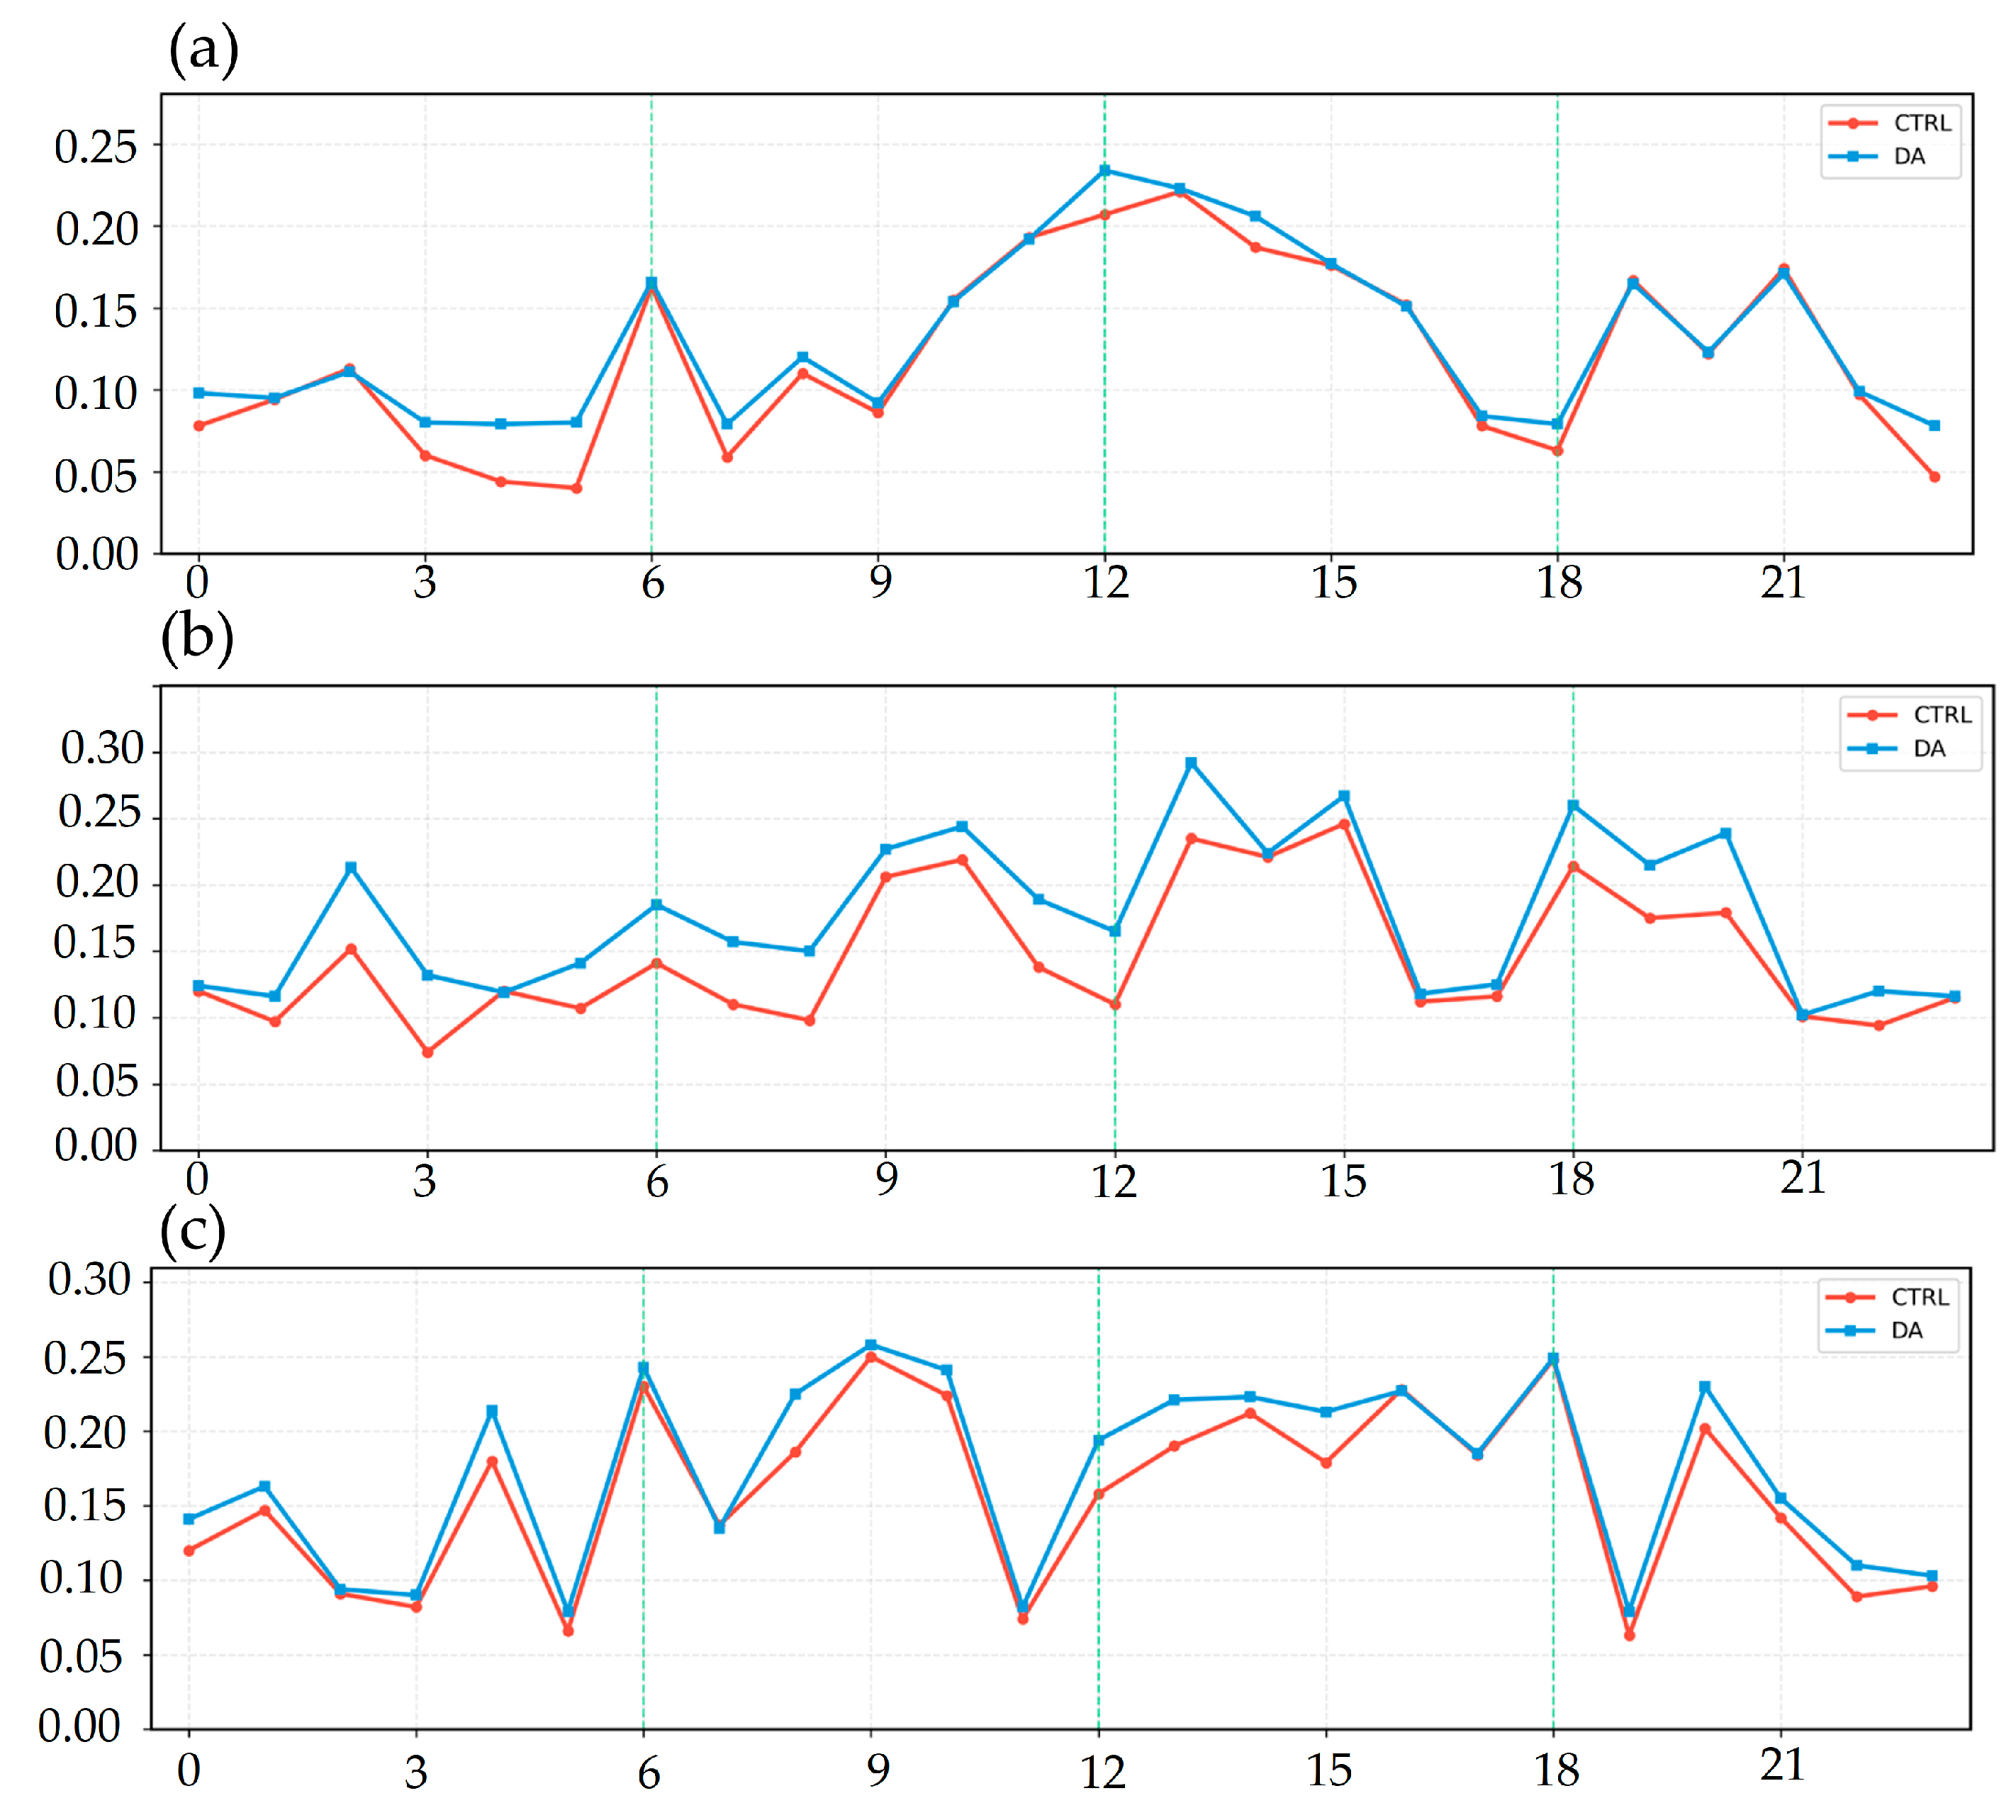
To evaluate the capability of reproducing the temporal evolution of rainfall, an hourly threshold of 2 mm h 1 is used to determine H , M and F , and TS is calculated at each hour for the three days (10–12 August 2020). As shown in Figure 5, the DA experiment achieves a higher TS than CTRL for most hours, with the advantage being most stable during the peak stage on 11 August. The maximum hourly TS of DA reaches 0.292 at 13 UTC on 11 August, whereas the maximum of CTRL is 0.250 at 09 UTC on 12 August. The largest hourly improvement occurs at 02 UTC on 11 August, when TS increases from 0.152 (CTRL) to 0.213 (DA), i.e., a gain of 0.061. In terms of daily statistics, the daily maximum TS of CTRL and DA is 0.221 and 0.234 on 10 August, 0.246 and 0.292 on 11 August, and 0.250 and 0.258 on 12 August, respectively; DA outperforms CTRL in 18/24, 23/24, and 22/24 h for the three days. These results suggest that cycling assimilation of CMONOC GNSS ZTD/PWV provides a more consistent hour-by-hour constraint on the precipitation pattern, especially during the development and maintenance stages of heavy rainfall.
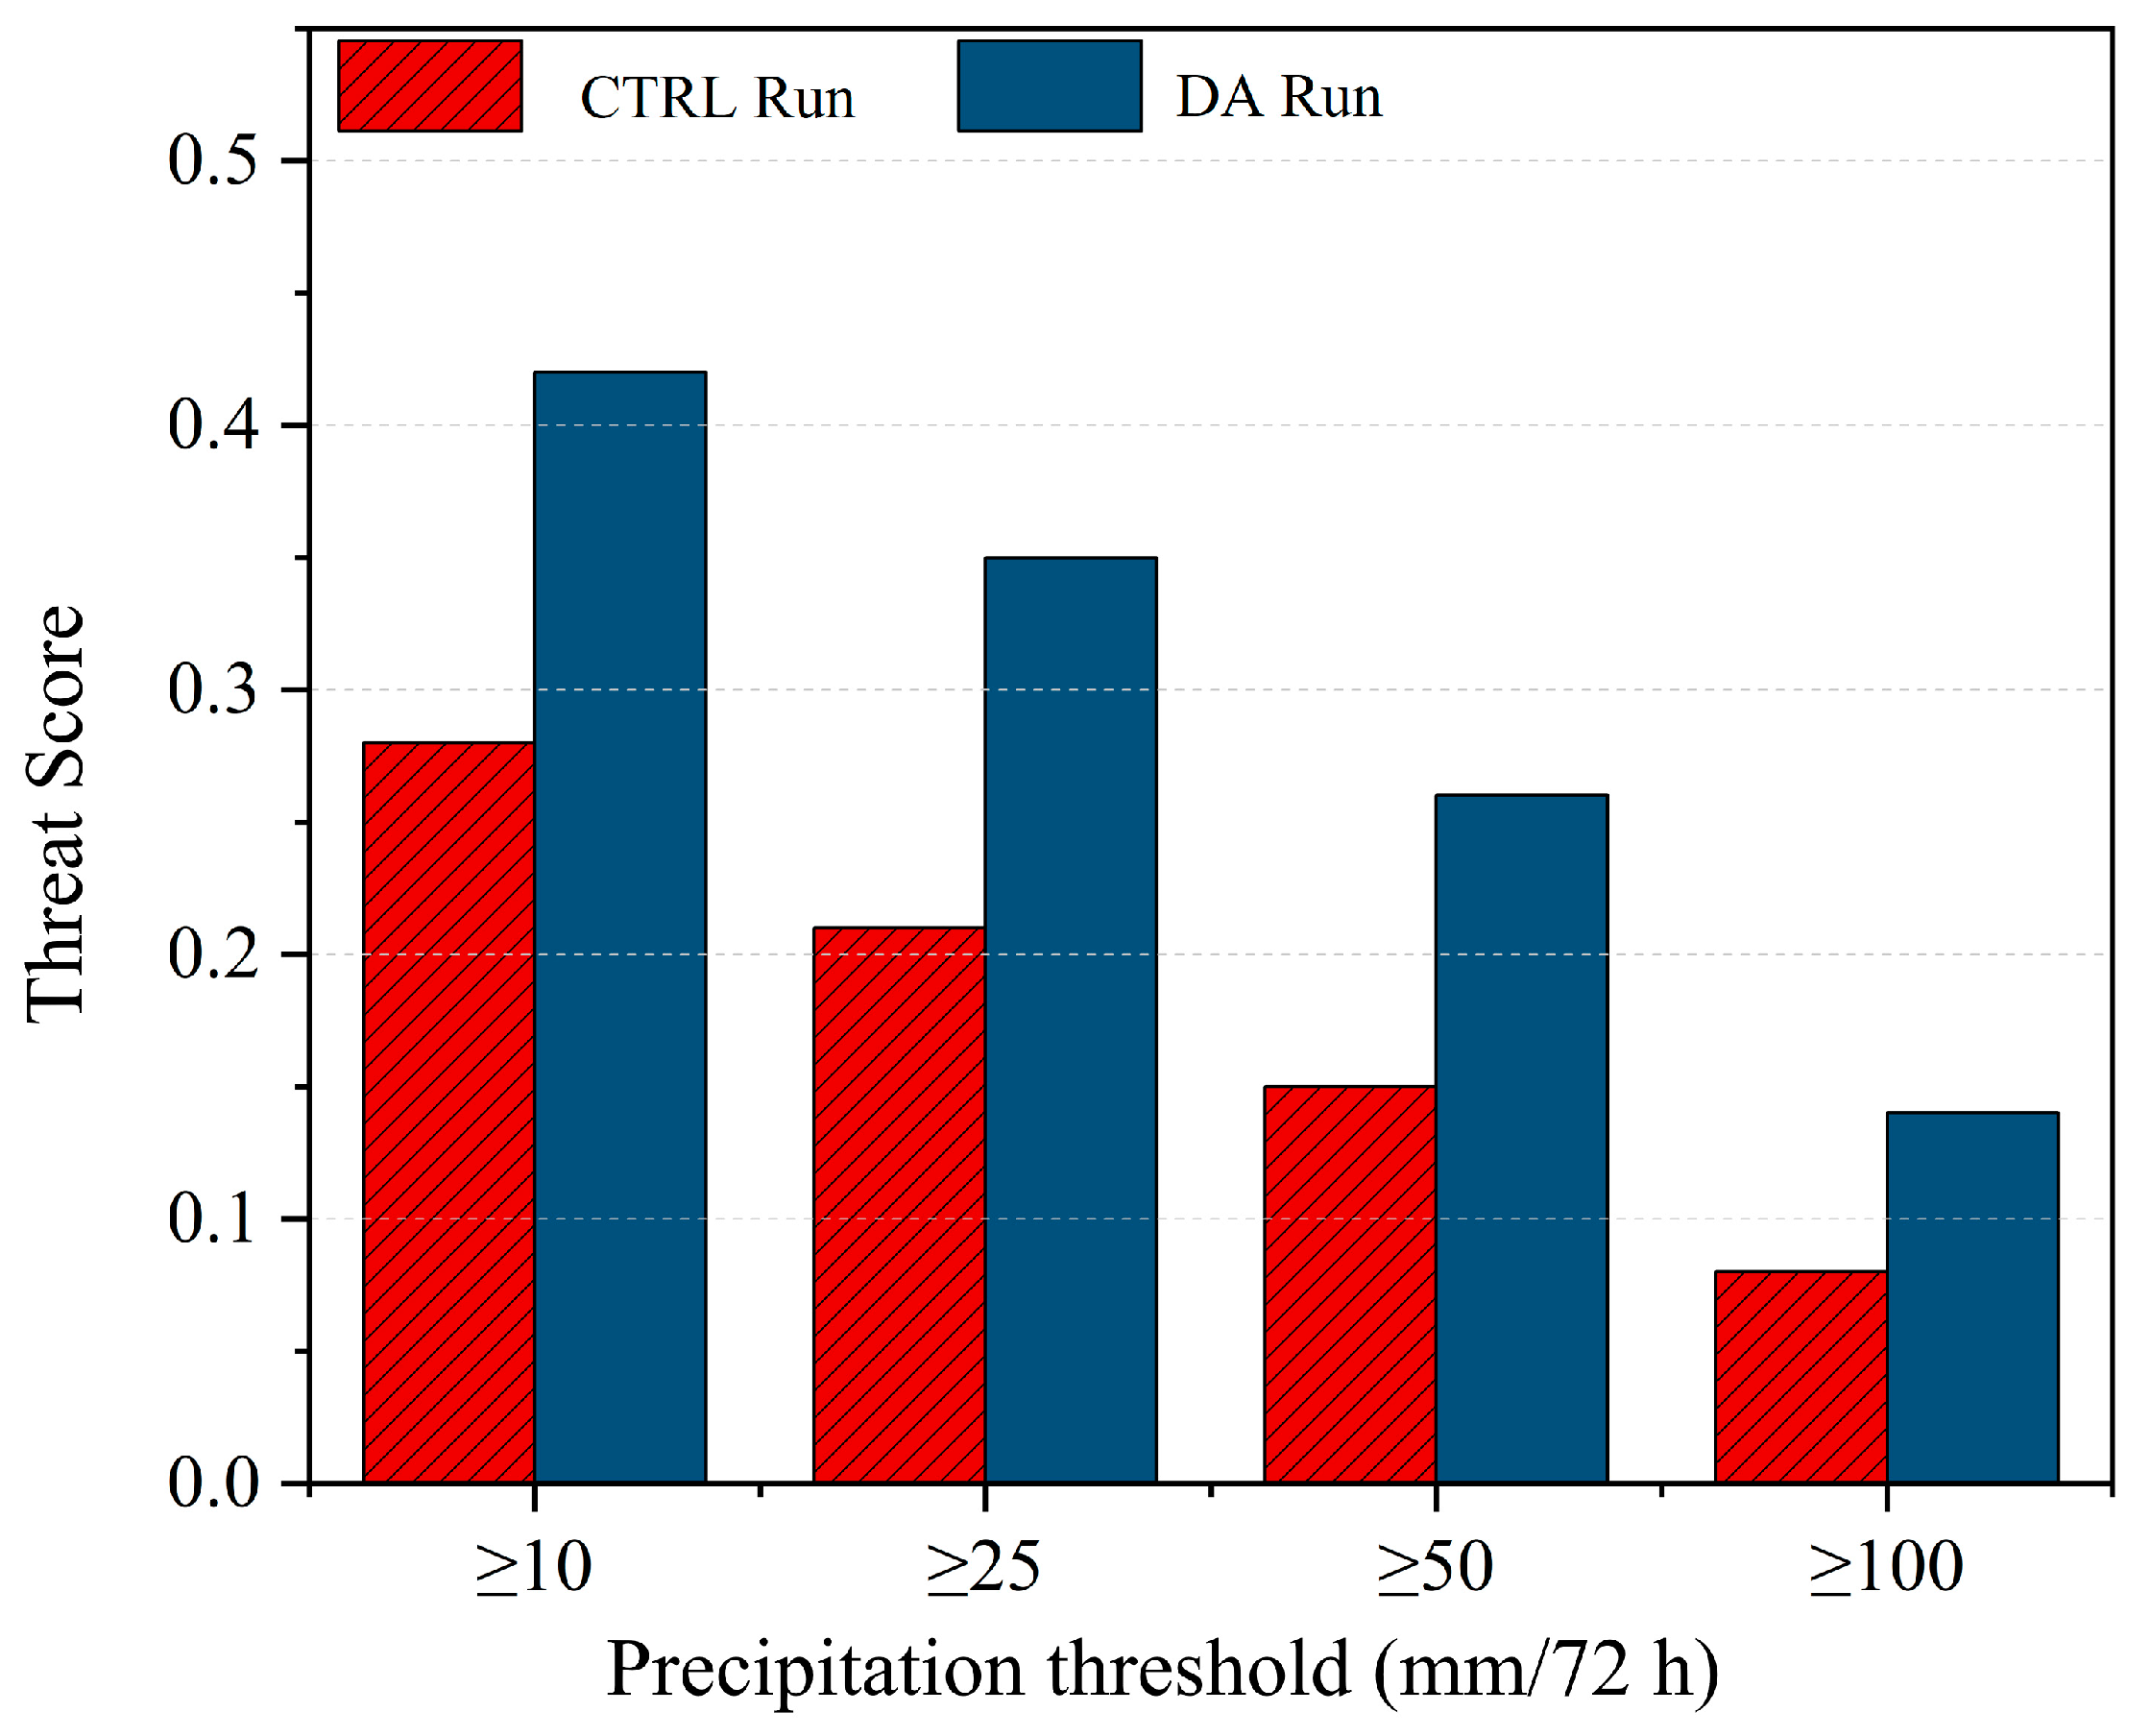
Based on the hourly verification, a categorical TS evaluation is further performed for the 72 h accumulated precipitation (00:00 UTC 10 August–00:00 UTC 13 August) at multiple thresholds (e.g., ≥10, ≥25, ≥50, and ≥100 mm). As shown in Figure 6, DA yields higher TS than CTRL across all thresholds, indicating an overall improvement in reproducing the accumulated rainband distribution. More importantly, the difference becomes more evident for heavier rainfall categories (≥50 and ≥100 mm): CTRL shows a marked drop in TS as the threshold increases, reflecting insufficient skill in capturing the location and intensity of heavy rainfall cores, whereas DA maintains a higher TS and retains non-zero skill even at the ≥100 mm threshold. This behavior is consistent with the spatial precipitation comparisons in Section 3.1 and Section 3.2, collectively confirming that assimilating CMONOC observations contributes more substantially to the simulation of strong precipitation centers than to light-rain coverage.

3.4. Verification Against Sounding Observations

To further evaluate whether data assimilation improves the simulated vertical thermodynamic structure, upper-air sounding temperature observations at the Chongqing Shapingba station (29.6°N, 106.5°E), located close to the main rainfall-affected region, were used as an independent reference. Model temperature profiles from both CTRL and DA were interpolated to the station location and matched to the corresponding sounding times, producing layer-by-layer comparable temperature profiles for assessing vertical-structure errors.
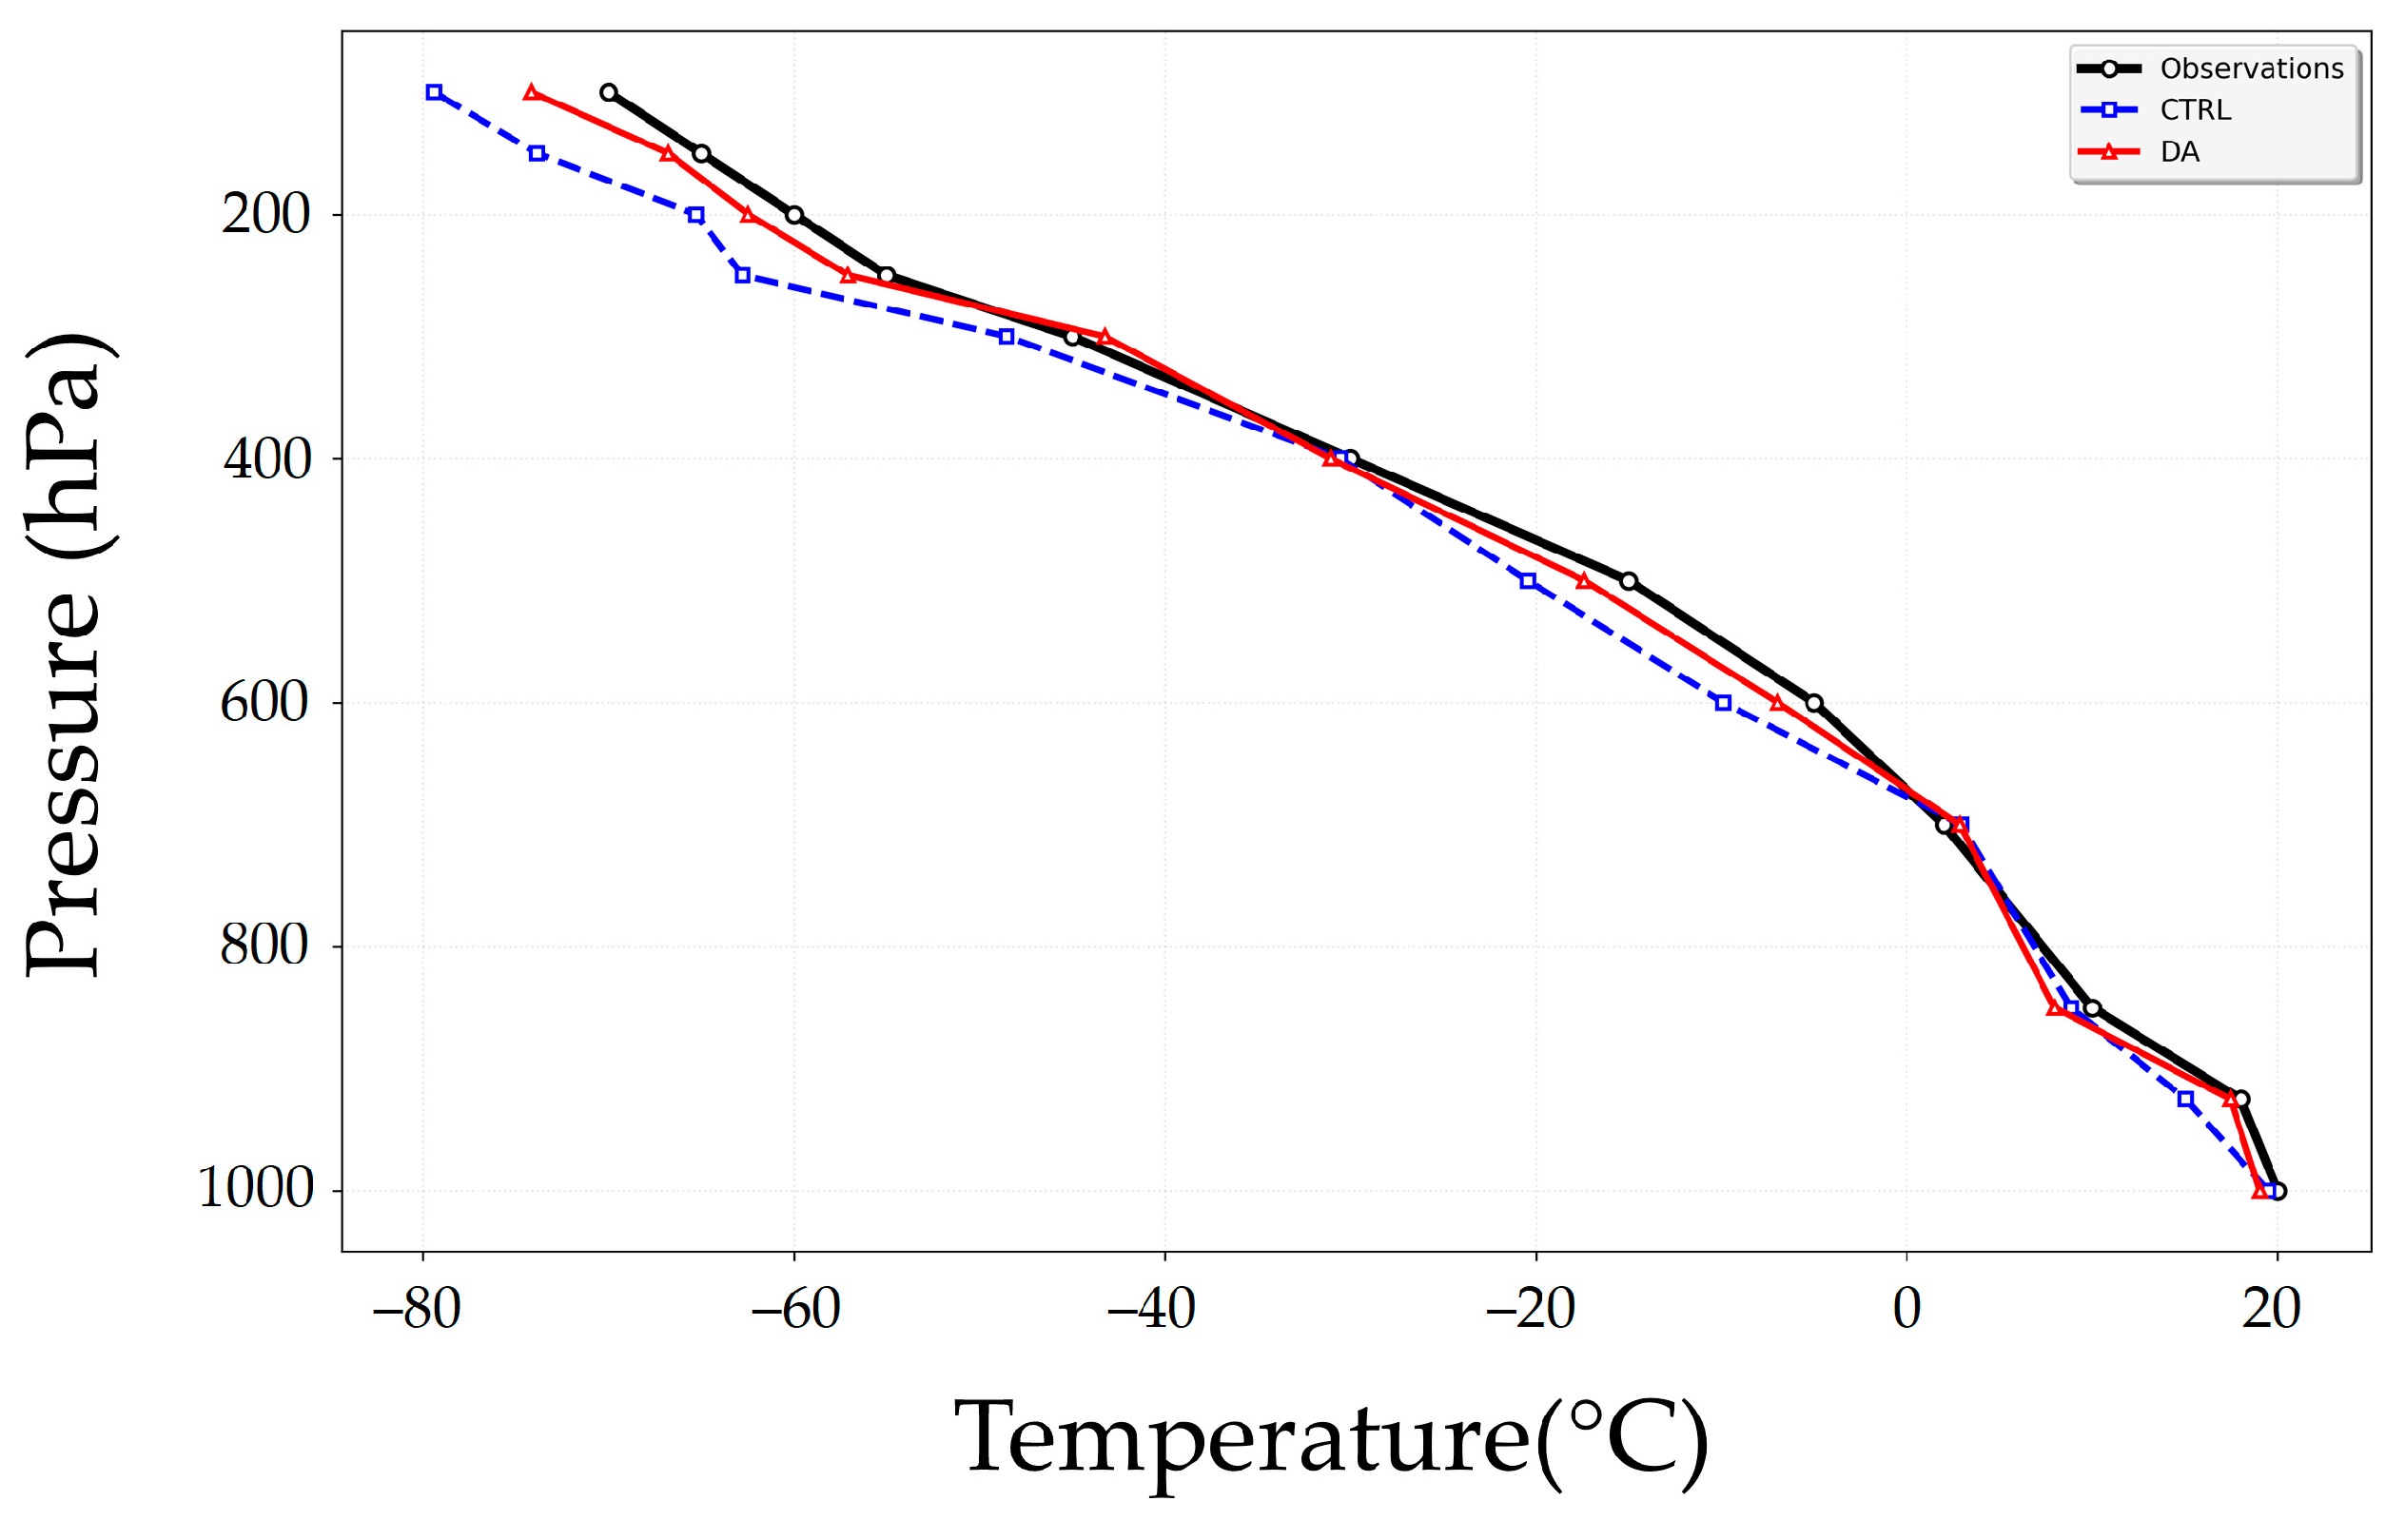
Figure 7 shows the temperature profile comparison at 12:00 UTC on 11 August 2020. Both experiments reproduce the basic decrease of temperature with height, but systematic deviations are evident. The CTRL profile is generally shifted toward lower temperatures relative to the sounding, indicating an overall cold bias, whereas DA follows the observed profile more closely, suggesting that cycling assimilation yields a more realistic vertical thermal structure during the peak stage of the event.
To avoid conclusions being dominated by a single time, Table 2 summarizes the RMSE of temperature profiles for additional sounding times during 10–12 August. Overall, DA achieves lower RMSE than CTRL in most cases, although the improvement varies with time. Specifically, RMSE decreases from 3.85 °C to 3.05 °C at 00:00 UTC on 11 August (18.2% improvement) and from 3.62 °C to 2.55 °C at 12:00 UTC on 11 August (29.6% improvement), whereas the difference is small at 12:00 UTC on 10 August (3.45 °C vs. 3.40 °C; 1.4% improvement). On average, DA reduces the RMSE from 3.68 °C (CTRL) to 3.12 °C, corresponding to an overall improvement of 15.2%.

4. Discussion

In Section 3, the DA experiment was shown to outperform CTRL in terms of rainband location and Threat Score (Figure 4, Figure 5 and Figure 6). This section therefore focuses on explaining the physical reasons for these improvements by examining how GNSS ZTD/PWV assimilation modifies the initial moisture and low-level convergence over the Sichuan Basin.

4.1. Impact on Initial Environmental Fields

To explain why the DA experiment yields better precipitation placement and higher TS than CTRL (Section 3), we first examine the immediate adjustments introduced by cycling assimilation in the low-level environment. Here, we focus on the analysis increments at 850 hPa, which diagnose how GNSS observations modify the background at each analysis time. The analysis increment is defined as
x = x a x b
where x b   is the background (first guess) and x a   is the analysis produced by the WRFDA 3DVar system after assimilating Crustal Movement Observation Network of China (CMONOC) ZTD/PWV observations.
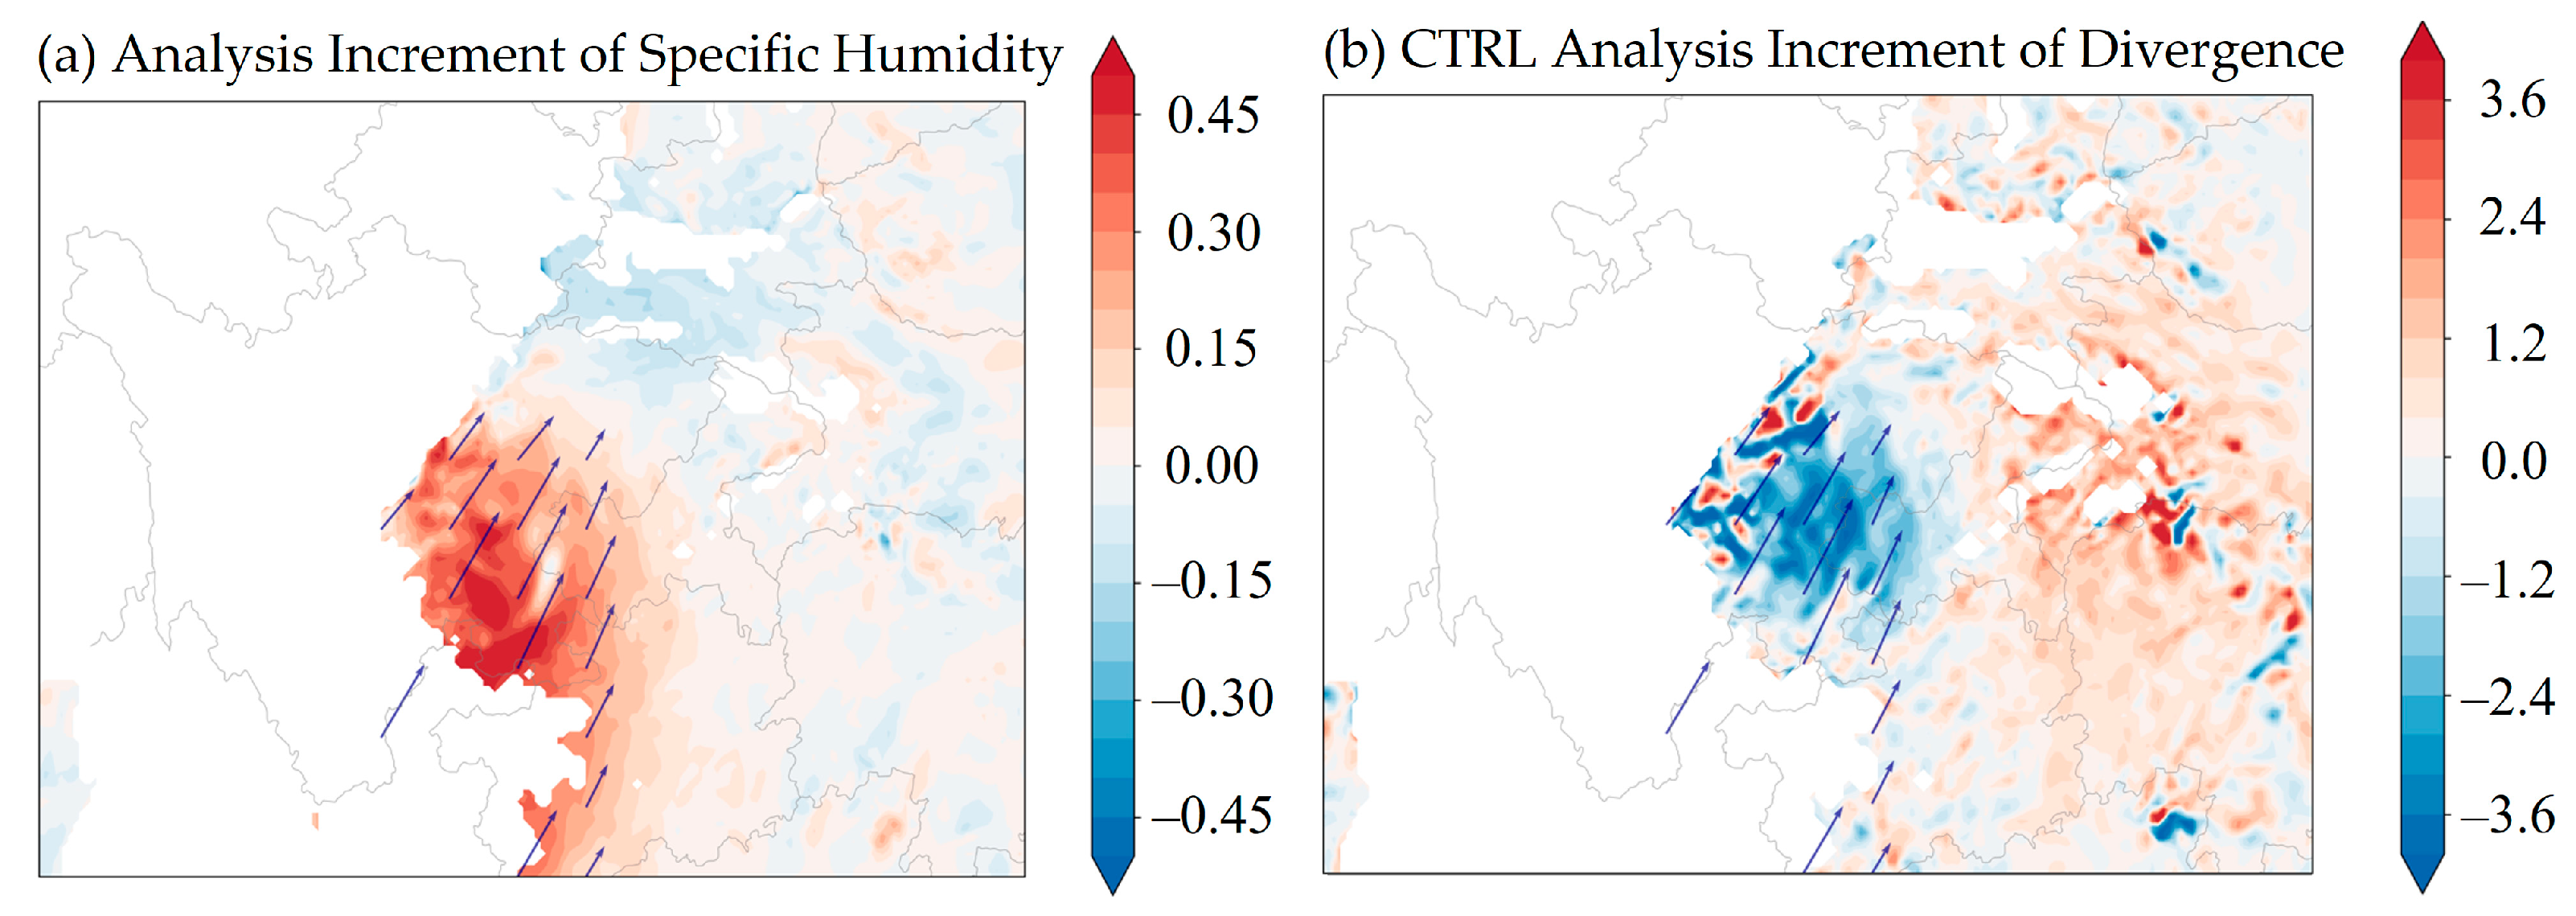
Figure 8 shows the 850 hPa analysis increments of (a) specific humidity and (b) divergence (with low-level wind vectors overlaid). Overall, the increment patterns are spatially coherent rather than noisy, indicating that the GNSS moisture constraints are effectively projected onto the model low-level fields through the background-error correlations. A notable feature is the presence of positive specific-humidity increments over the key rainband region in the Sichuan Basin and adjacent terrain, suggesting that the background underestimates low-level moisture there and that assimilation acts to moisten the initial condition. The increment magnitude reaches the order of several tenths of g   k g 1 (as indicated by the color scale), which is sufficient to influence convective instability and moisture availability in a rainstorm environment.
Meanwhile, the divergence increment exhibits a pronounced negative anomaly collocated with the moistening region. Because negative divergence corresponds to enhanced convergence, this pattern indicates that assimilation not only increases low-level moisture but also adjusts the convergence structure that organizes and anchors convection. Importantly, these moisture and convergence corrections are located in or near the area where the DA experiment later shows a better-positioned rainband and a more realistic heavy-rainfall center in Section 3. This spatial correspondence suggests that the improved precipitation simulation is not a random response, but is dynamically linked to the low-level analysis corrections introduced by GNSS assimilation. In complex terrain, persistent heavy rainfall commonly depends on the coupling among moist inflow, convergence focusing, and orographic lifting. Therefore, the coexistence of positive humidity increments and negative divergence increments provides a physically consistent adjustment that is favorable for sustaining upward motion and repeated convective triggering over the rainband-prone area. In other words, the assimilation modifies not only the thermodynamic environment through moistening but also the dynamical environment through strengthened low-level convergence.
Taken together, Figure 8 indicates that GNSS assimilation improves the initial environmental field through a coherent moisture–convergence adjustment in the key rainfall region. This offers a physical explanation for the downstream improvements shown in Section 3, including the better rainband location and higher TS in the DA experiment. These low-level corrections also provide a plausible precursor to the enhanced vertical structure discussed in Section 4.2, suggesting that the precipitation improvement is associated with a consistent adjustment of the moisture–convergence–ascent system rather than with an isolated local correction. Thermodynamically, the low-level moistening incrementally lowers the lifting condensation level (LCL) and increases the convective available potential energy (CAPE) in the pre-storm environment. Dynamically, the intensified 850 hPa convergence acts as a continuous trigger mechanism. In the basin–mountain transition zone, this enhanced low-level forcing allows boundary-layer moisture to effectively break through the capping inversion, triggering deep moist convection and sustaining the severe updrafts.

4.2. Adjustment of Vertical Dynamical Structure

While Section 4.1 emphasizes the low-level moistening and convergence adjustment induced by GNSS assimilation, the subsequent evolution of heavy rainfall in complex terrain also depends critically on the vertical dynamical structure, particularly the spatial placement and intensity of upward motion. Therefore, we further diagnose how cycling assimilation modifies the vertical motion field and whether it leads to a more realistic alignment between the ascent region and the observed precipitation center [32].
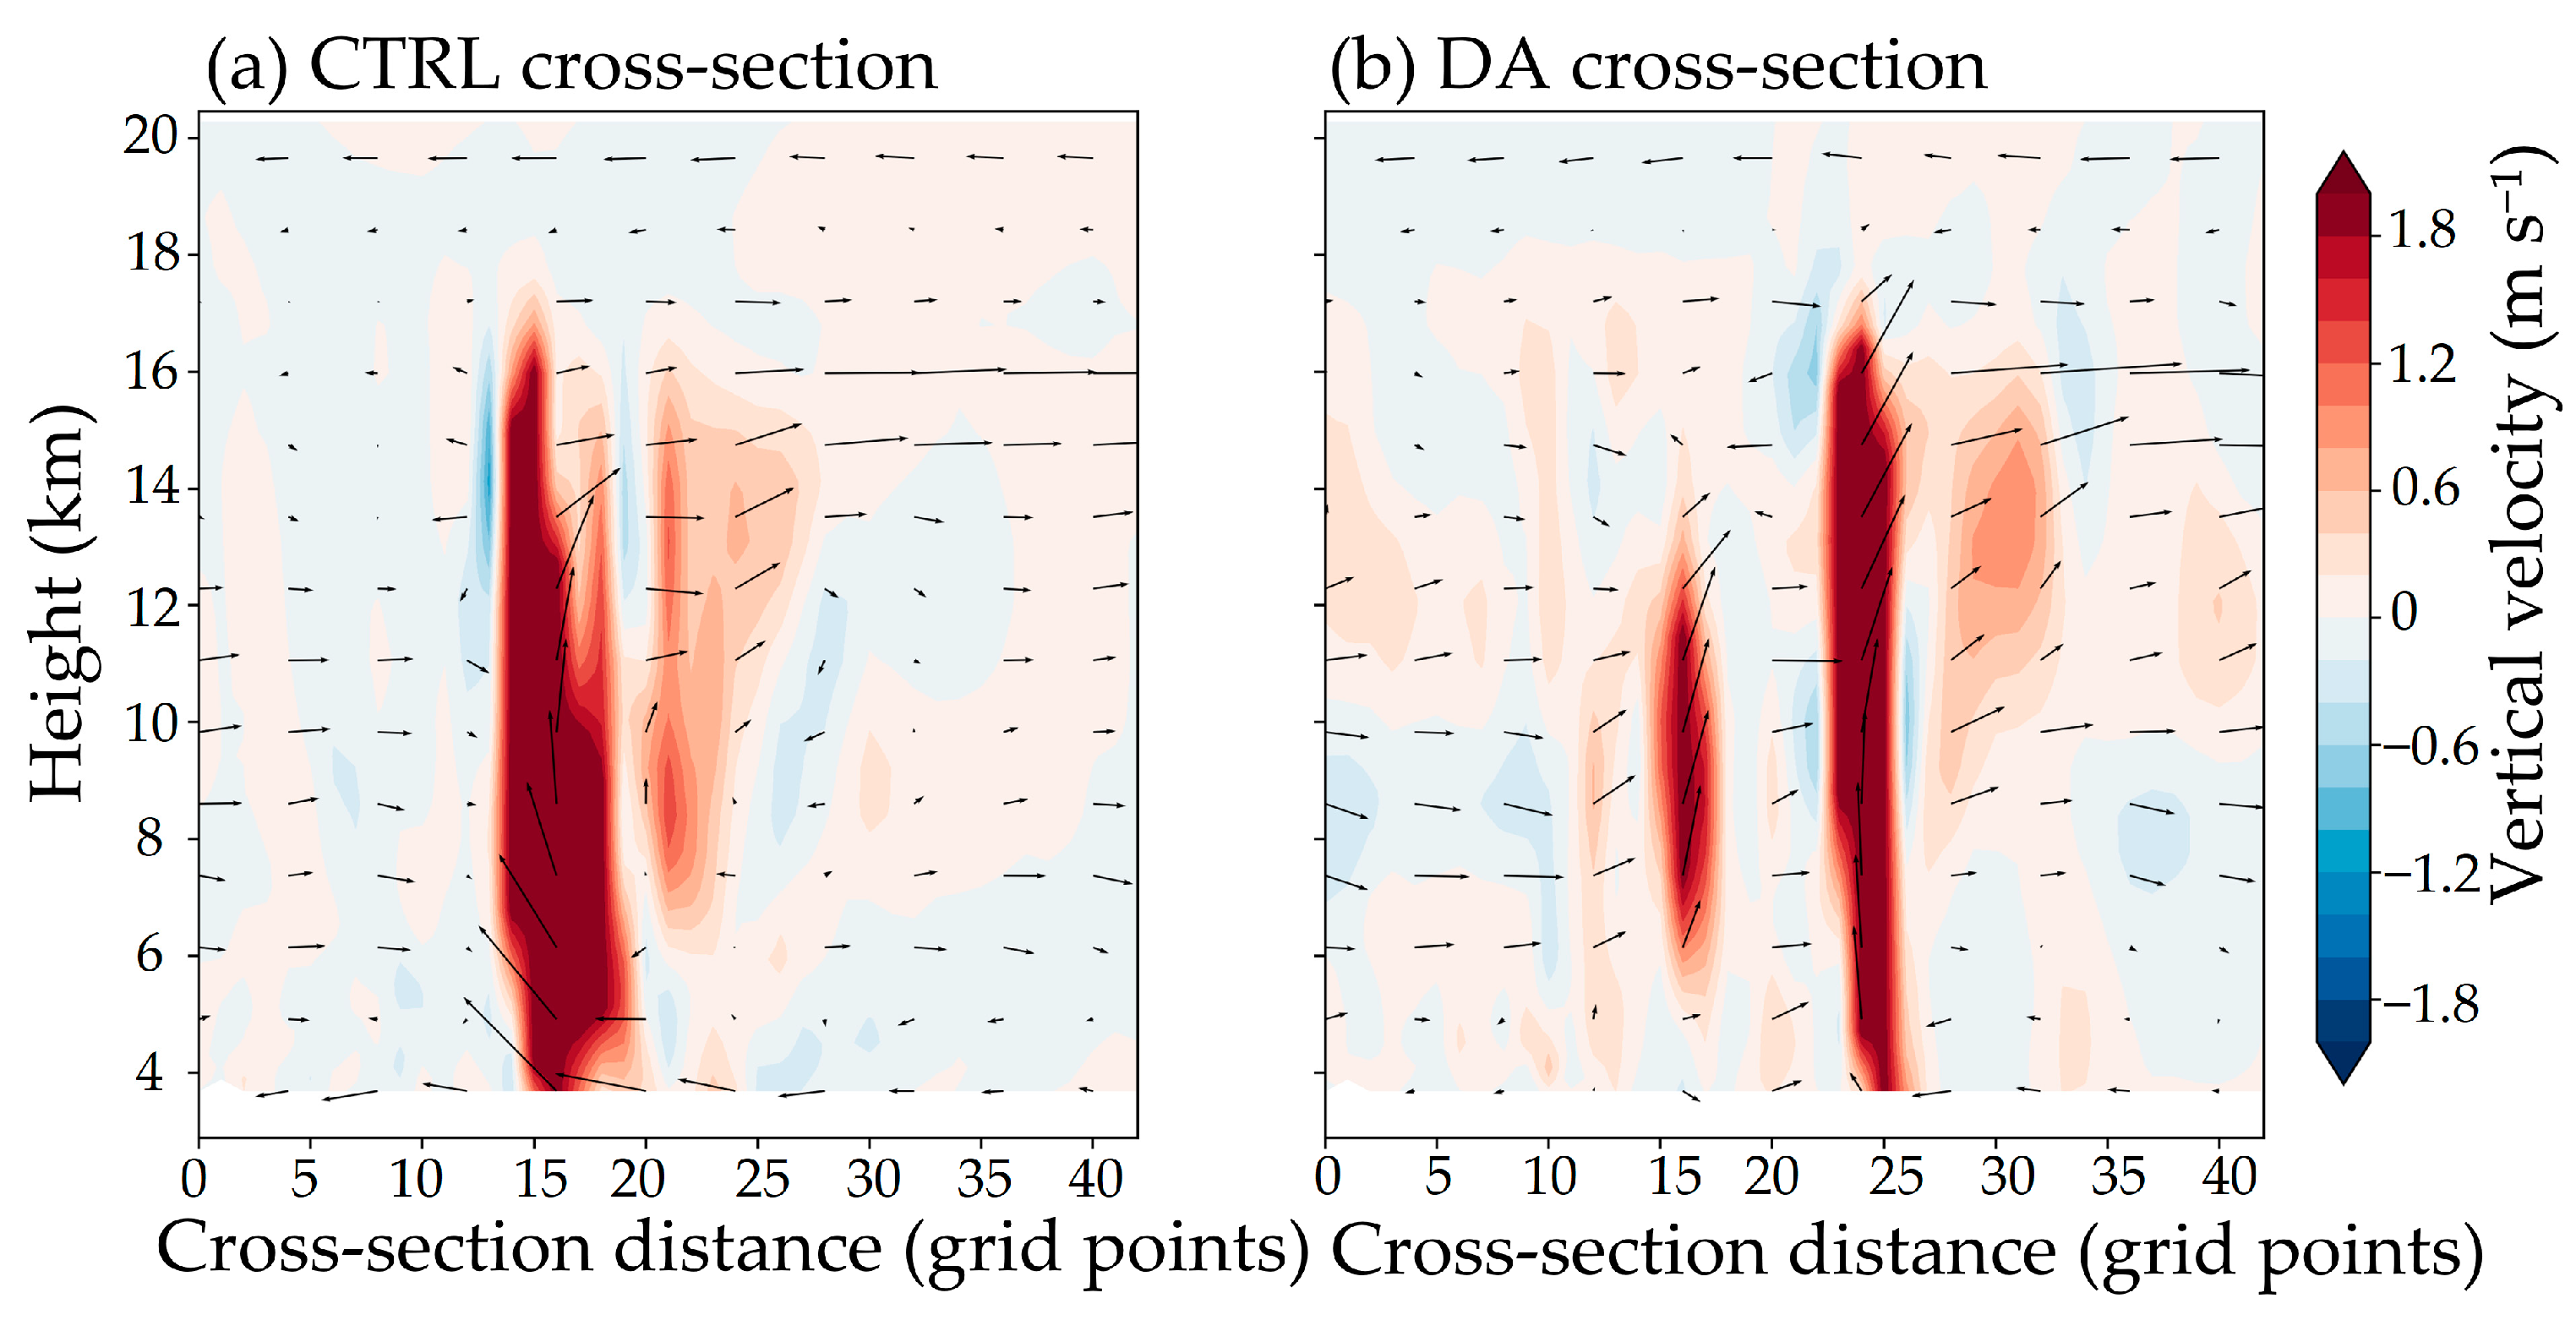
Figure 9 compares the simulated vertical velocity structure between CTRL and DA along a representative cross-section across the main rainband region during the mature stage of the event. In CTRL, the strongest ascent is relatively broad and exhibits a displaced core, with the maximum upward motion not fully collocated with the observed heavy-rainfall center. Such a mismatch can weaken moisture convergence–ascent coupling and can contribute to a northward-biased or smeared precipitation pattern. By contrast, DA produces a more organized vertical motion structure, with a clearer and more concentrated ascent core. The maximum upward motion is shifted toward the observed rainfall center, and the ascent column shows improved vertical coherence from the lower to mid-troposphere, indicating a strengthened and better-positioned lifting environment for deep convection.
The improvement in vertical dynamical structure is physically consistent with the low-level increments shown in Figure 8. Enhanced low-level convergence and increased moisture availability provide stronger conditional instability and promote sustained upward development once convection is initiated. Moreover, in a basin–mountain system, the interaction between synoptic flow and topographic forcing can anchor ascent zones; correcting the initial humidity and convergence through GNSS assimilation helps the model better represent where the flow is forced to rise, thereby improving the coupling among moisture transport, convergence, and ascent. As a result, the DA experiment is more capable of maintaining the rainband and reproducing its propagation, which is consistent with the improved precipitation distribution and TSs reported in Section 3.

4.3. Implications

This study highlights the practical value of assimilating Crustal Movement Observation Network of China (CMONOC) GNSS tropospheric products (ZTD/PWV) for heavy-rainfall simulation over complex terrain. CMONOC GNSS ZTD/PWV products provide temporally continuous moisture-related constraints that complement conventional observations over mountainous regions such as the Sichuan Basin, where spatiotemporal coverage is often limited. When introduced into a cycling WRFDA 3DVar framework, GNSS ZTD/PWV assimilation helps adjust the initial moisture-related fields in a dynamically consistent manner. The 850 hPa analysis increments indicate enhanced low-level moisture together with strengthened convergence, which provides favorable conditions for sustained ascent and repeated convective triggering in the basin–mountain environment. These adjustments offer a physically plausible explanation for the improved rainband placement and higher TSs in the DA experiment, with particularly clear benefits for moderate-to-heavy precipitation categories. Overall, the results suggest that dense ground-based GNSS networks can serve as an effective additional moisture constraint for regional numerical weather prediction over complex terrain.
Despite these encouraging results, several limitations of the present study should be acknowledged. First, the analysis is still based on a limited number of event-scale cases rather than on a large-sample multi-event comparison. Therefore, the present findings should be interpreted as case-based evidence rather than as a broadly general conclusion. Second, the precipitation verification in this study mainly relies on GPM IMERG data. Although IMERG provides spatially continuous precipitation estimates and is useful for regional pattern comparison, its uncertainty may increase over complex terrain such as the Sichuan Basin. Therefore, the present evaluation should be interpreted with caution, especially when assessing the exact intensity and location of localized heavy-rainfall centers. More robust validation using rain-gauge observations will be incorporated in future work when such data become available. Third, the precipitation verification mainly relies on traditional point-to-point metrics, such as TS, which may not fully capture small-scale spatial displacement errors in convective rainfall. More advanced spatial verification methods, such as the Fractions Skill Score (FSS), should be considered in future work. Fourth, the present study adopts the WRFDA 3DVar framework only. Although 3DVar provides a practical and computationally efficient framework for evaluating the impact of GNSS ZTD/PWV assimilation, it cannot fully represent the time-evolving flow-dependent background-error characteristics that may be better captured by more advanced approaches, such as 4DVar or hybrid ensemble–variational methods. Future work will extend the analysis to more extreme rainfall events over the Sichuan Basin and include more comprehensive verification and intercomparison of assimilation methods.

4.4. Additional Robustness Test

To further assess whether the positive impact of assimilating CMONOC GNSS tropospheric products is case-specific, an additional heavy-rainfall event over the Sichuan Basin during 21–23 August 2021 was simulated using the same model domains, physical parameterizations, and 6 h cycling WRFDA 3DVar configuration as those used for the primary August 2020 case. This additional experiment is intended as a compact robustness test rather than a full second case analysis.
Figure 10 presents the IMERG-derived daily accumulated precipitation for 21–23 August 2021. The observed rainfall exhibits a clear day-to-day evolution, with the main rainfall area shifting and reorganizing over the Sichuan Basin and surrounding regions. A pronounced rainfall center can be identified during this event, indicating that it is suitable for evaluating the robustness of the assimilation impact found in the primary case.
To examine whether the model can reproduce the above observed evolution, the corresponding daily accumulated precipitation from CTRL and DA is compared in Figure 11. Both experiments reproduce the general rainfall pattern, but the DA experiment is overall closer to the IMERG observations. In particular, the DA run better captures the location and spatial extent of the main rainfall area on several days, whereas CTRL shows a larger displacement and/or a weaker representation of the heavy-rainfall center. These results suggest that the positive influence of GNSS data assimilation on the precipitation distribution is not limited to the primary August 2020 event.
This visual improvement is further supported by the quantitative verification shown in Figure 12. For the additional August 2021 event, the DA experiment yields higher TS values than CTRL at all examined precipitation thresholds, including ≥10, ≥25, ≥50, and ≥100 mm/72 h. The improvement is especially evident at the lower and moderate thresholds, while positive gains are also maintained for heavier precipitation thresholds. Overall, the TS results are consistent with the spatial comparison in Figure 10 and Figure 11, and provide further case-based support for the beneficial impact of assimilating CMONOC GNSS tropospheric products on heavy-rainfall simulation over the Sichuan Basin.

5. Conclusions

Based on a primary persistent heavy-rainfall event over the Sichuan Basin during 10–12 August 2020 and an additional robustness case during 21–23 August 2021, this study investigated the impact of assimilating the Crustal Movement Observation Network of China (CMONOC) GNSS tropospheric products (ZTD/PWV) using the WRF/WRFDA 3DVar cycling framework. Compared with the CTRL experiment, the DA experiment improved the simulated precipitation evolution and spatial distribution in the primary case, producing a rainband placement more consistent with IMERG observations and yielding higher TSs at both hourly and 72 h accumulated scales, with more evident benefits for stronger precipitation thresholds. For the additional August 2021 event, the DA experiment also reproduced the rainfall pattern more realistically and yielded consistently higher TS values than CTRL, providing further support for the positive role of GNSS assimilation.
The diagnostic analysis further indicates that GNSS assimilation introduces dynamically consistent adjustments in the initial environmental fields. In particular, the DA experiment shows low-level moistening and strengthened convergence at 850 hPa in the key rainfall region, which together provide a more favorable thermodynamic and dynamical environment for sustained ascent and rainband organization. These low-level corrections are also consistent with the better-aligned vertical ascent structure during the key stage of the event, offering a physically plausible explanation for the improved precipitation simulation in the DA experiment.
Overall, the present results suggest that assimilating ground-based GNSS ZTD/PWV observations can improve the representation of moisture and related dynamical structures in complex terrain, thereby enhancing heavy-rainfall simulation over the Sichuan Basin in the examined cases. Nevertheless, because the present analysis is still based on a limited number of event-scale cases, the conclusions should be regarded as case-based evidence rather than as proof of broad general applicability. Future work should extend the evaluation to more extreme-rainfall events, incorporate more robust gauge-based and spatial verification methods, and compare the current 3DVar framework with more advanced assimilation approaches.

Author Contributions

Conceptualization, X.T. and C.Z.; methodology, X.T.; software, C.Z. and A.W.; validation, X.T., C.Z. and R.S.; formal analysis, X.T.; investigation, X.T. and A.W.; resources, X.T.; data curation, A.W. and J.L.; writing—original draft preparation, X.T.; writing—review and editing, X.T., C.Z., A.W., R.S. and J.L.; visualization, A.W. and R.S.; supervision, X.T.; project administration, X.T.; funding acquisition, X.T. All authors have read and agreed to the published version of the manuscript.

Funding

This research was funded by the National Key R&D Program of China (grant 2023YFE0208400) and the Open Fund of Jiangsu Research Center for Underground and Tunnel Engineering Technology (grant 2023SDJJ02).

Data Availability Statement

IMERG Final Run (V06B) precipitation is available from NASA GPM. NCEP FNL analyses are available from NOAA/NCEP. Radiosonde data (00/12 UTC) are available from the China Meteorological Administration (subject to CMA data policies). CMONOC GNSS products (ZTD/PWV) are available from CMONOC subject to data-use agreements. Model configuration files and simulation outputs that support the findings of this study are available from the corresponding author upon reasonable request.

Conflicts of Interest

The authors declare no conflicts of interest. The funders had no role in the design of the study; in the collection, analyses, or interpretation of data; in the writing of the manuscript; or in the decision to publish the results.

References

  1. Yang, L.; Smith, J. Sensitivity of extreme rainfall to atmospheric moisture content in the arid/semiarid southwestern United States: Implications for probable maximum precipitation estimates. J. Geophys. Res. Atmos. 2018, 123, 1638–1656. [Google Scholar] [CrossRef]
  2. Li, H.; Choy, S.; Wang, X.; Liang, H.; Purwar, S.; Zhang, K. Investigating the optimal spatial resolution for assimilating GNSS PWV into an NWP system to improve the accuracy of humidity field. IEEE J. Sel. Top. Appl. Earth Obs. Remote Sens. 2023, 16, 6876–6888. [Google Scholar] [CrossRef]
  3. Feng, J.; An, X.; Sheng, L.; Wang, F.; Li, W. Mechanisms of upper-level divergence superimposed on low-level disturbance causing heavy rainfall over the northern South China Sea in autumn: Case study. J. Geophys. Res. Atmos. 2024, 129, e2024JD041460. [Google Scholar] [CrossRef]
  4. Depasucat, C.H.T.; Bagtasa, G. Assimilating the Subic radar data in the WRF model for tropical cyclone-enhanced heavy monsoon rainfall prediction in Metro Manila. Meteorol. Appl. 2024, 32, 697–710. [Google Scholar] [CrossRef]
  5. Wang, Y.; Yang, Y.; Liu, D.; Zhang, D.; Yao, W.; Wang, C. A case study of assimilating lightning-proxy relative humidity with WRF-3DVAR. Atmosphere 2017, 8, 55. [Google Scholar] [CrossRef]
  6. Bonafoni, S.; Biondi, R. The usefulness of the Global Navigation Satellite Systems (GNSS) in the analysis of precipitation events. Atmos. Res. 2016, 167, 15–23. [Google Scholar] [CrossRef]
  7. Huffman, G.J.; Bolvin, D.T.; Braithwaite, D.; Hsu, K.; Joyce, R.; Xie, P.; Yoo, S.-H. NASA global precipitation measurement (GPM) integrated multi-satellite retrievals for GPM (IMERG). Algorithm Theor. Basis Doc. 2015, 4, 30. [Google Scholar]
  8. Gimeno, L.; Dominguez, F.; Nieto, R.; Trigo, R.; Drumond, A.; Reason, C.J.; Taschetto, A.S.; Ramos, A.M.; Kumar, R.; Marengo, J.; et al. Major mechanisms of atmospheric moisture transport and their role in extreme precipitation events. Annu. Rev. Environ. Resour. 2016, 41, 117–141. [Google Scholar] [CrossRef]
  9. Tregoning, P.; Herring, T.A. Impact of a priori zenith hydrostatic delay errors on GPS estimates of station heights and zenith total delays. Geophys. Res. Lett. 2006, 33, L23303. [Google Scholar] [CrossRef]
  10. Wu, M.; Jin, S.; Li, Z.; Cao, Y.; Ping, F.; Tang, X. High-precision GNSS PWV and its variation characteristics in China based on individual station meteorological data. Remote Sens. 2021, 13, 1296. [Google Scholar] [CrossRef]
  11. Crochemore, L.; Ramos, M.-H.; Pappenberger, F. Bias correcting precipitation forecasts to improve the skill of seasonal streamflow forecasts. Hydrol. Earth Syst. Sci. 2016, 20, 3601–3618. [Google Scholar] [CrossRef]
  12. Dayan, U.; Nissen, K.; Ulbrich, U. Atmospheric conditions inducing extreme precipitation over the eastern and western Mediterranean. Nat. Hazards Earth Syst. Sci. 2015, 15, 2525–2544. [Google Scholar] [CrossRef]
  13. Li, H.; Wang, X.; Choy, S.; Jiang, C.; Wu, S.; Zhang, J.; Qiu, C.; Zhou, K.; Li, L.; Fu, E.; et al. Detecting heavy rainfall using anomaly-based percentile thresholds of predictors derived from GNSS-PWV. Atmos. Res. 2022, 265, 105912. [Google Scholar] [CrossRef]
  14. Wang, Z.; Chai, H.; Ye, Y.; Wang, M.; Chen, P. High-precision forecasting of 1 km resolution PWV and ZTD over China based on the Pangu-Weather system. Atmos. Res. 2026, 334, 108771. [Google Scholar] [CrossRef]
  15. Wei, P.; Liu, J.; Ye, S.; Sha, Z.; Hu, F. Real-time GNSS tropospheric parameter prediction of extreme rainfall events in China based on WRF multi-source data assimilation. Adv. Space Res. 2024, 73, 1611–1629. [Google Scholar] [CrossRef]
  16. Chotamonsak, C.; Lapyai, D.; Limsakul, A.; Torsri, K.; Thanadolmethaphorn, P.; Nakapan, S. Evaluation of WRF-Downscaled CMIP5 Climate Simulations for Precipitation and Temperature over Thailand (1976–2005): Implications for Adaptation and Sustainable Development. Sustainability 2025, 17, 9899. [Google Scholar] [CrossRef]
  17. Nair, A.S.; Mangla, R.; P, T.; Indu, J. Remote sensing data assimilation. Hydrol. Sci. J. 2022, 67, 2457–2489. [Google Scholar] [CrossRef]
  18. Arcucci, R.; Zhu, J.; Hu, S.; Guo, Y.-K. Deep data assimilation: Integrating deep learning with data assimilation. Appl. Sci. 2021, 11, 1114. [Google Scholar] [CrossRef]
  19. Dee, D.P.; Da Silva, A.M. Data assimilation in the presence of forecast bias. Q. J. R. Meteorol. Soc. 1998, 124, 269–295. [Google Scholar] [CrossRef]
  20. Gong, Y.; Liu, Z.; Chan, P.W.; Hon, K.K. Assimilating GNSS PWV and radiosonde meteorological profiles to improve the PWV and rainfall forecasting performance from the Weather Research and Forecasting (WRF) model over the South China. Atmos. Res. 2023, 286, 106677. [Google Scholar] [CrossRef]
  21. Vaquero-Martínez, J.; Antón, M. Review on the role of GNSS meteorology in monitoring water vapor for atmospheric physics. Remote Sens. 2021, 13, 2287. [Google Scholar] [CrossRef]
  22. Notarpietro, R.; Cucca, M.; Bonafoni, S. GNSS signals: A powerful source for atmosphere and Earth’s surface monitoring. In Remote Sensing of Planet Earth; IntechOpen: London, UK, 2012; pp. 171–200. [Google Scholar]
  23. Mayaki, A.O. Evaluation of Precise Point Positioning Derived Zenith Total Delays from the Nigerian GNSS Reference Network. Master’s Thesis, University of New Brunswick, Fredericton, NB, Canada, 2019. [Google Scholar]
  24. Yin, W.; Zhou, C.; Tian, Y.; Qiu, H.; Zhang, W.; Chen, H.; Liu, P.; Zhao, Q.; Kong, J.; Yao, Y. Accurate Rainfall Prediction Using GNSS PWV Based on Pre-Trained Transformer Model. Remote Sens. 2025, 17, 2023. [Google Scholar] [CrossRef]
  25. Pipatsitee, P.; Ninsawat, S.; Tripathi, N.K.; Shanmugam, M.; Chitsutti, P. Estimating daily potential evapotranspiration using GNSS-based precipitable water vapor. Heliyon 2023, 9, e17747. [Google Scholar] [CrossRef] [PubMed]
  26. Yao, Y.; Shan, L.; Zhao, Q. Establishing a method of short-term rainfall forecasting based on GNSS-derived PWV and its application. Sci. Rep. 2017, 7, 12465. [Google Scholar] [CrossRef] [PubMed]
  27. Su, H.; Wang, Y.; Cao, Y.; Liang, H.; Zhou, L.; Mo, Z. Analysis of GNSS Precipitable Water Vapor and Its Gradients During a Rainstorm in North China in July 2023. Remote Sens. 2025, 17, 3247. [Google Scholar] [CrossRef]
  28. Cummings, J.; Bertino, L.; Brasseur, P.; Fukumori, I.; Kamachi, M.; Martin, M.J.; Mogensen, K.; Oke, P.; Testut, C.E.; Verron, J.; et al. Ocean data assimilation systems for GODAE. Oceanography 2009, 22, 96–109. [Google Scholar] [CrossRef]
  29. Giannaros, C.; Kotroni, V.; Lagouvardos, K.; Giannaros, T.M.; Pikridas, C. Assessing the Impact of GNSS ZTD Data Assimilation into the WRF Modeling System during High-Impact Rainfall Events over Greece. Remote Sens. 2020, 12, 383. [Google Scholar] [CrossRef]
  30. Feng, Y.; Qi, Y.; Chen, D.; Li, D.; Li, Z.; Xu, X. Multi-scale analysis of satellite, reanalysis and multi-source precipitation estimates over the Tibetan Plateau. Atmos. Res. 2024, 309, 107484. [Google Scholar] [CrossRef]
  31. Tao, W.-K.; Simpson, J.; Baker, D.; Braun, S.; Chou, M.-D.; Ferrier, B.; Johnson, D.; Khain, A.; Lang, S.; Lynn, B. Microphysics, radiation and surface processes in the Goddard Cumulus Ensemble (GCE) model. Meteorol. Atmos. Phys. 2003, 82, 97–137. [Google Scholar] [CrossRef]
  32. Tu, M.; Zhang, W.; Bai, J.; Wu, D.; Liang, H.; Lou, Y. Spatio-Temporal Variations of Precipitable Water Vapor and Horizontal Tropospheric Gradients from GPS during Typhoon Lekima. Remote Sens. 2021, 13, 4082. [Google Scholar] [CrossRef]
Figure 1. Study area, model domain configuration, and distribution of CMONOC stations.
Remotesensing 18 01126 g001
Figure 2. Comparison of Zenith Total Delay (ZTD) time series between GNSS observations (black line) and NCEP FNL background field (red dashed line) at three representative stations (SCMB, SCTQ, and SCMX) from 10 to 12 August 2020. The bottom panels show the difference ( Z T D F N L Z T D O B S ).
Remotesensing 18 01126 g002
Figure 3. IMERG-derived daily accumulated precipitation (00:00–24:00 UTC) over the Sichuan Basin and surrounding areas during 10–12 August 2020. (a) 10 August 2020; (b) 11 August 2020; (c) 12 August 2020. The red polygon outlines the Sichuan Basin. Units: mm.
Remotesensing 18 01126 g003
Figure 4. Simulated daily accumulated precipitation (00:00–24:00 UTC) over the Sichuan Basin and surrounding areas during 10–12 August 2020 from the CTRL and DA experiments. (ac) CTRL on 10, 11, and 12 August 2020, respectively; (df) DA on 10, 11, and 12 August 2020, respectively. Red rectangles indicate key heavy rainfall areas with significant differences. The red polygon outlines the Sichuan Basin. Units: mm.
Remotesensing 18 01126 g004
Figure 5. Hourly Threat Score (TS) comparisons between CTRL and DA over the Sichuan Basin during 10–12 August 2020 at a precipitation threshold of 2 mm h−1: (a) 10 August 2020; (b) 11 August 2020; and (c) 12 August 2020. Vertical dashed lines indicate the cycling analysis times.
Remotesensing 18 01126 g005
Figure 6. Threat Score (TS) comparison for 72 h accumulated precipitation between CTRL and DA at different thresholds (mm/72 h).
Remotesensing 18 01126 g006
Figure 7. Vertical temperature profiles from the radiosonde observation and the WRF simulations (CTRL and DA) at Chongqing Shapingba at 12:00 UTC on 11 August 2020.
Remotesensing 18 01126 g007
Figure 8. 850 hPa analysis increments associated with GNSS assimilation: (a) specific humidity increment ( g   k g 1 ) and (b) divergence increment ( 10 5 s 1 ); vectors denote the 850 hPa wind field shown in the figure. The blue vectors denote the full 850 hPa analysis wind field (m s−1), indicating the prevailing flow.
Remotesensing 18 01126 g008
Figure 9. Cross-sections of vertical velocity during the key stage of the event in (a) CTRL and (b) DA. Shading indicates vertical velocity (m s−1) , and the black arrows denote the airflow vectors in the cross-sectional plane. The figure illustrates the assimilation-induced adjustment of the ascent core relative to the rainband region.
Remotesensing 18 01126 g009
Figure 10. IMERG-derived daily accumulated precipitation (00:00–24:00 UTC) over the Sichuan Basin and surrounding areas during 21–23 August 2021: (a) 21 August 2021; (b) 22 August 2021; (c) 23 August 2021. The red polygon outlines the Sichuan Basin. Units: mm.
Remotesensing 18 01126 g010
Figure 11. Simulated daily accumulated precipitation (00:00–24:00 UTC) over the Sichuan Basin and surrounding areas during 21–23 August 2021: (ac) CTRL on 21, 22, and 23 August 2021, respectively; (df) DA on 21, 22, and 23 August 2021, respectively. The red polygon outlines the Sichuan Basin. Units: mm.
Remotesensing 18 01126 g011
Figure 12. Threat score (TS) of 72 h accumulated precipitation for the additional heavy-rainfall event during 21–23 August 2021 under different precipitation thresholds.
Remotesensing 18 01126 g012
Table 1. Model Domain and Parameter Settings.
ParameterConfiguration
Model CenterSichuan Basin (104.0°E, 30.0°N)
Outer Domain (d01)27 km resolution, covering Southwest China
Inner Domain (d02)9 km resolution, covering the Sichuan Basin
Time Step120 s (for d01) and 40 s (for d02)
Table 2. Root mean square error (RMSE) of simulated temperature profiles (CTRL and DA) against radiosonde observations at Chongqing Shapingba during 10–12 August 2020.
Data/Time (UTC)CTRL RMSE (°C)DA RMSE (°C)Improvement (%)
10 August, 12:003.453.401.4
11 August, 00:003.853.0518.2
11 August, 12:003.622.5529.6
12 August, 00:003.703.359.5
12 August, 12:003.783.2514.0
Average3.683.1215.2
Disclaimer/Publisher’s Note: The statements, opinions and data contained in all publications are solely those of the individual author(s) and contributor(s) and not of MDPI and/or the editor(s). MDPI and/or the editor(s) disclaim responsibility for any injury to people or property resulting from any ideas, methods, instructions or products referred to in the content.