Article

A Multi-Temporal Instance Segmentation Framework and Exhaustively Annotated Tree Crown Dataset for a Subtropical Urban Forest Case


1
School of Atmospheric Sciences, Sun Yat-sen University, Zhuhai 519082, China
2
Key Lab of Guangdong for Utilization of Remote Sensing and Geographical Information System, Guangdong Engineering Technology Research Center of Remote Sensing Big Data Application, Guangzhou Institute of Geography, Guangdong Academy of Sciences, Guangzhou 510070, China
3
Guangdong Province Key Laboratory of Climate Change and Natural Disaster Studies, Zhuhai 519082, China
*
Author to whom correspondence should be addressed.
Remote Sens. 2026, 18(7), 1082; https://doi.org/10.3390/rs18071082
Submission received: 19 February 2026 / Revised: 29 March 2026 / Accepted: 1 April 2026 / Published: 3 April 2026

Highlights

What are the main findings?
  • Based on an exhaustively annotated 47,754-crown dataset, bi-temporal joint training is sufficient to overcome the severe phenological overfitting of single-temporal models.
  • Strategic phase selection can yield higher segmentation generalizability than merely increasing multi-temporal data volume.
What are the implications of the main findings?
  • The exhaustive annotation of all visible crowns provides the model with more complete feature information to handle complex backgrounds in urban spaces.
  • Integrating multi-date UAV imagery effectively mitigates the influence of seasonal and illumination variations on tree crown geometric delineation.

Abstract

Accurate individual tree crown identification is essential for urban forestry, yet existing datasets often lack exhaustive annotations and multi-temporal diversity. To address this limitation, an exhaustively annotated dataset was curated for crown instance segmentation, comprising 47,754 labeled individual crowns from approximately 110 species across three temporal phases. Anchored in a “crown geometry” labeling criterion focusing on upper-canopy individuals visible in the imagery, and the high-resolution imagery captured seasonal variations in shape, color, and texture, providing an empirical basis for within-site robustness. Utilizing this dataset, this study (1) compared five instance segmentation models; (2) evaluated their generalization capabilities across different temporal phases; and (3) tested a multi-temporal joint training strategy and a non-maximum suppression (NMS)-based fusion. The experiments revealed significant overfitting in single-temporal models. While ConvNeXt-V2 achieved a high segmentation mean Average Precision (Segm_mAP) of 0.852 within the same temporal phase, its performance dropped sharply to 0.361 across phases. Bi-temporal joint training significantly mitigated this issue, improving cross-temporal performance to 0.665 and further increasing within-phase accuracy to 0.874. In contrast, tri-temporal training reduced accuracy (0.748), demonstrating that effective generalizability depends on the strategic selection of complementary temporal phases rather than the mere accumulation of data. The multi-temporal training framework provided in this study could serve as a practical reference and a foundational benchmark for further urban forest structural monitoring research.

1. Introduction

Trees constitute a core element of terrestrial ecosystems, and rigorous quantification of their crown structure forms the basis for evaluating carbon sequestration potential and tracking biogeochemical dynamics [1,2], while also being indispensable to urban microclimate regulation [3] and urban landscape studies [4]. The efficient, accurate retrieval of individual tree crown information in urban areas is now key to enabling forestry management and the development of smart cities. As the nation with the largest global area of planted forests [5], China must urgently break through monitoring bottlenecks for crowns in complex urban environments to strengthen its forest resource inventory framework [6].
Recent rapid progress in low-altitude unmanned aerial vehicle (UAV)-based remote sensing has substantially improved our ability to monitor tree structural attributes. A variety of techniques are currently available for tree crown recognition. Technologies like LiDAR and 3D point clouds enable highly accurate individual crown delineation [7,8], yet their cost constrains adoption at city-wide scales [9]. In comparison, methods using high-resolution orthophotography [10] provide centimeter- to even millimeter-scale resolution that can depict individual crowns in fine detail. At present, crown extraction from UAV images depends mainly on deep learning approaches for object detection and semantic segmentation [11,12], together with instance segmentation [13], which combines the advantages of the former two and opens up a new avenue for precise individual crown recognition. For instance, models like Mask R-CNN have seen broad use in crown recognition due to their strong local feature modeling capabilities [9]. Yet under complex urban conditions—marked by building shadows and mixed species—these models remain inadequate for delineating crown boundaries, resulting in constrained generalizability. Later, architectures like Mask2Former [14] and ConvNeXt-V2 [15] were introduced, leveraging refined network designs that markedly improve representational capacity and robustness, achieving state-of-the-art results on general benchmarks (e.g., ImageNet). However, a systematic evaluation of these architectures under their default configurations for crown instance segmentation in complex urban conditions remains to be further conducted [16].
Accordingly, tree crown segmentation in subtropical cities using UAV imagery and instance segmentation techniques is considered to confront two principal challenges: (1) Subtropical urban stands are densely vegetated with pronounced interspecific mixing. Consequently, crown boundaries become blurred, often leading to segmentation errors—reflecting low between-class variance. (2) The intraspecies differences across seasons are large. Even outside deciduous systems, crown morphology and coloration for a given species vary considerably by season. That is, within-class variance is substantial. It is therefore appealing to devise a generalizable crown recognition method that neither targets specific species nor depends on particular phenological stages (e.g., maturity).
In response, the present study advances along two axes, dataset development and algorithmic improvement, as detailed below:
(1) An exhaustively annotated, multi-period crown instance segmentation dataset is constructed, motivated by the observation that insufficient high-quality training data is a major limiting factor. Here, “exhaustively annotated” refers to a labeling strategy where every individual tree crown visible in the imagery is delineated, regardless of species, size, or health status. Relative to mainstream computer vision(CV) benchmarks such as COCO and ImageNet, the number of open crown datasets remains limited. Surveying the literature, eight public tree crown segmentation datasets are identified (Table 1) and two primary issues found: First, most datasets employ species-specific labeling, where only selected tree species are annotated. This partial labeling approach often leads segmentation models to misclassify unlabeled crowns as background, thereby hindering the development of exhaustive crown awareness. Second, with the exception of the Quebec Trees [17], existing open datasets are typically single-temporal, failing to capture the phenological variations essential for robust year-round monitoring. While BAMFORESTS [18] provides a large volume of data, its tile-based distribution makes it difficult to verify if all visible crowns within a continuous canopy are exhaustively labeled.
Therefore, a species-agnostic crown instance dataset is developed, guided by a crown geometry labeling criterion, providing exhaustive crown annotations for all trees in the study area over multiple temporal phases.
(2) A joint training framework for crown segmentation is developed, and segmentation algorithms are evaluated across several temporal phases to determine their suitability for the task. Subsequently, using multi-phase predictions and exploiting complementary information, a non-maximum suppression (NMS)-based fusion scheme is constructed along with its optimal hyperparameters.
Using Haizhu Lake (Guangzhou) as the study area, 47,754 individual tree crown instances are derived, spanning over 110 species from three sets of 2023–2024 UAV orthophotos. This study benchmarks key instance segmentation architectures on the dataset, analyzes how various phase combinations affect accuracy, and provides the optimal parameter settings for the NMS fusion algorithm.
This study provides a potential methodological path for efficient multi-temporal monitoring of tree crowns in subtropical cities based on a single-site case study. Compared with existing labeled individual-tree datasets, the fully annotated, multi-temporal, and generic dataset offers refined scale and very high spatial resolution, featuring individually delineated crowns from UAV imagery, and will be made publicly available upon acceptance of the article.

2. Materials and Methods

2.1. Materials

2.1.1. Study Area

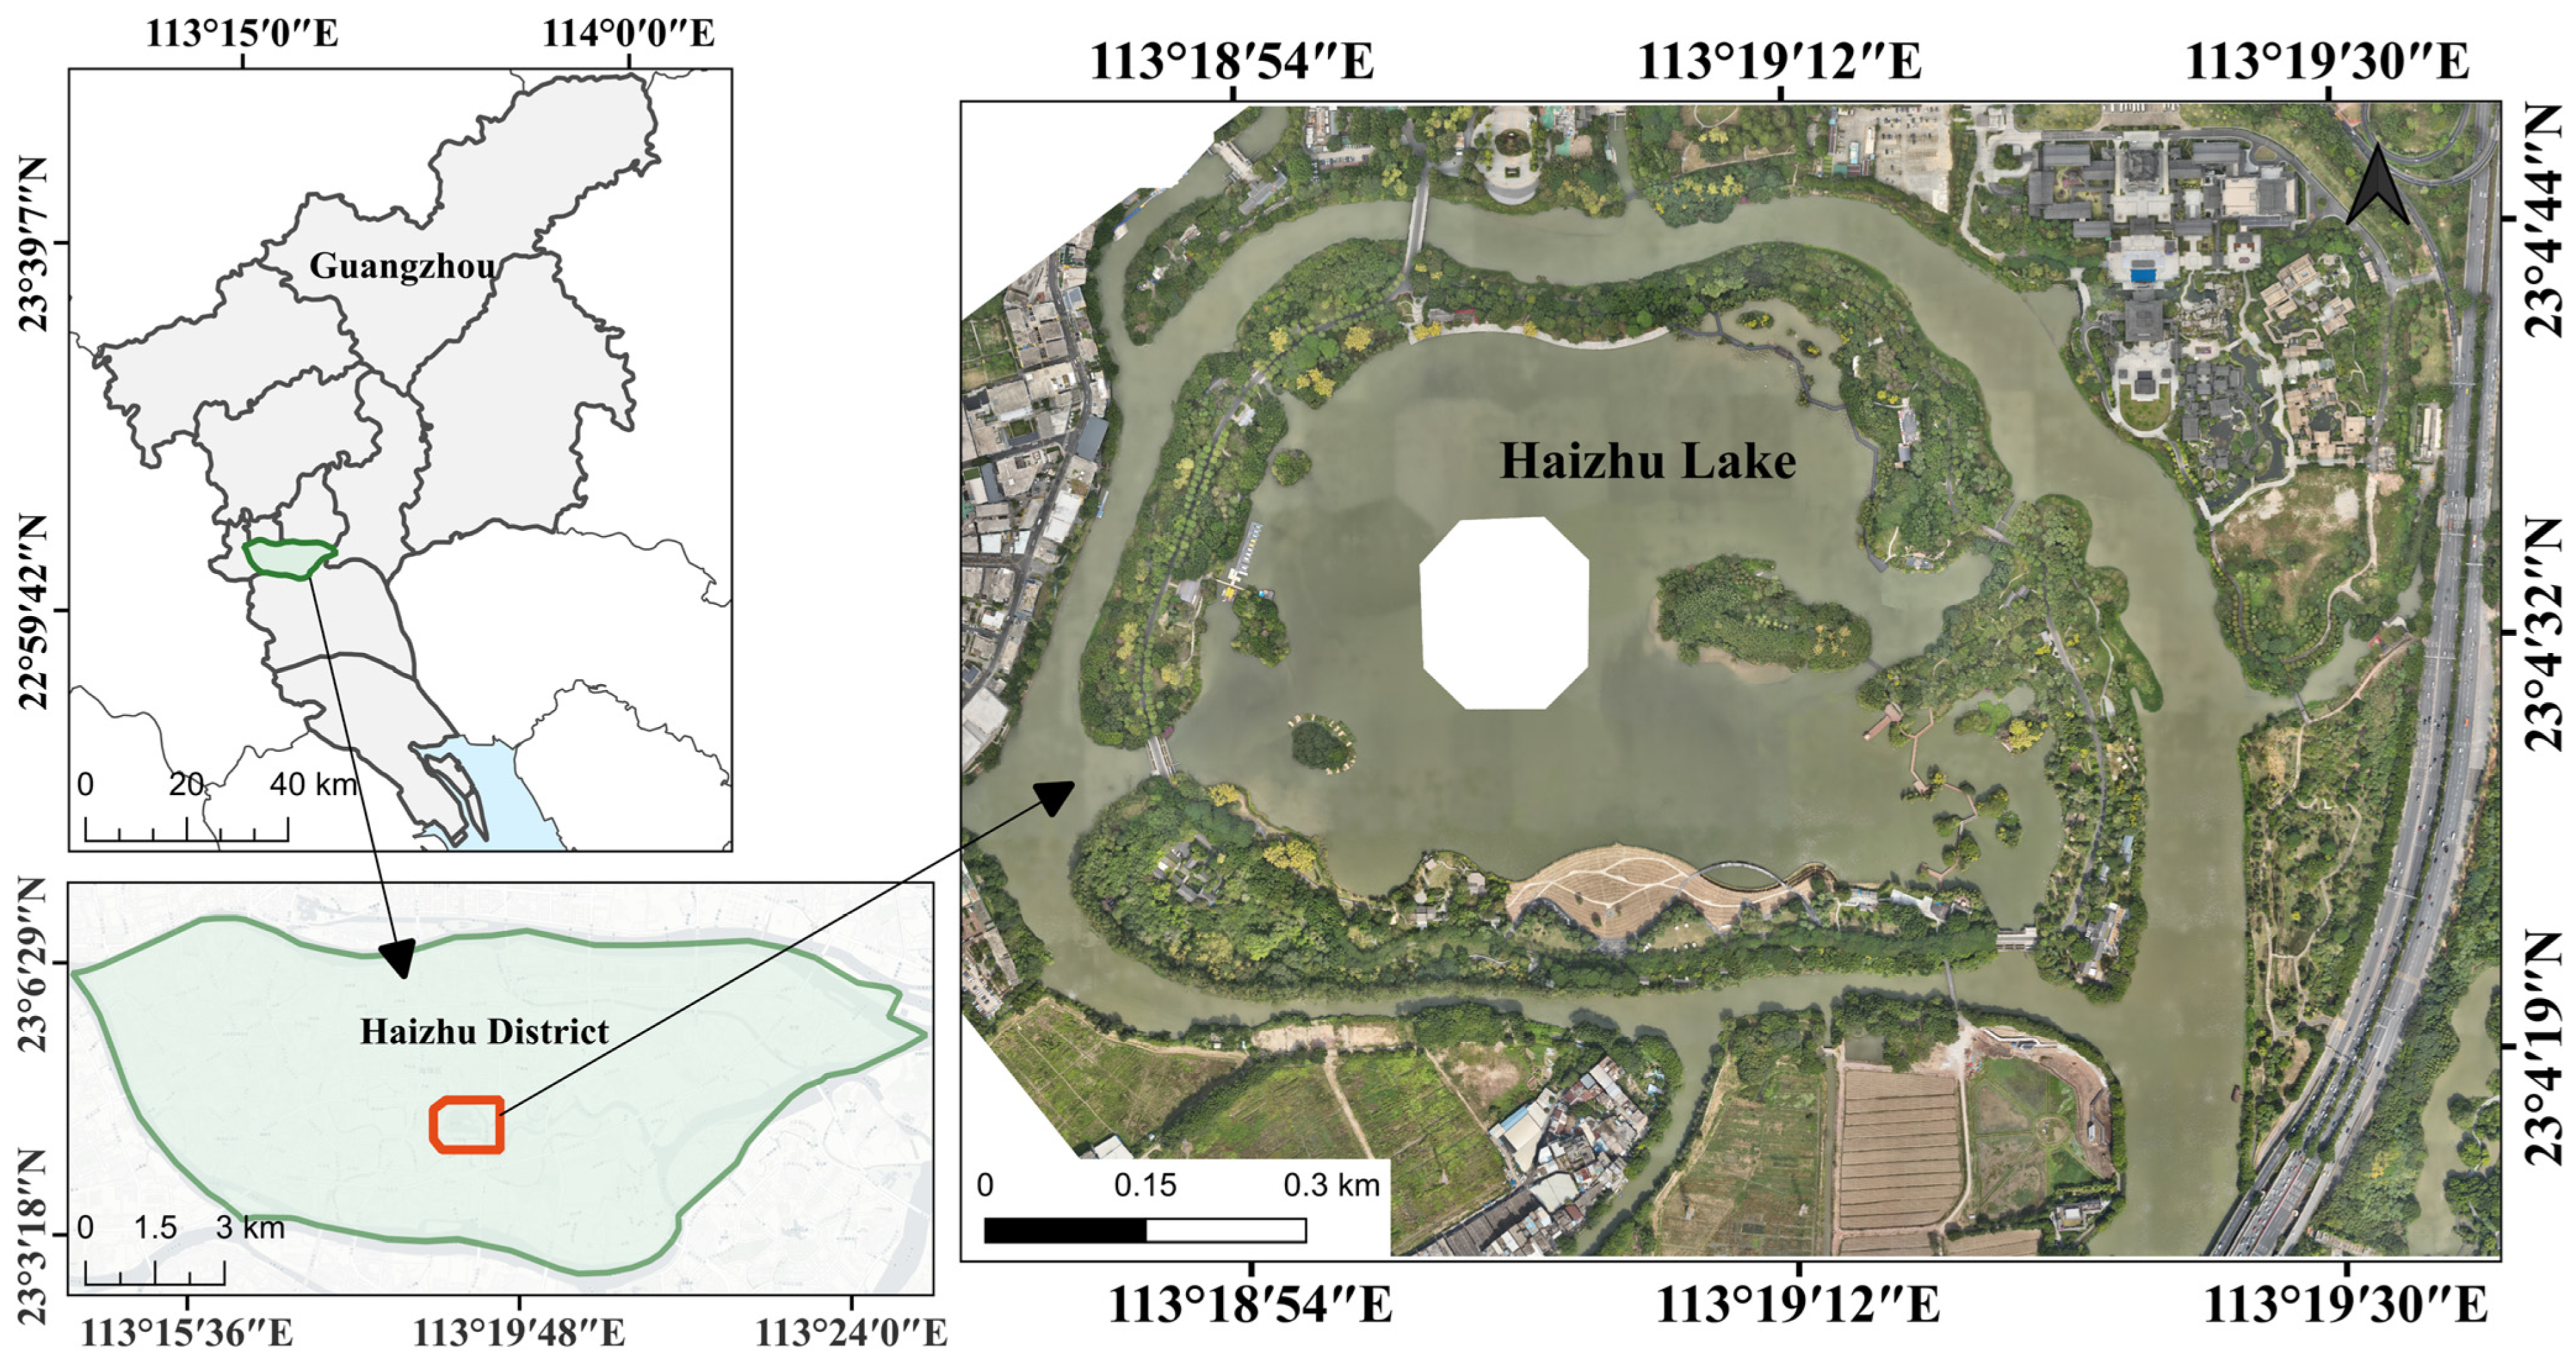
This study centers on Haizhu Lake, Guangzhou (Haizhu District), situated in the core of the Haizhu Wetland Park (Figure 1) at 113°18′E, 23°06′N, which is a key urban ecological wetland system. In this region, vegetation cover ranges from 60% to 80%, with as many as 110 tree species; average crown diameters are 3–5 m, and prolonged natural growth combined with management interventions has led to pronounced crown overlap. This trait not only complicates crown identification but also offers an ideal testing scenario to assess the accuracy and robustness of segmentation algorithms.

2.1.2. Airborne Optical Images

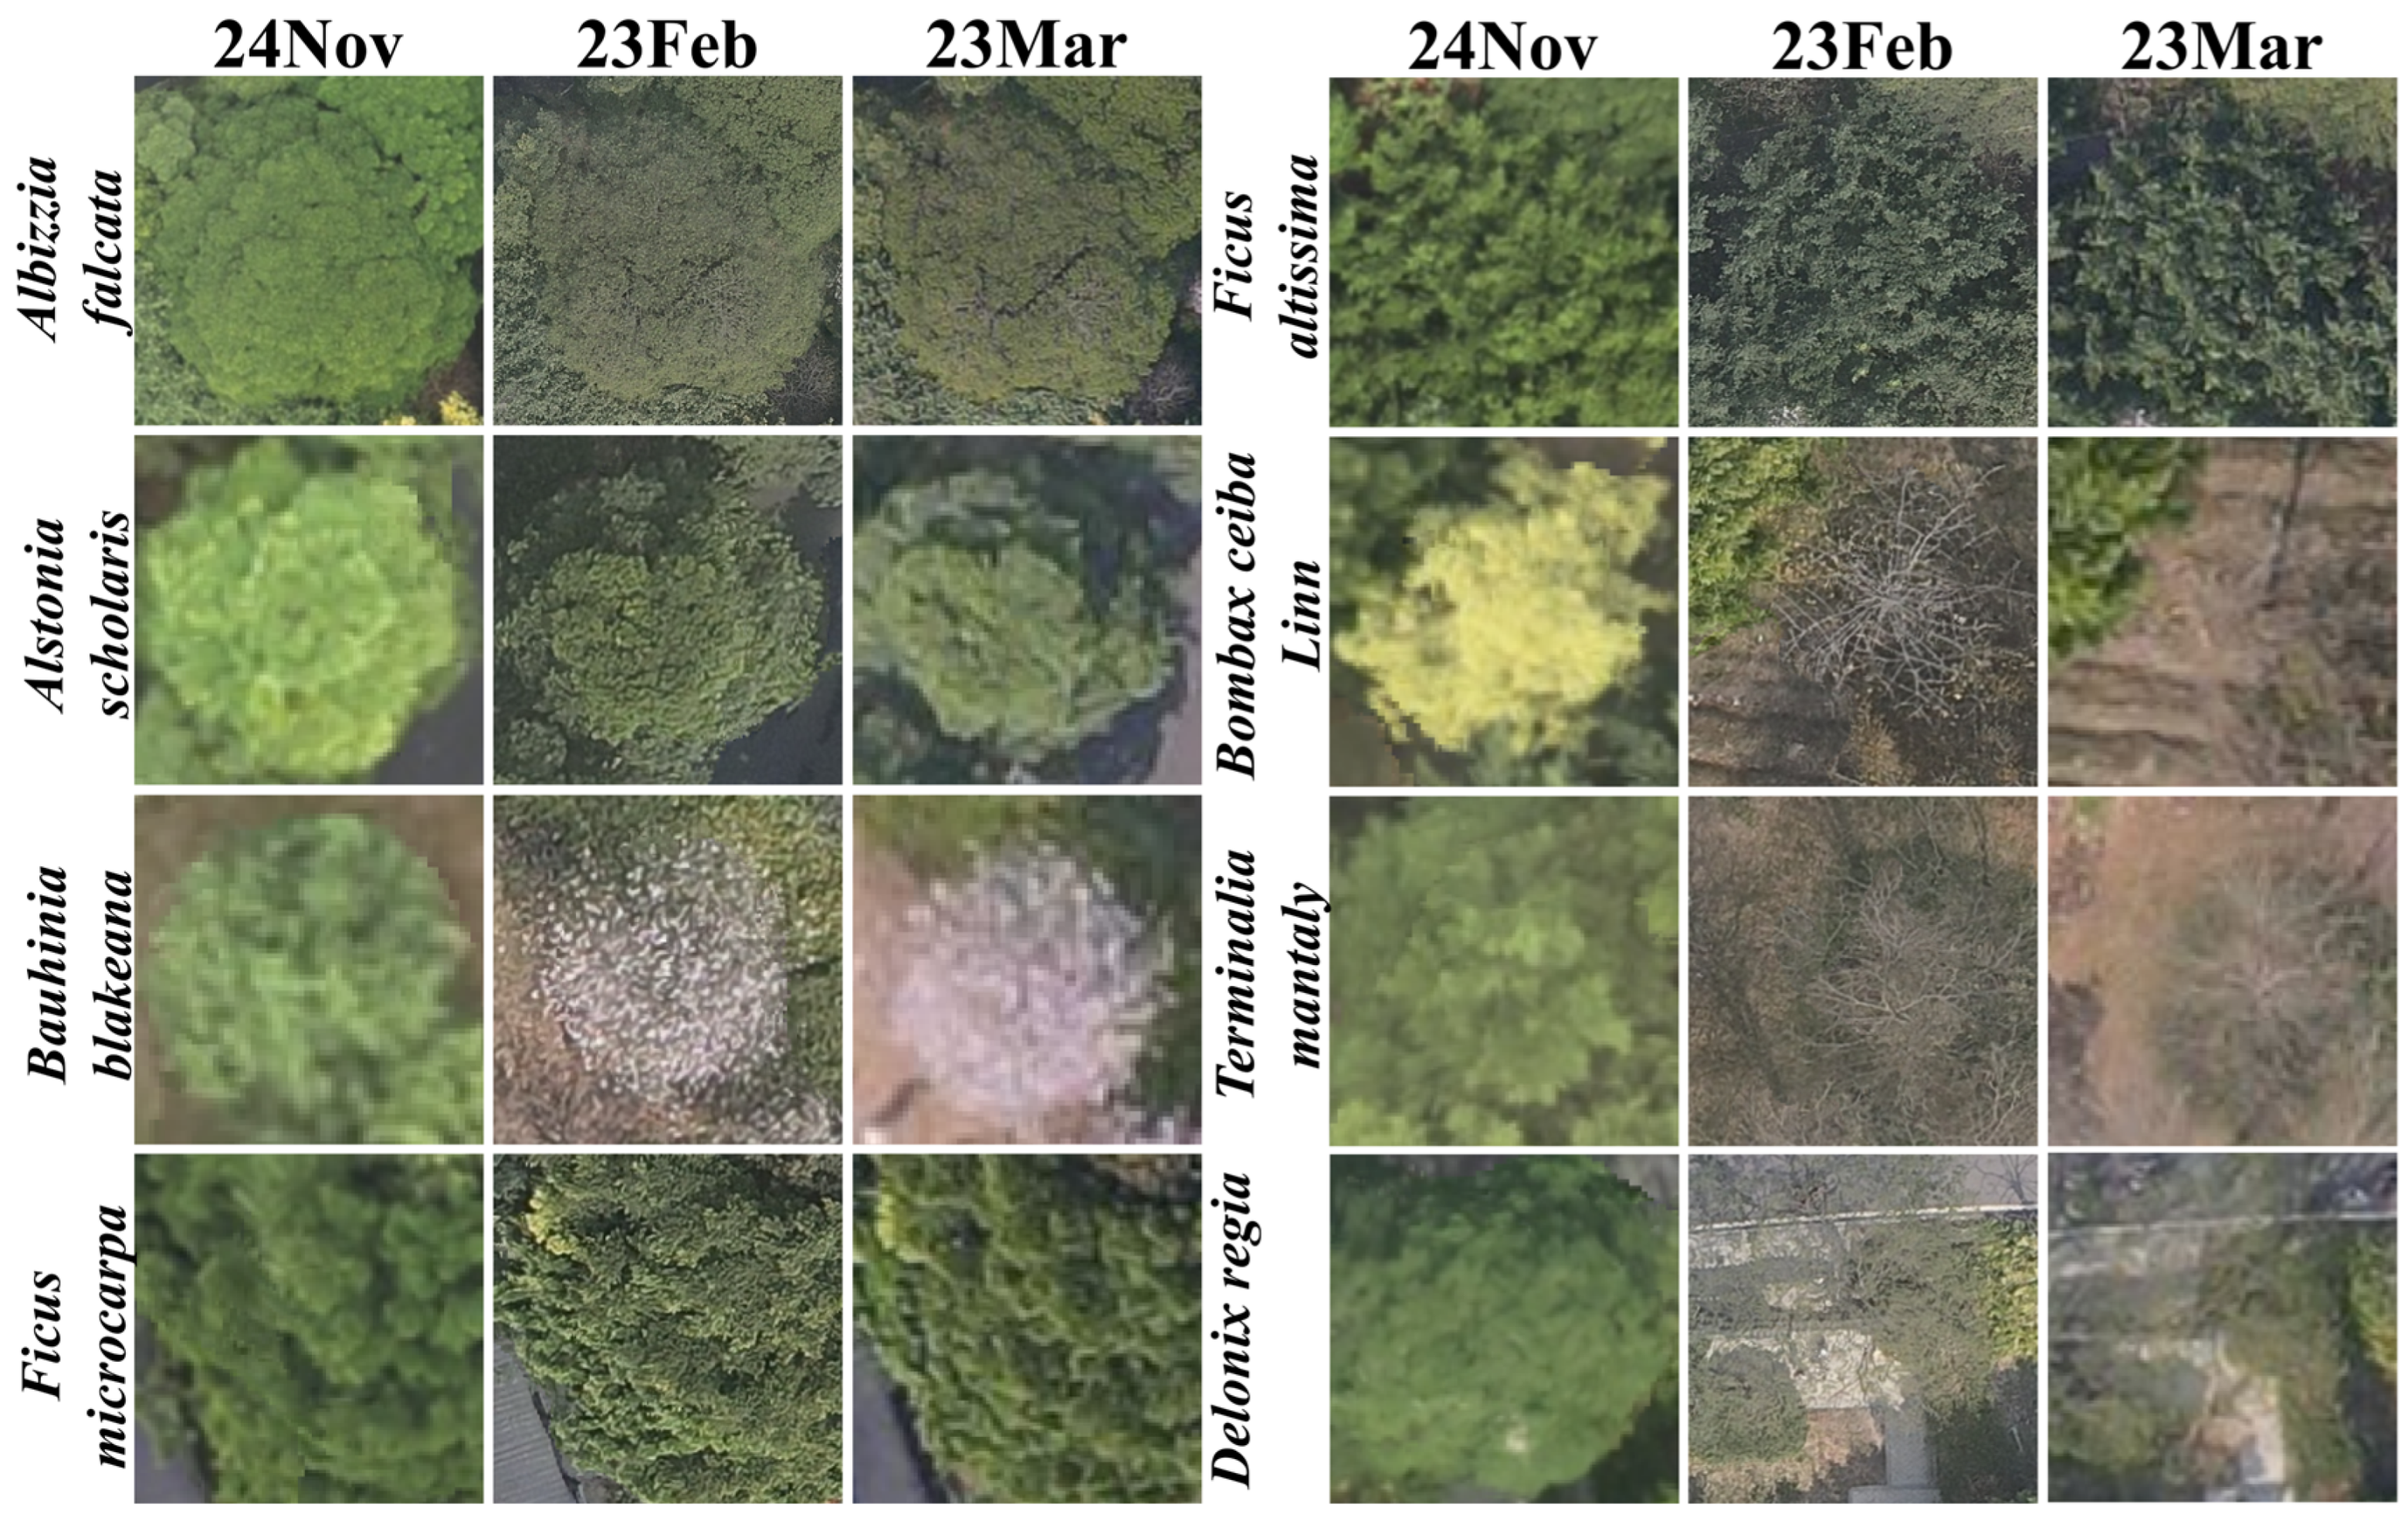
The imagery was acquired using DJI Mavic 2 Enterprise Advanced (DJI Science and Technology Co., Ltd., Shenzhen, China). Outfitted with an RGB sensor, the platform collected three clear-sky acquisitions in 2023–2024 with a spatial resolution of 0.1 m. The schedule followed phenological phases of subtropical evergreen stands: early growth (1 February 2023, 23Feb; 1 March 2023, 23Mar) and peak growth (8 November 2024, 24Nov). Coverage encompassed water and non-vegetated classes to maintain scene integrity. Each of the three temporal points was processed with geometric rectification and co-registration. For 23Feb and 24Nov, both co-registration accuracy and radiometric quality were high, supporting clear visuals and discriminable features. In 23Mar, afternoon acquisition and low sun angle produced shadow elongation and local overexposure, making detail sharpness poorer than in the other phases. Such acquisition disparities complicate multi-temporal fusion; this study is expressly designed to evaluate these effects and determine the best-performing strategies. The appearance of the same tree crown across different temporal phases is illustrated in Figure 2.

2.2. Methods

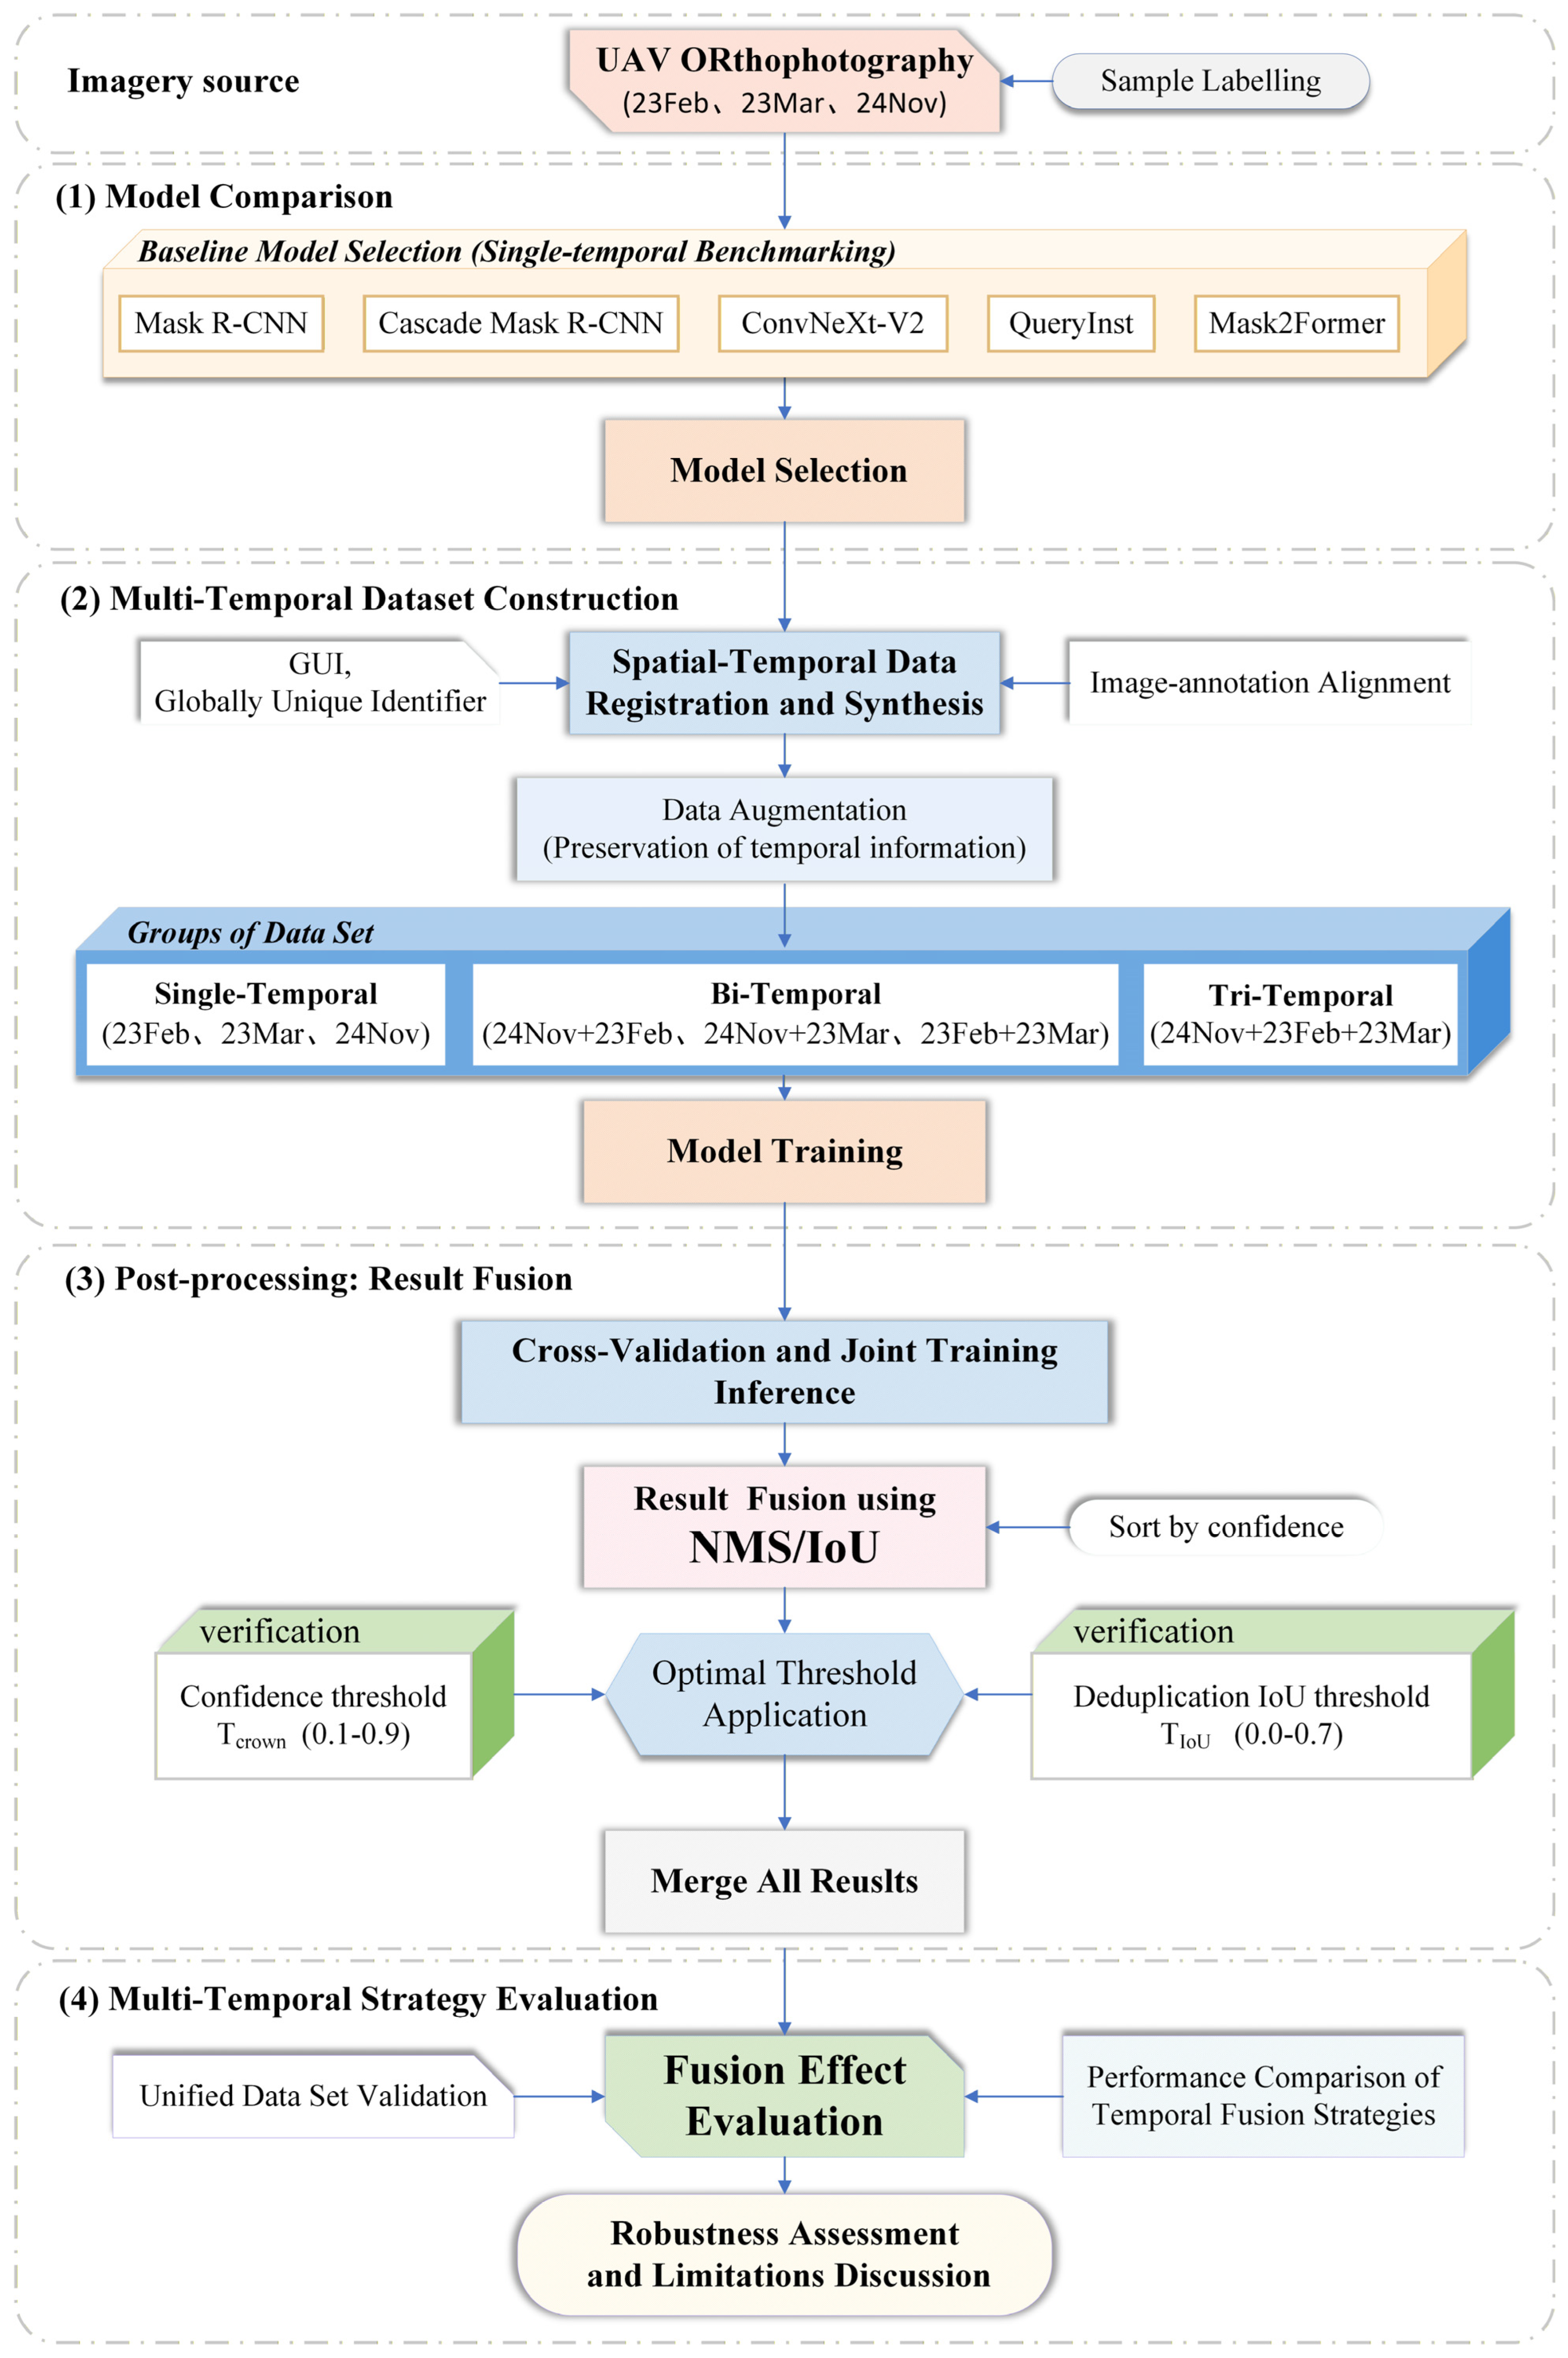
To parse the mechanisms by which architecture and phenology influence crown instance segmentation, this study establishes a four-stage operation pipeline (Figure 3). Stage 1 performs baseline model selection using standard configurations, aiming to identify a suitable reference architecture rather than conduct exhaustive or fully controlled comparisons. Stage 2 constructs varied multi-temporal scenarios (single-, bi-, and tri-temporal) to quantify cross-phase generalization capacity. Stage 3 implements joint training with multi-temporal data and an NMS-based fusion strategy for post-processing to leverage phenological complementarity. Finally, Stage 4 performs a comprehensive robustness evaluation on a common benchmark. This structured workflow ensures the systematic analysis and reproducibility of our multi-temporal fusion framework.

2.2.1. Sample Labeling

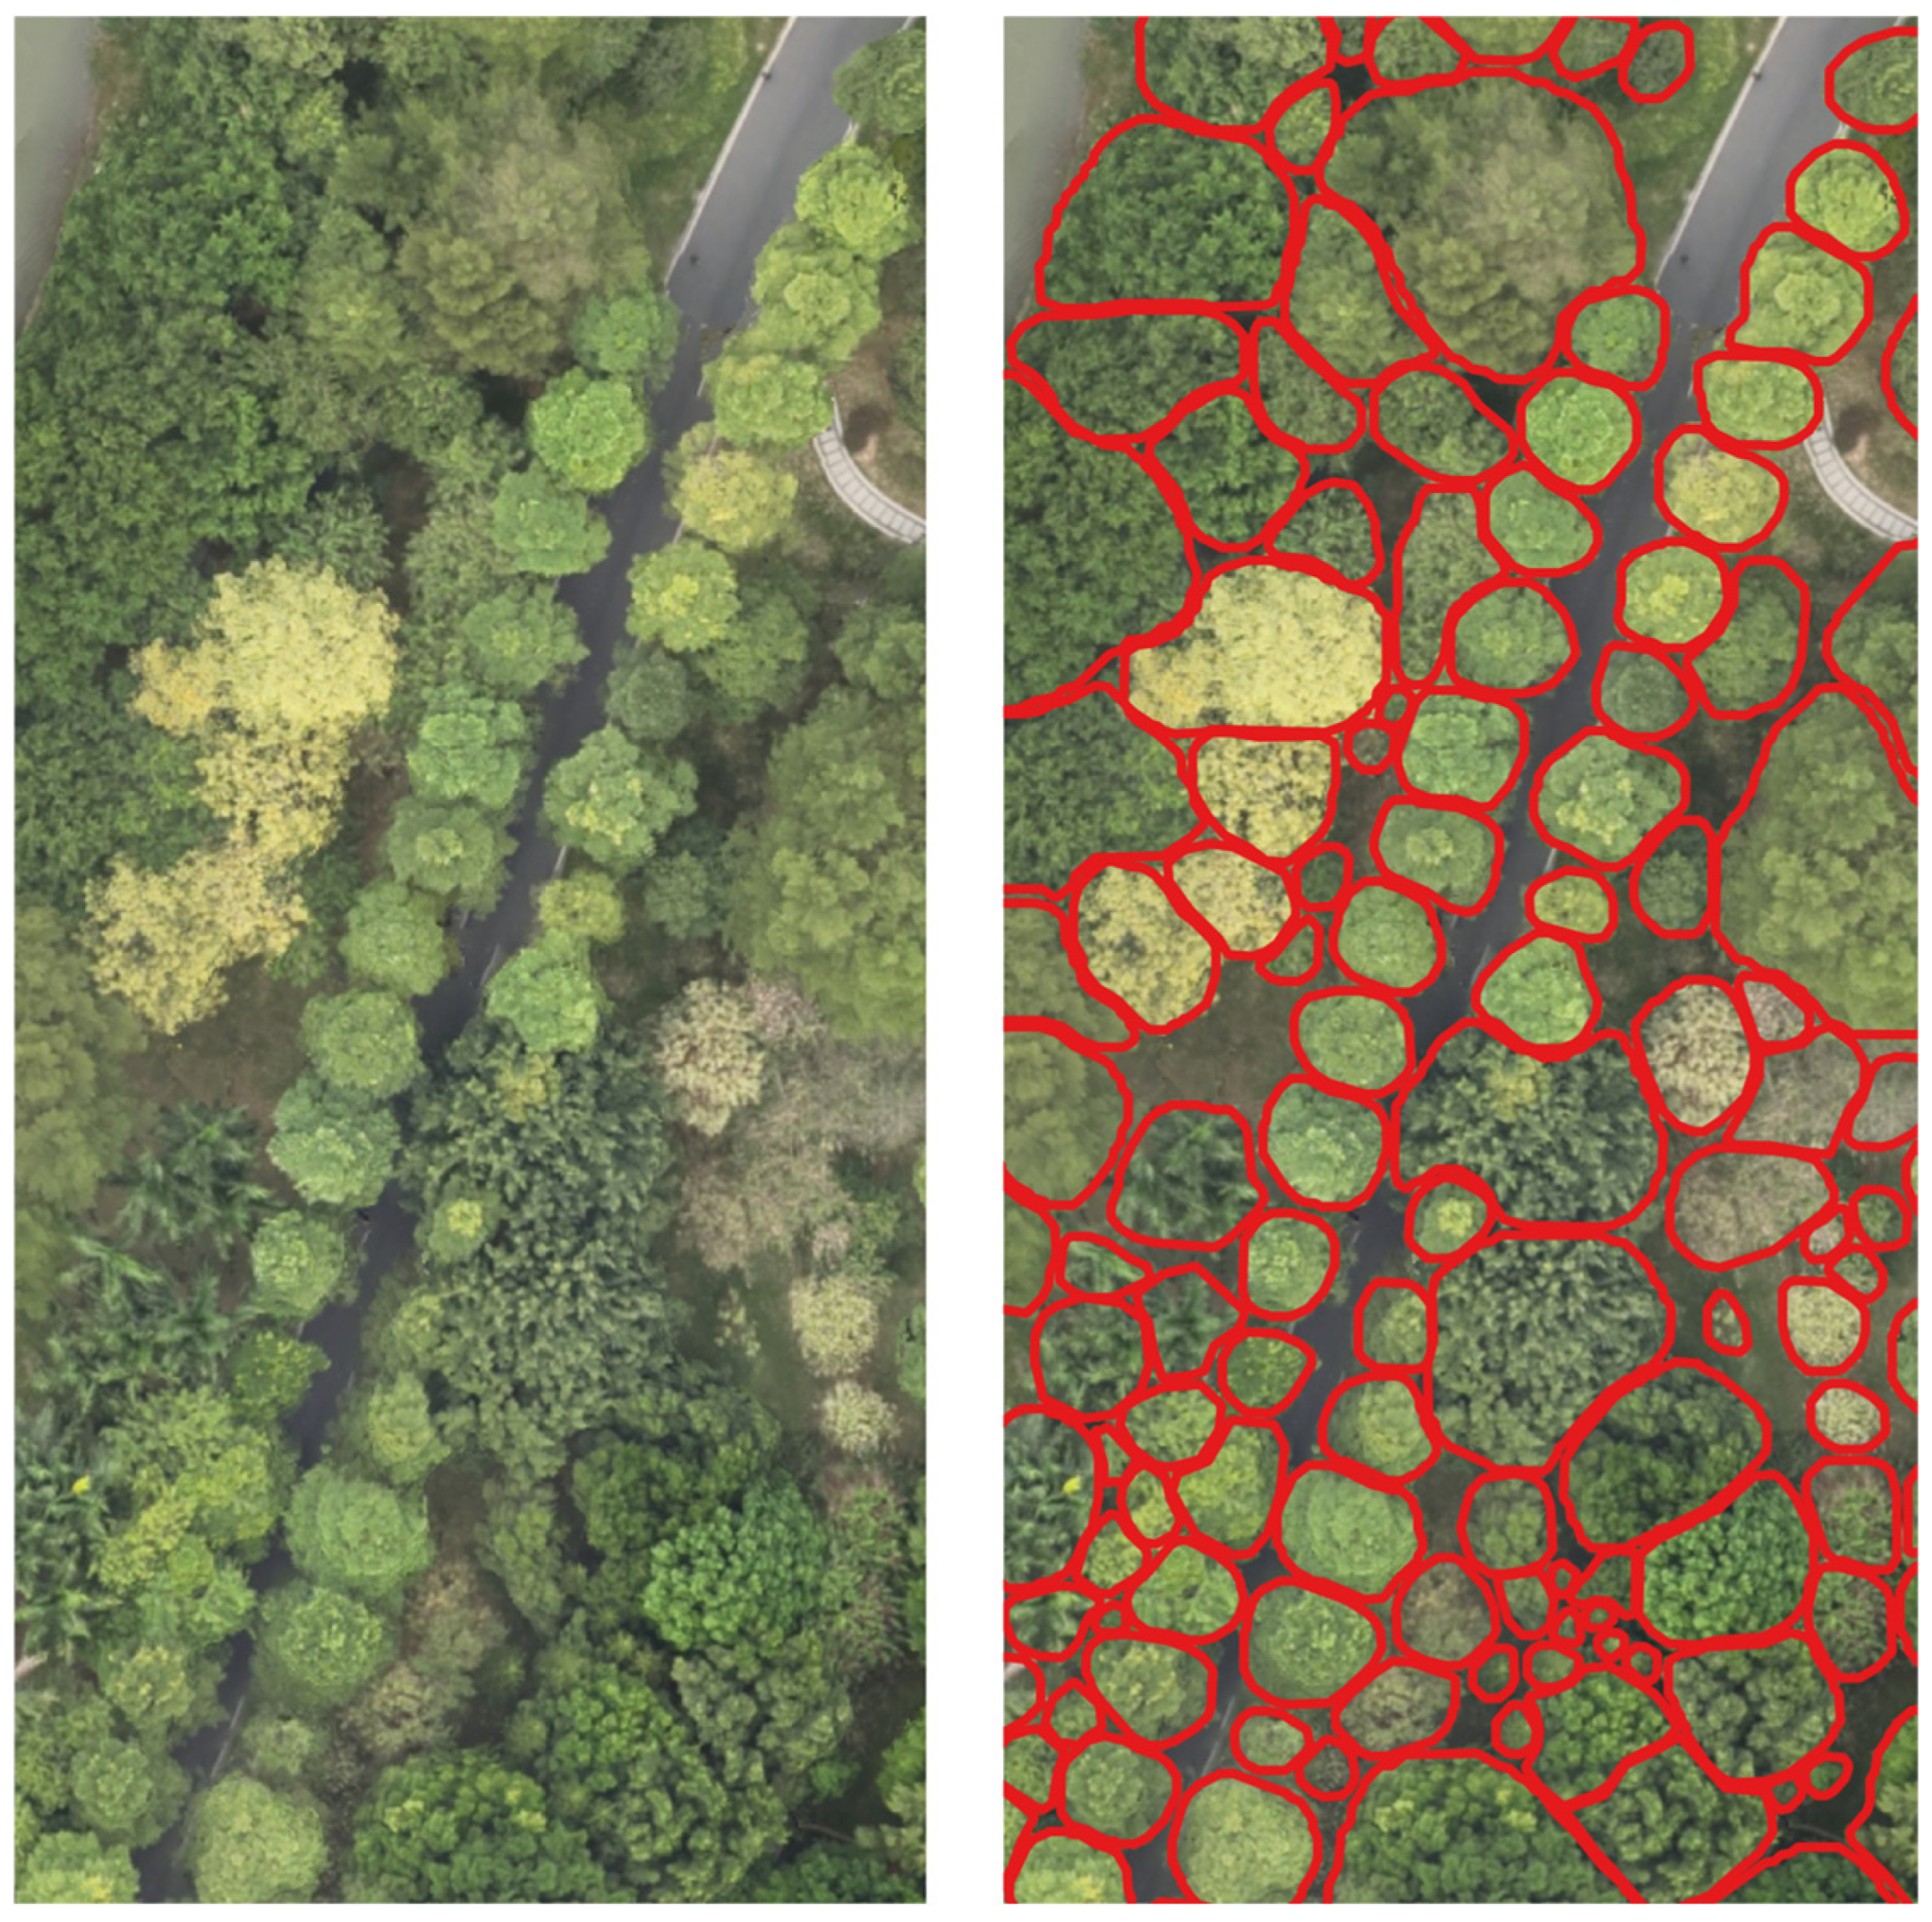
All 110 species were treated as a single category—tree crown—to concentrate on instance segmentation. Individual tree crowns were hand-digitized using QGIS 3.28.0. To mitigate occlusion effects, annotations were restricted to upper-canopy visible crowns, excluding understory-occluded trees. Sampling prioritized dense, heterogeneous forest patches to maximize representativeness. Furthermore, to address overlapping crowns, locally blurred orthophoto regions, and truncated edge crowns, delineation leveraged texture features (Figure 4) to minimize omissions. In total, the resulting dataset comprised 47,754 annotated crowns, serving both training and evaluation.

2.2.2. Dataset Partitioning

To reduce potential temporal leakage, the dataset was partitioned at the tile level using a fixed sliding-window grid, where each tile was assigned a unique spatial identifier. Because orthophotos were co-registered across temporal phases, observations from different phases corresponding to the same tile were kept within the same split, ensuring that training and validation subsets contained disjoint spatial regions. The dataset was randomly divided at the tile level into training and validation sets, with 80% allocated to training and 20% to validation. Only tiles intersecting at least one annotated tree crown were retained, resulting in a total of 11,234 usable tiles, including 8987 for training and 2247 for validation. Across temporal phases, the number of usable tiles was 7037 (23Feb), 1985 (24Nov), and 2212 (23Mar). Within the final split, the corresponding training/validation distributions were 5615/1422 (23Feb), 1602/383 (24Nov), and 1770/442 (23Mar), respectively. These statistics quantify the effective sample contribution of each phase under the sliding-window setting.

2.2.3. Temporal Data Characterization

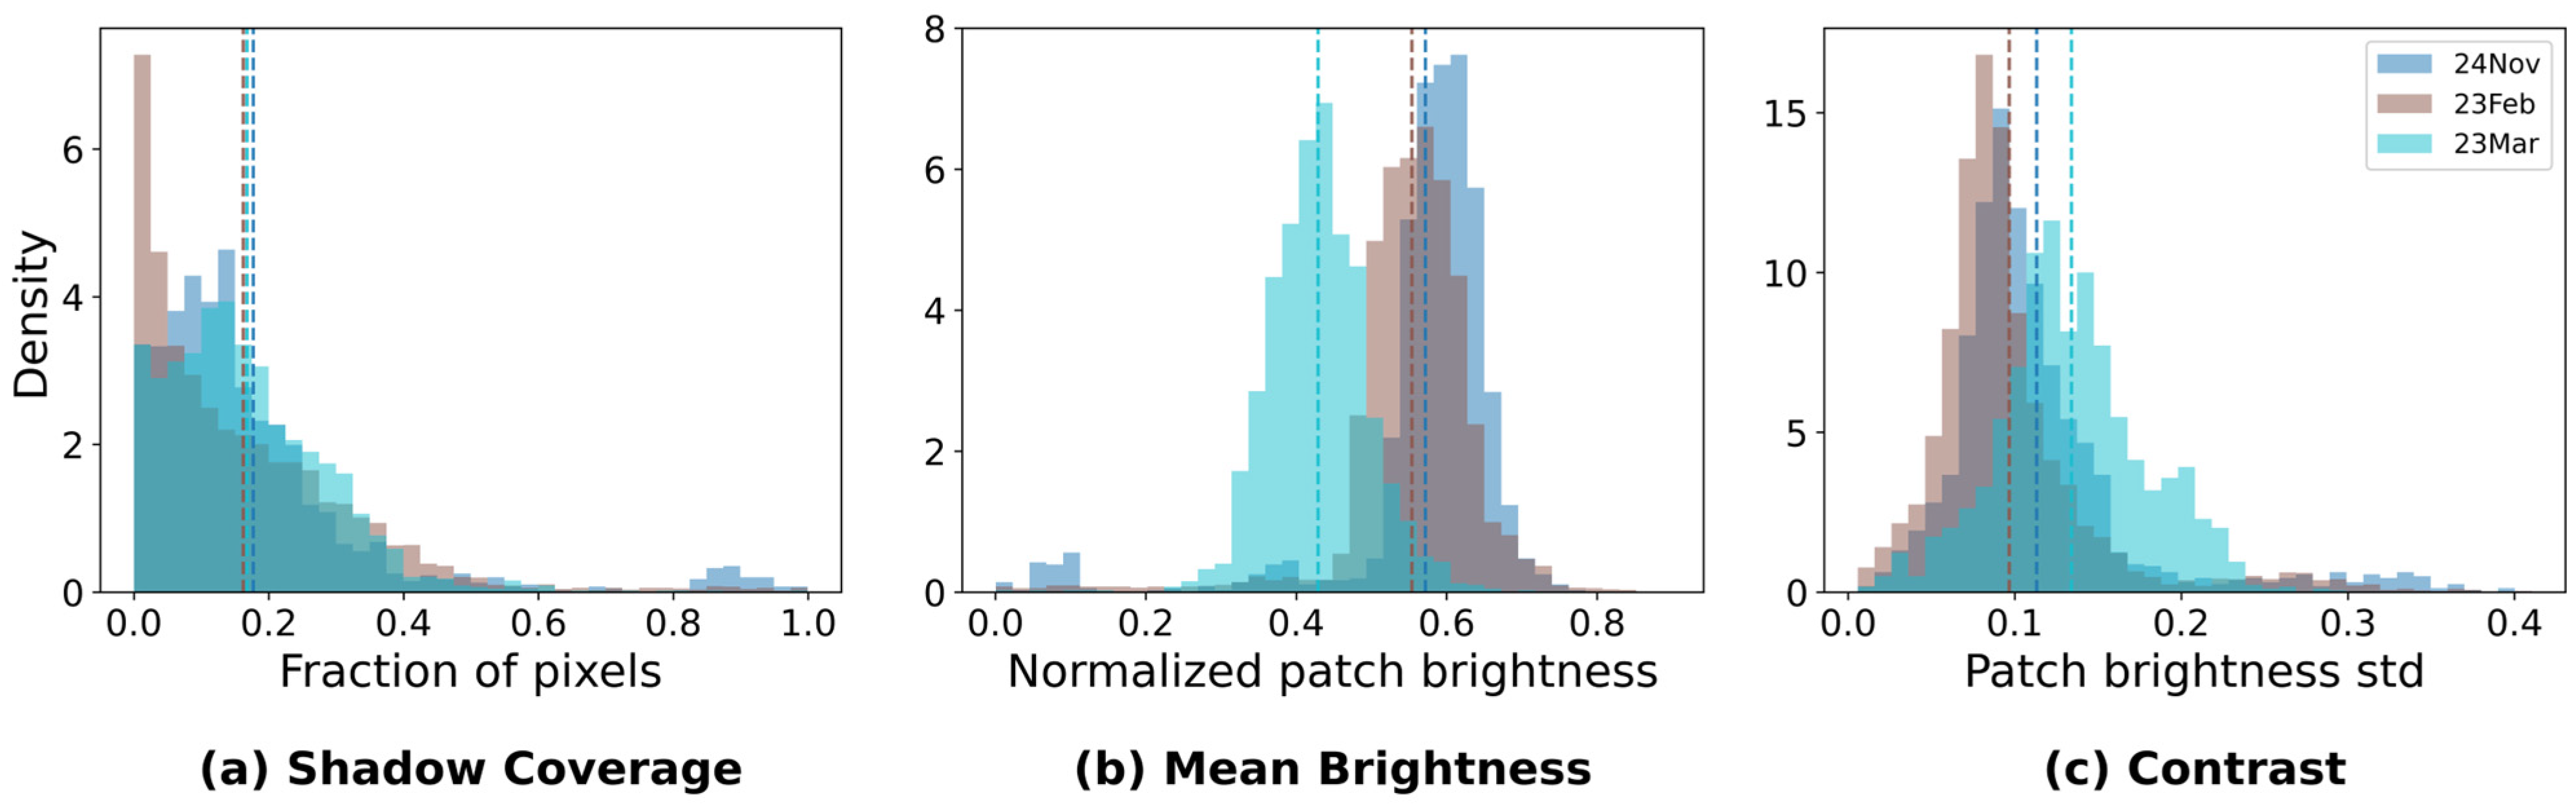
To account for temporal variations in illumination and acquisition conditions, pixel-level statistics were computed for each temporal phase based on the tile-wise partition. As summarized in Figure 5, three indicators were reported: (a) shadow coverage (fraction of shadow pixels), (b) mean brightness, and (c) contrast quantified by the standard deviation of brightness. These quantitative characterizations support a more objective interpretation of cross-temporal performance, complementing the distribution of samples across phases.

2.2.4. Tree Crown Recognition Based on ConvNext-V2

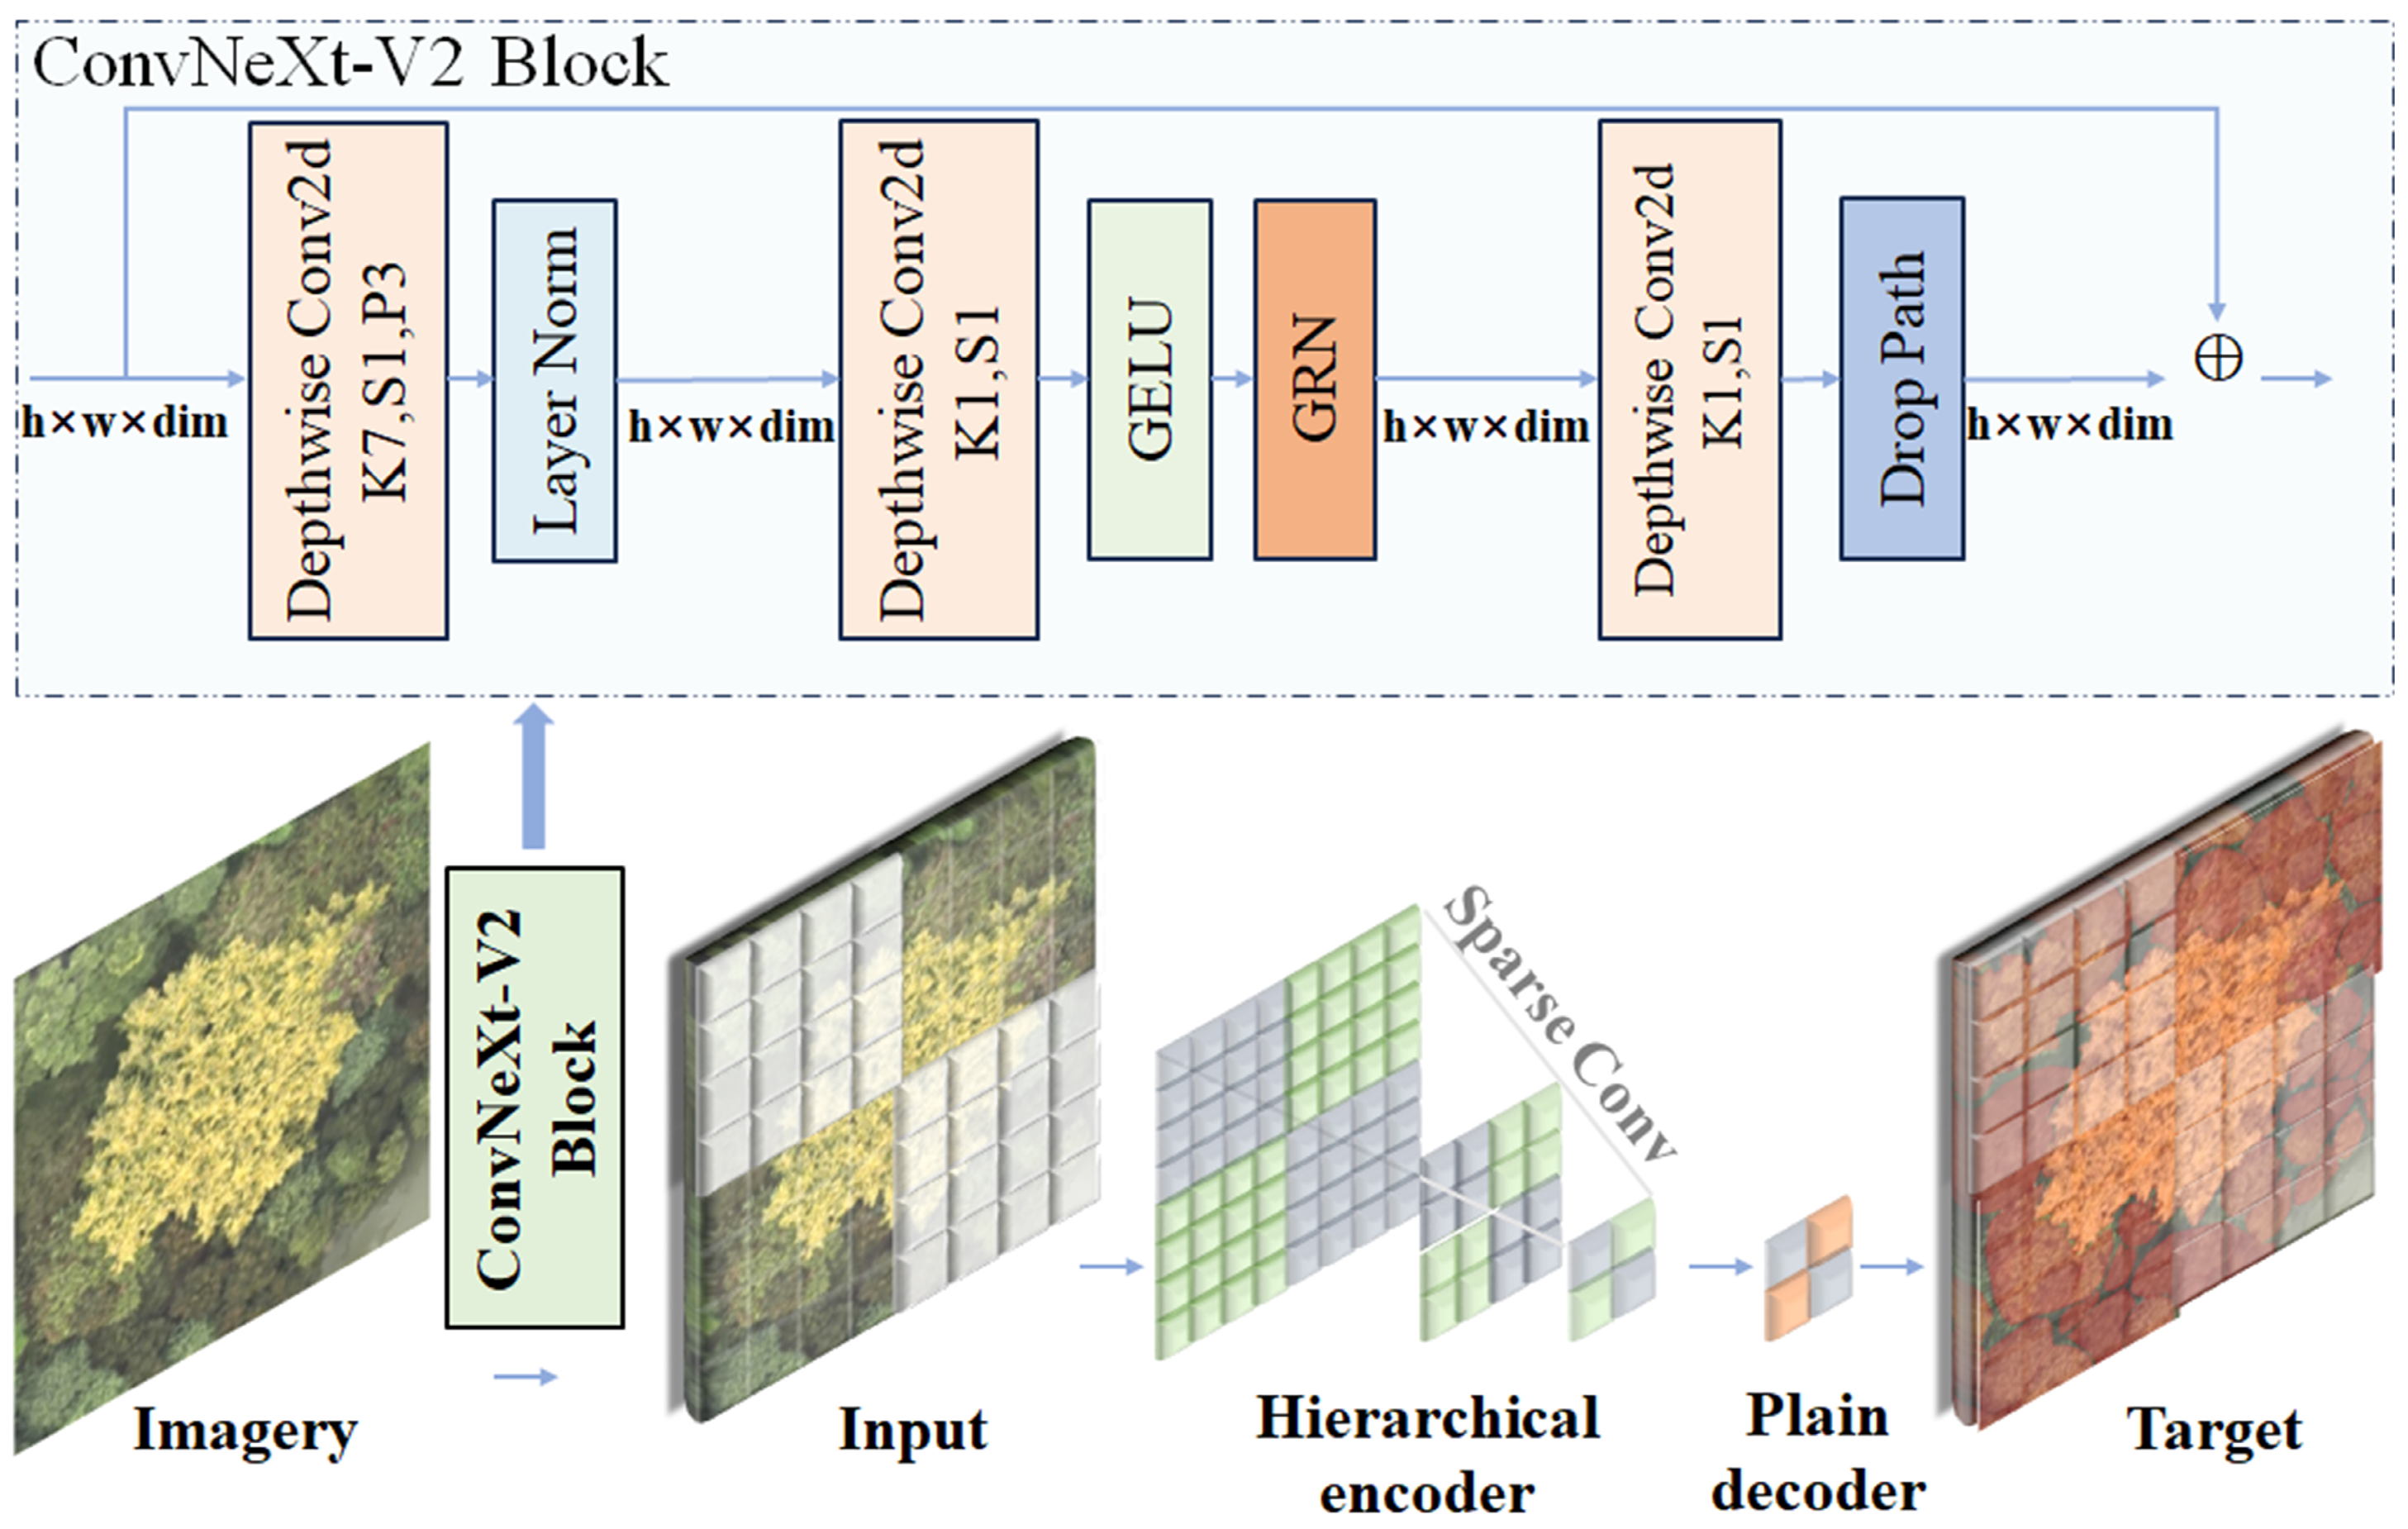
ConvNeXt-V2 was adopted as the backbone for our instance segmentation framework due to its superior feature representation capabilities. As shown in Figure 6, the operational flow for tree crown recognition involves three key stages: (1) feature extraction: the input UAV image patches are processed through the ConvNeXt-V2 backbone, where Global Response Normalization (GRN) is applied to enhance feature competition and prevent feature collapse; (2) multi-scale fusion: extracted features are passed through a Feature Pyramid Network (FPN) to capture crowns of varying sizes; (3) instance prediction: a Mask R-CNN head performs simultaneous bounding box regression and pixel-level mask generation [15].
To perform GRN, first, the feature map X R H × W × C of any input image X i R H × W is aggregated as:
ξ X = X 1 , X 2 , , X C R C
Normalization is then performed by executing the following operation:
Ψ X i = X i j = 1 , 2 , 3 , C X j X i = γ × X i × Ψ ξ X i + β + X i
where β and γ are two learnable parameters.
Experiments were executed on Ubuntu 22.04 with MMDetection v3.3 and PyTorch 2.0.1 on an NVIDIA GeForce RTX 4090 (24 GB). Models were trained using the AdamW optimizer with an initial learning rate of 1 × 10⁻⁴ and decayed at epochs 27 and 33 by a factor of 0.1 for a total of 36 epochs with a batch size of 4 per GPU. Data augmentation included RandomResize, RandomCrop, and RandomFlip. The best model was selected based on validation mAP, and all reported results were obtained from a single run, following a consistent training protocol.

2.2.5. Experiment Design

A suite of systematic experiments are conducted to evaluate, in aggregate, the impact of joint training with multi-temporal data and NMS-based post-processing on crown instance segmentation in subtropical urban forests. From a phenological perspective, the shape, color, and texture of tree crowns evolve over time [25]. Such variation directly affects the visual prominence of tree crown targets. Therefore, when only a single temporal acquisition is available, selecting the optimal acquisition timing is critical to maximize crown–background separability. When multiple temporal phases are available, the selection and combination of phases become key factors for leveraging phenological complementarity, thereby improving robustness and precision in crown delineation under diverse conditions.
Accordingly, the experiments follow a progressive design. Baseline models are first established for each single-temporal phase (23Feb, 23Mar, 24Nov) to assess phase-specific contributions. Next, all pairwise combinations of temporal phases are evaluated to quantify synergistic effects on accuracy and generalization. Finally, three-phase fusion is tested to examine marginal performance gains and identify potential saturation effects. All experiments are evaluated in terms of both accuracy and generalization capacity, resulting in a total of seven experimental settings. This design enables a systematic analysis of the intrinsic relationship between instance segmentation performance and multi-temporal fusion strategies.

2.2.6. Result of Fusion Based on Non-Maximum Suppression

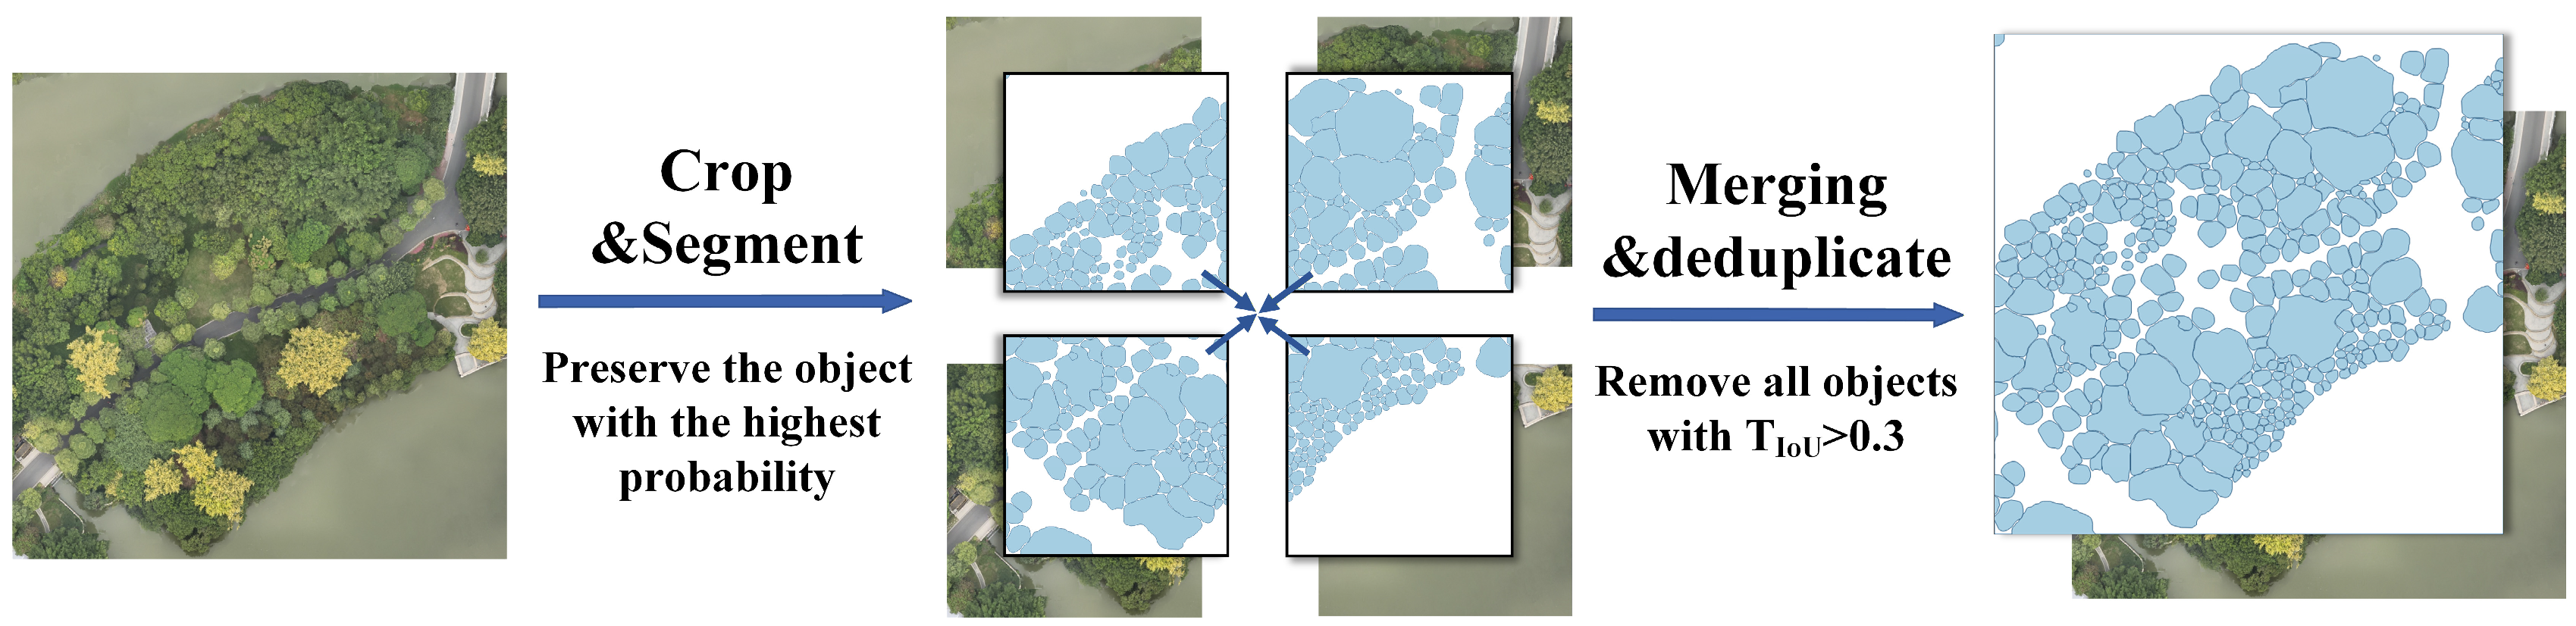
A sliding-window inference strategy combined with NMS is employed to extract tree crown instances. The input imagery is first partitioned into 512 × 512 tiles with an overlap of 160 pixels, and inference is performed independently on each tile, producing candidate crowns with corresponding instance masks and confidence scores. An initial confidence threshold (Tcrown) is applied to remove low-confidence predictions, reducing unreliable detections. The remaining masks are then polygonized and additional filtering is conducted based on bounding constraints, centroid locations, and a minimum area threshold to eliminate spurious detections and cross-tile duplicates. To retain a single optimal representation for each crown, a greedy NMS strategy based on Intersection over Union (IoU) is applied. Candidate instances are sorted in descending order of confidence; the highest-scoring instance is retained, and overlapping candidates exceeding the IoU threshold (TIoU) are suppressed. This process is repeated iteratively until all candidates are processed, resulting in refined and de-duplicated crown boundaries. The fusion process based on NMS is illustrated in Figure 7.

2.2.7. Assessment

In the evaluation phase, the Average Precision (AP) metric from the MS COCO protocol [26] is adopted as the foundation for comprehensive model performance evaluation. In addition, precision, recall, and F1-score are included to provide a multi-dimensional evaluation of model performance in both detection and segmentation tasks. To objectively evaluate segmentation accuracy and generalization, we determine matches based on the IoU between predicted and ground-truth crown masks, calculated as follows:
I o U = A r e a   o f   O v e r l a p A r e a   o f   U n i o n = A B A B
where A represents the automatically delineated crown area and B represents the manually delineated crown area. Predictions with IoU ≥ 0.5 are considered true positives, consistent with common practice in related studies [19,27].
Detection performance is evaluated via Bounding Box Mean Average Precision (Bbox_mAP), averaging precision over IoU thresholds 0.50–0.95 (step 0.05) and across object scales (small/medium/large), corresponding to APs, APm, and APl. Segmentation performance is assessed using segmentation mean Average Precision (Segm_mAP), computed from pixel-wise mask overlap over the identical IoU threshold range. Given the focus of this study, Segm_mAP is adopted as the primary evaluation metric.

3. Results

3.1. Benchmarking and Parameter Analysis

Of the three image sets, 24Nov is leaf-on and offers superior texture sharpness, making it the baseline for single-temporal assessment.

3.1.1. Model Architecture Comparison

A comparison was conducted on five instance segmentation models selected from the MMDetection project, with each model using its most basic configuration. Notably, unlike the default ResNet-50 backbone used in the other models, ConvNeXt-V2 adopts a more advanced backbone combined with a Mask R-CNN head. This comparison was intended solely for model selection in subsequent research; therefore, configurations were not strictly aligned across all models. This choice aimed to evaluate the performance upper bound of modern architectures rather than implying a common baseline across all frameworks.
As shown in Table 2, within the scope of this comparison, ConvNeXt-V2 attained the most favorable scores across all metrics, with a Segm_mAP of 0.852. In comparison, Mask R-CNN obtained 0.744, Cascade Mask R-CNN 0.763, QueryInst 0.629, and Mask2Former 0.595. These results demonstrate that ConvNeXt-V2 achieved high accuracy on the 24Nov dataset, indicating its effective capability in handling the complex urban forest textures presented in this case study.

3.1.2. Parameter Analysis

To ensure a fair evaluation and avoid potential bias, threshold tuning for Tcrown and TIoU was conducted exclusively on the validation subset of the 24Nov phase, which was not used for model training. The selected thresholds were then fixed and consistently applied across all subsequent experiments.
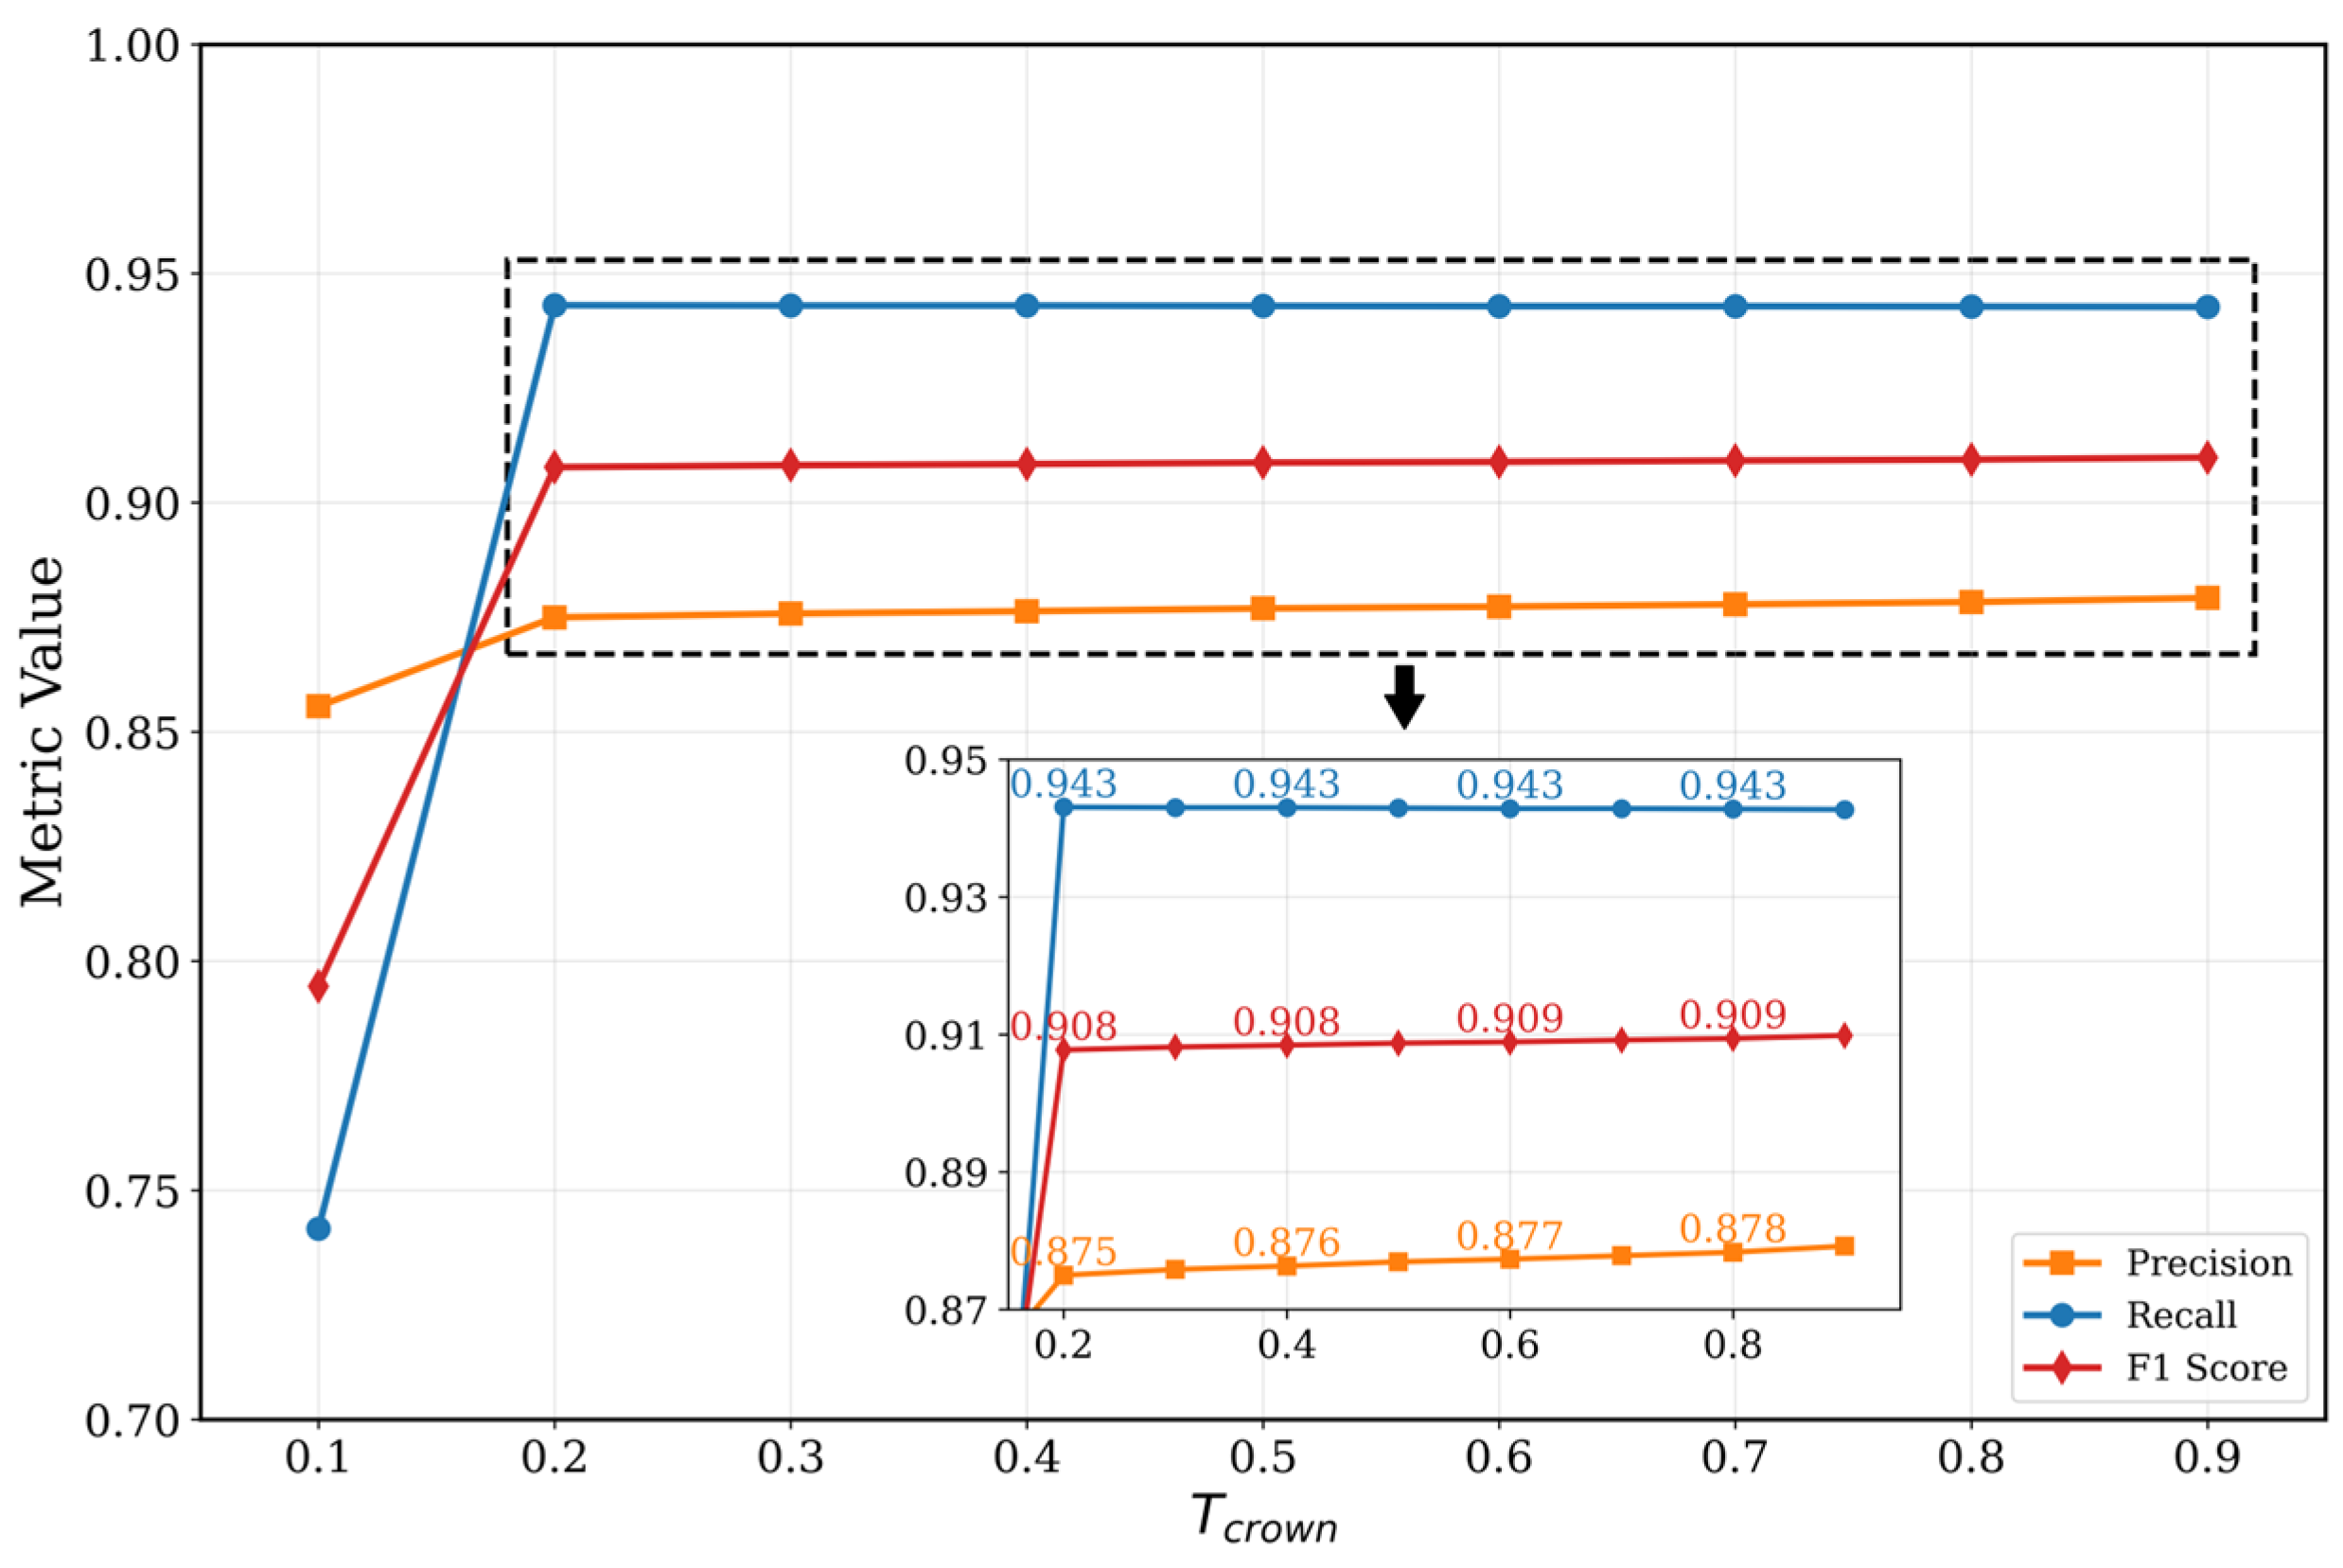
This section systematically evaluates how Tcrown and TIoU thresholds affect the performance of tree crown instance segmentation models. First, Tcrown was varied from 0.1 to 0.9 to evaluate model precision, recall, and F1-score, as illustrated in Figure 8. Increasing Tcrown from 0.1 to 0.2 led to significant improvements in precision, recall, and F1-score, which rose from 0.856, 0.742, and 0.795 to 0.875, 0.943, and 0.908, respectively. Within the range of 0.2 to 0.7, model performance remained stable, with F1-scores fluctuating between 0.908 and 0.910. These results suggest that a low confidence threshold (Tcrown = 0.2) suffices for stable performance, and raising it further yields diminishing returns.
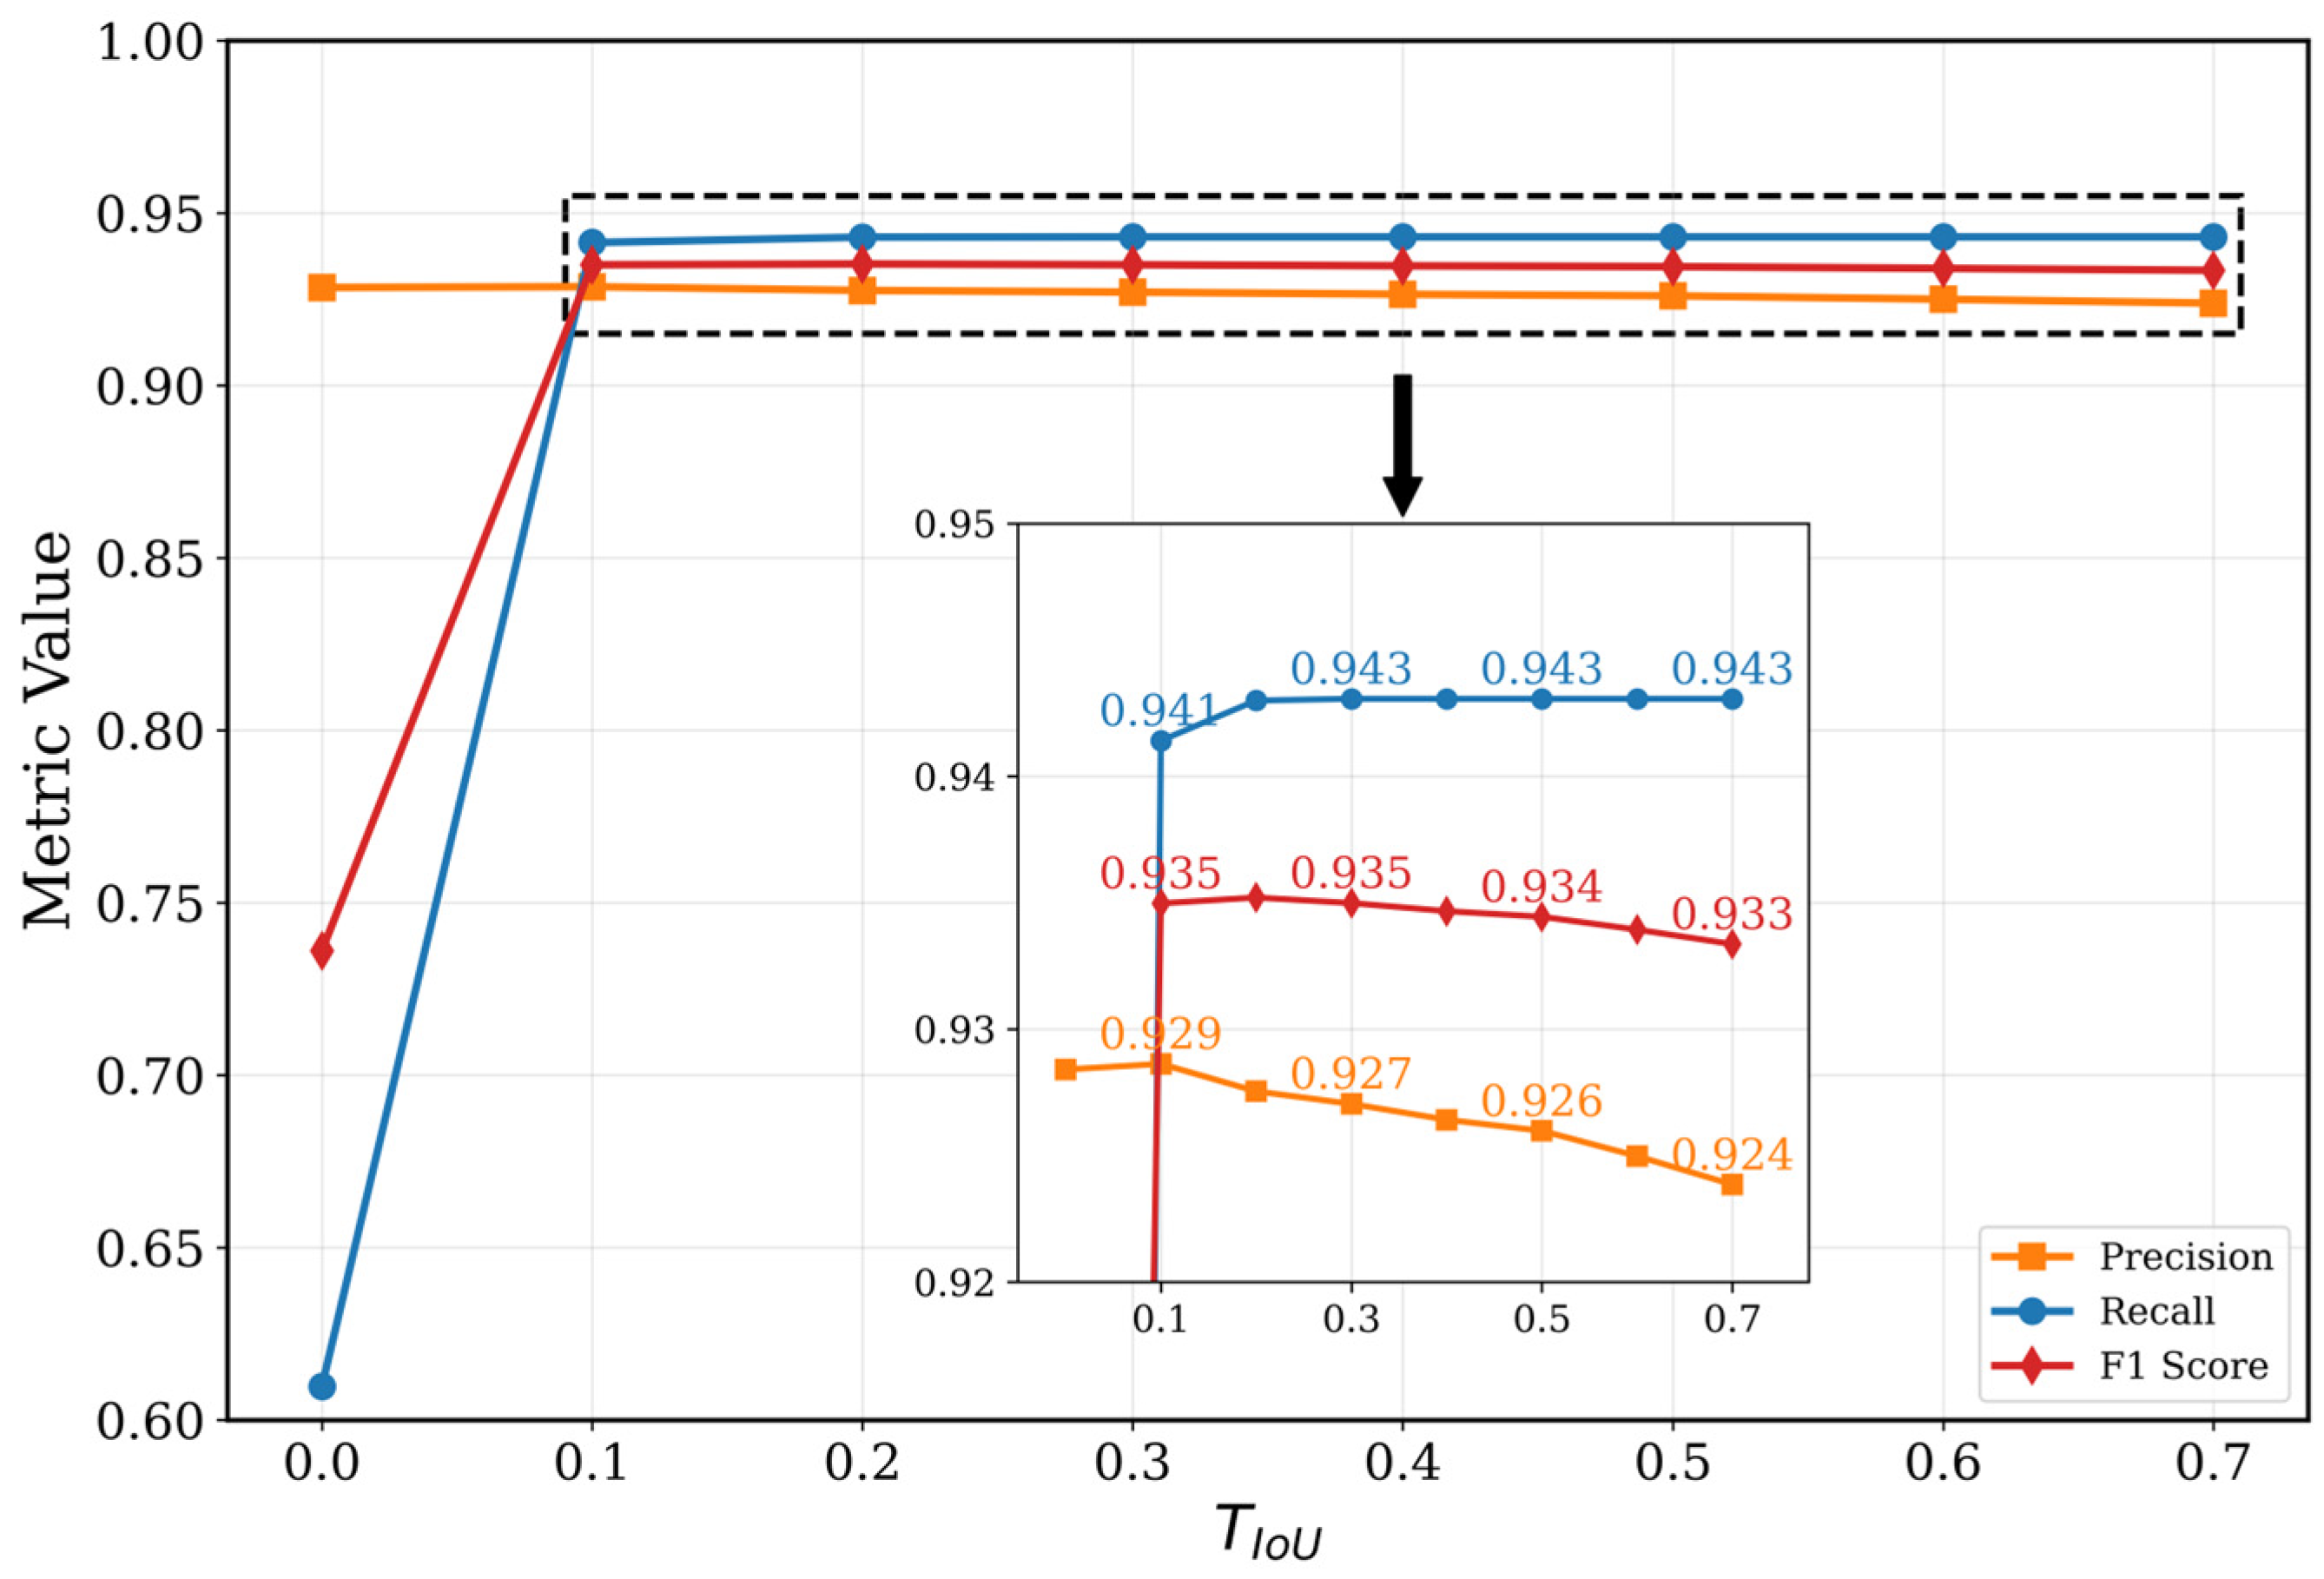
Furthermore, as shown in Figure 9, precision rose as TIoU increased, while recall and F1 reached maxima at 0.2 (0.943 and 0.935, respectively); beyond this point, gains were marginal or mildly negative. This suggests that a moderate TIoU threshold balances detection accuracy and completeness, whereas overly high values risk over-segmentation. Accordingly, Tcrown = 0.2 and TIoU = 0.2 were adopted and kept fixed for all subsequent experiments.

3.1.3. Comparison of Fusion Strategies

To address the need for alternative fusion strategies and establish a stronger baseline for multi-temporal analysis, we compared two distinct approaches using the 24Nov and 23Feb image phases. Naive Stacking concatenates images from the two phases into a six-channel input for end-to-end training, providing a baseline that increases data volume without explicit temporal design. The NMS processes each phase independently and merges the resulting instance masks using an NMS mechanism, reflecting a late fusion strategy designed to leverage temporal complementarity.
As shown in Table 3, the NMS strategy achieved a Bbox_mAP of 0.845 and a Segm_mAP of 0.874. In comparison, Naive Stacking achieved 0.634 and 0.661, respectively. The performance gap reflects the absence of six-channel pre-trained weights for the stacking approach, which relied on random initialization, whereas NMS benefited from ImageNet pre-trained weights on three-channel inputs.

3.1.4. Post-Processing Results at Different Stages

To clarify the role of post-processing in shaping the final results, we report segmentation outputs at three successive stages using the 24Nov validation set: raw model predictions, after confidence thresholding, and after NMS fusion.
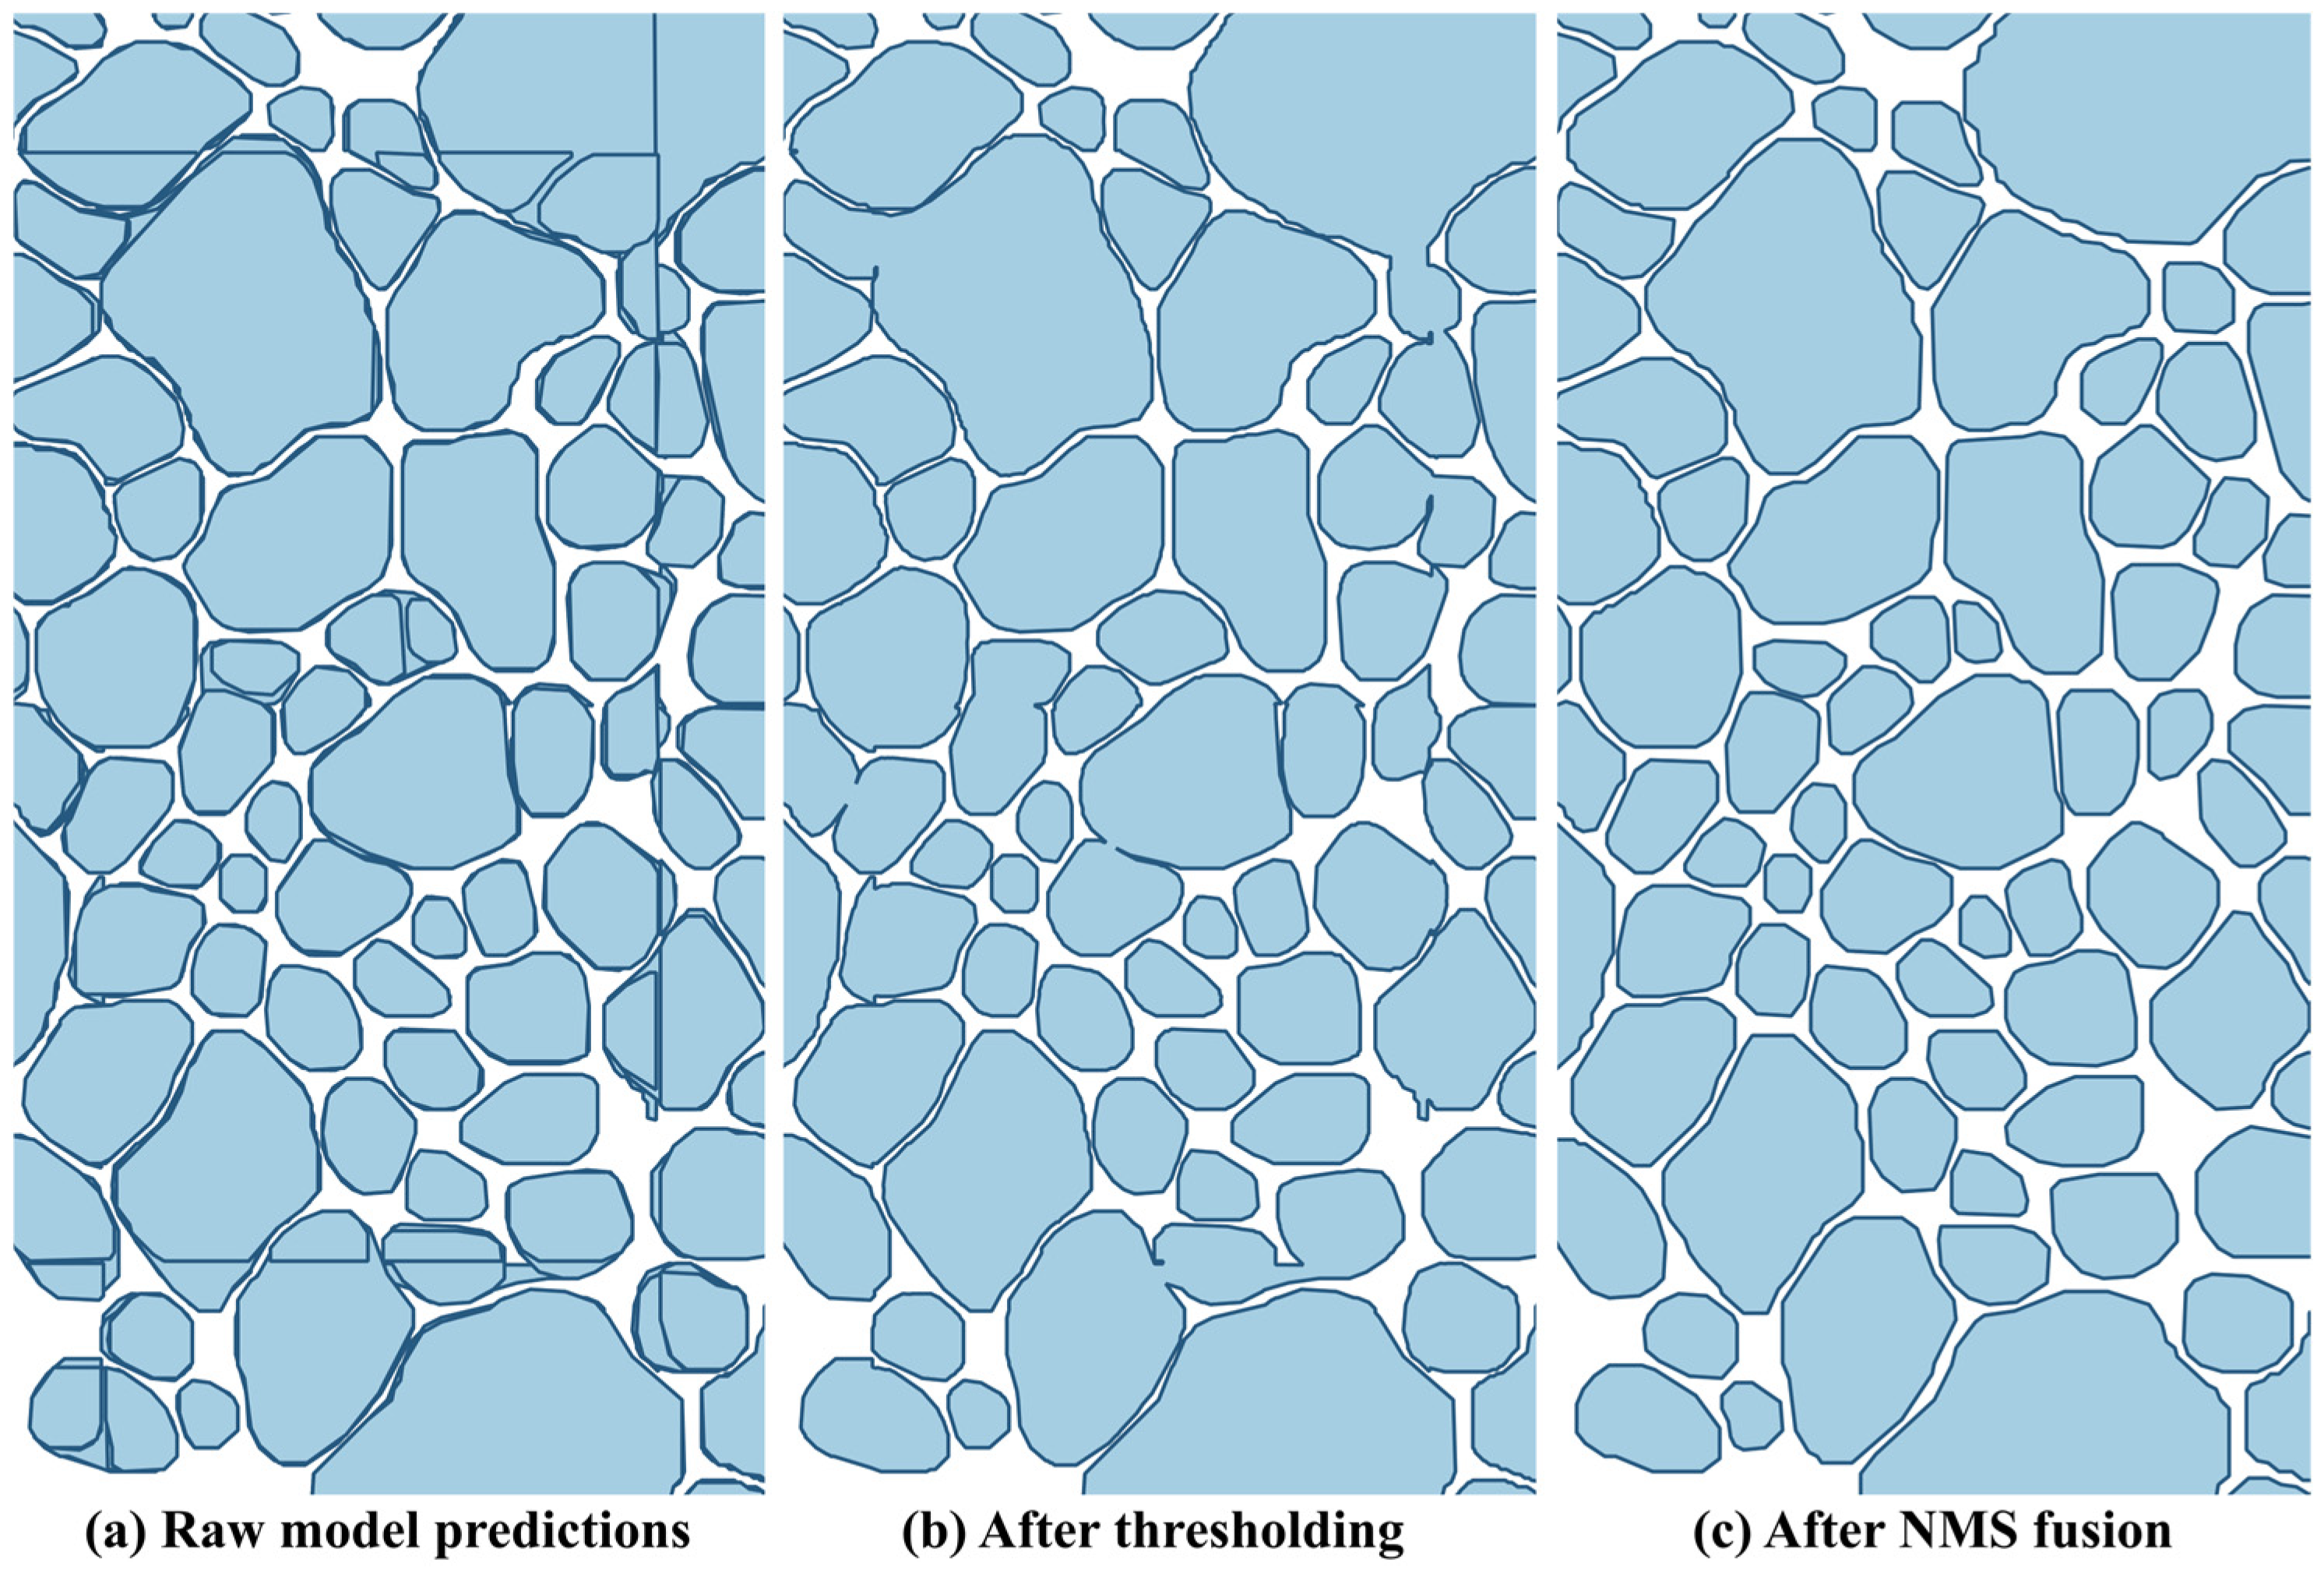
As illustrated in Figure 10, the raw predictions exhibit fragmented instances with repeated detections across tile boundaries. Due to the absence of cross-tile fusion, visible square artifacts remain, resulting in a strong “cutting” effect along tile edges, accompanied by overlapping and merging of candidate instances. After confidence thresholding, low-quality candidates are removed, which significantly reduces the cutting artifacts and repeated detections. However, instance-level merging persists, leaving boundaries between overlapping crowns still ambiguous. After NMS fusion, redundant candidates are suppressed based on inter-instance overlap, eliminating duplicate detections and resolving the merging issue, producing cleaner and more distinct crown boundaries. Figure 10 illustrates this progression, demonstrating that NMS fusion is critical for improving spatial consistency and instance-level interpretability.

3.2. Results Based on Multiple Temporal Observations

While prior experiments confirm superior accuracy, the models still face severe challenges in generalizing across years and varying conditions, motivating our analysis of the impact of multi-temporal fusion on crown instance segmentation.

3.2.1. Training Gains from Multi-Temporal Fusion

To evaluate how joint training with multi-temporal data improves generalization, two evaluation protocols were adopted. In-phase evaluation (“self”) assesses model performance on the validation set corresponding to the same temporal phase(s) used for training, reflecting within-phase accuracy. Cross-phase evaluation (“common”) assesses performance on a unified test set comprising all three temporal phases (24Nov, 23Feb, 23Mar), measuring generalization across phenological conditions. Models trained on different temporal combinations are benchmarked under both protocols, as summarized in Table 4.
The experiments indicate that single-temporal training yields strong in-phase accuracy (e.g., 24Nov-trained model Segm_mAP = 0.852), yet performance degrades substantially on the unified cross-temporal test set (to 0.361–0.419), revealing clear overfitting.
Multi-temporal joint training substantially alleviates this problem. Every bi-temporal configuration outperforms single-phase training on the common test set. Notably, the 24Nov + 23Feb combination delivers the strongest cross-temporal generalization (Segm_mAP = 0.665) and sustains high in-temporal accuracy (Segm_mAP = 0.874). By contrast, the model trained on all three phases shows no marked benefit (Segm_mAP = 0.748), trailing the optimal bi-temporal combination.

3.2.2. Image Quality and Sensitivity Analysis

To investigate whether the performance decline in tri-temporal fusion stems from image quality issues, a weighted training experiment was conducted on the 24Nov + 23Feb + 23Mar combination by progressively reducing the sampling weight of the 23Mar phase. The weight ratios and corresponding results are presented in Table 5.
As the weight of the 23Mar phase decreases from 1.0 to 0.3, both Bbox_mAP and Segm_mAP increase steadily from 0.717/0.748 to 0.758/0.791, respectively.

3.2.3. Visual Performance of Multi-Temporal Fusion

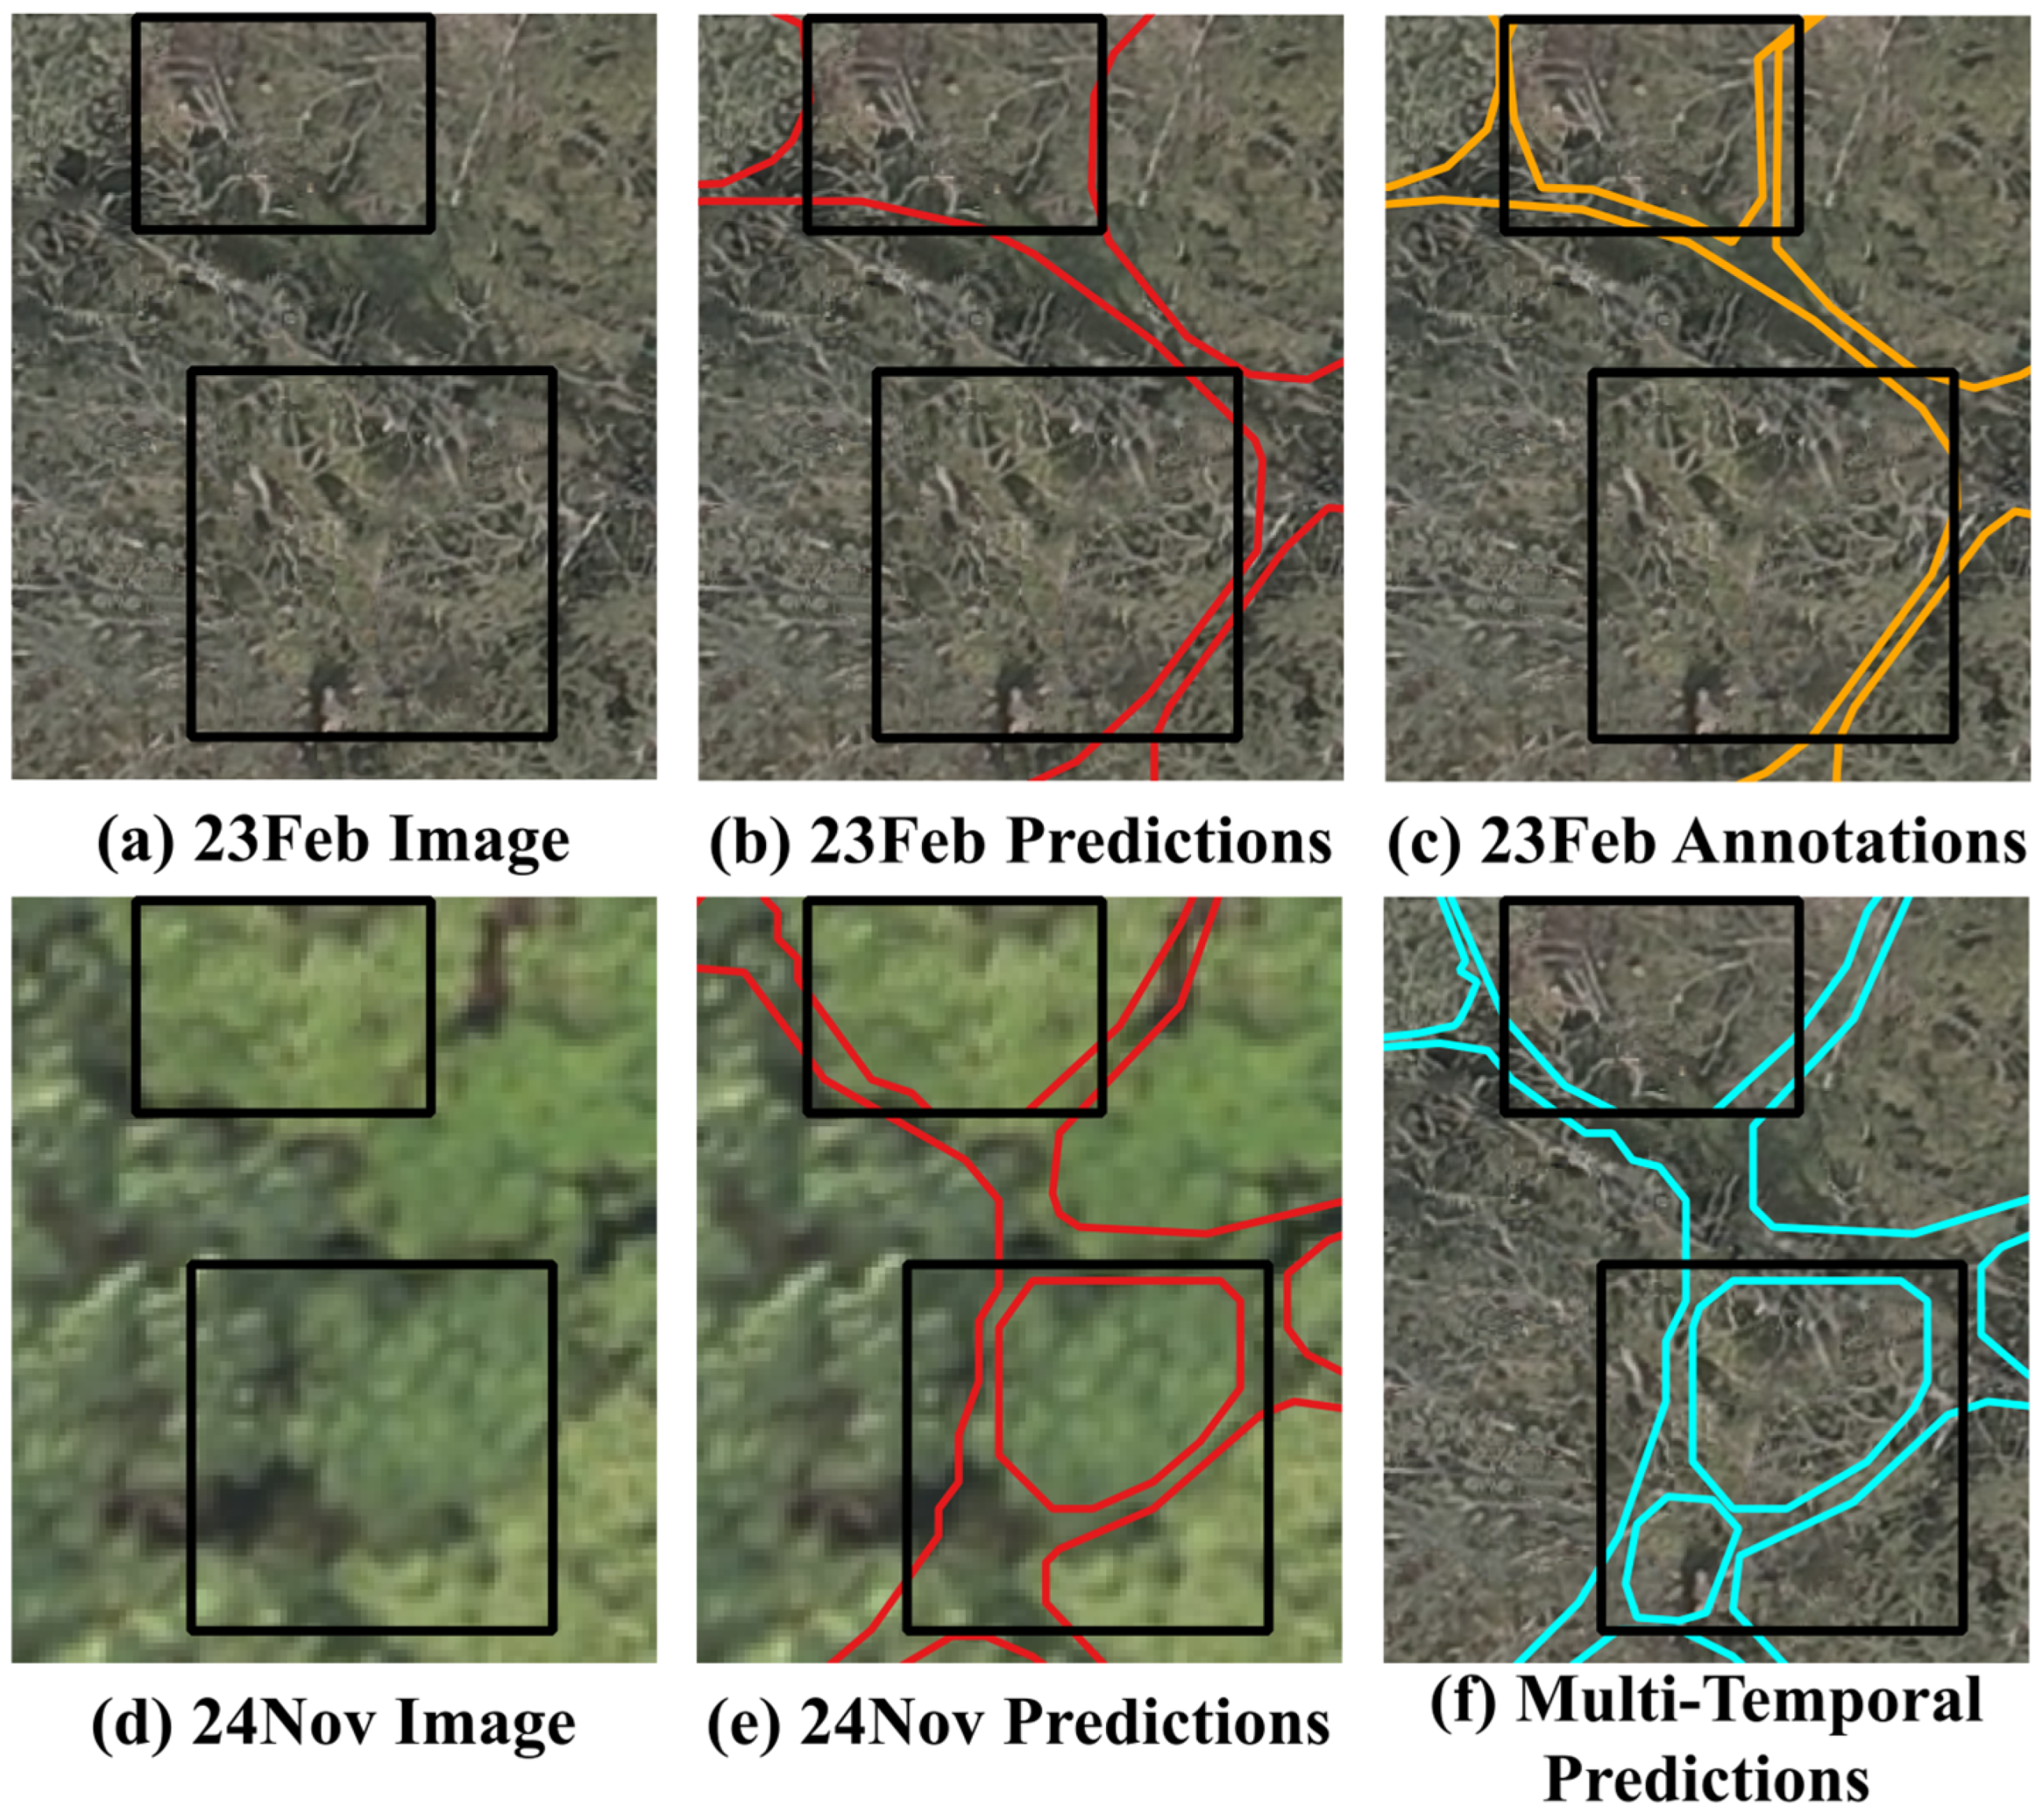
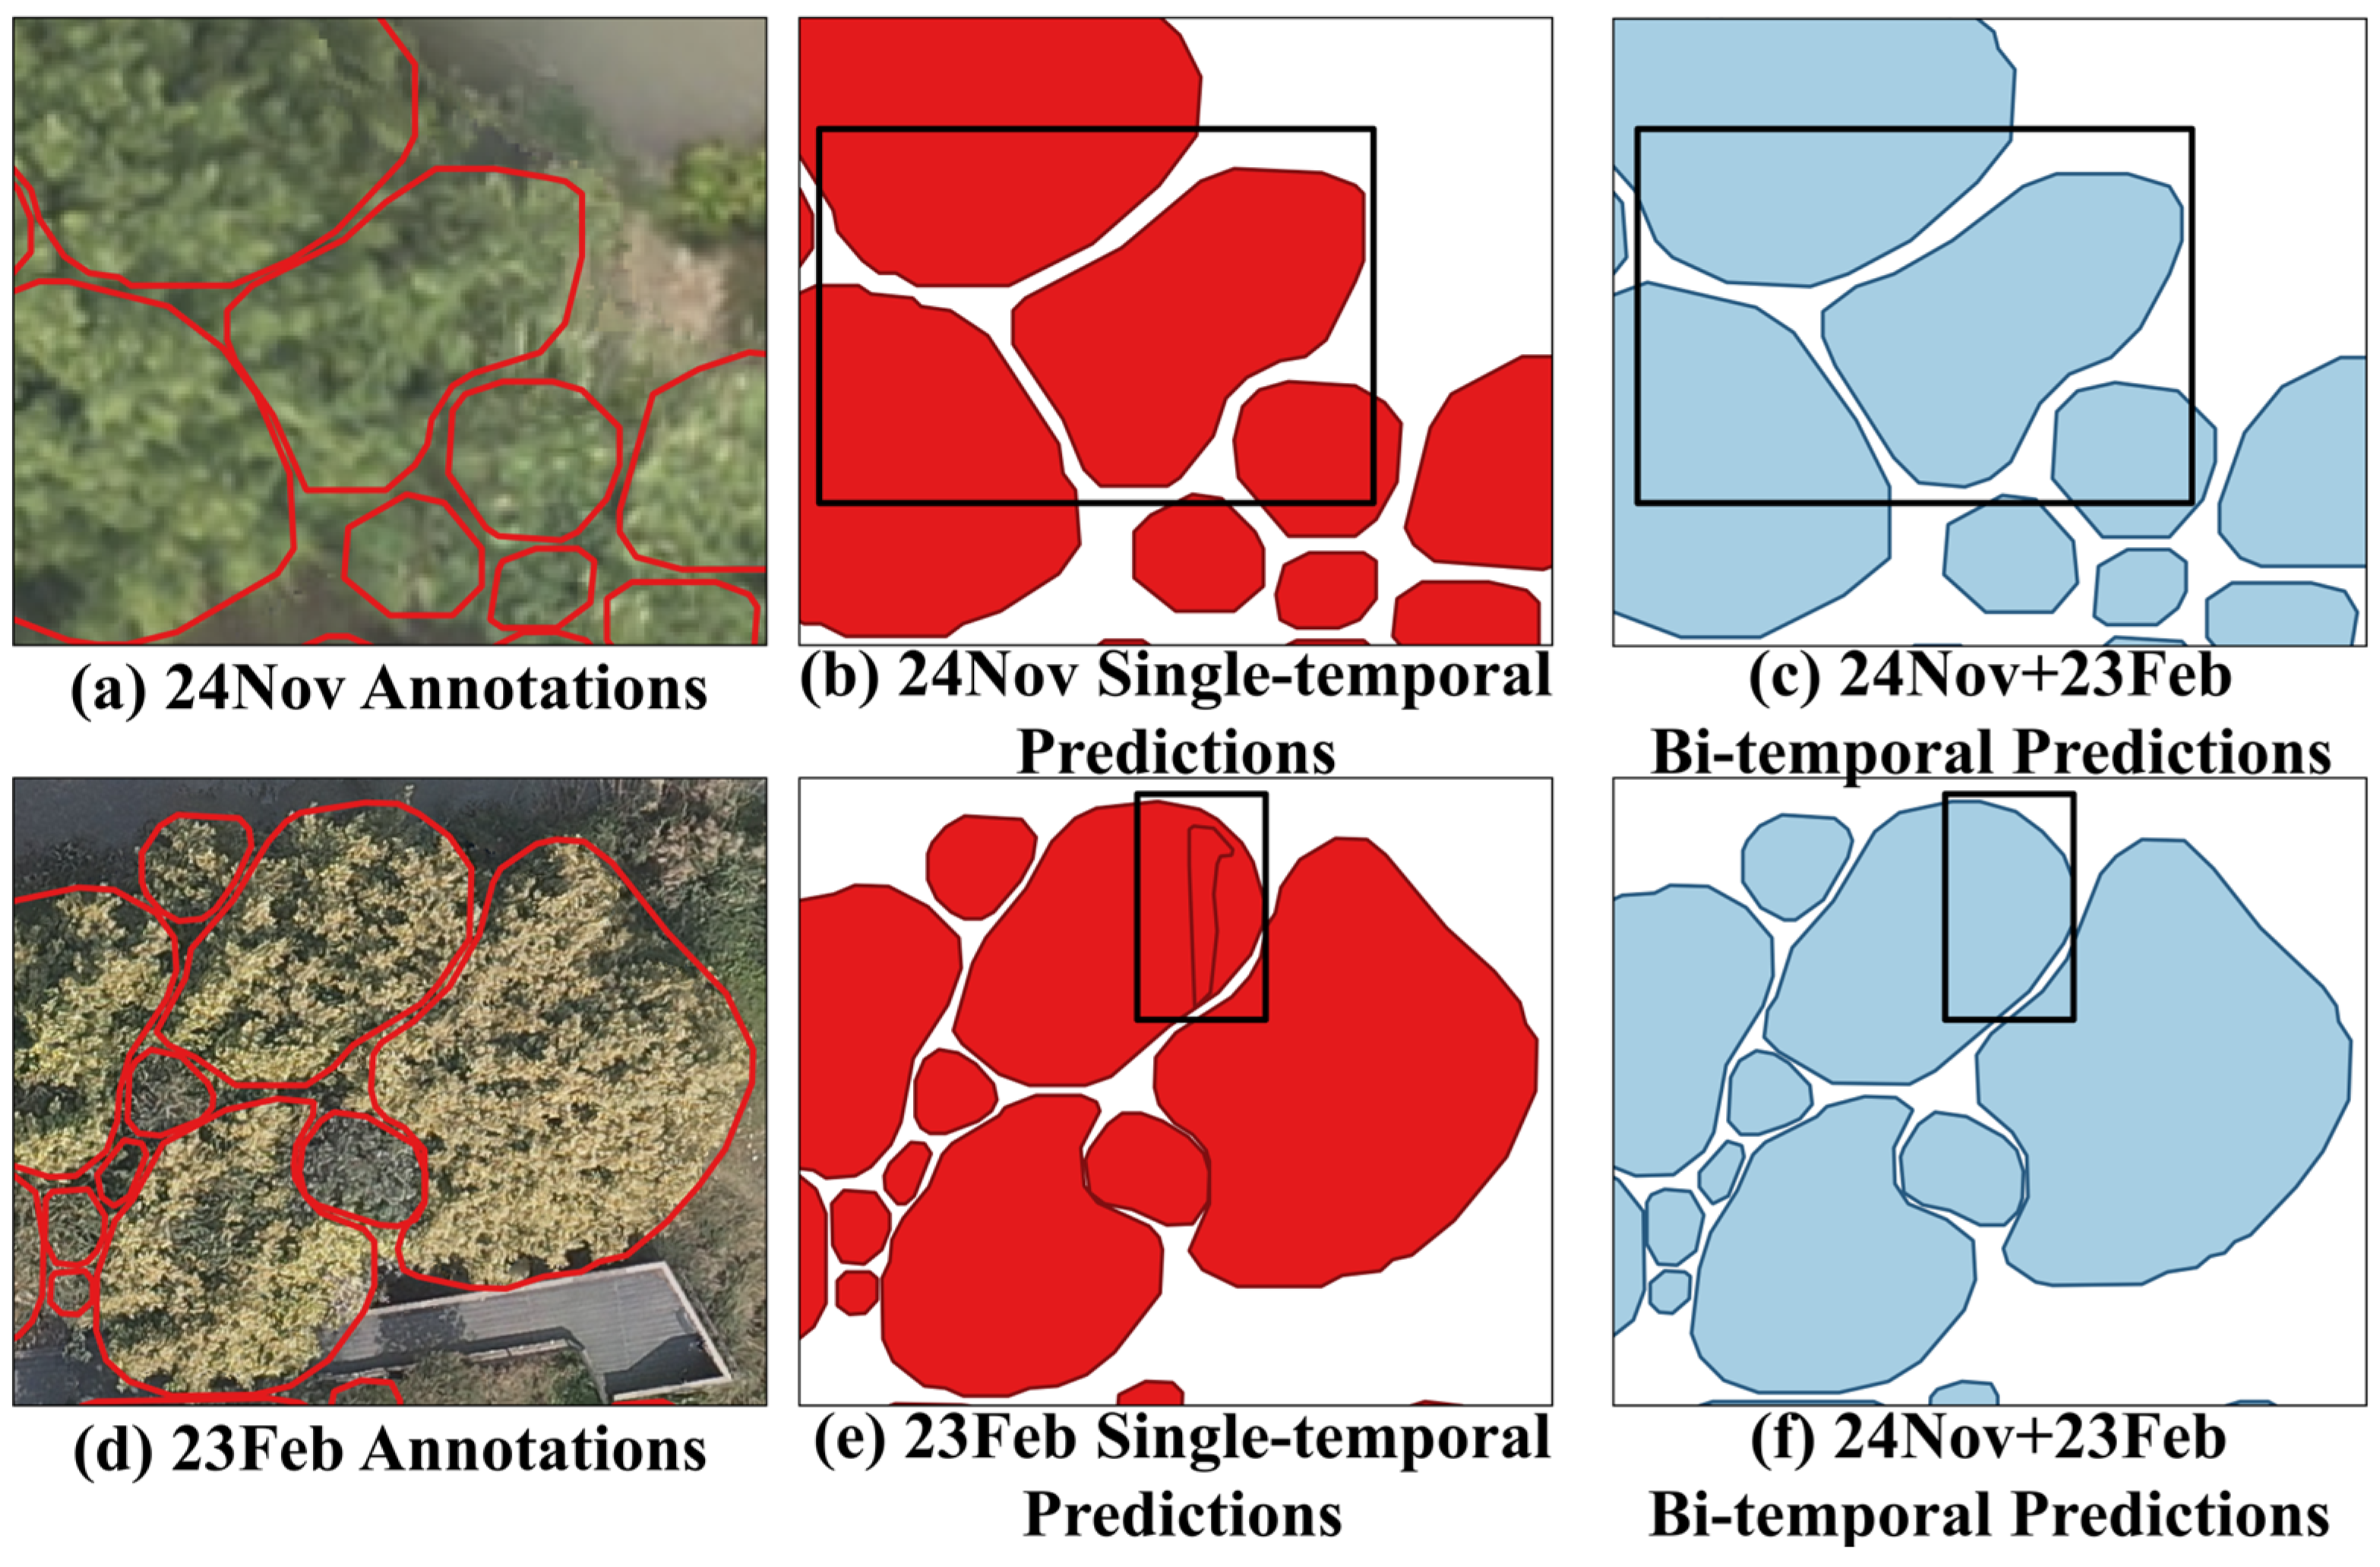
The models’ qualitative visual results further substantiate the preceding quantitative findings within the scope of this study. As observed in Figure 11, under our experimental setup, the bi-temporal (24Nov + 23Feb) training strategy shows a tendency to yield substantial gains over single-temporal models in both completeness of crown delineation and boundary fidelity. As highlighted by the red dashed boxes, in the 24Nov imagery (Figure 11b vs. Figure 11c), our observation suggests that bi-temporal training yields smoother, texture-conforming crown polygons. For the 23Feb imagery (Figure 11e vs. Figure 11f), this strategy appears to alleviate common issues such as over-detection and omission that are prevalent in our single-temporal baselines. Integrating our quantitative and qualitative evidence, the 24Nov + 23Feb pairing delivers the most favorable trade-off between accuracy and generalizability among the tested combinations and is thus adopted for downstream analysis.

3.2.4. Multi-Temporal Information Synergy and Complementary Effects

Data from different epochs provide inherent complementarity in tree crown segmentation. For 24Nov, dense, vividly green canopies cause mutual occlusions, yielding indistinct outlines and obscured textures. In 23Feb, the scene is sparser and crown edges are sharply delineated. Conversely, low contrast and shadowing degrade 23Feb imagery, whereas rich textures in 24Nov mitigate these issues. By fusing complementary epochs, predictions align better with actual crown outlines, thereby lowering misses and mistakes.
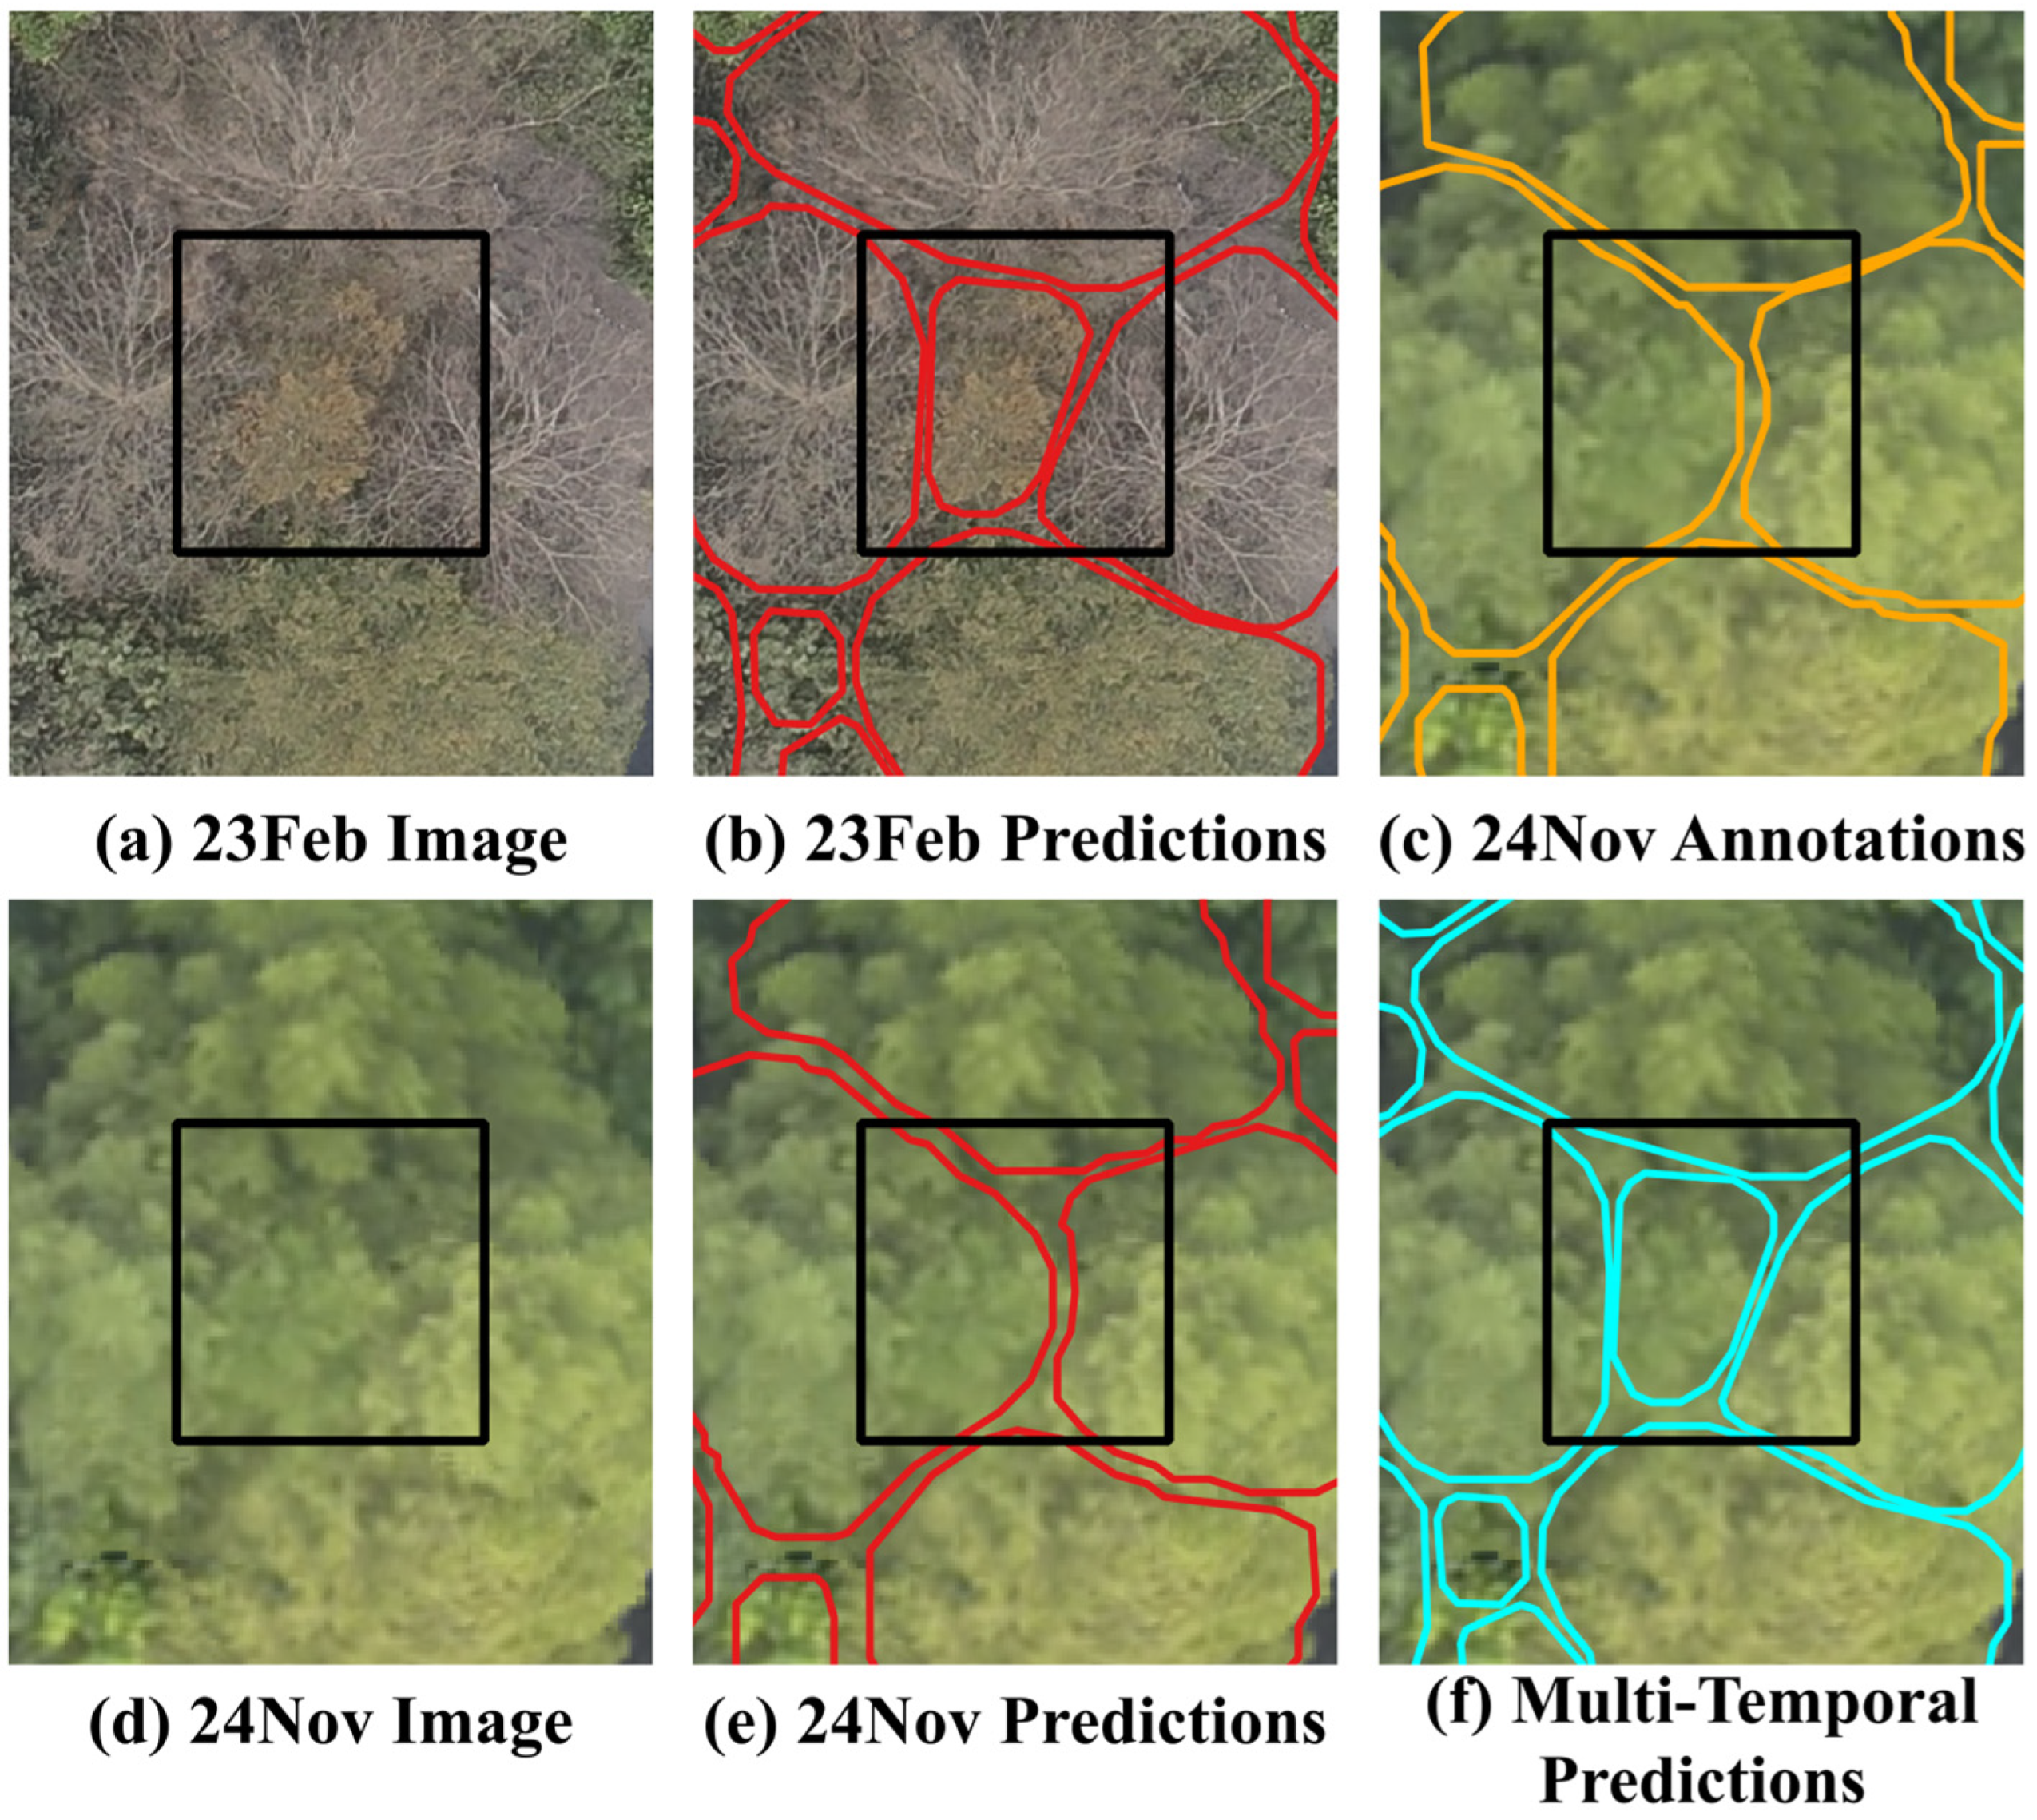
As illustrated in Figure 12, during 24Nov, the Terminalia mantaly shows dense, bright crowns, hindering direct delineation of single-tree boundaries. By 23Feb, foliage turnover renders single-tree-crown boundaries much clearer. Similarly, as of 23Feb, the Albizzia falcata displays dim leaves and partial leaf-drop, with only crisscrossed branches visible, impeding texture-driven separation of single trees. Come 24Nov, despite continued canopy contiguity, increased chroma and texture contrast clarify single-tree crown edges.
In addition, multi-temporal outputs (in Figure 12f and Figure 13f) that merge two complementary phases better match actual crown edges, substantially lowering false negatives and false positives. In some cases, these multi-temporal predictions also diverge from the original manual annotations, highlighting areas where the initial labeling may have been ambiguous.

3.2.5. Quantitative Evaluation of Boundary Delineation Accuracy

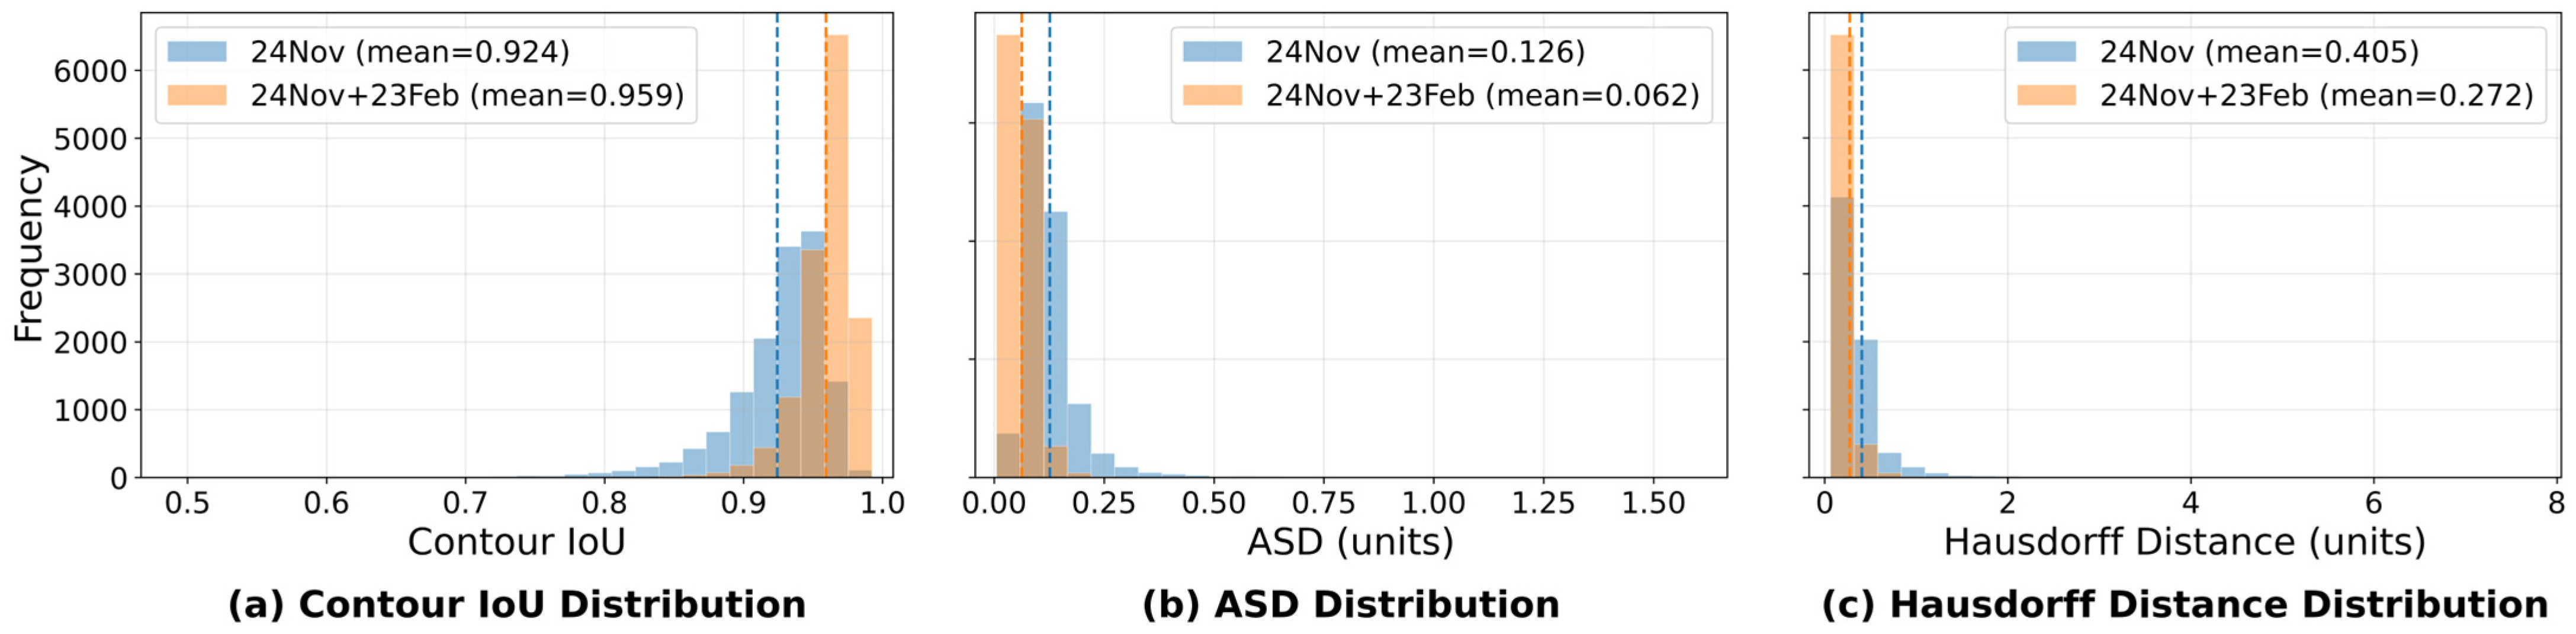
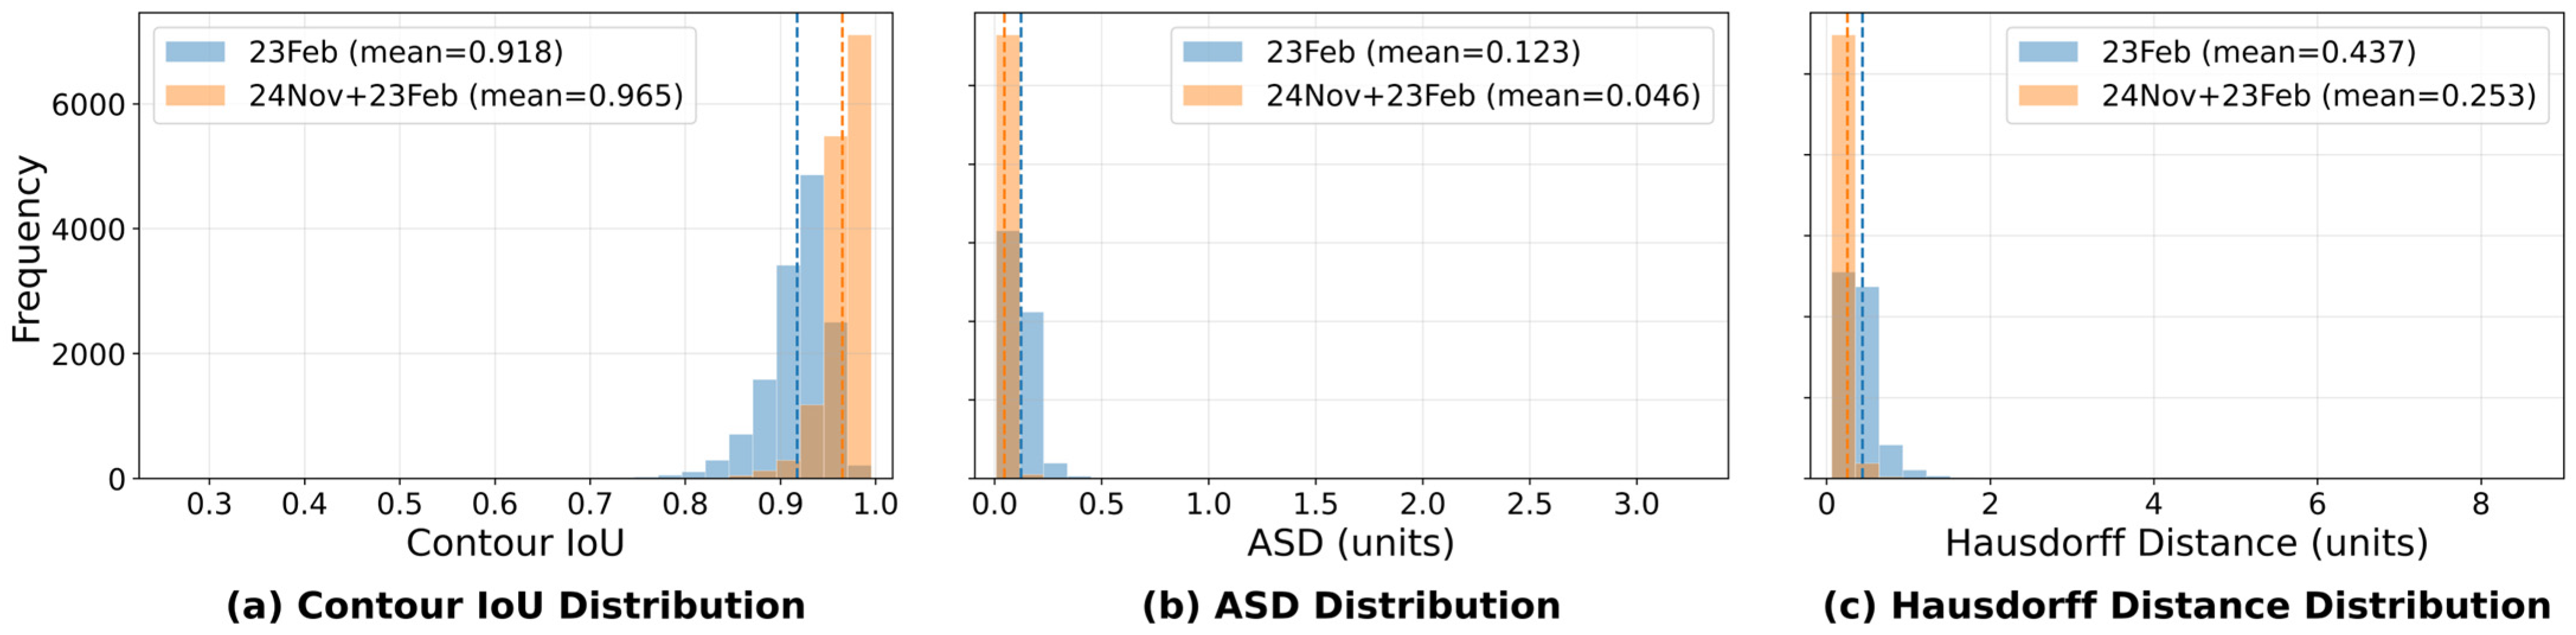
Boundary-sensitive metrics were computed to quantitatively assess delineation improvements, comparing the single-temporal baseline against the bi-temporal model (24Nov + 23Feb) on each respective test set. Metrics included Contour IoU, Average Surface Distance (ASD) and Hausdorff Distance (HD).
For the 24Nov test set, the bi-temporal model outperformed the single-temporal (24Nov) model, with Contour IoU improving from 0.9242 to 0.9591, ASD decreasing from 0.1263 to 0.0622, and HD dropping from 0.4050 to 0.2717, as shown in Figure 14.
For the 23Feb test set, the bi-temporal model similarly outperformed the single-temporal (23Feb) model, with Contour IoU improving from 0.9176 to 0.9650, ASD decreasing from 0.1225 to 0.0458, and HD dropping from 0.4370 to 0.2532, as shown in Figure 15.
As observed from the histogram distributions, the bi-temporal results shifted toward higher Contour IoU and lower distance errors, with the tail of large errors significantly reduced. This indicates that boundary quality was not only better on average but also more stable across instances.

4. Discussion

This study explores three primary considerations for crown instance segmentation in subtropical cities: (1) the applicability of a species- and phenology-agnostic generic dataset; (2) the capability of deep models to represent crown geometry; and (3) the consistency of detections for the same crown across phenophases. On the dataset side, one of the primary strategies adopted is a geometry-first, fully annotated scheme to improve generality and completeness despite species mixing and indistinct boundaries. Methodologically, we examine the exploiting of cross-epoch complementarity to reduce phenology-specific overfitting and potentially improve generalization across time. In addition, since the effectiveness of imagery varies with phenological shifts, fusion outcomes appear to depend on intrinsic data properties and appropriate fusion design.

4.1. Applicability of an Exhaustively Annotated Tree Crown Dataset

Existing open datasets rarely provide complete crown annotations per site; many target certain species or a single time, which limits their ability to support multi-temporal segmentation tasks. Additionally, pronounced interactions between sample size and crown geometry—driven by species-specific shapes—cause imbalanced sample distributions across object scales, impacting training efficacy. In the context of dataset design, a geometry-centric approach prioritizing complete crown boundary extraction may be more conducive than species-focused labeling to achieving balanced sampling and broader applicability. Recently, general-purpose models like SAM [28] have been found to have the potential to cut labeling costs, yet they struggle in scenes with ambiguous crown edges and intricate canopy structure. Teng et al. [29] probed SAM for this task and found that, even with carefully crafted prompts, its performance lagged behind a task-optimized Mask R-CNN.
In response, we developed an exhaustively annotated, multi-period crown instance segmentation dataset for the study area. Within this scope, two principal strengths are: (1) extensive species coverage (approximately 110 species, e.g., Terminalia mantaly and Ficus altissima), reflecting diverse stand structures, and (2) three temporally separated UAV acquisitions over the same footprint, depicting phenophase dynamics and dampening lighting and shadow effects. In addition to exhaustive crown labels, 47,754 individual instances provide a substantial foundation for robustness evaluation and overfitting reduction. Accordingly, we benchmarked single-epoch models and investigated the role of multi-temporal fusion in potentially reducing phenological sensitivity and improving out-of-phase generalization.

4.2. Characteristics of the Deep Learning Architectures

For single-temporal experiments, ConvNeXt-V2 demonstrated the most favorable results among the evaluated models within the specific scope of this study (Segm_mAP = 0.852 on the 24Nov dataset). This result suggests that combining Transformer-style global receptive modeling with CNN-based local feature extraction, further enhanced by modern normalization, appeared well-suited for intricate, highly variable imagery such as complex tree crowns, at least within the current experimental setting. In comparison, Mask R-CNN (0.744) and Cascade Mask R-CNN (0.763), which depend on localized detectors and cascaded refinement, demonstrated lower scores in these particular tests. The Transformer-based approaches QueryInst (0.629) and Mask2Former (0.595) also appeared less effective on the subtropical urban scenes evaluated in this work; QueryInst tended to mis-detect around ambiguous edges, and Mask2Former lacked sensitivity to small crowns (shown in Table 1, Segm_mAP_s). These observations suggest that, for tasks demanding fine local structural cues, convolutional-based architectures may offer practical advantages in similar experimental contexts.
However, it is important to note that this model comparison was conducted as a preliminary screening for model selection rather than a strictly controlled benchmark of architectural superiority. ConvNeXt-V2 was evaluated with its advanced backbone combined with a Mask R-CNN head, whereas the other models used their default ResNet-50 backbones. Therefore, the observed performance differences reflected a combination of backbone choice, framework design, and implementation settings, rather than an absolute ranking of the underlying architectures.
Nevertheless, evaluating ConvNeXt-V2 on unseen temporal phases caused a pronounced decline in accuracy (Segm_mAP 0.361–0.419), revealing limited robustness across phenology within the current dataset. Single-temporal training often overfits features peculiar to that phenophase, making it difficult to maintain consistent performance on different temporal phases. This lack of cross-phase transferability, frequently observed in crown segmentation and similar vision problems [30], indicates high phenology sensitivity and suggests limitations for multi-temporal and cross-regional settings under single-condition training. This implies that the learning focus may need to shift from single-condition dependency to discovering more robust, portable canopy representations from multi-phase information.

4.3. Considerations for Multi-Temporal Data Approach

Findings from joint training with multi-temporal data in this study show that training on two phases simultaneously enhances both accuracy and generalizability across phases. Phenologically distinct epochs provide marked feature-level complementarity: at 23Feb (early growth), crown outlines are sharp and geometric traits salient, aiding morphological learning; at 24Nov (peak growth), textures are richer and spectral contrast higher, benefiting the learning of local textures. Parallel to these phenological traits, image acquisition quality—specifically illumination and shadow conditions—plays a crucial role in data usability. Combining the two phases substantially mitigates the phenology dependence of single-temporal models and improves their adaptability in complex urban scenes within the study area. The evidence from our experiments indicates that choosing a pair of phases with complementary characteristics is more effective than adding more epochs indiscriminately for constructing a representative feature manifold.
Based on these observations, the proposed framework combining joint training with NMS-based fusion emphasizes “phenological complementarity” rather than fixed temporal combinations. The core idea is to construct a more comprehensive and robust feature representation space by strategically selecting two phases that exhibit distinct yet complementary characteristics. This strategy may be transferable to other ecosystems: in temperate deciduous forests, combining images from leaf-full and leaf-off stages could be effective; in arid woodlands, pairing wet and dry season imagery could leverage complementary spatial texture and structural traits. For instance, Zhu et al. [31] demonstrated that fusing WorldView-1 and WorldView-2 imagery from the leaf-off season, exploiting their complementary spatial details, effectively recovered vegetation information in shadowed pixels and significantly mitigated topographic shading effects in mountainous areas. This enhancement improved data usability and clarity, enabling deep learning models to achieve accurate identification of evergreen coniferous trees using the enriched spatial features.
Importantly, in the absence of trustworthy individual crown labels or under substantial radiometric shifts caused by illumination, incorporating additional epochs can inject noise and reduce accuracy. For instance, when 23Mar (strongly impacted by harsh illumination and deep shadows) was added, Segm_mAP dropped to 0.748, compared with 0.874 for the two-phase setup. This diminishing return phenomenon is consistent with existing studies: Grybas and Congalton [32] reported that while using five time points achieved the highest overall accuracy, improvements became limited beyond three time points; similarly, Liang et al. [10] found in a six-phase temperate forest experiment that gains from additional phases diminished rapidly after two phases, except under very-high-frequency observations. It should be noted that in our study, phenological variations and image acquisition quality (e.g., sun angle and shadowing) occurred simultaneously across different seasons. While our findings underscore the benefits of combining complementary phases, the individual contributions of biological phenology versus radiometric quality remain partially intertwined. Within the current experimental design, it is difficult to fully disentangle these two factors, and the observed performance gains likely reflect their synergistic effect. Because canopy structure varies gently and discriminative features cluster within limited phenology windows in subtropical evergreen systems, strategically choosing complementary phases may strike a superior trade-off between accuracy, cost, and efficiency. Collectively, these findings suggest that leveraging the complementary nature of multi-temporal imagery may be a promising pathway for improving crown instance segmentation under heterogeneous environments.
Practically, for large areas with dependable crown data, opting for two complementary periods outperforms merely increasing the number of temporal inputs in both efficacy and efficiency. The implications of our findings may extend beyond UAV data to cross-sensor spatiotemporal fusion contexts. Ongoing advances in very-high-resolution satellite data are expanding its applicability to broad-scale analyses of forest structure. Looking ahead, integrating UAV with satellite observations can support transferring methods from local sites to citywide urban forest extents. Our results offer a useful reference for conducting large-area crown instance segmentation with high-resolution images.

4.4. Limitations and Future Work

While this study provides significant insights into tree crown segmentation within subtropical urban forests, several limitations remain that warrant further exploration.
First, regarding spatial generalizability, this study primarily focused on a single subtropical urban wetland site, Haizhu Lake. Although our exhaustive annotation strategy enhanced local representativeness and model robustness within this specific environment, the model’s transferability to different bioclimatic zones or more complex lighting conditions remains to be verified. Furthermore, due to the intensive manual labor required for exhaustive annotation, all 47,754 labeled instances within the study area were utilized for model training and validation, and no fully independent, spatially distant test set was reserved. Consequently, the reported metrics primarily reflected model performance within the specific environmental context of Haizhu Lake, and further validation on geographically external datasets is required to fully assess out-of-distribution generalizability. Future research will involve incorporating diverse secondary study areas to systematically evaluate the boundary of the model’s generalization capabilities across different geographic scales.
Second, concerning the rigor of the experimental design, certain variables could be more strictly controlled. In our horizontal comparison, we did not unify the backbone capacity across all models; for instance, ConvNeXt-V2 utilized a more advanced architecture, while other models were evaluated using the default ResNet-50. Furthermore, due to the substantial computational overhead, the current quantitative results were derived from single training runs. Future work should provide a more robust statistical assessment by reporting the means and standard deviations across multiple iterations to account for training stochasticity.
Regarding the core multi-temporal fusion strategy, our findings suggest that the synergy between data quality and architectural design is paramount. The performance fluctuations observed after incorporating 23Mar imagery underscore that temporal complementarity is far more critical than simply increasing the volume of data. It is also worth noting that the “Naive Stacking” approach used in this study was inherently constrained by the lack of pre-trained weights for six-channel inputs. Leveraging large-scale pre-trained multi-channel backbones in the future could potentially unlock the full potential of early fusion strategies, allowing for deeper feature representation.
Finally, to transition from algorithmic evaluation to practical large-scale applications, the system’s flexibility and scalability must be enhanced. The current thresholds for Tcrown and TIoU were empirically tuned based on the 24Nov validation set; future research should focus on developing adaptive threshold mechanisms to accommodate more varied forest stand structures. Additionally, bridging the gap between platforms by integrating UAV-derived high-precision labels with high-resolution satellite imagery (e.g., Planet or WorldView) represents a promising path toward achieving high-frequency, city-scale forest resource monitoring.

5. Conclusions

Publicly available crown datasets often suffer from non-exhaustive labeling, species bias, and single-temporal limitations, which undermine robust segmentation across phenological states. Accordingly, an exhaustively annotated, multi-period, crown instance segmentation dataset was curated adhering to a crown geometry criterion, spanning the Haizhu Lake footprint with about 110 species and three temporal phases, totaling 47,754 meticulous annotations. This dataset served as a detailed case study providing cross-temporal crown labels across the study area. On this basis, we conducted single-temporal comparisons across leading architectures; within the scope of this study, ConvNeXt-V2 demonstrated the most favorable results on 24Nov (Segm_mAP = 0.852), and was therefore selected as the reference backbone for the subsequent multi-temporal evaluation. Our findings highlight that single-temporal models suffer from significant phenological overfitting; with cross-phase performance plunging to 0.361. This challenge can be effectively addressed through a multi-temporal joint training strategy. Specifically, the bi-temporal (24Nov + 23Feb) training approach, combined with NMS fusion, achieved a favorable balance between accuracy (0.874) and generalization (0.665). The results suggest that the synergy between distinct phenological phases is more critical than simply adding more data. The evidence from this study suggests that this training strategy showed clear advantages over indiscriminate data stacking in both efficacy and efficiency within our experimental setting. While currently limited to a single-site study, this proposed framework offers a feasible, preliminary methodological path that may serve as a reference for high-frequency, city-scale forest resource monitoring using UAV and high-resolution satellite imagery.

Author Contributions

Conceptualization, W.L. and H.J.; methodology, W.L. and H.J.; validation, W.L.; formal analysis, W.L.; investigation, W.L.; resources, W.L.; data curation, W.L.; writing—original draft preparation, W.L.; writing—review and editing, W.L. and H.J.; visualization, M.K.; supervision, H.J. and B.W.; project administration, H.J. and J.Z.; funding acquisition, H.J. All authors have read and agreed to the published version of the manuscript.

Funding

This research was funded by Guangzhou Science and Technology Plan Project (grant no. 2023B03J1373), GDAS’s Project of Science and Technology Development 2023GDASZH-2023010101 and National Natural Science Foundation of China (U21A6001).

Data Availability Statement

The data and materials supporting the findings of this study are available from the corresponding author upon reasonable request.

Conflicts of Interest

The authors declare no conflicts of interest.

References

  1. Blickensdörfer, L.; Oehmichen, K.; Pflugmacher, D.; Kleinschmit, B.; Hostert, P. National Tree Species Mapping Using Sentinel-1/2 Time Series and German National Forest Inventory Data. Remote Sens. Environ. 2024, 304, 114069. [Google Scholar] [CrossRef]
  2. Crowther, T.W.; Maynard, D.S.; Leff, J.W.; Oldfield, E.E.; McCulley, R.L.; Fierer, N.; Bradford, M.A. Predicting the Responsiveness of Soil Biodiversity to Deforestation: A Cross-Biome Study. Glob. Change Biol. 2014, 20, 2983–2994. [Google Scholar] [CrossRef]
  3. Duinker, P.N.; Ordóñez, C.; Steenberg, J.W.N.; Miller, K.H.; Toni, S.A.; Nitoslawski, S.A. Trees in Canadian Cities: Indispensable Life Form for Urban Sustainability. Sustainability 2015, 7, 7379–7396. [Google Scholar] [CrossRef]
  4. Wang, Y.; Zhu, Y.; Cook-Patton, S.C.; Sun, W.; Zhang, W.; Ciais, P.; Li, T.; Smith, P.; Yuan, W.; Zhu, X.; et al. Land Availability and Policy Commitments Limit Global Climate Mitigation from Forestation. Science 2025, 389, 931–934. [Google Scholar] [CrossRef] [PubMed]
  5. Crowther, T.W.; Glick, H.B.; Covey, K.R.; Bettigole, C.; Maynard, D.S.; Thomas, S.M.; Smith, J.R.; Hintler, G.; Duguid, M.C.; Amatulli, G.; et al. Mapping Tree Density at a Global Scale. Nature 2015, 525, 201–205. [Google Scholar] [CrossRef]
  6. Cheng, K.; Yang, H.; Chen, Y.; Yang, Z.; Ren, Y.; Zhang, Y.; Lin, D.; Liu, W.; Huang, G.; Xu, J.; et al. How Many Trees Are There in China? Sci. Bull. 2025, 70, 1076–1079. [Google Scholar] [CrossRef]
  7. Straker, A.; Puliti, S.; Breidenbach, J.; Kleinn, C.; Pearse, G.; Astrup, R.; Magdon, P. Instance Segmentation of Individual Tree Crowns with YOLOv5: A Comparison of Approaches Using the ForInstance Benchmark LiDAR Dataset. ISPRS Open J. Photogramm. Remote Sens. 2023, 9, 100045. [Google Scholar] [CrossRef]
  8. Xiang, B.; Wielgosz, M.; Kontogianni, T.; Peters, T.; Puliti, S.; Astrup, R.; Schindler, K. Automated Forest Inventory: Analysis of High-Density Airborne LiDAR Point Clouds with 3D Deep Learning. Remote Sens. Environ. 2024, 305, 114078. [Google Scholar] [CrossRef]
  9. Sun, Y.; Li, Z.; He, H.; Guo, L.; Zhang, X.; Xin, Q. Counting Trees in a Subtropical Mega City Using the Instance Segmentation Method. Int. J. Appl. Earth Obs. Geoinf. 2022, 106, 102662. [Google Scholar] [CrossRef]
  10. Liang, X.; Chen, J.; Gong, W.; Puttonen, E.; Wang, Y. Influence of Data and Methods on High-Resolution Imagery-Based Tree Species Recognition Considering Phenology: The Case of Temperate Forests. Remote Sens. Environ. 2025, 323, 114654. [Google Scholar] [CrossRef]
  11. Sylvain, J.-D.; Drolet, G.; Thiffault, É.; Anctil, F. High-Resolution Mapping of Tree Species and Associated Uncertainty by Combining Aerial Remote Sensing Data and Convolutional Neural Networks Ensemble. Int. J. Appl. Earth Obs. Geoinf. 2024, 131, 103960. [Google Scholar] [CrossRef]
  12. Tucker, C.; Brandt, M.; Hiernaux, P.; Kariryaa, A.; Rasmussen, K.; Small, J.; Igel, C.; Reiner, F.; Melocik, K.; Meyer, J.; et al. Sub-Continental-Scale Carbon Stocks of Individual Trees in African Drylands. Nature 2023, 615, 80–86. [Google Scholar] [CrossRef]
  13. Xie, Y.; Wang, Y.; Sun, Z.; Liang, R.; Ding, Z.; Wang, B.; Huang, S.; Sun, Y. Instance Segmentation and Stand-Scale Forest Mapping Based on UAV Images Derived RGB and CHM. Comput. Electron. Agric. 2024, 220, 108878. [Google Scholar] [CrossRef]
  14. Cheng, B.; Misra, I.; Schwing, A.G.; Kirillov, A.; Girdhar, R. Masked-Attention Mask Transformer for Universal Image Segmentation. arXiv 2022, arXiv:2112.01527. [Google Scholar] [CrossRef]
  15. Woo, S.; Debnath, S.; Hu, R.; Chen, X.; Liu, Z.; Kweon, I.S.; Xie, S. ConvNeXt V2: Co-Designing and Scaling ConvNets with Masked Autoencoders. arXiv 2023, arXiv:2301.00808. [Google Scholar]
  16. Zhang, J.; Lei, F.; Fan, X. Parameter-Efficient Fine-Tuning for Individual Tree Crown Detection and Species Classification Using UAV-Acquired Imagery. Remote Sens. 2025, 17, 1272. [Google Scholar] [CrossRef]
  17. Cloutier, M.; Germain, M.; Laliberté, E. Influence of Temperate Forest Autumn Leaf Phenology on Segmentation of Tree Species from UAV Imagery Using Deep Learning. Remote Sens. Environ. 2024, 311, 114283. [Google Scholar] [CrossRef]
  18. Troles, J.; Schmid, U.; Fan, W.; Tian, J. BAMFORESTS: Bamberg Benchmark Forest Dataset of Individual Tree Crowns in Very-High-Resolution UAV Images. Remote Sens. 2024, 16, 1935. [Google Scholar] [CrossRef]
  19. Ball, J.G.C.; Hickman, S.H.M.; Jackson, T.D.; Koay, X.J.; Hirst, J.; Jay, W.; Archer, M.; Aubry-Kientz, M.; Vincent, G.; Coomes, D.A. Accurate Delineation of Individual Tree Crowns in Tropical Forests from Aerial RGB Imagery Using Mask R-CNN. Remote Sens. Ecol. Conserv. 2023, 9, 641–655. [Google Scholar] [CrossRef]
  20. Jansen, A.J.; Nicholson, J.D.; Esparon, A.; Whiteside, T.; Welch, M.; Tunstill, M.; Paramjyothi, H.; Gadhiraju, V.; van Bodegraven, S.; Bartolo, R.E. Deep Learning with Northern Australian Savanna Tree Species: A Novel Dataset. Data 2023, 8, 44. [Google Scholar] [CrossRef]
  21. Vasquez, V.; Cushman, K.; Ramos, P.; Williamson, C.; Villareal, P.; Gomez Correa, L.F.; Muller-Landau, H. Barro Colorado Island 50-Ha Plot Crown Maps: Manually Segmented and Instance Segmented; Smithsonian Tropical Research Institute: Panama City, Panama, 2023.
  22. Hickman, S.; Jackson, T. Datasets of SH’s AI4ER MRes Project; Zenodo: Geneva, Switzerland, 2021. [Google Scholar]
  23. van Geffen, F.; Heim, B.; Brieger, F.; Geng, R.; Shevtsova, I.A.; Schulte, L.; Stuenzi, S.M.; Bernhardt, N.; Troeva, E.I.; Pestryakova, L.A.; et al. SiDroForest: A Comprehensive Forest Inventory of Siberian Boreal Forest Investigations Including Drone-Based Point Clouds, Individually Labeled Trees, Synthetically Generated Tree Crowns, and Sentinel-2 Labeled Image Patches. Earth Syst. Sci. Data 2022, 14, 4967–4994. [Google Scholar] [CrossRef]
  24. Lefebvre, I.; Laliberté, E. UAV LiDAR, UAV Imagery, Tree Segmentations and Ground Mesurements for Estimating Tree Biomass in Canadian (Quebec) Plantations; Federated Research Data Repository: Waterloo, ON, Canada, 2024. [Google Scholar] [CrossRef]
  25. Shcherbacheva, A.; Campos, M.B.; Wang, Y.; Liang, X.; Kukko, A.; Hyyppä, J.; Junttila, S.; Lintunen, A.; Korpela, I.; Puttonen, E. A Study of Annual Tree-Wise LiDAR Intensity Patterns of Boreal Species Observed Using a Hyper-Temporal Laser Scanning Time Series. Remote Sens. Environ. 2024, 305, 114083. [Google Scholar] [CrossRef]
  26. Lin, T.-Y.; Maire, M.; Belongie, S.; Hays, J.; Perona, P.; Ramanan, D.; Dollár, P.; Zitnick, C.L. Microsoft COCO: Common Objects in Context. In Proceedings of the Computer Vision—ECCV 2014; Fleet, D., Pajdla, T., Schiele, B., Tuytelaars, T., Eds.; Springer International Publishing: Cham, Switzerland, 2014; pp. 740–755. [Google Scholar]
  27. Hao, Z.; Lin, L.; Post, C.J.; Mikhailova, E.A.; Li, M.; Chen, Y.; Yu, K.; Liu, J. Automated Tree-Crown and Height Detection in a Young Forest Plantation Using Mask Region-Based Convolutional Neural Network (Mask R-CNN). ISPRS J. Photogramm. Remote Sens. 2021, 178, 112–123. [Google Scholar] [CrossRef]
  28. Kirillov, A.; Mintun, E.; Ravi, N.; Mao, H.; Rolland, C.; Gustafson, L.; Xiao, T.; Whitehead, S.; Berg, A.C.; Lo, W.-Y.; et al. Segment Anything. arXiv 2023, arXiv:2304.02643. [Google Scholar] [PubMed]
  29. Teng, M.; Ouaknine, A.; Laliberté, E.; Bengio, Y.; Rolnick, D.; Larochelle, H. Assessing SAM for Tree Crown Instance Segmentation from Drone Imagery. arXiv 2025, arXiv:2503.20199. [Google Scholar] [CrossRef]
  30. Sun, E.; Cui, Y.; Liu, P.; Yan, J. A Decade of Deep Learning for Remote Sensing Spatiotemporal Fusion: Advances, Challenges, and Opportunities. Inf. Fusion 2025, 126, 103675. [Google Scholar] [CrossRef]
  31. Zhu, X.; Wang, T.; Skidmore, A.K.; Duporge, I. A Deep Learning Framework for Mapping Evergreen Conifer Fractional Cover at 30 m Resolution Using Fused Bi-Temporal WorldView and Time-Series Landsat Imagery in Mixed Mountain Forests. Remote Sens. Environ. 2025, 331, 115055. [Google Scholar] [CrossRef]
  32. Grybas, H.; Congalton, R.G. A Comparison of Multi-Temporal RGB and Multispectral UAS Imagery for Tree Species Classification in Heterogeneous New Hampshire Forests. Remote Sens. 2021, 13, 2631. [Google Scholar] [CrossRef]
Figure 1. Study area of Haizhu Lake in Guangzhou, China.
Remotesensing 18 01082 g001
Figure 2. Multi-temporal orthophoto comparison across three phenological phases (23Feb, 23Mar, and 24Nov) for representative tree species, illustrating variations in crown appearance for identical individual trees.
Remotesensing 18 01082 g002
Figure 3. Overall flowchart of individual tree crown instance segmentation.
Remotesensing 18 01082 g003
Figure 4. Annotated image from the 24Nov dataset. The left panel represents a portion of the orthophoto of tree crowns taken on 8 November 2024. The red mask on the right is the annotation for segmenting tree crowns on the orthophoto.
Remotesensing 18 01082 g004
Figure 5. Quantitative characterization of multi-temporal image patches. The dashed vertical lines indicate the mean positions of the distributions of the corresponding metric at each time phase; the colors correspond to different phases (same color bar as in the legend).
Remotesensing 18 01082 g005
Figure 6. The workflow of ConvNeXt-V2.
Remotesensing 18 01082 g006
Figure 7. An example of tree crown instance segmentation result fusion using the NMS.
Remotesensing 18 01082 g007
Figure 8. Impact of Tcrown on tree crown instance segmentation performance metrics.
Remotesensing 18 01082 g008
Figure 9. Impact of TIoU on tree crown instance segmentation performance metrics.
Remotesensing 18 01082 g009
Figure 10. Comparison of segmentation results at different post-processing stages. The blue line indicates the identified boundary of the mask.
Remotesensing 18 01082 g010
Figure 11. Comparison of bi-temporal datasets. The black boxes highlight the areas of difference.
Remotesensing 18 01082 g011
Figure 12. Examples of corrections made to the 24Nov data using multi-temporal information. Colored lines indicate the respective masks; the black boxes highlight the areas of difference.
Remotesensing 18 01082 g012
Figure 13. Examples of corrections made to the 23Feb data using multi-temporal information. Colored lines indicate the respective masks; the black boxes highlight the areas of difference.
Remotesensing 18 01082 g013
Figure 14. Boundary-sensitive metric comparison for the 24Nov test set. The dashed vertical lines indicate the mean values for different time-phase combinations; the colors correspond to these combinations (same color bar as in the legend).
Remotesensing 18 01082 g014
Figure 15. Boundary-sensitive metric comparison for the 23Feb test set. The dashed vertical lines indicate the mean values for different time-phase combinations; the colors correspond to these combinations (same color bar as in the legend).
Remotesensing 18 01082 g015
Table 1. Tree crown instance segmentation public datasets.
DatasetsExhaustive Annotation 1Multi-Temporaln of Labels
BAMFORESTS [18]Unclear 2NO27,160
Quebec Trees [17]NOYES23,000
Detectree2 [19]NONO3797
Jansen et al. [20]NONO2547
BCI50ha [21]NONO2454
Hickman et al. [22]NONO901
SiDroForest [23]NONO872
Quebec Plantations [24]NONO-
1 Exhaustive Annotation: Indicates that all visible tree instances in the imagery are labeled, regardless of species. 2 Unclear: Indicates that the dataset is distributed in discrete tiles or samples, making it impossible to verify the continuity and comprehensiveness of annotations across the full canopy.
Table 2. Performance comparison of different models on the 24 Nov dataset.
ModelsBbox
mAP
Segm
mAP
Segm
mAP50
Segm
mAP75
Segm
mAP_s
Segm
mAP_m
Mask R-CNN
[28]
0.7000.7440.9190.8650.6320.844
Cascade Mask R-CNN
[29]
0.7510.7630.9190.8750.6370.870
QueryInst
[30]
0.5790.6290.8860.7310.5270.736
Mask2Former
[14]
0.5500.5950.8430.6820.4650.712
ConvNeXt-V2
[15]
0.8180.8520.9490.9300.7490.943
Note: This comparison is intended for model selection within the specific task and site context; it does not represent an absolute benchmark of the underlying architectures due to differences in backbone capacity. Bold indicates the highest precision value.
Table 3. Performance comparison of Naive Stacking and NMS fusion strategies.
MethodFusion StrategyInput ChannelsPre-Trained WeightsBbox_mAPSegm_mAP
NMSLate FusionThree-channelImageNet0.8450.874
Naive StackingEarly FusionSix-channelNone (Random Init)0.6340.661
Table 4. Performance of different training data on various test sets.
Training ConfigurationTraining DataBbox_mAP
(Self 1)
Segm_mAP
(Self)
Bbox_mAP
(Common 2)
Segm_mAP
(Common)
Single-temporal23Feb0.7980.8230.3830.398
23Mar0.7730.7910.4040.419
24Nov0.8180.8520.3460.361
Bi-temporal24Nov + 23Feb0.8450.8740.6370.665
24Nov + 23Mar0.810.8340.570.588
23Feb + 23Mar0.7390.7690.6190.651
Tri-temporal24Nov + 23Feb + 23Mar0.7170.748--
1 “self”: Evaluation on the validation set matching the training phase(s). 2 “common”: Evaluation on the unified validation set comprising all three temporal phases (24Nov, 23Feb, 23Mar). Bold indicates the highest precision value.
Table 5. Sensitivity analysis of 23Mar imagery weight.
Training DataWeight Ratio (24Nov:23Feb:23Mar)Bbox_mAPSegm_mAP
24Nov + 23Feb + 23Mar1:1:1.00.7170.748
1:1:0.70.7460.778
1:1:0.50.7560.786
1:1:0.30.7580.791
Note: Bold indicates the highest precision value.
Disclaimer/Publisher’s Note: The statements, opinions and data contained in all publications are solely those of the individual author(s) and contributor(s) and not of MDPI and/or the editor(s). MDPI and/or the editor(s) disclaim responsibility for any injury to people or property resulting from any ideas, methods, instructions or products referred to in the content.