Article

YOLO11-MSCAM UAV Remote Sensing-Based Detection of Illegal Rare-Earth Mining with Multi-Scale Convolution and Attention Module

1
School of Civil and Surveying and Mapping Engineering, Jiangxi University of Science and Technology, Ganzhou 341000, China
2
Geographic Information Engineering Group, Jiangxi Geological Bureau, Nanchang 330000, China
*
Author to whom correspondence should be addressed.
Remote Sens. 2026, 18(5), 738; https://doi.org/10.3390/rs18050738
Submission received: 28 January 2026 / Revised: 14 February 2026 / Accepted: 26 February 2026 / Published: 28 February 2026

Highlights

What are the main findings?
  • We built a UAV dataset (SIMA) using both orthomosaics and five-lens raw imagery (nadir + oblique views); the raw multi-view images are included as training samples and also support post-detection verification in occluded mountainous–forested scenes.
  • YOLO11-MSCAM (CA + SA + MSCB) improves detection performance over , achieving mAP@0.5 = 83.24% and mAP@0.5:0.95 = 58.29% with higher Precision and F1, while maintaining negligible efficiency overhead (19.67 M params, 67.34 GFLOPs@640, 45.86 FPS).
What are the implications of the main findings?
  • The proposed framework supports UAV batch screening via sliding-window inference to output suspicious locations and confidence scores, reducing manual interpretation and field-check costs.
  • Multi-view oblique imagery strengthens post-detection verification and evidence collection by providing complementary views of typical disturbance cues (e.g., pits, heap-leach facilities, and temporary roads) under complex terrain and shadow interference.

Abstract

Ion-adsorption rare-earth mining in southern China often leaves small, fragmented disturbances in rugged, forested terrain, making UAV-based enforcement challenging due to confusion with bare ground, canopy gaps, and shadows. We propose YOLO11-MSCAM, an enhanced YOLO11vm detector in which the original SPPF at the backbone–neck junction is replaced by a Multi-Scale Convolution–Attention Module that cascades channel attention, spatial attention, and multi-scale residual convolutions to enhance context aggregation and suppress background clutter. We build a field-acquired UAV dataset, SIMA (0.05 m GSD; September–November 2023), generating 1630 non-overlapping 640 × 640 orthomosaic tiles split into 1320/147/163 for training/validation/testing; five-lens raw images (nadir + oblique) are additionally used as auxiliary training samples and for post-detection verification. On the test set, YOLO11-MSCAM achieves mAP@0.5 = 83.24%, mAP@0.5:0.95 = 58.29%, and F1 = 79.92%, outperforming YOLOv11m and other detectors (YOLOv5m/6m/8m/9m/10m and Faster R-CNN with ResNet-50). With 19.67 M parameters, 67.34 GFLOPs@640, and 45.86 FPS, it supports tile-based batch screening to prioritize suspicious sites for field checks and evidence collection.

1. Introduction

Driven by the growth of strategic emerging industries (e.g., advanced materials, new energy technologies, and high-end manufacturing), rare earth elements (REEs) have become increasingly important as foundational raw materials for strategic supply security [1]. Ion-adsorption rare-earth (RE) deposits, enriched in medium and heavy REEs, provide irreplaceable resources for key strategic sectors [2]. Southern China—particularly the Gannan region in Jiangxi Province—hosts abundant ion-adsorption RE resources and represents the world’s most important concentration of such deposits [3]. Under the compounded influence of scattered deposits, pronounced topographic relief, and covert in situ leaching practices, illegal and non-compliant exploitation in ion-adsorption rare-earth mines is more likely to occur and often appears as “small, brief, and subtle” disturbances, which routinely places regulation efforts in a dilemma of being difficult to detect, difficult to validate on site, and difficult to substantiate with evidence. Remote sensing assessments in rare-earth mining areas have reported that ecological/environmental responses differ under varying disturbance intensities and can be spatially fragmented under complex terrain–vegetation backgrounds [4], while time-series mining-detection studies further highlight that small-scale mining signals can be subtle and easily masked by natural surface variability, motivating automated detection for reliable screening [5]. In addition, leachate transport and improper management of residual effluents can exacerbate ecological risks through cumulative build-up and off-site propagation [6]. Consequently, given the need to balance resource exploitation with ecological conservation, there is an urgent demand for an operational, continuous monitoring and refined management framework targeting mining-site activities [7].
In response to the demand for operational monitoring and fine-grained enforcement, illegal rare-earth mining is still predominantly identified through on-site patrols and human visual interpretation of high-resolution imagery; however, the associated workload and long turnaround hinder timely and continuous updating [8,9]. As UAV platforms and airborne high-resolution optical sensors become increasingly widespread, rapid access to centimeter-scale imagery of mining areas has become standard practice, supporting expedited verification and detailed inspections for priority zones [10,11]. Prior work predominantly uses orthorectified imagery for mining-area surveying and disturbance monitoring [12,13], yet in mountainous–forested settings, the near-vertical viewing perspective and vegetation occlusion constrain the depiction of 3D manifestations (e.g., excavation sidewalls, heap-leaching infrastructure, and temporary access roads). Multi-camera (five-lens) oblique imagery acquires observations from several angles, and the oblique views can penetrate canopy gaps to better reveal ground-level conditions, which has been shown to enhance fine-detail representation in urban reconstruction and infrastructure inspection applications [14]. In this work, the original five-lens images (nadir and oblique views) are also used as independent training samples, complementing orthorectified/orthomosaic tiles to increase viewpoint diversity and improve robustness under occlusion and complex terrain. Accordingly, jointly leveraging orthorectified imagery and five-lens oblique observations—both as training data and as post hoc visual evidence—is promising for enriching the depiction of mine-site geometry and operational details that are otherwise obscured beneath dense forest canopies.
Over the past few years, deep learning-driven object detection has emerged as a dominant route in remote sensing interpretation, progressing from baseline applicability toward increasingly fine-grained and discriminative recognition [15]. In the YOLO line of work, performance gains for cluttered scenes and small objects are typically pursued via a dual strategy of attention amplification and multi-scale feature enhancement [16,17,18]. Wan et al. developed YOLO-HR, which injects hybrid attention into multi-level feature pyramids and multiple detection heads to boost remote sensing detection capability [19]. Deng et al. incorporated Shuffle Attention into the YOLOv5s head and further enhanced feature representation through pyramid pooling and feature reconfiguration [20]. Qu et al. improved remote sensing small-target sensitivity by jointly leveraging multi-scale feature extraction and information fusion [21]. Su et al. introduced MSA-YOLO, where multi-scale strip attention co-models local–global context to attenuate background clutter [22]. Under lightweight design constraints, MEL-YOLO (Yang et al.) couples multi-scale features with an efficient attention module, achieving a favorable accuracy–efficiency trade-off [23]. As the YOLO line continues to evolve, Xu et al. developed SRTSOD-YOLO by refining YOLO11, where architectural lightweight design and improved feature-fusion strategies jointly strengthen real-time capability and robustness [24]. Furthermore, evidence suggests that YOLO11 offers a competitive accuracy–efficiency trade-off for high-resolution applications, including UAV-based aerial surveys, road-facility detection, and urban object recognition [25,26]. Beyond the YOLO family, transformer-based detectors and their remote sensing adaptations have been increasingly explored to better model global context and complex object geometry. For example, DETR-ORD improves oriented remote sensing object detection via feature reconstruction and dynamic query design [27], and RS-DETR introduces a remote sensing detection transformer derived from RT-DETR to enhance feature interaction and detection robustness in aerial scenes [28]. Building on these strengths, YOLO11 is a promising baseline for high-resolution imagery, yet the extent to which its performance and architectural benefits generalize across scenes is still unclear, necessitating task-specific verification and refinement. Prior work largely targets general remote sensing objects or conventional open-pit mines, with comparatively insufficient attention to tailoring methods for suspected illegal mining units in ion-adsorption rare-earth regions, where canopy obstruction, small target size, and heavy background clutter pose distinctive challenges.
Motivated by the foregoing analysis, we focus on fine-scale recognition of suspected illegal mining units in southern ion-adsorption rare-earth regions, and develop a data support scheme leveraging UAV orthorectified imagery together with five-lens oblique observations; on this basis, we take YOLOv11m as the baseline and introduce YOLO11-MSCAM, an enhanced detector that couples multi-scale residual convolutional modeling with attention mechanisms. Our approach augments the feature extraction and fusion stages with multi-scale residual convolutional modeling to enhance scale-adaptive representation, and combines channel and spatial attention to emphasize salient operational signatures while attenuating cluttered backgrounds, leading to more robust detection under small-object, occluded, and high-confusability distractor conditions. We additionally perform extensive experiments and benchmarking to assess the method’s detection accuracy, inference efficiency, and component-wise contributions, offering deployable support for the operational goals of “early detection, rapid verification, and evidence acquisition” in illegal rare-earth mining enforcement. In operational use, we mainly apply the detector to georeferenced orthomosaics for large-area screening and mapping, and then use the corresponding oblique views for multi-angle verification and evidence acquisition.

2. Methods

2.1. Model Framework

In high-resolution UAV images, suspected illegal mining disturbances in ion-adsorption rare-earth mining areas are often small in size, discontinuous in boundary geometry, low in texture contrast, and embedded in heavily mixed backgrounds; meanwhile, their visual manifestation can vary markedly with terrain undulation, canopy coverage, and illumination. As a result, the targets often closely resemble canopy openings, bare-soil spots, temporary tracks, and shadow regions in local texture and color tone, making operational detectors prone to both false alarms and missed detections. In these weak-signature–strong-clutter scenarios, the vanilla YOLOv11m, with conventional convolutional stacking, struggles to preserve sensitivity to small, fragmented targets while effectively suppressing background-induced responses..
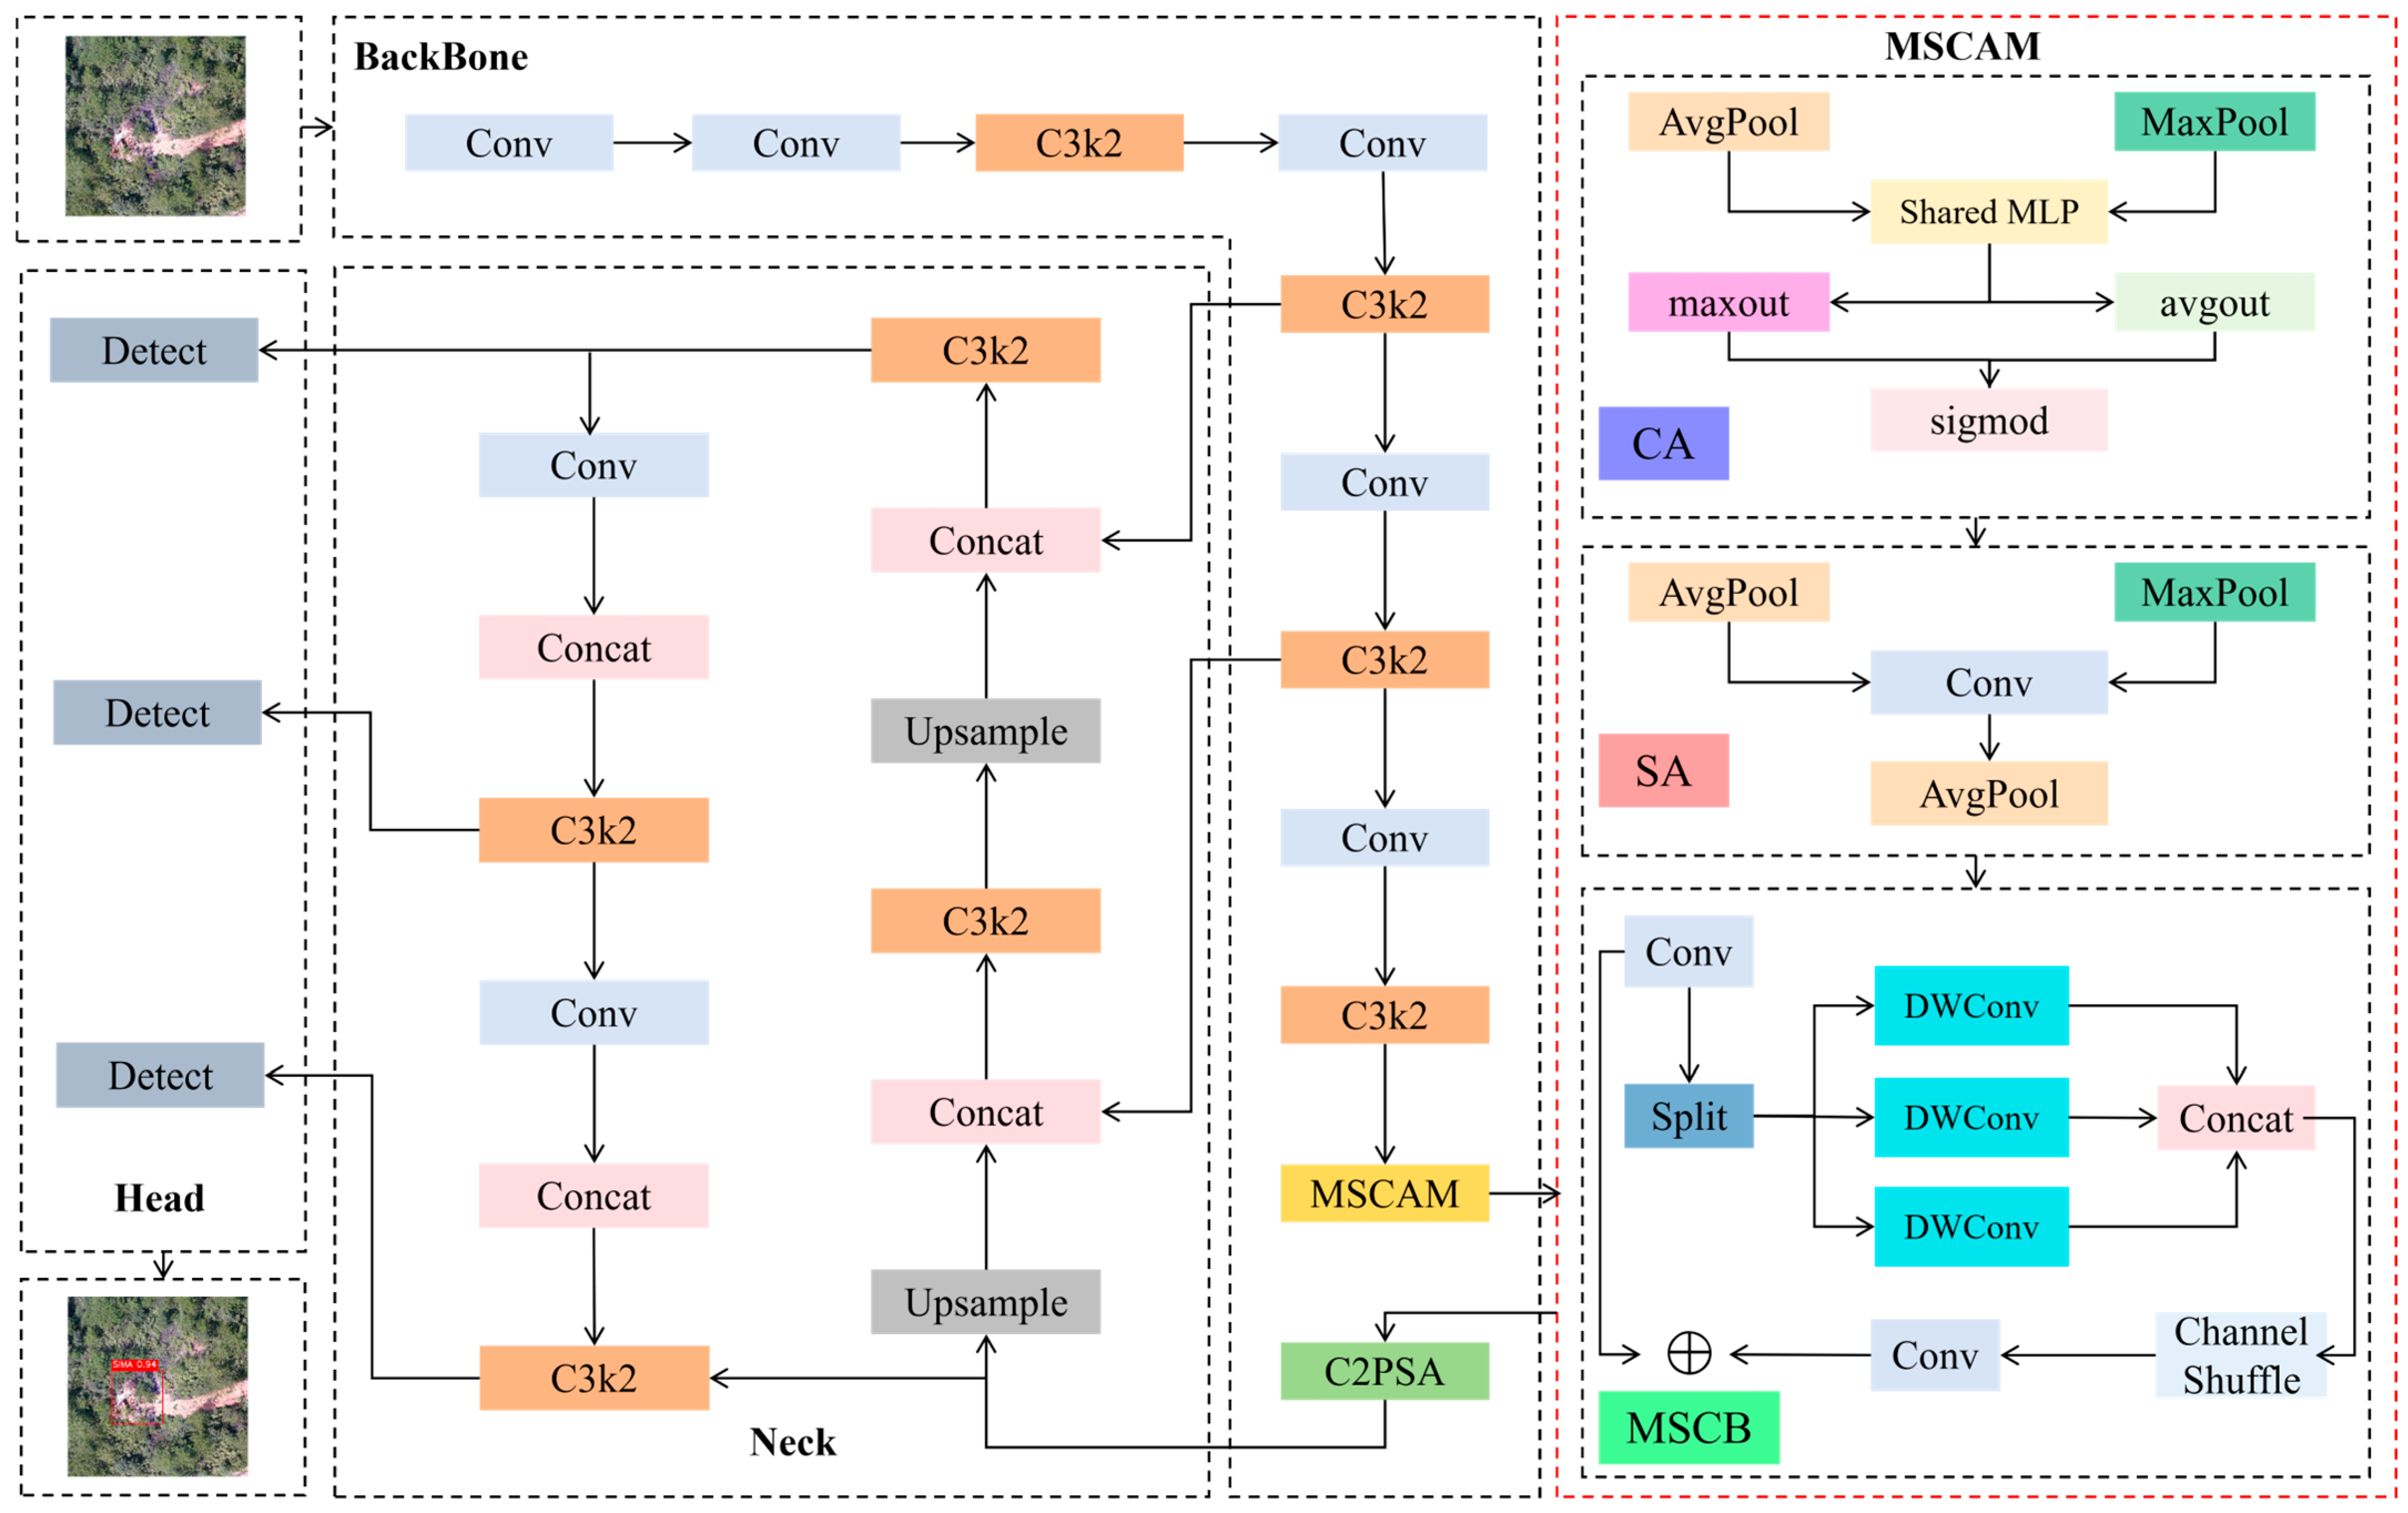
To tackle these issues, we develop YOLO11-MSCAM for mining-area imagery on top of YOLOv11m, preserving the original Backbone–Neck–Head workflow and the three-scale detection heads (Figure 1). Rather than relying on a wholesale architectural redesign, the model adopts a directed enhancement at the backbone–neck junction. Specifically, MSCAM is implemented by replacing the original SPPF module, and it operates on the P5 feature map (stride 32) right before the Neck (FPN–PAN). The output feature resolution and channel dimensions are kept identical to those of SPPF, so the subsequent Neck fusion (P5 → P4 → P3) and the three detection heads remain unchanged, while the features entering the Neck become more discriminative under cluttered backgrounds.
Concretely, MSCAM adopts a cascaded CA → SA → MSCB design and addresses the key scene difficulties through three complementary modeling components:
(1)
For target–background semantic mixing in mining areas, CA re-weights channels to strengthen activity-relevant discriminative semantics and dampen redundant background responses.
(2)
To cope with spatial uncertainty arising from scattered targets, indistinct boundaries, and canopy occlusion, SA steers attention toward disturbance-prone salient regions, thereby enhancing localization and boundary perception.
(3)
For heterogeneous disturbance shapes and large-scale spans, MSCB complements contextual encoding through multi-receptive-field fusion and residual forwarding, improving overall perception of targets at different scales, including minute pits, slender tracks, and areal heap-leaching pads.
Notably, our contribution is not merely the inclusion of attention or multi-scale convolutions, but rather (i) the CA–SA–MSCB cascading sequence, which enforces a staged enhancement of semantic selection, spatial focusing, and contextual integration; and (ii) the placement of MSCAM at semantically sensitive mid- and high-level feature stages for mining scenes, achieving targeted enhancement instead of uniformly stacking modules across the network. In implementation, MSCAM-refined features are propagated across scales through the native YOLOv11m FPN and PAN pathway and then delivered to the multi-scale detection heads to predict the categories and bounding boxes of suspected illegal mining objects. Owing to this scene-driven design, YOLO11-MSCAM more consistently accentuates illegal mining disturbance signatures under complex geomorphology and heavy background clutter, thereby providing more dependable automated detection support for UAV orthomosaic-based batch screening and follow-up verification workflows in rare-earth mining regions.

2.2. Channel Attention Module

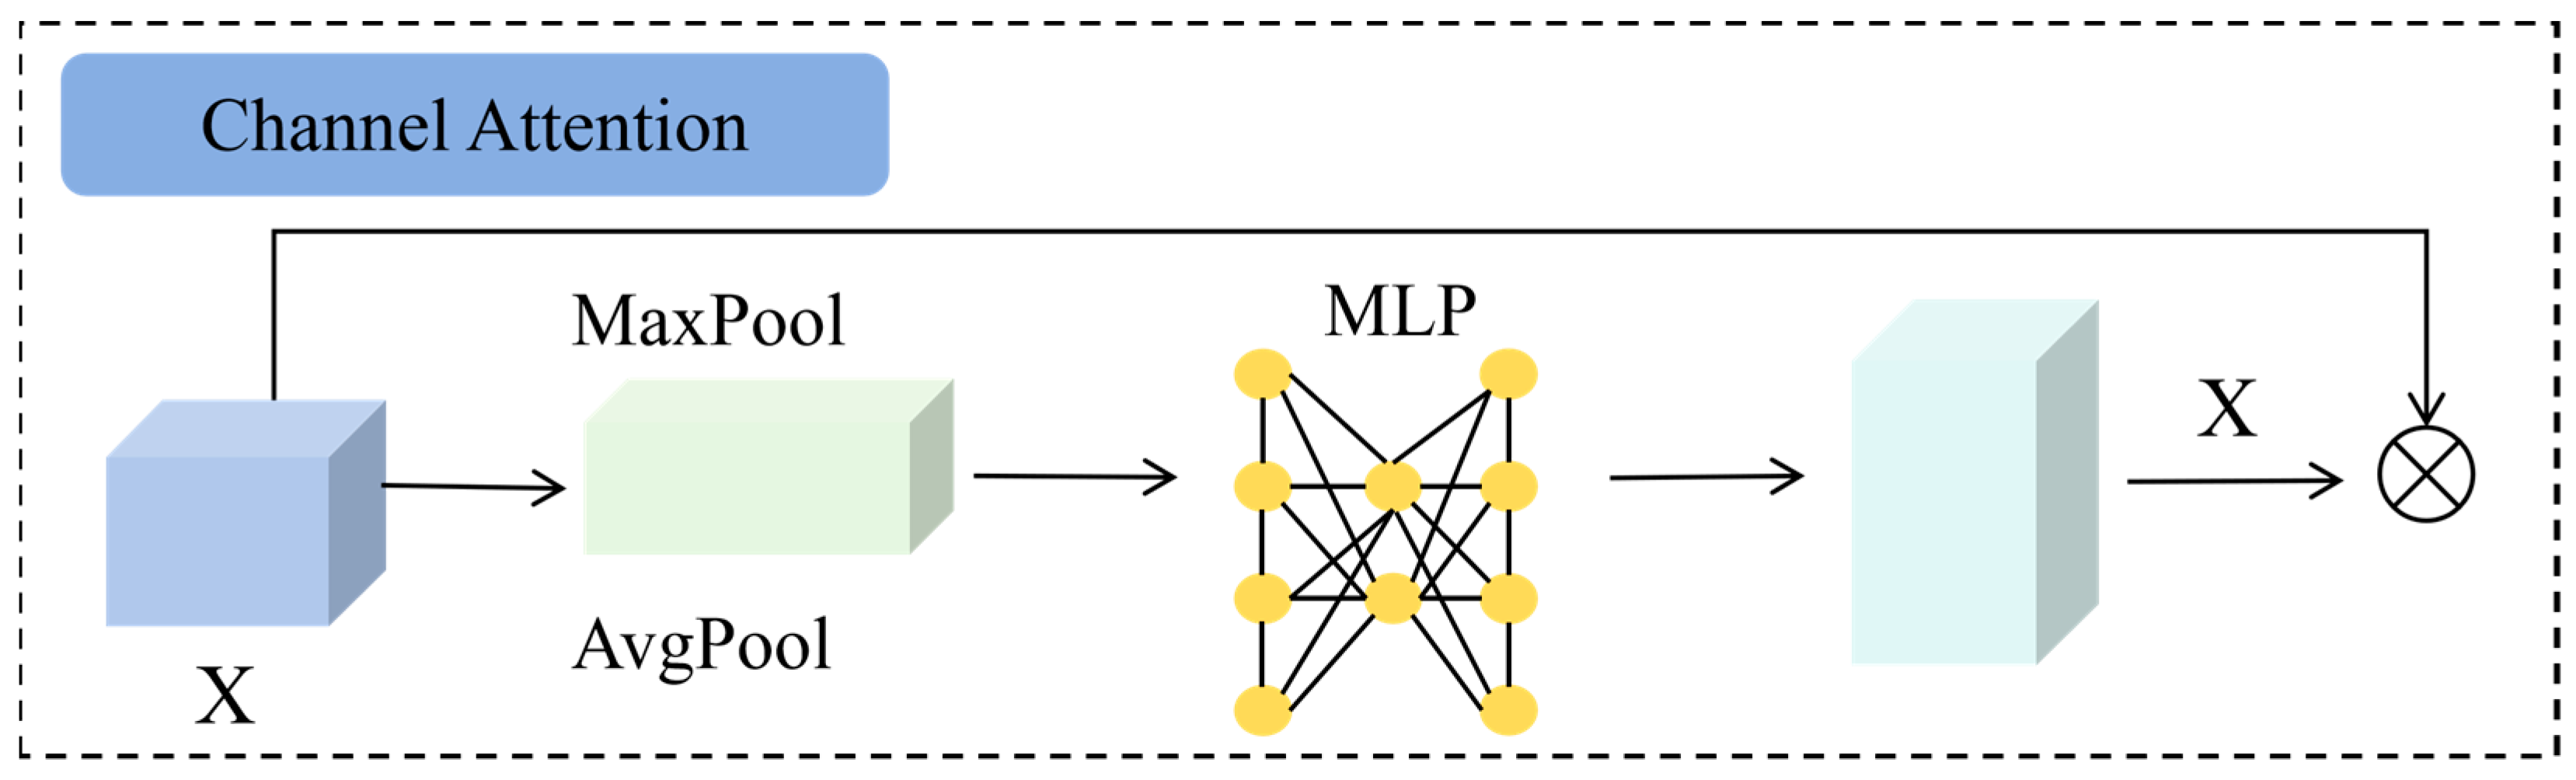
In high-resolution imagery, suspected illegal mining disturbances in ion-adsorption rare-earth areas are typically semantically weak, small in scale, and readily submerged by background textures such as bare soil or roads; consequently, target-relevant discriminative semantic channels can be attenuated by excessive background-driven activations. To enhance channel-wise semantic responses that are most indicative of illegal mining activities, we introduce a channel attention (CA) unit into MSCAM (Figure 2). The CA unit employs global pooling and a shared MLP to adaptively weight channels, effectively recalibrating channel-wise feature importance. Let the input feature map be X; CA performs global average pooling and global max pooling to produce two-channel descriptor vectors:
F a v g ( c , 1,1 ) = 1 H W i = 1 H j = 1 W X ( c , i , j ) , c = 1 , , C
F m a x ( c , 1,1 ) = max 1 i H , 1 j W X ( c , i , j ) , c = 1 , , C
Specifically, global average pooling summarizes each channel by its spatially averaged activation, encoding overall intensity and low-frequency structural cues, whereas global max pooling records the channel’s strongest activation, making it more responsive to local textures and high-contrast patterns. Both channel descriptors are processed by a lightweight MLP implemented with 1 × 1 convolutions, and the two outputs are aggregated (by summation) and then activated by a sigmoid function to yield the channel-attention weight vector.
S = σ ( Z a v g + Z m a x ) , σ ( z ) = 1 1 + e z
X ~ ( c , i , j ) = S ( c , 1,1 ) X ( c , i , j ) , c = 1 , , C
The resulting attention weights are applied to the original features via channel-wise element-wise multiplication, producing reweighted features that amplify informative channels and attenuate redundant responses. By sharing a single set of MLP parameters across the average- and max-pooling branches, CA maintains a lightweight parameter footprint while capturing both global statistical cues and local extremal responses; this makes it particularly responsive to channels informative for illegal mining identification (e.g., pit-edge roughness, high-frequency stockpile textures, and road-to-pit transition bands), thereby strengthening discrimination in cluttered scenes.

2.3. Spatial Attention Module

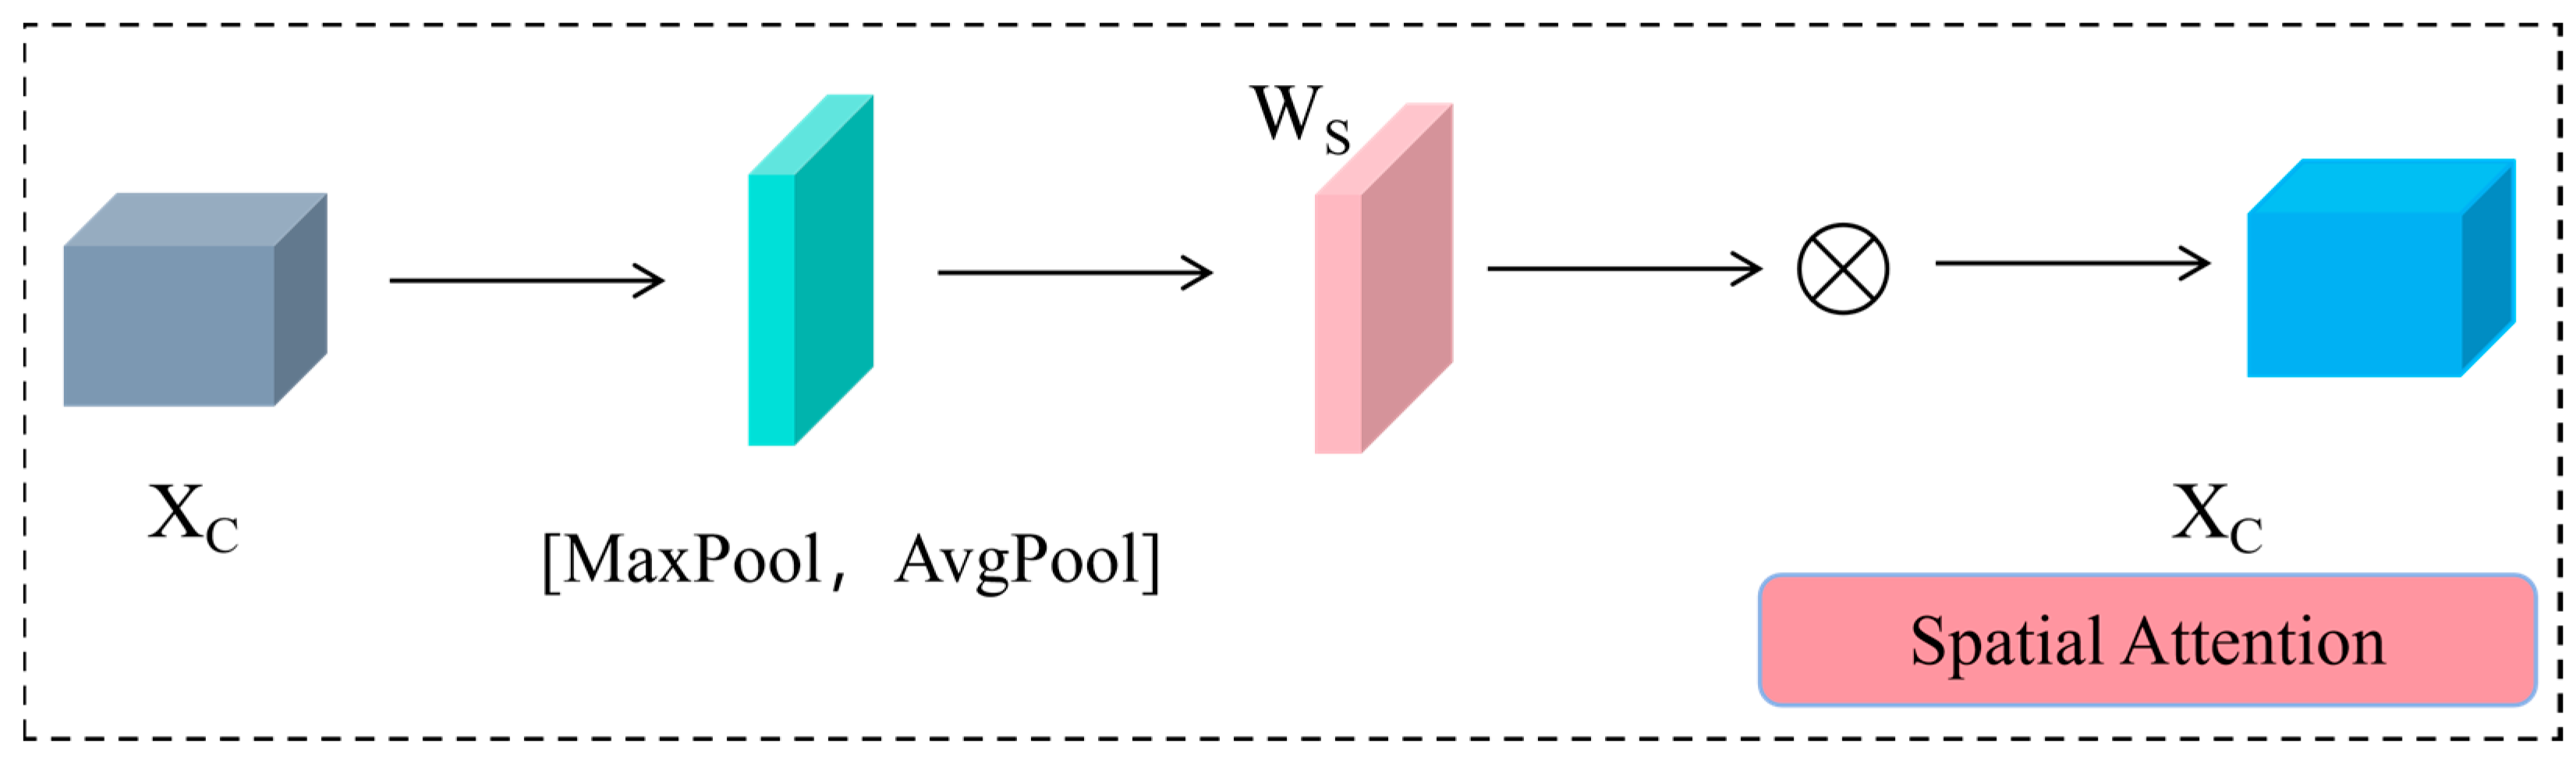
Channel-wise reweighting alone is inadequate for scenarios characterized by small targets and spatially sparse distributions. To promote spatial focusing on regions likely to contain illegal mining cues, MSCAM further incorporates a spatial attention (SA) module (Figure 3). SA learns a 2D saliency mask after channel aggregation to concentrate responses over suspected targets and attenuate extensive irrelevant background. Let the input feature map be X; the detailed steps are as follows:
First, we apply channel-wise average pooling and channel-wise max pooling to X, yielding two single-channel maps, F a v g and F m a x . Channel-average pooling is formulated as:
F a v g ( 1 , i , j ) = 1 C c = 1 c X ( c , i , j )
This operation summarizes the overall activation strength at each spatial position; in contrast, channel-wise max pooling highlights locally salient high-response areas.
The two single-channel maps are then concatenated along the channel axis to form a 2-channel tensor and passed through a 7 × 7 convolution to encode spatial context, thereby modeling neighborhood dependencies with an expanded receptive field.
Let W 7 × 7 be the 7 × 7 kernel; the spatial attention map A is given by
A = σ W 7 × 7 c o n c a t ( F a v g , F m a x )
In this formulation, “∗” indicates 2D convolution, σ and denotes the Sigmoid activation. The SA map is finally applied to the original features via spatial (pixel-wise) reweighting:
X ~ ( c , i , j ) = A ( 1 , i , j ) X ( c , i , j )
A Sigmoid activation produces the spatial attention map, which is then applied to the input features via pixel-wise multiplication.
Owing to the expanded receptive field of the 7 × 7 convolution, SA captures spatial dependencies among structures such as pits, haul tracks, and stockpiles, and preferentially attends to activity-prone areas (e.g., pit rims, track intersections, and fragmented patches), which enhances small-object saliency and localization precision under cluttered backgrounds.

2.4. Multi-Scale Convolutional Residual Block and Overall Structure of MSCAM

Even after channel and spatial attention are modeled, explicitly incorporating multi-scale context in the convolutional domain is still required to tackle the representation difficulty posed by suspected illegal mining disturbances—large-scale spans, fragmented shapes, discontinuous boundaries, and strong background-texture masking—in ion-adsorption rare-earth scenes. In high-resolution UAV imagery over ion-adsorption rare-earth mines, suspected disturbances show strong multi-scale fragmentation and weak boundary cues: minute pits and slender tracks may span only tens of pixels with low contrast, whereas heap-leaching and dumping areas tend to expand as contiguous patches; moreover, canopy-gap bare soil, agricultural tracks, and shadows closely resemble the targets in tone and texture, readily inducing background-driven false activations. Addressing the central issue that channel and spatial attention alone cannot adequately encode scale and structural cues, we further incorporate a multi-scale contextual aggregation unit (MSCB) after the CA–SA dual-attention stage; this allows features, once semantically refined and spatially focused, to be robustly characterized through explicit multi-scale receptive fields, thereby improving robustness to scale variability, fragmented boundaries, and elongated structures and mitigating background-texture interference.
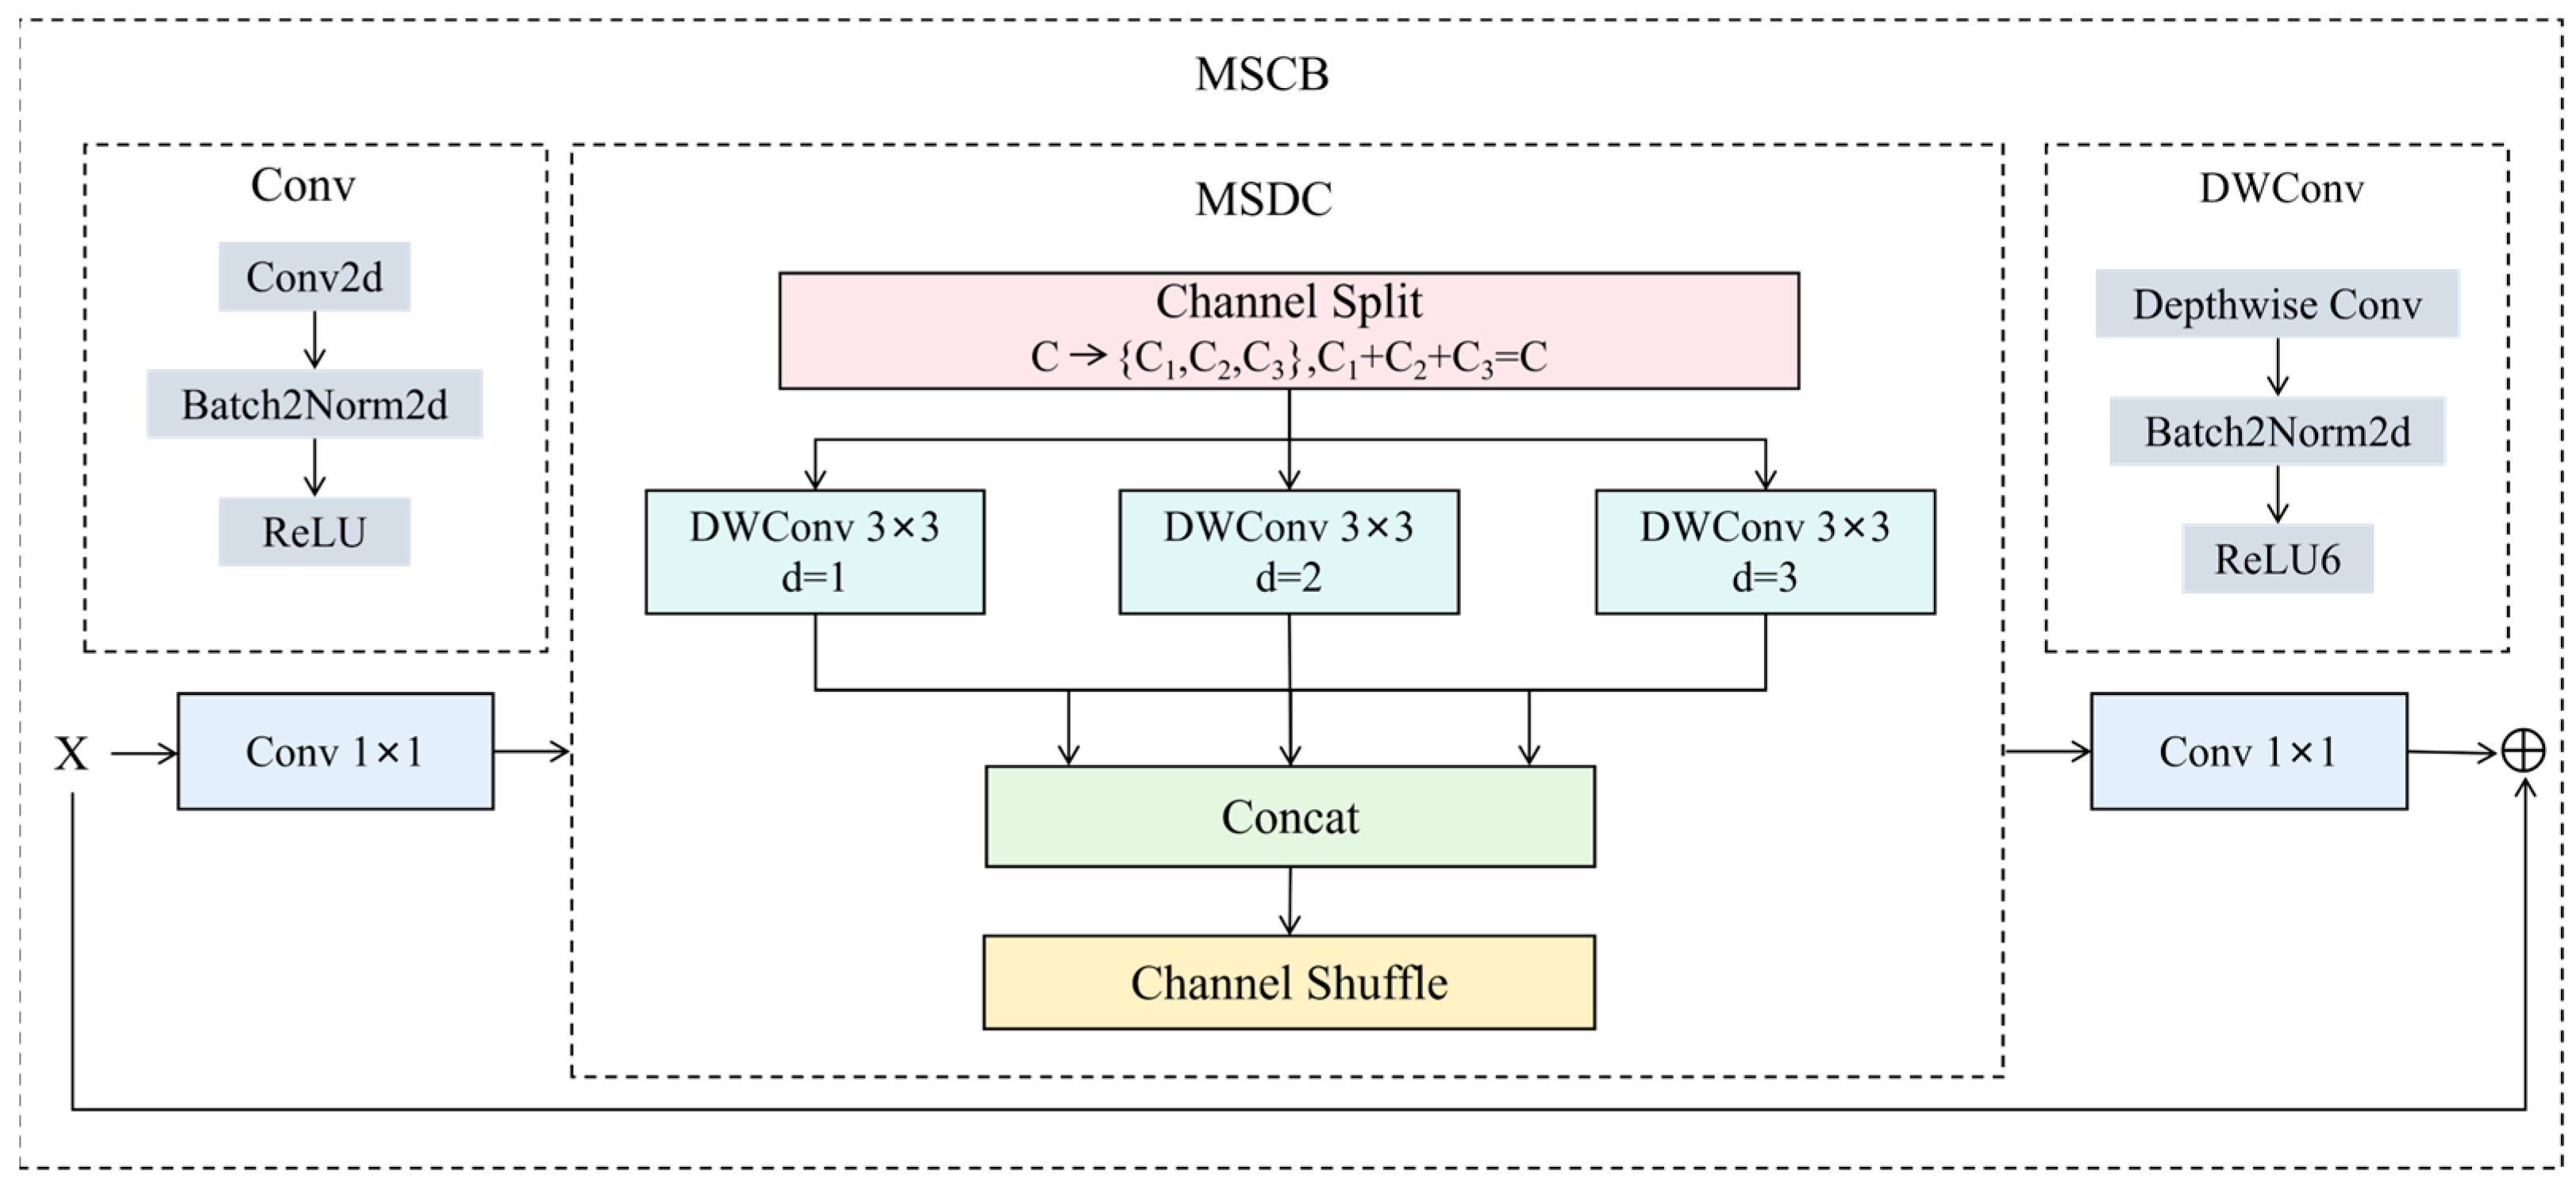
As illustrated in Figure 4, MSCB adopts a “1 × 1 projection → multi-scale depthwise-convolution aggregation → 1 × 1 recovery → residual reinjection” architectural paradigm. A 1 × 1 convolution is first used to project the features into an intermediate space that better supports scale-branch modeling. Next, in the MSDC stage, features are channel-partitioned into multiple groups and fed into three 3 × 3 depthwise separable branches with dilation rates d = 1, 2, 3, capturing multi-scale local and contextual cues. The branch outputs are concatenated and then channel-shuffled to encourage cross-scale interaction and channel-wise reconfiguration, avoiding independent learning of individual scale branches. Finally, channels are restored with a 1 × 1 convolution and fused with the input through residual addition, enabling multi-scale context enrichment without disrupting the original semantics and better preserving the fine boundaries and connectivity of minute pits and elongated haul tracks.
Cascading CA, SA, and MSCB yields the full multi-scale convolution–attention module (MSCAM), and its forward pass can be summarized as:
X = C A ( X ) , X = S A ( X ) , Y = M S C B ( X )
In this design, CA performs channel-wise semantic “refinement”, SA conducts spatial “focusing” on salient regions, and MSCB “encodes and stabilizes” multi-scale contextual information. This role-separated formulation enables MSCAM to improve the network’s perception of small illegal mining targets in cluttered mining scenes, with only a controlled increase in parameters and computational cost.

2.5. Model Evaluation Metrics

We formulate suspected illegal mining site identification in ion-adsorption rare-earth areas as a canonical object-detection problem. Given an image, the detector returns a set of candidate boxes with associated class labels and confidence scores. We use IoU and class consistency to determine matches, applying a confidence-ranked one-to-one assignment: a detection is a True Positive (TP) if it is the highest-confidence match to an unmatched ground-truth box with IoU ≥ the threshold and the correct class; it is a False Positive (FP) if it cannot be assigned to any ground truth (IoU below threshold for all) or carries an incorrect class label; any ground-truth instance left unmatched by all detections is counted as a False Negative (FN).
Building on these definitions, detection performance is quantitatively assessed using Precision, Recall, and the F1 score; the corresponding equations are provided in Equations (9)–(11).
P r e c i s i o n = T P T P + F P
R e c a l l = T P T P + F N
F 1 = 2 · P r e c i s i o n · R e c a l l P r e c i s i o n + R e c a l l
Specifically, Precision characterizes false-positive suppression, Recall captures the propensity for missed detections, and F1—defined as the harmonic mean of the two—is well-suited to imbalanced data settings.
To evaluate overall detection quality across varying confidence thresholds, we adopt Average Precision (AP) and its mean computed over multiple IoU thresholds as the core indicators. At a specified IoU threshold t, we sweep the confidence threshold to derive the PR curve; the area under this curve is defined as
A P c ( t ) = 0 1 P c ( t ; R ) d R
We adopt m A P @0.5 and m A P @0.5:0.95 for consistency with mainstream studies; since our task involves a single class, m A P ( t ) is identical to A P ( t ) . In particular, m A P @0.5 corresponds to AP at IoU = 0.5, while m A P @0.5:0.95 is a more stringent metric that is more sensitive to localization quality.
m A P 0.50.95 = 1 T t { 0.50,0.55 , , 0.95 } 1 C c = 1 C A P c ( t ) , T = 10
Unless otherwise stated, the same inference settings are used for all models when computing point metrics: the confidence threshold is fixed at 0.20, and non-maximum suppression (NMS) uses an IoU threshold of 0.40. While AP/mAP is computed by sweeping confidence thresholds to form the P–R curve (with NMS IoU fixed), the point metrics (Precision/Recall/F1) are computed at this fixed operating point (confidence = 0.20, NMS IoU = 0.40). For model comparisons and ablation studies, we uniformly report m A P @0.5, m A P @0.5:0.95, Precision, Recall, and F1, providing a comprehensive assessment of performance on the suspected illegal mining detection task.

3. Experimental Settings

3.1. Overview of the Study Area

Ion-adsorption rare-earth deposits are concentrated in Southeast Asia and the low-to-middle mountainous–hilly belts of southern China, typically featuring small orebody scales, highly dispersed occurrences, and relatively confined terrain [29]. Jiangxi Province represents an important ion-adsorption RE-rich region; in southern Ganzhou, deposits are particularly dense in Dingnan, Anyuan, Xunwu, Longnan, and Xinfeng counties, where sites are commonly situated in densely forested hills and low mountains with limited transportation access [30]. Under the combined influence of rugged terrain and heap-leaching extraction practices, ion-adsorption RE exploitation can induce vegetation degradation, soil erosion, heavy-metal mobilization, and localized geohazards, thereby exerting sustained stress on regional ecosystems [31]. Notably, in situ leaching produces relatively minor surface disturbance and weak visible traces, which increases the concealment of non-compliant operations and makes small-scale illicit mining and out-of-boundary exploitation harder to detect and regulate promptly with conventional means.
Historical records suggest that, beyond licensed extraction, Jiangxi Province has persistently faced rare-earth mining conducted illegally or in violation of regulations, at a measurable scale. By synthesizing monitoring information from natural-resources and environmental agencies, together with the 2022 remote sensing interpretation of suspected illegal disturbance patches, we identified 63 historical illegal mining sites. The sites are predominantly clustered in southern Jiangxi, spanning Ganzhou, Fuzhou, and Ji’an, with the highest proportion occurring in Ganzhou—especially in Dingnan, Anyuan, and Xunwu counties. Using a 1 km buffer centered on each site, we delineate 63 priority regulatory units, with an aggregated monitoring extent of ~225 km2 after spatial overlay. Accordingly, this area features pronounced clustering of illegal activities, topographic concealment, and compounded multi-type disturbances, offering a representative experimental setting and a pressing practical need for high-resolution remote sensing identification and dynamic governance of suspected illegal rare-earth mining. Moreover, the five-lens UAV imagery employed here enables multi-angle acquisitions of the same area, facilitating a more complete depiction of the spatial morphology of illegal mining disturbances in complex terrain.
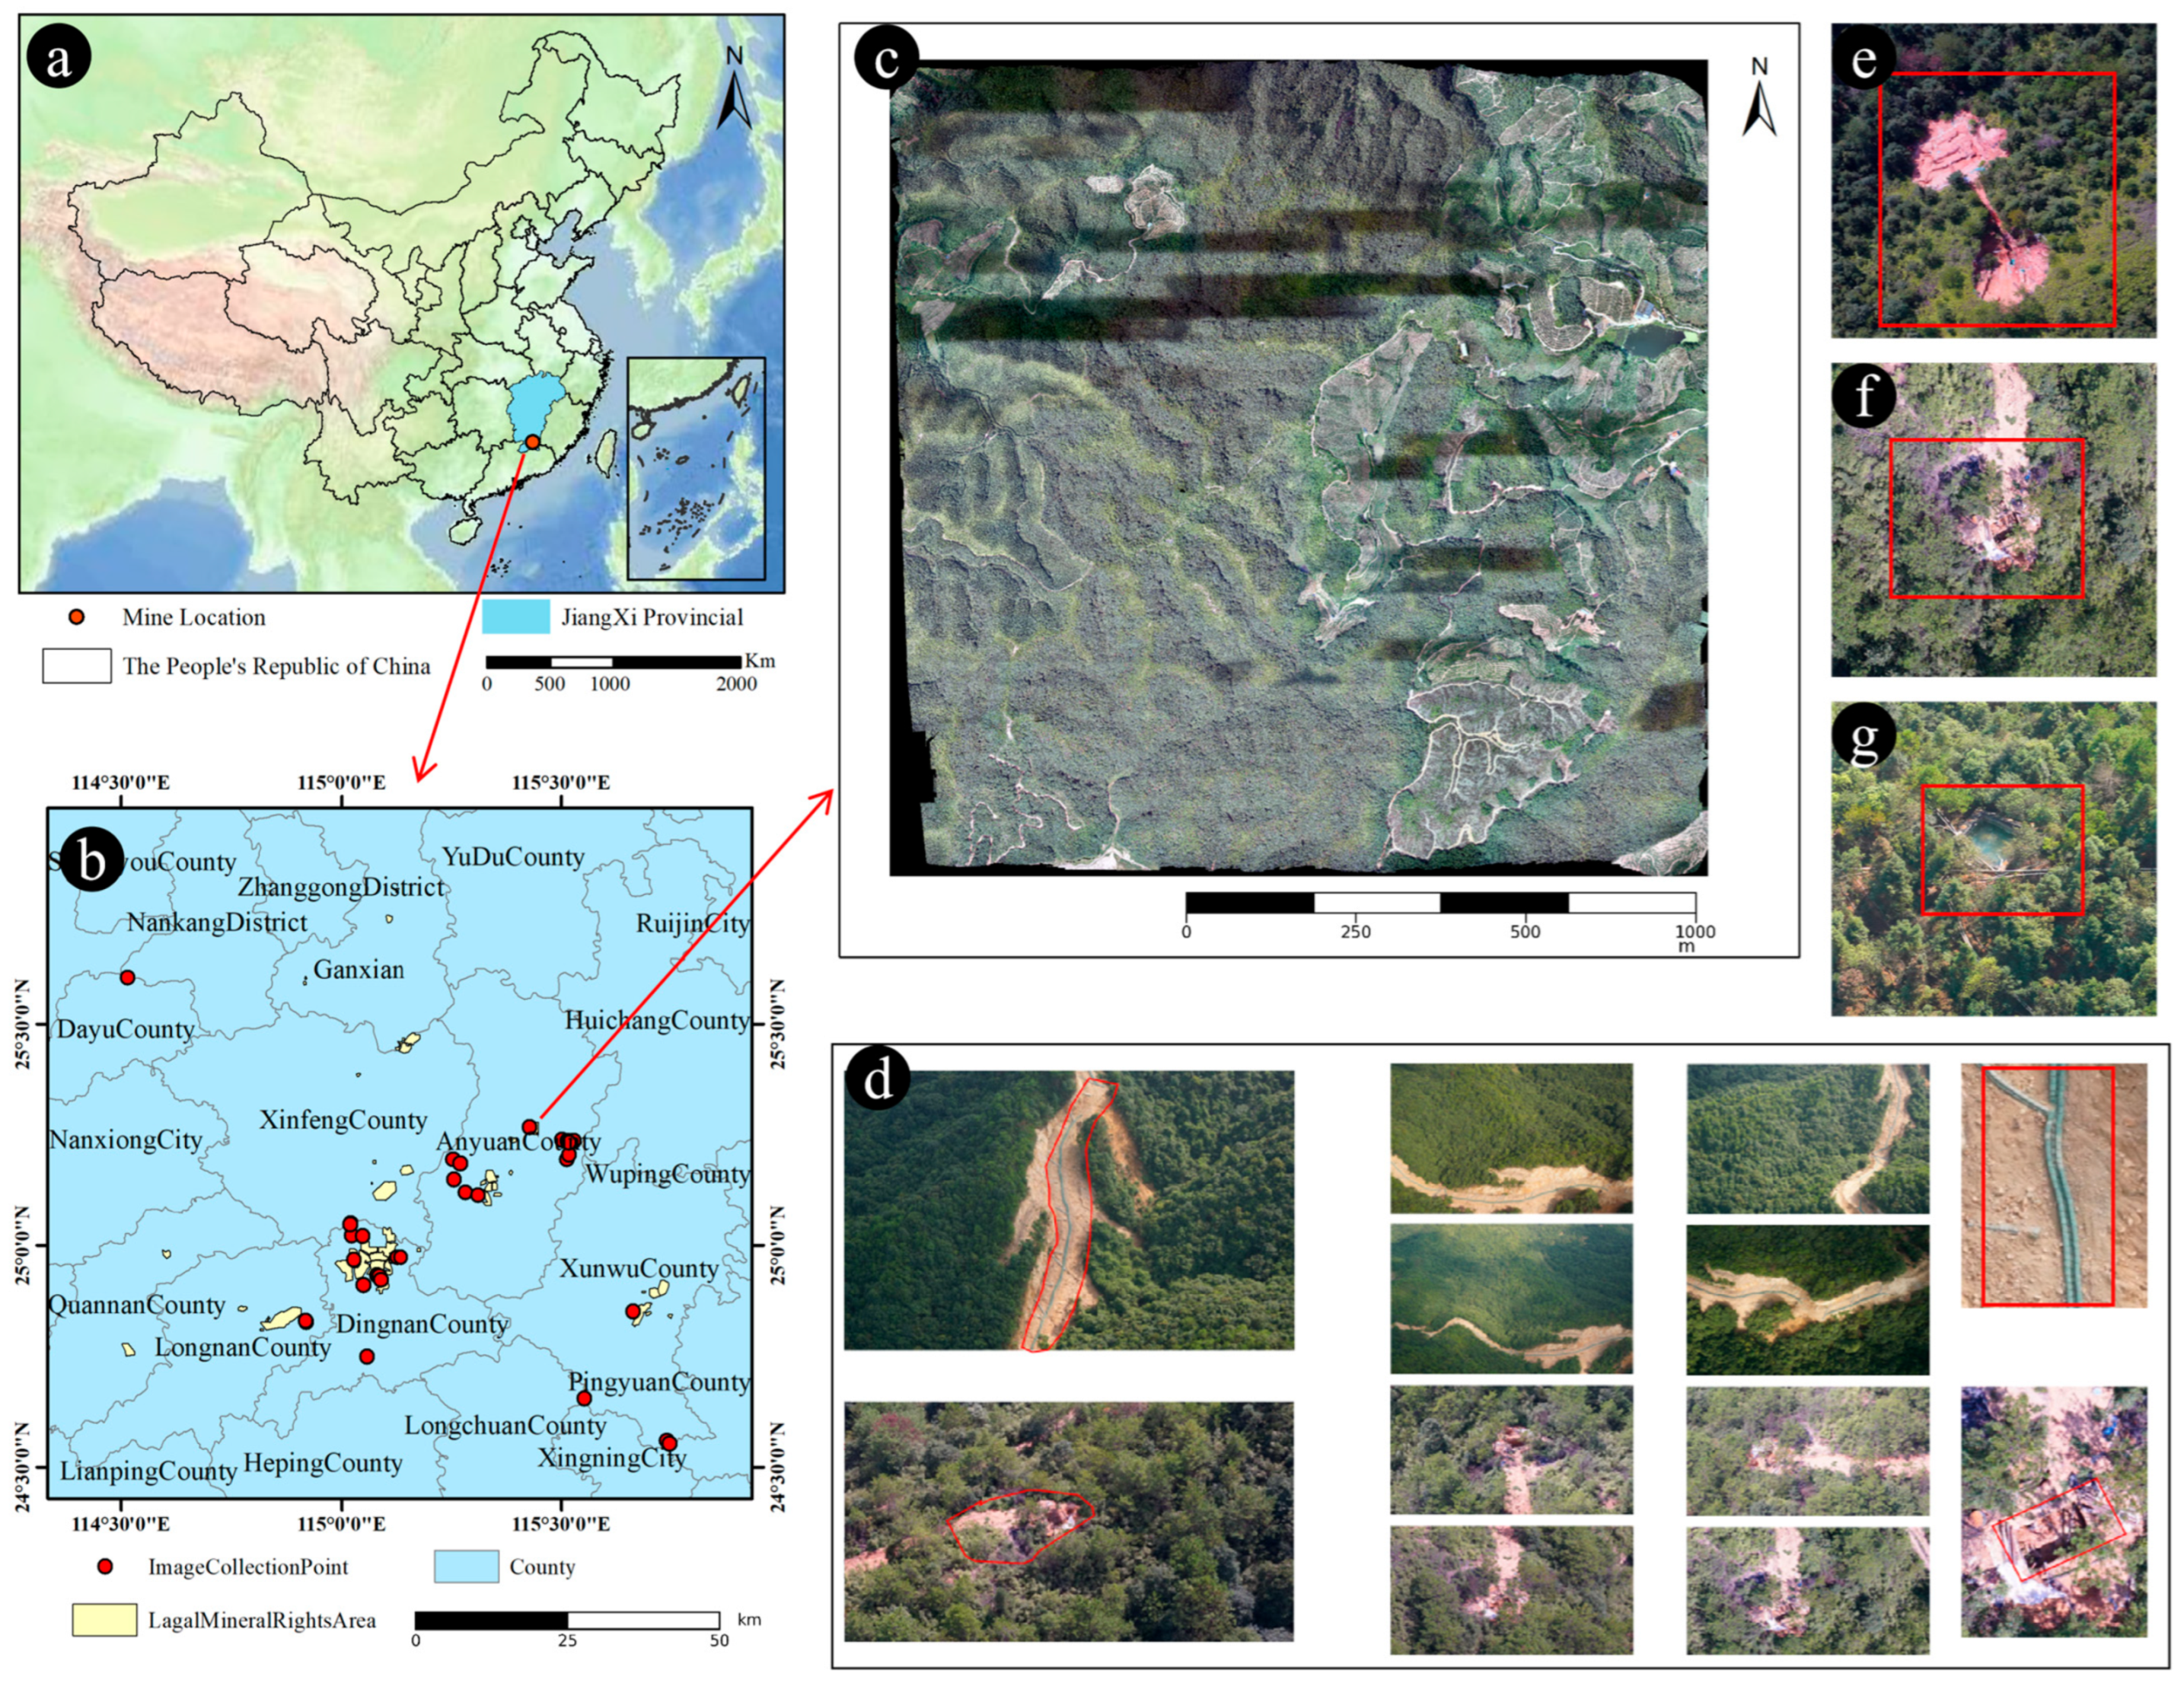
Figure 5 provides the geographic context of the study area by showing the location of the ion-adsorption RE mining region and the spatial distribution of historical illegal mining sites, together with the UAV survey coverage.

3.2. Dataset Construction

The UAV dataset was collected via on-site flight campaigns using an OP3000 imaging sensor (Shenzhen Feima Robotics Co., Ltd., Shenzhen, China) equipped with a Sony α6000 camera/lens assembly (Sony Corporation, Tokyo, Japan). The imagery is standard RGB optical data, and the resulting orthomosaics have an approximate ground sampling distance (GSD) of 0.05 m. The UAV campaigns were conducted from September to November 2023 (autumn) under suitable weather conditions (e.g., without precipitation). Orthomosaics were generated through a standard photogrammetric workflow and then tiled into 640 × 640 patches for model training and evaluation.
To facilitate model training, the mosaicked UAV orthomosaics were partitioned into smaller image tiles. Specifically, we employed a fixed-window sliding strategy with a tile size of 640 × 640 pixels, tiling the original orthomosaics in a raster-scan order starting from the upper-left corner. To ensure full coverage without redundancy, the sliding windows were generated without overlap, producing an initial set of tiles. Except for the non-overlapping 640 × 640 tiling, no additional data augmentation (e.g., rotation, flipping, or photometric adjustments) was applied in this study. For partially occluded targets, the bounding box is drawn to cover the visible disturbed extent only; heavily ambiguous regions are not extrapolated beyond what can be visually confirmed.
After sliding-window partitioning, the initial tile set contained many background-only tiles with no target objects. These background-only tiles were removed, and we retained 1630 non-overlapping 640 × 640 UAV image tiles that contain at least one annotated target of the Suspected Illegal Mining Area (SIMA) category. In this work, all suspected illegal mining manifestations are annotated as a unified single operational category (SIMA) rather than subdivided into pits, heap-leaching areas, or transportation roads, because such manifestations often co-occur within the same disturbed unit and are difficult to separate reliably at the UAV-image level. Each SIMA target is annotated with a tight bounding box covering the visible disturbed extent while excluding surrounding undisturbed vegetation as much as possible. Annotation quality is ensured through guideline-based labeling followed by manual review and correction to reduce obvious omissions and inaccurate boxes. When multiple SIMA targets appear in one tile, they are annotated separately; overlapping boxes are allowed when targets are spatially adjacent or partially overlapping.
The retained tiles were split into training, validation, and test subsets with 1320, 147, and 163 tiles, respectively (approximately 81.0%, 9.0%, and 10.0%). Table 1 summarizes the tile- and instance-level statistics of the orthomosaic SIMA dataset. Note that a single tile may contain multiple annotated instances; therefore, instance counts are not identical to tile counts. The annotated SIMA boxes span a wide range of scales, from 14 × 15 px (min) to near full-tile targets (639 × 639 px, max), reflecting the strong size variability of the disturbed units.
In addition to orthomosaic tiles, we also incorporate the original five-lens imagery (nadir + oblique views) as auxiliary training samples to increase viewpoint diversity. The raw images are tiled/cropped into 640 × 640 patches and annotated using the same SIMA labeling protocol as the orthomosaics. In the practical workflow, once suspicious cues are detected, the corresponding oblique views are further retrieved for post-detection multi-angle verification and evidence collection.

3.3. Experimental Setup and Environment

To assess the feasibility and performance advantages of YOLO11-MSCAM for detecting suspected illegal mining in rare-earth districts, all comparative experiments were conducted using the same training, validation, and test splits on a Windows 10 Professional workstation equipped with a 13th Gen Intel Core i5-13600KF (3.50 GHz), 512 GB RAM, an NVIDIA GeForce RTX 4060 GPU (16 GB VRAM), CUDA 11.8, and PyTorch 2.2.1. All models (YOLOv5m/6m/8m/9m/10m/11m, Faster R-CNN (ResNet-50), and YOLO11-MSCAM) were trained end to end from scratch without pretrained weights (i.e., no ImageNet/COCO pretraining). Model parameters were randomly initialized using the default initialization of the corresponding official implementations, and the random seed was fixed to 2 for all experiments. Training used the Adam optimizer with a weight decay of 1 × 10⁻⁶, a batch size of 8, and 200 epochs. The input image size was fixed to imgsz = 640 for all models. The learning rate was initialized at 1 × 10⁻⁴ and decayed in a stepwise manner, with a lower bound of 1 × 10⁻¹⁰. No additional data augmentation (e.g., rotation, flipping, or photometric adjustments) was applied, except the non-overlapping 640 × 640 tiling described in Section 3.2. No early stopping was used; we trained for 200 epochs and report results from the checkpoint with the best validation performance. For Faster R-CNN, we followed the official implementation while keeping the same data split, batch size, and number of epochs; its optimizer and learning-rate schedule followed the official settings, and other settings were matched as closely as possible for fair comparison.
In inference, we used a unified configuration for all models: confidence threshold = 0.20 and NMS IoU threshold = 0.40. Precision/Recall/F1 are computed under this fixed operating point and are reported in the subsequent Results section.

4. Results

We first present qualitative and quantitative comparisons against conventional object detectors, and discuss their suitability for detecting suspected illegal mining in ion-adsorption rare-earth mining settings. We then perform ablation studies to substantiate the contribution of each module.

4.1. Comparative Experiments

In the suspected illegal mining detection task over ion-adsorption rare-earth mines, we benchmark YOLO11-MSCAM against representative one-stage and two-stage detectors, including YOLOv5m, YOLOv6m, YOLOv8m, YOLOv9m, YOLOv10m, YOLOv11m, and Faster R-CNN with a ResNet-50 backbone (Faster R-CNN (ResNet-50)). Performance is evaluated using mAP@0.5, mAP@0.5:0.95, Precision, Recall, and F1, which jointly reflect overall detection accuracy, localization quality, and the balance between false positives and false negatives. Quantitative results on the test set are reported in Table 2.
In general, one-stage YOLO-series models perform better than the two-stage Faster R-CNN (ResNet-50) baseline for this task. Faster R-CNN (ResNet-50) attains a relatively high Recall (71.83%), but its Precision is notably low (34.23%), resulting in an F1-score of 46.37%. This suggests that, despite detecting many candidate regions, it generates excessive false positives and would substantially increase the downstream verification burden in operational supervision.
Among YOLO variants, YOLOv5m through YOLOv11m maintain a comparatively well-balanced Precision–Recall profile. In particular, YOLOv6m and YOLOv11m stand out on mAP@0.5, achieving 80.93% and 80.70%, respectively. In contrast, YOLOv10m lags behind the other variants across all metrics, suggesting limited robustness to small, low-contrast illegal mining targets in the present dataset.
The proposed YOLO11-MSCAM (Ours) delivers the strongest or near-strongest results across the majority of metrics. Specifically, Ours achieves 83.24% mAP@0.5, a gain of 2.54 percentage points over the YOLOv11m baseline, and surpasses all compared models. For the stricter mAP@0.5:0.95, Ours attains 58.29%, improving by 2.34 points over YOLOv11m (55.95%) and exceeding the strongest baseline on this metric, YOLOv9m (57.36%). On the F1 score, which jointly reflects Precision and Recall, Ours reaches 79.92%, higher than any other YOLO variant (maximum 77.36%), suggesting improved balance and robustness in overall detection performance.
In addition to accuracy, deployment-oriented efficiency is critical for UAV-based large-area screening. Therefore, we report model size (number of parameters), computational complexity (GFLOPs at 640 × 640), and inference speed under a unified benchmarking setting (imgsz = 640, batch = 8, FP32, 1630 images; same hardware). As shown in Table 3, YOLO11-MSCAM remains compact (19.67M parameters) with 67.34 GFLOPs, which is comparable to the YOLOv11m baseline (20.05M, 67.65 GFLOPs), indicating negligible computational overhead. Meanwhile, YOLO11-MSCAM achieves 45.86 FPS (21.81 ms/image), slightly faster than YOLOv11m (42.55 FPS, 23.50 ms/image) and substantially faster than Faster R-CNN (ResNet-50) (7.17 FPS, 139.43 ms/image), supporting real-time/near-real-time tile-based screening in operational workflows.
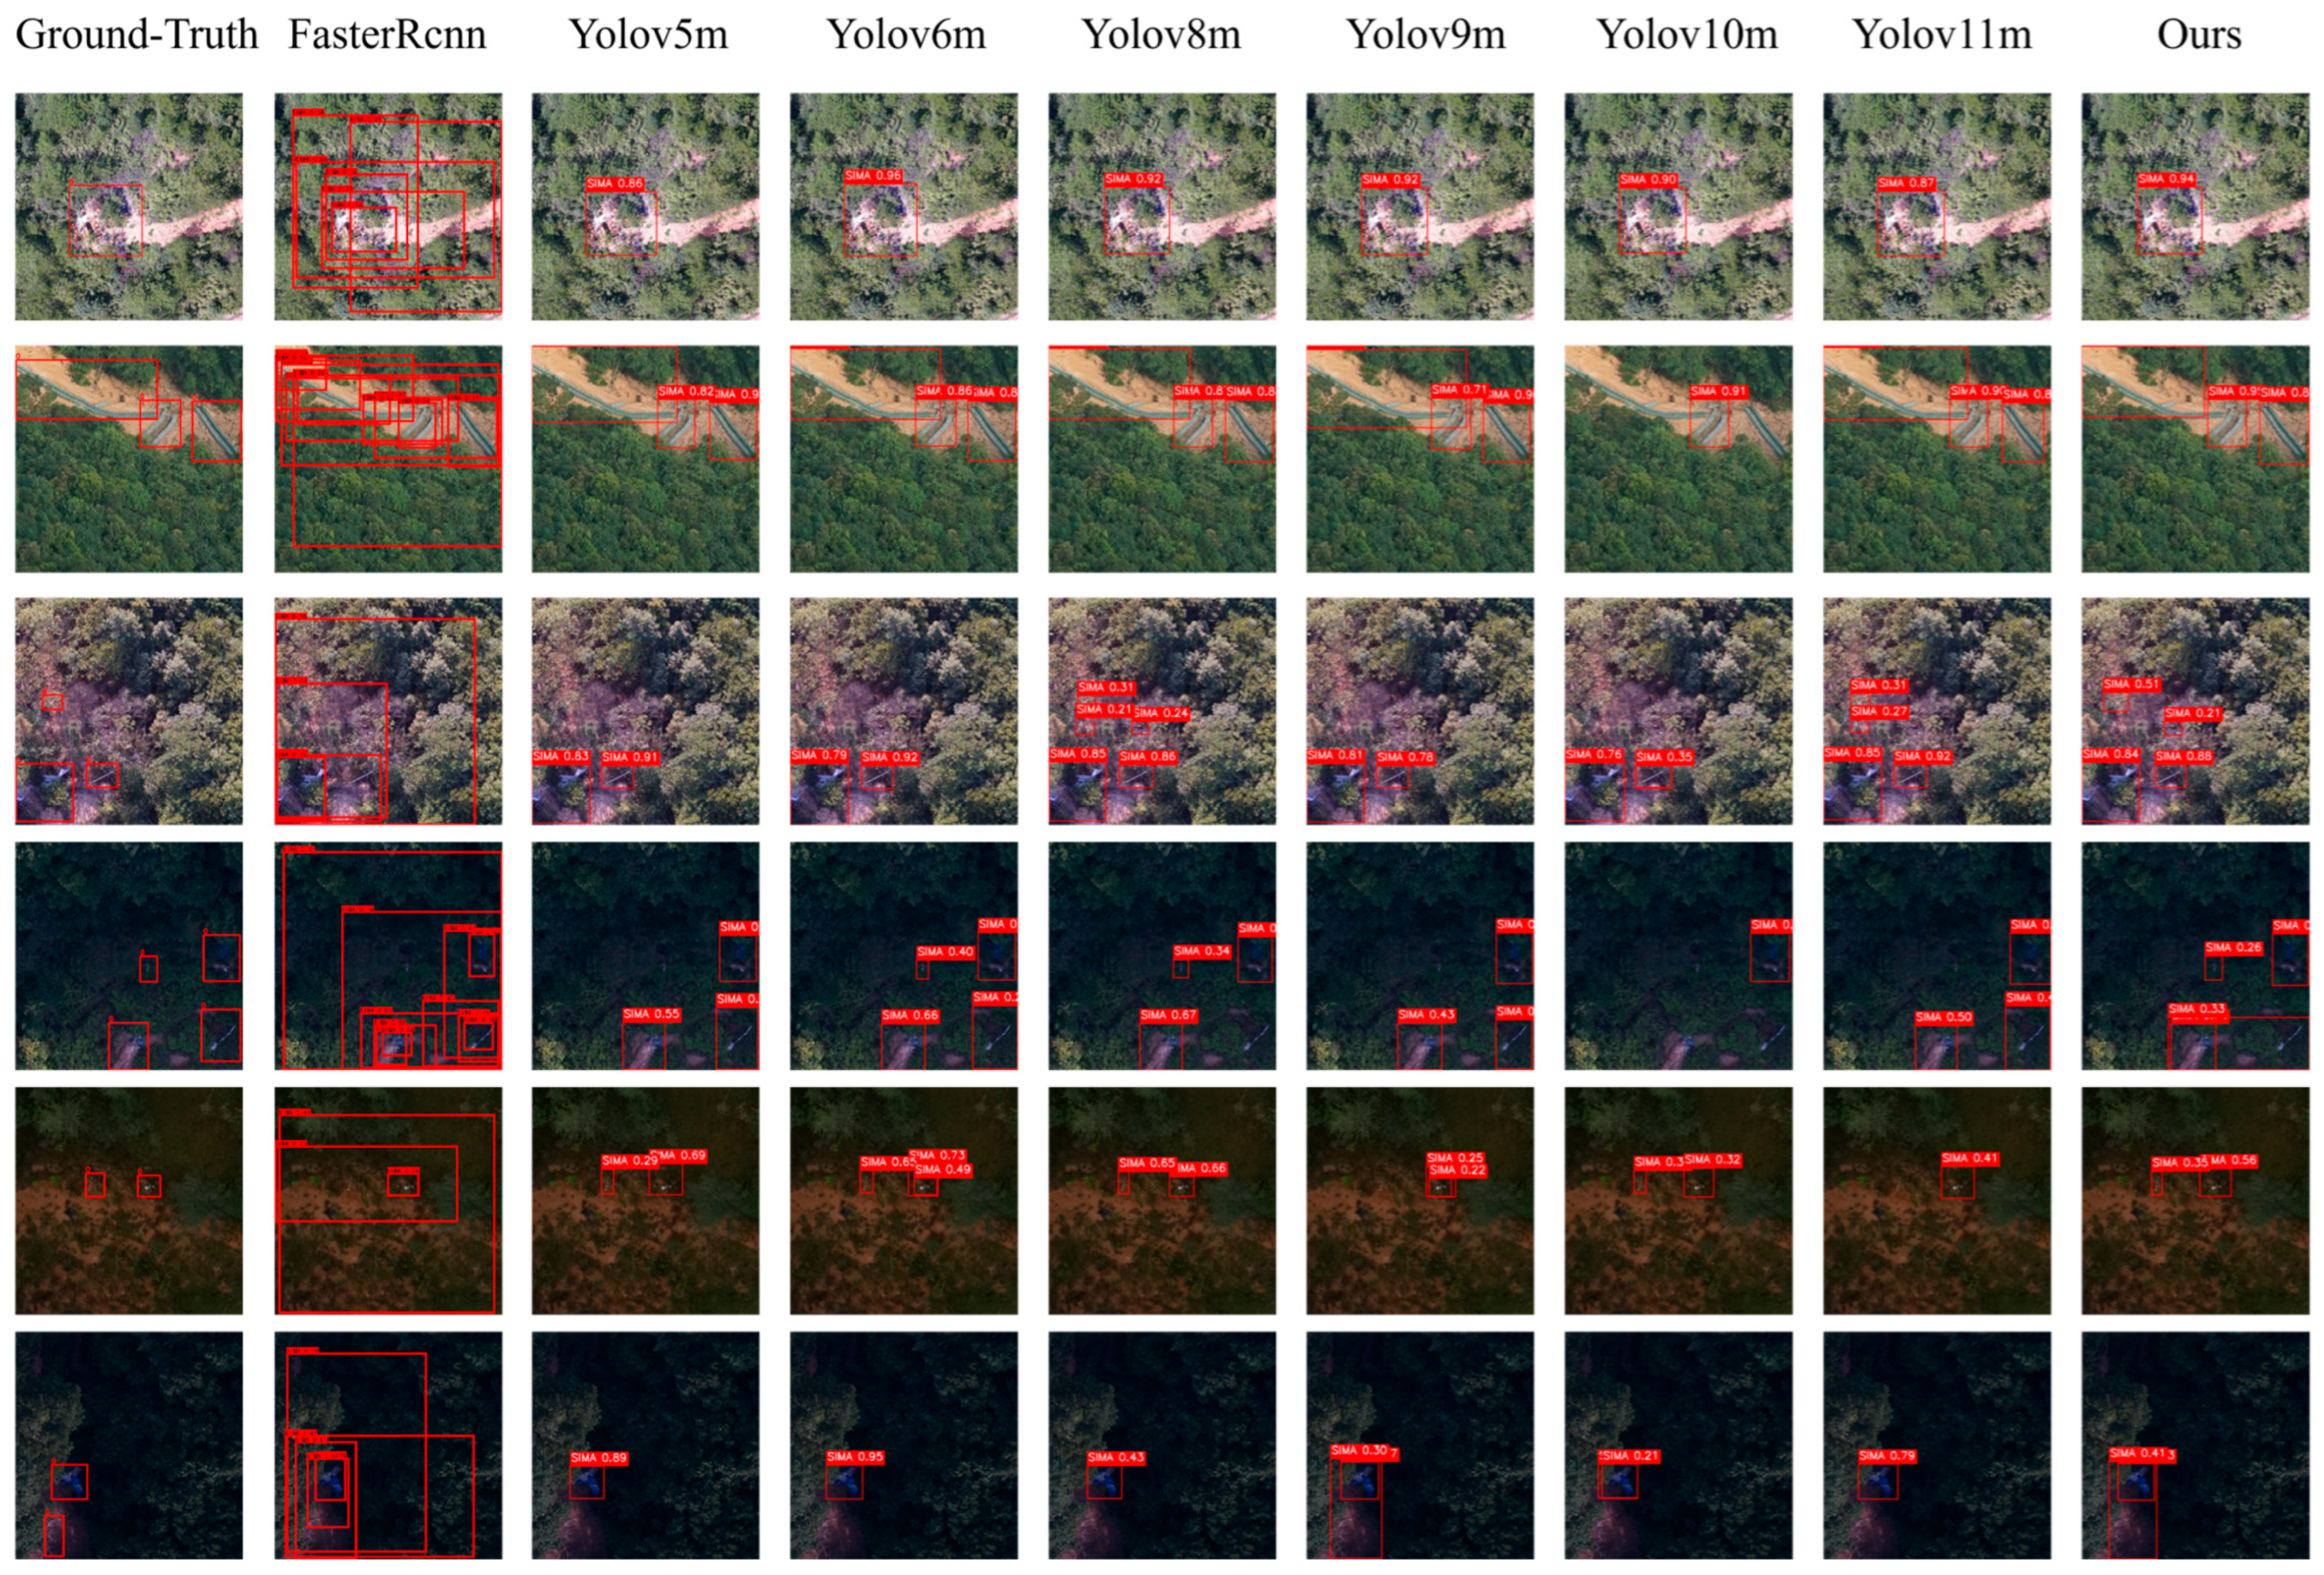
To enable a direct visual comparison of model performance in complex mining environments, Figure 6 shows detection visualizations for several representative test samples, covering canopy-obscured pits, hillside access roads, heap-leaching boundaries, and disturbance areas with weak textures and low contrast.
From the qualitative results, Faster R-CNN (ResNet-50) produces numerous, spatially dispersed proposals in many cases; under dense canopy cover or texture-rich backgrounds, it frequently confuses bare-soil patches, canopy openings, and shadowed areas with suspected illegal mining targets, exhibiting clear false-positive behavior. This qualitative pattern aligns closely with the low Precision observed in the quantitative assessment.
Overall, YOLO-based detectors are markedly more stable than Faster R-CNN (ResNet-50); however, their performance still varies across challenging scene conditions. YOLOv5m and YOLOv6m perform well on samples with relatively clean backgrounds, successfully capturing the principal disturbed regions; nevertheless, they still miss some instances when targets are small or exhibit irregular shapes. YOLOv8m and YOLOv11m are more robust in cluttered backgrounds, yet in densely distributed multi-target cases or low-texture areas, they may still produce partially localized boxes and exhibit unstable confidence estimates. YOLOv10m shows limited sensitivity to small, low-contrast targets in several examples, resulting in missed detections for parts of the suspected illegal mining regions.
By contrast, YOLO11-MSCAM delivers more uniform and stable detections across diverse sample types. On the one hand, in canopy-obscured pits and cluttered textured backgrounds, YOLO11-MSCAM effectively suppresses responses to vegetation, shadows, and non-mining disturbances, issuing high-confidence predictions only for regions with clear mining cues and thus markedly reducing false alarms. On the other hand, when multiple targets co-exist or exhibit large-scale variation, YOLO11-MSCAM can detect several suspected sites concurrently and preserve coherent box locations and sizes. Notably, in low-contrast samples with indistinct boundaries, YOLO11-MSCAM produces boxes that more fully encompass the actual disturbed areas, indicating a more thorough exploitation of multi-scale contextual cues.

4.2. Ablation Experiments

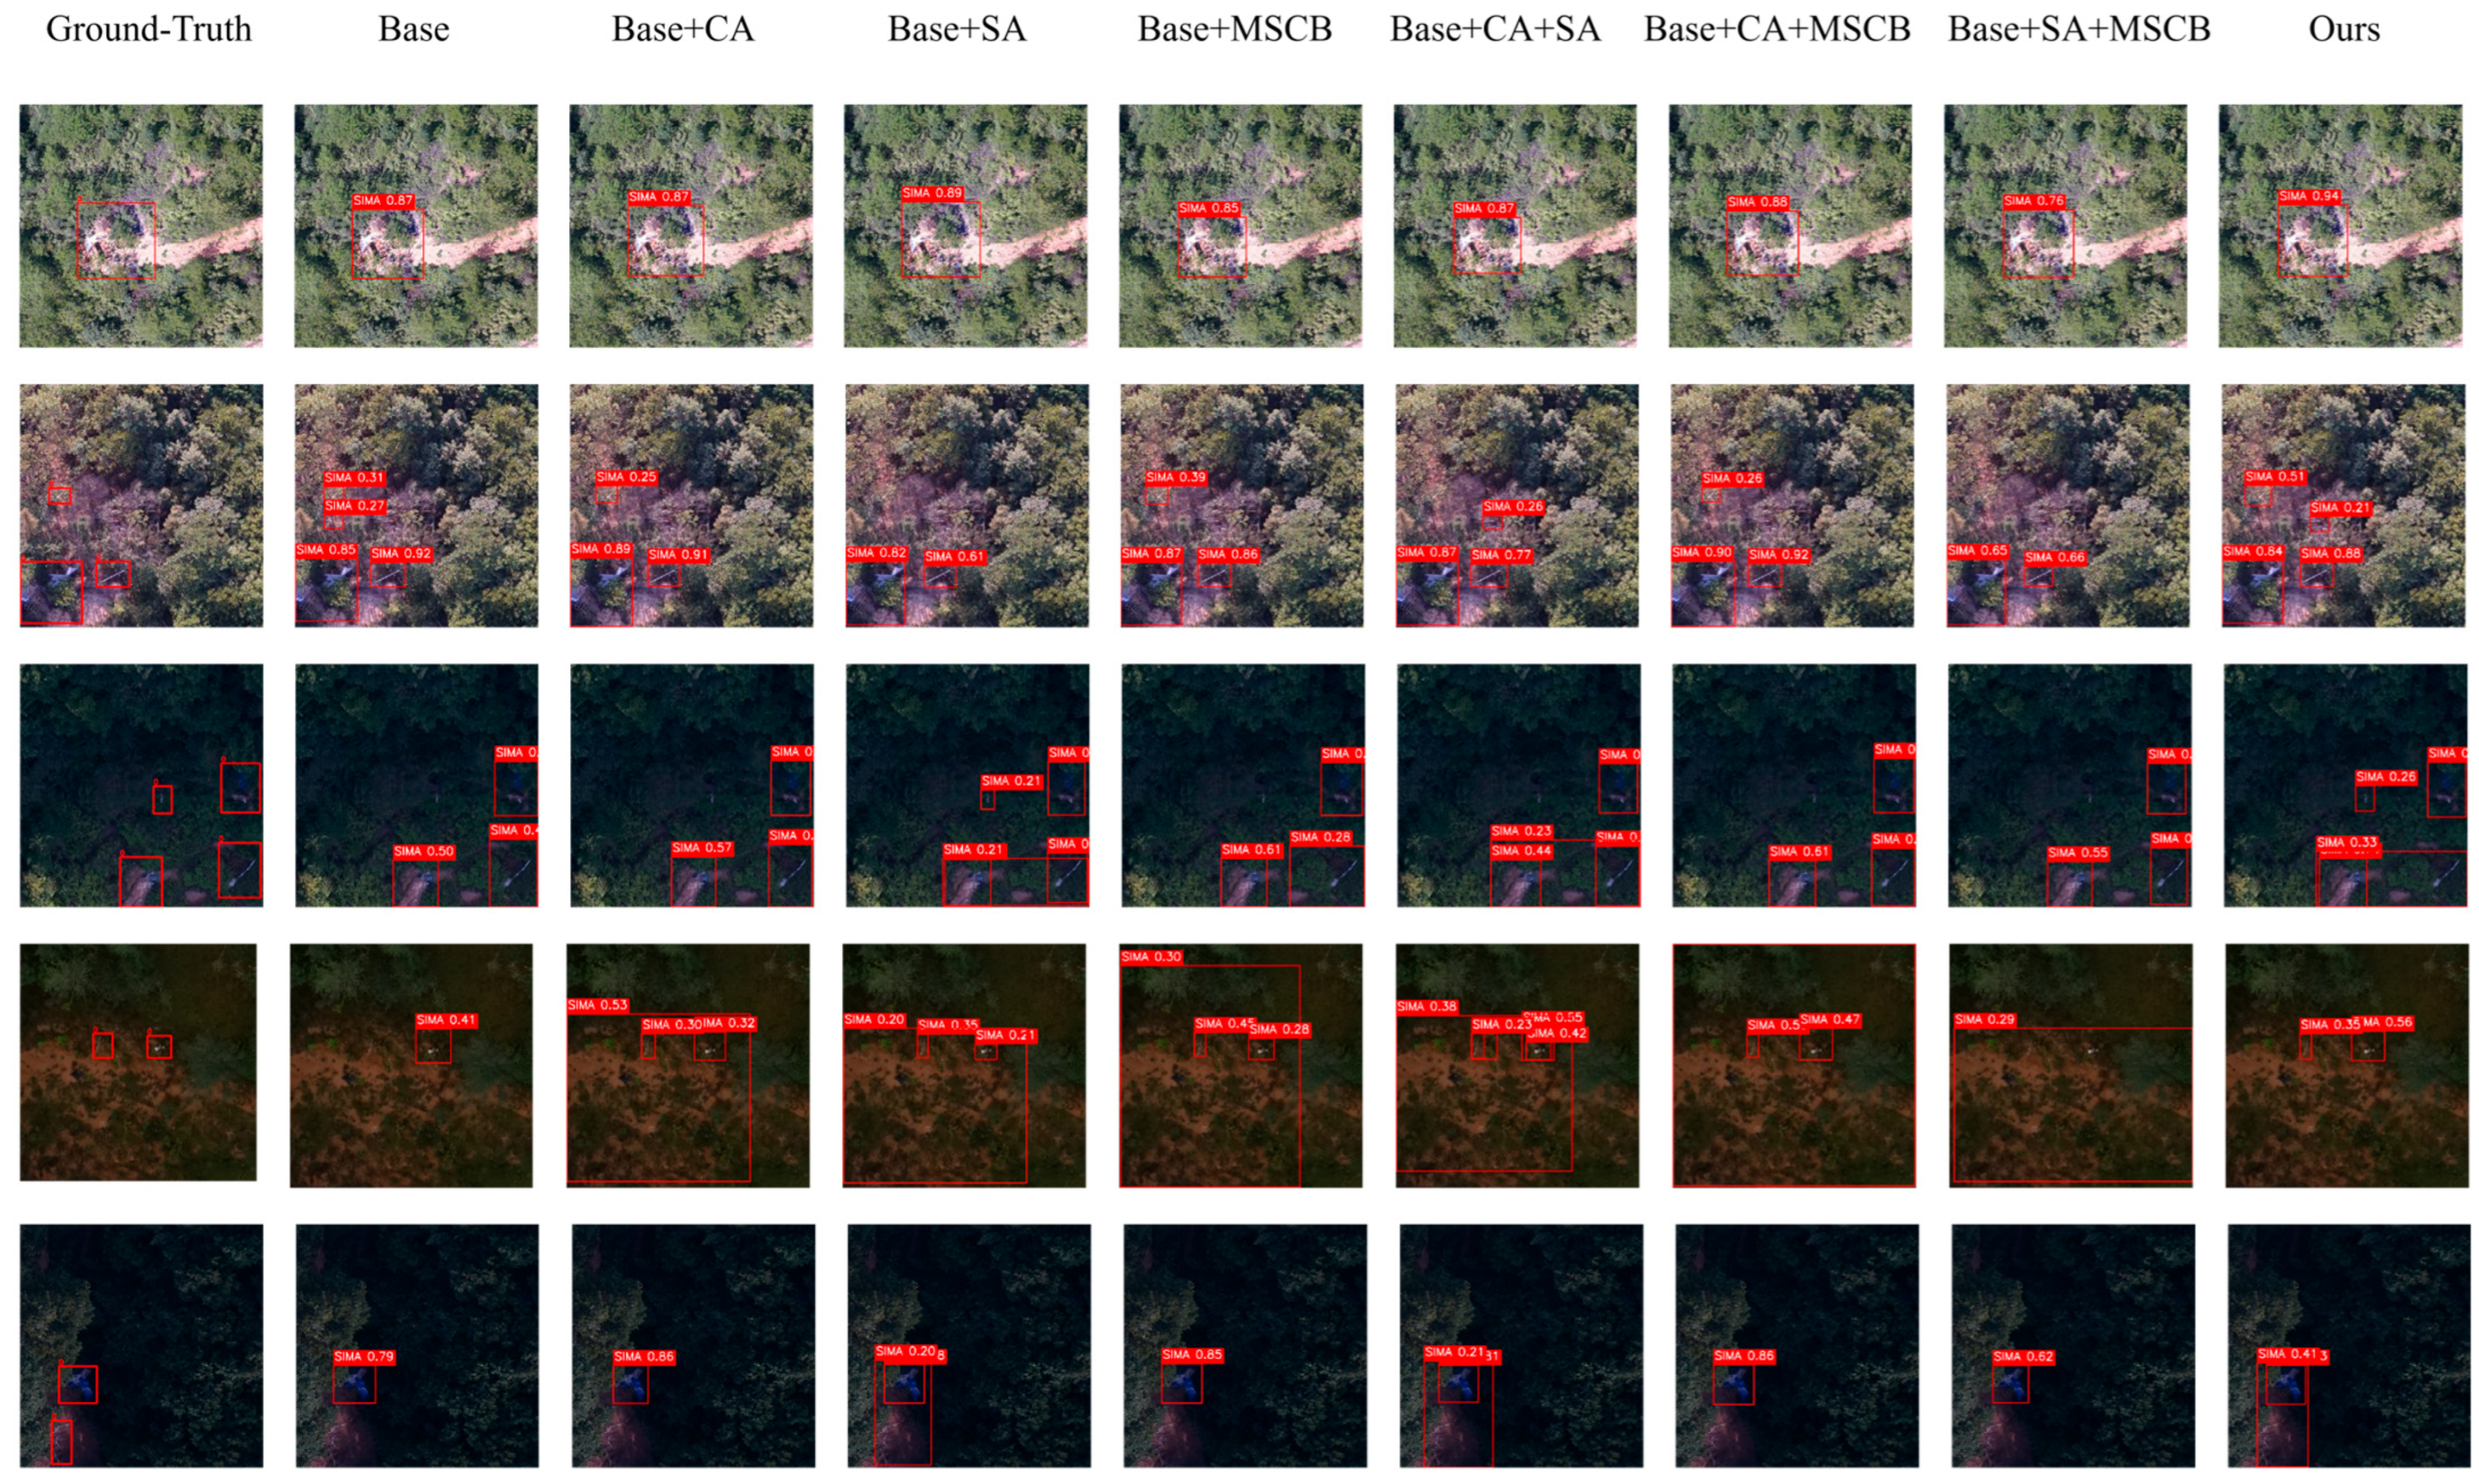
To assess the performance gains brought by MSCAM and its constituent blocks, we adopt YOLOv11m as the baseline (Base) and, with the dataset split, training scheme, and hyperparameters strictly fixed, incrementally introduce CA, SA, and MSCB and evaluate multiple module combinations in a controlled ablation setting. Table 4 reports the test-set results for all ablation variants in terms of m A P @0.5, m A P @0.5:0.95, Precision, Recall, and F1. Figure 7 provides qualitative detection visualizations for representative samples under each ablation configuration.
The results show that each standalone component yields gains, with improvements concentrated on different performance facets. Adding CA improves both Precision and Recall, implying that channel re-calibration enhances mining-relevant semantics, although the resulting m A P gains are less consistent. Incorporating SA leads to clear improvements in both m A P @0.5 and m A P @0.5:0.95—particularly under stricter IoU criteria—demonstrating that spatial saliency modeling enhances localization quality. When MSCB is introduced alone, m A P @0.5 and Precision increase noticeably, underscoring the benefit of multi-scale contextual modeling for mitigating cluttered-background interference. Overall, SA more strongly benefits localization under high-IoU evaluation, whereas MSCB provides a more pronounced boost in overall discriminative capability.
In the two-module settings, the components exhibit pronounced trade-offs. When only attention mechanisms are combined (CA + SA), overall performance degrades, indicating that attention stacking can become overly selective in the absence of multi-scale semantic/contextual support. CA + MSCB attains the highest Precision, but Recall decreases, reflecting a more conservative detector that favors precision over coverage. SA + MSCB improves localization to some extent; however, the reduced Recall means its overall performance does not exceed the baseline. Collectively, the findings indicate that gains are not additive in a linear manner; instead, the synergy (or interference) between modules plays a decisive role in overall performance.
When CA, SA, and MSCB are integrated into the full MSCAM (Ours), the model attains the best or near-best performance across metrics: relative to the baseline, m A P @0.5 and m A P @0.5:0.95 increase by 2.54 and 2.34 percentage points, respectively; Precision and Recall remain well balanced, and the F1 score reaches 79.92%. The findings suggest that MSCAM yields strong complementarity across channel-wise semantic enhancement, spatial saliency focusing, and multi-scale contextual modeling, jointly boosting accuracy, localization quality, and robustness in challenging rare-earth mining scenes.
Figure 7 visualizes the detection outcomes of different module configurations on typical rare-earth mining scenes, providing additional support for the quantitative conclusions. Overall, the baseline tends to miss targets or produce partially covering boxes in canopy-obscured, low-texture, and small-scale disturbance settings. After adding CA, false alarms decrease, but confidence scores for some targets remain unstable. Incorporating SA yields tighter box localization and higher spatial consistency with the disturbed areas, reflecting improved localization quality. With MSCB, multi-scale targets are detected more consistently, and background clutter (e.g., roads and bare ground) is more strongly suppressed. By contrast, the complete MSCAM (Ours) achieves more consistent results across challenging backgrounds, reducing false positives while mitigating misses; the predicted boxes align more closely with suspected illegal mining regions in both location and size, further indicating complementary and synergistic effects when the three components are integrated.

4.3. Application of the Proposed Model

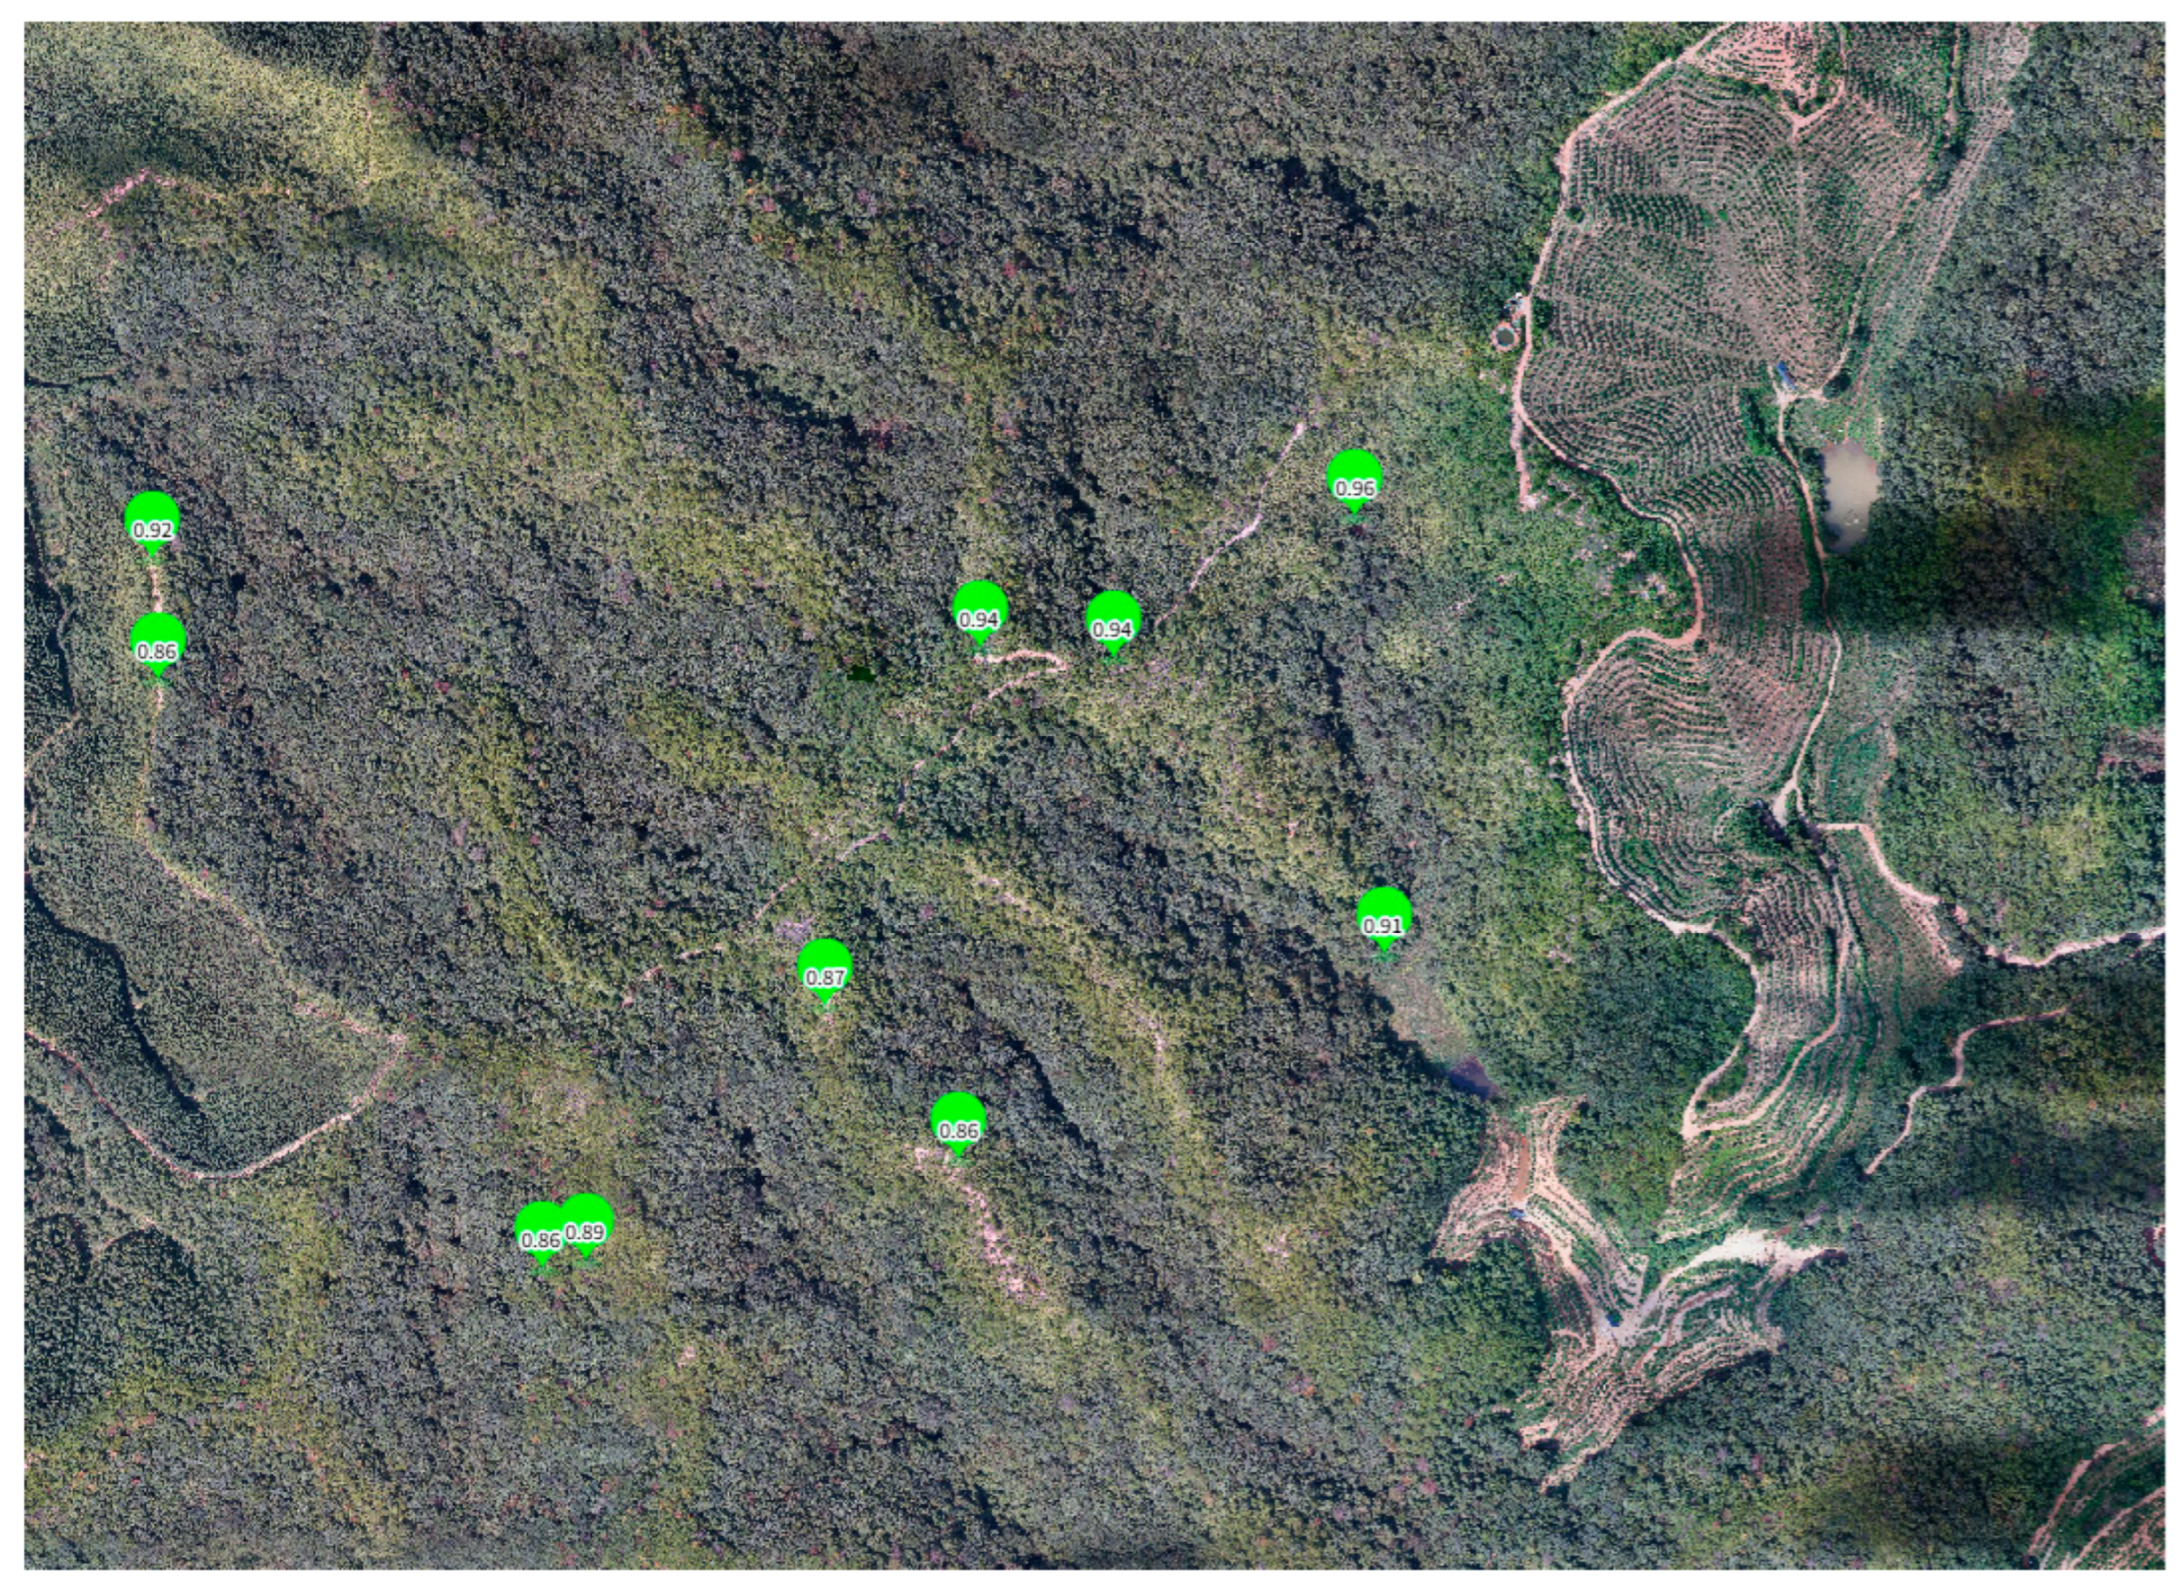
As illustrated in Figure 8, we deploy the trained YOLO11-MSCAM on large-scale UAV orthomosaics to conduct inference, thereby enabling rapid screening and georeferenced localization of suspected illegal mining disturbances in rare-earth mining districts. To accommodate the large spatial extent and heterogeneous backgrounds, inference is conducted in a sliding-window manner, and tile-level detections are re-projected and fused in the original coordinate frame to produce scene-wide outputs of target locations and confidence scores. Green markers in the figure indicate model-detected suspected sites, with the overlaid values representing prediction confidences, providing an intuitive proxy for the strength of evidence and the recommended priority for follow-up inspection. This scene-level output retains wide-area coverage while offering regulators a workflow from global scanning to prioritized hotspots, supporting subsequent targeted field checks and evidence collection.

5. Discussion

Based on high-resolution UAV imagery, we developed and validated an enhanced detector for suspected illegal mining targets in ion-adsorption rare-earth mining regions. Benchmark results indicate that, under the same dataset split and training/inference configuration, one-stage YOLO models generally provide a better accuracy–efficiency trade-off than the two-stage Faster R-CNN (ResNet-50) baseline, which is consistent with the operational need for fast screening in scenes with many small, fragmented targets and strong background clutter. Building on the YOLOv11m baseline, YOLO11-MSCAM consistently improves mAP@0.5, mAP@0.5:0.95, Precision, Recall, and F1 on the test set (Table 2). Notably, the gain in mAP@0.5:0.95—more sensitive to localization strictness—suggests improved geometric consistency for elongated or fragmented disturbed regions (e.g., pit margins, heap-leaching boundaries, and narrow access tracks) under complex mountainous–forested backgrounds.
Mechanistically, the ablation results clarify the roles and complementarities of MSCAM. CA recalibrates channel-wise semantics to strengthen disturbance-related responses while attenuating background redundancy; SA reinforces spatial saliency and benefits accurate localization and small-fragment detection; MSCB aggregates multi-scale context using multi-dilated depthwise separable convolutions, and promotes cross-scale interaction and information fidelity via channel shuffling and residual connections, helping suppress false responses and stabilize detection in cluttered scenes. We also observe that performance is not purely additive: naïvely stacking attention and/or multi-scale blocks may introduce redundancy and destabilize optimization. In contrast, the CA → SA → MSCB cascade establishes a coherent “semantic filtering–spatial focusing–multi-scale consolidation” pathway within the current topology, which is central to the stable improvements delivered by YOLO11-MSCAM.
From a practical perspective, YOLO11-MSCAM is designed to preserve the overall YOLOv11m detection pipeline while making a localized modification at the backbone–neck interface, where MSCAM replaces the original SPPF. Under a unified benchmarking setting (imgsz = 640, batch = 8, FP32, 1630 tiles), YOLO11-MSCAM has 19.67M parameters, 67.34 GFLOPs@640, and achieves 45.86 FPS (21.81 ms/image) (Table 3), indicating real-time/near-real-time throughput for tile-based screening in the developed prototype system. In the current implementation, large-area orthomosaics are processed by non-overlapping 640 × 640 sliding-window inference, and the system outputs candidate regions with confidence scores for subsequent verification. Therefore, rather than claiming a fully automated patrol workflow, our results support that the proposed method can facilitate UAV-based batch screening by prioritizing suspicious cues and reducing exhaustive manual review. Moreover, five-lens oblique imagery collected in parallel can strengthen post-detection verification and evidence gathering by providing complementary views of occluded structures and disturbance cues in mountainous–forested scenes.
Several limitations remain. First, edge-side latency on heterogeneous hardware platforms has not been fully benchmarked. Second, single-date detection is insufficient to describe disturbance persistence and temporal evolution. Future work will expand the dataset across regions and terrain settings and incorporate lightweight deployment strategies together with multi-temporal modeling to enhance generalization and operational readiness.

6. Conclusions

Suspected illegal mining units in ion-adsorption rare-earth districts are often small, fragmented, and highly confusable with bare ground, tracks, and shadows in UAV imagery, making generic detectors prone to both false alarms and missed detections. To address this “weak signature–strong clutter” scenario, we construct a UAV dataset (SIMA) using orthomosaic tiles and five-lens raw imagery (nadir + oblique views), and develop YOLO11-MSCAM by introducing a multi-scale convolution–attention design. The main conclusions are as follows:
(1)
Data support: In addition to UAV orthomosaics for large-area mapping, five-lens raw imagery (nadir + oblique views) is included as auxiliary training data and further supports post-detection verification/evidence collection by providing complementary views of disturbance cues in occluded mountainous–forested settings.
(2)
Methodology: YOLO11-MSCAM is built upon YOLOv11m by replacing the original SPPF with MSCAM at the backbone–neck junction. MSCAM cascades channel attention, spatial attention, and a multi-scale residual convolution block to enhance disturbance cues and aggregate context across receptive fields, improving robustness to small targets, fragmented boundaries, and confusable pseudo-targets.
(3)
Results: With the same dataset split and configuration, YOLO11-MSCAM yields stable gains over YOLOv11m across mAP@0.5, mAP@0.5:0.95, Precision, Recall, and F1 (80.70/55.95/81.00/74.04/77.36 → 83.24/58.29/85.54/75.00/79.92, all in %; Table 2). In particular, it improves mAP@0.5 by +2.54 percentage points (80.70% → 83.24%) and mAP@0.5:0.95 by +2.34 percentage points (55.95% → 58.29%) over YOLOv11m, and it also surpasses the strongest baseline on mAP@0.5:0.95 (YOLOv9m, 57.36%) by +0.93 percentage points. Under a unified efficiency benchmark, YOLO11-MSCAM achieves 45.86 FPS on 640 × 640 tiles with 19.67M parameters and 67.34 GFLOPs@640 (Table 3), supporting non-overlapping tile-based batch screening in the developed prototype system by producing prioritized suspicious cues for follow-up verification.
Overall, the results demonstrate the value of multi-view data support and confirm the effectiveness of coupling multi-scale convolution with attention modeling for suspected illegal mining detection in ion-adsorption rare-earth districts. Future work will primarily expand the dataset by collecting additional UAV campaigns across more sites and time points, with an emphasis on cross-year acquisitions under matched seasons/time windows (e.g., September–November) to reduce pseudo-changes caused by phenology and illumination. On this basis, we will explore matched-season multi-temporal analysis by comparing georeferenced detection outputs across years and emphasizing spatially coherent and persistent changes to better characterize disturbance evolution and persistence.

Author Contributions

Conceptualization, methodology, supervision, and writing—review and editing, H.L.; experiment construction, method implementation, software, and writing—original draft, Y.C.; results calibration, formal analysis, and validation, S.N.; investigation and data curation, K.L. All authors have read and agreed to the published version of the manuscript.

Funding

This research was funded by the Key Program of the Natural Science Foundation of Jiangxi Province, grant number 20232ACB203025; and the Jiangxi Provincial Bureau of Geology Youth Science and Technology Leaders Training Program Project, grant number 2024JXDZKJRC07.

Data Availability Statement

The original contributions presented in this study are included in the article. Due to the strategic sensitivity of rare-earth mining activities and the regulatory/evidence nature of the UAV imagery, the SIMA dataset is not publicly available. The data may be made available for non-commercial academic research upon reasonable request to the corresponding author, subject to a data-use agreement (e.g., no redistribution and compliant use; sensitive geolocation information can be removed when applicable). To support reproducibility, the manuscript provides detailed dataset statistics, labeling protocol, and the unified training/inference configuration.

Conflicts of Interest

The authors declare no conflicts of interest.

References

  1. Jowitt, S.M.; Werner, T.T.; Weng, Z.; Mudd, G.M. Recycling of the rare earth elements. Curr. Opin. Green Sustain. Chem. 2018, 13, 1–7. [Google Scholar] [CrossRef] [Scilit]
  2. Massari, S.; Ruberti, M. Rare earth elements as critical raw materials: Focus on international markets and future strategies. Resour. Policy 2012, 38, 36–43. [Google Scholar] [CrossRef] [Scilit]
  3. Goodenough, K.M.; Wall, F.; Merriman, D. The rare Earth elements: Demand, global resources, and challenges for resourcing future generations. Nat. Resour. Res. 2017, 27, 201–216. [Google Scholar] [CrossRef] [Scilit]
  4. Xu, F.; Li, H.; Li, Y. Ecological environment quality evaluation and evolution analysis of a rare earth mining area under different disturbance conditions. Environ. Geochem. Health 2020, 43, 2243–2256. [Google Scholar] [CrossRef] [Scilit]
  5. Fonseca, A.; Marshall, M.T.; Salama, S. Enhanced Detection of Artisanal Small-Scale Mining with Spectral and Textural Segmentation of Landsat Time Series. Remote Sens. 2024, 16, 1749. [Google Scholar] [CrossRef] [Scilit]
  6. Chen, H.B.; Chen, H.M.; Chen, Z.B.; Chen, Z.Q. The ecological impacts of residues from the heap leaching of ion-adsorption rare earth clays. Int. J. Environ. Sci. Technol. 2023, 20, 13267–13276. [Google Scholar] [CrossRef] [Scilit]
  7. Jiang, Y.; Li, H.; Zhang, Z.; Ren, G.; Zhang, J. Enhancing ecological sustainability in ion-adsorption rare earth mining areas: A multi-scale model for assessing spatiotemporal dynamics and ecological resilience. Ecol. Model. 2025, 502, 111038. [Google Scholar] [CrossRef] [Scilit]
  8. Zhao, L.; Niu, R.; Li, B.; Chen, T.; Wang, Y. Application of improved instance segmentation algorithm based on VOVNET-V2 in Open-PIT mines Remote Sensing Pre-Survey. Remote Sens. 2022, 14, 2626. [Google Scholar] [CrossRef] [Scilit]
  9. Xie, L.; Wu, W.; Huang, X.; Ou, P.; Lin, Z.; Zhiling, W.; Song, Y.; Lang, T.; Huangfu, W.; Zhang, Y.; et al. Mining and Restoration Monitoring of rare earth element (REE) exploitation by new remote sensing indicators in southern Jiangxi, China. Remote Sens. 2020, 12, 3558. [Google Scholar] [CrossRef] [Scilit]
  10. Ren, H.; Zhao, Y.; Xiao, W.; Hu, Z. A review of UAV monitoring in mining areas: Current status and future perspectives. Int. J. Coal Sci. Technol. 2019, 6, 320–333. [Google Scholar] [CrossRef] [Scilit]
  11. Booysen, R.; Jackisch, R.; Lorenz, S.; Zimmermann, R.; Kirsch, M.; Nex, P.A.M.; Gloaguen, R. Detection of REEs with lightweight UAV-based hyperspectral imaging. Sci. Rep. 2020, 10, 17450. [Google Scholar] [CrossRef] [Scilit] [PubMed]
  12. Meng, X.; Zhang, D.; Dong, S.; Yao, C. Open-Pit granite mining area extraction using UAV aerial images and the novel GIPNET. Remote Sens. 2024, 16, 789. [Google Scholar] [CrossRef] [Scilit]
  13. Park, S.; Choi, Y. Applications of Unmanned Aerial Vehicles in Mining from Exploration to Reclamation: A Review. Minerals 2020, 10, 663. [Google Scholar] [CrossRef] [Scilit]
  14. Aicardi, I.; Chiabrando, F.; Grasso, N.; Lingua, A.M.; Noardo, F.; Spanò, A. UAV photogrammetry with oblique images: First analysis on data acquisition and processing. Int. Arch. Photogramm. Remote Sens. Spat. Inf. Sci. 2016, XLI-B1, 835–842. [Google Scholar] [CrossRef] [Scilit]
  15. Zhu, X.X.; Tuia, D.; Mou, L.; Xia, G.; Zhang, L.; Xu, F.; Fraundorfer, F. Deep Learning in Remote Sensing: A comprehensive review and list of resources. IEEE Geosci. Remote Sens. Mag. 2017, 5, 8–36. [Google Scholar] [CrossRef] [Scilit]
  16. Zhang, L.; Wang, L.; Jin, M.; Geng, X.; Shen, Q. Small object detection in remote sensing images based on attention mechanism and multi-scale feature fusion. Int. J. Remote Sens. 2022, 43, 3280–3297. [Google Scholar] [CrossRef] [Scilit]
  17. Qu, J.; Tang, Z.; Zhang, L.; Zhang, Y.; Zhang, Z. Remote sensing small object detection network based on attention mechanism and Multi-Scale Feature fusion. Remote Sens. 2023, 15, 2728. [Google Scholar] [CrossRef] [Scilit]
  18. Wei, X.; Li, Z.; Wang, Y. SED-YOLO based multi-scale attention for small object detection in remote sensing. Sci. Rep. 2025, 15, 3125. [Google Scholar] [CrossRef] [Scilit] [PubMed]
  19. Wan, D.; Lu, R.; Wang, S.; Shen, S.; Xu, T.; Lang, X. YOLO-HR: Improved YOLOV5 for object Detection in High-Resolution Optical Remote Sensing Images. Remote Sens. 2023, 15, 614. [Google Scholar] [CrossRef] [Scilit]
  20. Deng, T.; Liu, X.; Mao, G. Improved YOLOV5 based on hybrid domain attention for small object detection in optical remote sensing images. Electronics 2022, 11, 2657. [Google Scholar] [CrossRef] [Scilit]
  21. Qu, J.; Liu, T.; Tang, Z.; Duan, Y.; Yao, H.; Hu, J. Remote sensing small object detection network based on Multi-Scale feature extraction and information fusion. Remote Sens. 2025, 17, 913. [Google Scholar] [CrossRef] [Scilit]
  22. Su, Z.; Yu, J.; Tan, H.; Wan, X.; Qi, K. MSA-YOLO: A remote sensing object detection model based on Multi-Scale Strip Attention. Sensors 2023, 23, 6811. [Google Scholar] [CrossRef] [Scilit] [PubMed]
  23. Yang, Y.; Feng, F.; Liu, G.; Di, J. MEL-YOLO: A novel YOLO network with Multi-Scale, effective, and lightweight methods for small object detection in aerial images. IEEE Access 2024, 12, 194280–194295. [Google Scholar] [CrossRef] [Scilit]
  24. Xu, Z.; Zhao, H.; Liu, P.; Wang, L.; Zhang, G.; Chai, Y. SRTSOD-YOLO: Stronger Real-Time Small Object Detection Algorithm based on improved YOLO11 for UAV imageries. Remote Sens. 2025, 17, 3414. [Google Scholar] [CrossRef] [Scilit]
  25. He, L.; Zhou, Y.; Liu, L.; Cao, W.; Ma, J. Research on object detection and recognition in remote sensing images based on YOLOv11. Sci. Rep. 2025, 15, 14032. [Google Scholar] [CrossRef] [Scilit]
  26. Bakirci, M.; Dmytrovych, P.; Bayraktar, I. Multi-class vehicle detection and classification with YOLO11 on UAV-captured aerial imagery. In Proceedings of the 2024 IEEE 7th International Conference on Actual Problems of Unmanned Aerial Vehicles Development (APUAVD), Kyiv, Ukraine, 22–24 October 2024. [Google Scholar]
  27. He, X.; Liang, K.; Zhang, W.; Li, F.; Jiang, Z.; Zuo, Z.; Tan, X. DETR-ORD: An Improved DETR Detector for Oriented Remote Sensing Object Detection with Feature Reconstruction and Dynamic Query. Remote Sens. 2024, 16, 3516. [Google Scholar] [CrossRef] [Scilit]
  28. Zhang, H.; Ma, Z.; Li, X. RS-DETR: An improved remote sensing object detection model based on RT-DETR. Appl. Sci. 2024, 14, 10331. [Google Scholar] [CrossRef] [Scilit]
  29. Tao, J.; Deng, Y.; Ye, D.; Chen, B.; Zhou, Y.; Zhong, J.; Wang, X.; Wang, W. Fine exploration and green development of ion-adsorption type REE deposits in South China using multi-geophysical technology. Front. Earth Sci. 2025, 13, 1489870. [Google Scholar] [CrossRef] [Scilit]
  30. Barnes, C. International Perspectives on Mining Rare earths: A Case Study in the Southern Jiangxi Province, China; University of Cambridge: Cambridge, UK, 2020. [Google Scholar]
  31. Luo, J.; Chen, X.; Bi, C.; Zhou, K.; Lin, J.; Zhang, Q. Effects of in-situ leaching process on spatial distribution of soil properties in ion-type rare earth mines. Microchem. J. 2025, 215, 114228. [Google Scholar] [CrossRef] [Scilit]
Figure 1. Overall architecture of the proposed model.
Remotesensing 18 00738 g001
Figure 2. Architecture of the channel attention (CA) module.
Remotesensing 18 00738 g002
Figure 3. Architecture of the spatial attention (SA) module.
Remotesensing 18 00738 g003
Figure 4. Architecture of the multi-scale convolutional residual block (MSCB).
Remotesensing 18 00738 g004
Figure 5. Study-area overview showing the location, imagery sources, and representative samples of suspected illegal mining. (a) The geographic location of the study area in China and within Jiangxi Province. (b) The spatial distribution of UAV acquisition sites and licensed mining-right boundaries across Ganzhou City. Red arrows denote the spatial zoom-in linkage from the national extent to the study area. (c) UAV orthorectified mosaic of the study area, highlighting land-surface features against a mountainous geomorphic backdrop. (d) Typical scenes acquired by five-lens oblique photogrammetry, including nadir and multi-directional oblique perspectives. (eg) Local enlargements of typical suspected illegal mining areas, where red boxes mark the manually annotated targets.
Remotesensing 18 00738 g005
Figure 6. Qualitative results for different models in comparison. Red boxes indicate model-predicted bounding boxes (shown as produced by each detector); occasional overlaps reflect dense/cluttered scenes and do not affect interpretation.
Remotesensing 18 00738 g006
Figure 7. Qualitative results for individual modules and module combinations. Red boxes indicate model-predicted bounding boxes (shown as produced by each detector); occasional overlaps reflect dense/cluttered scenes and do not affect interpretation.
Remotesensing 18 00738 g007
Figure 8. Intelligent detection and visualization example for illegal rare-earth mining. Green markers denote detected suspected sites, and the overlaid numbers indicate the corresponding confidence scores.
Remotesensing 18 00738 g008
Table 1. Tile- and instance-level statistics of the SIMA dataset (640 × 640 tiles).
StatisticTrainingValidationTest
Images(tiles)1320147 163
Instances1737184213
Avg instances/tile1.321.251.31
Table 2. Quantitative comparison among different models.
mAP@0.5mAP@0.5:0.95PrecisionRecallF1Score
Yolov5m79.6954.5285.5668.5476.11
Yolov6m80.9356.9683.5469.9576.14
Yolov8m80.4155.6274.4674.1874.32
Yolov9m80.3857.3682.0371.8376.59
Yolov10m69.9246.9468.1962.3965.16
Yolov11m80.7055.9581.0074.0477.36
Faster R-CNN (ResNet-50)59.2032.4934.2371.8346.37
Ours83.2458.2985.5475.0079.92
Note: All metrics are reported in percentage (%).
Table 3. Model size and inference speed under a unified setting (imgsz = 640, batch = 8, FP32, 1630 images).
ModelParams (M)GFLOPs@640FPSms/img
YOLOv5m25.0763.9655.3118.08
YOLOv6m52.00160.2039.0925.58
YOLOv8m25.8678.6949.5620.18
YOLOv9m20.1677.0146.7121.41
YOLOv10m16.4963.4150.1919.92
YOLOv11m20.0567.6542.5523.50
Faster R-CNN (ResNet-50)28.28507.487.17139.43
YOLO11-MSCAM (Ours)19.6767.3445.8621.81
Note: The “m” suffix is not standardized across different YOLO families; thus, parameter counts can differ substantially. We report measured Params and FPS under the same settings for transparency.
Table 4. Quantitative comparison across module configurations.
mAP@0.5mAP@0.5:0.95PrecisionRecallF1Score
Base80.7055.9581.0074.0477.36
Base + CA79.9354.3982.5475.4778.85
Base + SA81.6957.8381.7575.6978.60
Base + MSCB82.2056.4084.4774.0678.92
Base + CA + SA78.5554.6983.6372.7777.82
Base + CA + MSCB82.7157.7987.3772.3079.12
Base + SA + MSCB80.2356.5181.6470.4275.62
Ours83.2458.2985.5475.0079.92
Note: All metrics are reported in percentage (%).
Disclaimer/Publisher’s Note: The statements, opinions and data contained in all publications are solely those of the individual author(s) and contributor(s) and not of MDPI and/or the editor(s). MDPI and/or the editor(s) disclaim responsibility for any injury to people or property resulting from any ideas, methods, instructions or products referred to in the content.