Article

How Much Uncertainty Does the Tower Create in Tower-Based Albedo Observations?

1
State Key Laboratory of Remote Sensing and Digital Earth, Faculty of Geographical Science, Beijing Normal University, Beijing 100875, China
2
Satellite Application Center for Ecology and Environment, Ministry of Ecology and Environment, Beijing 100094, China
*
Author to whom correspondence should be addressed.
Remote Sens. 2026, 18(4), 631; https://doi.org/10.3390/rs18040631
Submission received: 25 December 2025 / Revised: 5 February 2026 / Accepted: 14 February 2026 / Published: 17 February 2026

Highlights

What are the main findings?
  • Towers increase uncertainty through their reflective properties.
  • The uncertainty created by the tower in the Saihanba region is negligible because of its reflective properties.
What are the implications of the main findings?
  • This study provides the first systematic quantification of the impact of towers on albedo observations.

Abstract

Towers often have complex structures and higher reflectances than the surrounding surfaces. To identify the uncertainty of the tower in tower-based albedo observations, a combined approach involving simulation and field observations was applied to three newly constructed towers in the Saihanba region. The simulation results demonstrate that tower presence influenced the albedo measurements, with the impact primarily controlled by tower reflectance rather than sensor height. When the tower-body albedo markedly differs from the background, systematic correction is necessary. Field validation indicates that for the towers in the Saihanba region, the contrast in albedo between the tower and the surrounding background is small, and both the simulated and observed albedos agree well with the ground measurements, with differences below 0.0075. By identifying when and how tower structures distort albedo observations, this study enhances confidence in ground-based validation and provides practical guidance for future tower design and material selection.

1. Introduction

Land surface albedo, defined as the ratio of reflected to incident shortwave radiation across the hemispherical space, is a key parameter in the Earth’s surface radiation budget [1]. In recent years, numerous remote sensing-based albedo products have been developed [2,3,4,5,6] and extensively applied in a variety of research domains, particularly in the field of global climate change [7,8,9,10]. However, these products are inherently subject to uncertainties arising from systematic errors during satellite data acquisition and model inaccuracies within albedo inversion algorithms [11]. Given that surface albedo plays a critical role in modulating the distribution and balance of solar radiation at the Earth’s surface, even minor uncertainties or variations can result in substantial discrepancies in radiation budget estimations [12]. Therefore, to minimize the propagation of such errors in subsequent applications, rigorous validation of surface albedo products is essential prior to their scientific use.
A commonly used approach for validating albedo products is to directly employ in situ measurements as reference values. This method is based on the assumption that the land surface within a coarse-resolution pixel is sufficiently homogeneous such that a single in situ observation can represent the entire pixel. It was widely adopted in early validation studies of albedo products [13,14,15,16,17]. However, owing to the inherent complexity and heterogeneity of land surfaces, the assumption of surface uniformity often fails to resolve the “point-to-pixel” scale mismatch problem, thereby limiting the accuracy of validation.
To overcome this challenge, two alternative validation strategies have been developed. The first involves pre-assessing the spatial representativeness of in situ measurements and selecting those observations that accurately reflect the footprint of coarse-resolution pixels for validation [18,19,20,21,22,23]. While this method is currently widely applied, it substantially restricts the number of usable in situ sites. The second strategy introduces high spatial resolution data as an intermediary to facilitate scale conversion between in situ observations and satellite-derived products [24,25]. This approach effectively mitigates errors arising from scale mismatches and is particularly suitable for heterogeneous regions; however, it may introduce additional uncertainties into the validation process [11]. As an alternative to relying on a single observation point, increasing the number of in situ measurements within a single pixel has also been proposed to improve representativeness [26,27]. Nevertheless, owing to the high costs associated with site installation and maintenance, this approach has been implemented in only a limited number of studies.
Building on these methodological developments, all the aforementioned validation strategies ultimately rely, either directly or indirectly, on ground-based albedo measurements. These measurements are typically obtained through three main approaches. The first involves sparse observation networks in which only a single station exists within a coarse-resolution pixel, such as the Baseline Surface Radiation Network (BSRN) [28], the Surface Radiation Budget Network (SURFRAD) [29], the Atmospheric Radiation Measurement (ARM) [30], and some local Automatic Weather Station (AWS) sites [14,15]. These networks were originally established to monitor meteorological variables and validate satellite-derived radiation budgets. FLUXNET [31] also belongs to this category but provides more comprehensive flux observations, capturing daily, seasonal, and interannual variations in CO2, water vapor, and energy fluxes across global ecosystems. The second approach employs small-scale dense observation networks that are often established for specific experimental purposes, such as the Heihe Watershed Allied Telemetry Experimental Research (HiWATER) network [32] and Huailai Wireless Sensor Networks (WSN) [27]. These networks are generally designed on the basis of optimal sampling principles, with pyranometers installed at fixed locations; because of their targeted objectives, they typically deploy only one type of instrument, and the towers are built at relatively low heights to minimize costs. Finally, mobile albedo measurements represent a flexible and cost-effective alternative and are usually conducted in specific regions of interest [24,26]. Such measurements are typically performed using pyranometers mounted on tripods, although in some cases, ground albedo is derived from bidirectional reflectance factor (BRF) measurements collected with multiangle observation systems. In summary, despite the availability of dense or mobile measurements, sparse observation networks remain the most widely used source of reference data for albedo validation because of their cost-effectiveness and continuity of long-term records.
While considerable efforts have been made to reconcile the scale mismatch between satellite and ground measurements, relatively little attention has been given to the accuracy and reliability of ground observations themselves. Ground-based albedo data are widely considered benchmarks for validation, under the assumption that once systematic and random errors are corrected, they represent the true surface albedo within the instrument’s footprint. Systematic biases—caused by instrument design or configuration—can typically be addressed through calibration, whereas random errors can be reduced by standardizing measurement protocols or averaging parallel observations.
However, a potentially overlooked source of uncertainty lies in the structural characteristics of observation platforms. Driven by the need for multi-instrument integration, wider observational footprints, and safety considerations, modern observational infrastructure—particularly at FLUXNET sites—often consists of tall, self-supporting towers. Pyranometers mounted on these towers capture hemispherical upward radiation that includes not only the natural landscape but also the tower itself. As a result, the observed reflectance becomes a mixed signal composed of both surface and structural contributions. Given the inherent spectral differences between artificial materials and natural surfaces, the albedo derived from such mixed observations may deviate from the true land surface albedo. This potential deviation highlights the need for a closer examination of how observation tower structures influence surface albedo measurements—an aspect that remains insufficiently addressed in current validation practices.
To address this issue, the present study focuses on newly constructed self-supporting observation towers in the Saihanba region of Hebei Province, China, where large-scale ecological monitoring infrastructure was established in 2021. Owing to their considerable size and higher reflectance relative to the surrounding landscape, these towers have the potential to interfere with surface albedo measurements. In particular, their structural and spectral characteristics may introduce systematic bias into the observed upward shortwave radiation, thereby affecting the reliability of ground-based albedo reference data.
Given the limited availability of extensive field measurements, a combined approach that integrates field observations with simulated data is employed to assess the extent of tower-induced impacts. This strategy helps to overcome data scarcity while ensuring both practicality and analytical rigor. Specifically, three observation towers in the Saihanba region are selected as case studies to examine the magnitude and conditions under which structural interference alters albedo measurements. Through this investigation, the aim of this study is to quantify the influence of tower structures on ground-based albedo estimates and provide guidance for future observatory design and data interpretation in validation workflows.

2. Materials and Methods

2.1. Research Area

Saihanba is located in the northern part of Weichang Manchu and Mongolian Autonomous county, Chengde city, Hebei Province, China (42°10′–42°40′N, 116°50′–117°20′E), with an average elevation of approximately 1500 m. Located on the southern edge of the Yinshan Mountains, it forms a transitional zone between the Inner Mongolia Plateau and the North China Plain. The terrain is predominantly hilly and interspersed with mountainous areas. The soils are mainly dark brown and meadow types, characterized by shallow profiles and low permeability.
The region experiences a cold-temperate, semihumid monsoon climate, with an average annual temperature of approximately 1.4 °C. Saihanba represents a typical ecotone of coniferous forest and meadow ecosystems, with forest coverage exceeding 80%. The dominant vegetation types include artificial plantations, natural secondary forests, meadows, and shrubs, with larch and pine being the primary tree species. Saihanba functions as a critical ecological barrier in northern China and plays an essential role in soil and water conservation, windbreak and sand fixation, and biodiversity protection. Its success in ecological restoration also offers valuable references for global desertification control and ecosystem rehabilitation.
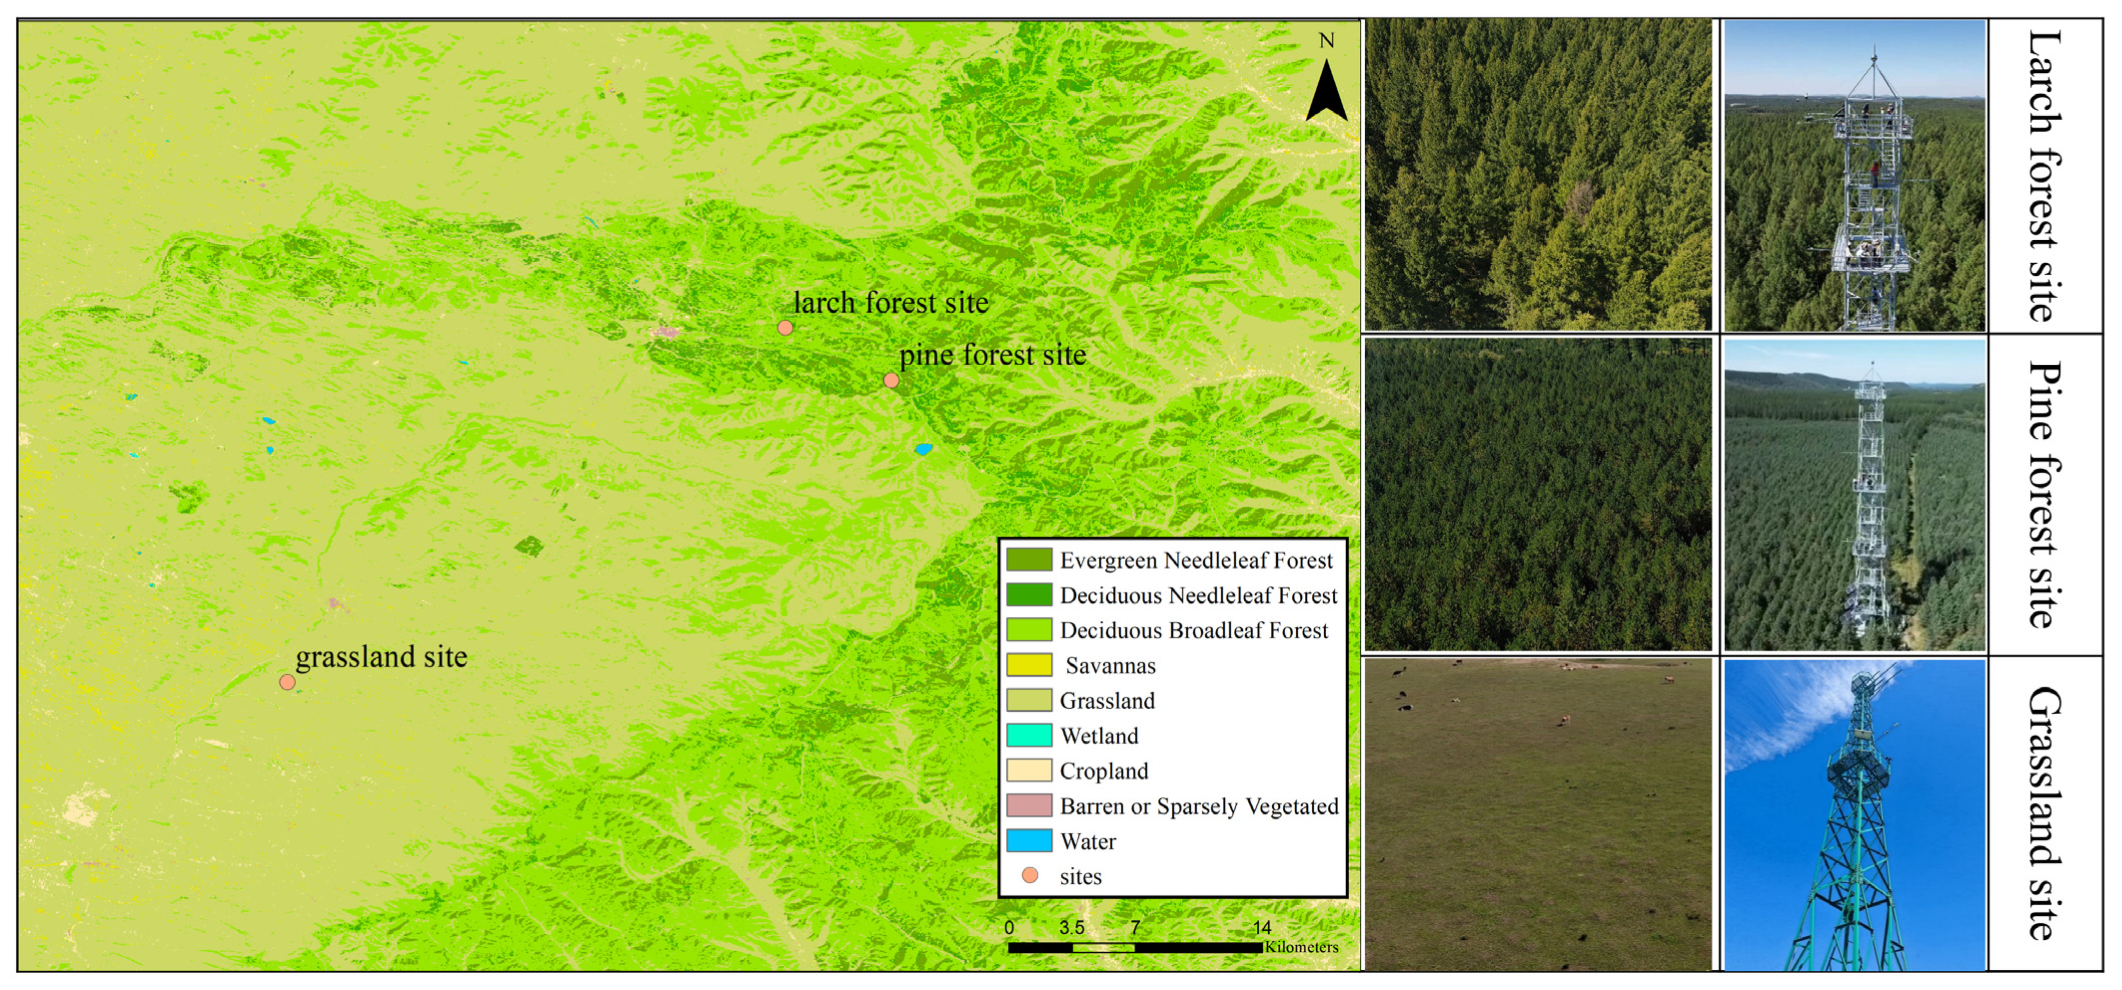
Given the ecological importance and heterogeneous surface characteristics of the region, three representative observation towers located in areas characterized by distinct land cover types, namely, a meadow, a larch forest, and a pine forest, were selected in this study. All the towers are self-supporting steel structures. The towers in the larch and pine forests are identical in structure, standing 40 m tall and painted white, whereas the tower in the meadow area is 20 m in height and painted green (Figure 1 and Table 1).

2.2. Site Data

Owing to the limited number of sites in the Saihanba region, AmeriFlux sites were included to improve the representativeness of the study.
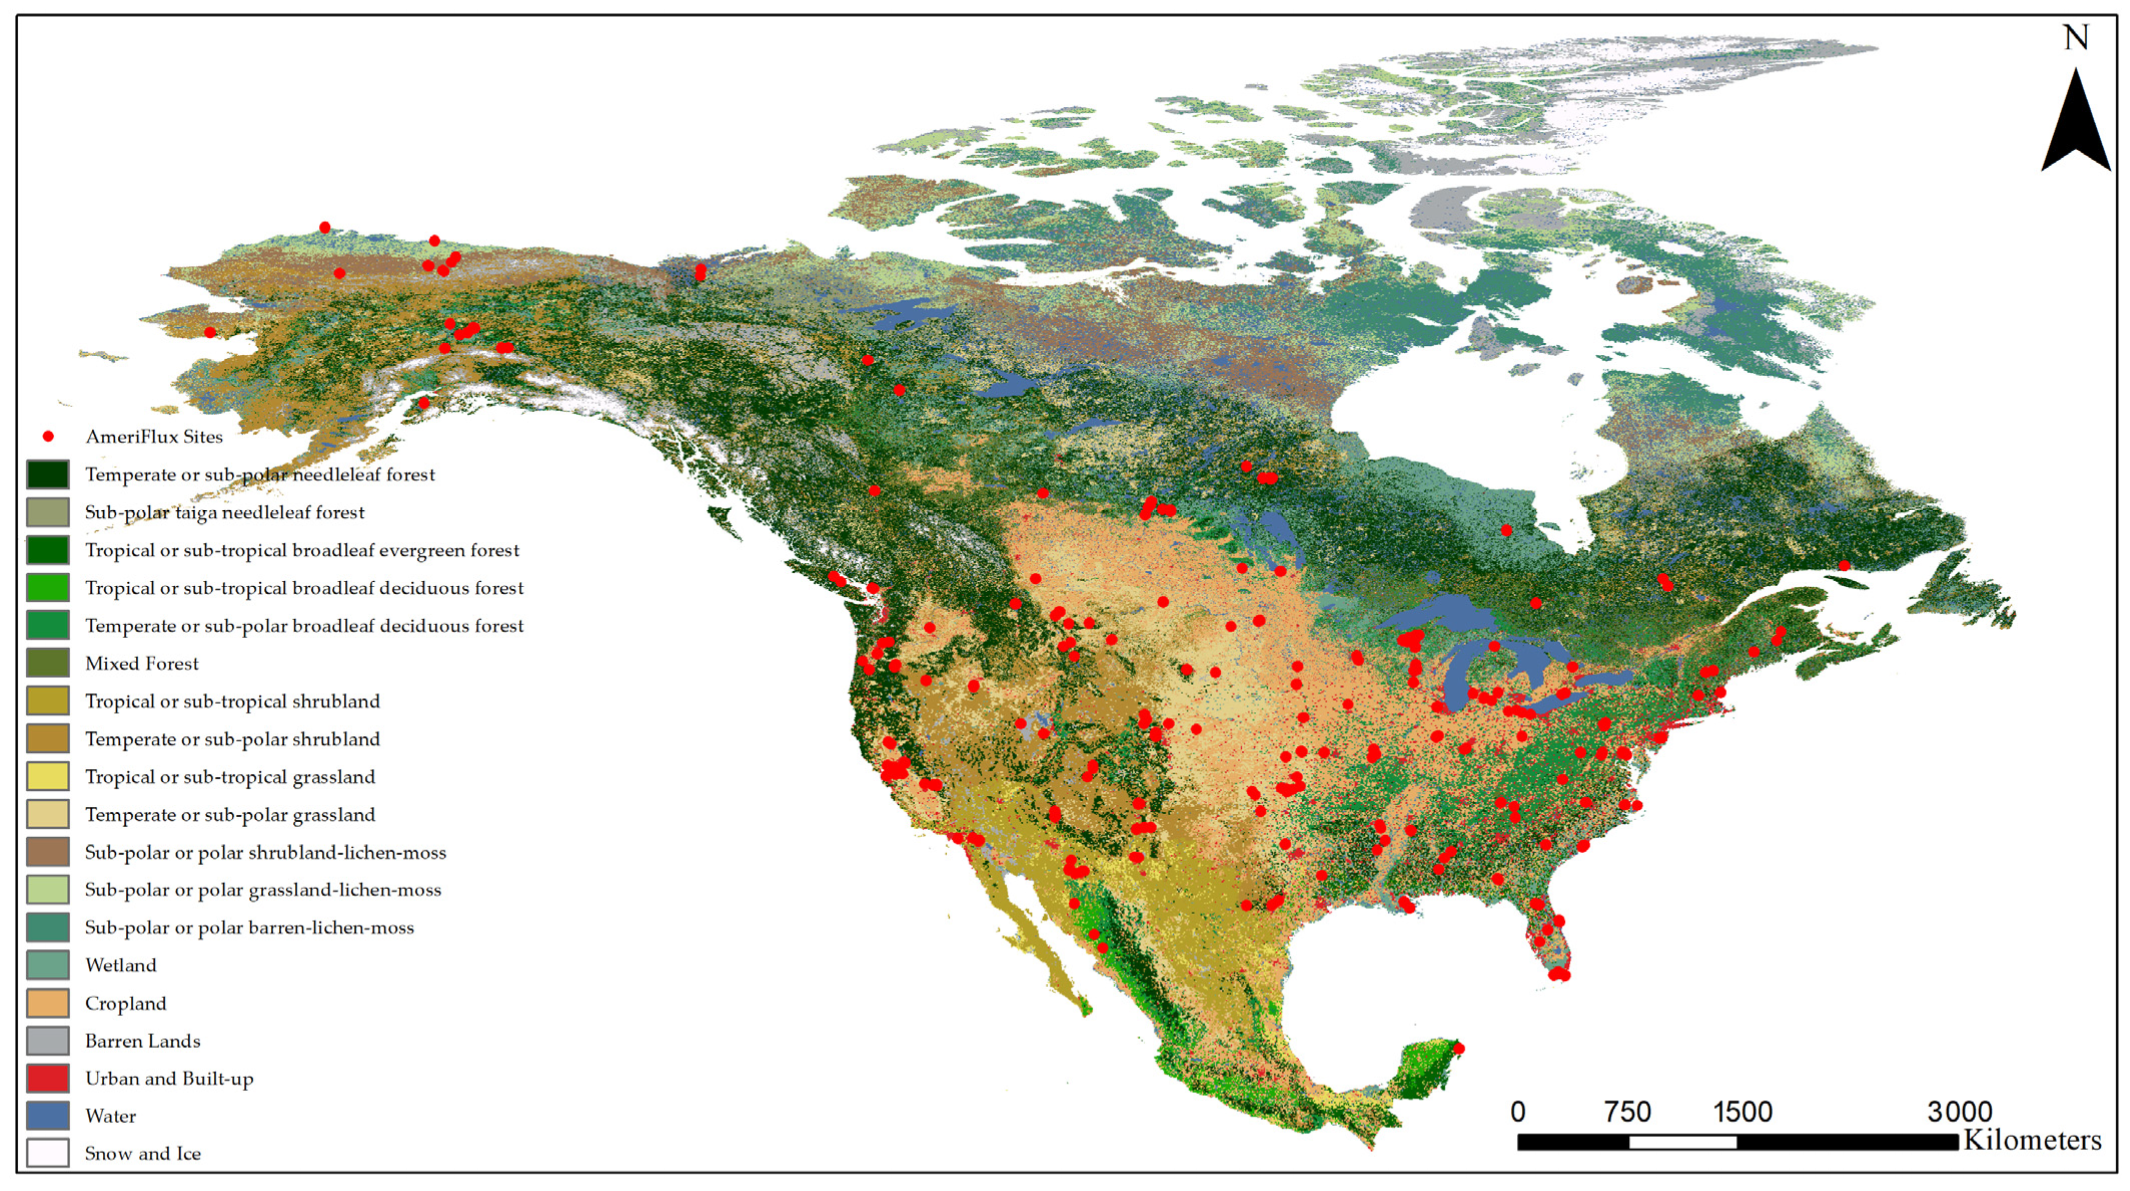
The AmeriFlux network, initiated by the U.S. Department of Energy in 1996, is a PI-driven consortium of flux sites across North, Central, and South America. The standardized datasets provided by AmeriFlux, including long-term ecosystem-scale measurements of carbon, water, energy exchange, and surface radiation parameters, are among the most widely used datasets worldwide because of their particular value for investigating land–atmosphere interactions and ecosystem responses to climate change. Since its early stage, with approximately 15 sites in 1997, the network has expanded to more than 730 sites, covering diverse climate zones and ecosystem types, including tundra, grassland, savanna, cropland, temperate and boreal forests, as well as tropical rainforests. However, only 356 sites involve observations of albedo, according to statistics [33] (Figure 2).

2.3. Experiments and Methods

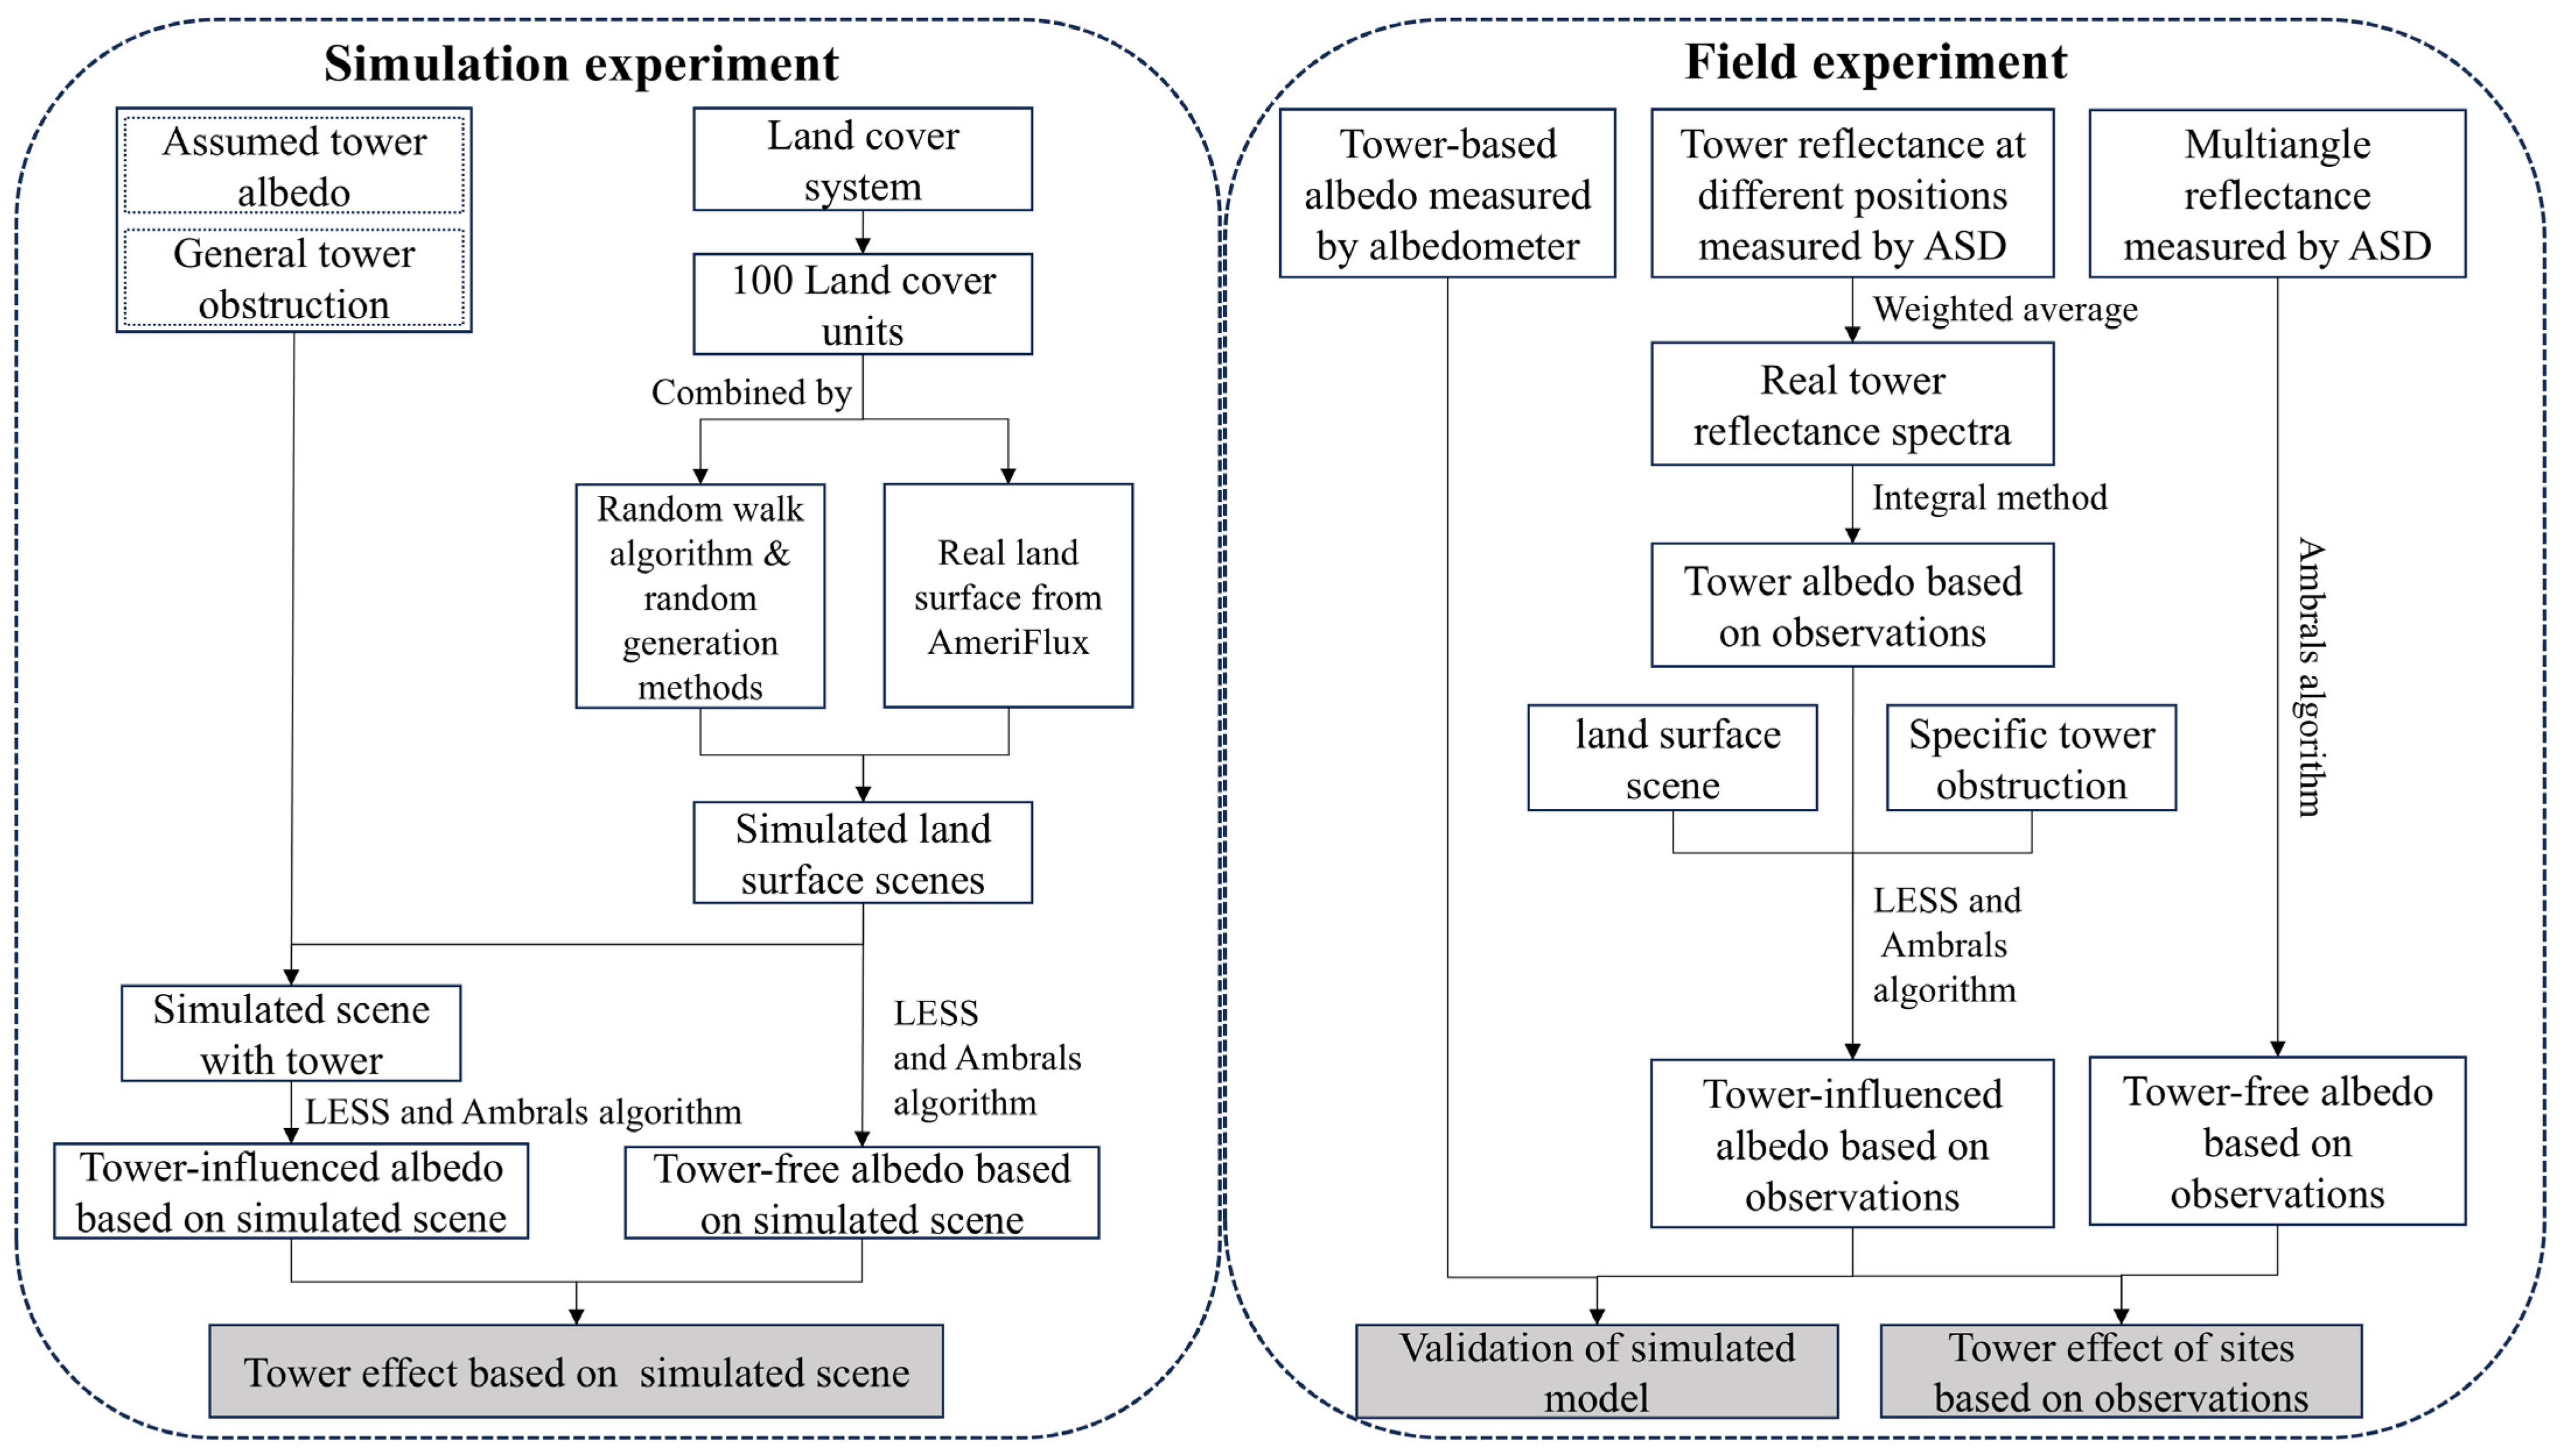
The impact of observation towers on surface albedo measurements is evaluated by comparing tower-free and tower-influenced albedo using a combination of simulations and field observations. The overall framework of the methodology is illustrated in Figure 3, which involves two separate parts: simulation experiments and field validation experiments.
First, a simulation experiment was conducted to assess the potential impact of observation towers on albedo measurements. A simplified land cover system was first obtained from the GLC_FCS30D land cover dataset [34]. One hundred standard land cover units were constructed using three-dimensional vegetation models to represent the different land cover types. These units were then assembled into simulated land surface scenes using two approaches: (1) a combination method based on real land surface characteristics from AmeriFlux sites and (2) random walk and random generation methods. A general tower obstruction model, coupled with an assumed tower albedo, was then embedded in the scenes to generate tower-inclusive realizations that closely reproduce the actual conditions of land surface observations. Albedo was subsequently computed for each scene with and without the tower using the LESS and Ambrals algorithms. Differences between the two sets of retrievals isolate the tower-induced bias and quantify the magnitude and direction of the errors.
Second, a field validation experiment was conducted using actual observations to complement the simulation. The tower-based albedo was directly measured by an albedometer mounted on the tower. In parallel, the tower reflectance at different positions was measured using a Malvern Panalytical (Malvern, UK) ASD hyperspectral spectrometer. These tower reflectance spectra were processed through weighted averaging and integral methods to obtain the tower albedo on the basis of observations. In this calculation, the weight for each position was assigned on the basis of the estimated area ratio relative to the tower obstruction structure. This, together with the actual land surface scene and specific tower obstruction, was fed into the LESS and Ambrals algorithms. This yielded a tower-influenced albedo based on observations, acting as a modeled proxy for comparison with direct tower-based albedo. This comparison validated the model’s capacity to replicate physical tower effects. Moreover, the tower-free albedo based on observations was retrieved through multiangle reflectance measurements using the ASD instrument and subsequently processed with the AMBRALS algorithm. By comparing these results with the tower-influenced albedo based on observations, we quantified the tower effect across various sites. This comparison reveals the extent of albedo deviation caused by physical tower structures under real-world conditions.
The individual steps of the simulation and field experiments are described in detail below:

2.3.1. Simulation Experiments

  • Simulation of Tower-free Surface Scenes
To increase simulation efficiency, the study established standard units of 30 m × 30 m as the foundational spatial resolution for all the simulations. Large-scale simulated land surface scenes were generated by stitching and combining these standard units in various configurations. Each standard unit comprised basic elements (objects), which were three-dimensional models of representative plants sourced from the RAdiation transfer Model Intercomparison-V (RAMI-V) 3D scenes available on the Discrete Anisotropic Radiative Transfer (DART) model website. The corresponding component spectral curves were obtained from the ENVI 5.3 spectral library. On the basis of the reclassification of the 30 m global fine land cover product (GLC_FCS30), 13 major natural land surface types were identified, excluding ice and snow, tundra, built-up areas, and water bodies (Table 2). By adjusting the density of the basic element distribution within each unit, a total of 100 standard units were generated, each representing a specific natural land cover type in detail.
To enhance the realism of the simulated scenes, widely distributed AmeriFlux sites—featuring diverse and representative land cover types—were used as references. For each simulated scene, the central pixel was assigned the land cover type of the corresponding AmeriFlux site (central land cover), while the dominant land cover type within a 1 km × 1 km area surrounding the site was assigned the main land cover type. However, as real AmeriFlux sites often exhibit relatively homogeneous land cover and some combinations of central and main land cover types are absent, some of the simulated scenes were supplemented using algorithm-based generation to increase diversity and ensure the representation of all major land cover categories. Given that all land cover types in this study focus on vegetation-dominated natural terrestrial surfaces, a two-dimensional random walk algorithm, in conjunction with stochastic generation methods, was utilized to construct additional scenes. The random walk algorithm, widely recognized in ecological modeling for simulating vegetation spread, competition, and spatial patterning, allowed the construction of robust and varied simulated scenes.
  • Simulation of Tower-influenced Surface Scenes
To simulate tower-induced effects, each generated tower-free surface scene was assumed to contain an observation tower at its center. The tower-influenced scene represents the portion of the land surface visible to the instruments mounted on the tower, and the magnitude of the influence depends on factors such as the tower structure, instrument installation height, and tower surface albedo.
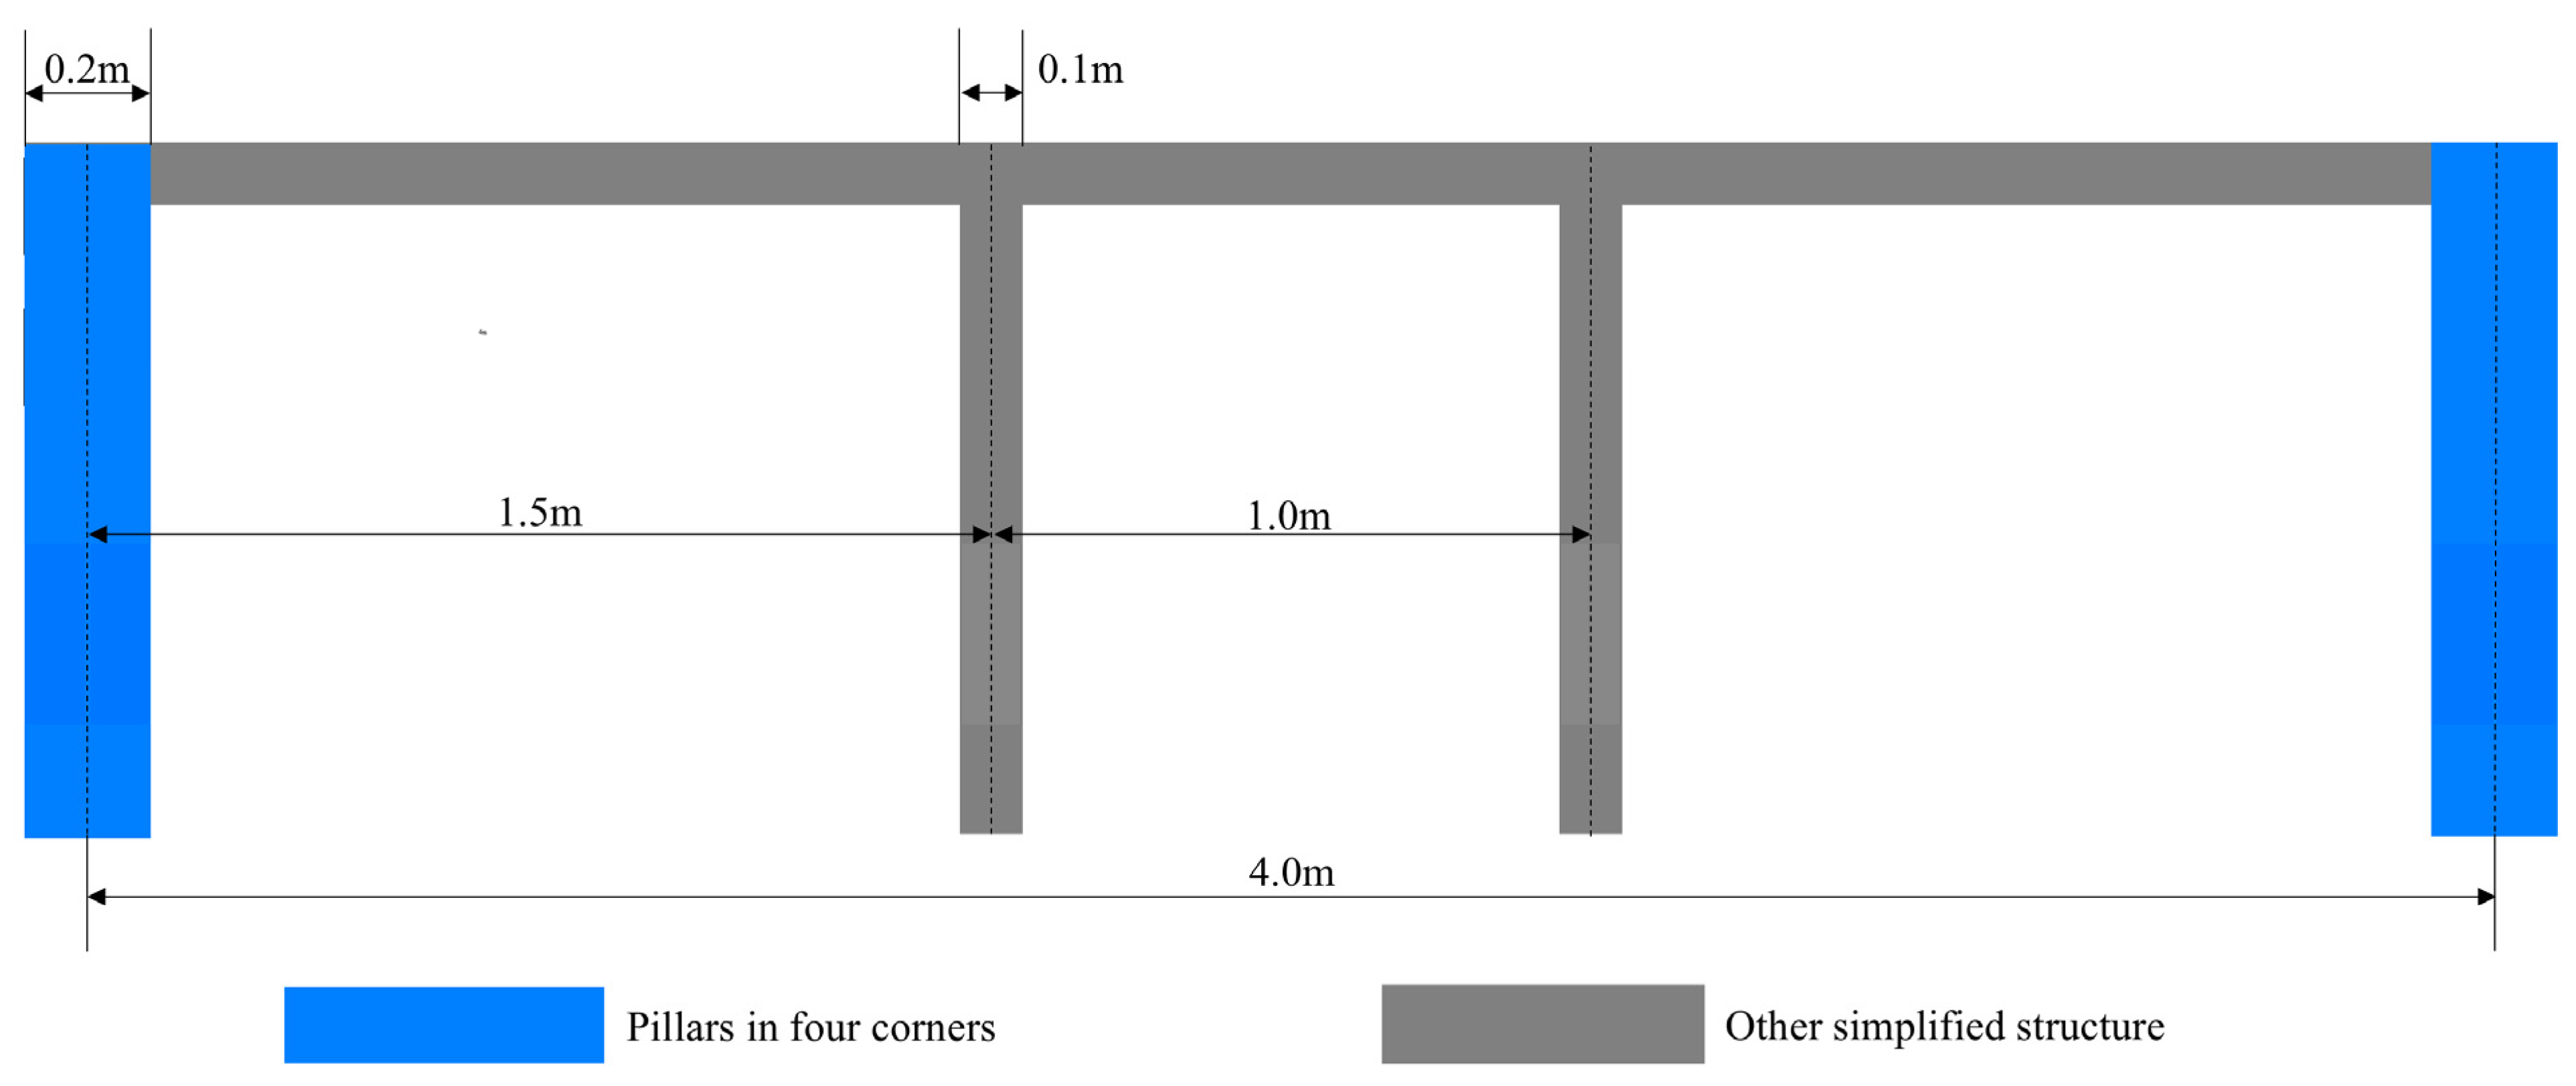
For general applicability, large-volume, structurally complex self-supporting towers were considered in this study. The tower body was simplified with reference to typical self-supporting tower designs, as there is no unified construction standard. The section of the tower most affecting the observations is the portion adjacent to the mounted instruments. In the simplified model, the tower was represented as a column with a 4 m × 4 m square base. The actual tower structure includes openwork support frames, stairs, handrails, and intermediate platforms. These three-dimensional vertical and horizontal components were projected onto the four sides of the column, forming a “slice unit” on each side (Figure 4). The basic tower body was represented as a cube enclosed by four slice units, with changes in tower height simulated by stacking such cubes.
The effect of tower obstruction is determined primarily by the instrument installation height and the tower surface albedo. The installation height defines the spatial extent of the observed scene. Although the maximum scene size in Section 3.1.1 was 1 km × 1 km, such an extent cannot be covered fully by actual albedometer observations. Therefore, installation heights of 10 m, 20 m, 35 m, and 50 m were simulated, representing the range commonly found at existing observation sites. At an installation height of 35 m, the observation footprint (~450 m) is comparable to the coarse spatial resolution of the satellite imagery. The heights of 10 m, 20 m, and 50 m served as complementary cases for comparison.
The tower surface albedo was determined by its color. In practice, tower bodies are most often painted white or green. In the visible spectrum, white surfaces exhibit higher reflectance than surrounding natural vegetation does, whereas green surfaces have lower reflectance. Under the assumption of Lambertian reflection, the albedo values were set to 0.6 for white towers and 0.3 for green towers (Table 3).
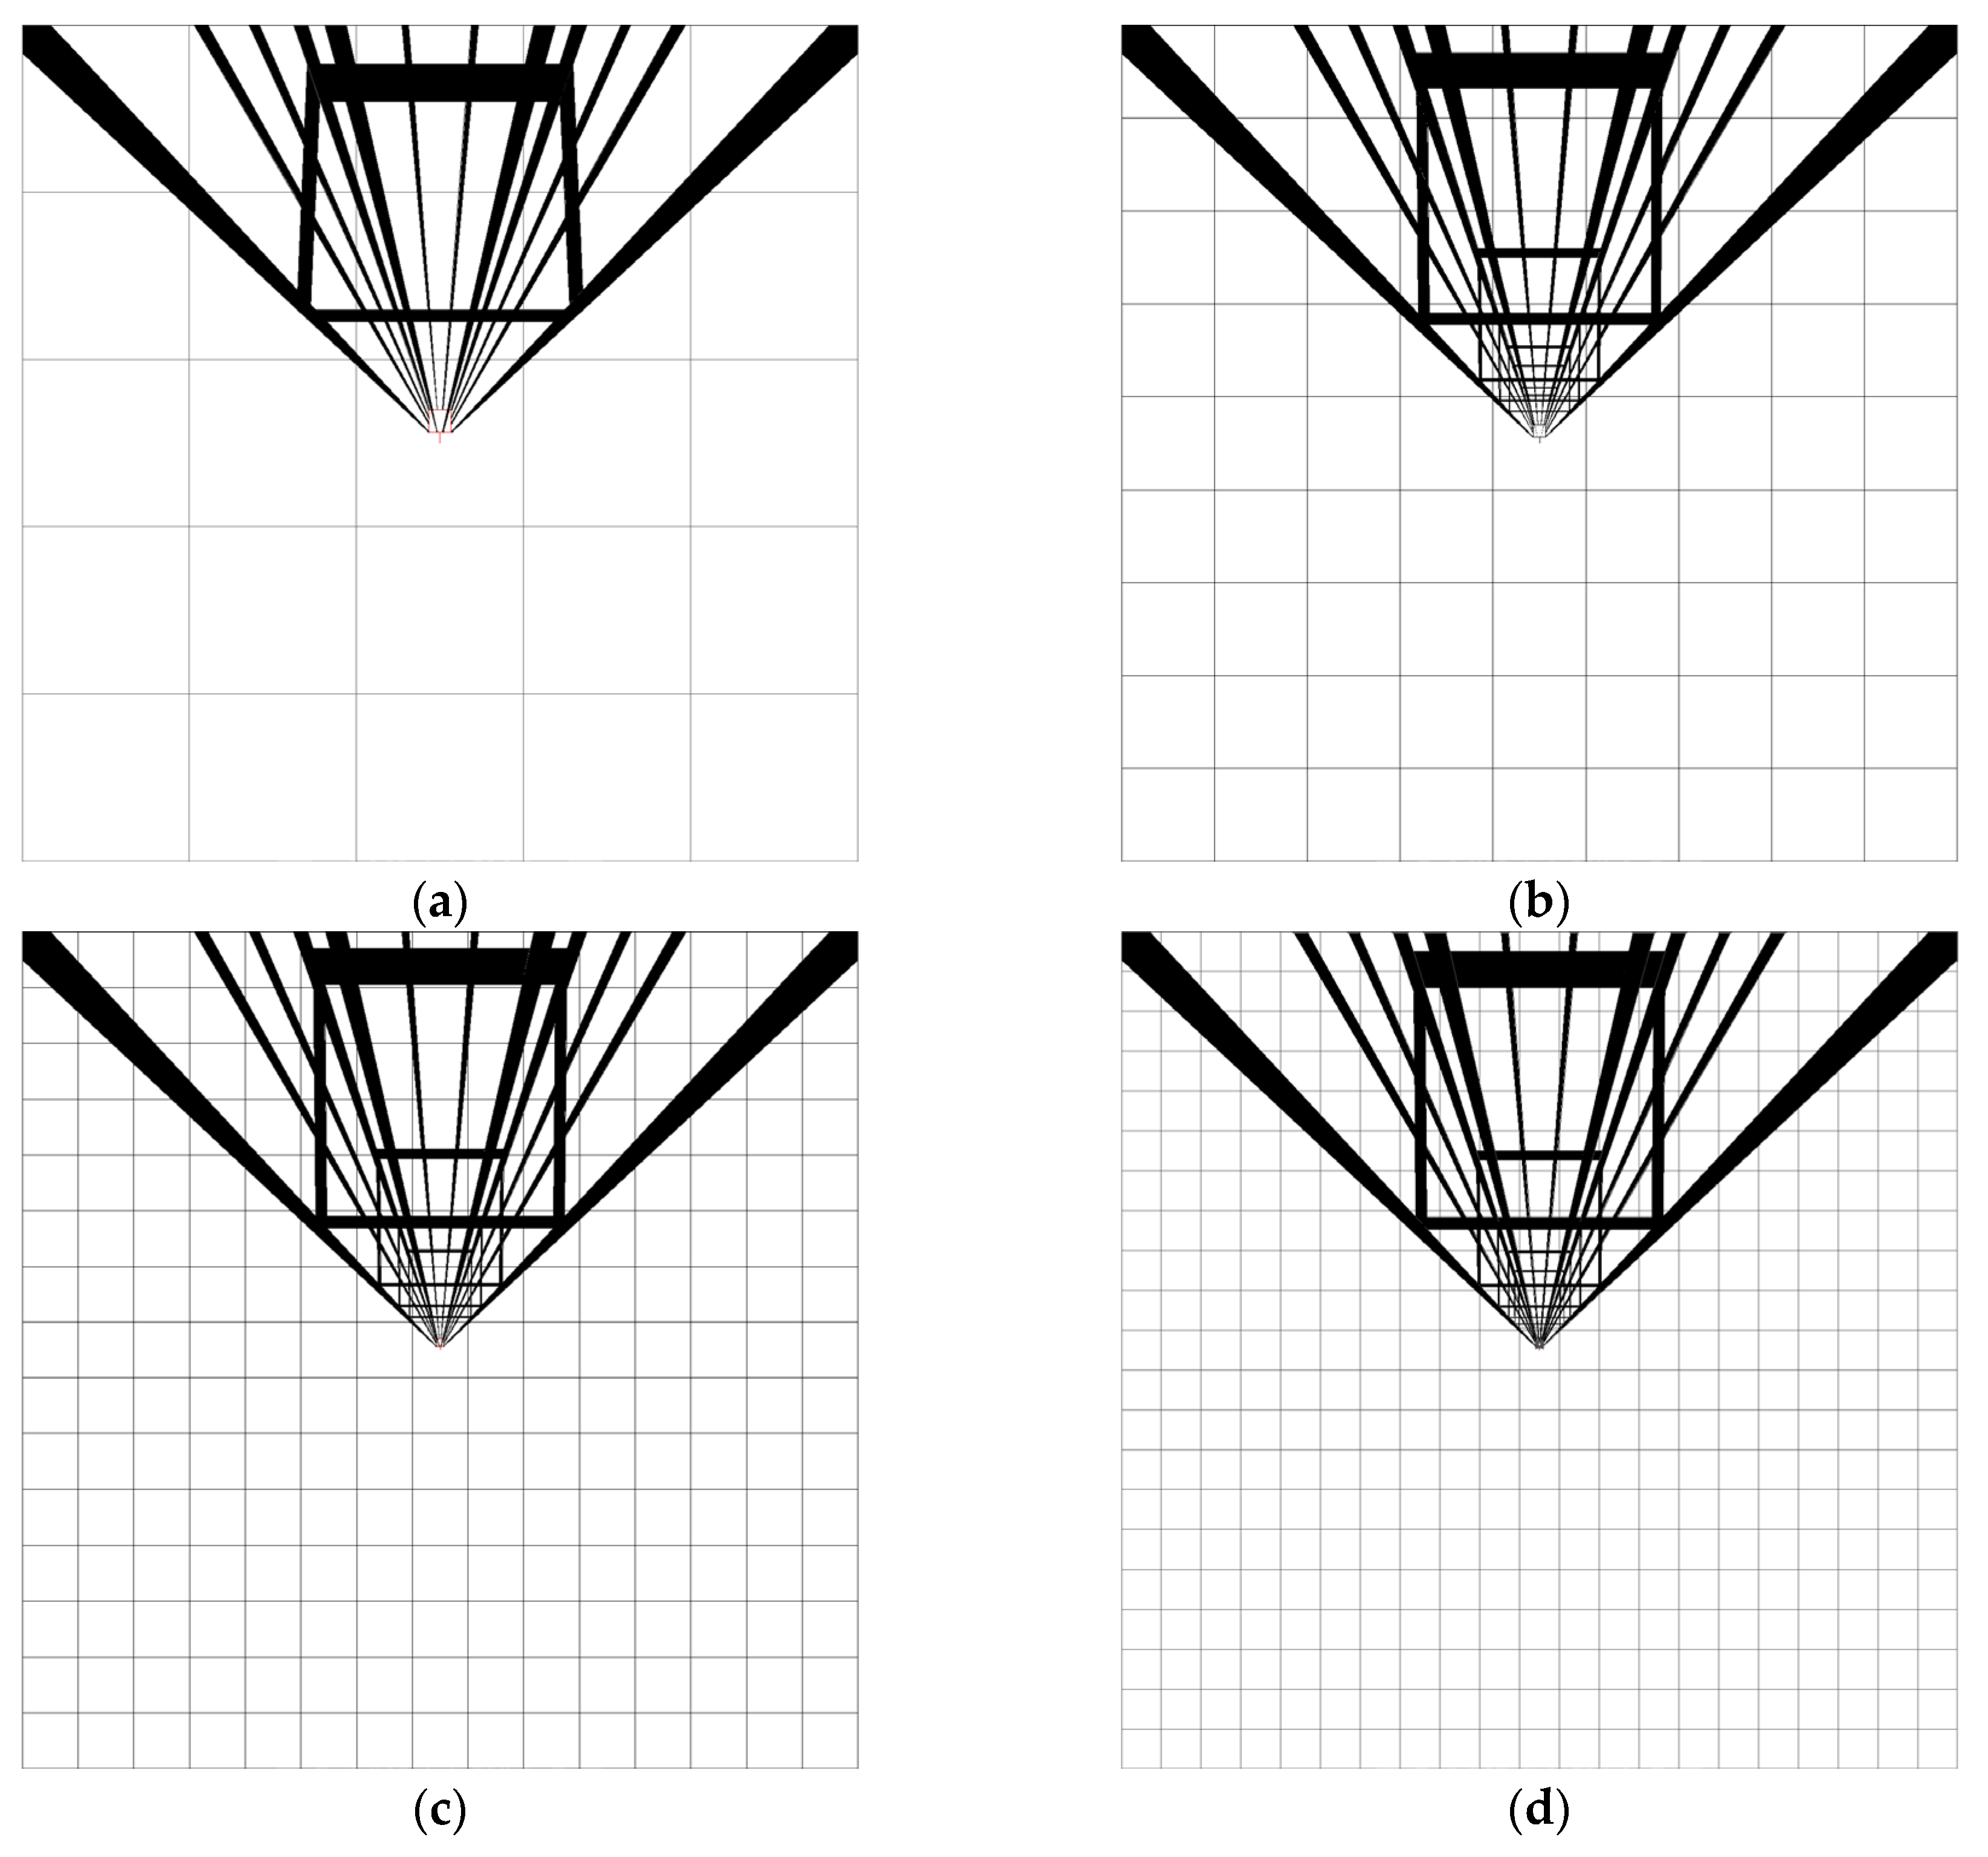
On the basis of the tower geometry and instrument height, the obstruction shape (Figure 5) was derived in CAD 2020 software using central projection rules. This obstruction shape was then overlaid onto the tower-free surface scenes to produce tower-influenced observation scenarios. Because obstruction shapes are irregular, a special standard unit (tower unit) was defined, consisting of a flat surface with the assumed tower albedo (white or green). If the obstruction shape fully covered a standard unit, that unit was replaced with a tower unit. For partial coverage, a 40% threshold was applied: units with ≥40% coverage were replaced, whereas those with <40% coverage were left unchanged.
  • Three-Dimensional Radiative Transfer Model LESS
In this study, the forward photon-tracing mode of the Large-Scale remote sensing data and image Simulation framework (LESS) was employed to obtain multi-angle reflectance of simulated tower-free and tower-influenced surface scenes.
LESS is a three-dimensional realistic-structure radiative transfer model based on the ray-tracing principle. It simulates the transport and interaction of incident light within a scene—including absorption, reflection, and transmission—and outputs the corresponding simulation data. Here, “realistic structure” refers to scene elements with arbitrarily complex geometries represented by triangular meshes, in contrast to the simplified representations (e.g., imaginary ellipsoids or continuous homogeneous media) commonly used in traditional remote sensing models. In ray tracing, the reflection, transmission, and refraction of light rays emitted from a virtual light source are computed as they propagate through the defined scene, enabling the derivation of radiance information detectable by a sensor [35]. The equation is represented as follows:
L 0 q , ω 0 = L e q , ω 0 + 4 π f q , ω i , ω 0 L i q , ω i | cos θ i | d ω i
where L 0 q , ω 0 represents the outgoing radiance from point q along the ω 0 direction within the scene. L e q , ω 0 denotes the radiance emitted from point q in the ω 0 direction (e.g., thermal radiation). f q , ω i , ω 0 represents the bidirectional scattering distribution function (BSDF) near point q . L i q , ω i is the incident radiance to point q in the ω i direction, and θ i represents the angle between the incoming light and the local surface normal. The entire formula indicates that the outgoing radiance from the q point along the ω 0 direction is equal to the radiance emitted by the object itself at that point plus the sum of all incident radiance scattered at that point in the outgoing direction.
A complete LESS simulation process involves the following steps: defining the three-dimensional virtual scene, generating light sources, calculating the intersections between light rays and scene elements, determining changes in light energy and direction at the intersections, and computing the resulting radiative information. In practical applications, this requires the input of fundamental parameters such as the three-dimensional scene structure, component spectra, observation geometry, and illumination settings, which are then processed through the ray-tracing-based radiative transfer model to generate simulated remote sensing data.
For all the simulations, the solar zenith angle was set to 0°, and the solar azimuth angle was oriented south. The solar zenith angle was specified to maintain consistency with the solar geometry of the satellite observations being evaluated, whereas a southward solar azimuth was assumed given that all the study sites are located in the Northern Hemisphere. The upper hemisphere above each scene was evenly divided into 150 small solid angles to represent combinations of observation azimuth and zenith angles. To balance computational accuracy and efficiency, the illumination resolution—expressed as incident photon density—was set to 0.05.


2.3.2. Ground Observation Experiments

Ground Reflectance Observations
Reflectance measurements of both land surface and tower components were conducted using an ASD FieldSpec 4 Hi-Res spectroradiometer (350–2500 nm; spectral resolution: 3 nm in VNIR and 8 nm in SWIR), Malvern Panalytical (Malvern, UK), providing the necessary data to estimate both tower-free land surface albedo and real tower albedo.
To ensure data comparability, land surface reflectance measurements were taken from a platform positioned at the same height or a height similar to the installation height of the albedometer. The observation zenith angles for the multiangle land surface reflectance measurements were set using a goniometer acquired in eight zenith directions along both the solar principal plane and the perpendicular principal plane. On the basis of the downward radiation conditions on the measurement day, the observation set collected during the time window in which the albedometer provided valid and high-quality measurements was selected. Table 4 summarizes the angular configurations and acquisition times for the multiangle reflectance sampling around each observation station.
In addition to land surface reflectance measurements, the reflectance of the tower structure was characterized to account for its potential influence on albedo estimation. Although the surface of the tower is not strictly Lambertian, implementing non-Lambertian behavior in simulations is computationally challenging. To approximate a Lambertian representation, tower reflectance spectra were measured at multiple observable positions on the tower and combined through an area-weighted average, providing an effective albedo for simulation purposes. Measurements were performed with the same ASD spectroradiometer.
Tower-Based Observations
Tower-based observations serve as the ground reference for simulated tower-influenced surface albedo. These comprise 435 long-term observations of shortwave albedo (300–2800 nm) collected using rigorously calibrated Kipp and Zonen (Delft, The Netherlands) CNR4 radiometers. These radiometers, equipped with clean hemispherical domes, provide a 180° field of view for albedo observation. However, owing to their directional response characteristics, the instruments have a nominal directional error of 10%, which affects the effective observation range. This range can be described as follows:
g = 2 H tan ( H F O V ° )
where H F O V [degrees] is its half field of view, and H F O V = 81°. H represents the relative installation height of the albedometer, which is the distance from the instrument to the top of the canopy.
Tower-based albedo is determined as the ratio of upward radiation to downward radiation, and the formula is described below:
A = E u p w e l l i n g E d o w n w e l l l i n g
where A represents the tower-based shortwave albedo, E u p w e l l i n g represents the radiation collected by the lower pyranometer of the albedometer, and E d o w n w e l l i n g represents the radiation collected by the upper pyranometer of the same albedometer.
The observation frequency is 30 min for the larch and pine forests and 1 min for the grassland. The albedo data used in this study are obtained by averaging the observed albedo over the experimental time window.
Ambrals Algorithm and Broadband Albedo Calculation
The semiempirical linear kernel-driven model is a widely used surface bidirectional reflectance model [36]. The kernel-driven model is known for its simplicity, high speed, and strong data-fitting ability. The general expression of the model is as follows:
R θ i , θ r , φ ; λ = f i s o λ k i s o + f g e o λ k g e o θ i , θ r , φ + f v o l ( λ ) k v o l ( θ i , θ r , φ )
where k i s o is the isotropic kernel function, which is typically a constant value of 1. k g e o and k v o l represent the geometric optical kernel function and the volumetric scattering kernel function, respectively. They are functions of the incident and reflection angles and are independent of wavelength. In contrast, f i s o , f g e o , and f v o l are the corresponding kernel coefficients, which depend on the wavelength but are independent of the angle.
The Ambrals algorithm, used in the MODIS albedo products, is a well-established albedo algorithm based on the kernel-driven model. The model’s kernel coefficients are derived using the least squares method. Once the kernel coefficients are obtained, the bidirectional reflectance under any condition of solar incidence and observation angle can be extrapolated using the kernel-driven model. The bidirectional reflectance distribution function (BRDF) and albedo have a well-defined mathematical relationship: the black-sky albedo is the integral of the BRDF over the observation direction space, whereas the white-sky albedo is the integral of the black-sky albedo over the solar incidence direction space. After the Ambrals algorithm is used to obtain the narrowband albedo for various scenes, the broadband albedo is synthesized using conversion coefficients from narrowband to broadband under typical atmospheric conditions [37]. The formula is as follows:
A s w = 0.0036 + 0.3973 α 1 + 0.2382 α 2 + 0.3489 α 3 0.2655 α 4 + 0.1604 α 5 0.0138 α 6 + 0.0682 α 7
where A s w represents the broadband shortwave albedo and α i   represents the narrowband albedo corresponding to specific wavelengths.
In this study, the algorithm is used to calculate the tower-free ground albedo, with the reflectance data from eight observation directions serving as inputs for model fitting. Since the spectral range of the ASD spectrometer closely matched the spectral range of the first seven MODIS bands, for computational efficiency and to maintain the accuracy of the AMBRALS algorithm, the continuous reflectances were convolved with the MODIS spectral response functions and aggregated into seven discrete bands.
ρ b a n d = λ m i n λ m a x ρ λ E s ( λ ) f ( λ ) d λ λ m i n λ m a x E s ( λ ) f ( λ ) d λ
where λ m i n   and λ m a x   represent the wavelengths, E s λ   denotes the spectral irradiance of the incident light, and   ρ λ represents the measured spectral reflectance.

3. Results

3.1. Simulated Scenes

3.1.1. Simulated Tower-Free Surface Scenes

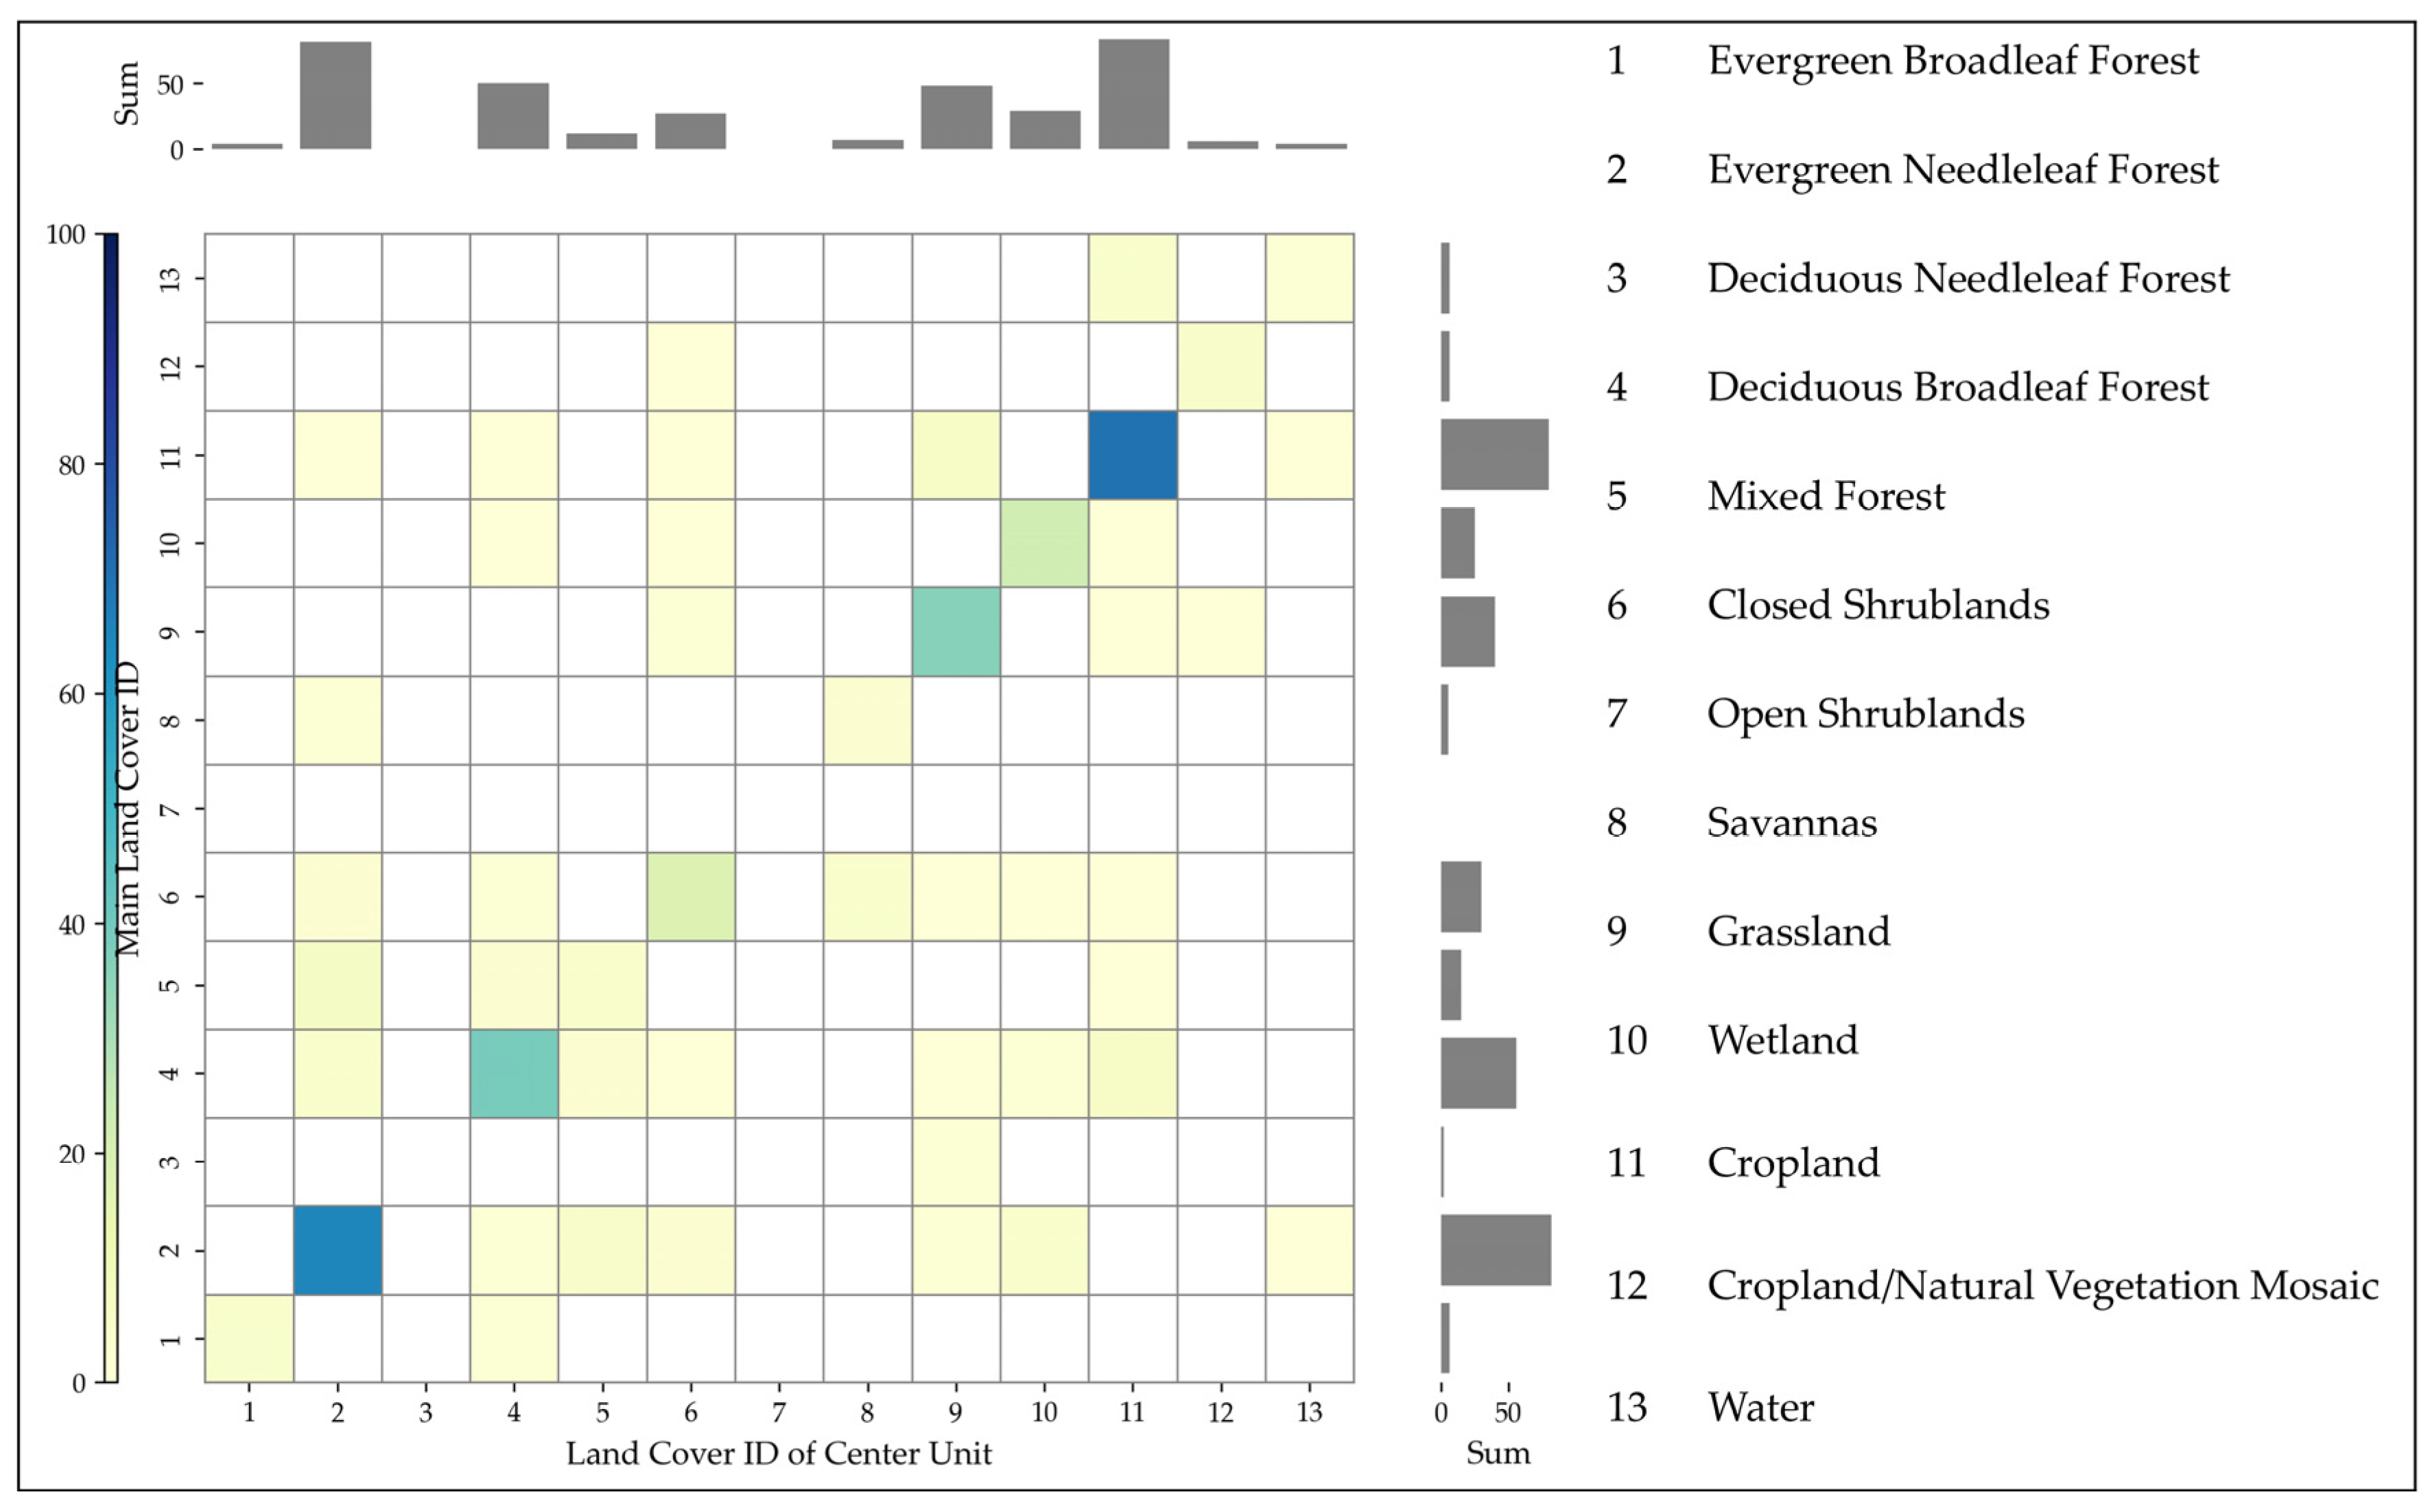
Figure 6 shows the combined distribution of the central unit land cover types and the main land cover types of the AmeriFlux site scenes. Among them, scenes where the land cover type of the center unit is the same as the scene main land cover type account for 75.3% of all the scenes, where evergreen needleleaf forests, deciduous broadleaf forests, grasslands, and croplands are the main types. The land cover type distribution is uneven, which is due mainly to the characteristics of AmeriFlux sites, as they are mostly established on relatively uniform land surfaces, and sites that include up- and down-radiation are mostly concentrated in specific climatic zones in North America.
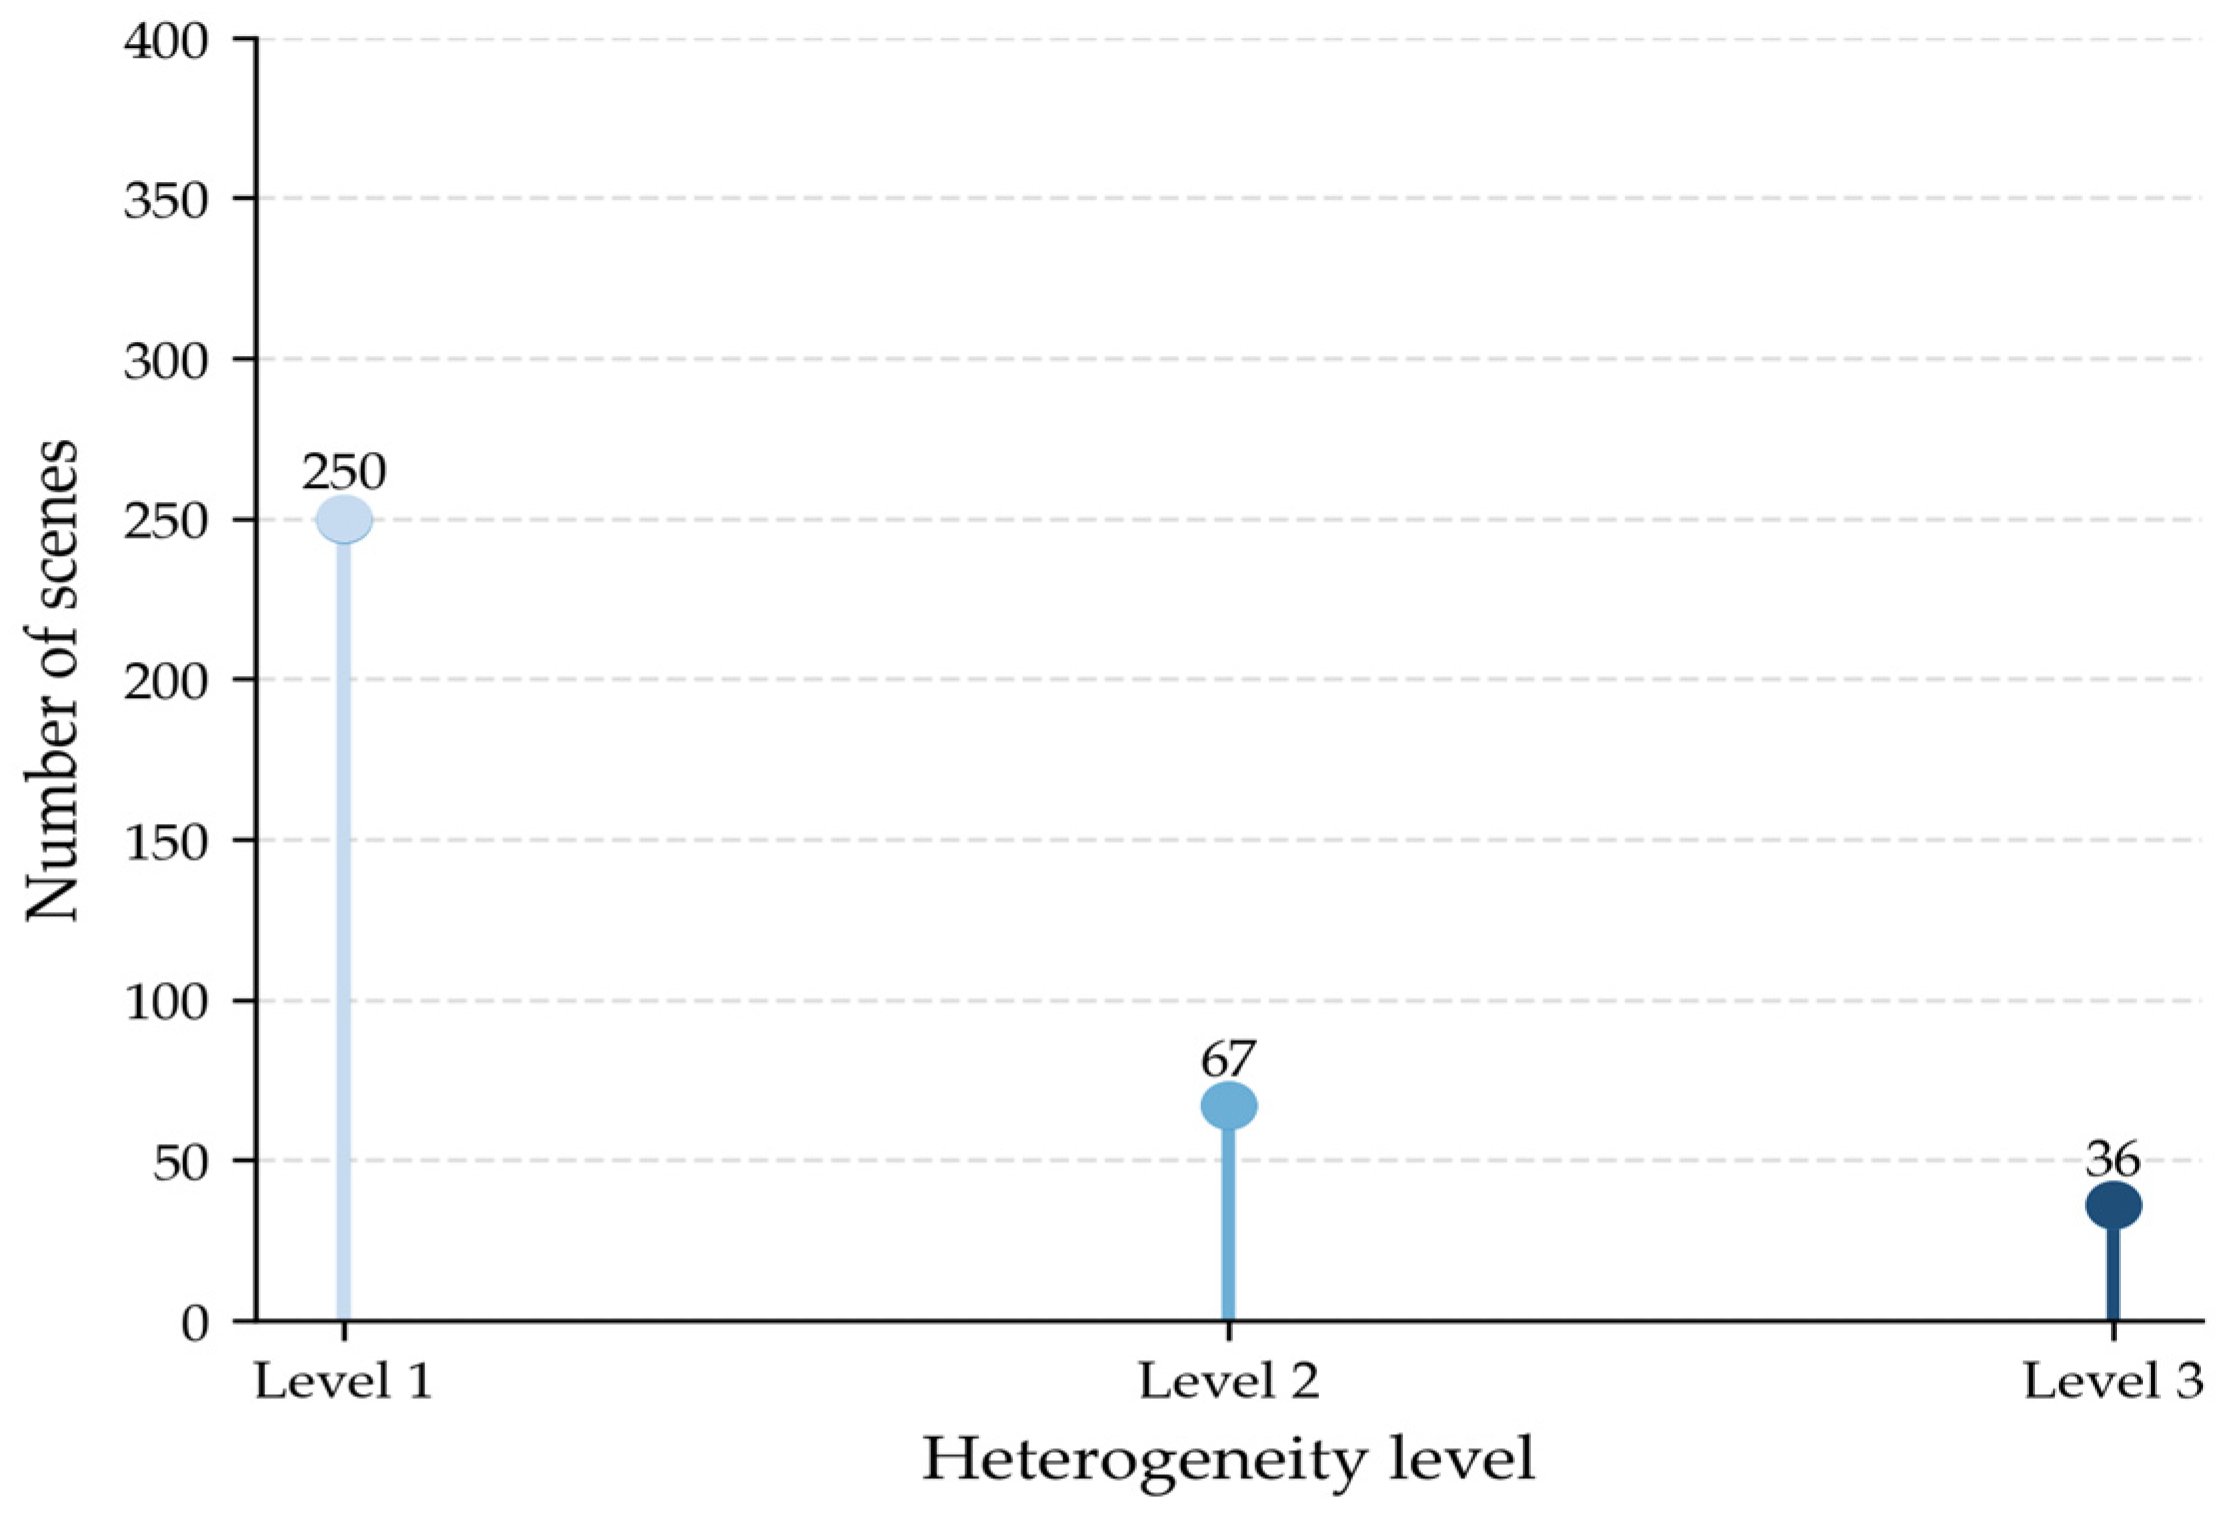
Figure 7 shows the distribution of the heterogeneity of the site scenes. The heterogeneity of site-based scenes was assessed using the coefficient of variation (CV) and the Shannon diversity index (SHDI). On the basis of both empirical knowledge and the distribution of these indicators in simulated scenes, thresholds of SHDI = 0.5 and CV = 0.28 were established [35]. Accordingly, scenes were classified into three heterogeneity levels: level 1 for homogeneous scenes (SHDI ≤ 0.5 and CV ≤ 0.28), level 2 for moderately heterogeneous scenes (SHDI > 0.5 and CV < 0.28, or SHDI < 0.5 and CV > 0.28), and level 3 for highly heterogeneous scenes (SHDI > 0.5 and CV > 0.28). As illustrated in Figure 7, highly heterogeneous surfaces are largely absent in the existing site scenes.
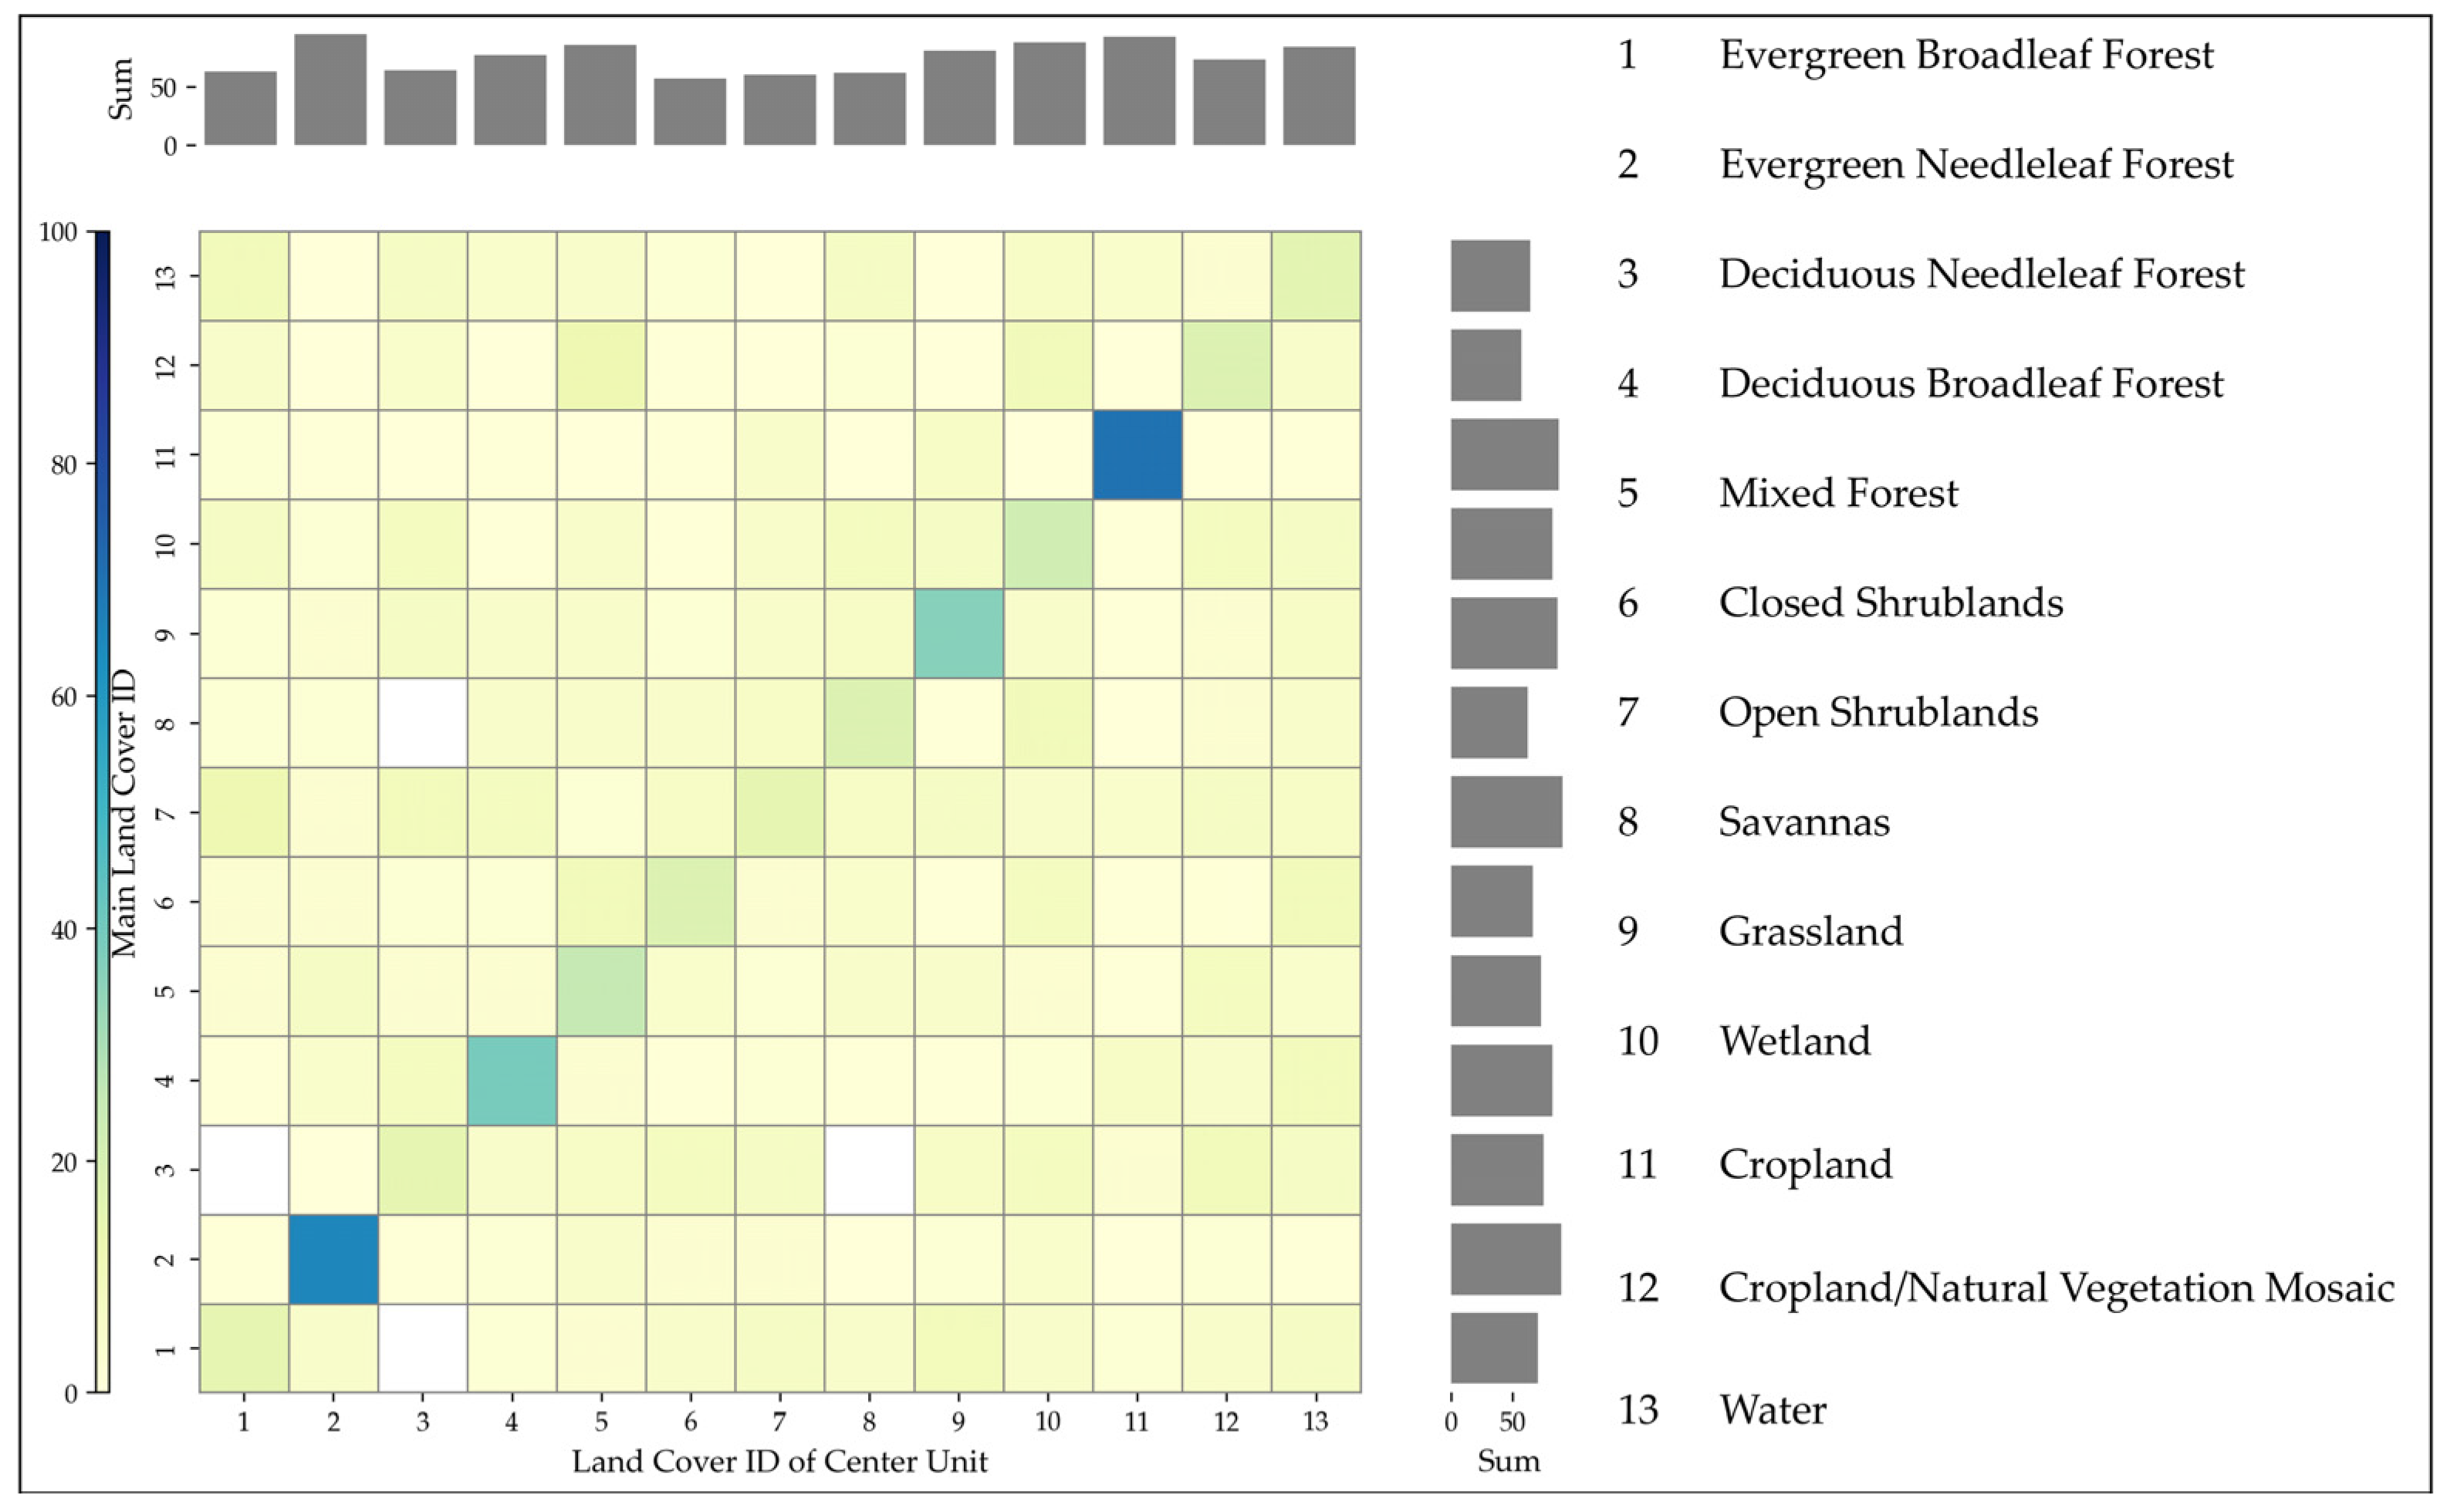
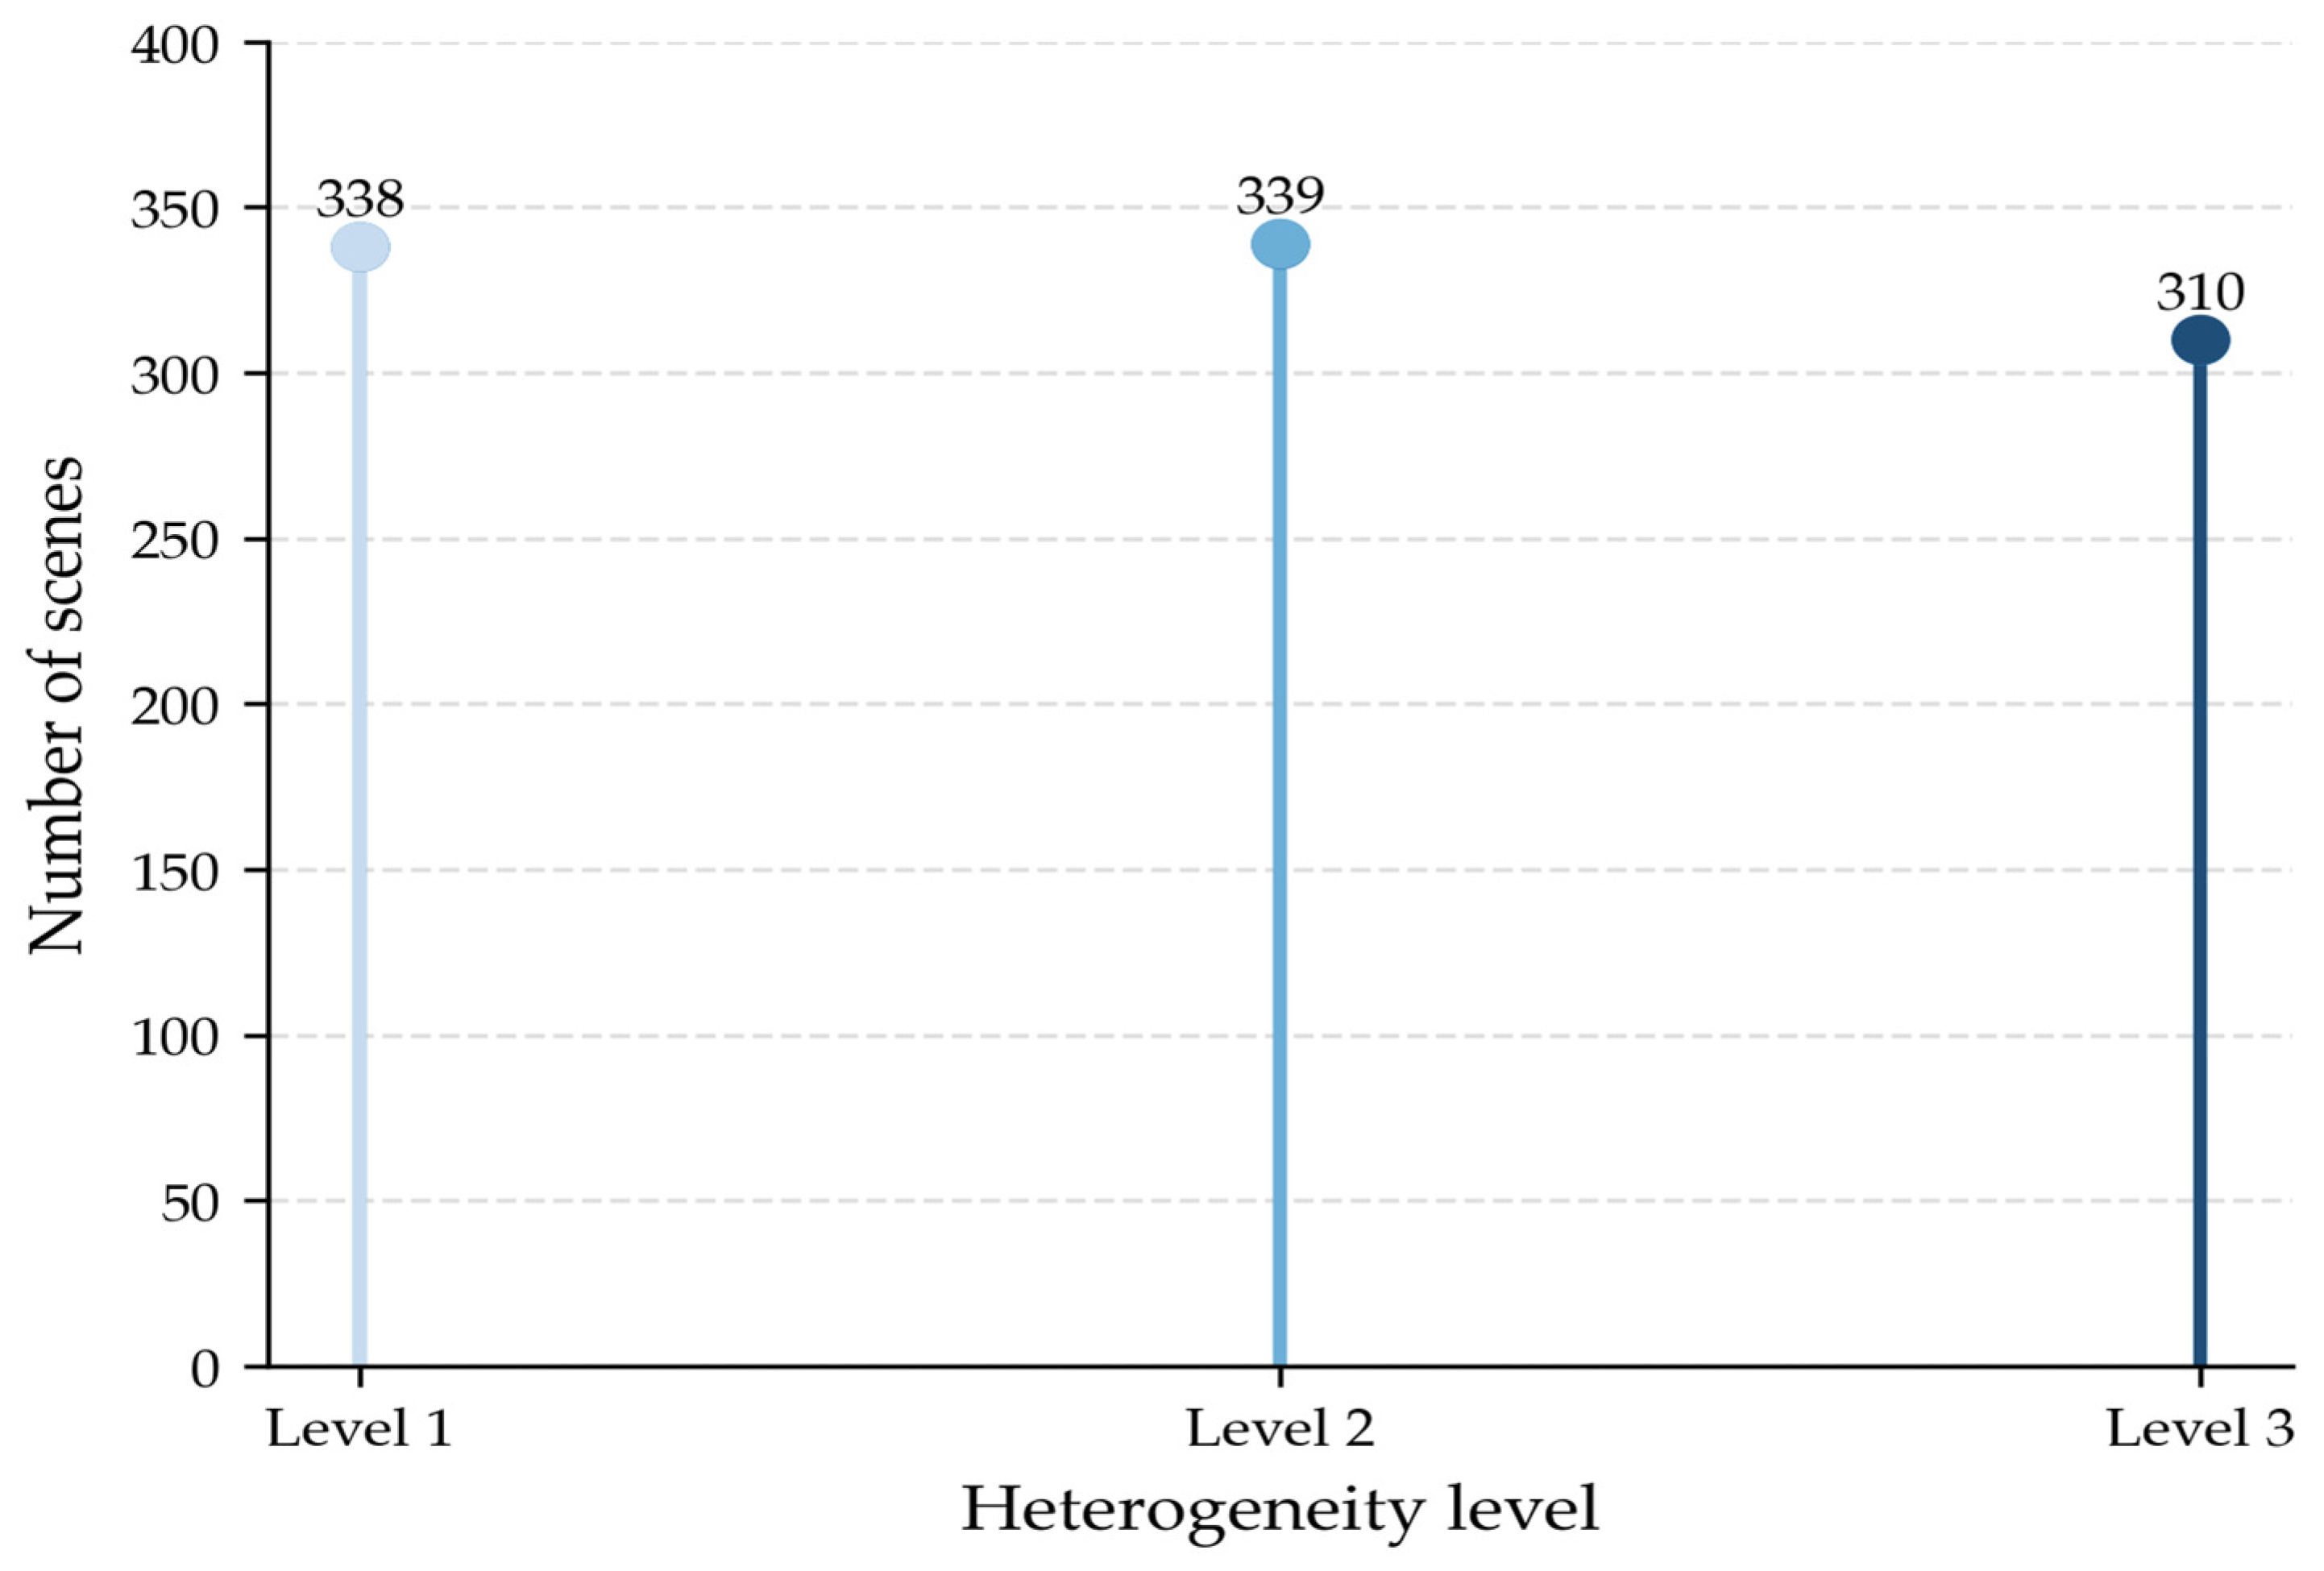
To increase scene diversity and heterogeneity, some simulated scenes were generated using a random-walk algorithm [38]. Following algorithm-generated supplementation, the distributions of land cover types and surface heterogeneity across all scenes are shown in Figure 8 and Figure 9, respectively. This finding shows that the supplementation effectively balanced the distribution of land cover types and included highly heterogeneous surfaces that were missing from the original sites. Combining the site-based and algorithm-generated data resulted in a total of 1000 land surface scenes, each spanning 33 × 33 pixels (990 m × 990 m). All these scenes are adopted in further simulation experiments.

3.1.2. Simulated Tower-Influenced Surface Scenes

On the basis of the obstruction pattern of the tower shown in Figure 4, the proportion of obstructions within the field of view was calculated at different simulation scales (Table 5). The obstruction proportion remained nearly unchanged across different scales because, with a fixed tower structure, increasing the albedometer height expands the total field of view while enlarging the obstructed area by a similar ratio.
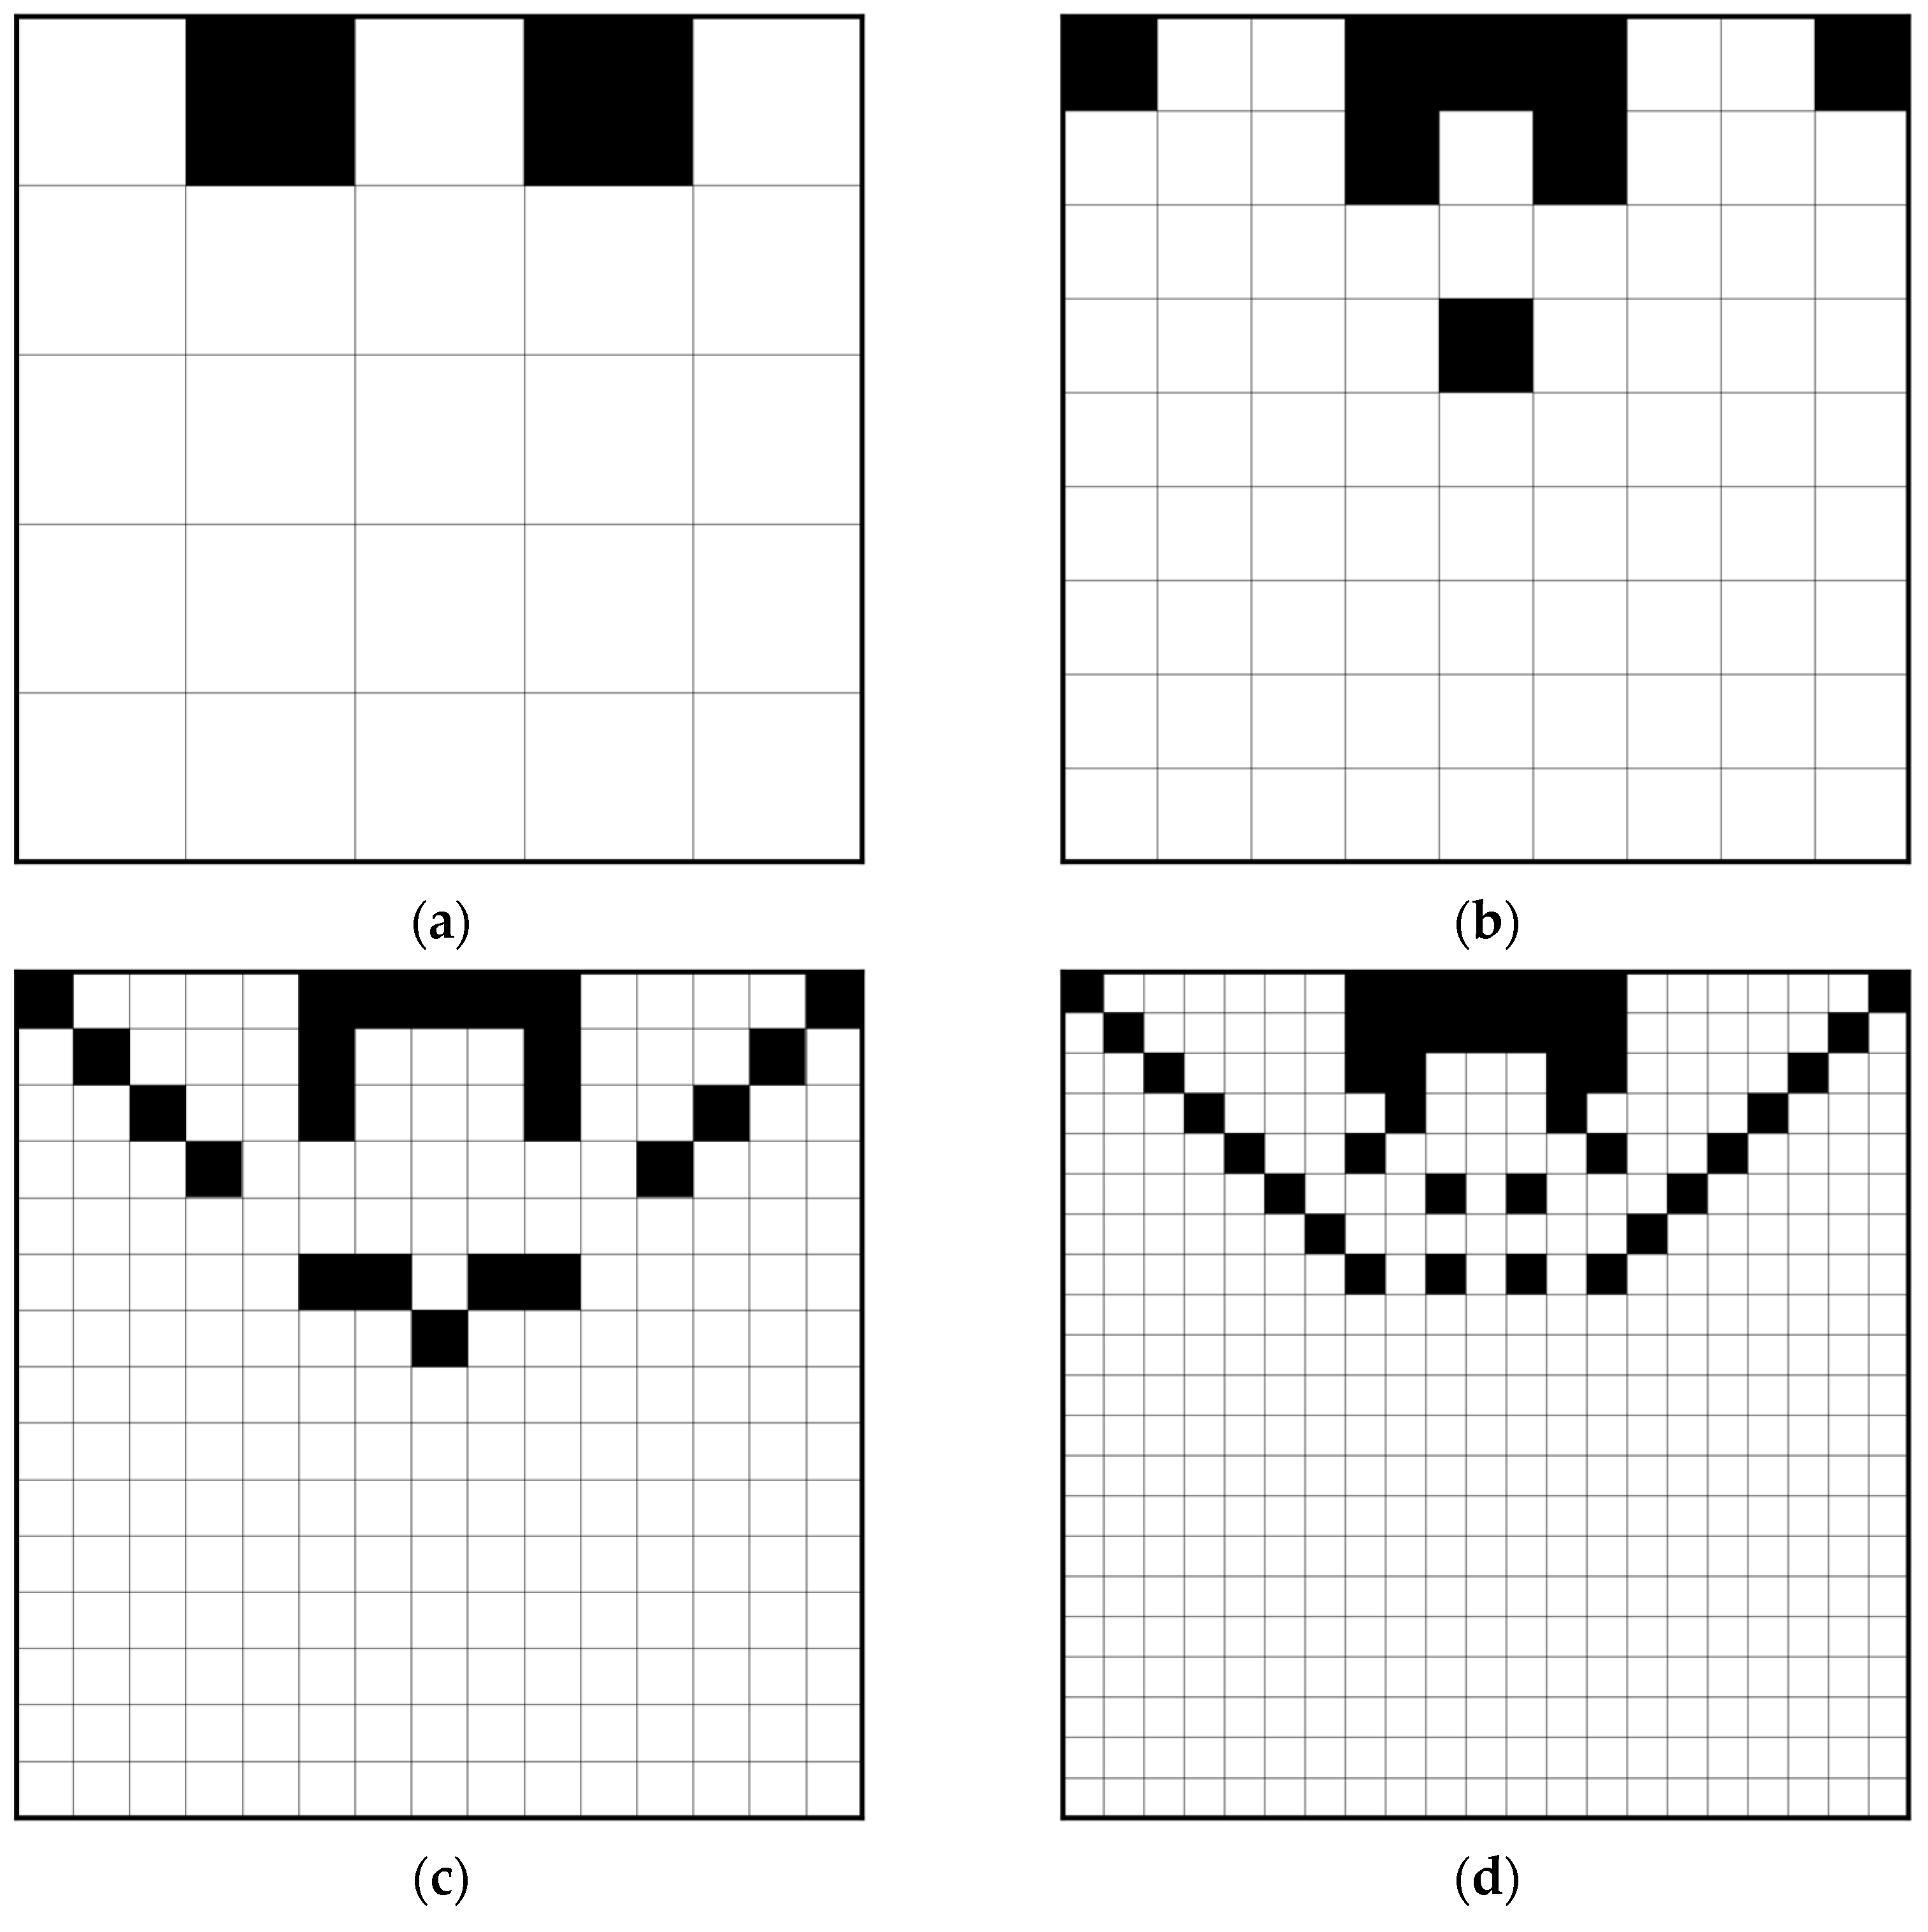
By applying a 40% decision threshold to each grid unit, these irregular obstruction patterns (Figure 5) were transformed into standardized 30 × 30 m tower units, and the final count result was reported as “round ratio-based obstruction pixels”. The specific spatial distribution of these tower units is shown in Figure 10.

3.2. Tower Effect Assessment Based on the Simulation

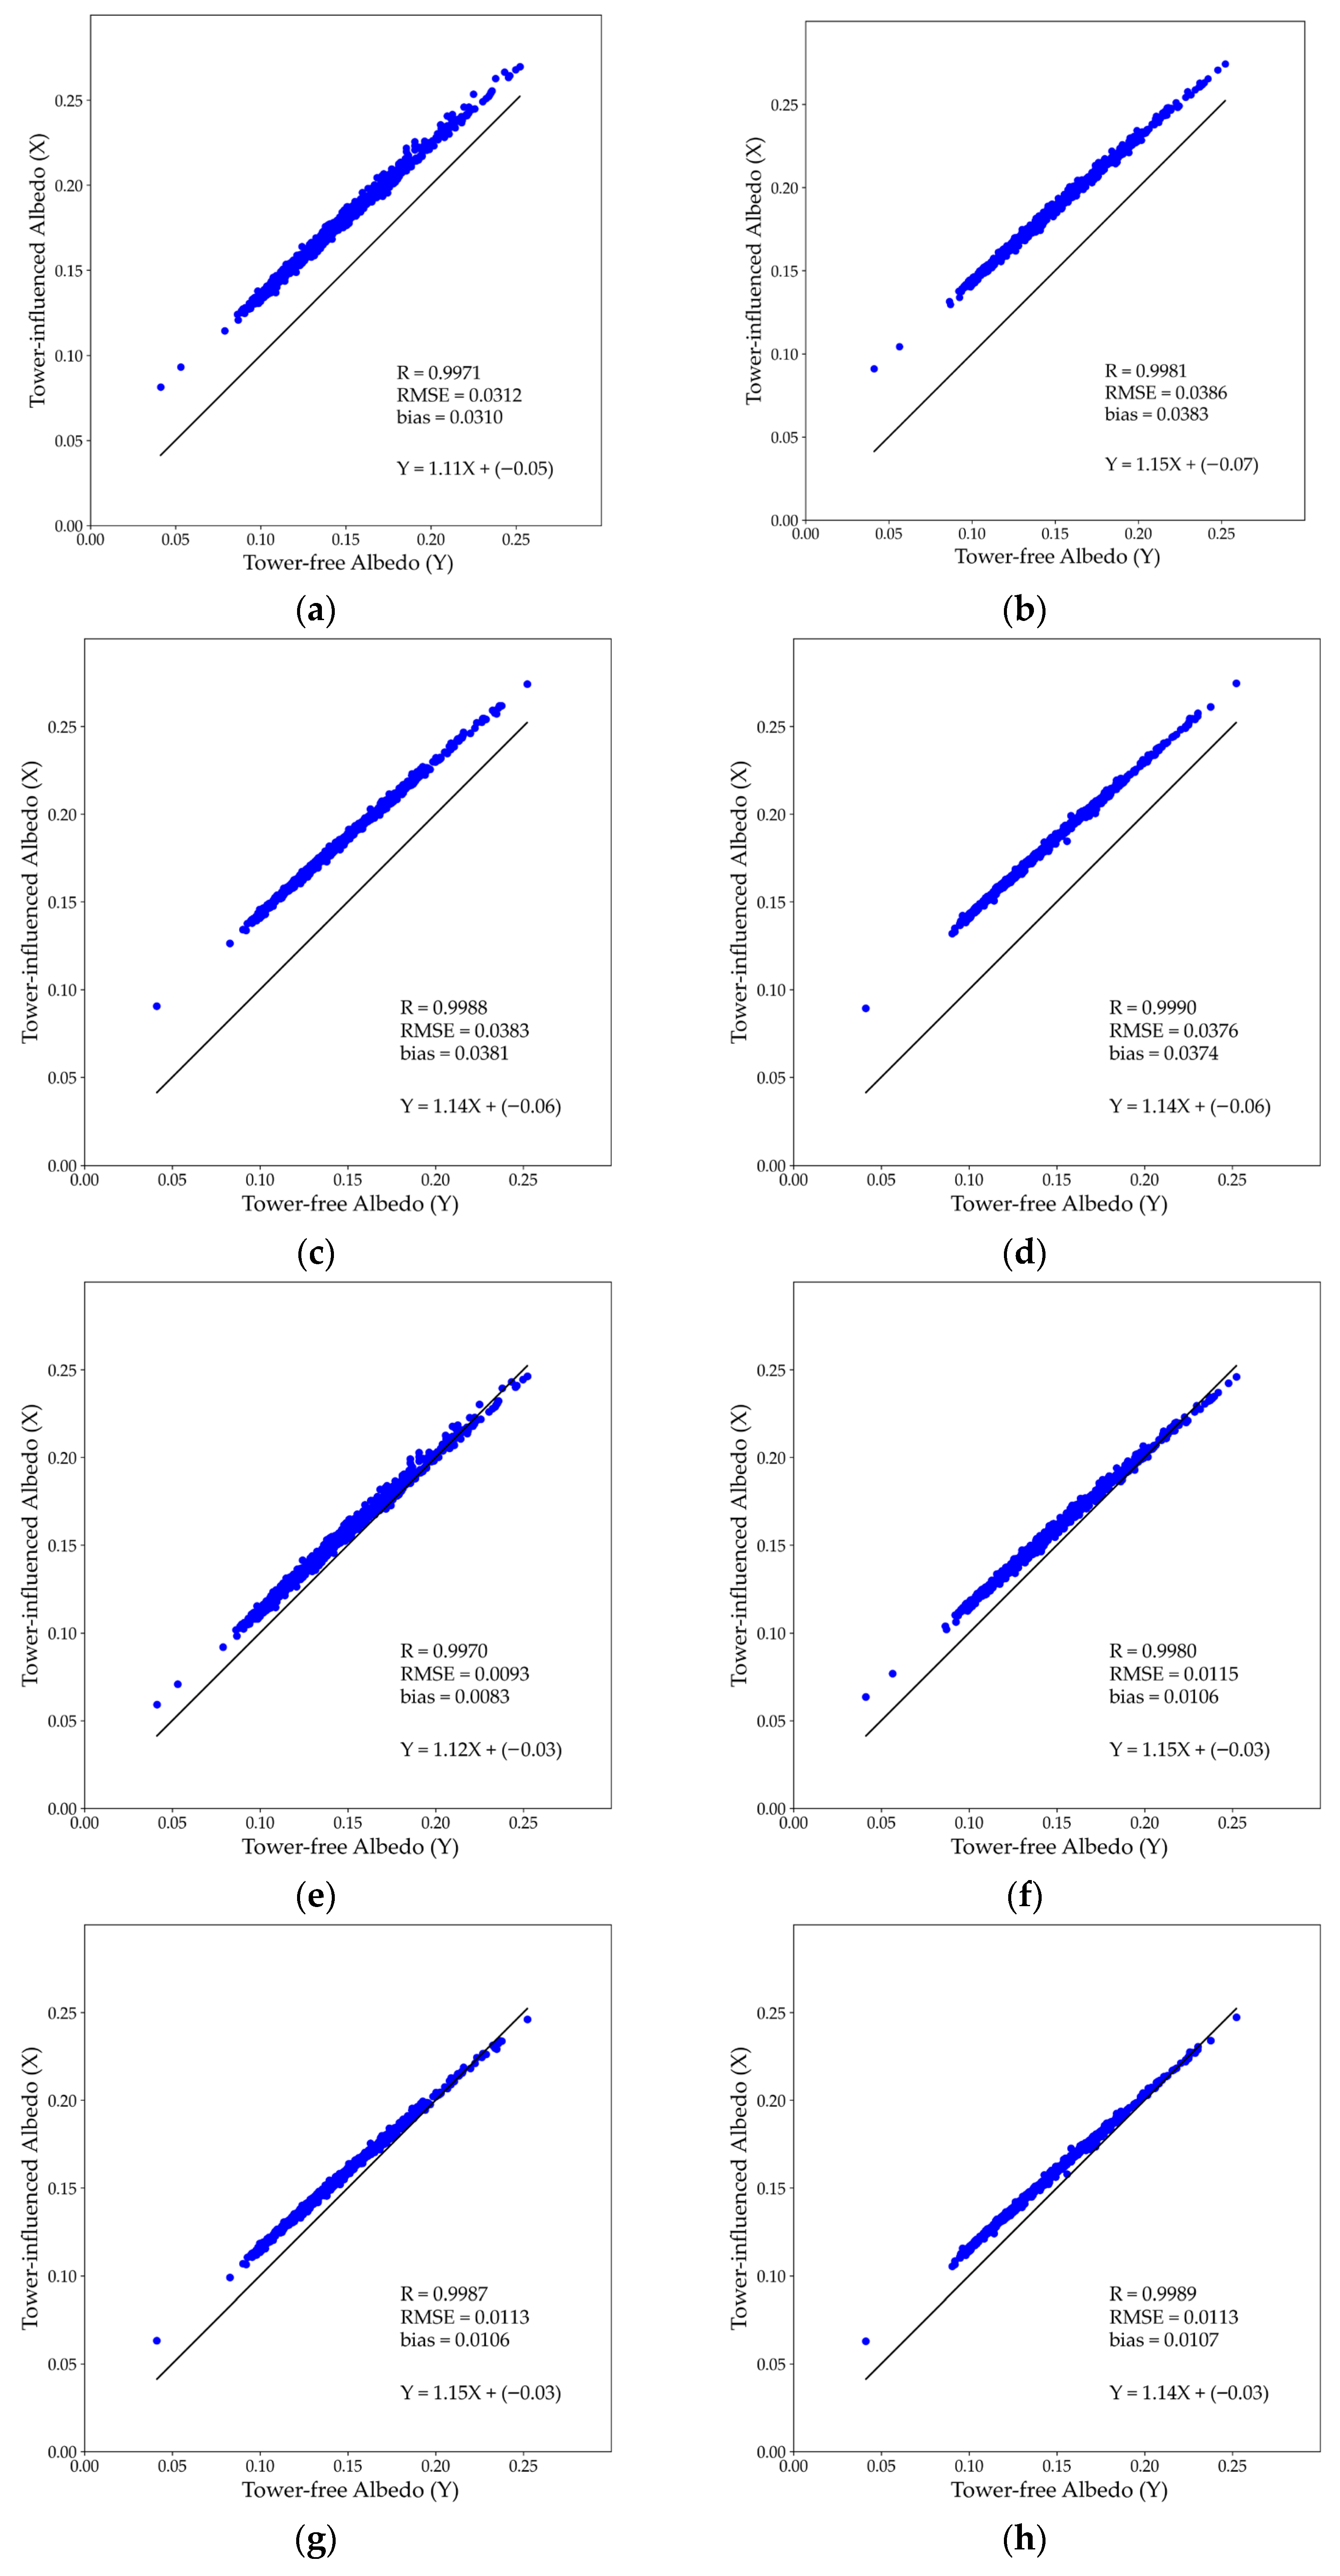
The effect of towers on land surface albedo observations were evaluated by comparing simulated tower-free and tower-influenced albedos. Scatter plots of the tower-free albedo versus tower-influenced albedo for four relative installation heights (10, 20, 35, and 50 m) and two tower colors (white and green) are shown in Figure 11. Figure 11a–d corresponds to white towers at the four installation heights, whereas Figure 11e–h corresponds to green towers. Across all heights and colors, the relationships between the tower-free and tower-influenced albedos are highly linear, with correlation coefficients consistently above 0.99. This finding indicates that the ideal ground-observed albedo (tower-free) and actual ground-observed albedo (tower-influenced) are strongly proportional, whereas the magnitude of the tower-induced errors is captured separately by the RMSE and bias.
Bias and RMSE quantify the magnitude and direction of the tower-induced errors. For relative heights of 20–50 m, the RMSE and bias values were 0.0376–0.0386 and 0.0374–0.0383, respectively, for the white tower and 0.0113–0.0115 and 0.0106–0.0107, respectively, for the green tower. For the 10 m tower, both the RMSE and the bias were slightly smaller for the towers of both colors. These results indicate that the tower-induced errors vary primarily with the tower color rather than with the installation height. Quantitatively, the effect of a white tower on surface scenes is approximately 3 to 4 times greater than that of a green tower.
The obstruction results exhibit negligible variation across installation heights, aligning with the obstruction ratios reported in Table 5 and Figure 9. The simulated obstruction patterns, derived from these ratios, expand proportionally with the observation field of view. Minor differences observed at 10 m are attributable to rounding errors when the obstruction pattern is simplified into integer tower units, which disproportionately affect small scenes. These differences reflect model simplification rather than physical effects.
Tower reflectance was identified as the dominant factor controlling the magnitude of tower-induced errors. The greater tower albedo increases contrast with the average surface albedo, leading to larger errors, whereas the effect diminishes as the surface scene albedo increases. This finding indicates that the tower effect depends on the difference in reflectance between the tower and the overall scene rather than the obstruction of any specific surface object.
Figure 11 also shows linear regression models for each combination of tower color and height. All slopes and intercepts are statistically significant (t test, p < 0.05), confirming that these models can be used to correct tower-induced uncertainties. Overall, correction is particularly necessary for white towers, whereas for green towers, the correction is generally minor or optional depending on the application.

3.3. Tower Effect Assessment Based on Field Experiments

3.3.1. Field-Measured Tower Albedo

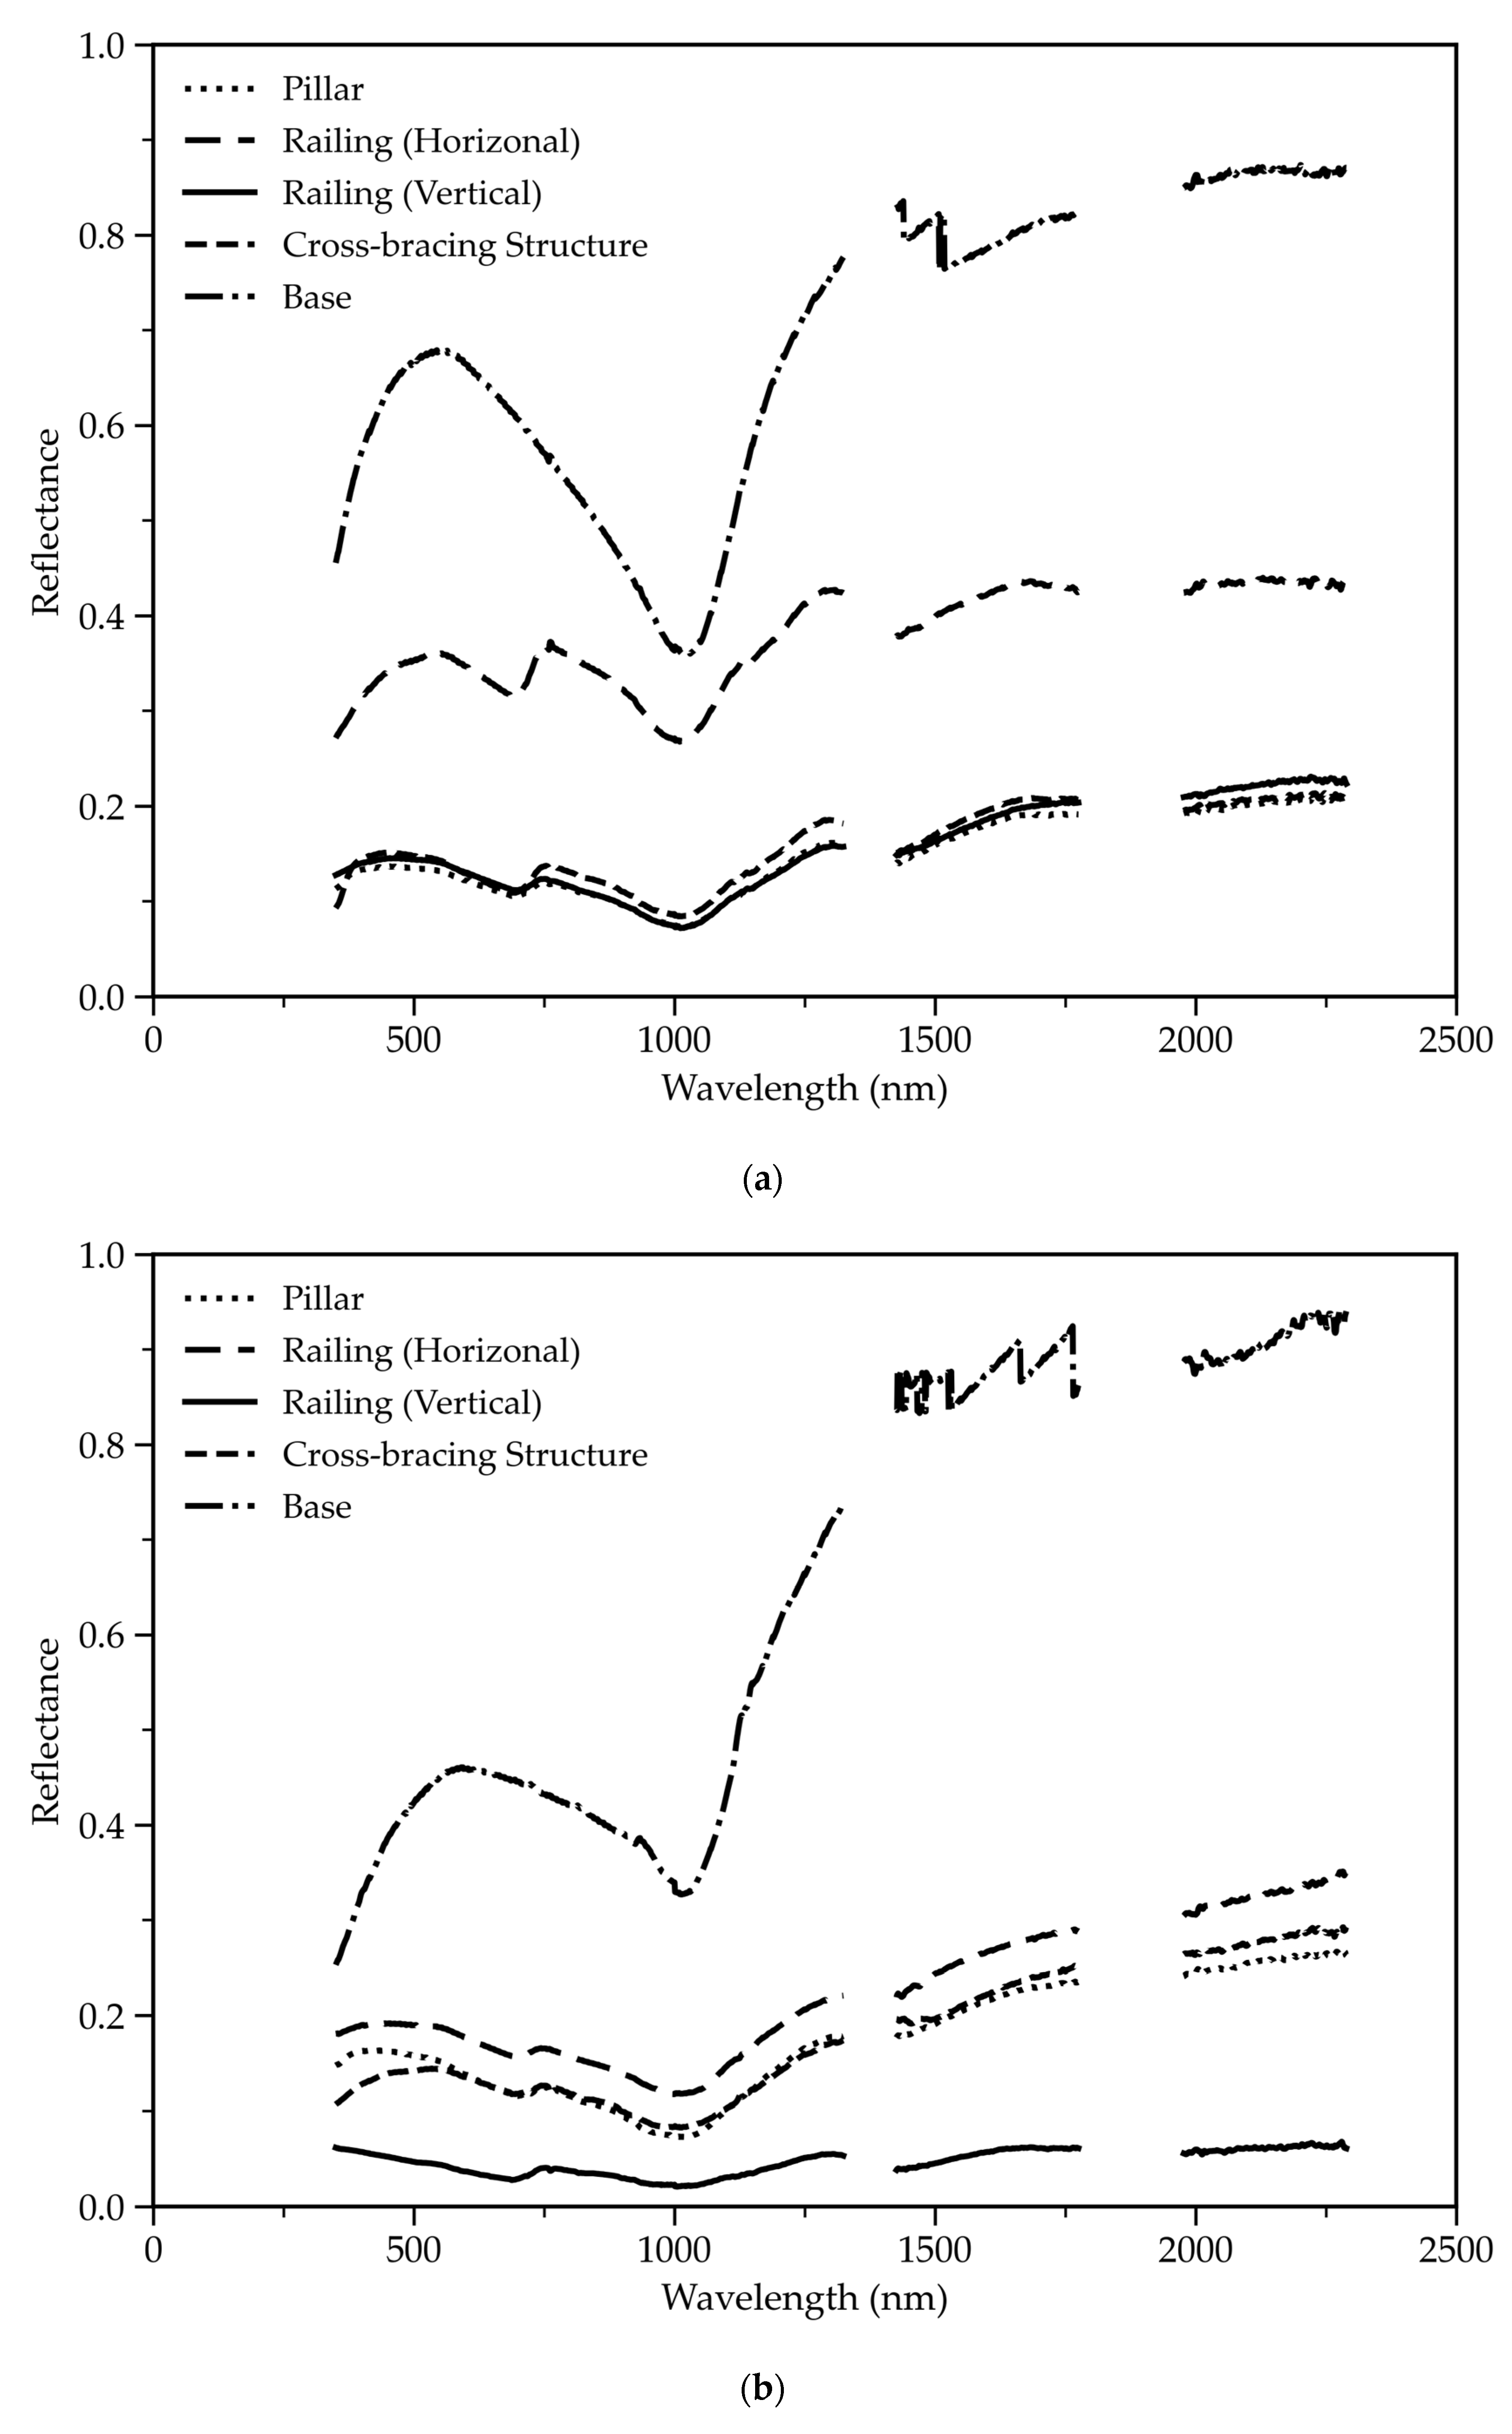
Figure 12 presents the reflectance spectra of three observation towers measured at different positions. The reflectances of the white tower at the pine forest site are shown in Figure 12a. In the visible wavelength range, the reflectance of the tower peaks at approximately 0.6, which is consistent with the albedo values used in previous simulations. Horizontal surfaces, such as the platform base and railing tops, exhibit higher reflectances (0.4–0.8) than vertical surfaces do, including pillars and vertical railings (≈0.1–0.2). The platform base shows a distinct near-infrared trough followed by a sharp increase to more than 0.8 in the shortwave region, indicating near-total reflection, whereas other surfaces maintain relatively stable reflectance. Moreover, the platform base has the highest overall reflectance, which increases the visibility of fine spectral features, thus making the fluctuations in the wavelength range more pronounced: the platform base exhibits a distinct trough in the near-infrared band, followed by a rapid increase to above 0.8 in the shortwave infrared band, whereas other surfaces maintain relatively stable reflectance.
The white tower at the larch forest site is shown in Figure 12b. Its overall spectral pattern is similar to that of the pine forest tower, but the horizontal surfaces of the railings exhibit slightly lower reflectance (≈0.5) in the visible wavelength range, reflecting site-specific and measurement time differences.
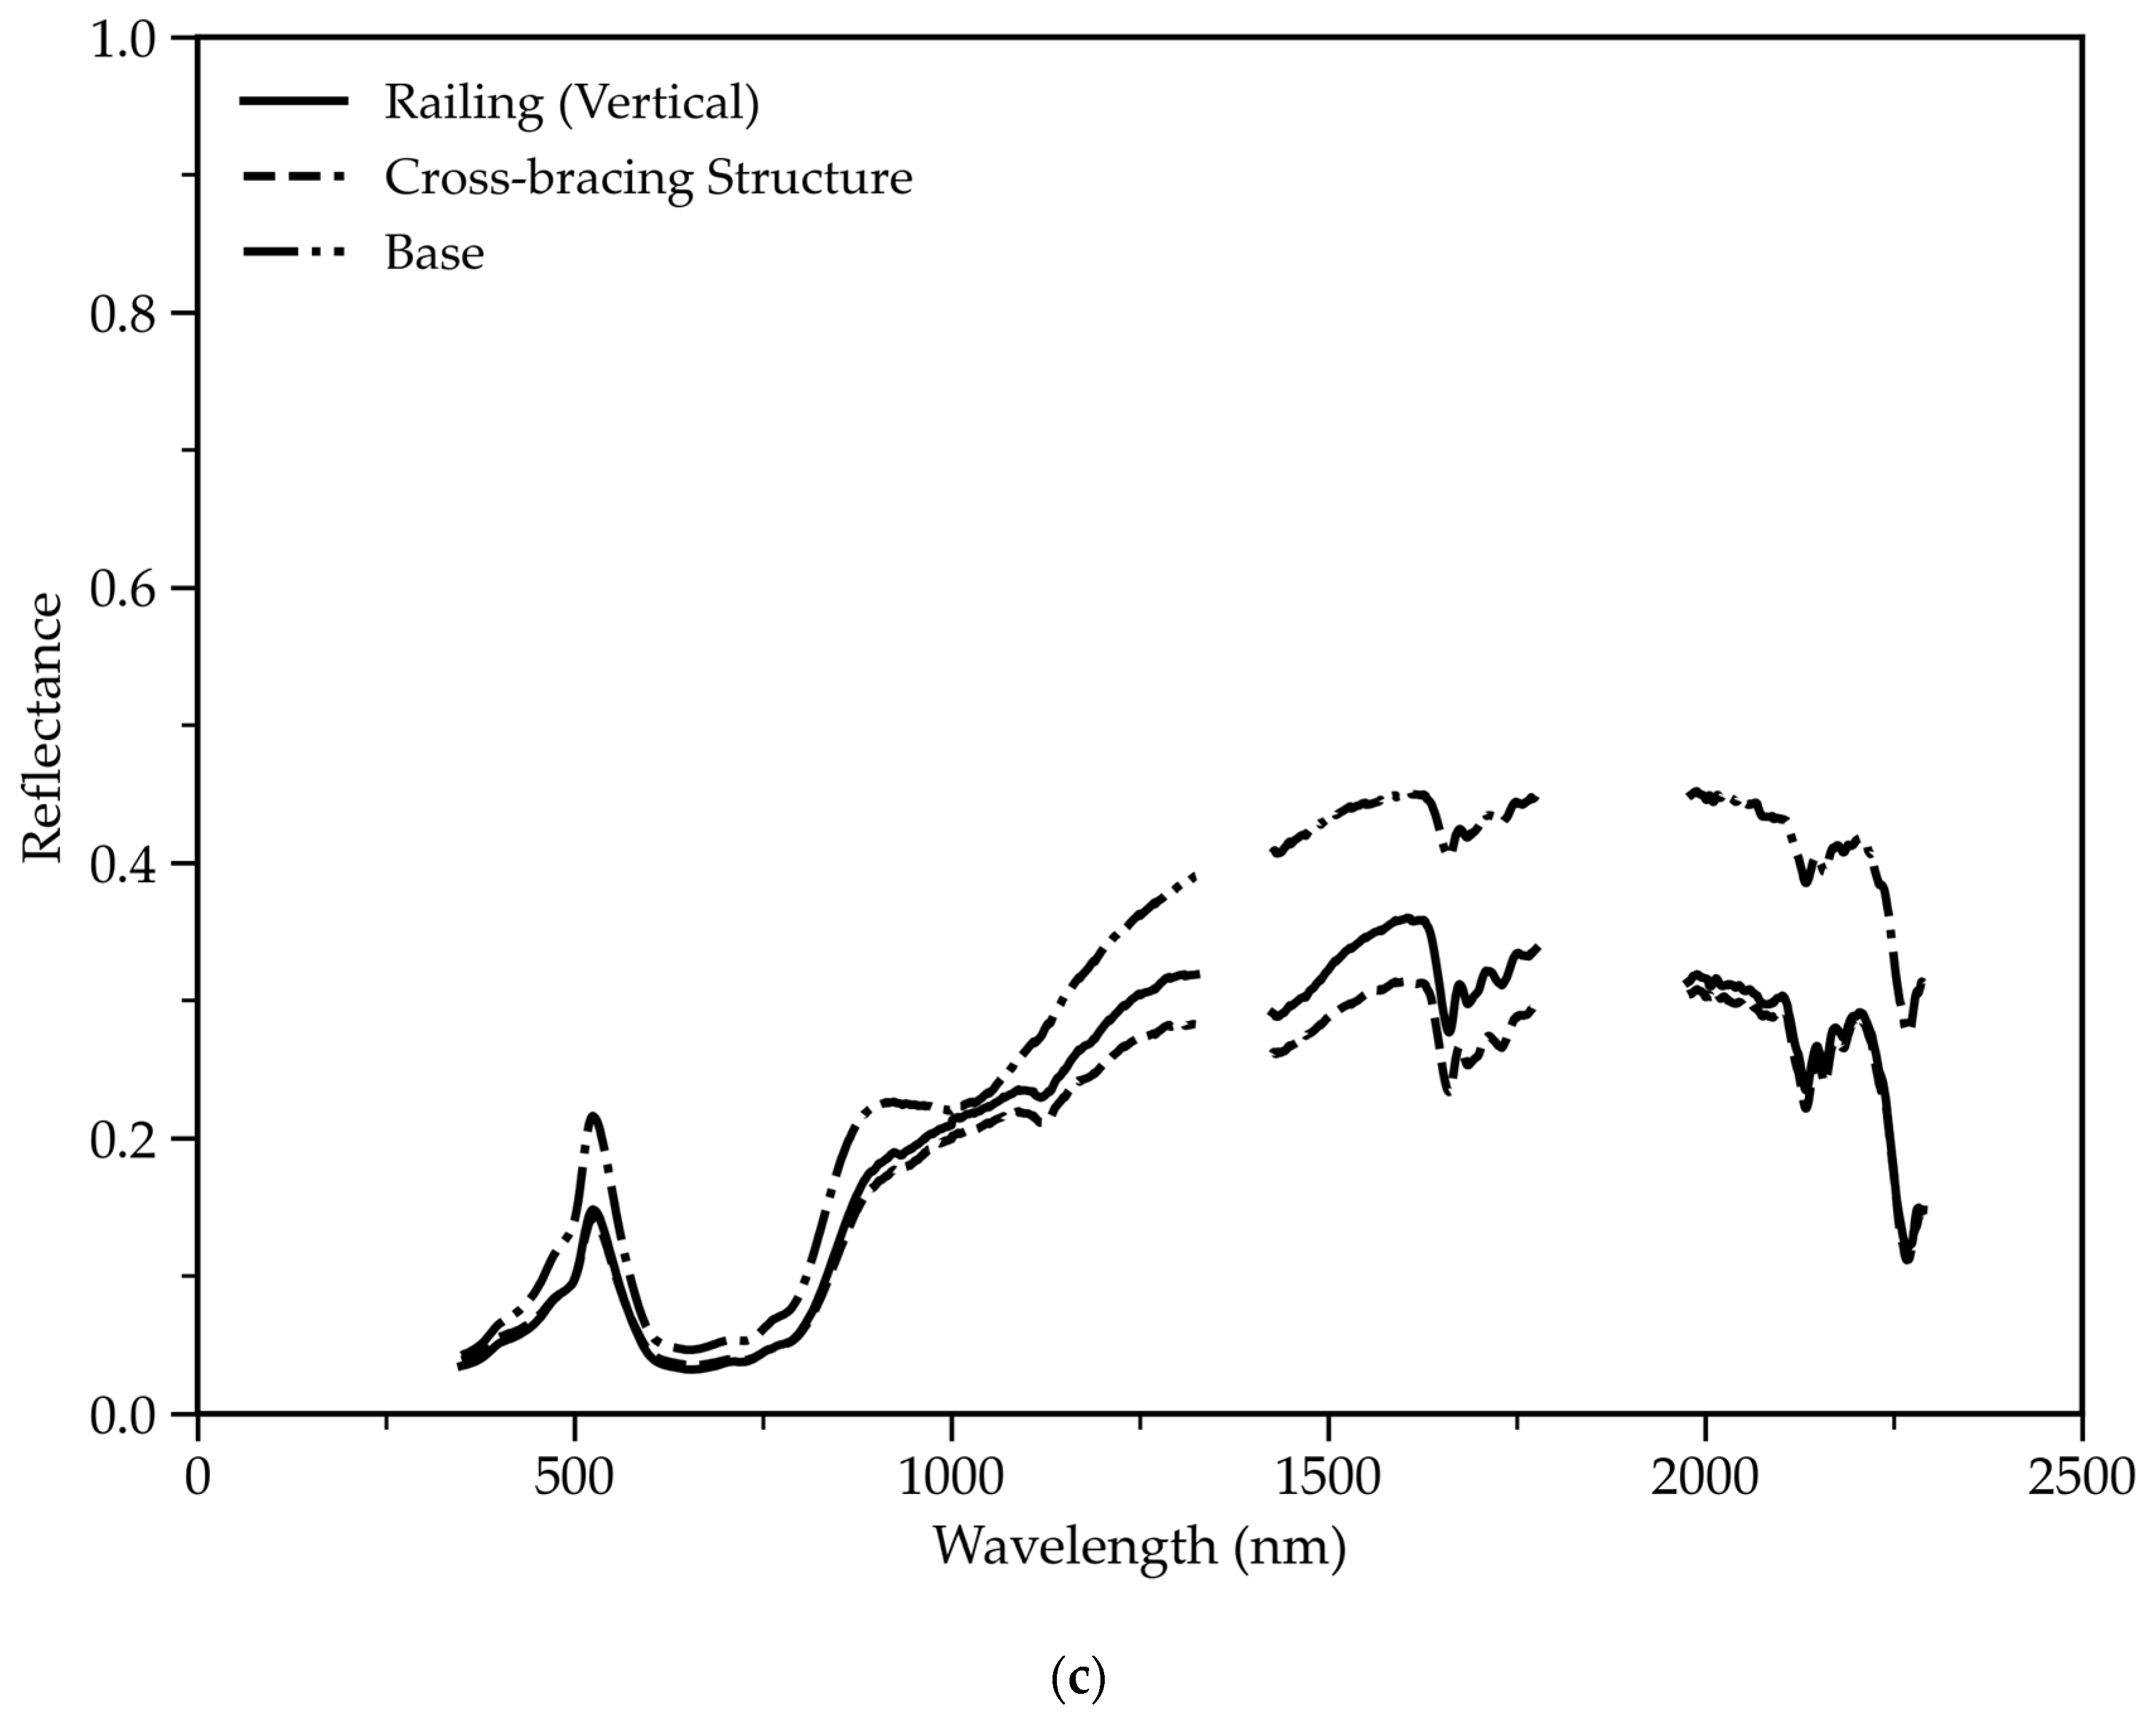
The reflectance of the green tower at the grassland site is shown in Figure 12c. In the visible range, the reflectance of the green band is elevated (~0.2), whereas that of the other bands remains at approximately 0.05. The near-infrared reflectance gradually increases to a plateau in the shortwave infrared band, reaching a maximum of ~0.4. Compared with the white towers, the green tower has smaller differences among positions, although the platform base still displays the highest reflectance.
Despite the Lambertian assumption, the observed position-dependent variations can be attributed to a combination of structural, material, and measurement factors. Structurally, uneven incident light, shadowing, and multiple intersurface reflections induce differences in reflectance across tower surfaces. Material properties, including differences in color and surface composition between white and green towers, further contribute to these variations. Additionally, the measurement conditions, such as the specific observation location and the time of measurement at each site, introduce minor differences in the recorded spectra. Collectively, these factors explain the observed deviations from the idealized Lambertian behavior.
Overall, the highest reflectance consistently occurs at horizontal surfaces, particularly the platform base, and the spectral differences among positions are more pronounced for white towers than for the green tower. These findings quantify the real-world deviations from the Lambertian assumption, providing reference values for simulating tower-influenced albedo.
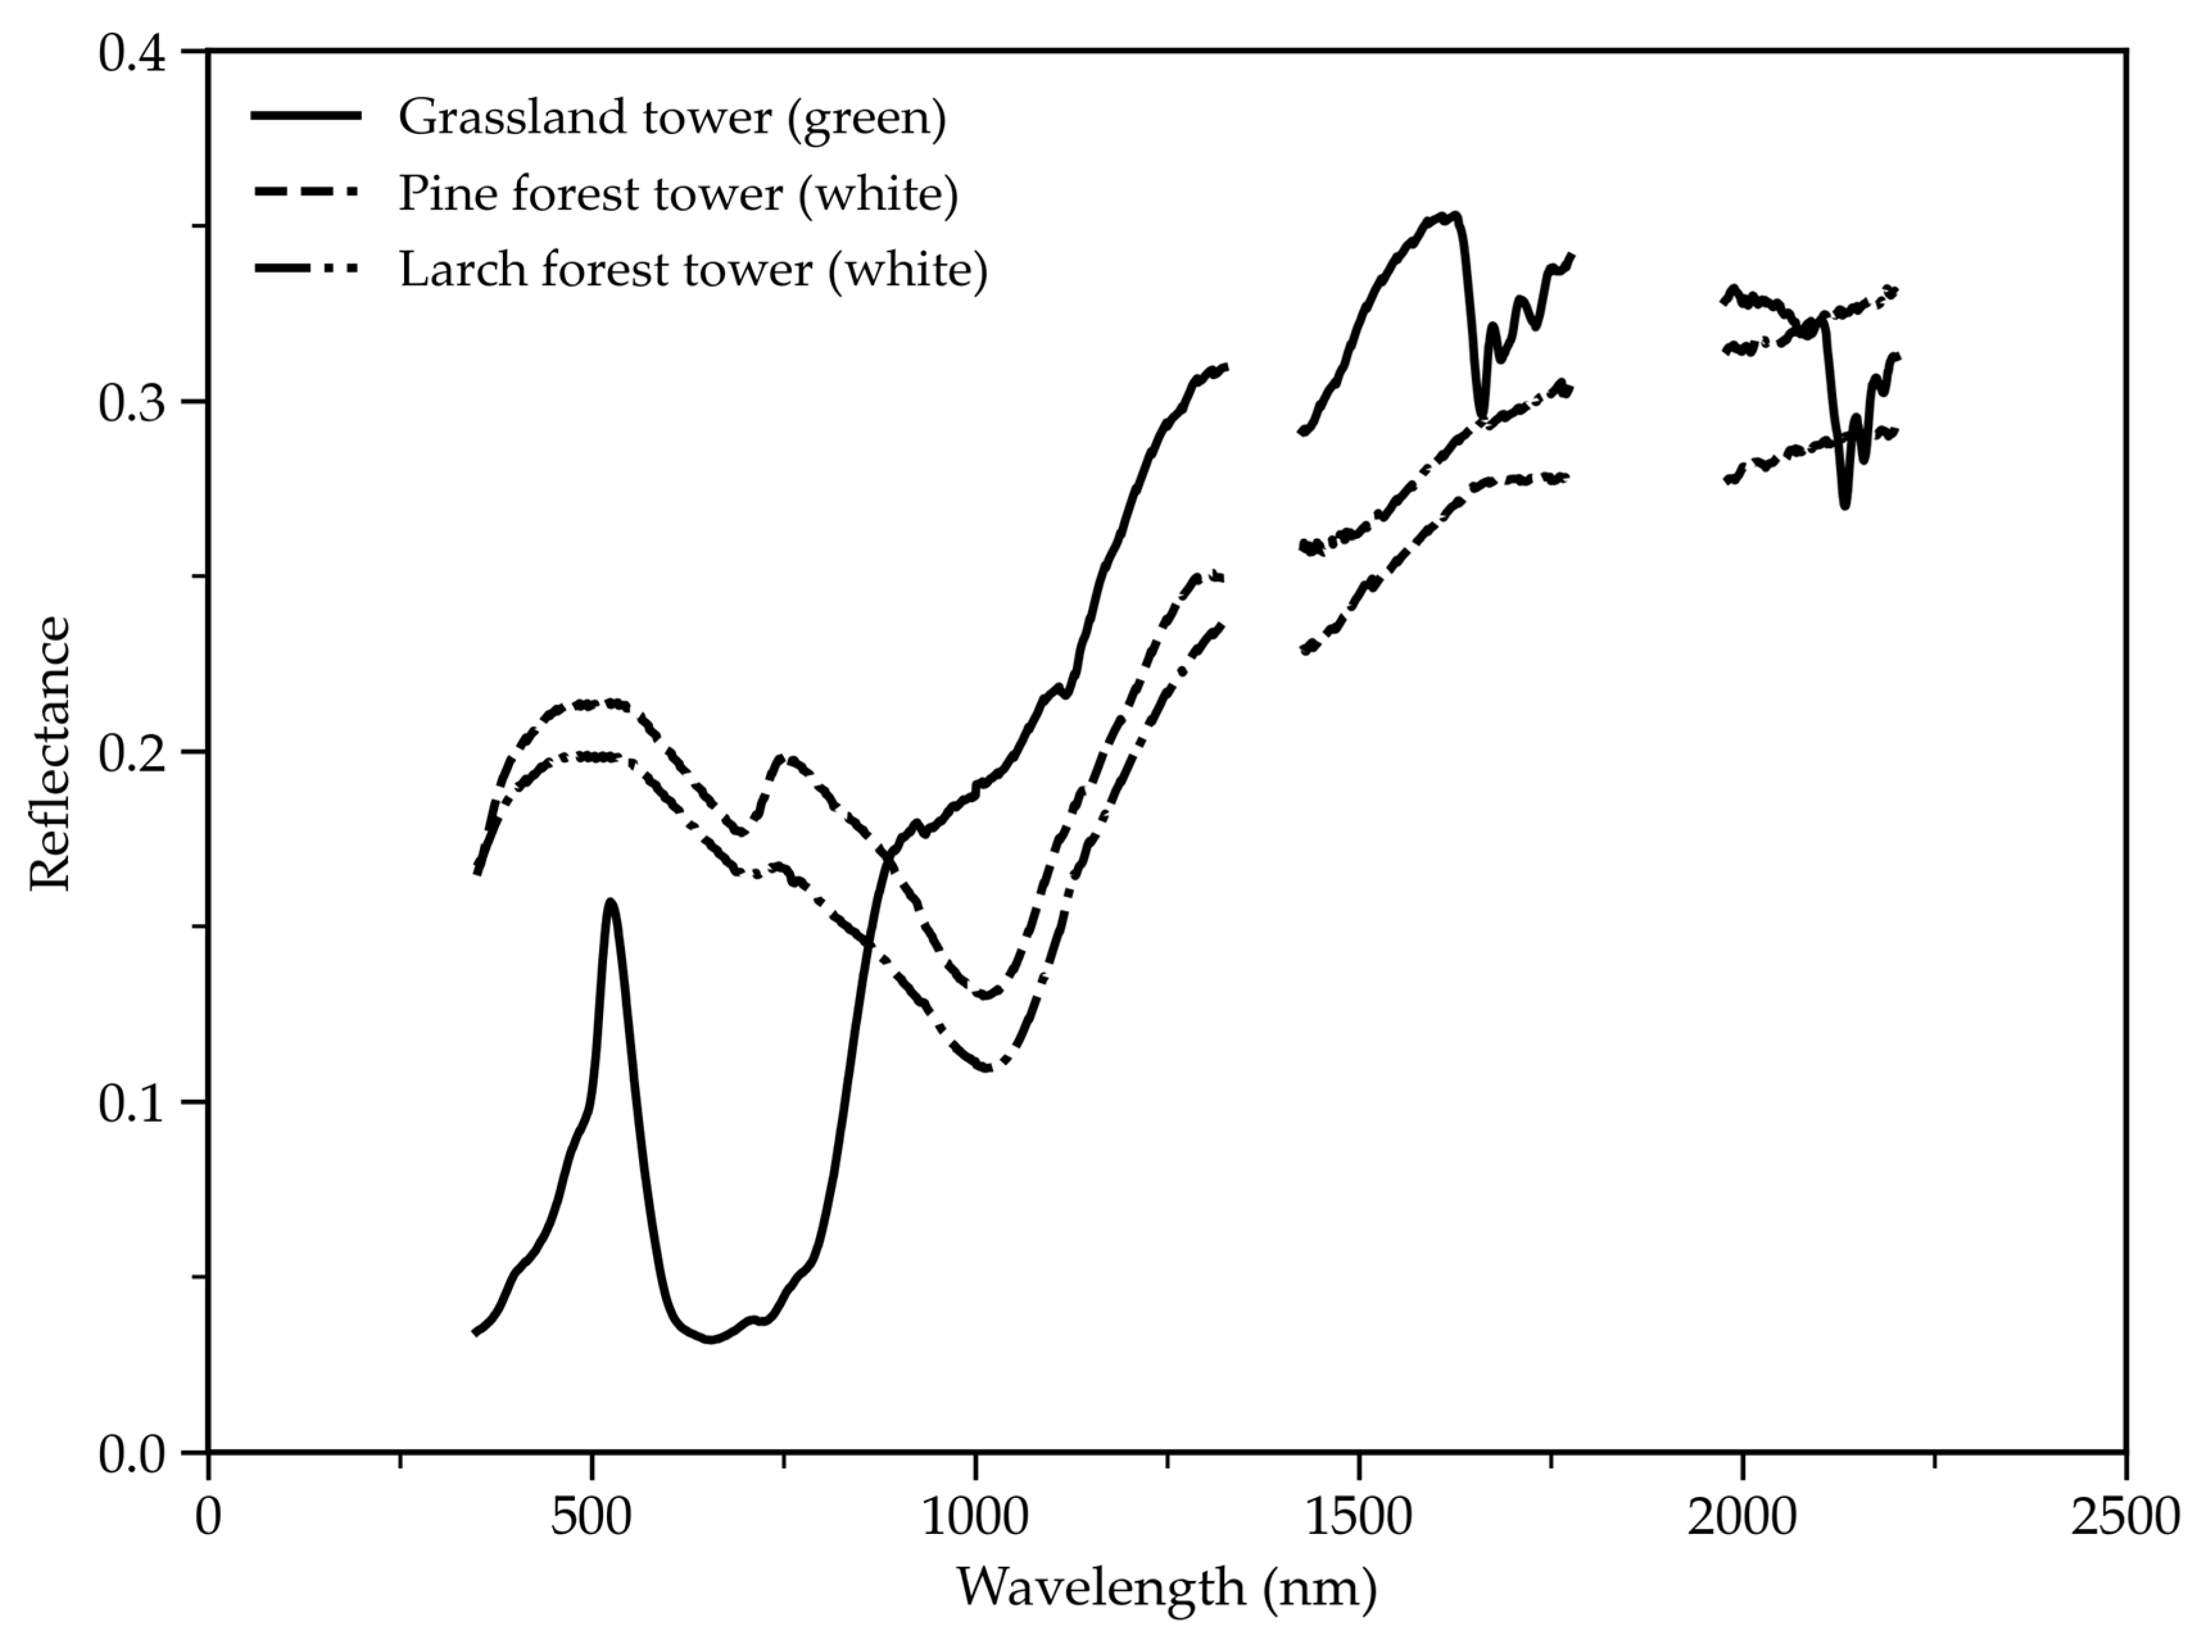
Reflectance spectra from different tower components were integrated to estimate the effective tower albedo. For white towers, the albedo derived from the tower base was 0.62 at the larch forest site and 0.67 at the pine forest site. As the base has the highest reflectance among all the components, these values represent the upper bound of the tower albedo. The lowest albedo values were obtained from the pillar at the pine forest site (0.14) and from the vertical railing at the larch forest site (0.04). Although the tower base has a relatively high reflectance, it accounts for only a very small fraction of the tower’s total surface area. Therefore, its contribution to the integrated tower albedo was downweighted. A weight of 0.05 was assigned to the base, whereas the remaining components collectively accounted for 0.95. This weighting scheme was directly assigned to reflect the negligible spatial proportion of the base relative to the entire tower structure. Figure 13 shows the weighted-average reflectance spectra of the three observation towers, yielding integrated albedo values of 0.22 for the white tower and 0.21 for the green tower (Table 6). These values are lower than those assumed in the simulation experiments, and the color difference is much less pronounced.
The overestimation arises from both perceptual and physical factors. Visually, the white tower appears brighter than its surroundings, suggesting strong interference with ground observations. In reality, its metallic surfaces are not truly white, exhibit angle-dependent reflectance, and do not maintain high reflectance across the full spectrum. Moreover, with the applied weighting, high-reflectance areas represent only a small fraction of the albedometer’s field of view, and the integrated albedo is dominated by low-reflectance surfaces.
Similarly, the small difference in albedo between the white and green towers arises from spectral compensation across different wavelength regions. The white tower exhibits higher reflectance in the visible bands, particularly in the blue and red wavelengths, whereas the green tower shows relatively higher reflectance in the near-infrared and shortwave infrared regions. When the albedo is calculated by integrating the reflectance over the full spectrum, the increased visible reflectance of the white tower is largely offset by the increased long-wavelength reflectance of the green tower, resulting in only a minor difference in the broadband albedo.

3.3.2. Verification of the Tower Effect at the Saihanba Observation Towers

Surface scenes at the three Saihanba sites were simulated on the basis of the actual underlying surface composition to evaluate the obstruction effect of the tower bodies. Table 7 presents simulated and ground-measured albedo values for both tower-free and tower-influenced conditions. The albedo values for the pine and larch forests were less than 0.10, which is consistent with the typical albedo of dense forests during the growing season, whereas the grassland value was 0.14—slightly lower than the typical range, likely because of the darker soil background caused by the higher moisture content.
Under actual site conditions, the differences between the tower-influenced and tower-free albedo values were consistently less than 0.002, an order of magnitude smaller than those in the hypothetical simulations. Such differences fall well within measurement uncertainty and can be considered operationally negligible, indicating that no tower obstruction correction is required for these sites. The smaller magnitude of influence compared with the initial estimates is attributed primarily to the actual albedo of the tower bodies being less than the values assumed in earlier simulations.
The absolute deviations between the simulated and ground-measured albedo values were less than 0.01 for all the sites, confirming the reliability of the simulation results.

4. Discussion

4.1. Uncertainty in Ground Experiments

Assuming proper calibration of the albedometer and spectrometer, the primary sources of uncertainty in ground-based experiments arise from angular measurement errors and the methodology for acquiring ground reflectance data.
For multiangle ground reflectance measurements, both the zenith and azimuth angles are subject to similar precision constraints. Although the goniometer has a nominal zenith angle resolution of 0.01°, the handheld operation limits the actual accuracy to approximately 1°. The azimuth angles, restricted to four directions—forward and backward in the solar principal plane and in the plane perpendicular to it—are determined from solar geometry calculations, with a comparable precision of approximately 1°.
Beyond angular measurement errors, differences also arise from the spatial sampling strategy relative to satellite-based approaches. The Ambrals algorithm, which generates MODIS BRDF/Albedo products, uses multiday and multiangle observations nominally targeting the same central area. In contrast, the field measurements in this study used the tower base as the observation center, preventing repeated multiangle observations of an identical central region. As a result, the multiangle data represent reflectance measurements of ground surfaces surrounding the tower rather than a perfectly centered area.
Given the relatively homogeneous surface conditions at the study sites, these sources of uncertainty are unlikely to introduce systematic bias, and their magnitude remains within acceptable limits for the intended applications.

4.2. Errors Induced by the Simplification of the Tower Body

The impact of tower structures on albedo observations was assessed, but certain limitations inherent to the experimental design introduced potential errors. A key source of uncertainty arises from simplifications in the representation of tower geometry. Given the complex and diverse designs of observation towers at real sites, the simulations could not explicitly resolve all structural details. To ensure computational efficiency, the tower geometry was therefore modeled in a simplified form. In addition, tower obstructions were approximated using planar elements, without explicitly resolving the three-dimensional truss structure of real observation towers. This geometric simplification neglects the potential effects associated with structural porosity and internal scattering and therefore introduces an additional source of uncertainty into the estimated tower effects. More detailed geometric representations would be required only for site-specific applications or analyses targeting higher accuracy.
Another source of uncertainty arises from the estimation of tower albedo on the basis of experimental observations. A weighted averaging approach was applied, with weighting factors assigned empirically to integrate reflectance measurements from different tower components. This procedure assumes that the tower surface behaves as a Lambertian reflector, which allows multi position spectral measurements to be combined into a representative albedo. In reality, observation towers are typically constructed from painted or metallic materials that may exhibit non-Lambertian behavior, including specular or anisotropic reflectance, particularly under direct solar illumination. Such effects are not explicitly represented in the current framework and could, in principle, lead to transient increases in reflected radiance (e.g., specular glint) that are not captured by the Lambertian assumption. The combined influence of non-Lambertian reflectance and empirically assigned weighting factors therefore constitutes an additional source of uncertainty in the estimated tower albedo. Nevertheless, these simplifications are considered acceptable for general conclusions, whereas more rigorous methods are needed for site-specific or highly precise analyses.

4.3. Analysis of the Representativeness of Simulated Scenarios

A total of 1000 simulated land surface scenes were generated in this study, combining site-based surfaces with algorithmically produced scenes. While this dataset cannot encompass all potential surface conditions, it provides statistically sufficient coverage for the purpose of analyzing tower effects. Algorithmically generated scenes may not fully replicate the natural distribution patterns of land surfaces, and the limited availability of 3D vegetation models necessitated the representation of different land cover types with a small set of typical models. Consequently, even site-based scenes approximate the actual surfaces only at a basic level.
Notably, the simulated scenes do not incorporate terrain effects. Therefore, additional experiments are needed to assess whether shadows induced by topographic variability interact with the impact of tower obstruction. Despite these limitations, the current set of simulated scenes is considered adequate to support generalizable conclusions regarding tower effects on albedo observations.

4.4. Assessment of the Applicability and Limitations of the Tower Effect

The field verification results of this study are transferable to sites with surface and tower conditions similar to those in the Saihanba region. Under such conditions, the tower-induced effect on albedo measurements can be considered negligible. However, before this conclusion is applied to other sites, the effective albedo of the tower structure should be estimated in advance. If the tower exhibits a low effective albedo, its influence on ground-based albedo observations is expected to be minimal and may be safely neglected. On the basis of the simulation results, we further recommend that future observation towers avoid the use of high-reflectance materials, such as bright white paint without open structures, to increase the reliability of albedo measurements.
However, over high-albedo backgrounds—such as snow-covered or sparsely vegetated surfaces—the relative contrast between the tower and the underlying surface may increase, potentially amplifying tower-induced biases. These surface conditions were beyond the scope of this study, and additional evaluation of tower effects is therefore necessary.

5. Conclusions

Accurate tower-based albedo measurements are critical for validating remote sensing products and improving the accuracy of Earth surface energy balance studies. However, uncertainties remain regarding the representativeness of such measurements, especially when observation towers exhibit reflectance properties that differ from those of surrounding surfaces, potentially introducing biases. This study provides a systematic assessment of these effects, addressing a previously overlooked source of uncertainty in ground-based albedo observations.
Simulation experiments and field measurements were combined to quantify the tower-induced influence on albedo. Virtual surface scenes with and without towers were analyzed using a three-dimensional radiative transfer model, and field-based multiposition tower reflectance and multiangle ground reflectance provided empirical estimates of actual tower reflectance and tower-free surface albedo. Comparison with tower-mounted albedometer data enabled direct validation of both the simulated and observed results.
The findings indicate that the tower’s reflectance, rather than the albedometer installation height, primarily affects the magnitude of measurement errors. High-reflectance towers can introduce nonnegligible biases, whereas towers with reflectances similar to those of the surrounding surface have minimal influence. Field observations at the three Saihanba towers confirmed that despite appearing brighter in the visible spectrum, the actual broadband reflectance closely matched that of the surrounding surfaces. Therefore, albedo measurements from these towers can be used directly without correction, providing a robust scientific basis for their continued use in the validation of remote sensing products. These results clarify the conditions under which tower effects become significant and support the reliability of existing tower-based datasets under low tower albedo conditions.
While the study establishes a comprehensive framework that integrates simulation and experimental validation, certain limitations remain. Simplifications in tower geometry and obstruction modeling may not capture the full complexity of real-world structures, and the simulated scenes primarily represent vegetated landscapes. Future research should refine tower modeling, extend assessments to diverse surface types—including snow-covered or urban areas—and leverage advanced 3D measurement technologies to enhance structural and spectral characterization. Addressing these aspects will further improve the precision and applicability of tower effect assessments, strengthening the foundation for accurate ground-based albedo observations and their use in remote sensing product validation.

Author Contributions

Conceptualization, H.Z.; methodology, H.Z. and J.Q.; software, J.Q.; validation, Y.Z., P.S., H.W., J.Q., C.L., Z.W., C.M. and R.F.; resources, H.Z., Y.Z., P.S. and H.W.; writing—original draft preparation, J.Q.; writing—review and editing, H.Z. and J.Q.; supervision, H.Z.; project administration, H.Z.; funding acquisition, H.Z. All authors have read and agreed to the published version of the manuscript.

Funding

This research was funded by the National Natural Science Foundation of China (grant No. 42171313, 42090012).

Data Availability Statement

The AmeriFlux site data used in this study are publicly available from the AmeriFlux data portal at https://ameriflux.lbl.gov/ (accessed on 25 November 2024). The LESS radiative transfer model can be accessed at https://lessrt.org/ (accessed on 3 November 2024).

Acknowledgments

The authors thank AmeriFlux for providing open-access data.

Conflicts of Interest

The authors declare no conflicts of interest.

References

  1. Dickinson, R.E. Land processes in climate models. Remote Sens. Environ. 1995, 51, 27–38. [Google Scholar] [CrossRef] [Scilit]
  2. Schaaf, C.B.; Gao, F.; Strahler, A.H.; Lucht, W.; Li, X.; Tsang, T.; Strugnell, N.C.; Zhang, X.; Jin, Y.; Muller, J.-P. First operational BRDF, albedo nadir reflectance products from MODIS. Remote Sens. Environ. 2002, 83, 135–148. [Google Scholar] [CrossRef] [Scilit]
  3. Govaerts, Y.M.; Pinty, B.; Taberner, M.; Lattanzio, A. Spectral conversion of surface albedo derived from Meteosat first generation observations. IEEE Geosci. Remote Sens. Lett. 2006, 3, 23–27. [Google Scholar] [CrossRef]
  4. Muller, J.-P.; López, G.; Watson, G.; Shane, N.; Kennedy, T.; Lewis, P.; Fischer, J.; Guanter, L.; Domench, C.; Preusker, R.; et al. The ESA GlobAlbedo Project for mapping the Earth’s land surface albedo for 15 years from European sensors. In Proceedings of the IEEE International Geoscience and Remote Sensing Symposium, Munich, Germany, 22–27 July 2012. [Google Scholar]
  5. Wen, J.; Dou, B.; You, D.; Tang, Y.; Xiao, Q.; Liu, Q.; Qinhuo, L. Forward a small-timescale BRDF/albedo by multisensor combined BRDF inversion model. IEEE Trans. Geosci. Remote Sens. 2016, 55, 683–697. [Google Scholar] [CrossRef] [Scilit]
  6. Liu, Y.; Wang, Z.; Sun, Q.; Erb, A.M.; Li, Z.; Schaaf, C.B.; Zhang, X.; Román, M.O.; Scott, R.L.; Zhang, Q. Evaluation of the VIIRS BRDF, Albedo and NBAR products suite and an assessment of continuity with the long term MODIS record. Remote Sens. Environ. 2017, 201, 256–274. [Google Scholar] [CrossRef] [Scilit]
  7. Rechid, D.; Raddatz, T.J.; Jacob, D. Parameterization of snow-free land surface albedo as a function of vegetation phenology based on MODIS data and applied in climate modelling. Theor. Appl. Climatol. 2009, 95, 245–255. [Google Scholar] [CrossRef] [Scilit]
  8. Ouyang, Z.; Sciusco, P.; Jiao, T.; Feron, S.; Lei, C.; Li, F.; John, R.; Fan, P.; Li, X.; Williams, C.A. Albedo changes caused by future urbanization contribute to global warming. Nat. Commun. 2022, 13, 3800. [Google Scholar] [CrossRef] [Scilit]
  9. Guo, T.; He, T.; Liang, S.; Roujean, J.-L.; Zhou, Y.; Huang, X. Multi-decadal analysis of high-resolution albedo changes induced by urbanization over contrasted Chinese cities based on Landsat data. Remote Sens. Environ. 2022, 269, 112832. [Google Scholar] [CrossRef] [Scilit]
  10. Sieber, P.; Ericsson, N.; Hammar, T.; Hansson, P.-A. Albedo impacts of current agricultural land use: Crop-specific albedo from MODIS data and inclusion in LCA of crop production. Sci. Total Environ. 2022, 835, 155455. [Google Scholar] [CrossRef] [Scilit]
  11. Peng, J.; Liu, Q.; Wen, J.; Liu, Q.; Tang, Y.; Wang, L.; Dou, B.; You, D.; Sun, C.; Zhao, X. Multi-scale validation strategy for satellite albedo products and its uncertainty analysis. Sci. China Earth Sci. 2015, 58, 573–588. [Google Scholar] [CrossRef] [Scilit]
  12. Franch, B.; Vermote, E.; Claverie, M. Intercomparison of Landsat albedo retrieval techniques and evaluation against in situ measurements across the US SURFRAD network. Remote Sens. Environ. 2014, 152, 627–637. [Google Scholar] [CrossRef] [Scilit]
  13. Jin, Y.; Schaaf, C.B.; Woodcock, C.E.; Gao, F.; Li, X.; Strahler, A.H.; Lucht, W.; Liang, S. Consistency of MODIS surface bidirectional reflectance distribution function and albedo retrievals: 2. Validation. J. Geophys. Res. Atmos. 2003, 108, 4159. [Google Scholar] [CrossRef] [Scilit]
  14. Wang, K.; Liu, J.; Zhou, X.; Sparrow, M.; Ma, M.; Sun, Z.; Jiang, W. Validation of the MODIS global land surface albedo product using ground measurements in a semidesert region on the Tibetan Plateau. J. Geophys. Res. Atmos. 2004, 109, D05107. [Google Scholar] [CrossRef] [Scilit]
  15. Stroeve, J.; Box, J.E.; Gao, F.; Liang, S.; Nolin, A.; Schaaf, C. Accuracy assessment of the MODIS 16-day albedo product for snow: Comparisons with Greenland in situ measurements. Remote Sens. Environ. 2005, 94, 46–60. [Google Scholar] [CrossRef] [Scilit]
  16. Salomon, J.G.; Schaaf, C.B.; Strahler, A.H.; Gao, F.; Jin, Y. Validation of the MODIS bidirectional reflectance distribution function and albedo retrievals using combined observations from the aqua and terra platforms. IEEE Trans. Geosci. Remote Sens. 2006, 44, 1555–1565. [Google Scholar] [CrossRef]
  17. Liu, J.; Schaaf, C.; Strahler, A.; Jiao, Z.; Shuai, Y.; Zhang, Q.; Roman, M.; Augustine, J.A.; Dutton, E.G. Validation of Moderate Resolution Imaging Spectroradiometer (MODIS) albedo retrieval algorithm: Dependence of albedo on solar zenith angle. J. Geophys. Res. Atmos. 2009, 114. [Google Scholar] [CrossRef] [Scilit]
  18. Román, M.O.; Schaaf, C.B.; Woodcock, C.E.; Strahler, A.H.; Yang, X.; Braswell, R.H.; Curtis, P.S.; Davis, K.J.; Dragoni, D.; Goulden, M.L. The MODIS (Collection V005) BRDF/albedo product: Assessment of spatial representativeness over forested landscapes. Remote Sens. Environ. 2009, 113, 2476–2498. [Google Scholar] [CrossRef] [Scilit]
  19. Román, M.O.; Gatebe, C.K.; Schaaf, C.B.; Poudyal, R.; Wang, Z.; King, M.D. Variability in surface BRDF at different spatial scales (30 m–500 m) over a mixed agricultural landscape as retrieved from airborne and satellite spectral measurements. Remote Sens. Environ. 2011, 115, 2184–2203. [Google Scholar] [CrossRef] [Scilit]
  20. Wang, K.; Liang, S.; Schaaf, C.L.; Strahler, A.H. Evaluation of Moderate Resolution Imaging Spectroradiometer land surface visible and shortwave albedo products at FLUXNET sites. J. Geophys. Res. Atmos. 2010, 115. [Google Scholar] [CrossRef] [Scilit]
  21. Wang, Z.; Schaaf, C.B.; Chopping, M.J.; Strahler, A.H.; Wang, J.; Román, M.O.; Rocha, A.V.; Woodcock, C.E.; Shuai, Y. Evaluation of Moderate-resolution Imaging Spectroradiometer (MODIS) snow albedo product (MCD43A) over tundra. Remote Sens. Environ. 2012, 117, 264–280. [Google Scholar] [CrossRef] [Scilit]
  22. Román, M.O.; Gatebe, C.K.; Shuai, Y.; Wang, Z.; Gao, F.; Masek, J.G.; He, T.; Liang, S.; Schaaf, C.B. Use of in situ and airborne multiangle data to assess MODIS-and Landsat-based estimates of directional reflectance and albedo. IEEE Trans. Geosci. Remote Sens. 2013, 51, 1393–1404. [Google Scholar] [CrossRef] [Scilit]
  23. Wang, Z.; Schaaf, C.B.; Strahler, A.H.; Chopping, M.J.; Román, M.O.; Shuai, Y.; Woodcock, C.E.; Hollinger, D.Y.; Fitzjarrald, D.R. Evaluation of MODIS albedo product (MCD43A) over grassland, agriculture and forest surface types during dormant and snow-covered periods. Remote Sens. Environ. 2014, 140, 60–77. [Google Scholar] [CrossRef] [Scilit]
  24. Liang, S.; Fang, H.; Chen, M.; Shuey, C.J.; Walthall, C.; Daughtry, C.; Morisette, J.; Schaaf, C.; Strahler, A. Validating MODIS land surface reflectance and albedo products: Methods and preliminary results. Remote Sens. Environ. 2002, 83, 149–162. [Google Scholar] [CrossRef] [Scilit]
  25. Zhang, R.; Tian, J.; Li, Z.; Su, H.; Chen, S.; Tang, X. Principles and methods for the validation of quantitative remote sensing products. Sci. China Earth Sci. 2010, 53, 741–751. [Google Scholar] [CrossRef] [Scilit]
  26. Susaki, J.; Yasuoka, Y.; Kajiwara, K.; Honda, Y.; Hara, K. Validation of MODIS albedo products of paddy fields in Japan. IEEE Trans. Geosci. Remote Sens. 2006, 45, 206–217. [Google Scholar] [CrossRef]
  27. Wu, X.; Wen, J.; Xiao, Q.; Liu, Q.; Peng, J.; Dou, B.; Li, X.; You, D.; Tang, Y.; Liu, Q. Coarse scale in situ albedo observations over heterogeneous snow-free land surfaces and validation strategy: A case of MODIS albedo products preliminary validation over northern China. Remote Sens. Environ. 2016, 184, 25–39. [Google Scholar] [CrossRef] [Scilit]
  28. Ohmura, A.; Dutton, E.G.; Forgan, B.; Fröhlich, C.; Gilgen, H.; Hegner, H.; Heimo, A.; König-Langlo, G.; McArthur, B.; Müller, G.; et al. Baseline Surface Radiation Network (BSRN/WCRP): New Precision Radiometry for Climate Research. Bull. Am. Meteorol. Soc. 1998, 79, 2115–2136. [Google Scholar] [CrossRef] [Scilit]
  29. Augustine, J.A.; DeLuisi, J.J.; Long, C.N. SURFRAD—A National Surface Radiation Budget Network for Atmospheric Research. Bull. Am. Meteorol. Soc. 2000, 81, 2341–2358. [Google Scholar] [CrossRef] [Scilit]
  30. Ackerman, T.P.; Stokes, G.M. The atmospheric radiation measurement program. Phys. Today 2003, 56, 38–44. [Google Scholar] [CrossRef] [Scilit]
  31. Baldocchi, D.; Falge, E.; Gu, L.; Olson, R.; Hollinger, D.; Running, S.; Anthoni, P.; Bernhofer, C.; Davis, K.; Evans, R. FLUXNET: A new tool to study the temporal and spatial variability of ecosystem-scale carbon dioxide, water vapor, and energy flux densities. Bull. Am. Meteorol. Soc. 2001, 82, 2415–2434. [Google Scholar] [CrossRef] [Scilit]
  32. Li, X.; Cheng, G.; Liu, S.; Xiao, Q.; Ma, M.; Jin, R.; Che, T.; Liu, Q.; Wang, W.; Qi, Y. Heihe watershed allied telemetry experimental research (HiWATER): Scientific objectives and experimental design. Bull. Am. Meteorol. Soc. 2013, 94, 1145–1160. [Google Scholar] [CrossRef] [Scilit]
  33. Cooperation (CEC), C.f.E. North American Environmental Atlas—Land Cover 2020 30 m. Available online: https://www.cec.org/north-american-environmental-atlas/land-cover-30m-2020/ (accessed on 30 September 2025).
  34. Zhang, X.; Liu, L.; Chen, X.; Gao, Y.; Xie, S.; Mi, J. GLC_FCS30: Global land-cover product with fine classification system at 30 m using time-series Landsat imagery. Earth Syst. Sci. Data Discuss. 2020, 13, 2753–2776. [Google Scholar] [CrossRef] [Scilit]
  35. Qi, J.; Xie, D.; Yin, T.; Yan, G.; Gastellu-Etchegorry, J.-P.; Li, L.; Zhang, W.; Mu, X.; Norford, L.K. LESS: LargE-Scale remote sensing data and image simulation framework over heterogeneous 3D scenes. Remote Sens. Environ. 2019, 221, 695–706. [Google Scholar] [CrossRef] [Scilit]
  36. Roujean, J.L.; Leroy, M.; Deschamps, P.Y. A bidirectional reflectance model of the Earth’s surface for the correction of remote sensing data. J. Geophys. Res. Atmos. 1992, 97, 20455–20468. [Google Scholar] [CrossRef] [Scilit]
  37. Liang, S. Narrowband to broadband conversions of land surface albedo I: Algorithms. Remote Sens. Environ. 2001, 76, 213–238. [Google Scholar] [CrossRef] [Scilit]
  38. Xia, F.; Liu, J.; Nie, H.; Fu, Y.; Wan, L.; Kong, X. Random walks: A review of algorithms and applications. IEEE Trans. Emerg. Top. Comput. Intell. 2019, 4, 95–107. [Google Scholar] [CrossRef] [Scilit]
Figure 1. Spatial distribution of the observation sites in the Saihanba region. The photographs on the right illustrate the representative underlying surface conditions and observation towers at each site.
Remotesensing 18 00631 g001
Figure 2. Distribution of AmeriFlux sites involving the observation of albedo. Red dots mark the locations of these sites.
Remotesensing 18 00631 g002
Figure 3. Framework for evaluating the impact of observation towers.
Remotesensing 18 00631 g003
Figure 4. Schematic representation of a tower slice unit. This unit corresponds to a projected structural slice of the tower and is used as an elemental component for constructing the tower in the simulation framework.
Remotesensing 18 00631 g004
Figure 5. Obstruction patterns of the tower body at different simulation scales derived using the central projection rule: (a) 10 m (5 × 5 grid), (b) 20 m (9 × 9 grid), (c) 35 m (15 × 15 grid), and (d) 50 m (21 × 21 grid). Each grid cell represents an area of 30 m × 30 m.
Remotesensing 18 00631 g005
Figure 6. Land cover type distribution for the existing site scenes. The color scale represents the number of scenes for different combinations of the main land cover type and land cover type of the center unit. The histograms at the top and right show the number of occurrences of each land cover type as the central land cover and as the main land cover, respectively.
Remotesensing 18 00631 g006
Figure 7. Distribution of the heterogeneity of the existing site scenes. Level 1: homogeneous; level 2: moderately heterogeneous; and level 3: highly heterogeneous.
Remotesensing 18 00631 g007
Figure 8. Land cover type distribution for all scenes. The color scale represents the number of scenes for different combinations of the main land cover type and land cover type of the center unit. The histograms at the top and right show the number of occurrences of each land cover type as the central land cover and as the main land cover, respectively.
Remotesensing 18 00631 g008
Figure 9. Distribution of the heterogeneity of all the scenes. Level 1: homogeneous; level 2: moderately heterogeneous; and level 3: highly heterogeneous.
Remotesensing 18 00631 g009
Figure 10. Obstruction patterns simplified using tower units at different simulation scales. In (a), black grids indicate the standard tower units that must be replaced for an albedometer installation height of 10 m. (b) Corresponding pattern for a height of 20 m. (c) Pattern for 35 m and (d) pattern for 50 m.
Remotesensing 18 00631 g010
Figure 11. Scatter plots of albedo in the tower-free and tower-influenced simulated scenes with different relative installation heights and tower colors: (a) white tower at 10 m, (b) white tower at 20 m, (c) white tower at 35 m, (d) white tower at 50 m, (e) green tower at 10 m, (f) green tower at 20 m, (g) green tower at 35 m, and (h) green tower at 50 m.
Remotesensing 18 00631 g011
Figure 12. Reflectance spectra at different positions of the tower bodies: (a) white tower at the pine forest site; (b) white tower at the larch forest site; and (c) green tower at the grassland site.
Remotesensing 18 00631 g012aRemotesensing 18 00631 g012b
Figure 13. Actual reflectance spectra of the tower bodies for the three observation towers at Saihanba.
Remotesensing 18 00631 g013
Table 1. Basic information of the three observation towers in the Saihanba region.
Land Cover TypeLatitudeLongitudeTower ColorTower Height (m)Albedometer Height (m)
Larch Forest42.41°N117.31°EWhite4020
Pine Forest42.39°N117.37°EWhite4015
Grassland42.24°N117.08°EGreen2010
Note: Albedometer height in this table indicates the relative distance between the albedometer and the observed canopy.
Table 2. Land cover type classification system of the simulated scenes.
Land Cover IDLand Cover Type
1Evergreen Broadleaf Forest
2Evergreen Needleleaf Forest
3Deciduous Needleleaf Forest
4Deciduous Broadleaf Forest
5Mixed Forest
6Closed Shrublands
7Open Shrublands
8Savannas
9Grassland
10Wetland
11Cropland
12Cropland/Natural Vegetation Mosaic
13Water
Table 3. Basic information about the simulated tower.
Tower ColorAlbedometer HeightsStructureAssumed Tower Albedo
White10/20/35/50 mSelf-supporting0.6
Green0.3
Table 4. Angle information and data collection times for multiangle reflection observations.
Pine Forest SiteLarch Forest SiteGrassland Site
10:00~10:05 AM11:00~11:06 AM13:35~13:40 PM
VZA (°)VAA (°)VZA (°)VAA (°)VZA (°)VAA (°)
56310623364037
37310193366637
6040296623127
1740696672127
552205915662217
752207715624217
541307524659307
341305024677307
Table 5. Obstruction conditions at various simulation heights.
Albedo Height (m)10203550
Scene Scale (pixels)5Í59Í915Í1521Í21
Scene Area (m2)22,50072,900202,500396,900
Obstruction Pattern Area (m2)2139.87064.419,563.137,966
Obstruction Ratio (%)9.51 9.69 9.66 9.56
Ratio-based Obstruction Pixels 2.377.8521.7442.35
Rounded Ratio-based Obstruction Pixels282242
Pixel-based Obstruction Ratio (%)89.889.789.52
Table 6. Tower body albedos based on observations for the three observation towers at Saihanba.
SiteTower ColorAlbedo
pine forest white0.22
larch forestwhite0.22
grasslandgreen0.21
Table 7. Comparison of the simulated and observed albedos of the three observation towers.
Site A t f , g A t i , g A t f , s A t i , s | d i f f | t f | d i f f | t i
Pine Forest Site0.08770.08930.08740.09290.00030.0036
Larch Forest Site0.09130.09080.09130.098300.0075
Grassland Site0.13860.14010.13840.13970.00020.0004
Note: A represents the albedo, and | d i f f | represents the absolute difference between the simulated and ground-observed albedo. Subscripts t f and t i indicate tower-free and tower-influenced conditions, respectively, whereas g and s denote ground-observed and simulated values, respectively.
Disclaimer/Publisher’s Note: The statements, opinions and data contained in all publications are solely those of the individual author(s) and contributor(s) and not of MDPI and/or the editor(s). MDPI and/or the editor(s) disclaim responsibility for any injury to people or property resulting from any ideas, methods, instructions or products referred to in the content.