Technical Note

High-Spatial- and -Temporal-Resolution Sargassum AFAI Coastal Dataset for Guadeloupe, Martinique and Yucatán

LEGOS, Université de Toulouse, IRD, CNRS, CNES, UPS, 31400 Toulouse, France
*
Author to whom correspondence should be addressed.
Remote Sens. 2026, 18(4), 624; https://doi.org/10.3390/rs18040624
Submission received: 15 January 2026 / Revised: 3 February 2026 / Accepted: 11 February 2026 / Published: 17 February 2026
(This article belongs to the Section Ocean Remote Sensing)

Highlights

What are the main findings?
  • Sargassum detections at very high resolution derived from the VEN μ S (Vegetation and Environment New Micro-Satellite) mission with daily observations at 4 m resolution.
  • Daily time resolution allows coastal stranding dynamics and fine-scale organisation of Sargassum near the coast to be followed.
What is the implication of the main findings?
  • Fine-scale mapping of Sargassum influx along the coastline according to coast type and Sargassum occurrence.

Abstract

Recurrent massive strandings of pelagic Sargassum have severely impacted Caribbean and Gulf of Mexico coastlines over the past decade, generating major environmental, sanitary, and socioeconomic consequences. Accurate monitoring of Sargassum dynamics in nearshore waters remains challenging, as most existing satellite products rely on moderate-resolution sensors that inadequately resolve coastal processes. Here, we present a high-spatial- and -temporal-resolution Sargassum detection dataset derived from the VENµS (Vegetation and Environment New Micro-Satellite) mission, providing daily observations at 4 m resolution for five coastal zones in Guadeloupe, Martinique, and the Yucatán Peninsula over the 2022–2024 period. VENµS imagery consists of 12 multispectral bands, and the analysis specifically uses the red, the red-edge/near-infrared and the short-wave infrared bands. Detection is based on the Alternative Floating Algae Index (AFAI), combined with land and cloud masking, background estimation, and adaptive thresholding. We demonstrate the capability of this dataset to resolve fine-scale Sargassum raft dynamics, characterize the seasonal influx of Sargassum along the coastline, and assess exposure across different coastal typologies. By offering the highest combined spatial and temporal resolution currently available for these regions, this dataset provides a novel resource for coastal impact assessment, nearshore drift analysis, and validation of Sargassum transport and stranding models.

1. Introduction

Recent recurrent macroalgal strandings have posed significant challenges to the Caribbean and Gulf of Mexico coastlines [1], following a North Atlantic Oscillation anomaly in 2010 that facilitated the advection of Sargassum from the Sargasso Sea toward equatorial waters [2,3]. This substantial influx in coastal areas led to Sargassum aggregations consequently impacting the environment and local economy [4]. Extensive beaching events cause major sanitary issues, including neurological, digestive and respiratory disorders, due to harmful H2S gas emanation during decomposition [5,6,7]. Consequently, accurate spatiotemporal data on Sargassum nearshore aggregations are critical for predicting and mitigating these stranding events [8].
Currently, remote sensing optical observations of Sargassum biomass across the Tropical North Atlantic are predominantly derived from intermediate-resolution sensors (e.g., MODIS with 1 km pixel resolution and daily revisit frequency, Sentinel-3 OLCI with 300 m to 1 km pixel resolution and 1–2 days revisit frequency, VIIRS with 750 m pixel resolution and daily revisit frequency, and MERIS with 300 m pixel resolution and 3 days revisit frequency) and mainly used for open ocean detection purposes [8,9]. Such spatial resolutions are limited for effective coastal monitoring, and the corresponding studies were often compelled to mask out the first 20–30 km of nearshore areas to avoid land contamination and mixed pixel issues in shallow water [10].
Given that the most significant ecological and socioeconomic impacts manifest in coastal areas, fine-scale monitoring of these macroalgae in nearshore waters and on beaches is imperative [11,12,13]. While high-resolution satellite missions such as Sentinel-2 MSI (with 10–20 m resolution and a 5–10-day revisit frequency) and Landsat-8 and 9 (with 30 m resolution and a 16-day revisit frequency) offer adequate spatial detail for detection [14], their revisit frequencies might still be insufficient to capture high-frequency dynamic coastal aggregation patterns and temporally track Sargassum rafts accurately.
Moreover, most sub-kilometer sensors with high revisit frequency do not necessarily provide consequent detection time series and are limited to specific study sites. The authors of [15] conducted an airborne study on Greater Florida Bay at a spatial resolution of 1 m with a Portable Remote Imaging Spectrometer (PRISM) for less than a month. This highlights the need for both frequent and high resolution, especially for regions where Sargassum are not the only type of floating debris [15,16]. Both airborne imagery and in situ information help validate satellite information and fill gaps, but provide very limited zones and time series available, hindering systematic Sargassum beaching quantification. To our knowledge, the most up-to-date aerial monitoring was conducted in [17] coupled with in situ camera monitoring for a 2-year time series over Martinique from January 2022 to December 2023.
To address these limitations and support enhanced coastal monitoring, this study presents daily 4 m optical-satellite detections of Sargassum aggregations for Guadeloupe, Martinique, and the Yucatán Peninsula during 2022–2024, the highest combined spatial and temporal resolution currently available for these regions for such a time series. This dataset specifically addresses two critical gaps in current Sargassum monitoring and modeling efforts in coastal areas:
  • The lack of fine-scale, high-revisit imagery necessary to resolve dynamic coastal aggregation patterns.
  • The limited availability of independent validation data for Sargassum drift and stranding coastal models.
Consequently, this dataset is designed to serve researchers requiring a robust, georeferenced, detection layer to better understand transport pathways or Sargassum distribution close to the coast, and also operational modelers seeking reliable satellite-based benchmarks in regions with sparse in situ observations in the Caribbean Arc. The core advantage of the VENµS VM5 mission lies in its high revisit frequency (daily) and spatial resolution. This enables the monitoring of Sargassum aggregation dynamics in coastal areas and provides a daily baseline for comparison in modeling or forecasting systems at these very fine scales. The derived dataset can be used to assess Sargassum residence times and quantify biomass in coastal areas. This work has significant operational application, such as the validation of stranding scenarios, and research applications, including the assessment of the impact of Sargassum accumulation at the bay scale and the assessment of the pressure on ecologically fragile ecosystems such as reefs, mangroves and seagrass, as achieved in [11] at much lower resolution.
This paper describes a dataset of Sargassum detections derived from the Vegetation and Environment New Micro-Satellite (VENµS) satellite acquisitions. Section 2 presents the satellite data and the detection processing chain. Section 3 describes the Sargassum detection AFAI dataset in more detail (Section 3.1) and shows a few illustrations of its content, as well as potential coastal applications with the dataset (Section 3.2). A discussion with conclusion and perspectives are given in Section 4.

2. Materials and Methods

2.1. Satellite Mission Overview

The Vegetation and Environment New Micro-Satellite (VEN μ S) mission is a joint initiative led by the French National Centre for Space Studies (CNES) and Israel Space Agency (ISA), dedicated to high-resolution Earth observation with a focus on vegetation and environmental monitoring [18]. Launched in August 2017, VEN μ S entered its fifth operational phase (VM5) in March 2022, repositioned to a 560 km altitude for data acquisition until 2024.
VEN μ S provides high-quality imagery through its sun-synchronous Super Spectral Camera (VSSC) multispectral sensor, capturing optical images every 1–2 days with a 4 m ground resolution. It features 12 narrow spectral bands, detailed in Table 1, ranging from blue visible (0.420 µm) to near-infrared (0.908 µm), specifically designed for monitoring vegetation and aquatic systems. Level 1C Top-of-Atmosphere (TOA) reflectances, Level 2A surface reflectances (SREs) and Level 3 10-day composite products are publicly available on the CNES GEODES portal (https://geodes-portal.cnes.fr/ accessed on 1 November 2024) for 105 selected science sites [19].

2.2. Study Area and Data Collection

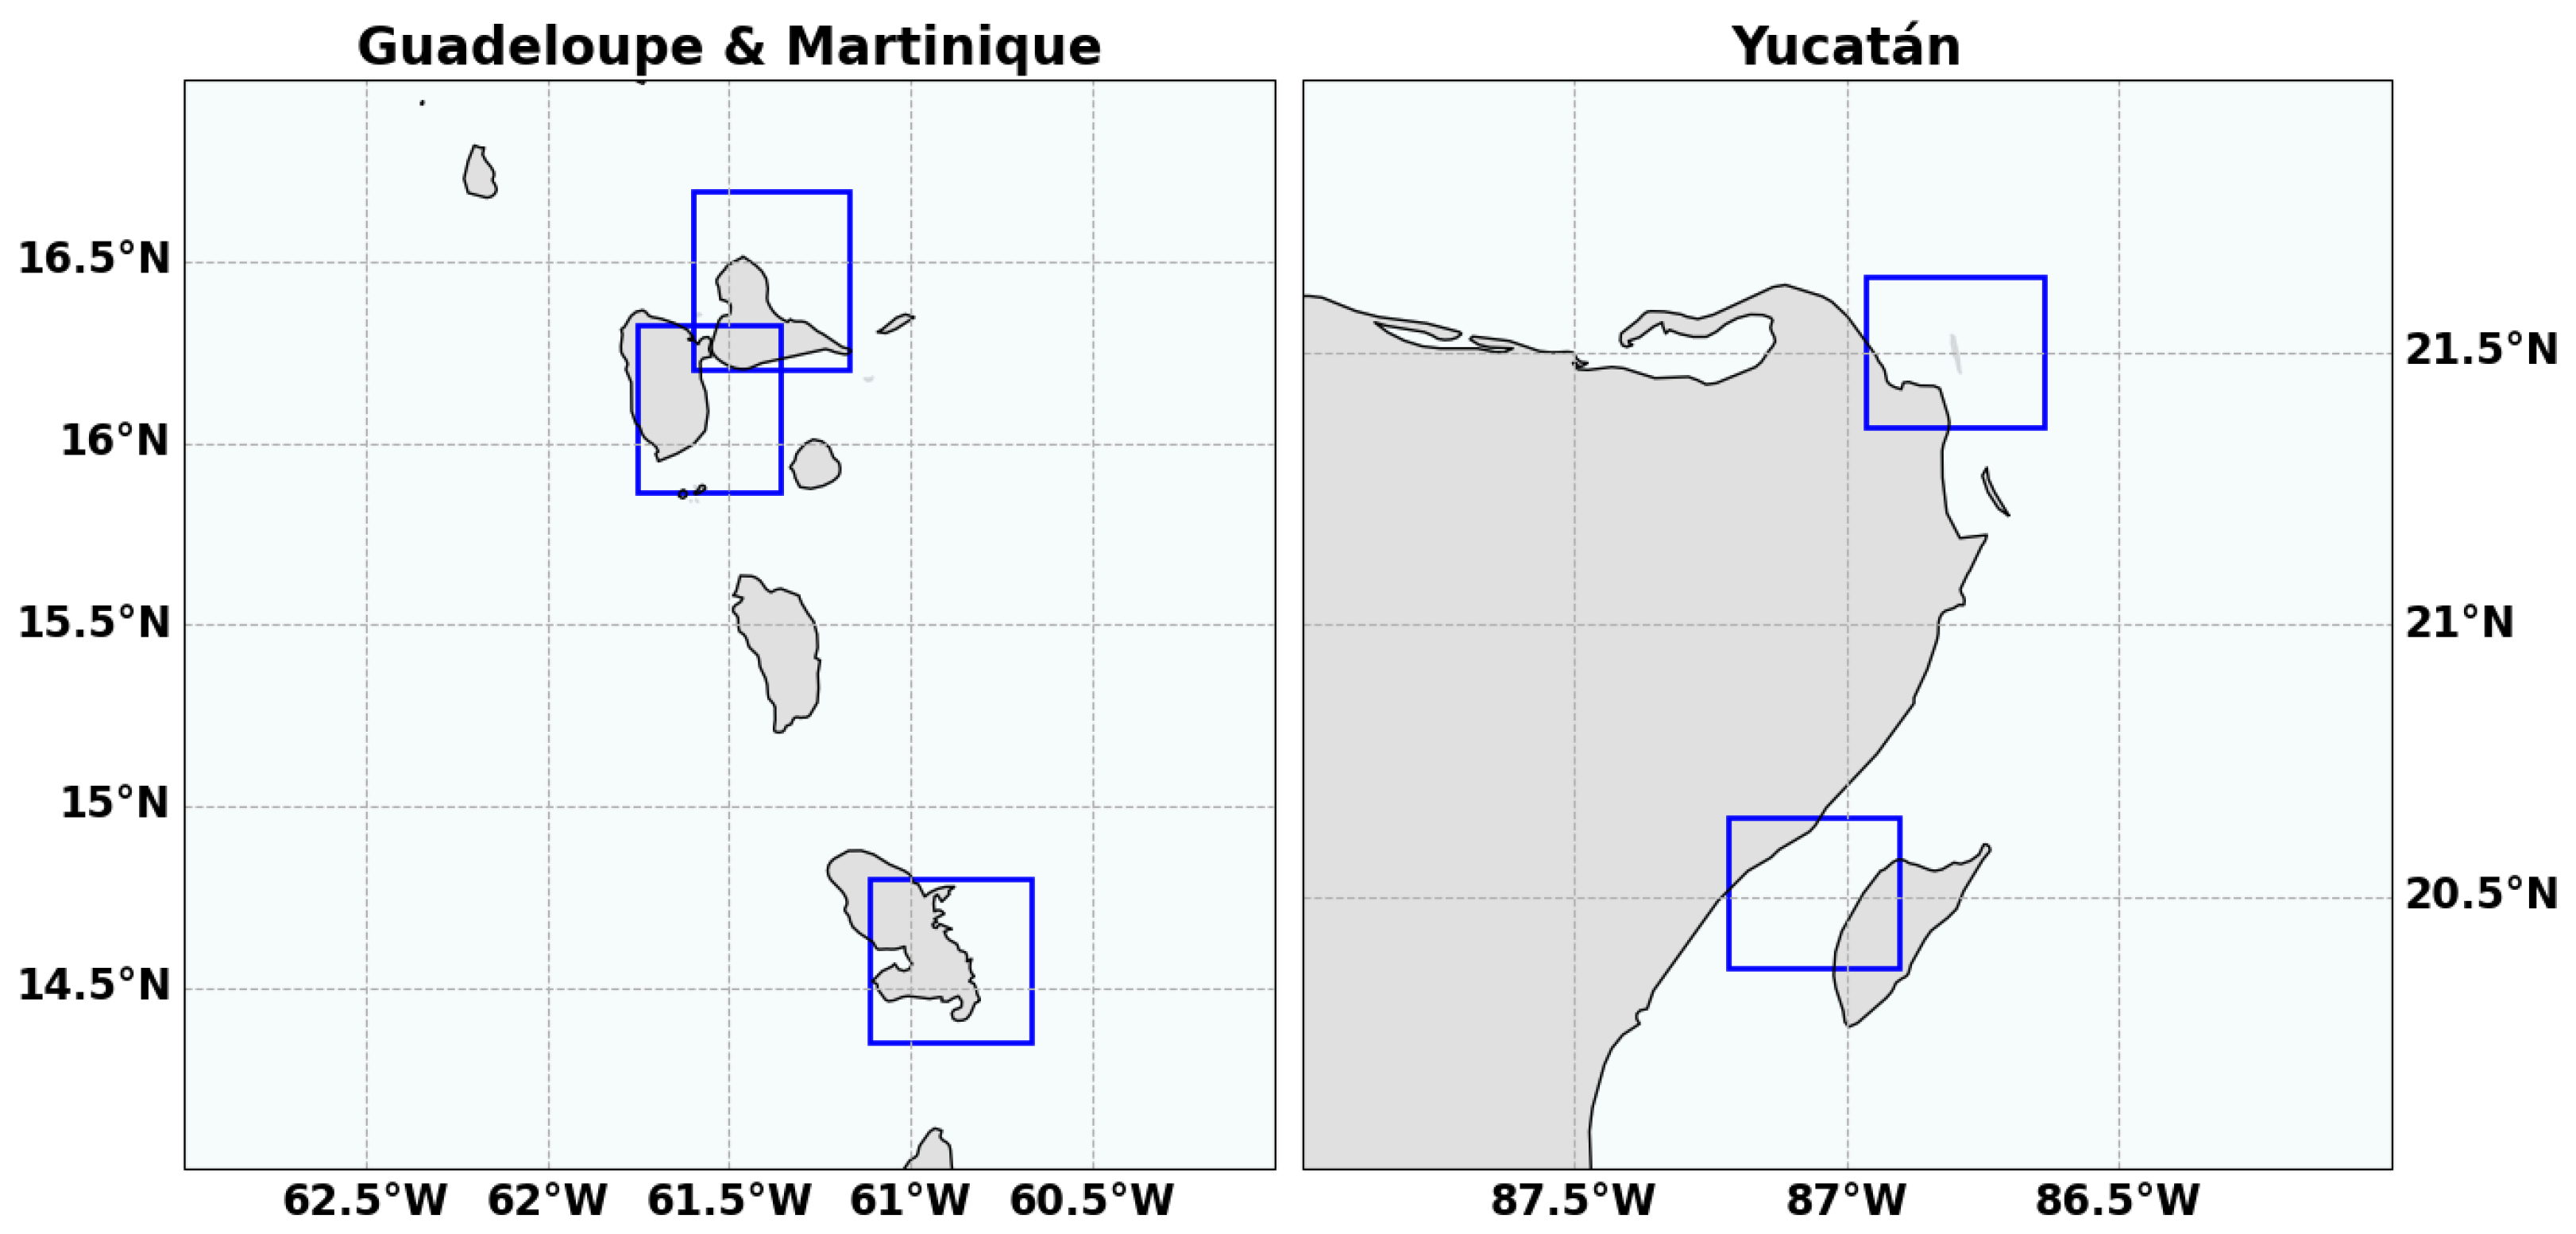
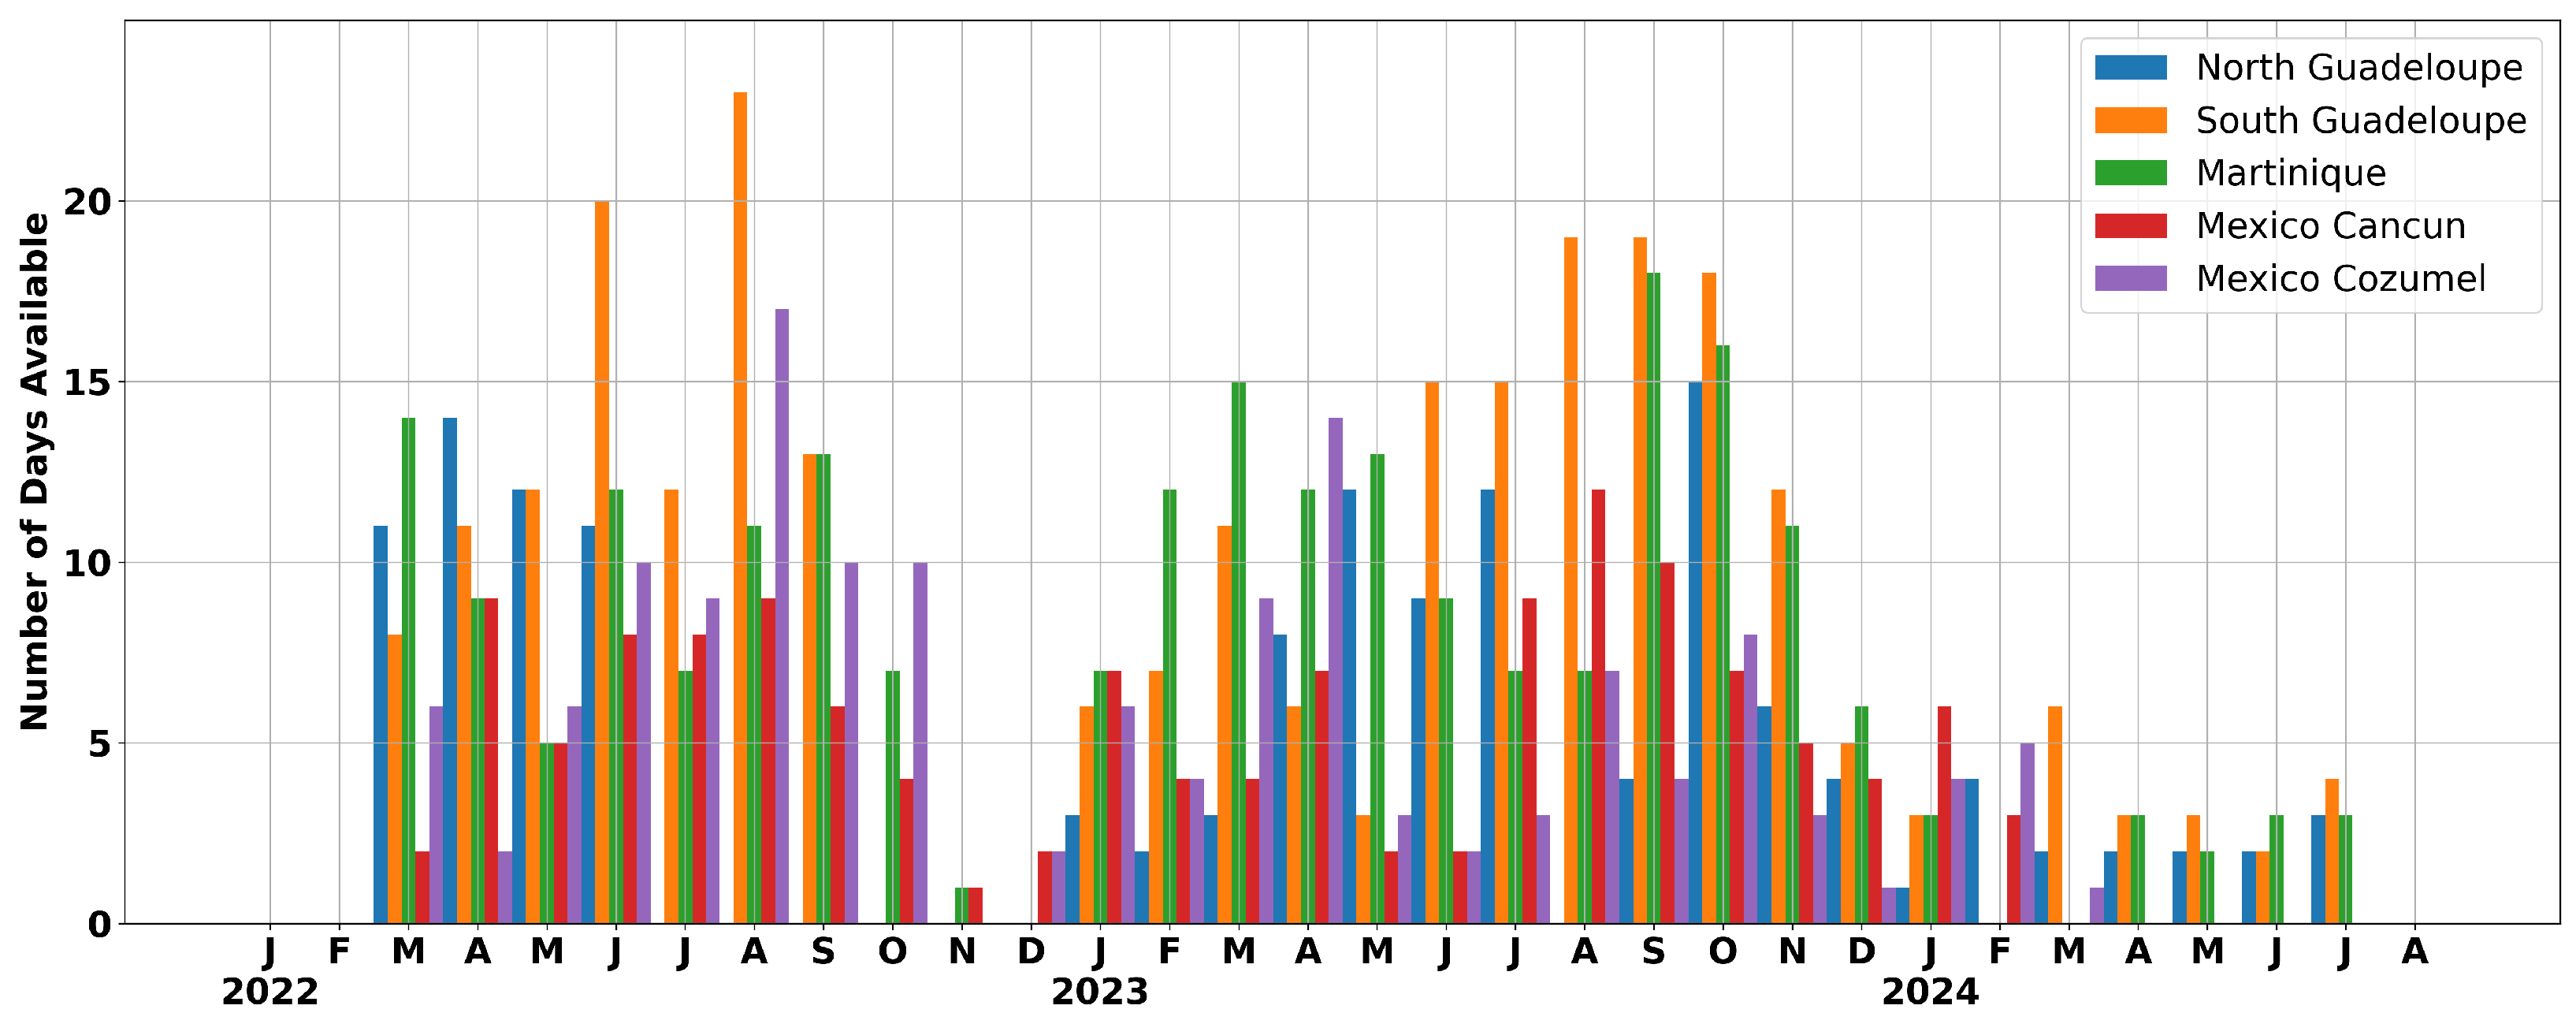
This study employs Level 2A (L2A) single-date ortho-rectified SRE products acquired during the VENµS VM5 phase (2022–2024). Our analysis focuses on five Sargassum-impacted coastal zones in the Caribbean arc, as shown in Figure 1: northern and southern Yucatán, northern and southern Guadeloupe, and Martinique. A total of 906 scenes were collected across these zones for the given period, and irregular monthly scene acquisition per zone ranged from 0 to 23, averaging 6 scenes per zone and month, with some months providing almost daily data and others providing none (Figure 2). Initially, VENµSVM5 retains images daily or every 2 days depending on the site. Reasons for the irregular temporal spacing in the data provided are mainly due to cloud presence. L2A products are obtained from valid L1C products that exist only if there are not too many clouds on the scene, and where geometric calibration (geolocalization) has been effective. For Guadeloupe, as the satellite has 2 zones to cover, it alternates between North Guadeloupe and South Guadeloupe. Lastly, some anomalies can emerge when commuting data from satellite to ground stations.
These L2A products are generated from TOA reflectances using the MACCS-ATCOR Joint Algorithm (MAJA) processing chain [20]. MAJA is a widely used atmospheric correction algorithm for multiple missions (e.g., VENµS, Formosat-2, Landsat, Sentinel-2), applying aerosol and adjacency effect correction. Alongside the SRE products, MAJA provides corresponding cloud and geophysical mask files in georeferenced TIFF format.

2.3. Standard Index-Thresholding Detection Method

2.3.1. Index Computation (AFAI Theory and Implementation)

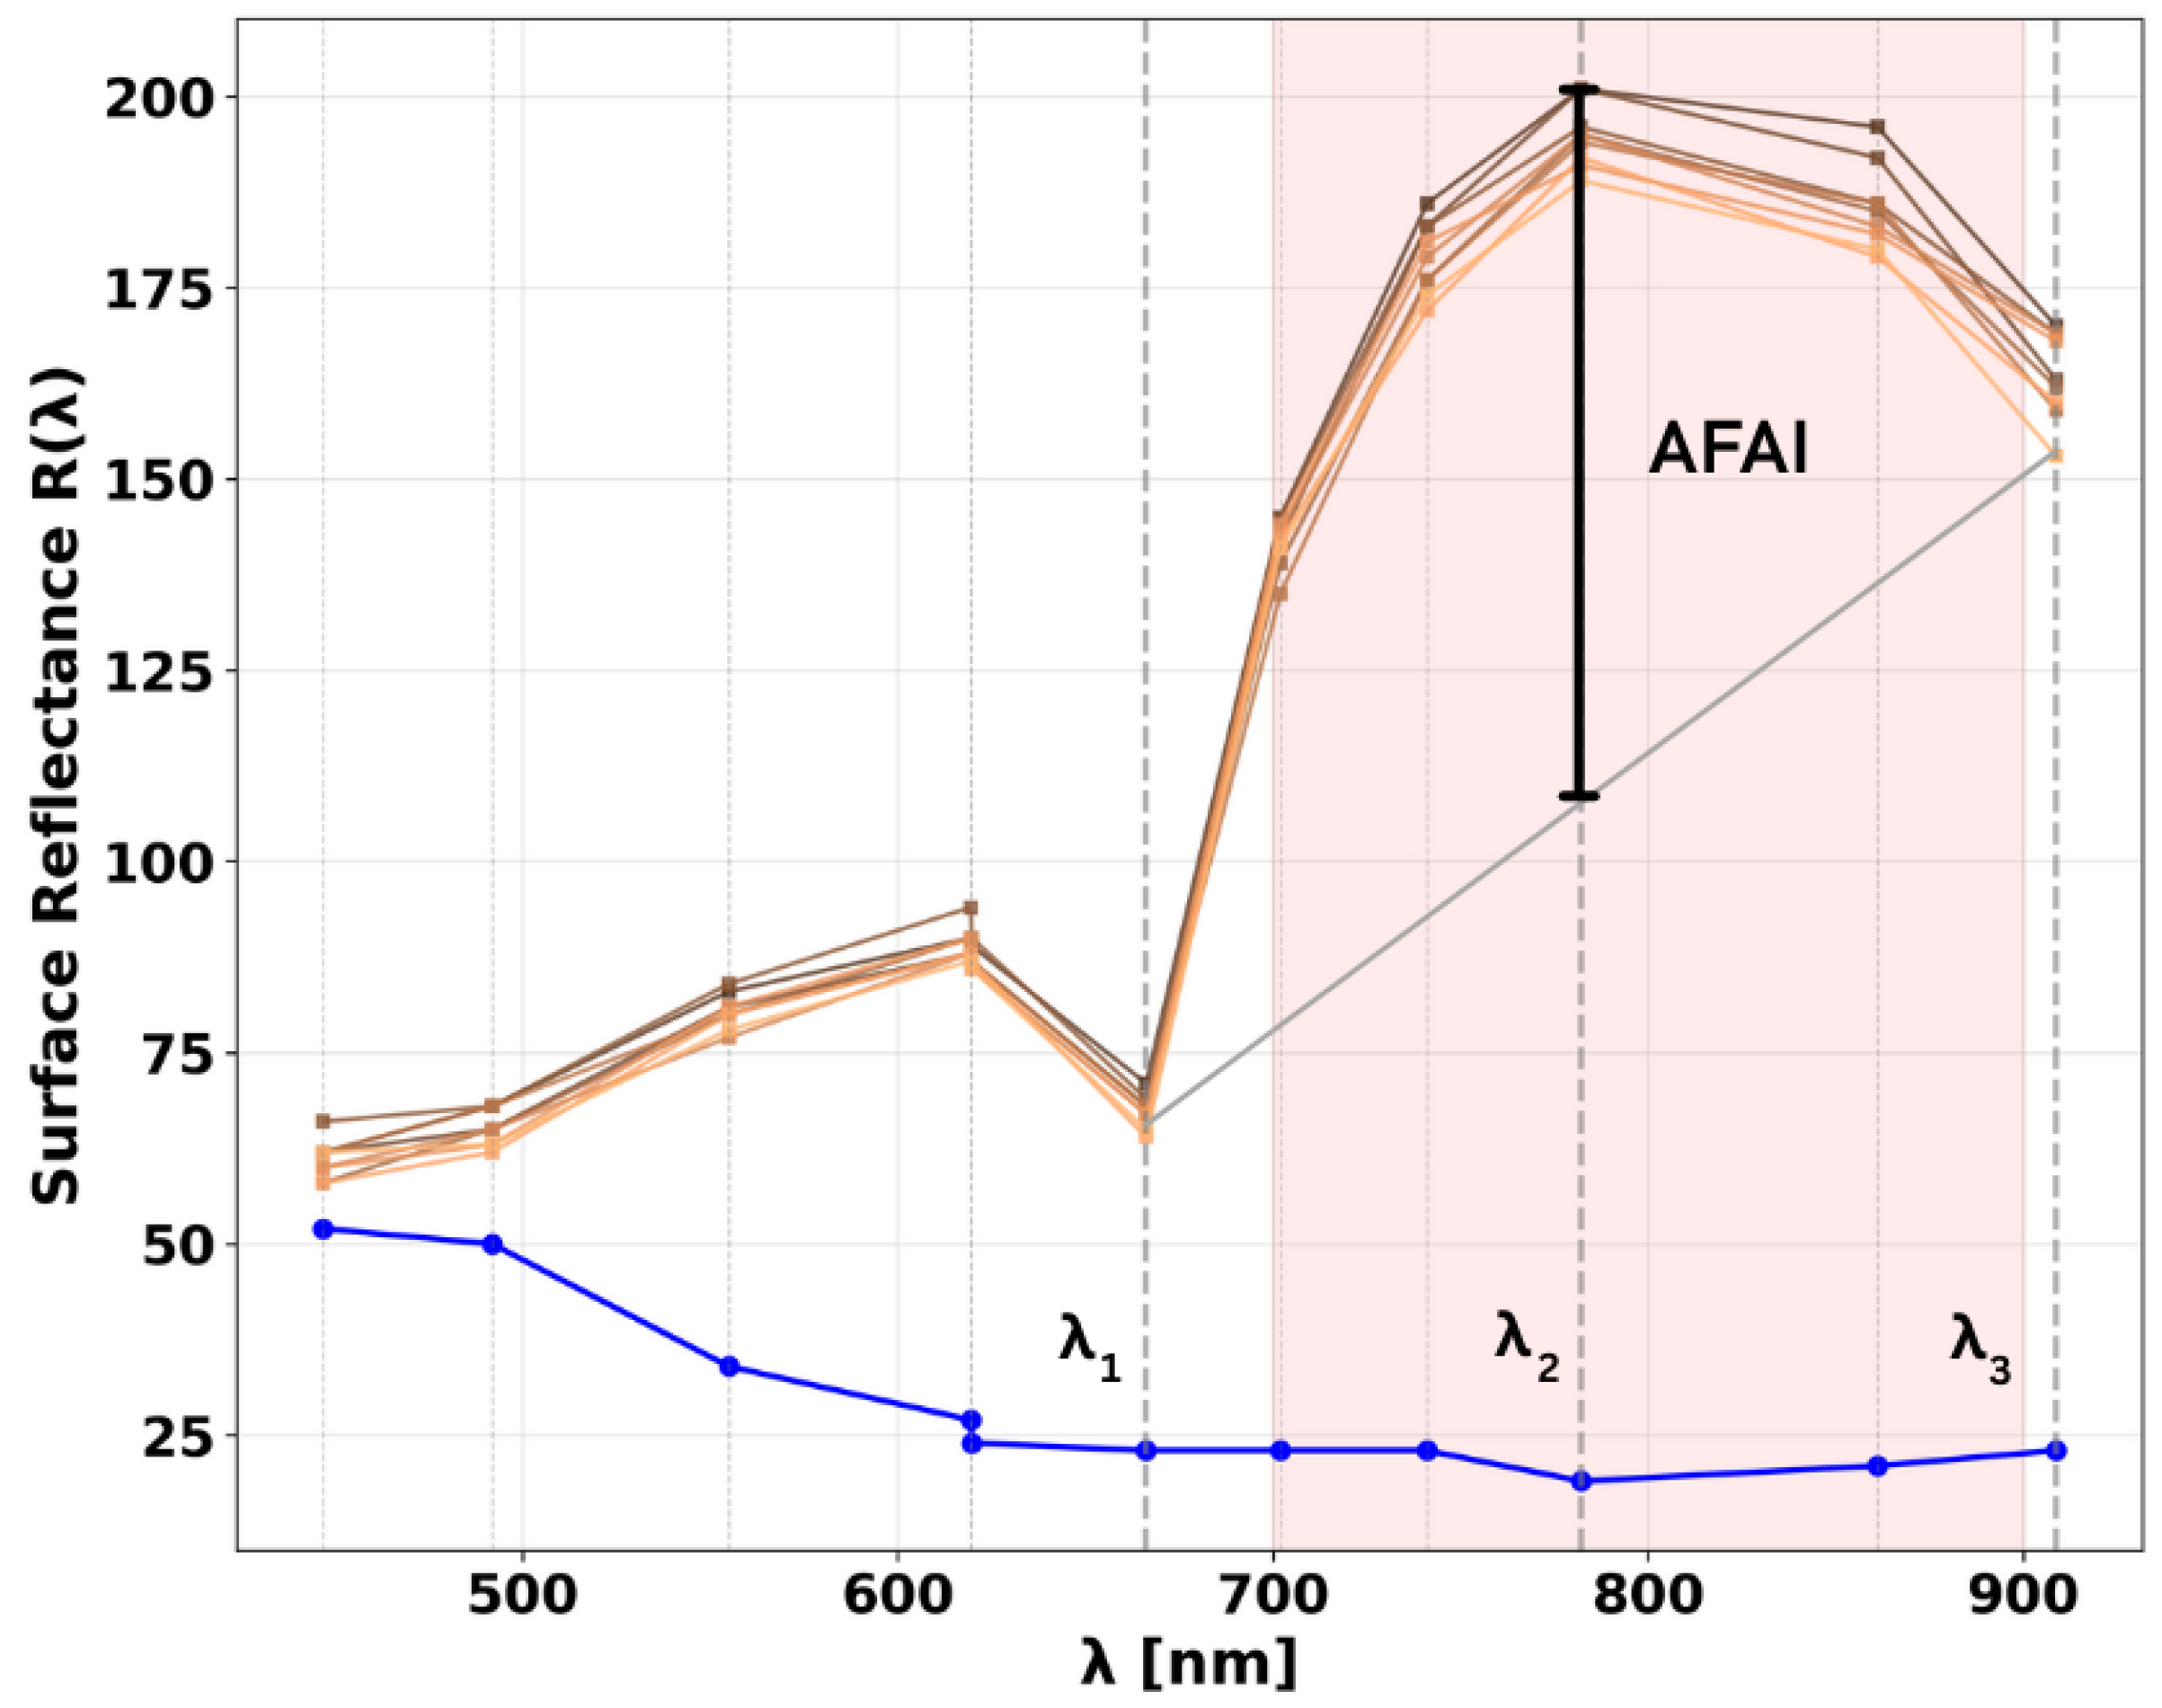
Sargassum detection is based on the Alternative Floating Algae Index (AFAI), a widely adopted optical remote sensing index for floating algae [10,21,22]. The AFAI leverages Sargassum’s characteristic red-edge/near-infrared (NIR) spectral peak to maximize contrast with seawater and other materials (Figure 3), computed pixel-wise as the NIR ( R λ 2 ) deviation from linearly interpolated red ( R λ 1 ) and short-wave infrared (SWIR) ( R λ 3 ) reflectances [10,23]:
AFAI = R λ 2 R λ 1 + λ 2 λ 1 λ 3 λ 1 × R λ 3 R λ 1 ,
The specific VENµS bands selected for AFAI calculation are listed in Table 1, where λ represents the central wavelength of the corresponding reflectance band.

2.3.2. Land and Cloud Masking

Following index computation, a multi-step masking procedure was applied to refine Sargassum detection. First, a 5 m resolution land mask is generated based on satellite-derived waterline detections (e.g., [24,25]). These methods rely on index-based segmentation, generally coupled with an automatic thresholding method (e.g., Otsu’s threshold [26]), and typically yield land–sea interface positions with an accuracy of 10–15 m [24,27], down to a few meters in low-energy, microtidal environments [28,29]. Here, L1C Sentinel-2 or Landsat 9 “Top-of-Atmosphere” reflectance imagery has been used to generate Subtractive Coastal Water Index (SCoWI [25]) maps. For each site, an optimal cloud-free image was selected, from which the sub-pixelic waterline was derived using the Local Minimum [25] thresholding method coupled with a Marching Squares contouring algorithm [30]. At microtidal sites such as those presented in this study, the SCoWI–Local Minimum method yields waterline delineations with an accuracy of about 10 m and is stable across various environments [29]. The resulting land–sea interface was used to generate a land polygon, then rasterized at 5 m resolution to form a land mask. In order to ensure small island masking and remove shallow areas exposed to tide, land masks were visually inspected, manually refined at a few places and extended towards the sea by 2 pixels (i.e., 10 m). This mask was then interpolated on the VENµS 4 m grid for accurate land masking.
A cloud mask was obtained from MAJA [20] and pixels flagged as cloud or cloud shadow were excluded for each scene, ensuring that high-quality clear-sky surface reflectance observations were retained.

2.3.3. Background Estimation and Deviation Calculation

In order to distinguish Sargassum pixels from surrounding water, we computed an AFAI deviation δ AFAI as in established methodologies [21,31,32]:
δ AFAI = AFAI AFAI bcg
where δ AFAI is the AFAI deviation and AFAIbcg is the AFAI background field. Specifically, the background field is derived from the original AFAI image (4 m resolution) through a three-step process: First, the initial AFAI image is spatially coarsened to a 24 m resolution by block-averaging over 6 × 6 pixel blocks ( 6 × 4 m = 24 m ). This coarse-resolution field serves as an intermediate background estimate. Second, a local median filter is applied to this 24 m resolution field using a 40 × 40 pixel window. This window size corresponds to a spatial extent of approximately 960 m (≈1 km), which effectively captures the larger-scale variability of the surrounding water background. Third, the resulting AFAI bcg field is resampled back to the original 4 m grid resolution to allow for the pixel-wise computation of the AFAI deviation ( δ AFAI) using Equation (2). An additional denoising step is performed on the resulting pixel-wise AFAI deviation with a Gaussian filtering ( σ gauss = 1.5 px) to reduce small-scale noise. The filter effectively smooths the signal over a radius of σ gauss 24 m, reducing noise at scales below ∼20 m while largely conserving elongated filaments and raft structures whose spatial extent exceeds this scale [14,21].

2.3.4. Detection via Thresholding

Sargassum pixels are detected using an adaptive thresholding method on the denoised deviation field following Equation (3):
δ AFAI > μ + 3.5 σ Sargassum pixel
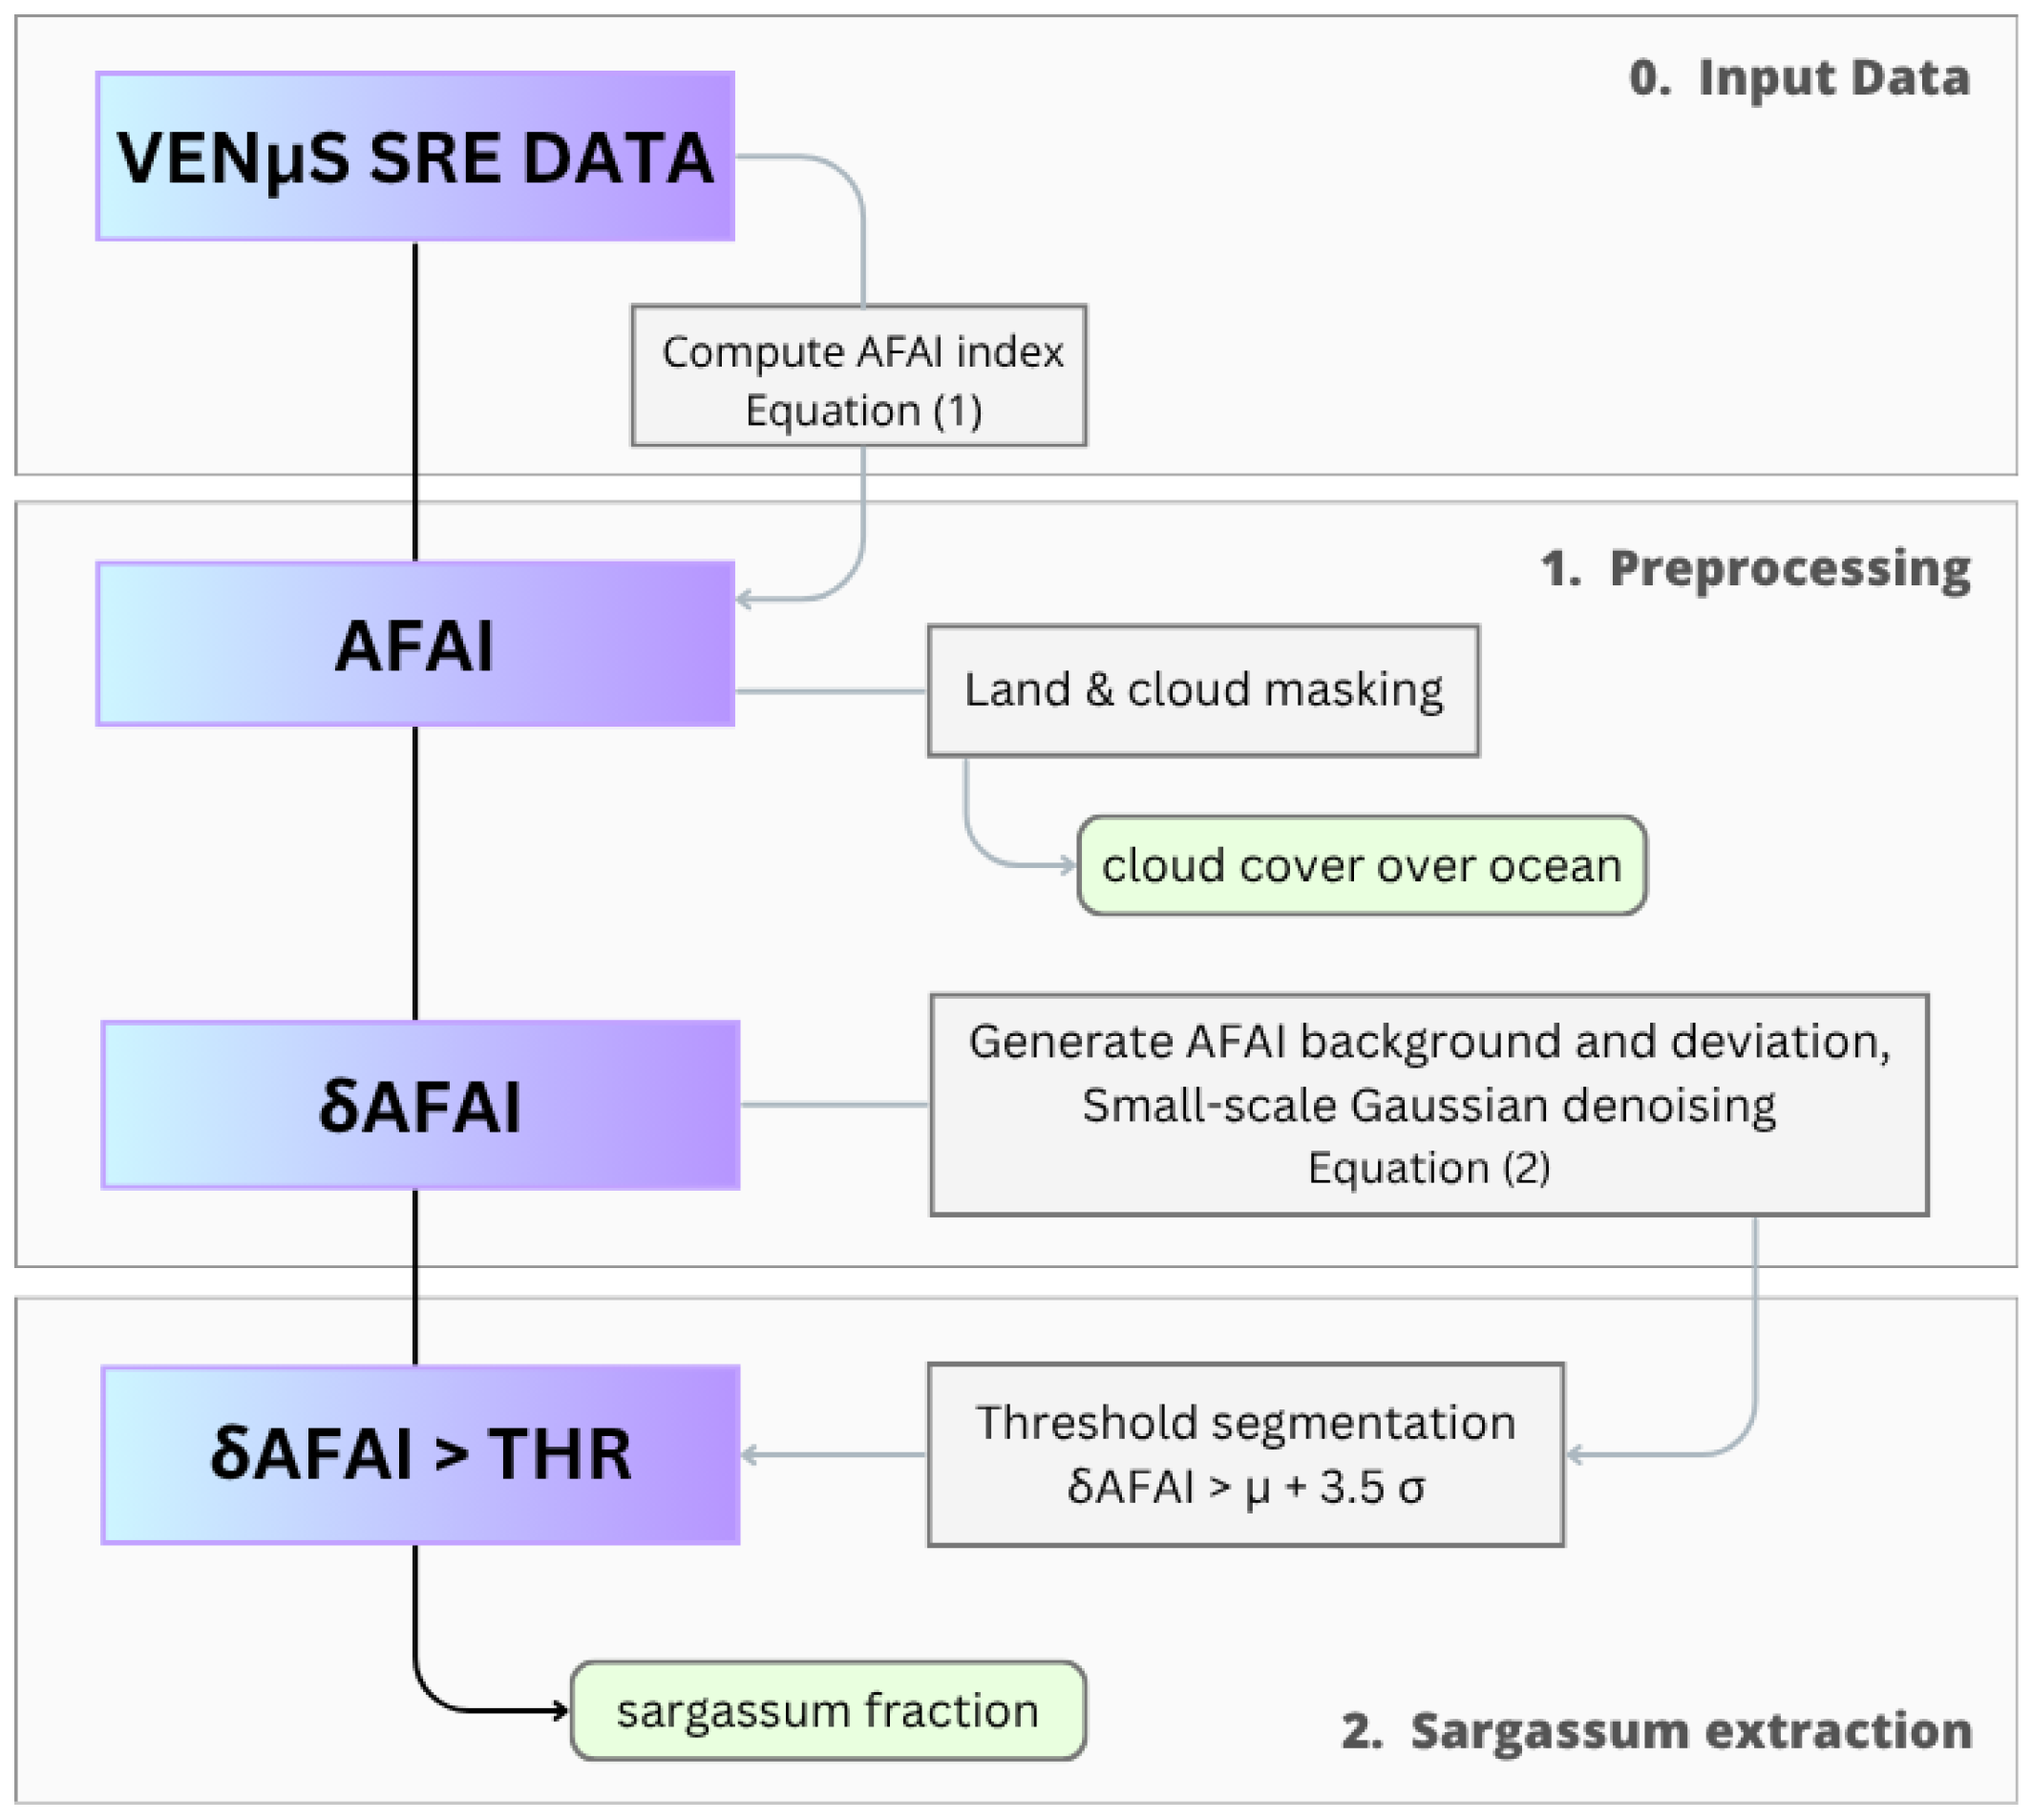
where μ and σ are statistical parameters computed from the spatial distribution of denoised δ AFAI following [21,32] considering each scene. Binary detection was derived by assigning 1 to all retained δ AFAI pixels while sub-threshold pixels were set to 0. The Sargassum fraction per image is therefore derived from this binary detection. The processing chain is detailed in the flowchart shown in Figure 4.

3. Results

3.1. Available Dataset

The proposed dataset provides a complete set of intermediate and final variables derived from VENµS surface reflectances. The variable AFAI_raw represents the unprocessed index field, while AFAI_landfree_cloudfree corresponds to the same index after masking land- and cloud-contaminated pixels. The AFAI_deviation quantifies the deviation of AFAI from the local background, and AFAI_deviation_denoised provides its spatially smoothed version using a Gaussian filter. The thresholded AFAI_detection and AFAI_detection_bin isolate pixels exceeding the adaptive limit μ + 3.5 σ and define a binary Sargassum presence detection field, respectively. The dataset also includes a True Color composite generated from the RGB surface reflectance bands for visual interpretation; see Table 2. It has been made available on the ODATIS open access platform through the Sextant catalog [33] in common NetCDF format.
Global attributes summarize scene statistics such as cloud_cover_over_water, defined as the fraction of cloudy pixels over water after land masking, as well as valid_water fraction, the proportion of pixels remaining after masking land, clouds, and negative surface reflectance values. These valid water pixels determine the area where the AFAI index is applicable. Per-scene attributes include the global mean μ and standard deviation σ of its AFAI_deviation_denoised field, as well as the applied threshold, and finally the sargassum_fraction, which represents the proportion of detected Sargassum coverage on valid_water.
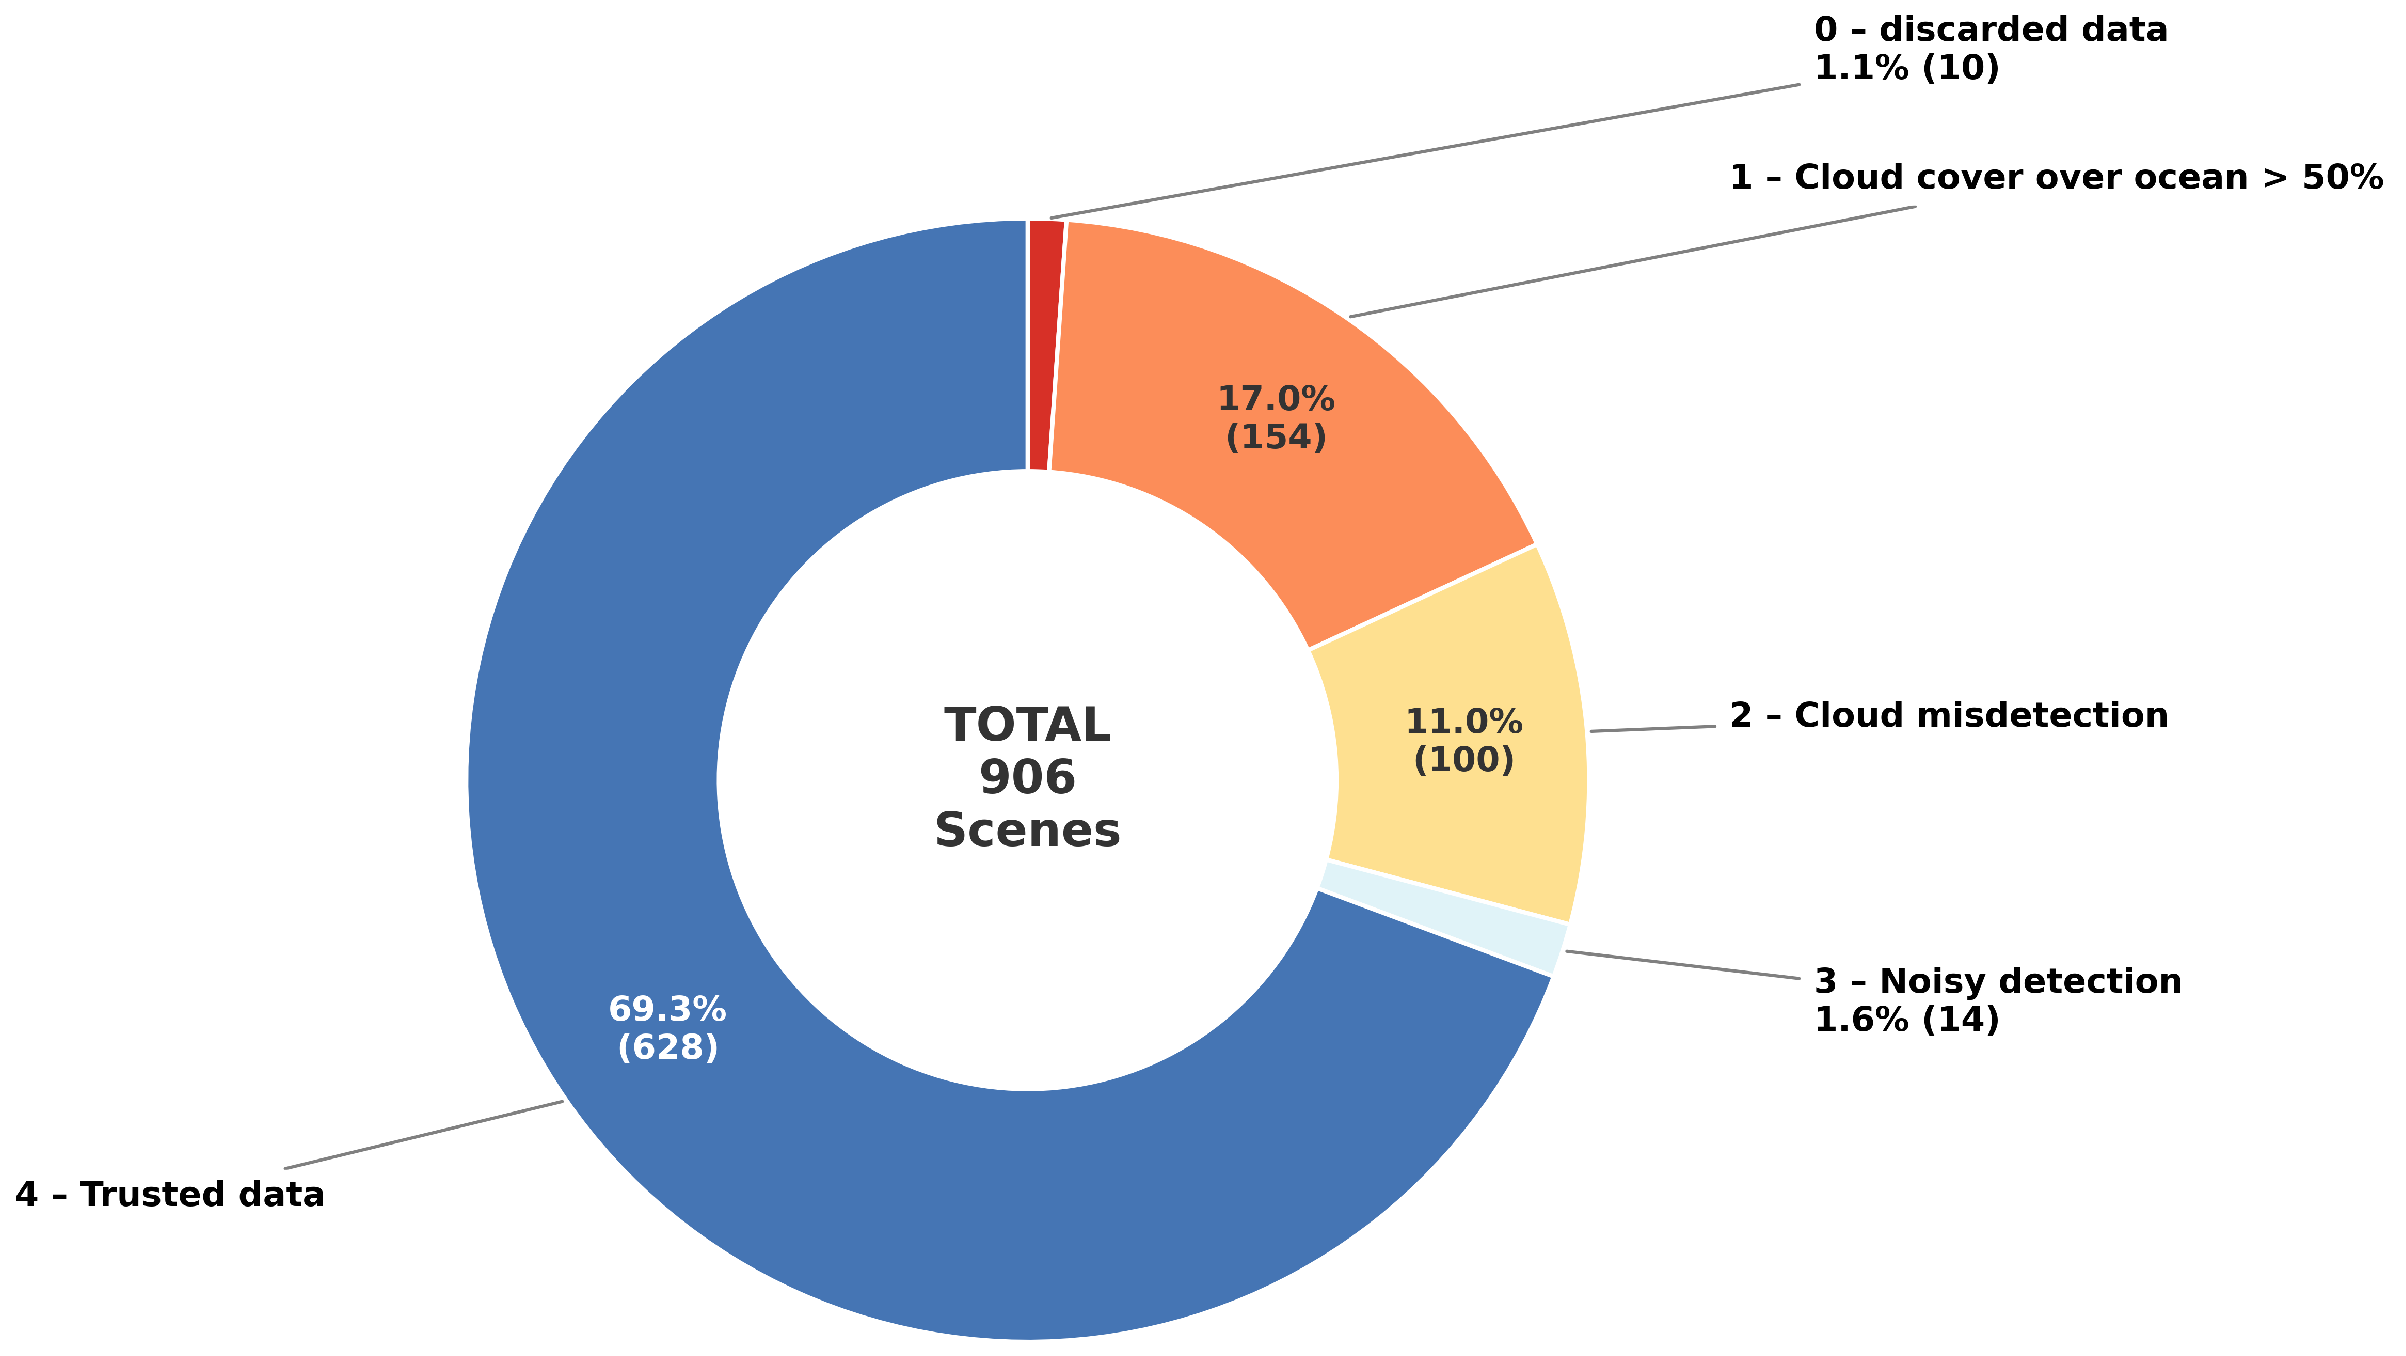
The trust_index attribute provides a qualitative confidence flag for each processed scene, indicating the reliability conditions under which Sargassum detection was performed. The index ranges from 0 to 4, where each value corresponds to a distinct quality class rather than a strictly increasing confidence scale. Specifically, 0 identifies discarded data due to an excessive proportion of negative surface reflectance (SRE < 0) pixels; 1 designates scenes with cloud cover over ocean exceeding 50%; 2 corresponds to inaccurate atmospheric corrections, including unmasked high-altitude clouds, incomplete cloud masking and sunglint; 3 indicates detections affected by strong noise; and 4 represents data acquired under reliable conditions, considered as the most trustworthy. Figure 5 shows that 70% of VENµS scenes processed for this data base are usable after this data quality assessment. Consequently, Level 4 data is intended for direct quantitative analysis, whereas Level 2 and 3 data are provided as qualitative case studies or requiring potential user-led refinement. Quality information is also encoded through the subjective sargassum_visual flag indicating the visually confirmed presence of Sargassum rafts for each scene. This latter attribute may be useful for the novice user of Sargassum-containing scenes, and may be refined by experts. Out of the 906 scenes collected, North Guadeloupe and Cancún exhibited the highest proportions of trusted scenes, with 112 out of 142 scenes (78.9%) and 119 out of 146 scenes (81.5%), respectively, followed by South Guadeloupe with 179 out of 256 scenes (69.9%) and Martinique with 145 out of 226 scenes (64.2%). Cozumel showed the lowest proportion of trusted data, with 73 out of 136 scenes classified as trusted (53.7%).

3.2. Applications of the Fine-Resolution Sargassum Detection Dataset

This section presents key applications of the proposed VENµS-derived Sargassum detection dataset, emphasizing its relevance for high-resolution nearshore drift observation, qualitative assessment of seasonal dynamics and coastal exposure analysis.

3.2.1. Fine Spatial Resolution for Tracking Raft Dynamics

The fine spatial and temporal resolution of the VENµS dataset enables precise monitoring of Sargassum raft dynamics in coastal waters, resolving sub-kilometric patterns typically undetected by traditional ocean color sensors. This level of detail substantially improves the capacity to identify, delineate, and track individual rafts as they drift and interact with the shoreline.
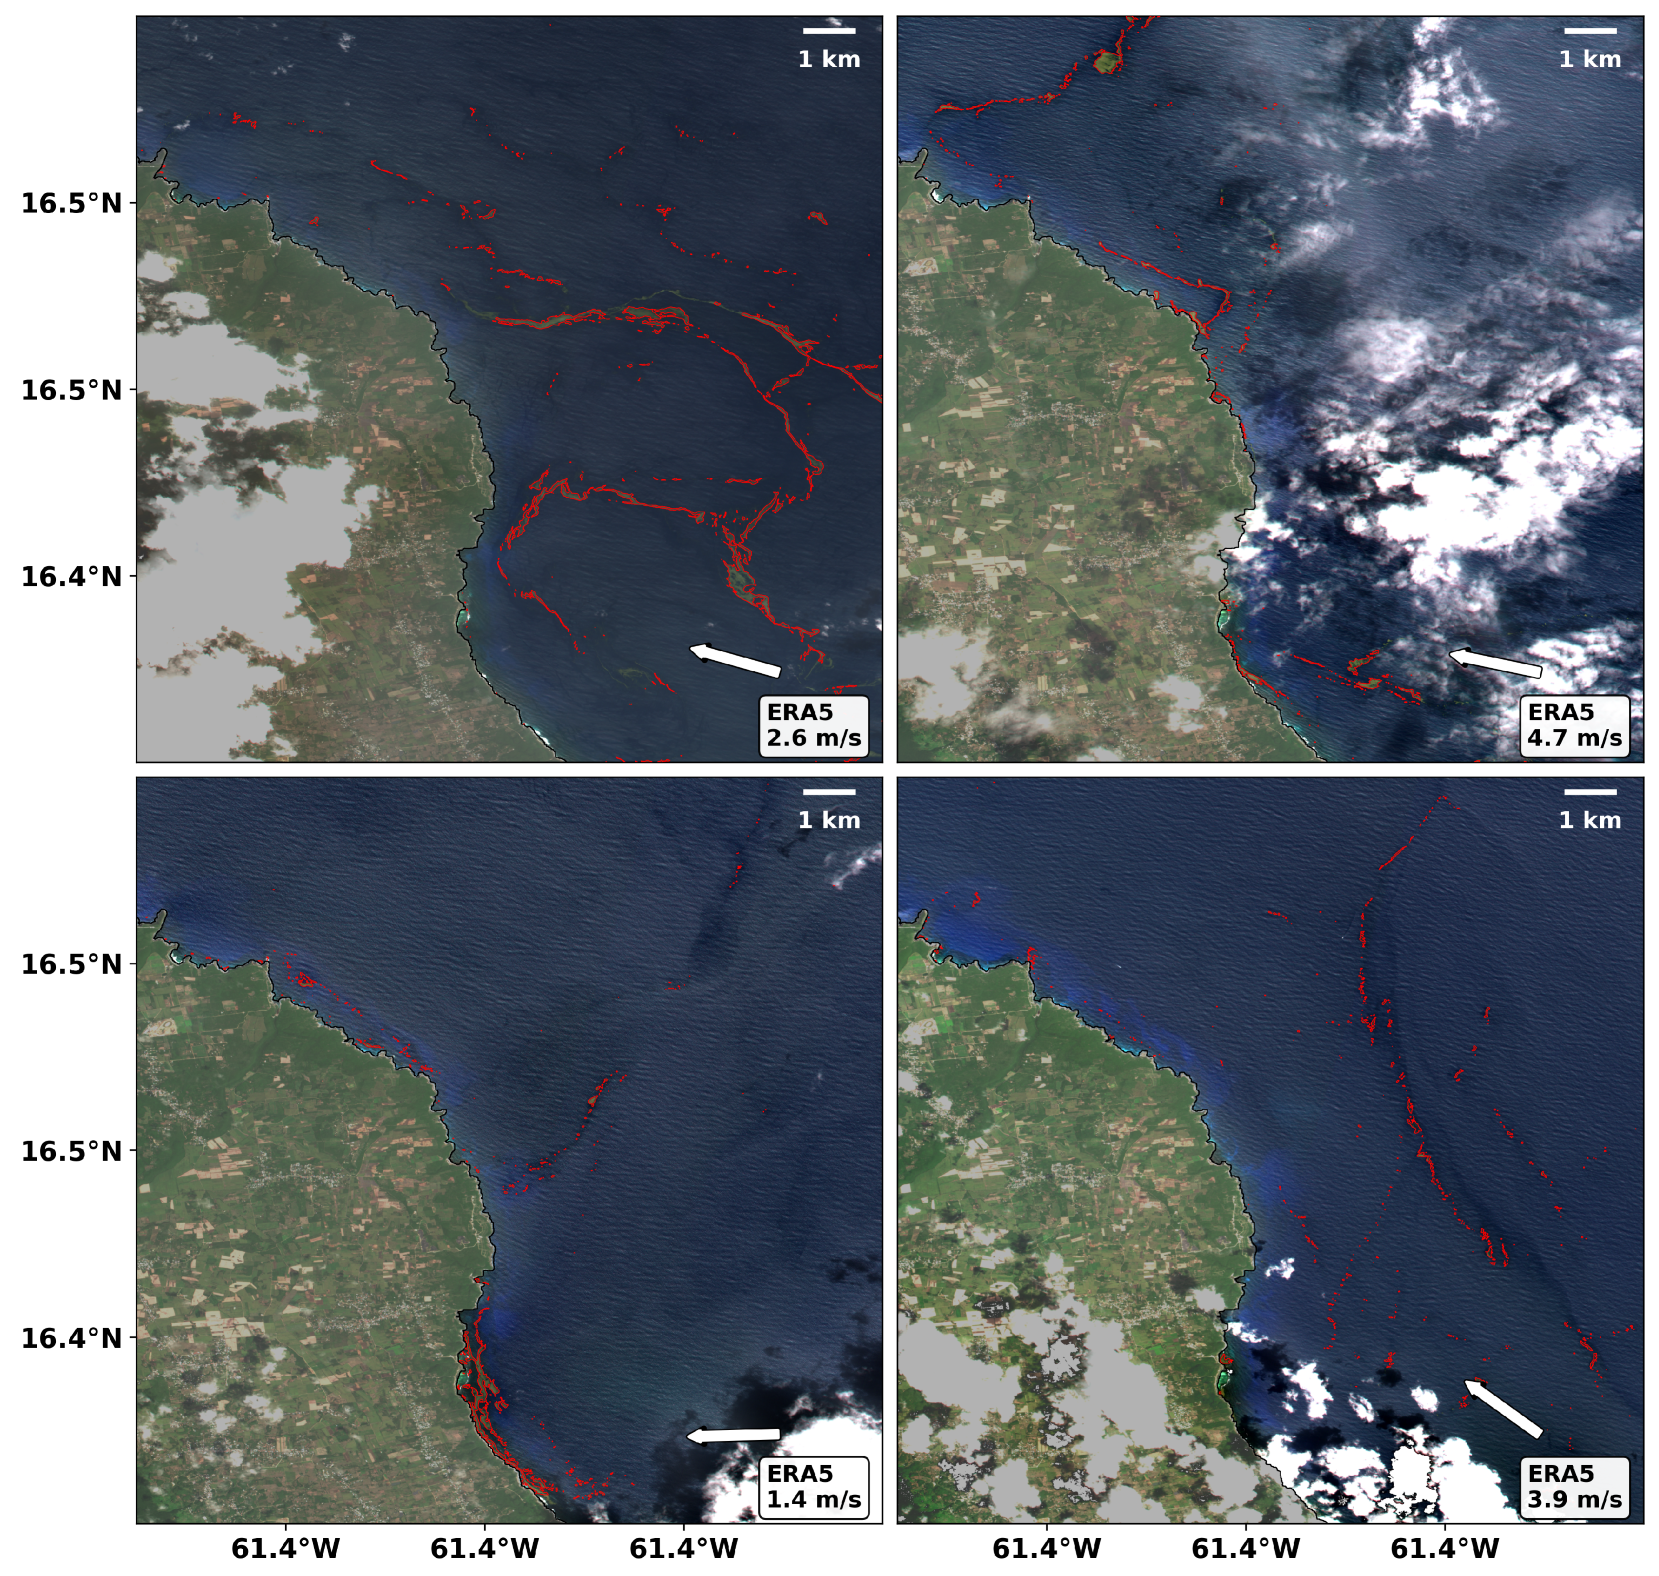
Figure 6 presents AFAI-based detections of Sargassum accumulations (outlined in red) overlaid on True Color composite for four consecutive days (25–29 April 2023) along the northern coast of Guadeloupe. ERA5 reanalysis wind vectors ( u , v ) at 10 m height (0.25° resolution) are shown in white, illustrating the transport of surface mats [34]. Daily acquisitions enable the tracking of short-term drift and dispersion, showing Sargassum entering Guadeloupean waters from the Atlantic and evolving into distinct morphologies as it approaches the coast.
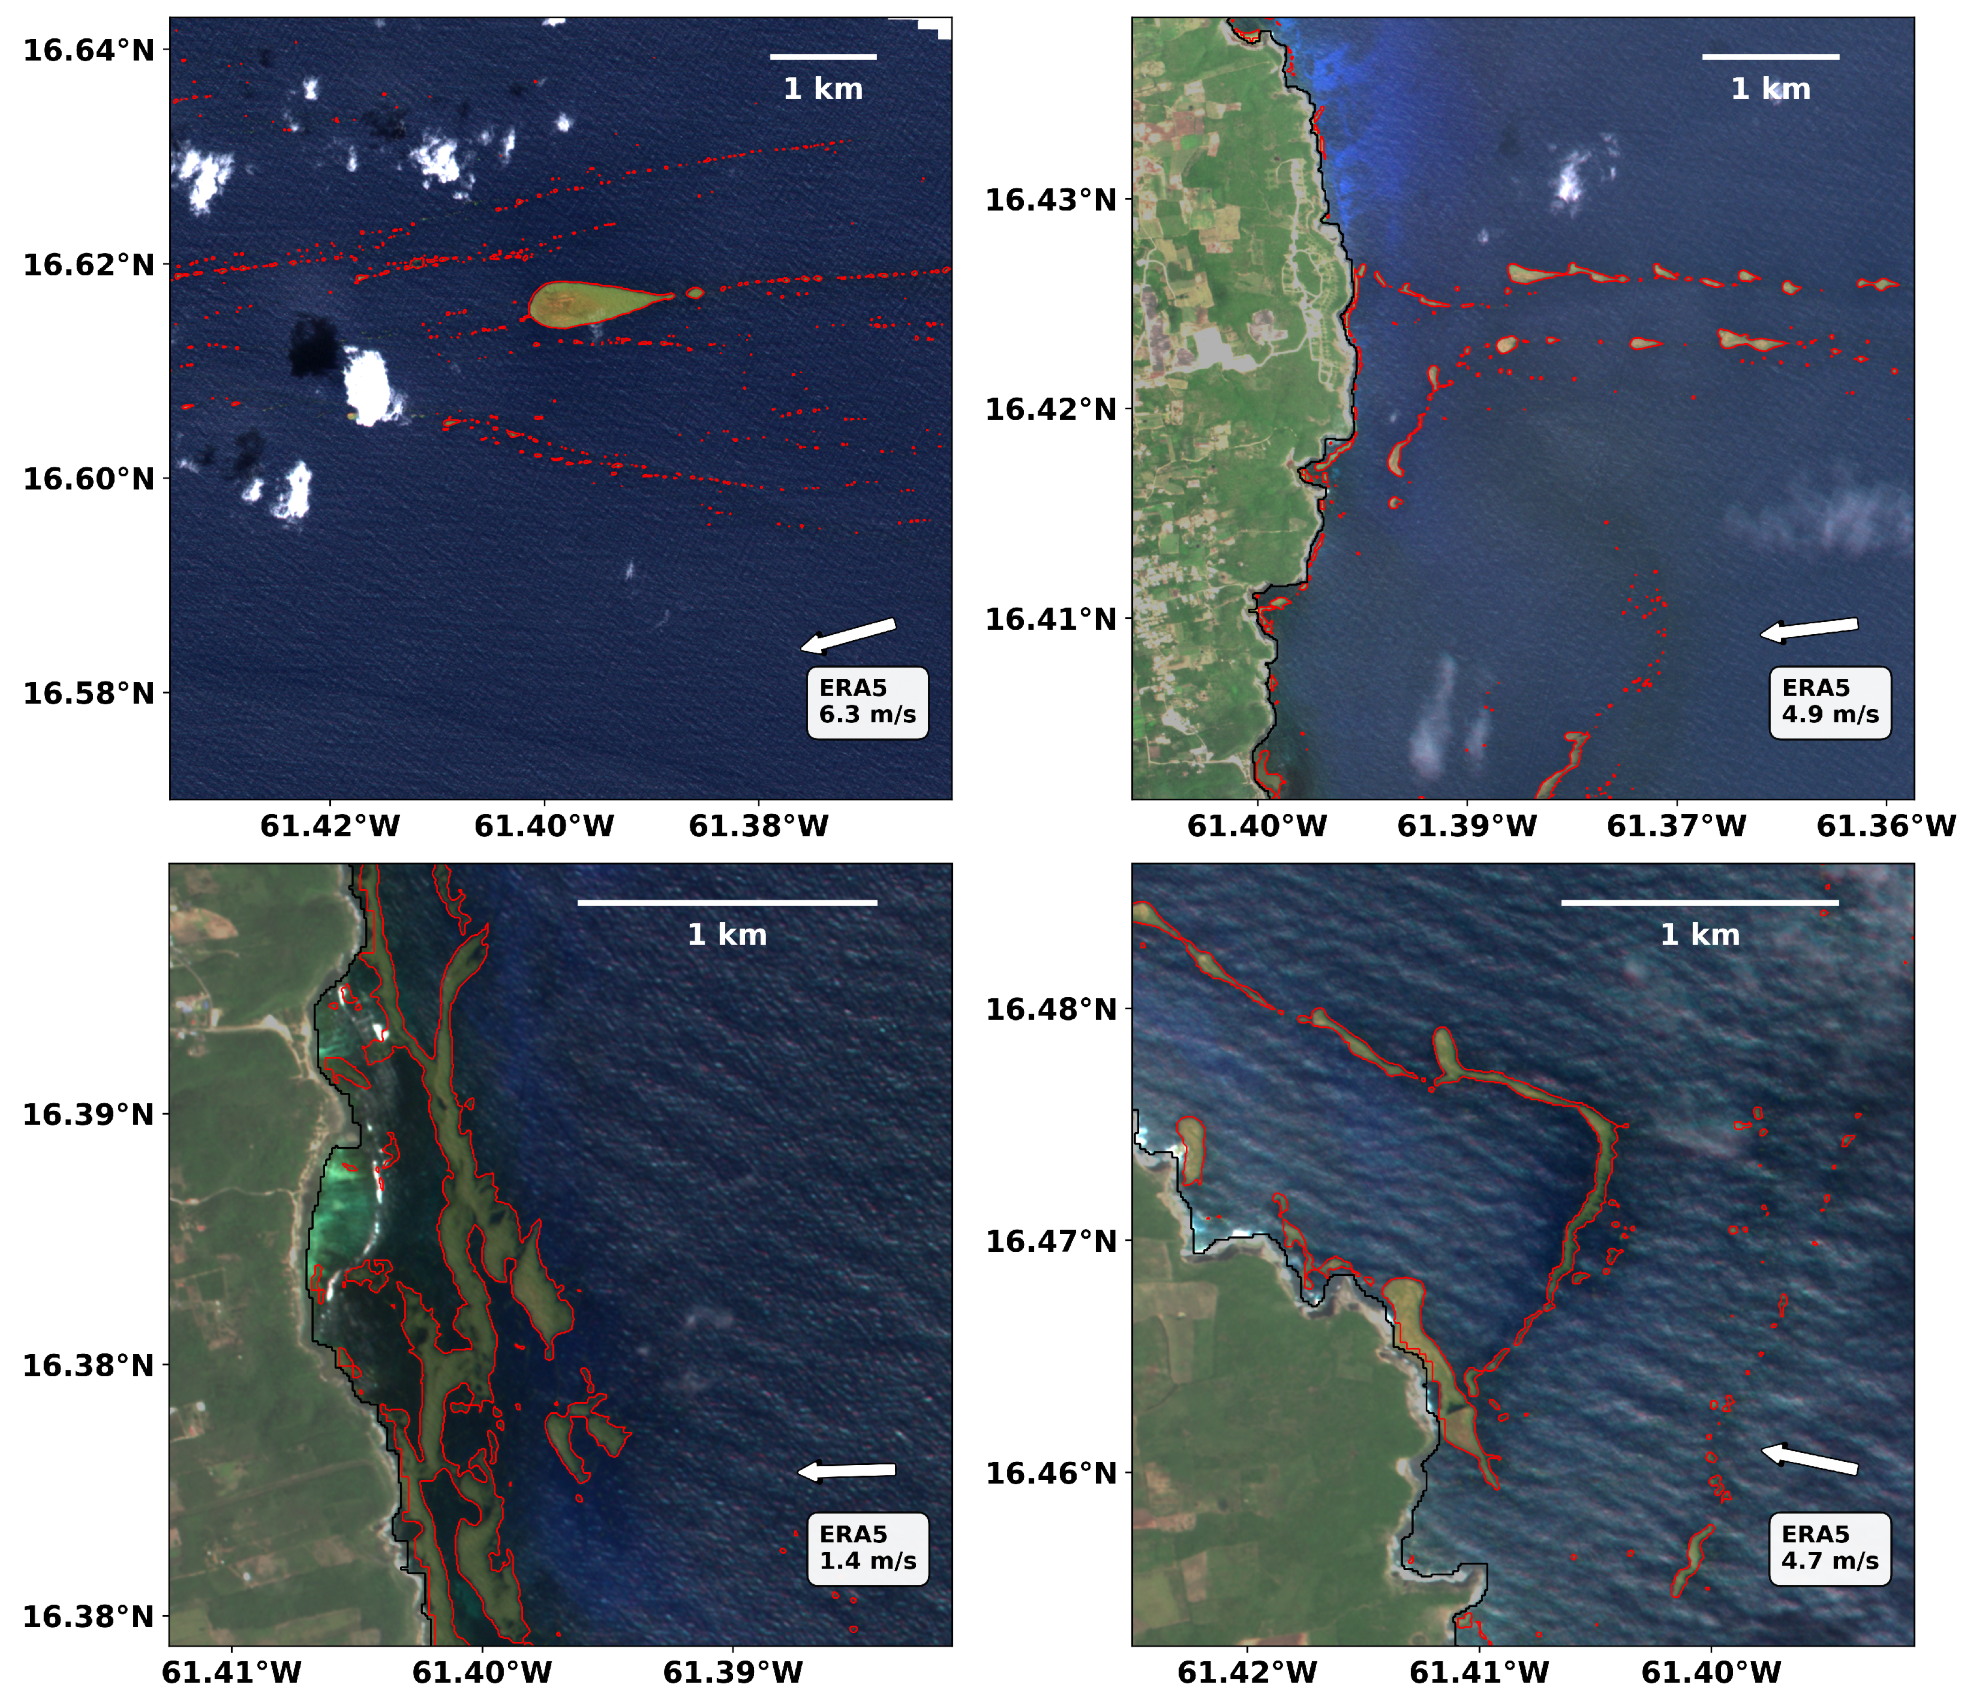
The top-left panel of Figure 7 highlights a large droplet-like raft observed on 31 May 2022, with an estimated surface area of 430,000 m2. This example demonstrates the ability of VENµS imagery to quantify raft areas and monitor their temporal evolution at 4 m precision. The subsequent top-right panel (1 June 2022) shows similar droplet-like aggregations progressing toward the coast under the influence of persistent northeasterly winds, eventually leading to nearshore accumulation in bays and beaching events consistent with the sequence in Figure 6. Detailed close-ups of Anse à la Barque (26 April 2023) and Anse Marguerite (28 April 2023) are displayed in the bottom panels of Figure 7.
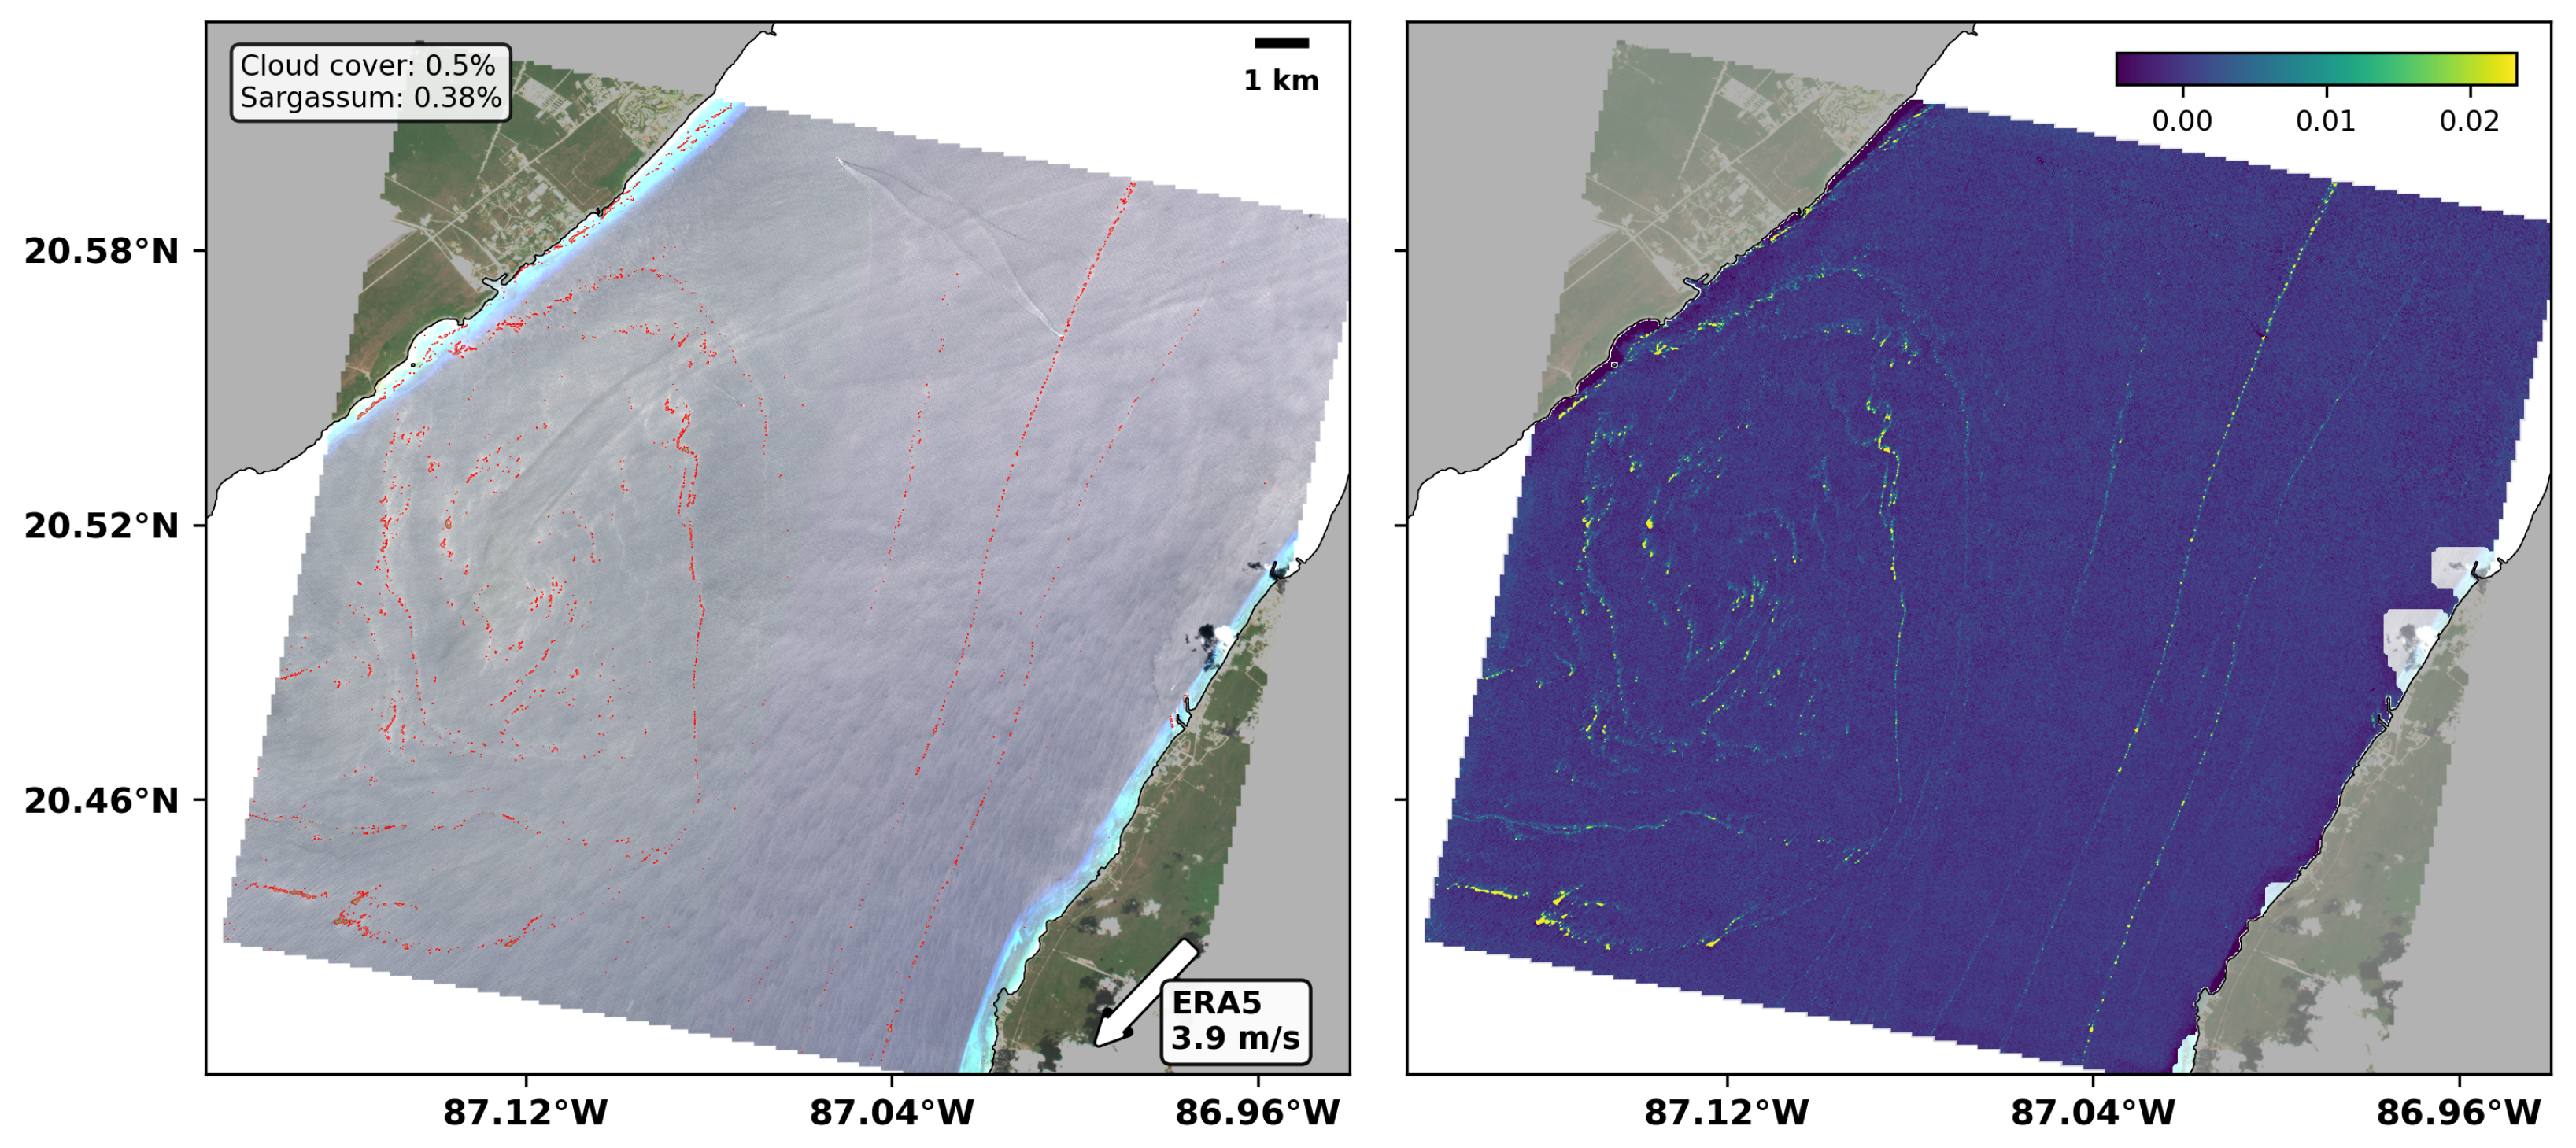
Sargassum aggregates usually follow the wind, with elongated filament structures, or get tangled in submesoscale circulation patterns like eddies or coastal currents (Figure 8). These scenes confirm the reliability of the detection pipeline in shallow-water environments, where seabed reflectance often hampers classification accuracy. Such fine-scale monitoring represents a major step forward for Sargassum remote sensing, providing a solid basis for quantifying coastal impacts and understanding raft evolution dynamics.

3.2.2. Sargassum Occurrence Rate at Peak Arrival Months

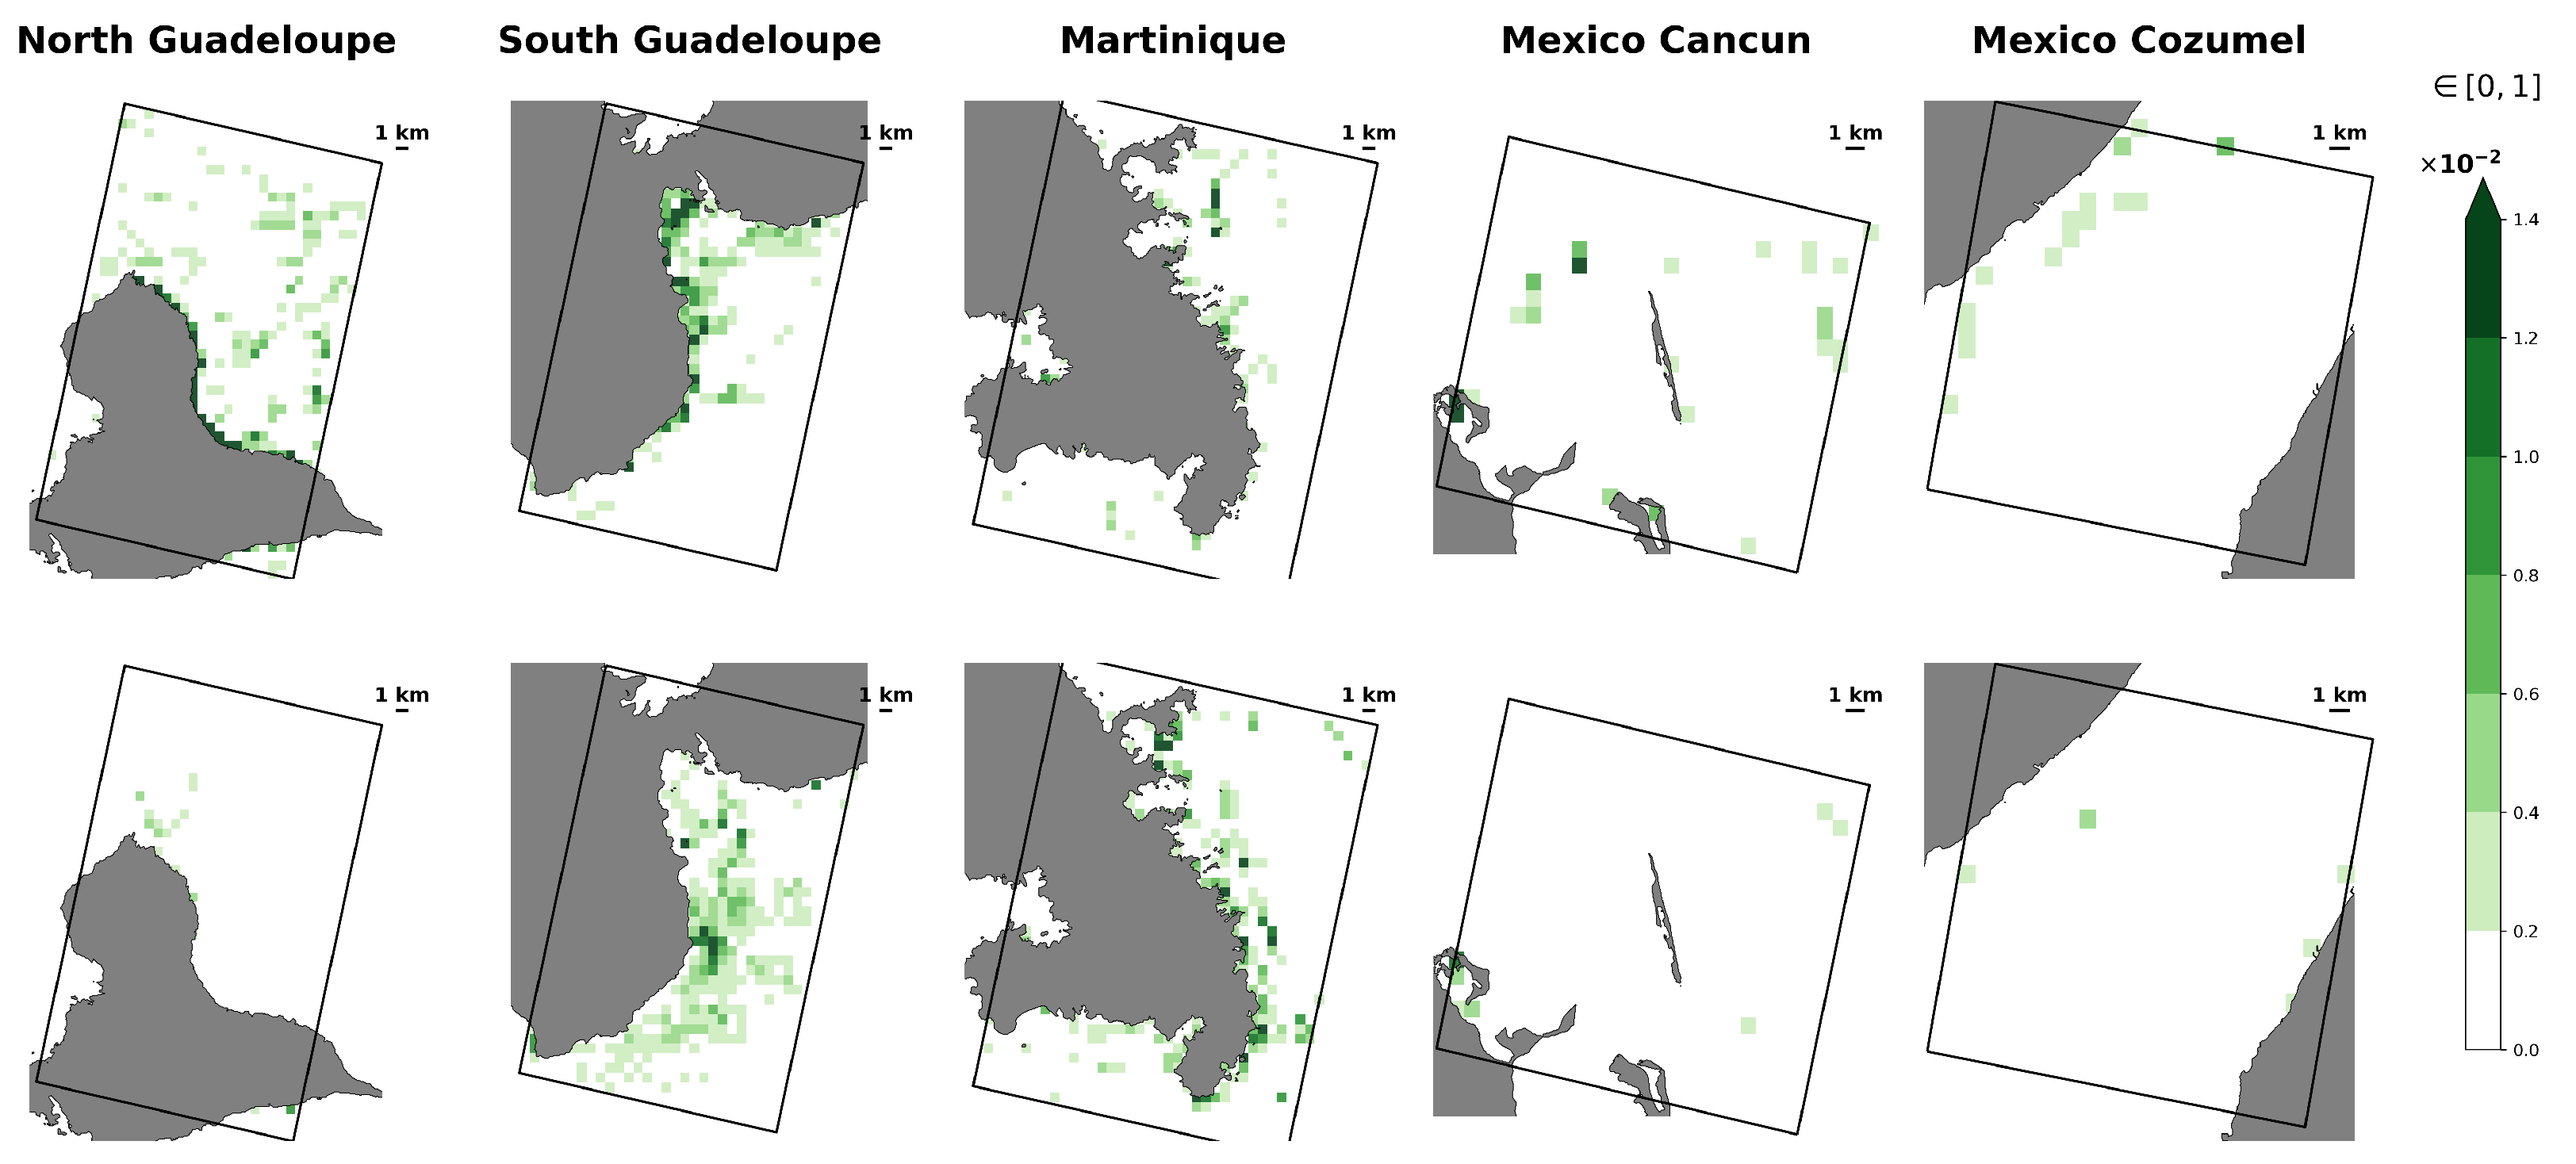
To determine Sargassum occurrence rate across all zones, we computed the temporal mean AFAI intensity over July and September, when Sargassum presence peaks. We then spatially averaged it on a 1 km wide pixel grid shown in Figure 9’s panels. Observed differences in Sargassum accumulation between the zones and months reveal distinct regional patterns (Figure 9): July accumulation was concentrated along the coastline of North Guadeloupe and within the bays of South Guadeloupe; by September, Sargassum presence shifted southward in Guadeloupe and became prominent on the eastern coast of Martinique. Meanwhile, the Mexico zones exhibited varied nearshore passage (Cancún) versus intensified North-East accumulation (Cozumel) during September.

3.3. Influx of Sargassum Along the Coastline According to Coast Type

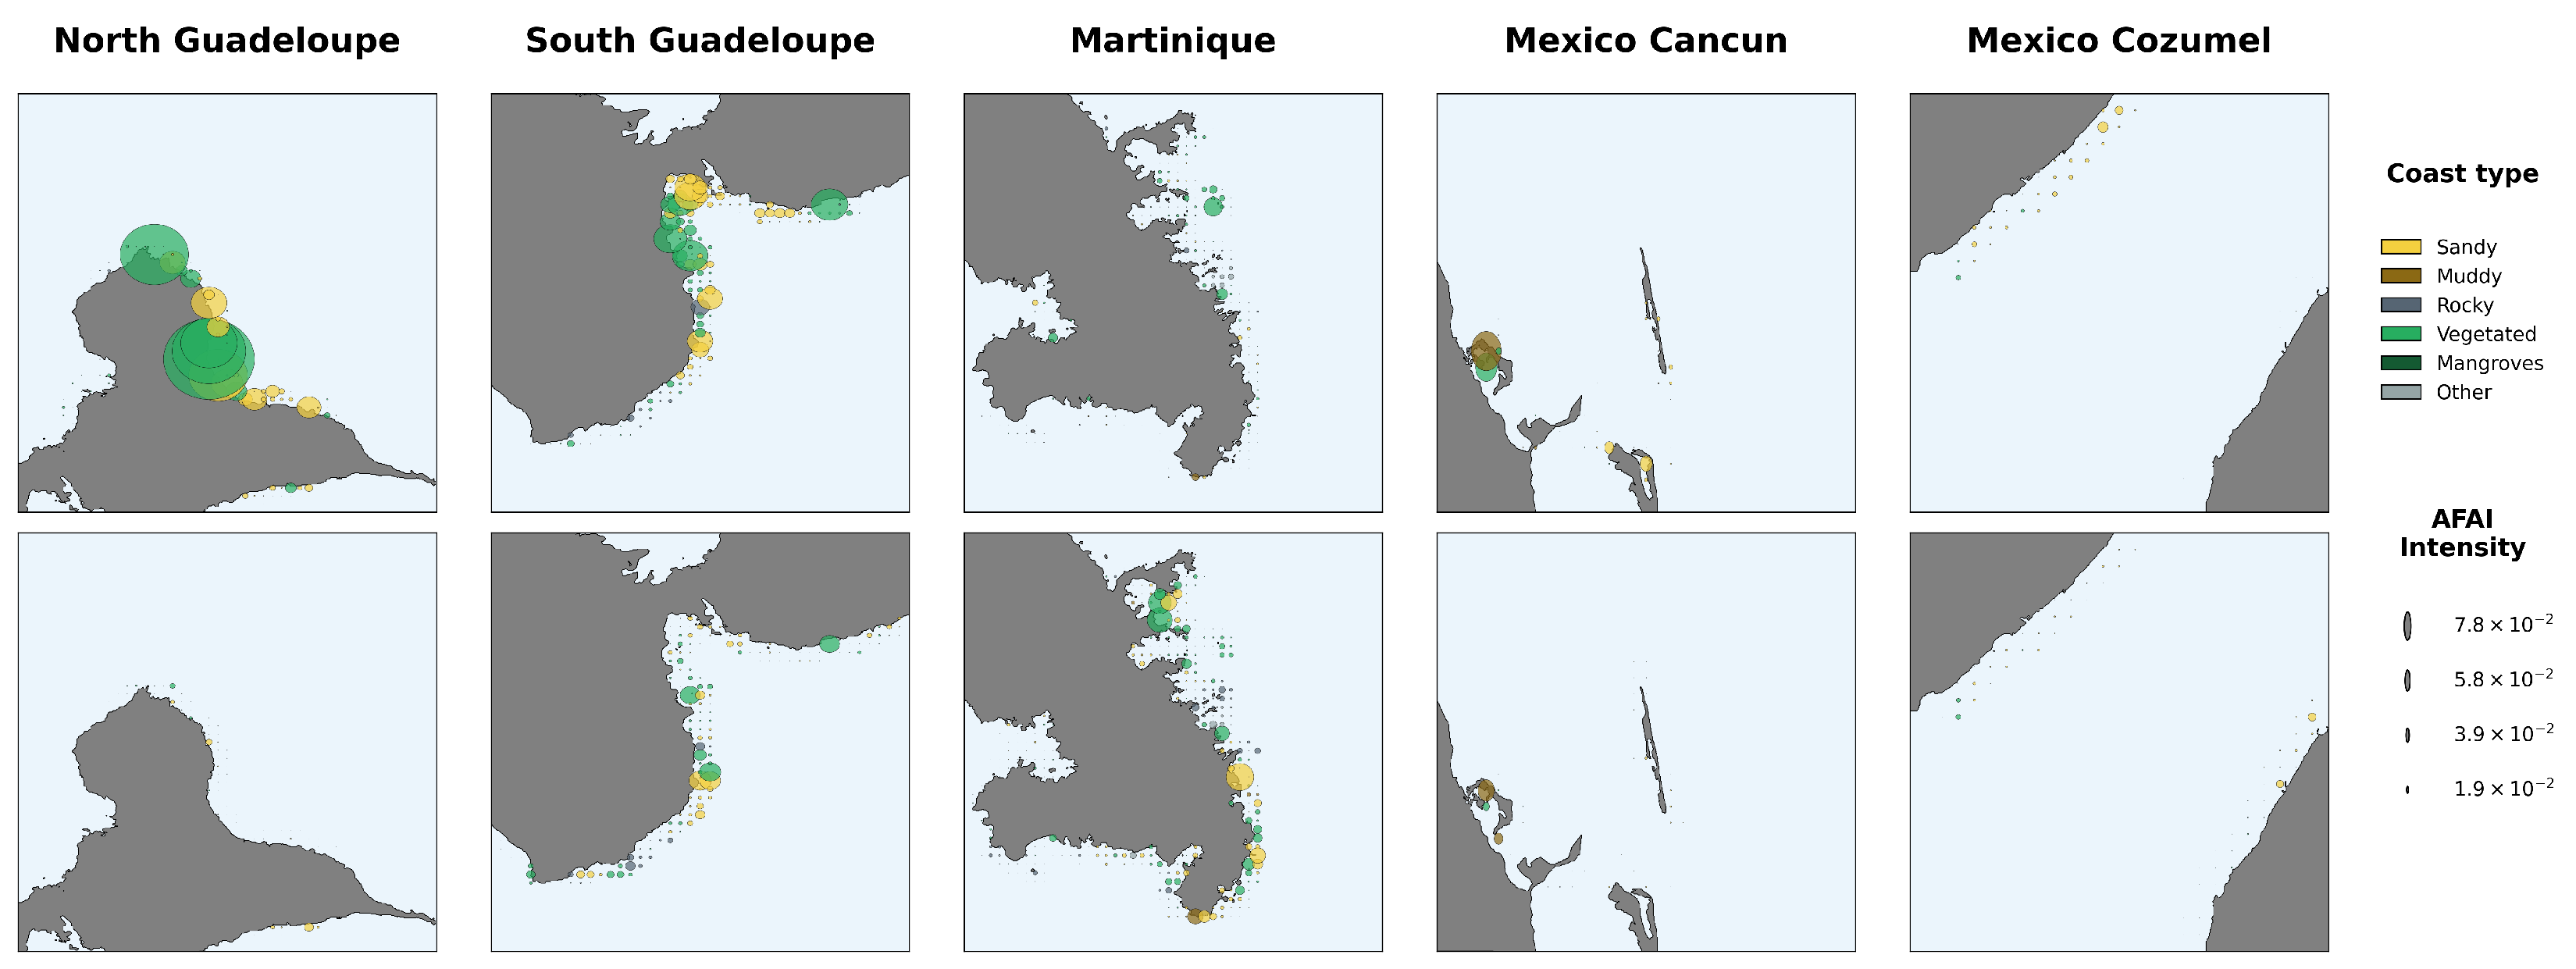
One useful application of the dataset is to determine the coverage fraction in coastal areas exerted by arrival of Sargassum. To do so, we relate the mean AFAI intensity coarsened at 1 km computed Section 3.2.2 to the coast type indicator (coast_type_flag) obtained from the Global Coastal Classification (GCC) dataset [35]. In Figure 10, Sargassum occurrence rate is shown through proportional circle size to Sargassum mean within a 2 km coastal band, while color indicates the dominant coastal type, distinguishing sandy or muddy from vegetated coastal areas. This coastal band is defined as the Euclidean distance extending from the initial coastline 2 km toward the open ocean. This analysis provides insight into the heterogeneity of Sargassum accumulation across coastal typologies and could support the assessment of local ecosystem vulnerability at a very fine scale.

4. Discussion and Conclusions

In this study, we presented a three-year daily Sargassum detection dataset derived from the Alternative Floating Algae Index (AFAI), generated at the finest available combination of spatial and temporal resolution using VENµS imagery from 2022 to 2024, acquired daily during the fifth phase of the mission on selected sites. The dataset provides both raw and flagged products, enabling users to access intermediate processing levels depending on their analytical needs.
The major advantage of this dataset lies in its unprecedented temporal sampling. The near-daily revisit of VENµS VM5 significantly increases the probability of capturing cloud-free observations, which is crucial in tropical regions characterized by high cloud persistence. This allows for the computation of monthly mean aggregations based on a larger population of scenes, resulting in a statistically more robust representation of Sargassum influx along the coastline compared to the sparser scenes provided by Sentinel-2. This high temporal frequency is essential for resolving the short timescale dynamics of Sargassum rafts at submesoscale, which can transit through narrow coastal corridors in less than 48 h—a timeframe often missed by coarser-revisit missions.
According to the literature, the main sources of uncertainty in index-based detection stem from cloud-mask accuracy and threshold selection. Cloud discrimination remains challenging for two reasons: (i) dense Sargassum aggregations can occasionally be misclassified as clouds, producing false negatives, and (ii) thin cirrus layers may yield elevated AFAI values, leading to false positives. The trust_index attribute was specifically introduced to mitigate these misclassifications. Arbitrary thresholding also inherently leads to missed detections under the chosen cutoff, as illumination and atmospheric variability can locally depress index values below the threshold [9]. A last pitfall concerns scenes with no algae at all, for which a Sargassum fraction will be estimated due to the thresholding method chosen, leading to false positives. Nevertheless, index-based methods maintain robustness and reliability for long-term monitoring, owing to their physical consistency and low computational cost when compared with segmentation or machine learning-based approaches [10].
We demonstrated several key applications of this dataset for monitoring nearshore drift and coastal accumulation across five representative zones in the Lesser Antilles and the Yucatán Peninsula.
Despite an almost daily revisit frequency, tracking Sargassum rafts in coastal areas remains difficult due to their rapid displacement and frequent cloud cover. While the AFAI intensity in this dataset allows for biomass derivation, this study did not attempt to estimate stranded quantities. Such an estimation was hindered by the combination of irregular data availability and the significant movement of the rafts, which prevented a reliable count of the Sargassum reaching the shore. Although the 4 m resolution of VENµS significantly reduces the impact of “mixed pixels” compared to kilometric sensors like MODIS or VIIRS [21], sub-pixel heterogeneity may still occur at the edges of narrow filaments or for isolated small clumps. As the mean raft size is greater than a 4 m pixel size, we consider that fractional coverage typically required for low-resolution sensors is here unnecessary, though it may introduce a slight overestimation of area for narrow features or an underestimation for very sparse, sub-pixel patches.
Ongoing reprocessing of VENµS marine reflectances using the POLYMER algorithm [36], successfully applied to Sentinel-2 MSI and Sentinel-3 OLCI data, is expected to enhance atmospheric correction and cloud discrimination quality. This will further improve detection accuracy in optically complex waters, where adjacency and bottom effects have been largely overcome—except for the Mexican coastal zone, where the land mask was intentionally extended seaward to minimize spurious detections.
In the future, the current workflow can be adapted to Sentinel-2 MSI data using larger median-filtering windows and, conversely, VENµS data can be downsampled to S2 MSI scale for inter-sensor comparison. Indeed, [37] demonstrates the technical feasibility of super-resolution algorithms by providing co-located, same-day acquisition patches between Sentinel-2 and VENµS. The Sen2VENµS dataset is a training foundation for Deep Learning models capable of injecting the fine-scale spatial textures observed by VENµS into the coarser 10 m Sentinel-2 bands. Although co-located acquisitions remain rare [32], such cross-sensor analyses are promising for regional integration. Combining VENµS fine-scale observations with broader-scale MSI or OLCI datasets could bridge the gap between local drift monitoring and basin-scale Sargassum tracking, as highlighted by Laval et al. [38]. Additionally, one goal would be to seek synergies between coastal camera estimates of Sargassum coverage, which provide high-resolution, high-frequency (below-the-hour) observations in key stranding areas (see the supplementary material in [11] for Guadeloupe, for example). VENµS’s AFAI coastal dataset, combined to other satellite observations will allow to better understand Sargassum transport pathways and validate coastal drift models, with a high spatial and temporal resolution.

Author Contributions

Conceptualization: L.P.; methodology: L.P.; validation: J.J., P.-E.B., and M.G.; formal analysis: L.P.; investigation: L.P.; resources, J.J.; data curation: L.P.; writing—original draft preparation: L.P.; writing—review and editing: J.J., P.-E.B., and M.G.; visualization: L.P.; supervision: J.J. and P.-E.B.; project administration: J.J.; funding acquisition: J.J. All authors have read and agreed to the published version of the manuscript.

Funding

This research was supported by CNES, through the project TOSCA SARGAT, under grants 10035 and 10513. Computing resources are provided by CNES.

Data Availability Statement

The original data presented in the study are openly available on the ODATIS platform with the following doi: 10.24400/527896/a01-2025.011 at https://www.aviso.altimetry.fr/en/data/products/value-added-products/sargassum/hr-coastal-sargassum-floating-algae-detection-with-venus.html [33].

Acknowledgments

We acknowledge the CESBIO for providing the MAJA library.

Conflicts of Interest

The authors declare no conflicts of interest. The funders had no role in the design of the study; in the collection, analyses, or interpretation of data; in the writing of the manuscript; or in the decision to publish the results.

Abbreviation

The following abbreviation is used in this manuscript:
AFAIAlternative Floating Algae Index

References

  1. UNEP-CEP. Sargassum White Paper: Turning the Crisis into an Opportunity United Nations Environment Programme and Caribbean Environment Programme; UNEP-CEP: Kingston, Jamaica, 2021. [Google Scholar]
  2. Jouanno, J.; Berthet, S.; Muller-Karger, F.; Aumont, O.; Sheinbaum, J. An extreme North Atlantic Oscillation event drove the pelagic Sargassum tipping point. Commun. Earth Environ. 2025, 6, 95. [Google Scholar] [CrossRef]
  3. Johns, E.M.; Lumpkin, R.; Putman, N.F.; Smith, R.H.; Muller-Karger, F.E.; Rueda-Roa, D.T.; Hu, C.; Wang, M.; Brooks, M.T.; Gramer, L.J.; et al. The establishment of a pelagic Sargassum population in the tropical Atlantic: Biological consequences of a basin-scale long distance dispersal event. Prog. Oceanogr. 2020, 182, 102269. [Google Scholar] [CrossRef]
  4. Debue, M.; Guinaldo, T.; Jouanno, J.; Chami, M.; Barbier, S.; Berline, L.; Chevalier, C.; Daniel, P.; Daniel, W.; Descloitres, J.; et al. Understanding the Sargassum phenomenon in the Tropical Atlantic Ocean: From satellite monitoring to stranding forecast. Mar. Pollut. Bull. 2025, 216, 117923. [Google Scholar] [CrossRef] [PubMed]
  5. Resiere, D.; Mehdaoui, H.; Florentin, J.; Gueye, P.; Lebrun, T.; Blateau, A.; Viguier, J.; Valentino, R.; Brouste, Y.; Kallel, H.; et al. Sargassum seaweed health menace in the Caribbean: Clinical characteristics of a population exposed to hydrogen sulfide during the 2018 massive stranding. Clin. Toxicol. 2021, 59, 215–223. [Google Scholar] [CrossRef] [PubMed]
  6. Van Tussenbroek, B.I.; Hernández Arana, H.A.; Rodríguez-Martínez, R.E.; Espinoza-Avalos, J.; Canizales-Flores, H.M.; González-Godoy, C.E.; Barba-Santos, M.G.; Vega-Zepeda, A.; Collado-Vides, L. Severe impacts of brown tides caused by Sargassum spp. on near-shore Caribbean seagrass communities. Mar. Pollut. Bull. 2017, 122, 272–281. [Google Scholar] [CrossRef]
  7. Rodríguez-Martínez, R.E.; Gómez Reali, M.Á.; Torres-Conde, E.G.; Bates, M.N. Temporal and spatial variation in hydrogen sulfide (H2S) emissions during holopelagic Sargassum spp. decomposition on beaches. Environ. Res. 2024, 247, 118235. [Google Scholar] [CrossRef]
  8. Wang, M.; Hu, C. Predicting Sargassum blooms in the Caribbean Sea from MODIS observations. Geophys. Res. Lett. 2017, 44, 3265–3273. [Google Scholar] [CrossRef]
  9. Hu, C. A novel ocean color index to detect floating algae in the global oceans. Remote Sens. Environ. 2009, 113, 2118–2129. [Google Scholar] [CrossRef]
  10. Hu, C.; Barnes, B.B.; Qi, L.; Gower, J.F.; Jiao, J.; Xie, Y. Monitoring pelagic Sargassum in the Atlantic Ocean from space: Principles and practices. Harmful Algae 2025, 144, 102840. [Google Scholar] [CrossRef]
  11. Jouanno, J.; Almar, R.; Muller-Karger, F.; Morvan, G.; Van Tussenbroek, B.; Benshila, R.; Marchesiello, P.; Addo, K.A. Socio-ecological vulnerability assessment to Sargassum arrivals. Sci. Rep. 2025, 15, 9998. [Google Scholar] [CrossRef]
  12. Trinanes, J.; Putman, N.; Goni, G.; Hu, C.; Wang, M. Monitoring pelagic Sargassum inundation potential for coastal communities. J. Oper. Oceanogr. 2023, 16, 48–59. [Google Scholar] [CrossRef]
  13. Lazcano, H.; Arellano-Verdejo, J.; Rodríguez-Martínez, R. Algorithms applied for monitoring pelagic Sargassum. Mar. Eng. Front. 2023, 10, 1216426. [Google Scholar] [CrossRef]
  14. Wang, M.; Hu, C. Automatic Extraction of Sargassum Features From Sentinel-2 MSI Images. IEEE Trans. Geosci. Remote Sens. 2021, 59, 2579–2597. [Google Scholar] [CrossRef]
  15. Dierssen, H.; Chlus, A.; Russell, B. Hyperspectral discrimination of floating mats of seagrass wrack and the macroalgae Sargassum in coastal waters of Greater Florida Bay using airborne remote sensing. Remote Sens. Environ. 2015, 167, 247–258. [Google Scholar] [CrossRef]
  16. Arellano-Verdejo, J.; Lazcano-Hernandez, H.E. Towards sustainable coastal management: Aerial imagery and deep learning for high-resolution Sargassum Mapping. PeerJ 2024, 12, e18192. [Google Scholar] [CrossRef]
  17. Teyssier, M.; Desrosiers, C.; Hellio, C.; Kerninon, F. Assessing sargassum pressure on coastal habitats using a spatial and temporal approach at the territorial scale. Ecol. Indic. 2025, 171, 113211. [Google Scholar] [CrossRef]
  18. Raynaud, J.L.; Binet, R.; Pelou, S.; Dick, A.; Dejus, M.; Specht, B.; Dedieu, G.; Gascoin, S.; Hagolle, O.; Rolland, A. Multi-Thematic Earth Monitoring Capabilities Using Venμs Optical Time Series. In Proceedings of the IGARSS 2020—2020 IEEE International Geoscience and Remote Sensing Symposium; IEEE: New York, NY, USA, 2020; pp. 6113–6116. [Google Scholar]
  19. Dick, A.; Raynaud, J.L.; Rolland, A.; Pelou, S.; Coustance, S.; Dedieu, G.; Hagolle, O.; Burochin, J.P.; Binet, R.; Moreau, A. VENμS: Mission Characteristics, Final Evaluation of the First Phase and Data Production. Remote Sens. 2022, 14, 3281. [Google Scholar] [CrossRef]
  20. Hagolle, O.; Huc, M.; Pascual, D.V.; Dedieu, G. A multi-temporal method for cloud detection, applied to FORMOSAT-2, VENµS, LANDSAT and SENTINEL-2 images. Remote Sens. Environ. 2010, 114, 1747–1755. [Google Scholar] [CrossRef]
  21. Wang, M.; Hu, C. Mapping and quantifying Sargassum distribution and coverage in the Central West Atlantic using MODIS observations. Remote Sens. Environ. 2016, 183, 350–367. [Google Scholar] [CrossRef]
  22. Qi, L.; Hu, C.; Mikelsons, K.; Wang, M.; Lance, V.; Sun, S.; Barnes, B.B.; Zhao, J.; Van Der Zande, D. In search of floating algae and other organisms in global oceans and lakes. Remote Sens. Environ. 2020, 239, 111659. [Google Scholar] [CrossRef]
  23. Gower, J.; Hu, C.; Borstad, G.; King, S. Ocean Color Satellites Show Extensive Lines of Floating Sargassum in the Gulf of Mexico. IEEE Trans. Geosci. Remote Sens. 2006, 44, 3619–3625. [Google Scholar] [CrossRef]
  24. Vos, K.; Splinter, K.D.; Palomar-Vázquez, J.; Pardo-Pascual, J.E.; Almonacid-Caballer, J.; Cabezas-Rabadán, C.; Kras, E.C.; Luijendijk, A.P.; Calkoen, F.; Almeida, L.P.; et al. Benchmarking satellite-derived shoreline mapping algorithms. Commun. Earth Environ. 2023, 4, 345. [Google Scholar] [CrossRef]
  25. Bergsma, E.W.J.; Klotz, A.N.; Artigues, S.; Graffin, M.; Prenowitz, A.; Delvit, J.M.; Almar, R. Shoreliner: A Sub-Pixel Coastal Waterline Extraction Pipeline for Multi-Spectral Satellite Optical Imagery. Remote Sens. 2024, 16, 2795. [Google Scholar] [CrossRef]
  26. Otsu, N. A Threshold Selection Method from Gray-Level Histograms. Automatica 1975, 11, 23–27. [Google Scholar] [CrossRef]
  27. Vitousek, S.; Buscombe, D.; Vos, K.; Barnard, P.L.; Ritchie, A.C.; Warrick, J.A. The future of coastal monitoring through satellite remote sensing. Camb. Prism. Coast. Futures 2023, 1, e10. [Google Scholar] [CrossRef]
  28. Pardo-Pascual, J.; Sánchez-García, E.; Almonacid-Caballer, J.; Palomar-Vázquez, J.; Priego De Los Santos, E.; Fernández-Sarría, A.; Balaguer-Beser, Á. Assessing the Accuracy of Automatically Extracted Shorelines on Microtidal Beaches from Landsat 7, Landsat 8 and Sentinel-2 Imagery. Remote Sens. 2018, 10, 326. [Google Scholar] [CrossRef]
  29. Graffin, M.; Touzé, T.; Bergsma, E.W.; Almar, R. Towards a global assessment of sandy shorelines: Systematic extraction and validation of optical satellite-derived coastal indicators at various sites. Remote Sens. Environ. 2025, 331, 115033. [Google Scholar] [CrossRef]
  30. Cipolletti, M.P.; Delrieux, C.A.; Perillo, G.M.; Cintia Piccolo, M. Superresolution border segmentation and measurement in remote sensing images. Comput. Geosci. 2012, 40, 87–96. [Google Scholar] [CrossRef]
  31. Wang, M.; Hu, C.; Cannizzaro, J.; English, D.; Han, X.; Naar, D.; Lapointe, B.; Brewton, R.; Hernandez, F. Remote Sensing of Sargassum Biomass, Nutrients, and Pigments. Geophys. Res. Lett. 2018, 45, 12359–12367. [Google Scholar] [CrossRef]
  32. Descloitres, J.; Minghelli, A.; Steinmetz, F.; Chevalier, C.; Chami, M.; Berline, L. Revisited Estimation of Moderate Resolution Sargassum Fractional Coverage Using Decametric Satellite Data (S2-MSI). Remote Sens. 2021, 13, 5106. [Google Scholar] [CrossRef]
  33. Pitek, L. High Resolution Coastal Sargassum Floating Algae Detection with VENUS Mission in Carribean Arc. Available online: https://www.aviso.altimetry.fr/en/data/products/value-added-products/sargassum/hr-coastal-sargassum-floating-algae-detection-with-venus.html (accessed on 1 January 2026).
  34. Hersbach, H.; Bell, B.; Berrisford, P.; Hirahara, S.; Horányi, A.; Muñoz-Sabater, J.; Nicolas, J.; Peubey, C.; Radu, R.; Schepers, D.; et al. The ERA5 global reanalysis. Q. J. R. Meteorol. Soc. 2020, 146, 1999–2049. [Google Scholar] [CrossRef]
  35. Athanasiou, P.; Van Dongeren, A.; Pronk, M.; Giardino, A.; Vousdoukas, M.; Ranasinghe, R. Global Coastal Characteristics (GCC): A global dataset of geophysical, hydrodynamic, and socioeconomic coastal indicators. Earth Syst. Sci. Data 2024, 16, 3433–3452. [Google Scholar] [CrossRef]
  36. Steinmetz, F.; Ramon, D. Sentinel-2 MSI and Sentinel-3 OLCI consistent ocean colour products using POLYMER. In Proceedings of the Remote Sensing of the Open and Coastal Ocean and Inland Waters; Frouin, R.J., Murakami, H., Eds.; SPIE: Honolulu, HI, USA, 2018; p. 13. [Google Scholar] [CrossRef]
  37. Michel, J.; Vinasco-Salinas, J.; Inglada, J.; Hagolle, O. SEN2VENµS, a Dataset for the Training of Sentinel-2 Super-Resolution Algorithms. Data 2022, 7, 96. [Google Scholar] [CrossRef]
  38. Laval, M.; Belmouhcine, A.; Courtrai, L.; Descloitres, J.; Salazar-Garibay, A.; Schamberger, L.; Minghelli, A.; Thibaut, T.; Dorville, R.; Mazoyer, C.; et al. Detection of Sargassum from Sentinel Satellite Sensors Using Deep Learning Approach. Remote Sens. 2023, 15, 1104. [Google Scholar] [CrossRef]
Figure 1. Coastal zones studied include Northern and Southern Guadeloupe, South East Martinique, Northern Cancún and Southern Yucatán Cozumel.
Remotesensing 18 00624 g001
Figure 2. Available scenes per month and zone in the VENµS dataset.
Remotesensing 18 00624 g002
Figure 3. Spectral reflectance signatures of several Sargassum rafts (shades of brown) versus seawater (blue) off North Guadeloupe VENµS-VM5 data, showing characteristic red-edge peak signal and selected reflectances for AFAI computation.
Remotesensing 18 00624 g003
Figure 4. Flowchart of the overall methodology used for Sargassum detection dataset creation using AFAI index.
Remotesensing 18 00624 g004
Figure 5. Pie chart of trust index repartition for the whole dataset. It shows that 70% of VENµS Martinique, Guadeloupe and Yucatán scenes are usable. High cloud cover (>50%) is the primary cause why some scenes are unusable for Sargassum monitoring.
Remotesensing 18 00624 g005
Figure 6. Four consecutive VENµS detections over northern Guadeloupe (25, 26, 28, and 29 April 2023) with ERA5 10 m wind direction vector and speed as white arrows near acquisition times. Downsampled at 2 px (8 m resolution), rafts > 30 m contoured in red.
Remotesensing 18 00624 g006
Figure 7. Detailed VENµS detections over Northern Guadeloupe with ERA5 wind direction near acquisition dates. (Top left): 31 May 2022; (top right): 1 June 2022; (bottom left): Anse à la Barque (26 April 2023); (bottom right): Anse Marguerite (28 April 2023). Resolution of 4 m, rafts > 16 m contoured in red and ERA5 10 m wind direction vector and speed as white arrows.
Remotesensing 18 00624 g007
Figure 8. Detailed VENµS detection between Mexico and Cozumel island on 17 May 2022. (Left): True Color at a resolution of 4 m, and rafts > 16 m contoured in red; (right): AFAI deviation denoised. ERA5 10 m wind direction vector and speed shown as a white arrow.
Remotesensing 18 00624 g008
Figure 9. Time-averaged binarized AFAI values on a 1 km grid that indicate the presence of Sargassum for July (top) and September (bottom) 2023 for all zones. The black rectangles refer to the Venµs swath.
Remotesensing 18 00624 g009
Figure 10. Time-averaged binarized AFAI values on a 1 km grid in a 2 km coastal band, indicating the presence of Sargassum associated with corresponding coast types for July (top) and September (bottom) 2023 for all zones.
Remotesensing 18 00624 g010
Table 1. Wavelengths of the VENµS VM5 spectral bands, in bold the ones used in the present study.
Band NumberCentral Wavelength (nm)
B1420.0
B2446.9
B3491.9
B4555.0
B5619.7
B6619.5
B7666.2 λ 1
B8702.0
B9741.1
B10782.2 λ 2
B11861.1
B12908.7 λ 3
Table 2. Dataset variables and processing stages.
VariableDescription
AFAI_rawRaw index field
AFAI_landfree_cloudfreeLand- and cloud-masked index field
AFAI_deviationAFAI deviation from local background
AFAI_deviation_denoisedAFAI deviation denoised ( σ gauss = 1.5 )
AFAI_detectionAFAI deviation denoised > μ + 3.5 σ
AFAI_detection_binBinary Sargassum classification
RGBRed–Green–Blue SRE data
Attributes
cloud_cover_over_waterFractional cloud coverage over water
valid_waterValid water pixels (land, clouds, SRE < 0 masked)
μ Scene mean of deviation denoised
σ Scene standard deviation of deviation denoised
threshold μ + 3.5 σ
sargassum_fractionSargassum coverage per scene
trust_index0: discarded; 1: cloud cover over ocean > 50%; 2: misdetected clouds; 3: noisy detection; 4: trusted
sargassum_visualVisual confirmation (0/1)
product_versionV1.0
Disclaimer/Publisher’s Note: The statements, opinions and data contained in all publications are solely those of the individual author(s) and contributor(s) and not of MDPI and/or the editor(s). MDPI and/or the editor(s) disclaim responsibility for any injury to people or property resulting from any ideas, methods, instructions or products referred to in the content.