Article

Morphometric Analysis of the Jingpo Lake Volcanic Field: A Terrestrial Analog for Lunar Lava Flow


1
College of Land Science and Technology, China University of Geosciences (Beijing), Beijing 100083, China
2
Lunar and Planetary Remote Sensing Exploration Research Center, China University of Geosciences (Beijing), Beijing 100083, China
3
Lunar and Planetary Exploration International Cooperation Research Center, Joint Research Center for Deep Space Exploration, Ministry of Education, Beijing 100083, China
*
Author to whom correspondence should be addressed.
Remote Sens. 2026, 18(3), 512; https://doi.org/10.3390/rs18030512
Submission received: 7 January 2026 / Revised: 23 January 2026 / Accepted: 2 February 2026 / Published: 5 February 2026

Highlights

What are the main findings?
  • Established the Jingpo Lake Volcanic Field (JLVF) as a high-fidelity terrestrial analog for the lunar Marius Hills through a systematic morphometric continuum.
  • Identified a “U-to-V” cross-sectional transition in collapse trenches, confirming that lunar sinuous rilles originate from tube-roof failure.
What are the implications of the main findings?
  • Provides a new geological model to explain the transition from subsurface lava tubes to open sinuous rilles on the Moon.
  • Offers high-resolution terrestrial data to fill the gap caused by the lack of sub-meter scale lunar orbital imagery.

Abstract
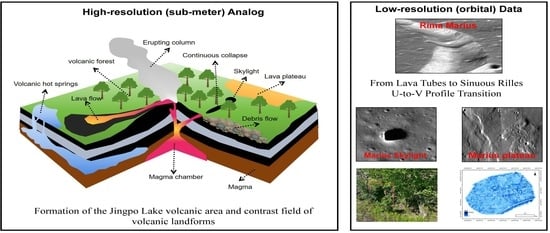
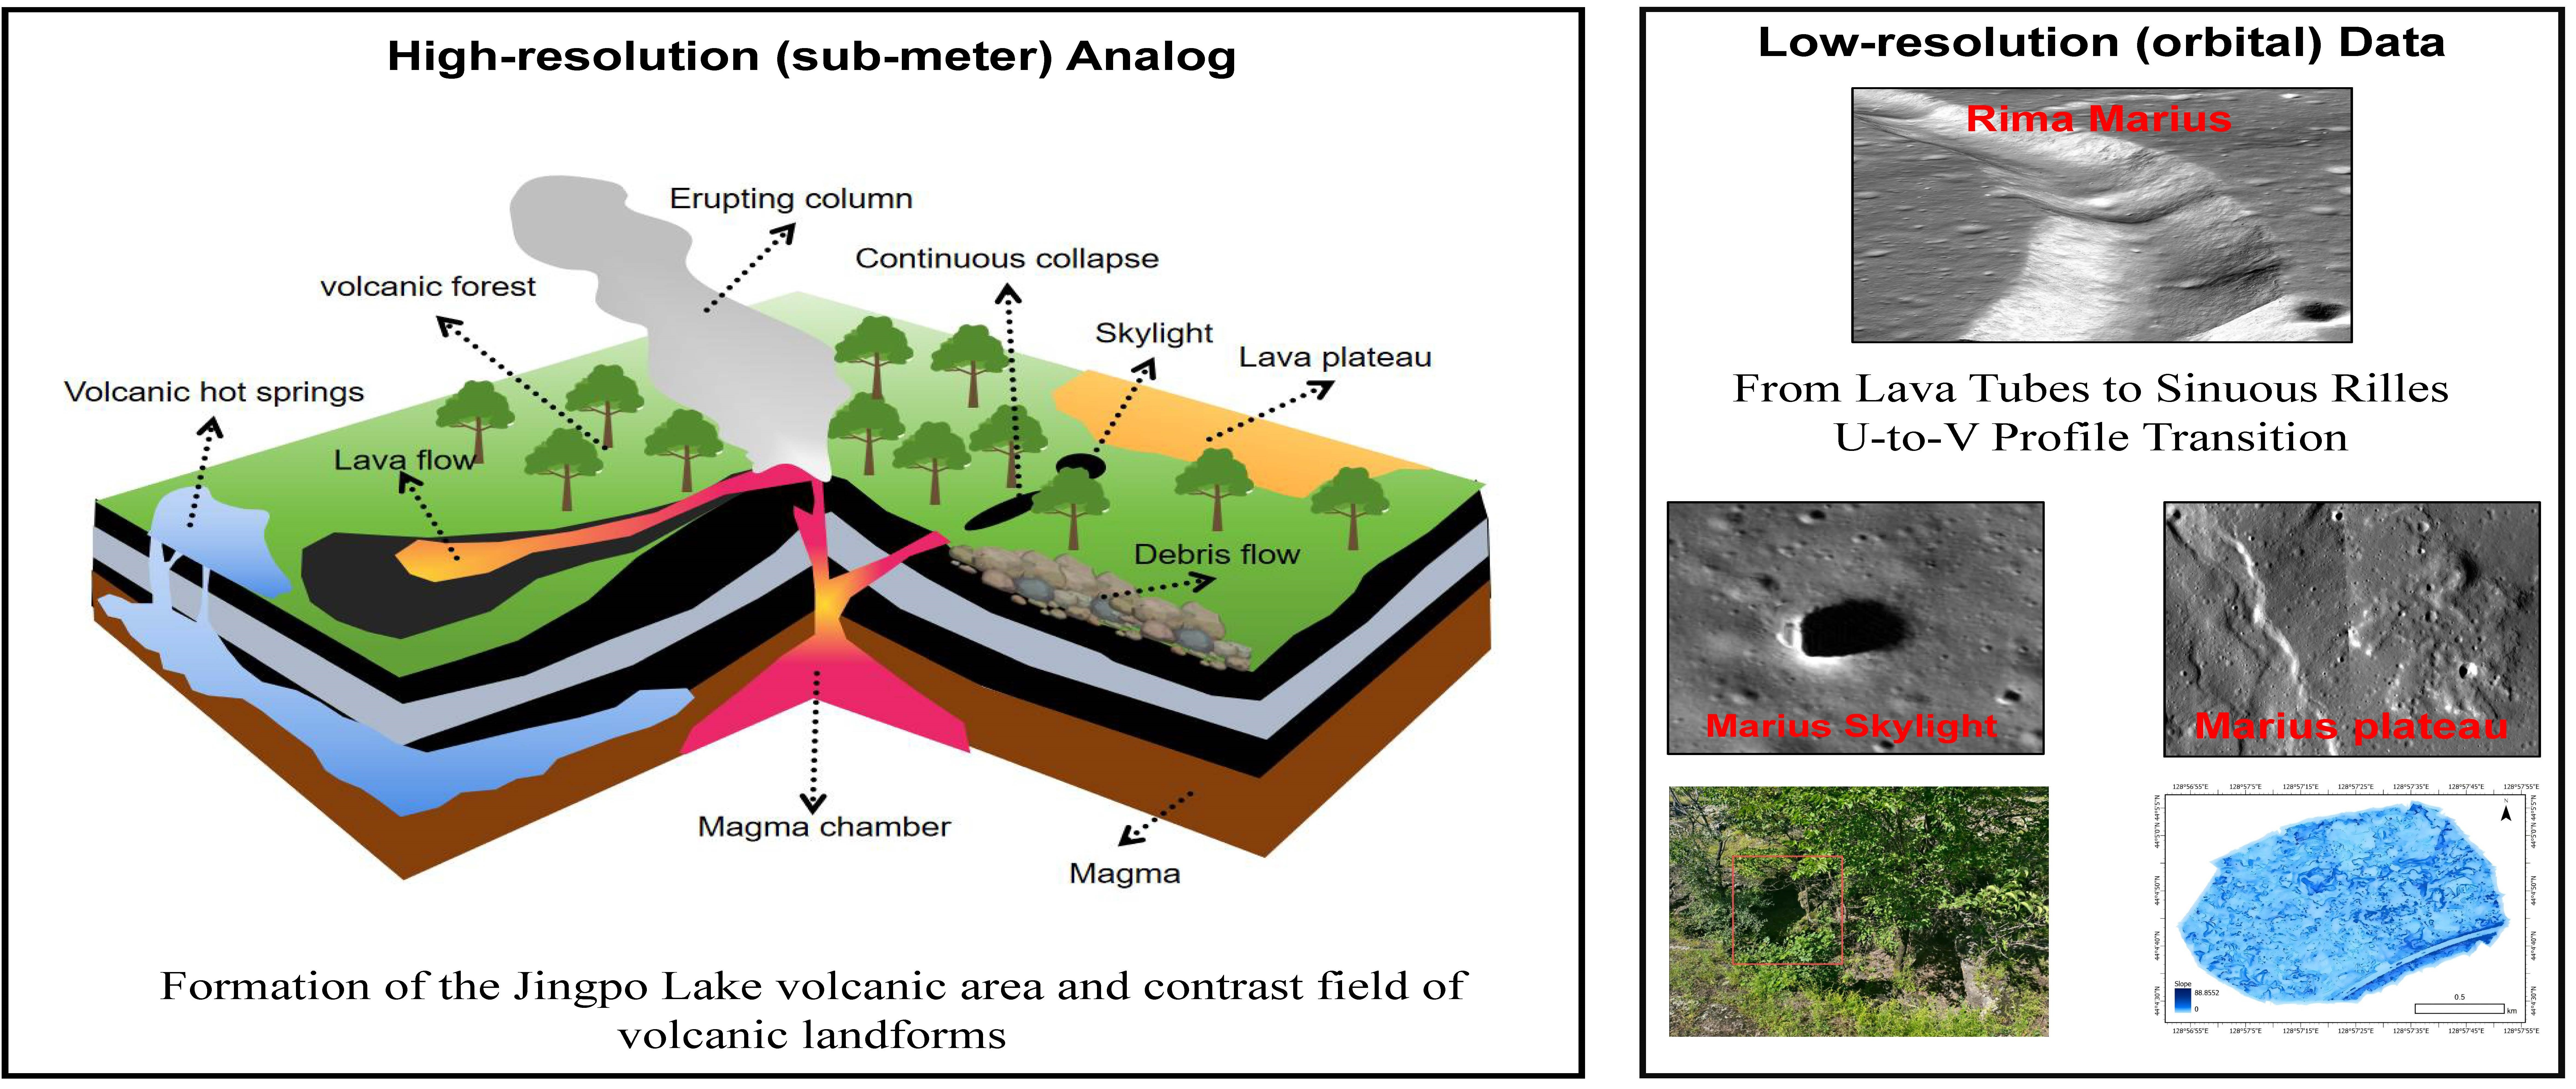
The lack of high-precision imaging data for lunar volcanic regions currently hinders the detailed characterization of lava tube systems and their associated fine-scale geomorphology. To address this information deficit, this study establishes the Jingpo Lake Volcanic Field (JLVF) in Northeast China as a primary terrestrial analog for the lunar Marius Hills complex. We systematically characterize the basaltic morphometric continuum, tracing the geological evolution from proximal scoria cones through medial lava tube skylights to distal lava plateaus. Focusing on the subsurface transport system, we identify a linear chain of discontinuous skylights that structurally mirrors the “proto-rille” stage of lunar sinuous rilles. Quantitative morphometry reveals that these terrestrial vents reproduce the geometric duality of lunar pits, ranging from stable “deep shafts” to degraded “funnel pits,” effectively validating the mechanical diversity of the lunar inventory. Critically, the “U-to-V” cross-sectional transition observed in JLVF collapse trenches serves as diagnostic ground-truth evidence, confirming that lunar rilles originate from the catastrophic roof failure of subsurface tubes rather than purely thermal erosion. Regarding the lava plateau, our field investigation resolves sub-meter micro-textures—including laminar pahoehoe ropes and inflation fissures—that are typically obscured by the resolution limits of current lunar orbiters. These findings suggest that the seemingly “smooth” lunar maria likely host complex, rugged micro-terrains. Therefore, comparing lunar volcanic regions with simulated volcanic fields from Earth is crucial. Analyzing potential volcanic products from angles undetectable by some lunar satellites can offer vital insights for future lunar exploration.

Graphical Abstract

1. Introduction

The history of extraterrestrial lava tube exploration has evolved from theoretical hypothesis to orbital verification [1]. As early as the late 1960s, Oberbeck et al. hypothesized based on fluid dynamics models that the meandering sinuous rilles observed on the Moon (e.g., Hadley Rille) [2] were essentially collapsed lava tubes [3,4,5]. However, direct observational evidence remained elusive for decades. A breakthrough occurred in 2009 when the JAXA SELENE (Kaguya) spacecraft detected a vertical collapse pit with a diameter of approximately 65 m in the Marius Hills region (Marius Hills Hole) [6], which was interpreted as a “skylight” providing access to a massive subsurface void [7]. Subsequently, NASA’s Lunar Reconnaissance Orbiter (LRO) confirmed the existence of over 200 similar pits, predominantly located in the mare basalt regions. Furthermore, gravity gradiometry data from the GRAIL mission revealed mass-deficit anomalies beneath these rilles [8,9], suggesting the presence of intact, empty voids extending for tens of kilometers [6]. Paralleling these lunar findings, exploration on Mars by the Mars Odyssey Thermal Emission Imaging System (THEMIS) and the Mars Reconnaissance Orbiter (MRO) has identified atypical pit craters on the flanks of shield volcanoes (e.g., Pavonis Mons) [10,11], providing strong evidence for cavernous spaces [10]. However, the formation mechanism of lunar sinuous rilles remains a subject of debate between thermal erosion and tube-fed collapse models [12,13,14,15]. Distinguishing between these mechanisms requires resolving micro-geometric features—such as floor roughness and accumulation talus—that are currently obscured by the “resolution gap” of orbital sensors [16].
Consequently, orbital data alone cannot resolve the micro-morphological continuity required to interpret these volcanic processes. Existing terrestrial analog studies are frequently limited by specific geological constraints or environmental degradation, rendering them imperfect proxies for the lunar maria. The current global standards, such as the Kazumura Cave in Hawaii [17] and the Corona Lava Tube in the Canary Islands [18,19], offer extensive subterranean networks; however, they are predominantly situated on the steep flanks of massive shield volcanoes. This high-gradient topography contrasts sharply with the nearly horizontal, low-viscosity flood basalts of the lunar maria, complicating the comparative analysis of laminar flow emplacement, which is typically intended for flat terrain. Similarly, analogs in Iceland (e.g., Surtshellir) [20], while basaltic, often bear the distinct imprint of glaciovolcanism (lava-ice interaction) and phreatomagmatic activity, creating morphological features absent on the desiccated Moon. In the Asian region, the famous Manjanggul Cave on Jeju Island (South Korea) [21], despite being morphologically significant, has undergone extensive anthropogenic modification for tourism, including paved floors and artificial lighting, which compromises the preservation of original floor textures essential for interpreting flow dynamics. Domestically, while the Haikou Volcanic Cluster (China) [22] contains numerous tunnels, its tropical location results in intense chemical weathering and dense vegetation cover, which obliterates the delicate surface micro-topography (e.g., pahoehoe ropes and tumuli) essential for high-fidelity roughness characterization.
Crucially, a common drawback across these sites is the lack of “morphological continuity” within a single, accessible Holocene field. It is rare to find a site that simultaneously preserves an intact subsurface tube representing the transport system, a linearly aligned chain of collapse skylights representing the transition to sinuous rilles, and a pristine, unweathered surface for textural analysis. Most analogs offer one or two of these elements but lack the integrated “surface-to-subsurface” sequence required to study the evolutionary mechanism of lunar rille formation. Addressing these limitations, this study evaluates the Jingpo Lake Volcanic Field (JLVF), located in the deep mountainous region of the Zhangguangcai Range in Northeast China, as a comprehensive “terrestrial comparative field” for lunar lava flow geomorphology. As a Holocene volcanic field formed by multi-stage effusive eruptions, the JLVF retains a pristine volcanic morphology comparable to young lunar mare basalts. Anchored by 13 well-preserved craters (including the prominent “Underground Forest” cluster) serving as eruptive centers, massive basaltic lava flows extend approximately 26 km along the prehistoric river valley, covering an area of 500 km2 and hosting a complex lava tube network with a cumulative length exceeding 20 km [23,24,25].
Uniquely, the JLVF exhibits all key morphological elements required for lunar analogy along a single flow path, effectively solving the fragmentation issue of other analogs. Its underground contains complex, complete tunnels, which are mushroom-shaped or have double-layered cross-sections, serving as an ideal geometric model for habitable spaces. The surface features a linear chain of 10 discontinuous collapsed skylights, perfectly simulating the formation stage of the “primitive lunar gullies” of the moon’s meandering lunar gullies. The extensive lava terraces retain complex rope-like lava textures and bulges, providing strong support for the study of lunar lava flow landforms. This study aims to quantitatively characterize the “surface-to-subsurface” continuum of the JLVF using a multi-scale remote sensing approach. We integrate airborne UAV photogrammetry to map the macroscopic surface topography and collapse chains, combined with handheld SLAM LiDAR to map the GPS-denied subsurface environments. This paper aims to achieve three core geological objectives: (1) to study the morphological analysis of lava tube windows and similarities to lunar lava tube windows; (2) to elucidate the formation mechanism of the meandering lunar gullies by analyzing the longitudinal randomness of the collapse chain; and (3) to characterize the rheological traces characterizing basaltic emplacement on a lava plateau and analysis of lunar invisible landforms.

2. Study Area

2.1. The Jingpo Lake Volcanic Field (JLVF)

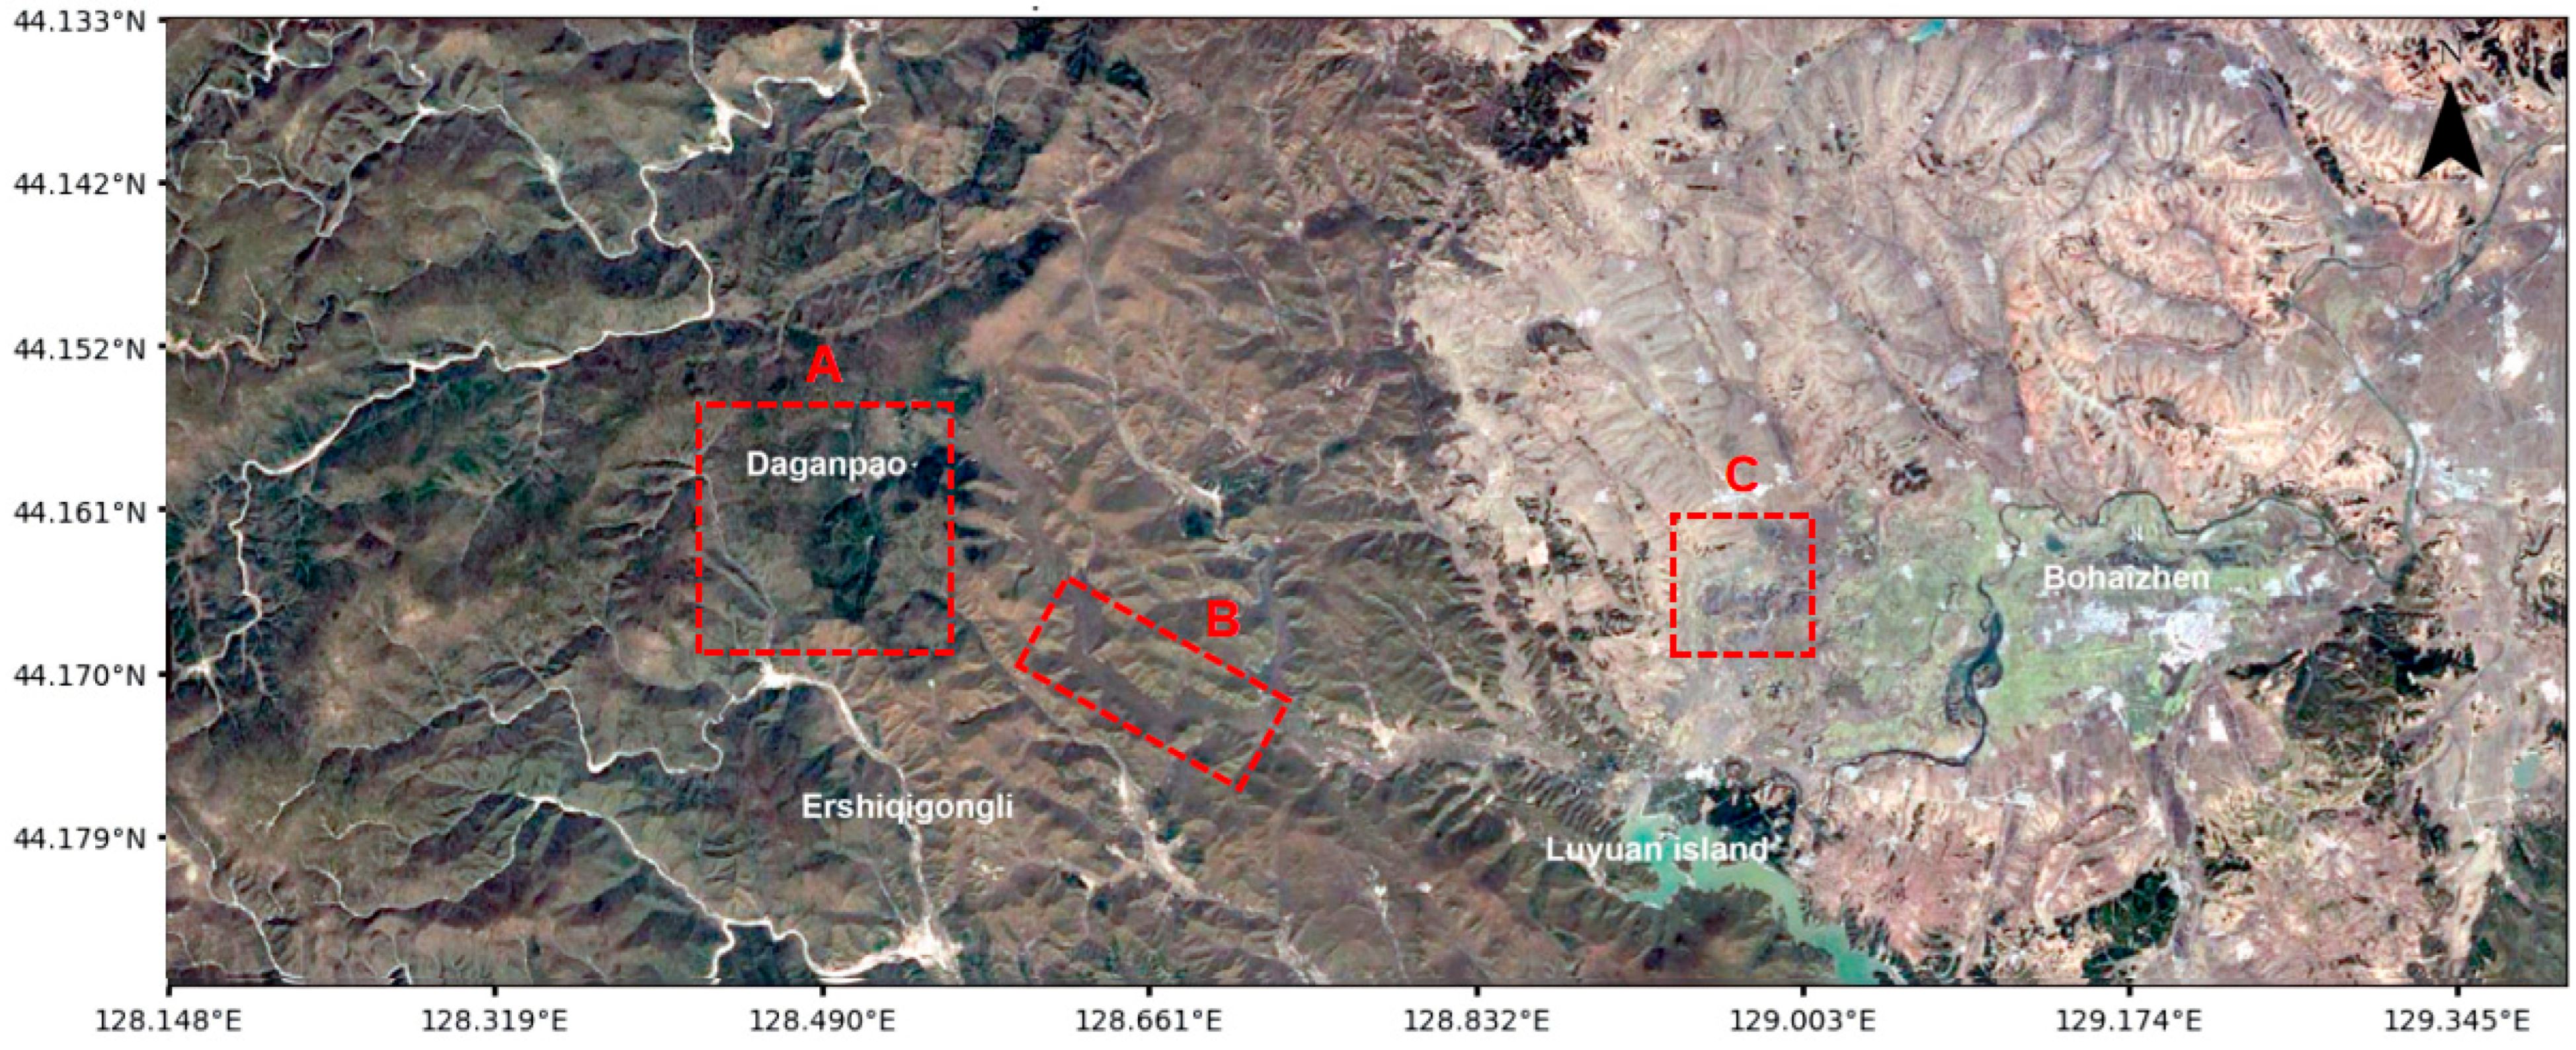
The JLVF, located in Northeast China (43°52′–44°20′N, 128°30′–129°00′E) (Figure 1), serves as the primary terrestrial analog for this study. As one of the youngest monogenetic volcanic fields in Eastern China, JLVF is characterized by Holocene effusive eruptions dated to approximately 5500–5200 years BP. The eruptive activity produced voluminous alkali olivine basalt flows that extended 26 km southeastward from the “Crater Forest” vents, forming extensive lava plateaus. Regarding the Petrological Basis for Analog Validity, although these alkali basalts differ chemically from lunar tholeiites, they exhibit convergent rheological behaviors—specifically high eruption temperatures and low viscosity—that facilitate the formation of extensive sheet flows structurally equivalent to lunar mare deposits [26,27].
Uniquely, this area hosts a complex subsurface lava tube system with a cumulative length exceeding 20 km. Along the main flow trajectory, a linear sequence of discontinuous collapse skylights exposes the tube interior, presenting a structural equivalent to the “proto-rille” stage of lunar sinuous rilles. In addition to the main tubes, the plateau architecture is defined by Inflation Fissures and Cryptic Subsurface Cavities—deep axial clefts and lateral voids formed by the uplift and partial drainage of the crust—which present distinct structural hazards often obscured in orbital data. Due to the young age of the flows, the surface retains pristine volcanic micro-topography, specifically the Laminar Pahoehoe and Inflated Sheet Flows facies. These surfaces preserve intricate ropy ridges and inflation tumuli, providing high-fidelity ground-truth data for comparing surface roughness with lunar mare basalts.
Jingpo Lake Volcano has a high average elevation, with an average relative height of nearly 300 m and a maximum diameter exceeding 400 m. All volcanoes are circular or nearly circular, exhibiting a ring-shaped collapse structure as shown in Table 1. The crater is deep and funnel-shaped, with steep inner walls approaching 90 degrees. The ejecta are primarily basalt, consisting mainly of volcanic bombs, volcanic cinders, volcanic ash, lava cake, and some gravel.
These steep-sided scoria cones were critical initiation points for the lava tube formation. Driven by high effusion rates, the unconsolidated walls of the cones were frequently breached, forming distinct outflow tubes (breaches) at their bases. These focused flows rapidly tube and roofed over, evolving into thermally efficient subsurface conduits that transported lava far beyond the vent. This insulated transport system allowed the basaltic flows to reach the distal lowlands, where they eventually obstructed the Paleo-Mudan River—creating the barrier lake (Jingpo Lake) and depositing the extensive lava plateau that characterizes the field’s eastern margin [28,29].

2.2. Ground-Truth Classification of Volcanic Surface Textures

While orbital Digital Terrain Models (DTMs) provide a macro-scale topographic baseline for lunar landing site selection, their resolution limits (typically 2–5 m/px for LROC NAC) obscure sub-meter surface textures that govern critical wheel-terrain interaction mechanics [30]. To bridge this observational gap, we leverage the millimeter-resolution UAV imagery and field survey data from the JLVF to construct a comprehensive ground-truth classification system. This framework categorizes the basaltic surface into three distinct rheological facies—Laminar Pahoehoe, Brittle Auto-breccia, and Gravitational Talus—providing a quantitative reference for interpreting ambiguous lunar orbital signals.
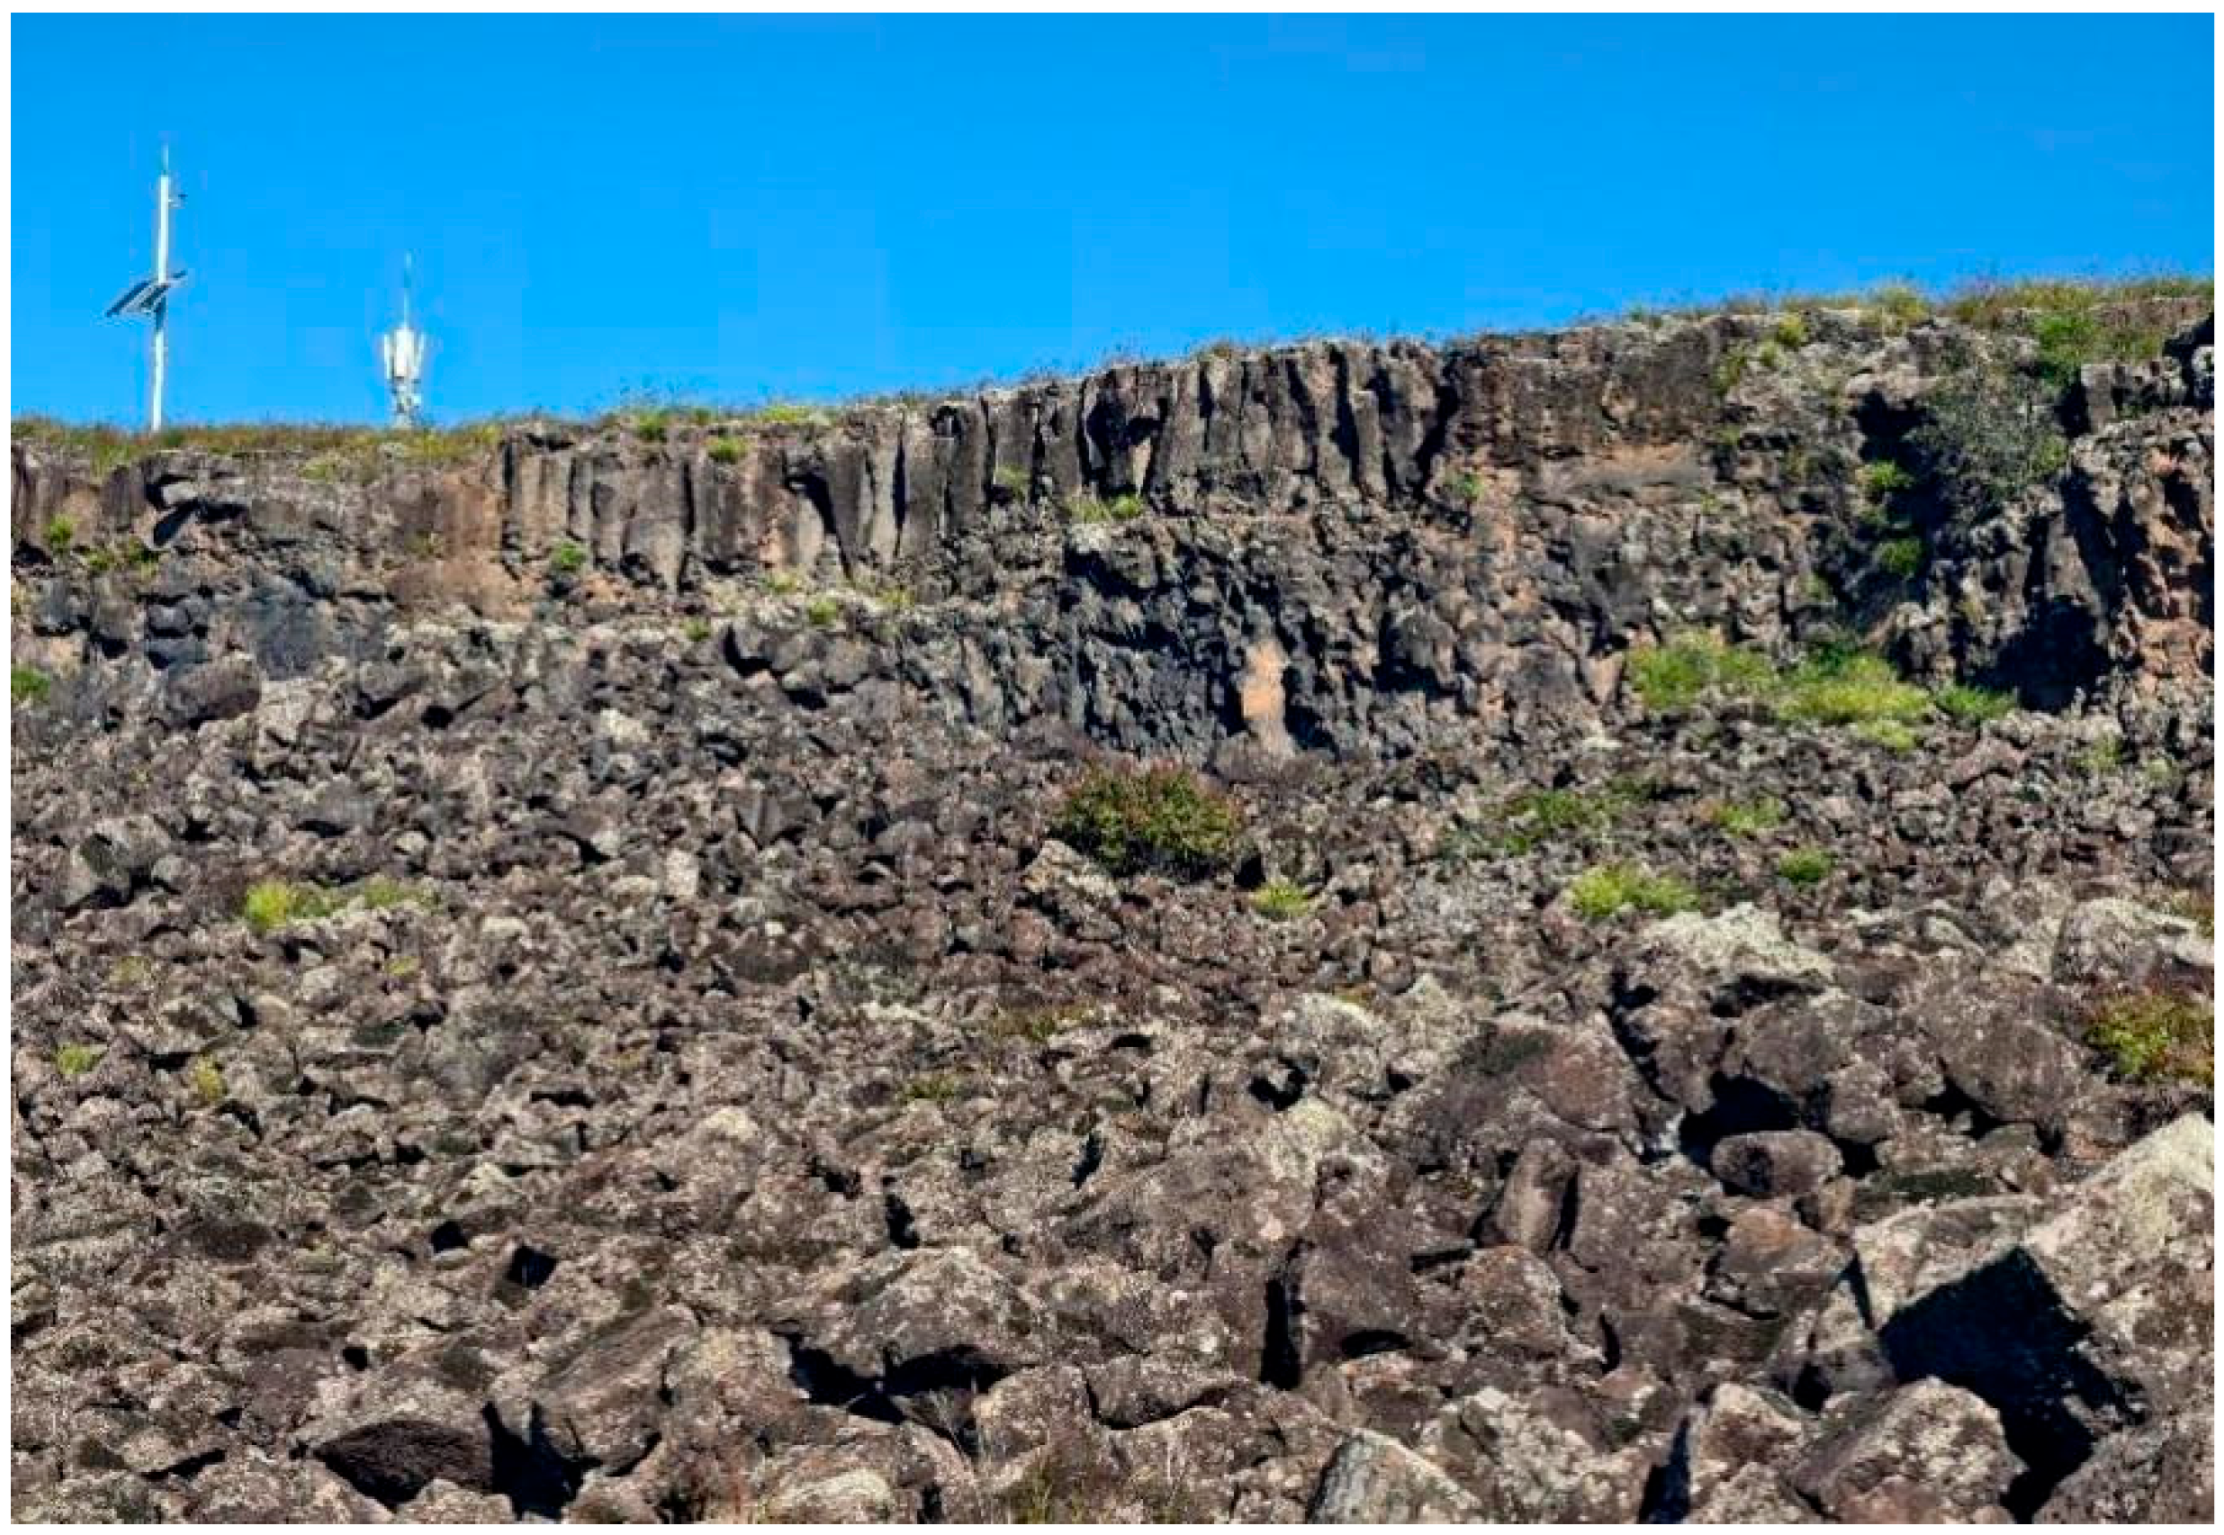
Establishing the validity of JLVF as a lunar analog requires a rigorous comparison of material properties. Geochemically, the JLVF basalts are classified as alkali olivine basalts, characterized by a silica-undersaturated composition enriched in alkalis (Na, K). In contrast, the lunar maria, including the Marius Hills region, are predominantly composed of Tholeiitic Basalts, which are depleted in volatiles but enriched in iron ( F e ) and titanium ( T i ) [31,32]. Despite these chemical distinctions, both rock types belong to the mafic volcanic family and exhibit convergent rheological behaviors essential for engineering simulations. Both magmas erupted at high temperatures (~1100–1200 °C) with low viscosity, facilitating the formation of extensive, flat lava sheets rather than steep stratovolcanoes as shown in Figure 2 [32]. Furthermore, the unweathered compressive strength (100–300 MPa) and density (~2.8–3.0 g/cm3) of the JLVF basalts are mechanically equivalent to lunar bedrock [32]. Consequently, the surface textures discussed herein are products of universal fluid dynamics—specifically the interplay between shear stress and cooling rates—rather than unique chemical signatures, ensuring their applicability to lunar surface modeling.
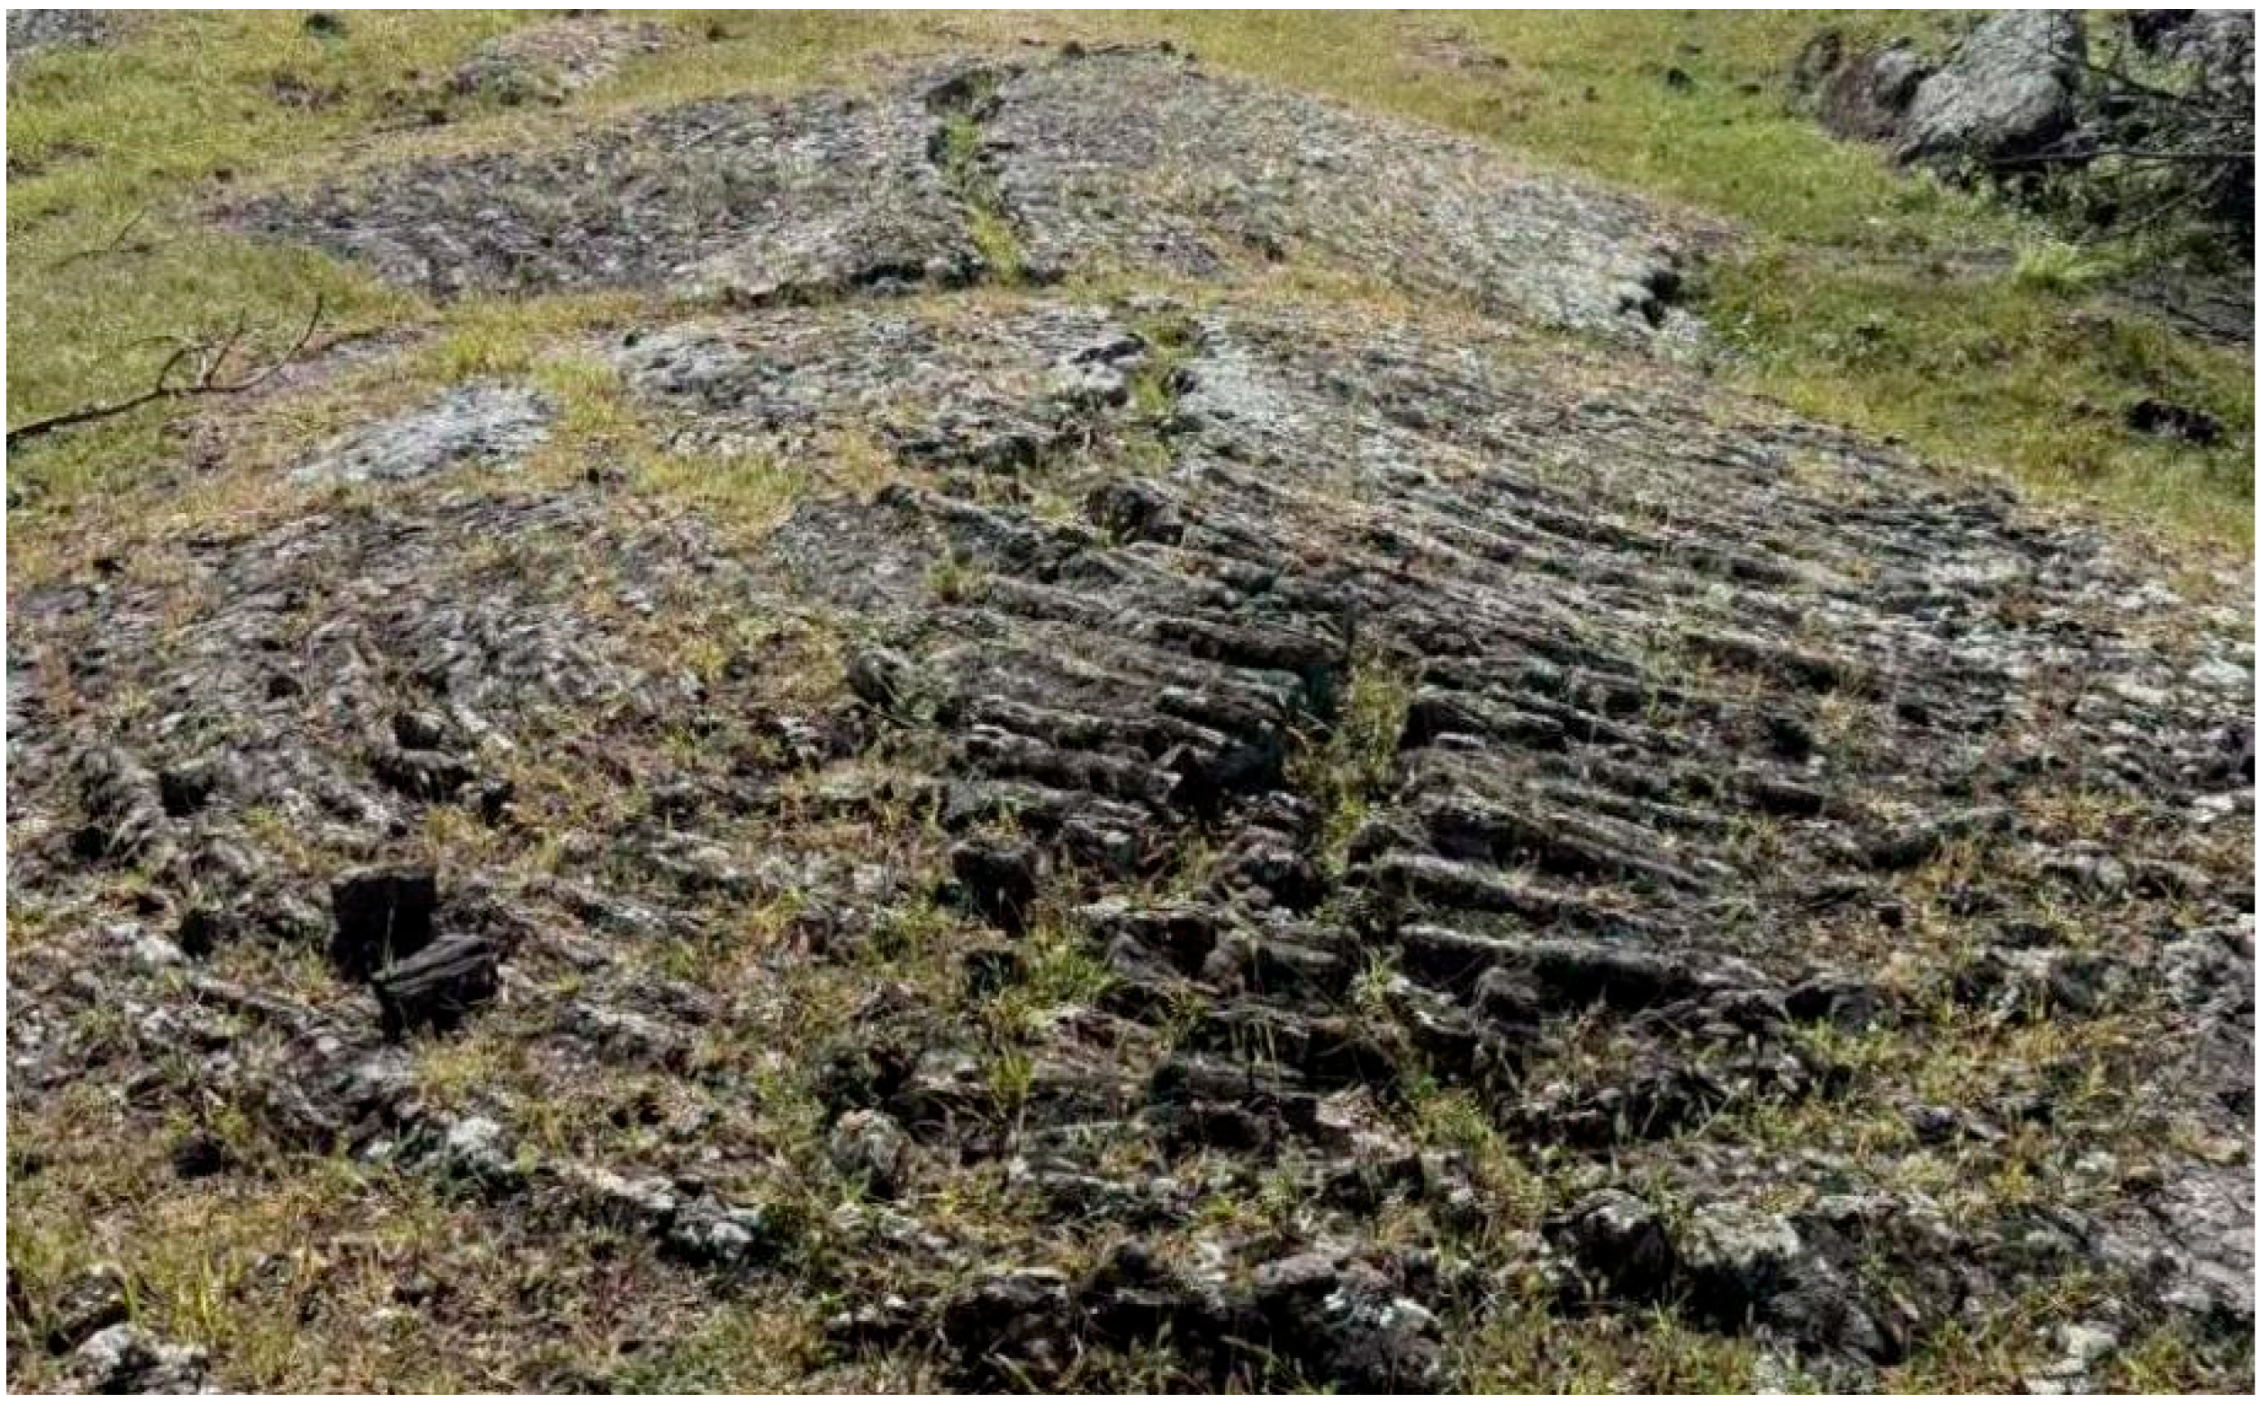
As illustrated in Figure 3, the widespread distribution of laminar pahoehoe facies within the JLVF provides morphological evidence for an inflation mechanism. This suggests that these deposits are not merely the result of low-viscosity alkali olivine basalt emplaced under stable laminar flow, but involve more complex emplacement processes. It serves as direct geomorphic evidence of the Inflation Mechanism [33]. Its diagnostic decimeter-scale ropy textures (wavelength 10–30 cm, amplitude 2–5 cm as shown in Figure 4) originate from the compressional folding of a cooling viscoelastic crust, driven by the continuous shear of the underlying fluid core. Consequently, this low-roughness surface is not merely a superficial cooling skin but a “fossilized record” of the lava’s internal thermo-fluid dynamics [34].
Thermal Insulation and Long-Distance Transport: The critical geological function of this facies lies in its thermal insulation capacity. The rapidly solidified surface crust acts as a highly efficient insulating carapace, significantly minimizing radiative heat loss and maintaining the high temperature and low viscosity of the internal fluid core [35]. This mechanism facilitates long-distance transport via tube or sheet flows (exemplified by JLVF flows extending over 26 km). Ultimately, internal hydrostatic pressure uplifts the crust to form extensive, flat-topped plateaus and localized inflation tumuli.
Implications for Lunar Exploration: These findings offer profound planetary geological insights into the “smooth” radar-dark regions of the lunar maria. They suggest that lunar plains, which appear featureless in orbital data, may actually host complex networks of micro-scale ropy ridges and inflation clefts. This confirms that in shaping planetary micro-topography, universal fluid dynamic mechanisms (laminar flow and inflation) override geochemical distinctions. Consequently, future lunar missions targeting these “smooth” landing zones must anticipate complex micro-terrains formed by the freezing of ancient fluid turbulence [36].
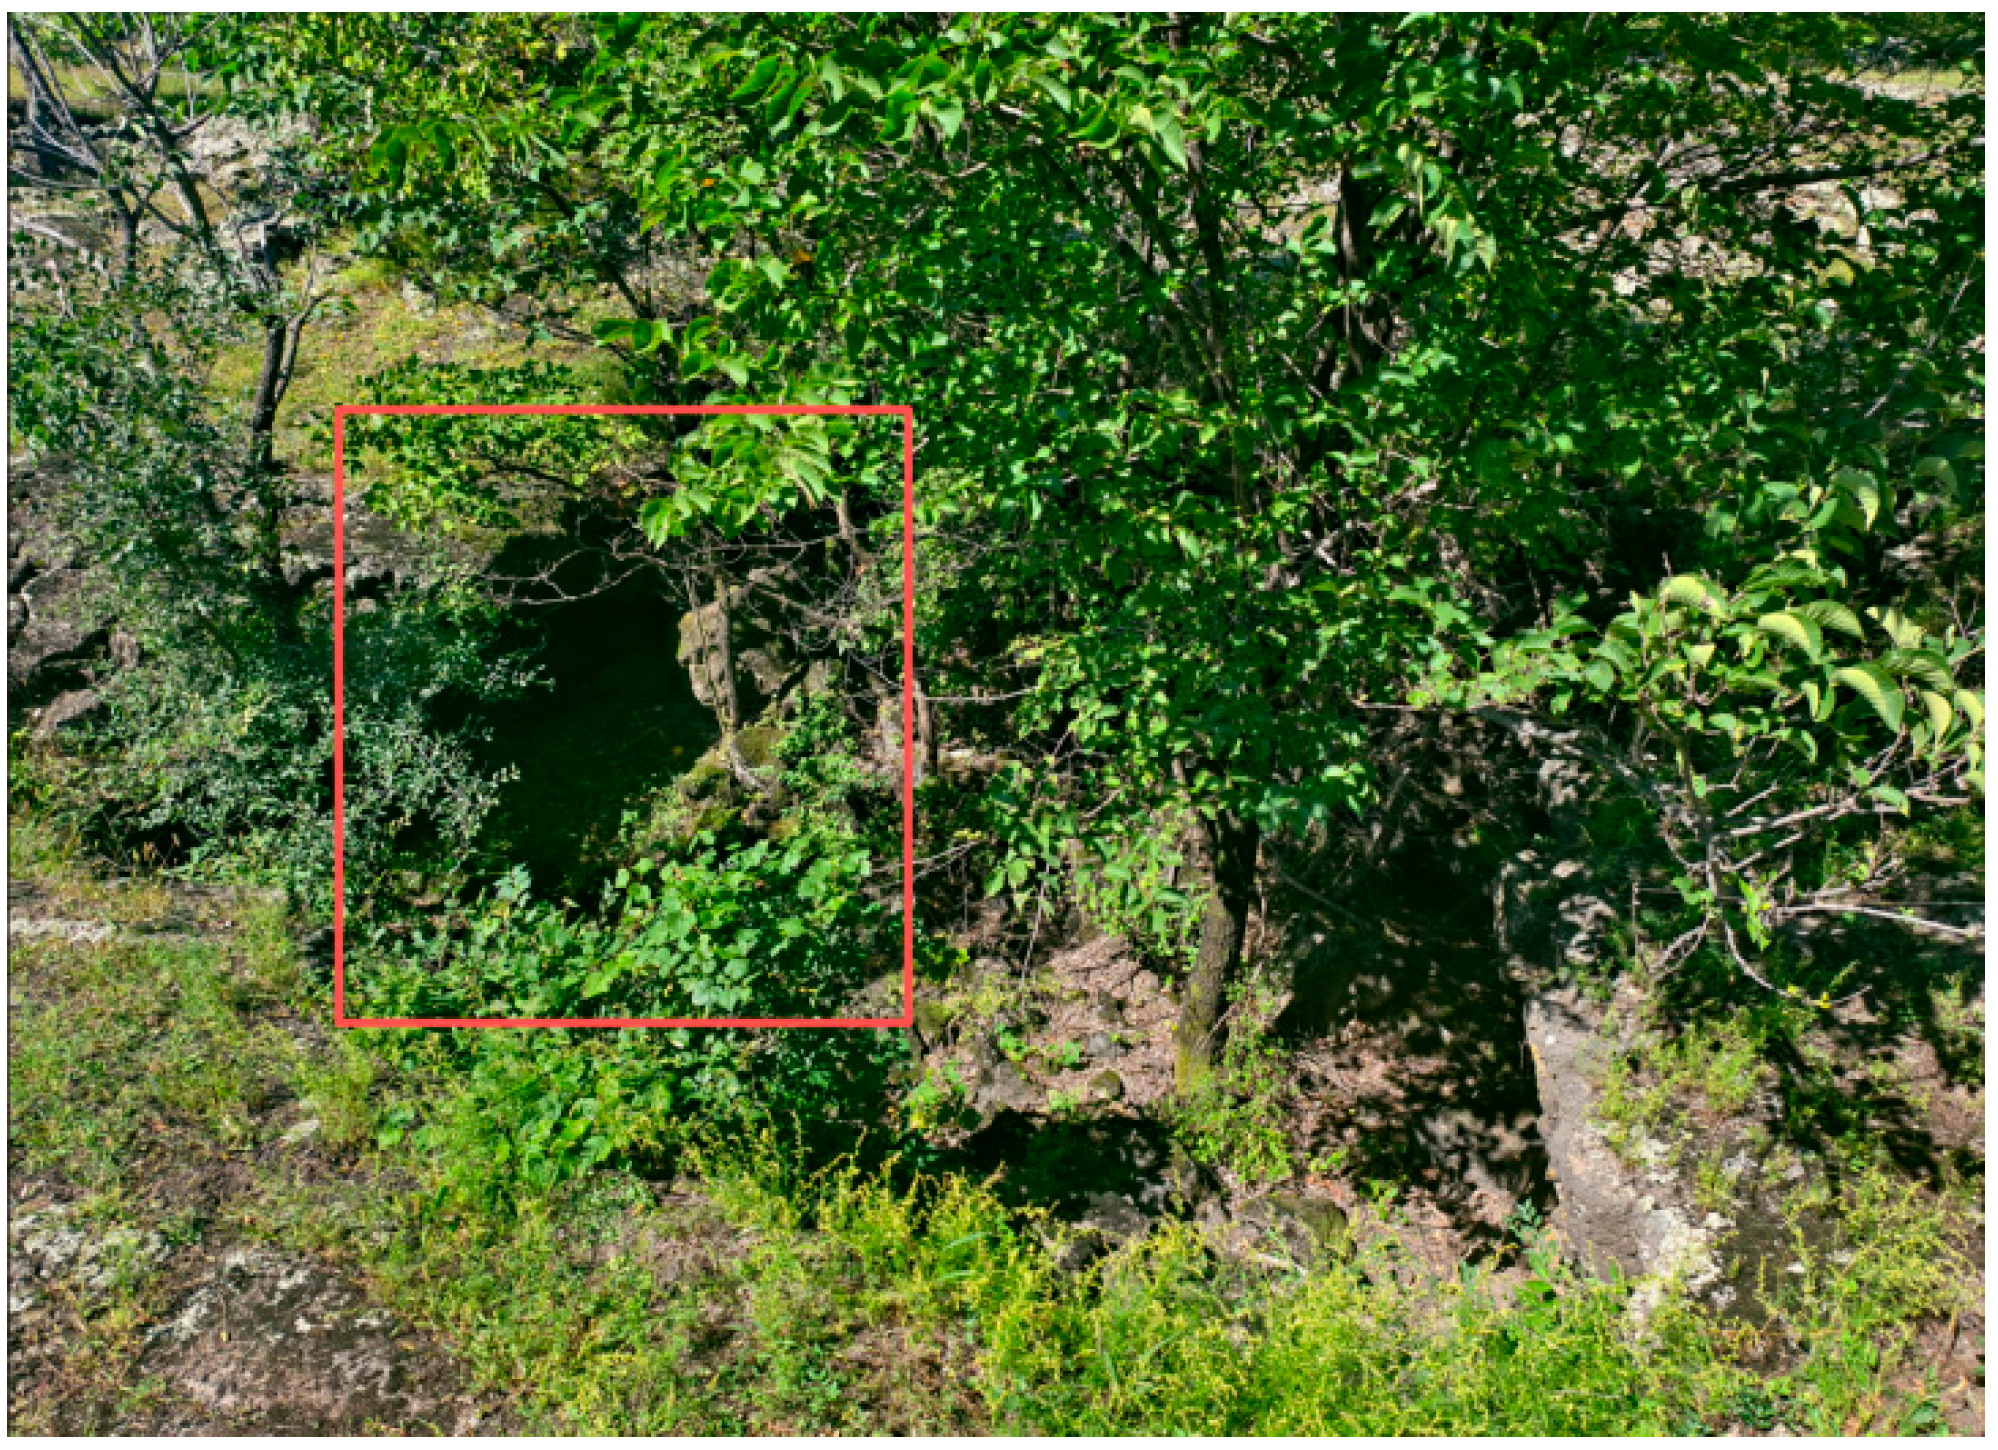
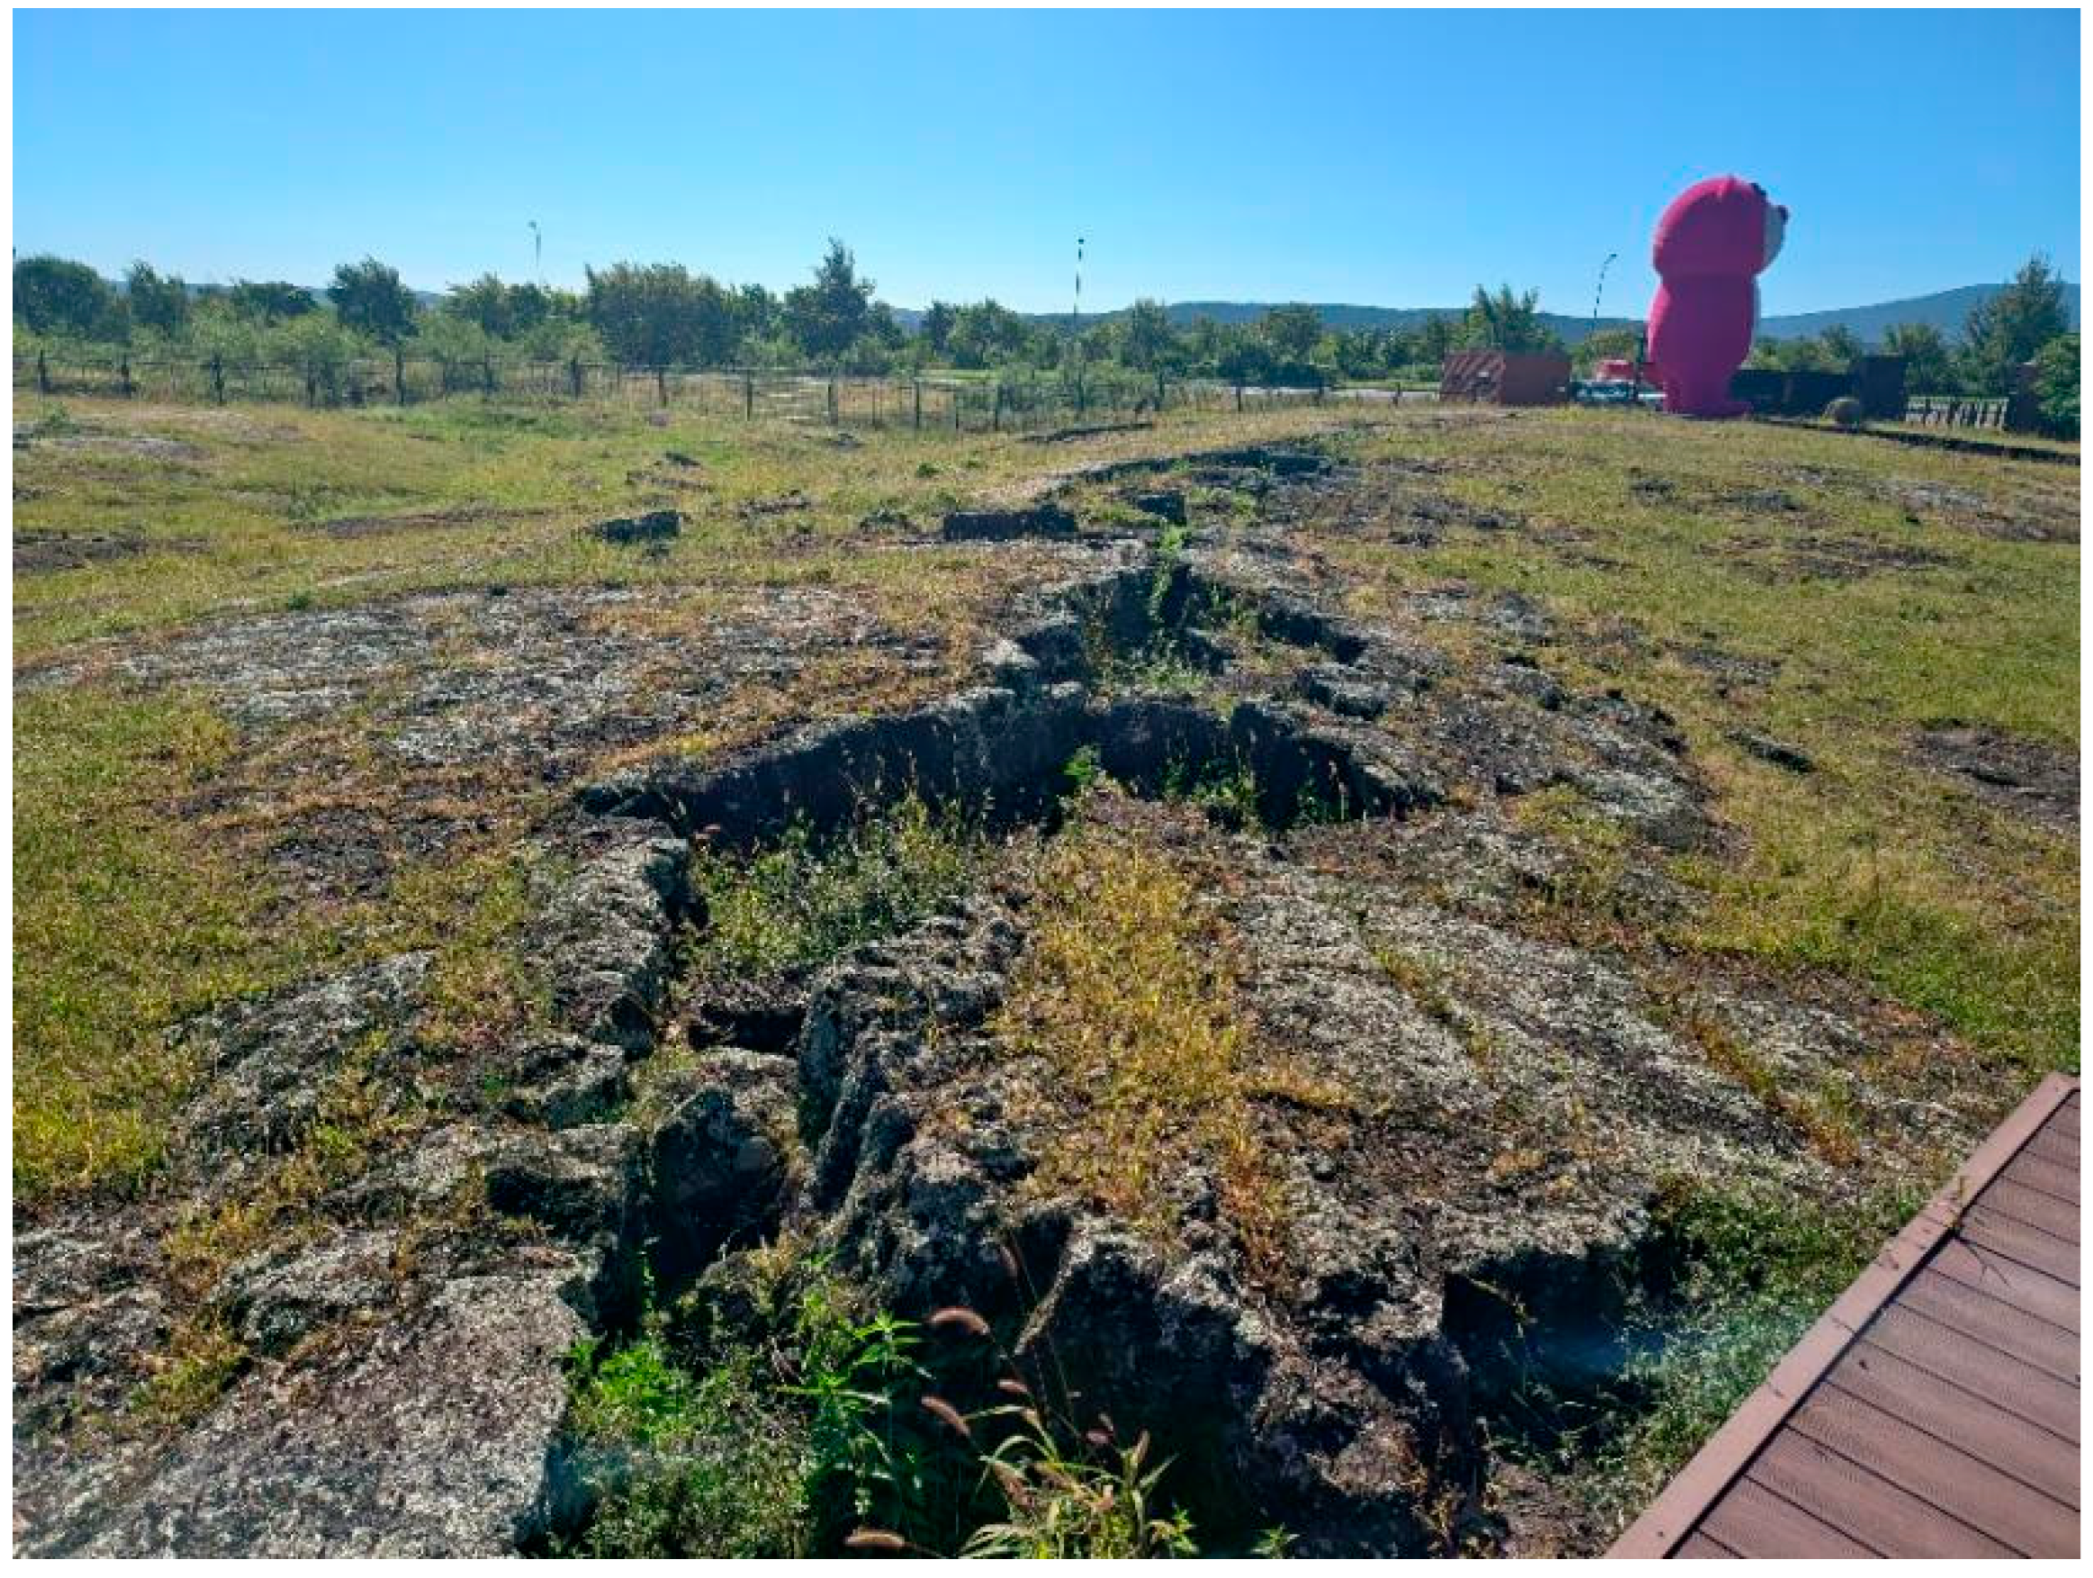
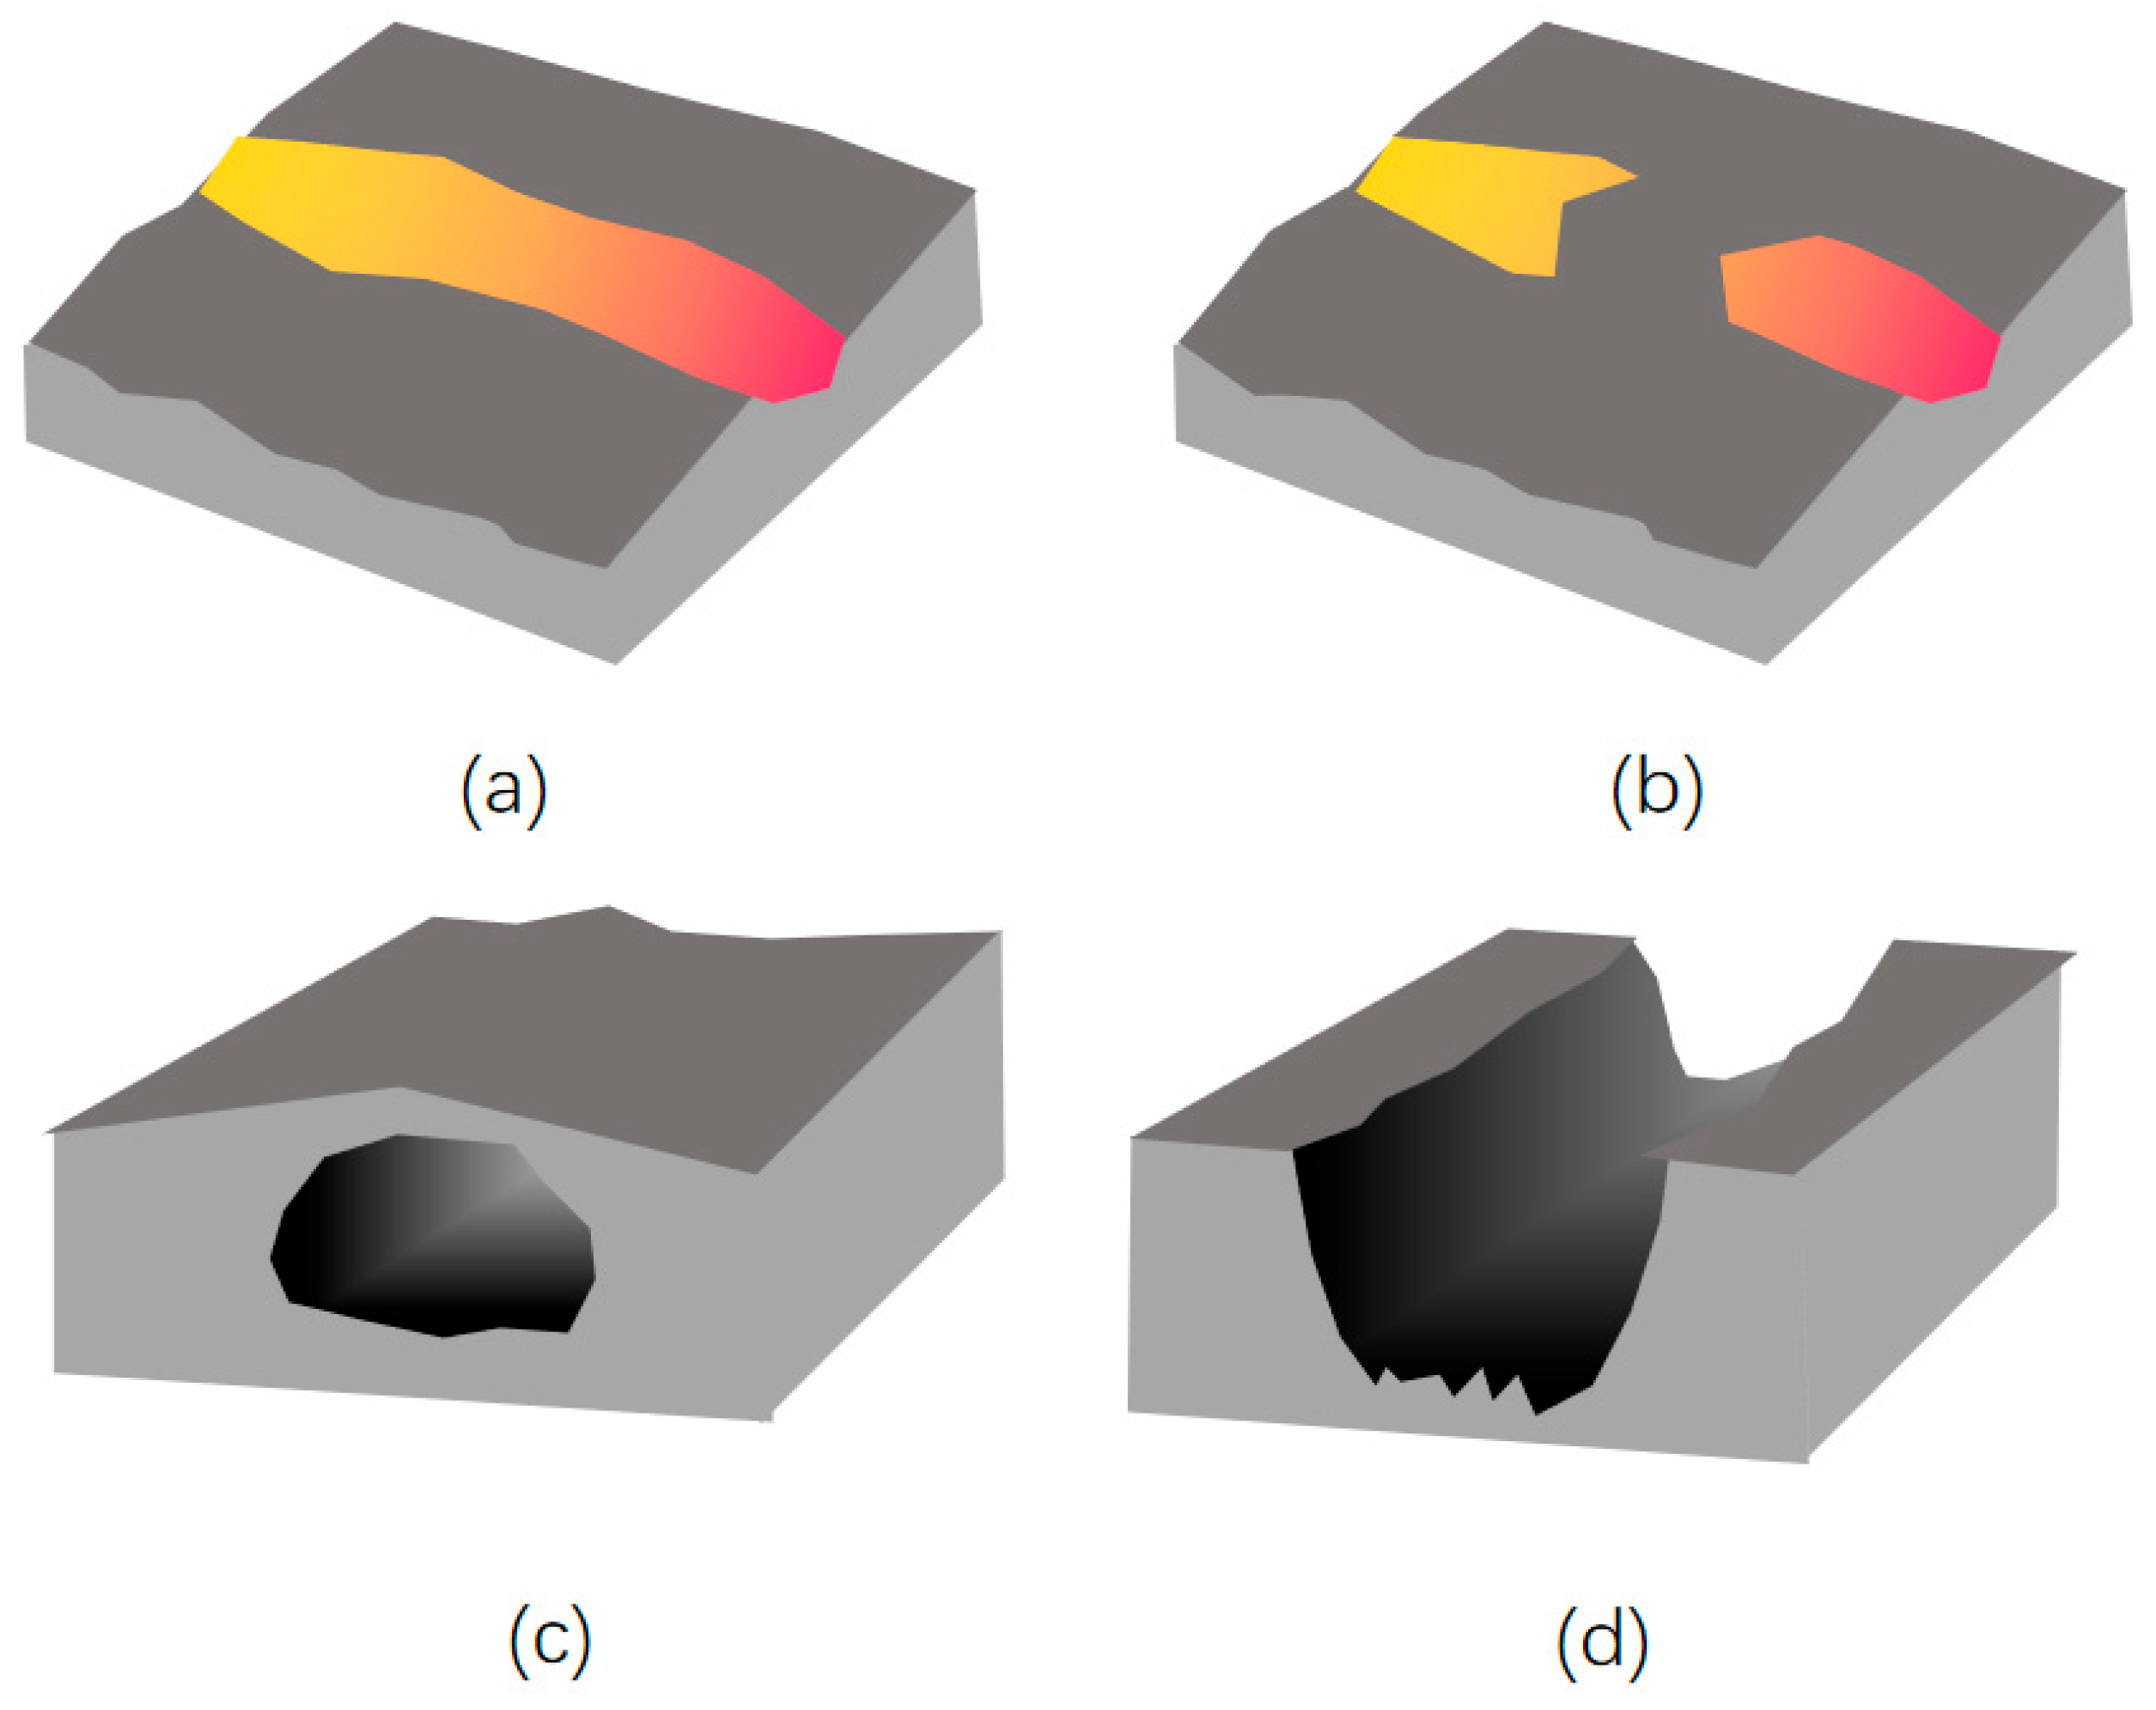
Distinct from the circular collapse skylights, the JLVF lava terraces exhibit a secondary class of structural voids identified as Inflation Fissures and Lateral Subsurface Cavities. As illustrated in our field surveys as shown in Figure 5, the basaltic plateau is frequently dissected by deep, linear fractures ranging from decimeters to meters in width [33].
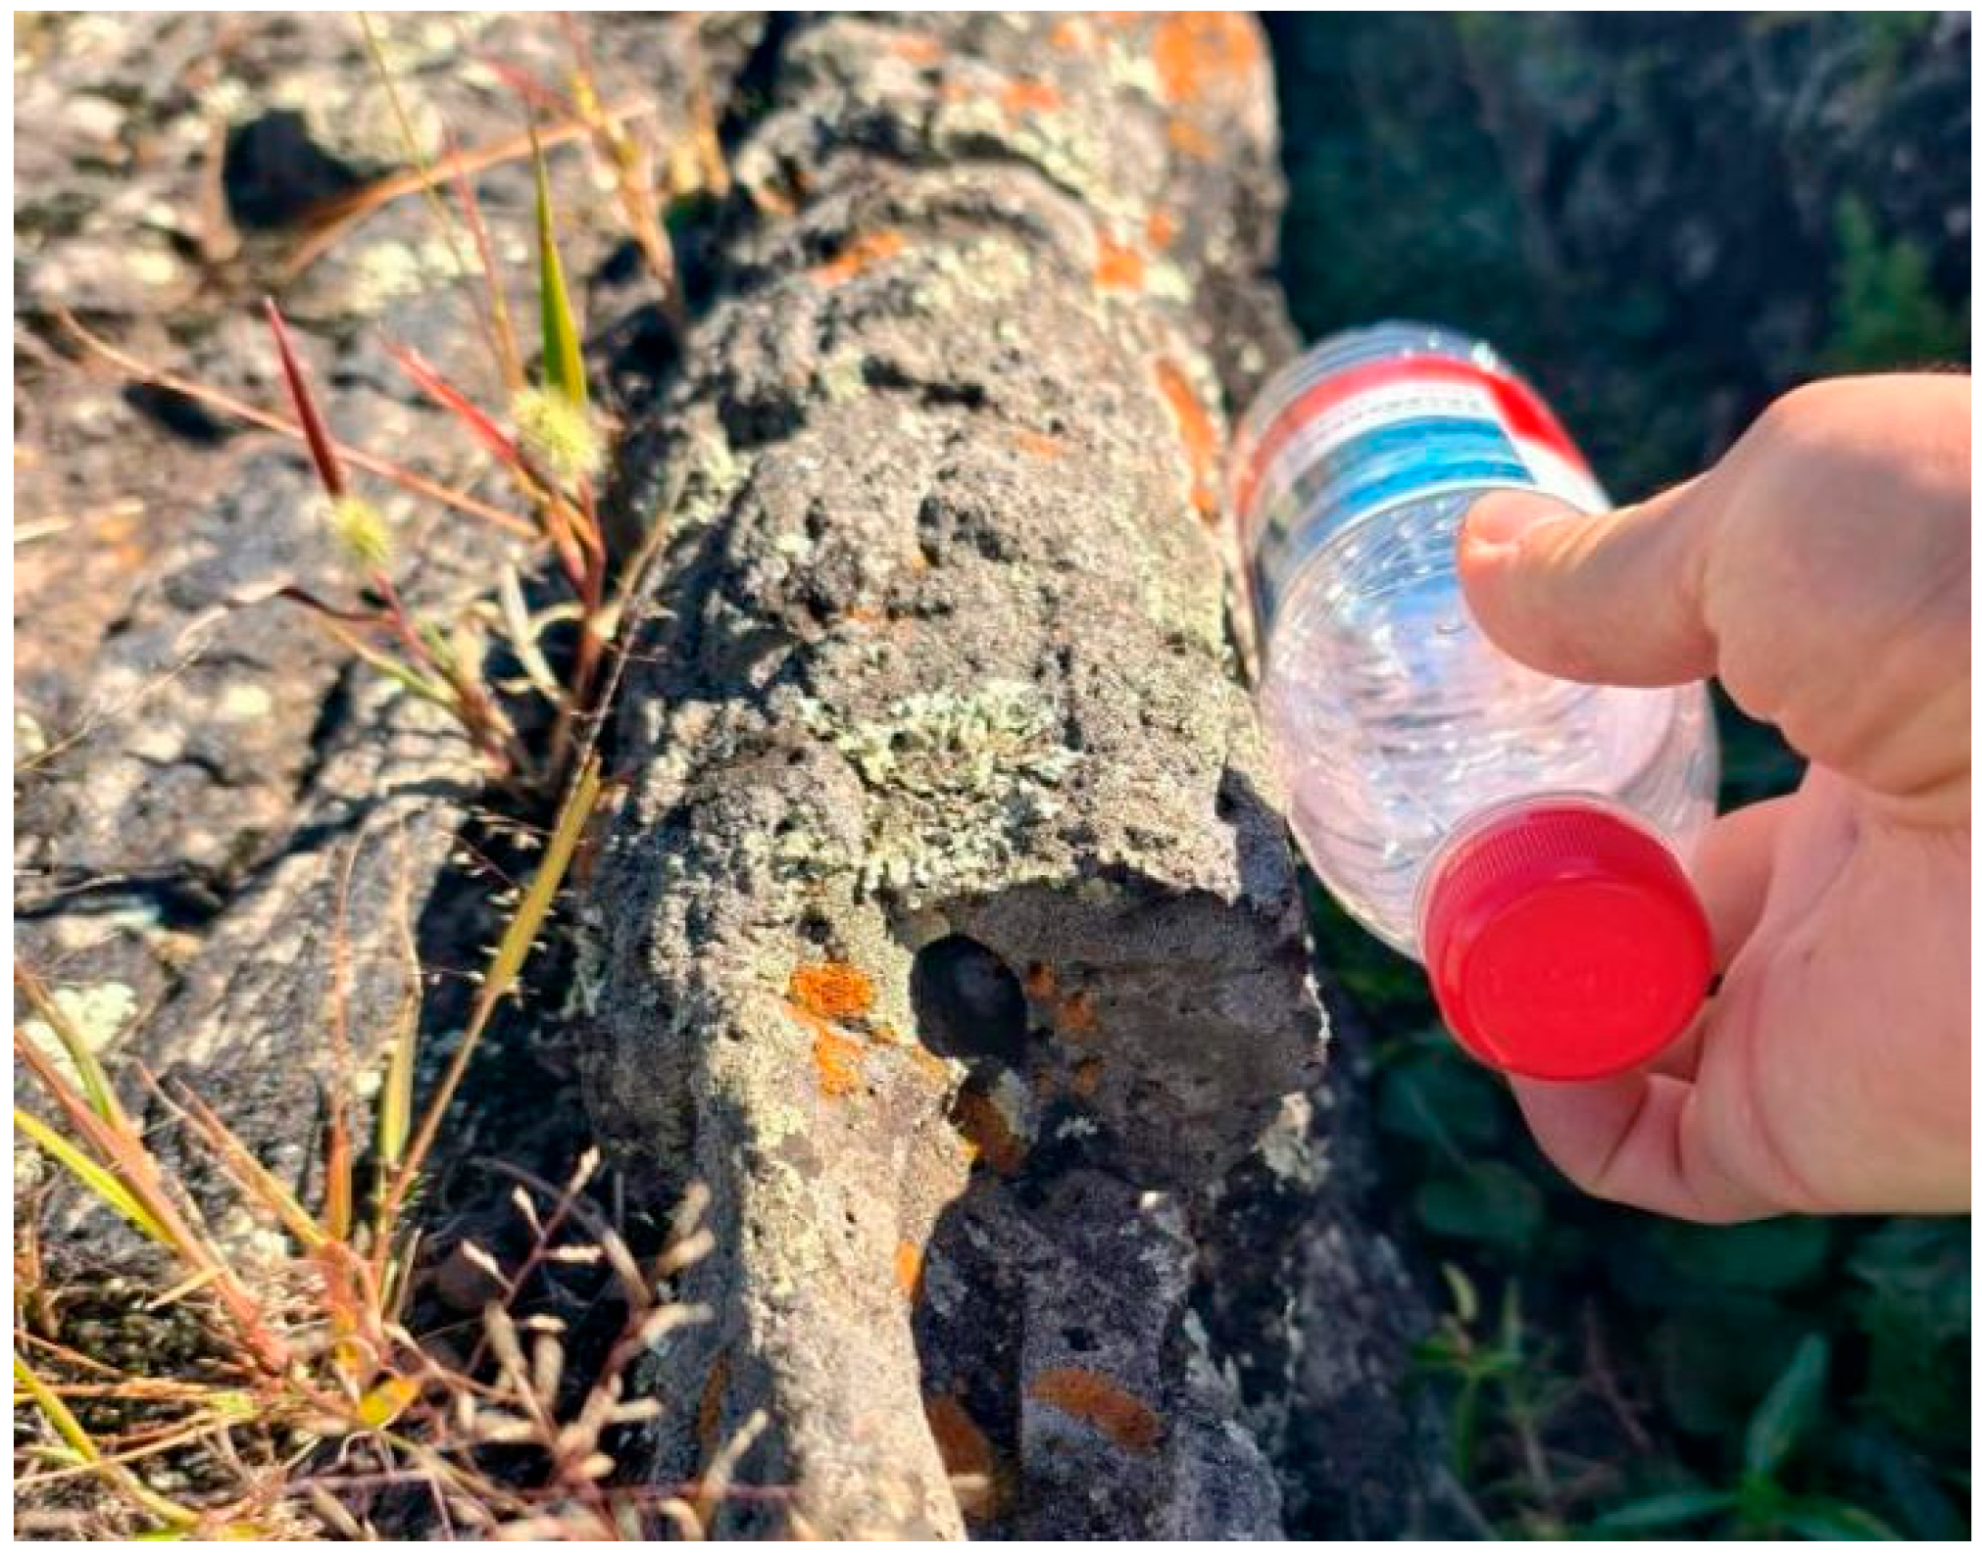
These features are the direct geomechanical result of the inflation process. As the pressurized liquid core uplifts the solidifying crust to form the plateau, the brittle surface undergoes tensile failure, creating deep axial clefts (fissures) that penetrate the upper crust. Furthermore, at the margins of these inflated lobes, or where the internal liquid core has partially drained, lateral voids are preserved beneath the solidified crustal shelf as seen in Figure 6. Unlike vertical skylights, these cavities open horizontally or obliquely, often shielded by the overhanging plateau edge.
The identification of these features at JLVF highlights a critical observational blind spot in current lunar reconnaissance. While large vertical pits (like the Marius Hills Hole) are easily resolved in nadir-viewing orbital imagery, these “cryptic cavities” are effectively invisible to top-down sensors due to their narrow apertures and the shadowing effect of the overhangs [18].
However, geologically, they represent a widespread phenomenon. On the lunar maria, the margins of inflated sheet flows and the crests of wrinkle ridges are likely riddled with similar tensile fractures and lateral voids. These fissures act as “stealth traps” for rover wheels, capable of causing entrapment in terrain that orbital data classify as “safe, flat plains.” The lateral cavities function as natural, non-collapsed entrances to the subsurface. Unlike skylights which require rappelling down vertical walls, these side-openings may offer accessible, ramp-like entry points for micro-rovers to access the shielded subsurface environment without complex winch systems.

2.3. Geological Survey of the Marius Hills Volcanic Field on the Moon

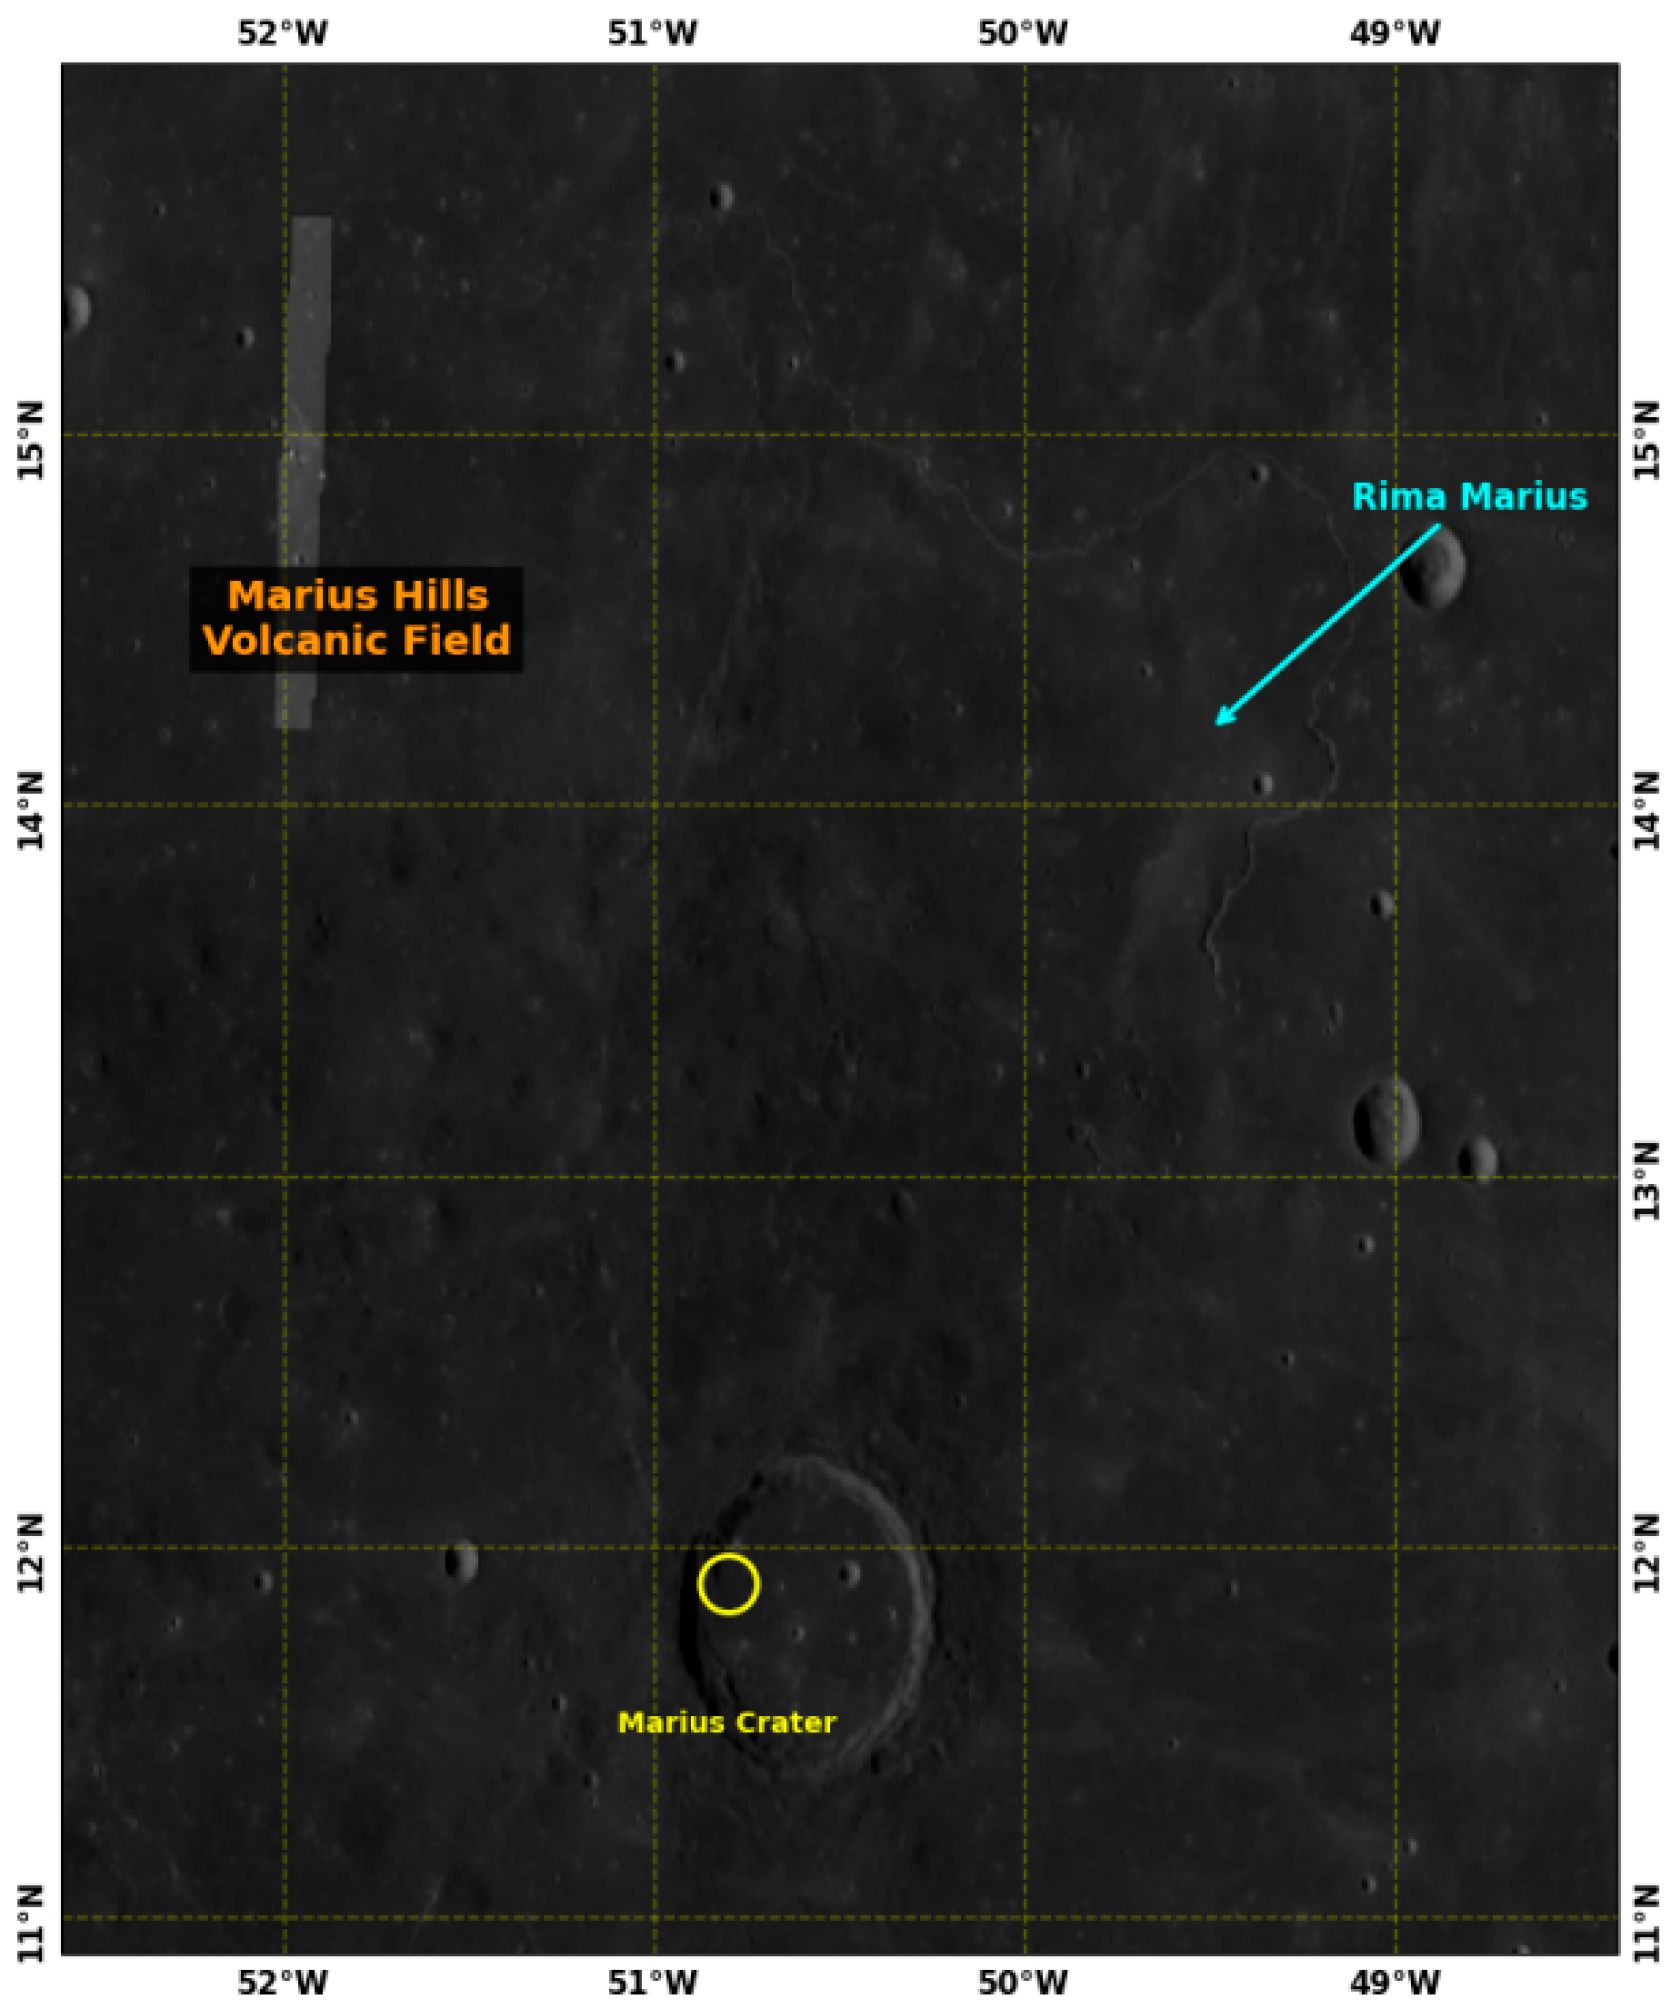
The Marius Hills Volcanic Field (MHVF), situated in the central Oceanus Procellarum (11°–15°N, 301°–310°E), was selected as the lunar reference site for this study. As one of the most prominent volcanic provinces on the Moon, the MHVF is characterized by a high concentration of volcanic features as shown in Figure 7, including over 300 steep-sided cones and volcanic domes formed during the Late Imbrian to Eratosthenian periods [37,38,39].
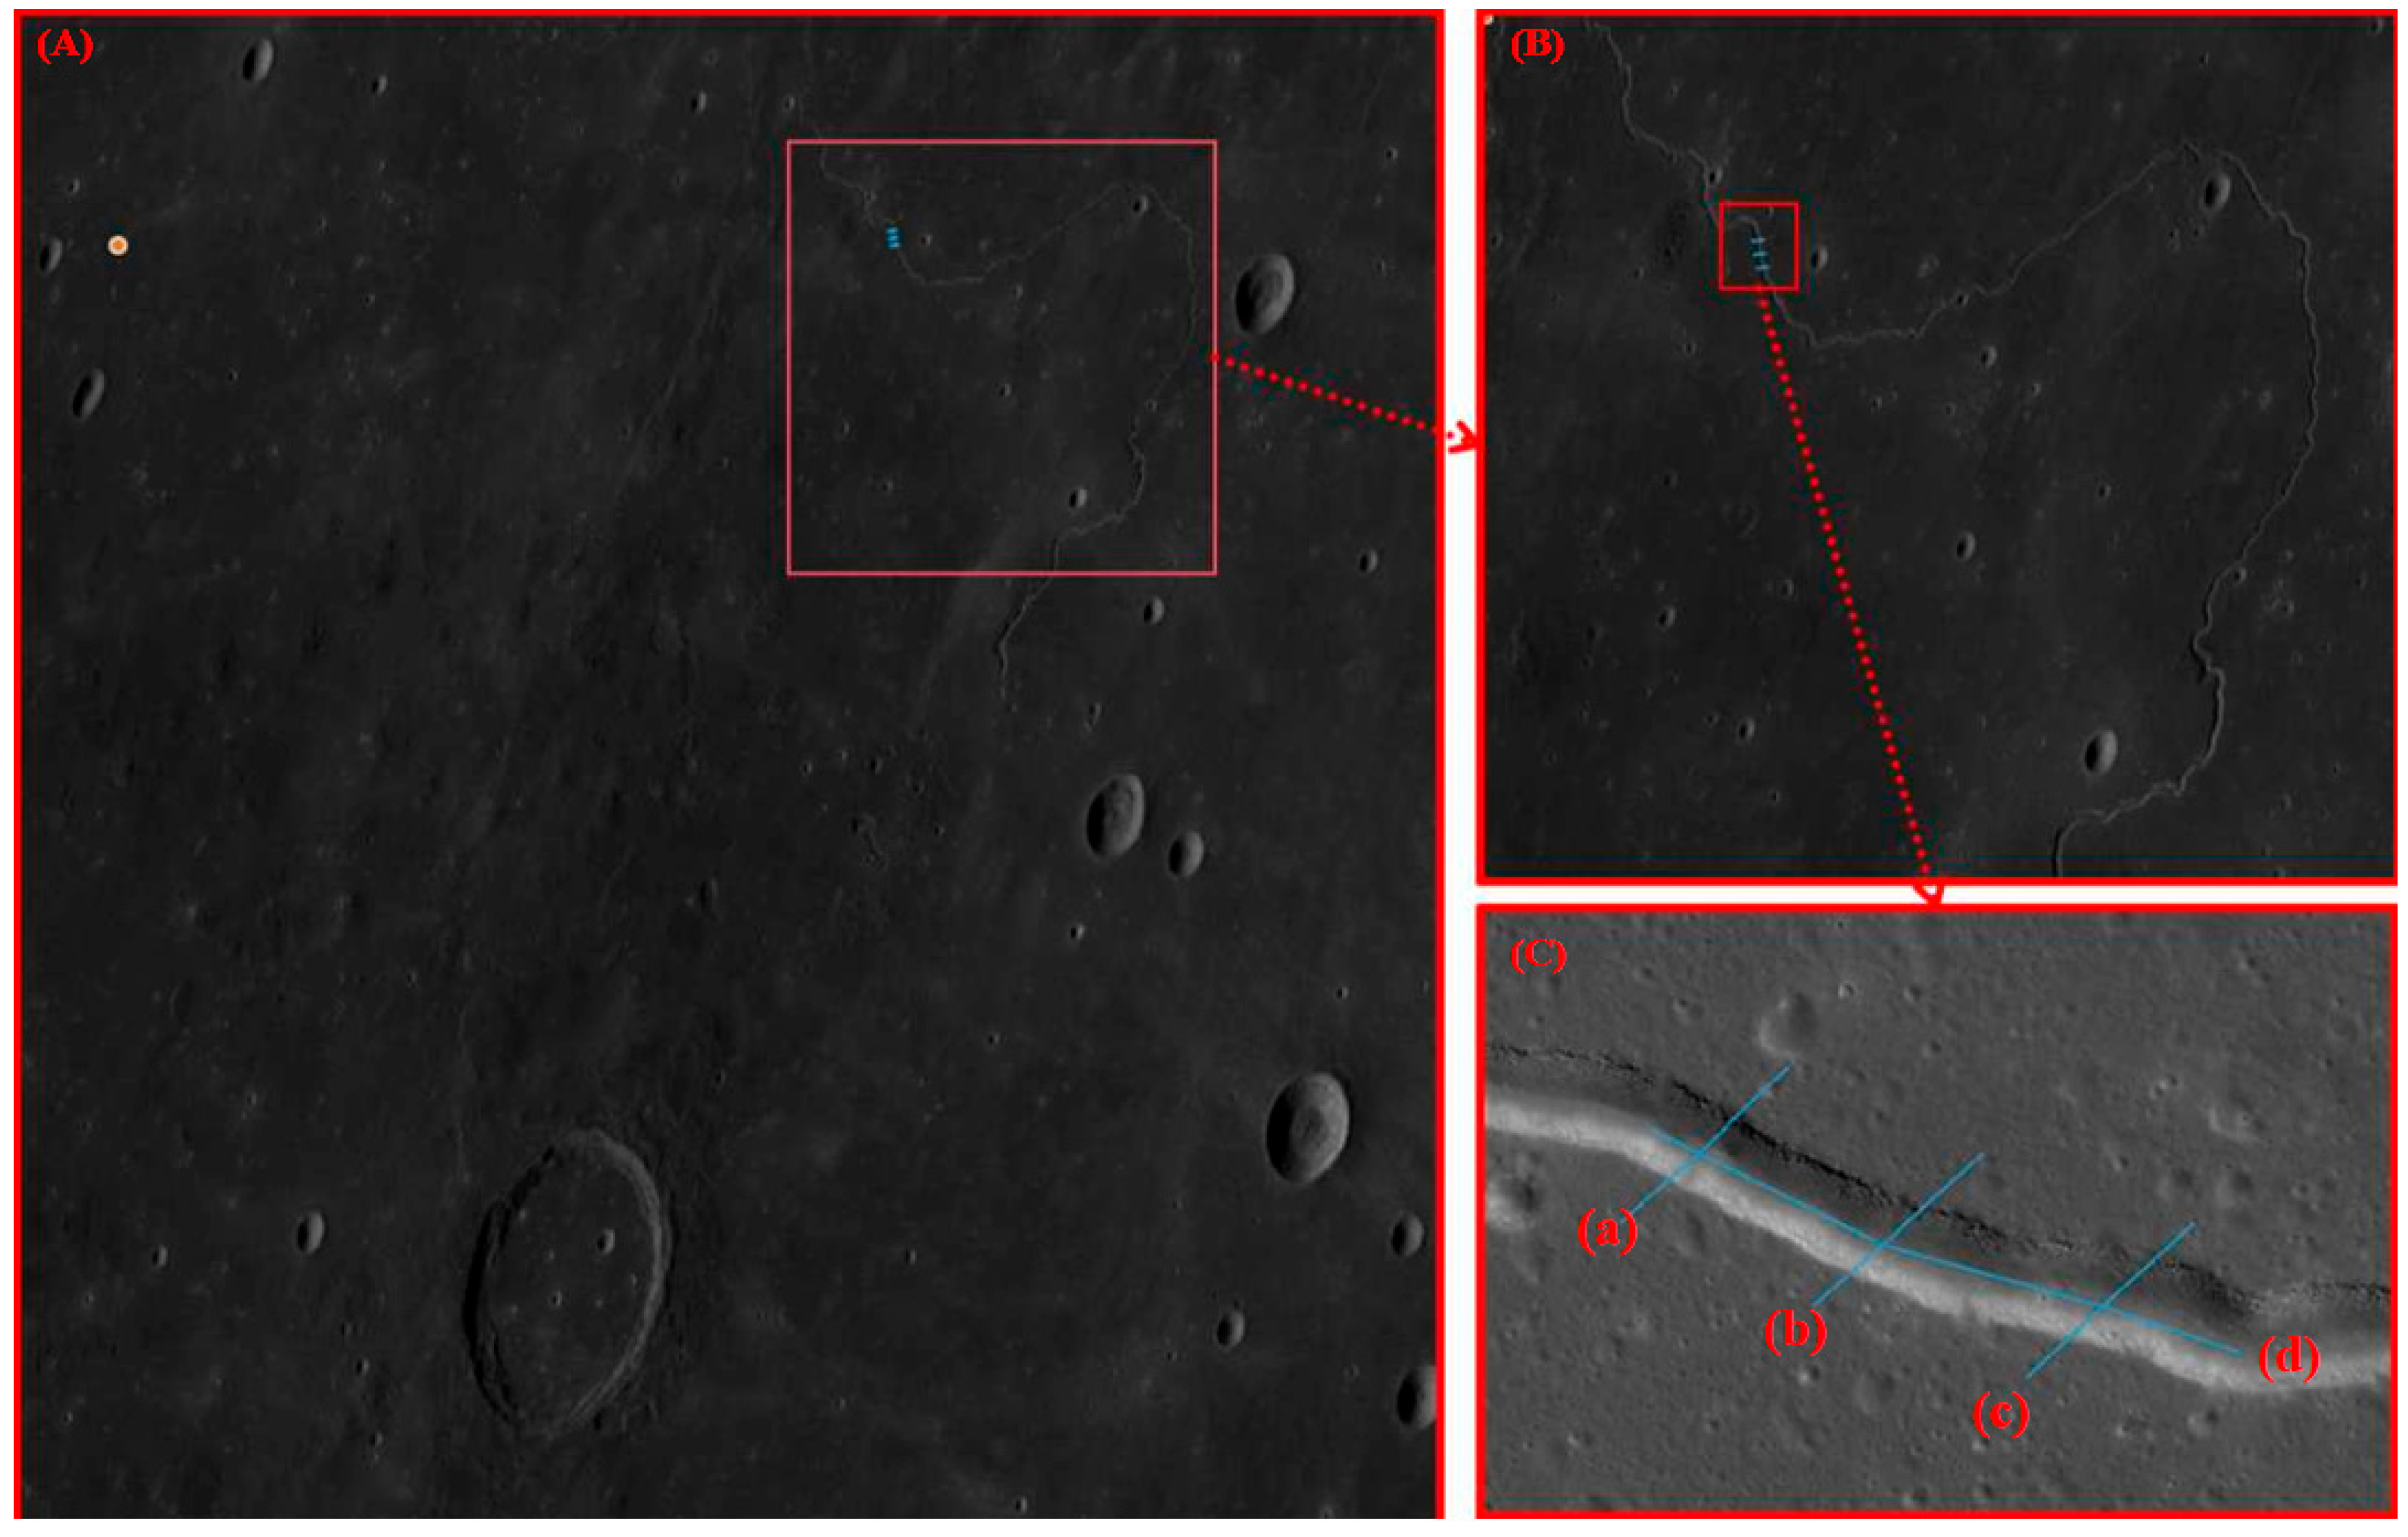
Crucially for this comparative analysis, the region hosts a complex network of sinuous rilles, most notably Rima Marius. These rilles are widely interpreted as collapsed lava tubes or open lava tubes, exhibiting meandering geometries and cross-sectional profiles that structurally resemble the terrestrial continuous collapse chains observed at JLVF. Furthermore, the region contains the Marius Hills Hole (MHH) (14.2°N, 303.3°E), a confirmed vertical skylight that provides direct evidence of subsurface voids. The coexistence of vast flat mare basalts (analogous to terrestrial lava terraces) and rille-skylight systems makes this region an ideal morphological counterpart for validating terrestrial geomorphic fingerprints of lava tube systems [40].

3. Methodology

3.1. Data Acquisition and Preprocessing

3.1.1. Data of Jingpo Lake Volcanic Field

To construct a seamless “surface-to-subsurface” 3D model of the JLVF, this study implemented a hierarchical, multi-sensor remote sensing campaign designed to bridge the resolution gap between macroscopic topographic mapping and microscopic textural analysis. The acquisition strategy integrated low-altitude airborne Light Detection and Ranging (LiDAR) for regional topography, close-range Unmanned Aerial Vehicle (UAV) photogrammetry for vertical skylight walls, and handheld Simultaneous Localization and Mapping (SLAM) LiDAR for Global Positioning System(GPS)-denied subsurface environments.
For the broad-scale characterization of the lava terraces and the continuous collapse chain corridor, we utilized a DJI M300 Pro UAV platform equipped with the Zenmuse L1 LiDAR sensor to generate a high-precision Digital Elevation Model (DEM). Flight missions were executed at an altitude of 100 m with a stable flight speed of 8 m/s, ensuring sufficient point density to resolve decimeter-scale lava flow features. Crucially, to mitigate the occlusion caused by the dense vegetation cover typical of the JLVF, the L1 sensor was configured to operate in triple-echo mode with a pulse repetition rate of 240,000 points/s (effective rate up to 480,000 points/s in multi-echo mode). This multi-return capability allowed for the effective separation of ground points from canopy returns, achieving a system vertical accuracy of 5 cm and a horizontal accuracy of 10 cm (at 50 m flight height), thereby generating a bare-earth model that reveals subtle lava flow boundaries and inflation tumuli.
While airborne LiDAR provides excellent vertical coverage, it often lacks the oblique viewing angle required to capture the steep, vertical sidewalls of deep skylights. To address this limitation, a DJI Phantom 4 RTK (P4R) drone was employed for supplementary close-range photogrammetry. Equipped with a 1-inch, 20-megapixel CMOS sensor and a wide-angle lens (24 mm equivalent), the P4R executed specialized manual flight paths descending into the larger skylights where safety permitted. The terrain in this area is complex and the vegetation is dense, making automatic flight impossible. Manual flight can improve the accuracy and density of point cloud acquisition in different locations based on different geological types and landform features. It not only allows for adjustment of point cloud density according to individual needs, but also enables safer and more stable data collection. This allowed for the capture of high-resolution oblique imagery (GSD < 5 mm) of the steep basaltic cliffs and the stratigraphy of the collapse zones—areas typically occluded in nadir LiDAR scans. The precise RTK positioning of the P4R ensured that these photogrammetric point clouds could be rigidly aligned with the L1 LiDAR data, filling critical data gaps in the transition zone between surface and subsurface.
For the GPS-denied interior of the lava tubes, where traditional GNSS positioning is unavailable due to the shielding effect of the basaltic roof, we utilized the GeoSLAM ZEB-HORIZON handheld mobile LiDAR system. This device employs a 3D Simultaneous Localization and Mapping (SLAM) algorithm to construct the environment map while estimating the scanner’s trajectory in real-time. The ZEB-HORIZON features a maximum range of 100 m and a data capture rate of 300,000 points/s, with a relative accuracy of 1.5–3 cm. Its extensive field of view (270° × 360°) allows it to capture the complex “mushroom-shaped” cross-sections and large subterranean voids of the Jingpo tubes without missing ceiling details. The data acquisition followed a rigorous “closed-loop” protocol, where the operator initiated the scan at a surface control point, descended through the skylight, traversed the full length of the accessible tunnel, and returned to the start point to minimize inertial drift and ensure trajectory consistency. To minimize the cumulative drift inherent in SLAM algorithms over long durations, we implemented a hierarchical ‘nested loop’ trajectory strategy. The operator executed small, local closure loops within individual tunnel chambers to constrain local geometry, which were then integrated into a larger, global return-to-start loop. This ‘small loop nested in a large loop’ approach ensures that trajectory errors are corrected at multiple spatial scales, significantly improving the internal consistency of the tubular point cloud.
To enable the seamless fusion of these distinct datasets into a unified coordinate framework, a precise co-registration strategy was implemented. Reflective spherical targets were established as Ground Control Points (GCPs) at the skylight entrances, visible to all three sensors (L1 LiDAR, P4R Camera, and ZEB-HORIZON). In the post-processing stage, the airborne LiDAR point cloud served as the absolute spatial reference frame due to its high georeferencing accuracy. The photogrammetric point clouds of the skylight walls were first registered to this frame to fill the geometric voids in steep areas, followed by the transformation of the subsurface SLAM data into the same global coordinate system. The Iterative Closest Point (ICP) algorithm was utilized to fine-tune the alignment between overlapping point cloud segments, resulting in a unified “Surface-to-Subsurface” 3D model with sub-decimeter accuracy. This integrated model enables continuous morphometric analysis from the surface pahoehoe flows down to the tube floor, providing a verified dataset for determining roof thickness and validating collapse mechanisms.
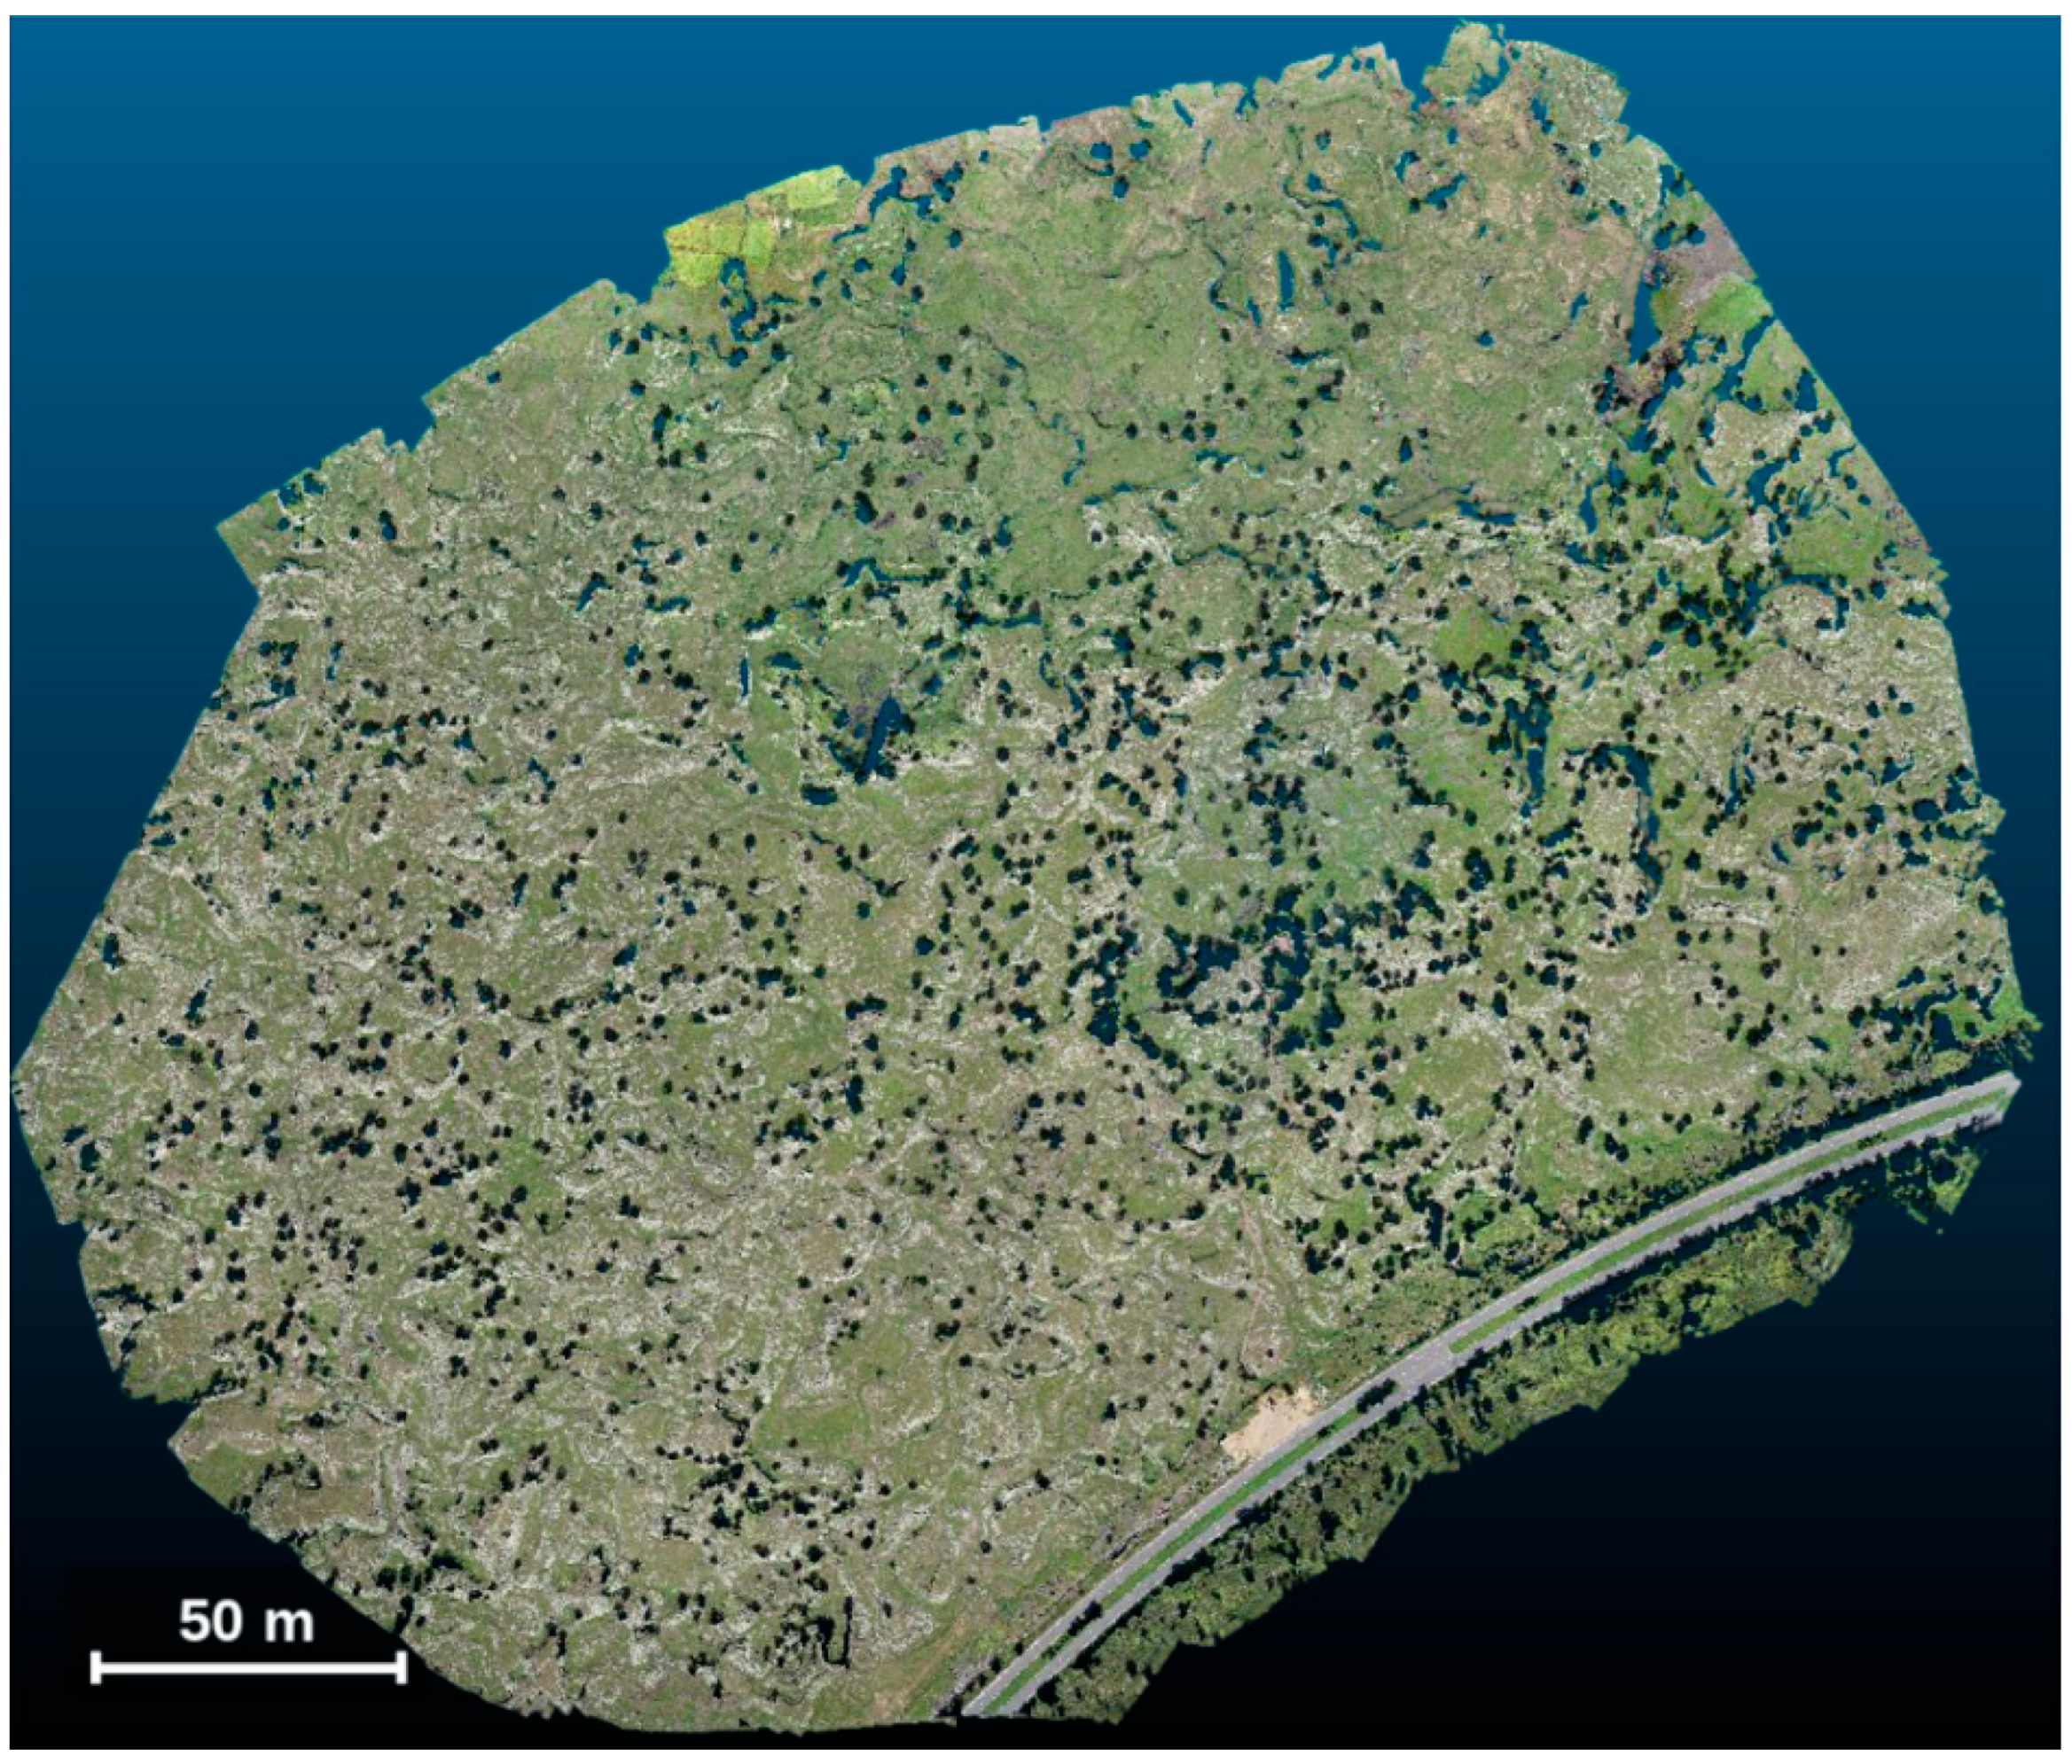
To effectively strip the dense vegetation cover and generate a bare-earth Digital Elevation Model (DEM), we employed the Cloth Simulation Filter (CSF) algorithm [41] as shown in Figure 8. This method physically simulates a rigid cloth draping over the inverted point cloud; by analyzing the interaction between the ‘cloth’ nodes and the terrain points, the algorithm classifies ground points based on a stiffness parameter, effectively filtering out canopy returns while preserving the micro-topography of the lava flows.

3.1.2. Data of the Marius Hill Volcanic Field on the Moon

To establish a comparative baseline for lunar volcanic geomorphology, the Marius Hill Volcanic Field (14°N, 304°E) was selected as the lunar reference site due to its high concentration of volcanic domes, sinuous rilles, and the presence of a potential skylight (Marius Hills Hole).
High-resolution topographic data were acquired from the Lunar Reconnaissance Orbiter Camera (LROC) archive. Specifically, we utilized the Narrow Angle Camera (NAC) Digital Terrain Model (DTM), which is derived from geometric stereo pairs and provides a spatial resolution of 2 to 5 m/pixel. This resolution represents the highest quality orbital topography currently available for characterizing meter-scale lunar surface roughness and rille morphology.
The raw DTM data were obtained in the lunar geographic coordinate system (GCS Moon 2000). To enable quantitative morphometric analysis in metric units (e.g., slope in degrees and roughness in meters), a coordinate transformation was performed using QGIS (Version 3.44) software. The DTM was reprojected to the Moon 2000 Equidistant Cylindrical projection (based on a spherical moon radius of 1737.4 km). This projection minimizes metric distortion in the equatorial and mid-latitude regions, ensuring the accuracy of subsequent slope and RMS height calculations.

3.2. Morphometric Analysis

To systematically evaluate the analog fidelity of JLVF across different spatial scales, we employed a hierarchical morphometric analysis framework ranging from regional surface texture to discrete volcanic structures.

3.2.1. Regional Surface Characterization: Lava Terraces and Mare Plains

To quantitatively validate the morphological similarity between the terrestrial lava terraces (JLVF) and the lunar mare plains (MHVF), we established a unified morphometric analysis workflow. Identical processing algorithms were applied to both the resampled JLVF DTM (2 m/px) and the lunar Marius Hills DTM (2 m/px) using the GDAL library within the QGIS environment. This parallel processing approach eliminates algorithmic bias, ensuring that the derived morphometric indices—Slope, Roughness, and Trafficability—are physically comparable across the two planetary bodies.
First, the local Slope Gradient ( β ), representing the steepness of the terrain surface, was derived using Horn’s algorithm [42]. This method estimates the surface gradient based on the weighted partial derivatives of elevation in the West–East ( z x ) and South–North ( z y ) directions within a 3 × 3 moving window. The rates of change are estimated as:
z x ( Z 3 + 2 Z 6 + Z 9 ) ( Z 1 + 2 Z 4 + Z 7 ) 8 x
z x ( Z 7 + 2 Z 8 + Z 9 ) ( Z 1 + 2 Z 2 + Z 3 ) 8 y
where x and y represent the cell resolution, and Z 1 through Z 9 denote the elevation values of the kernel cells. The final slope value β (in degrees) is determined by:
β = a r c t a n   ( ( z x ) 2 + ( z y ) 2 ) × 180 π
Second, Surface Roughness was quantified as the Root Mean Square (RMS) Height ( ξ ) to characterize vertical surface deviations at the baseline scale of the DTM resolution. RMS height serves as a proxy for identifying micro-topographic obstacles [43,44] (e.g., pahoehoe ropes or small impact craters) that influence wheel-terrain interaction. We applied a 3 × 3 pixel sliding window to calculate the standard deviation of elevation within the kernel:
ξ = 1 n 1 i = 1 n ( Z i Z ¯ ) 2
where n is the total number of pixels in the sampling window (n = 9), Z i is the elevation of the i-th pixel, and Z ¯ is the local mean elevation. This metric highlights textural complexity that may not be apparent in simple gradient maps.

3.2.2. Structural Geometry Extraction: Continuous Collapses and Sinuous Rilles

To quantitatively test the morphological affinity between the terrestrial continuous collapse chains (JLVF) and lunar sinuous rilles (Marius Hills), a systematic cross-sectional profiling analysis was conducted. Given the high-resolution nature of the terrestrial LiDAR data, this approach focuses on extracting the geometric architecture from the 3D point clouds and comparing it with the lunar orbital profiles to distinguish between erosional incision and tube-roof collapse mechanisms.
The geometric extraction protocol commenced with the delineation of flow axis centerlines for both the JLVF collapse trenches and the lunar Rima Marius. Orthogonal transects were generated perpendicular to the centerlines at equidistant intervals relative to the mean tube width. For the JLVF dataset, topographic profiles were derived by slicing the dense LiDAR point clouds along the transects, capturing the detailed distributions of wall structures and floor debris (talus). For the lunar dataset, corresponding profiles were extracted from the LROC NAC DTM.
To characterize the tube architecture, we first calculated the Width-to-Depth Ratio ( R W D ), a robust dimensionless index indicating structural stability. It is defined as the ratio of the Top Width ( W t o p ), measured between the opposing rim crests, to the Maximum Depth ( D m a x ), measured from the mean rim elevation to the lowest point of the trough floor:
R W D = W t o p D m a x
Lower R W D values typically indicate deep, narrow vertical collapses, while higher values suggest widening due to post-collapse wall slumping.
Crucially, to overcome the scale disparity between terrestrial (meters) and lunar (kilometers) features and to enable a direct morphological classification, a Spatial Normalization Procedure was applied. This method transforms the absolute coordinates of the raw profiles into a dimensionless shape signature. The normalized coordinates ( x , z ) for each profile point were computed as:
x = x x c e n t e r W t o p 2 ,   z = z z m i n D m a x
This transformation maps the horizontal span to a standardized range of [−1, 1] and the vertical depth to [0, 1]. By overlaying these normalized profiles, we analyzed the overall geometric trend to distinguish between two distinct morphological types: (1) V-shaped profiles, characterized by a sharp convergence towards the bottom, typically associated with fluid erosion or active incision; and (2) U-shaped (Box-shaped) profiles, characterized by steep walls and a broad, distinct floor zone, which is the diagnostic signature of lava tube roof collapse and subsequent talus accumulation. This morphological matching approach avoids the bias introduced by surface roughness in the raw point cloud data, focusing instead on the dominant structural mechanism.

3.2.3. Discrete Feature Analysis: Skylights and Pits

The final level of morphometric analysis focuses on the discrete entry points into the subsurface voids. Given the limitations in vertical resolution and shadow obscuration inherent in the lunar orbital DTMs, which constrain accurate depth retrieval for deep pits like the Marius Hills Hole (MHH), our comparative framework is strictly confined to the planimetric geometry of these features.
To quantify the morphological characteristics, we delineated the rim boundaries of the intact skylights in the JLVF dataset and the identified pit craters in the Marius Hills region based on high-contrast edge detection. For each feature, three fundamental geometric indices were derived to characterize its size and shape complexity.
First, the Mean Diameter ( D m e a n ) was calculated to represent the fundamental scale of the aperture. It is defined as the arithmetic mean of the major axis (a) and minor axis (b) of the best-fit ellipse enclosing the pit rim:
D m e a n = a + b 2
This metric allows for a direct magnitude comparison between terrestrial skylights and lunar pits to assess whether they fall within a geologically comparable scale range.
Second, to characterize the elongation of the opening, we calculated the Ellipticity Index (E). This dimensionless ratio indicates whether the collapse was structural and localized (tending towards circular) or controlled by linear tectonic fissures:
E = 1 a b
where a is the semi-major axis and b is the semi-minor axis. An E value close to 0 implies a perfect circle, whereas values approaching 1 indicate a highly elongated, trench-like feature.
To quantify the regularity of the rim boundary, the Circularity Index (C) was derived. Unlike ellipticity, which describes the overall shape, circularity is sensitive to the roughness or irregularity of the rim edges (e.g., jagged collapse margins):
C = 4 π · A P 2
where A is the planimetric area of the opening and P is the perimeter. A value of C approaching 1 indicates a smooth, circular collapse characteristic of a mature, stable skylight (such as the MHH), whereas lower values indicate irregular widening or the coalescence of adjacent pits. By comparing these three indices ( D m e a n , E   a n d   C ), we can statistically validate whether the JLVF skylights share the same geometric fingerprint as their lunar counterparts.

3.2.4. Fractal Roughness Characterization

To rigorously bridge the resolution gap that currently severs orbital macro-geodesy from ground-truth reality, we developed a composite dual-band fractal analysis framework designed to quantify surface roughness across complementary spatial domains. Instead of relying on a single dataset, we synthesized longitudinal thalweg profiles extracted from disparate gravitational environments to construct a unified spectral continuum. The mathematical basis for this characterization relies on the Power Spectral Density (PSD) function S ( f ) , which describes how the variance of surface elevation is distributed as a function of spatial frequency f . We modeled the surface roughness as a self-affine fractal process governed by the power-law relation:
S ( f ) = C · f β
where C is a proportionality constant related to the overall roughness amplitude and β is the spectral exponent diagnostic of the dominant geological shaping mechanism. For the macroscopic domain, we utilized the LROC NAC Digital Terrain Models to analyze the low-frequency spectral band corresponding to wavelengths between 10 and 100 m, a scale that characterizes the fundamental structural integrity of the rille floor and the periodicity of massive roof failures. Complementing this orbital perspective, the microscopic domain was resolved using high-density terrestrial LiDAR models from the Jingpo Lake collapse chain, targeting the high-frequency band associated with wavelengths of 0.2 to 5 m. This specific frequency range captures the fine-scale textural signature of basaltic rubble, fissures, and ropy lava flow crusts that remain physically invisible to current lunar orbiters. By fitting the power-law equation to the spectral energy distribution of both domains, we derived the diagnostic spectral exponent β to test the hypothesis of fractal continuity, determining whether the stochastic mechanics governing kilometer-scale lunar collapses scale down self-similarly to the meter-scale debris fields observed on Earth [45].

4. Results

4.1. Comparative Analysis of Surface Roughness and Slope Distributions

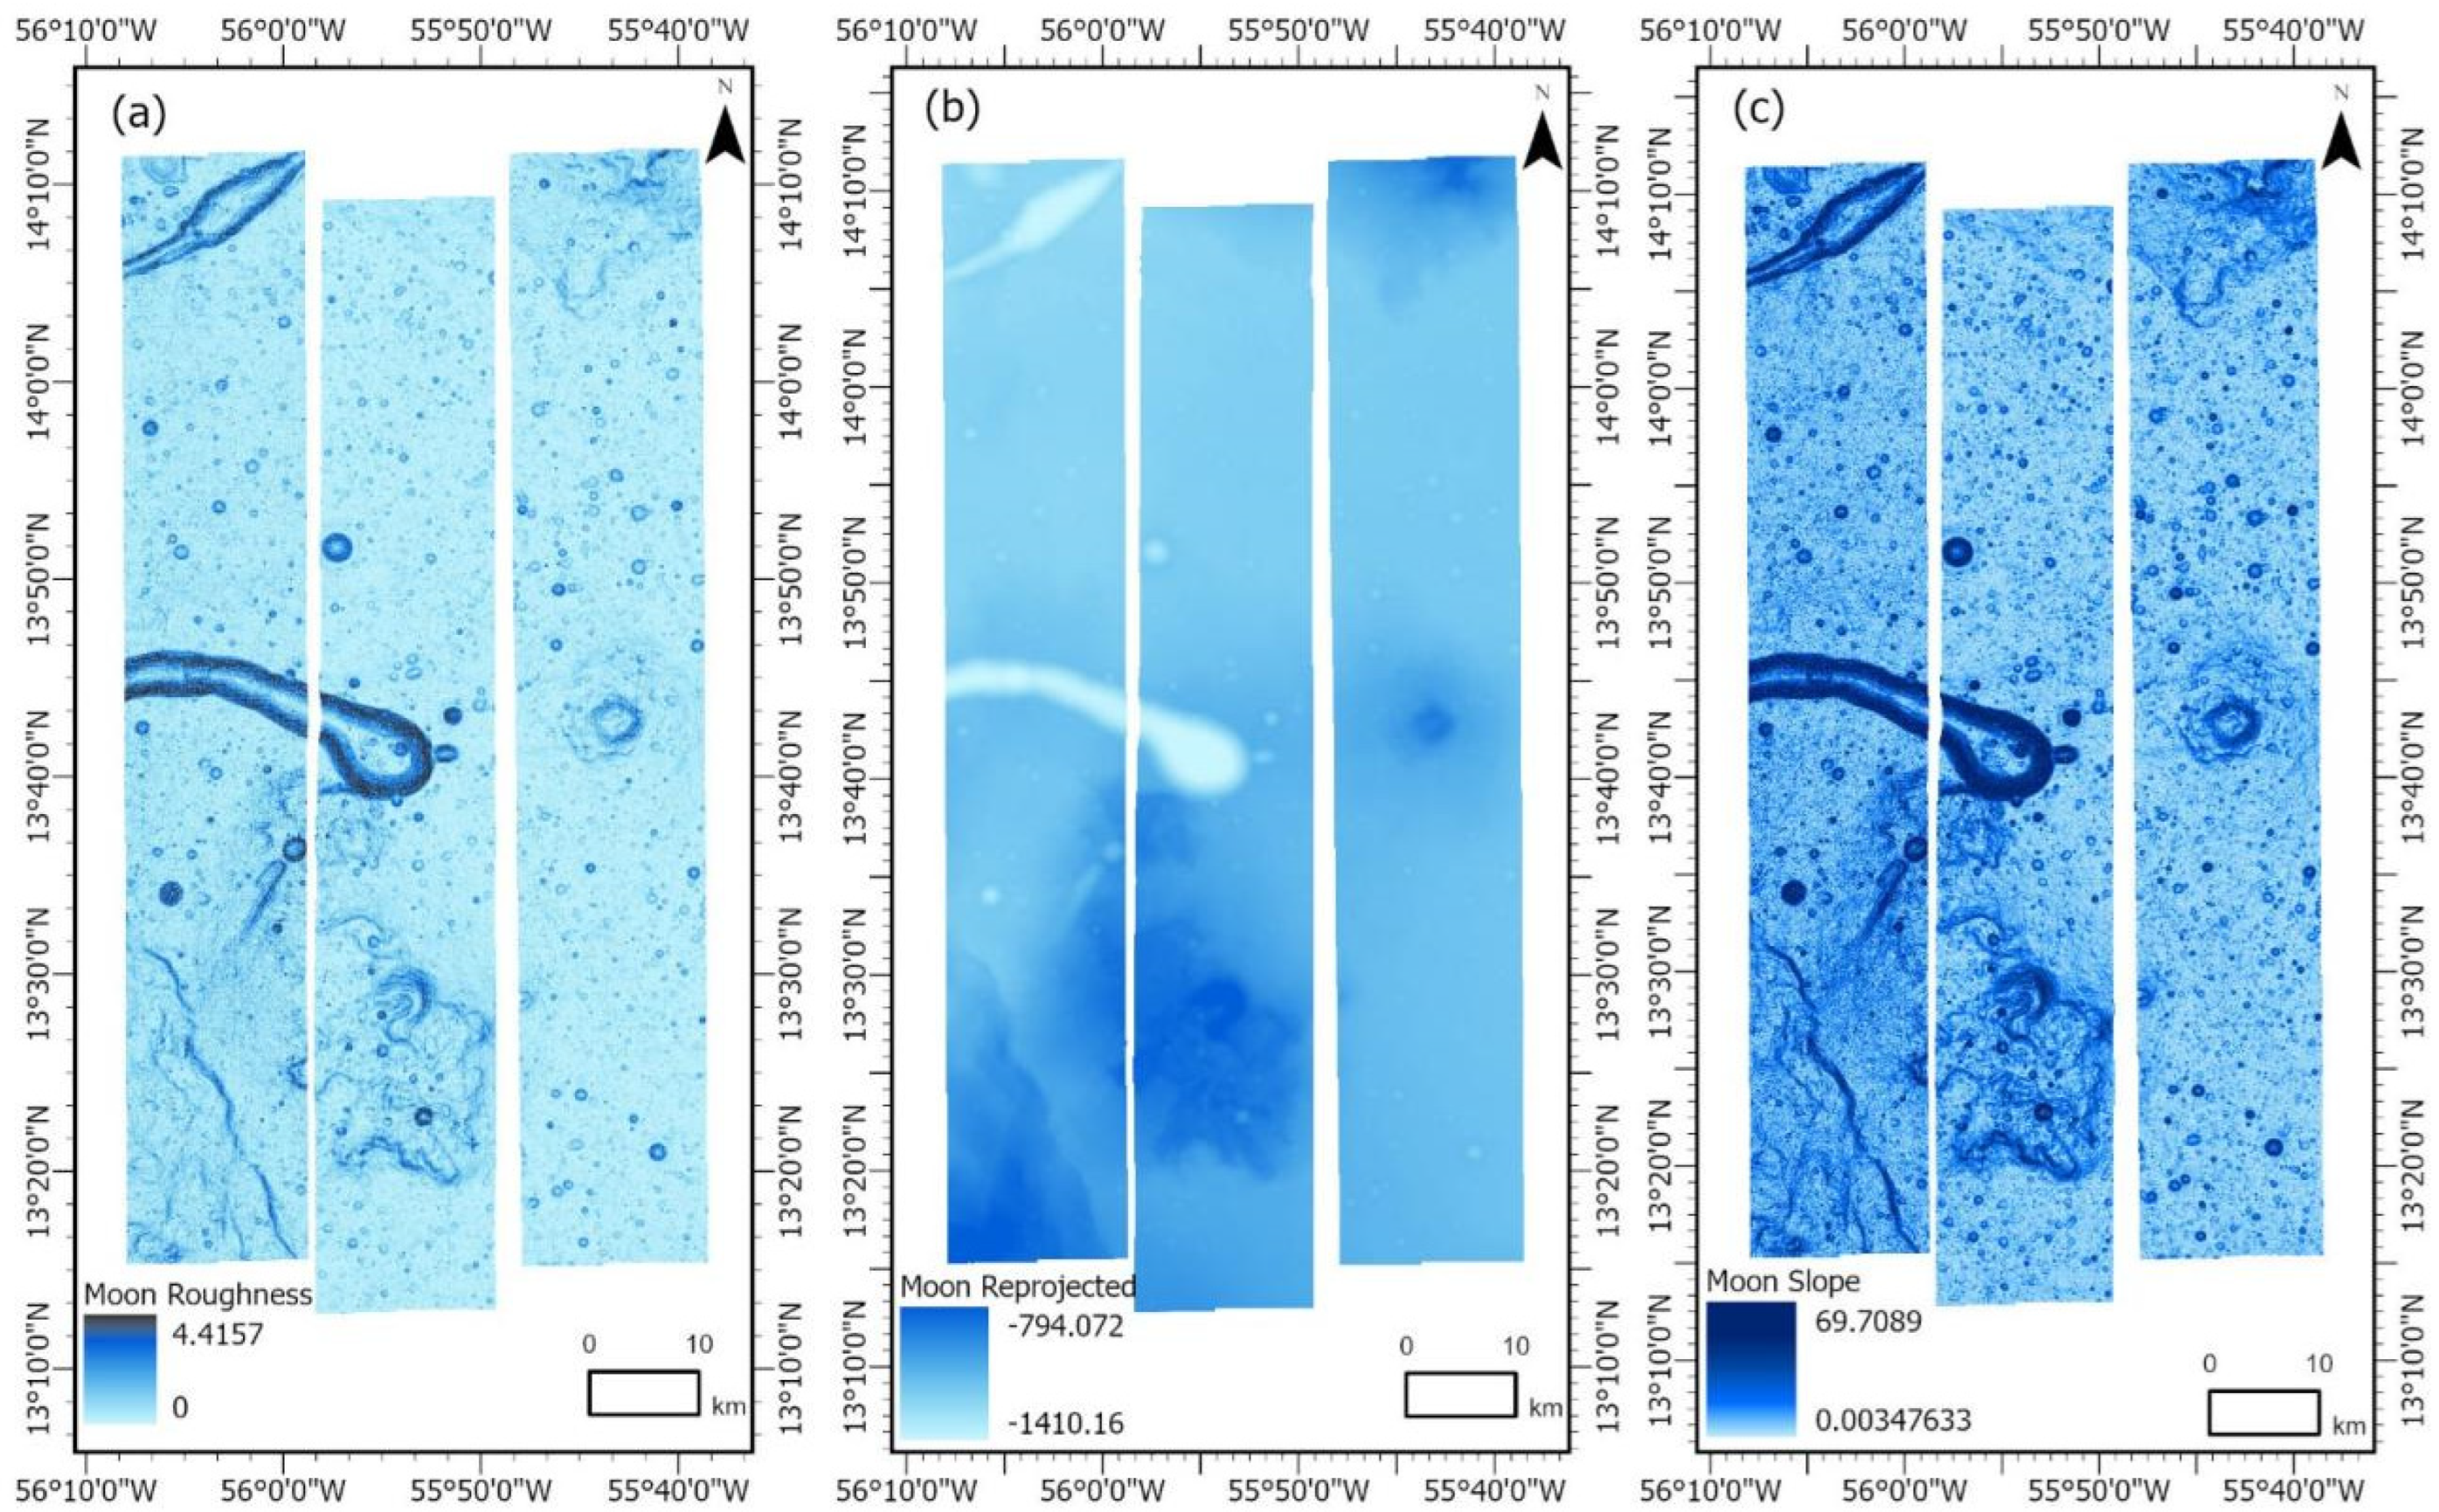
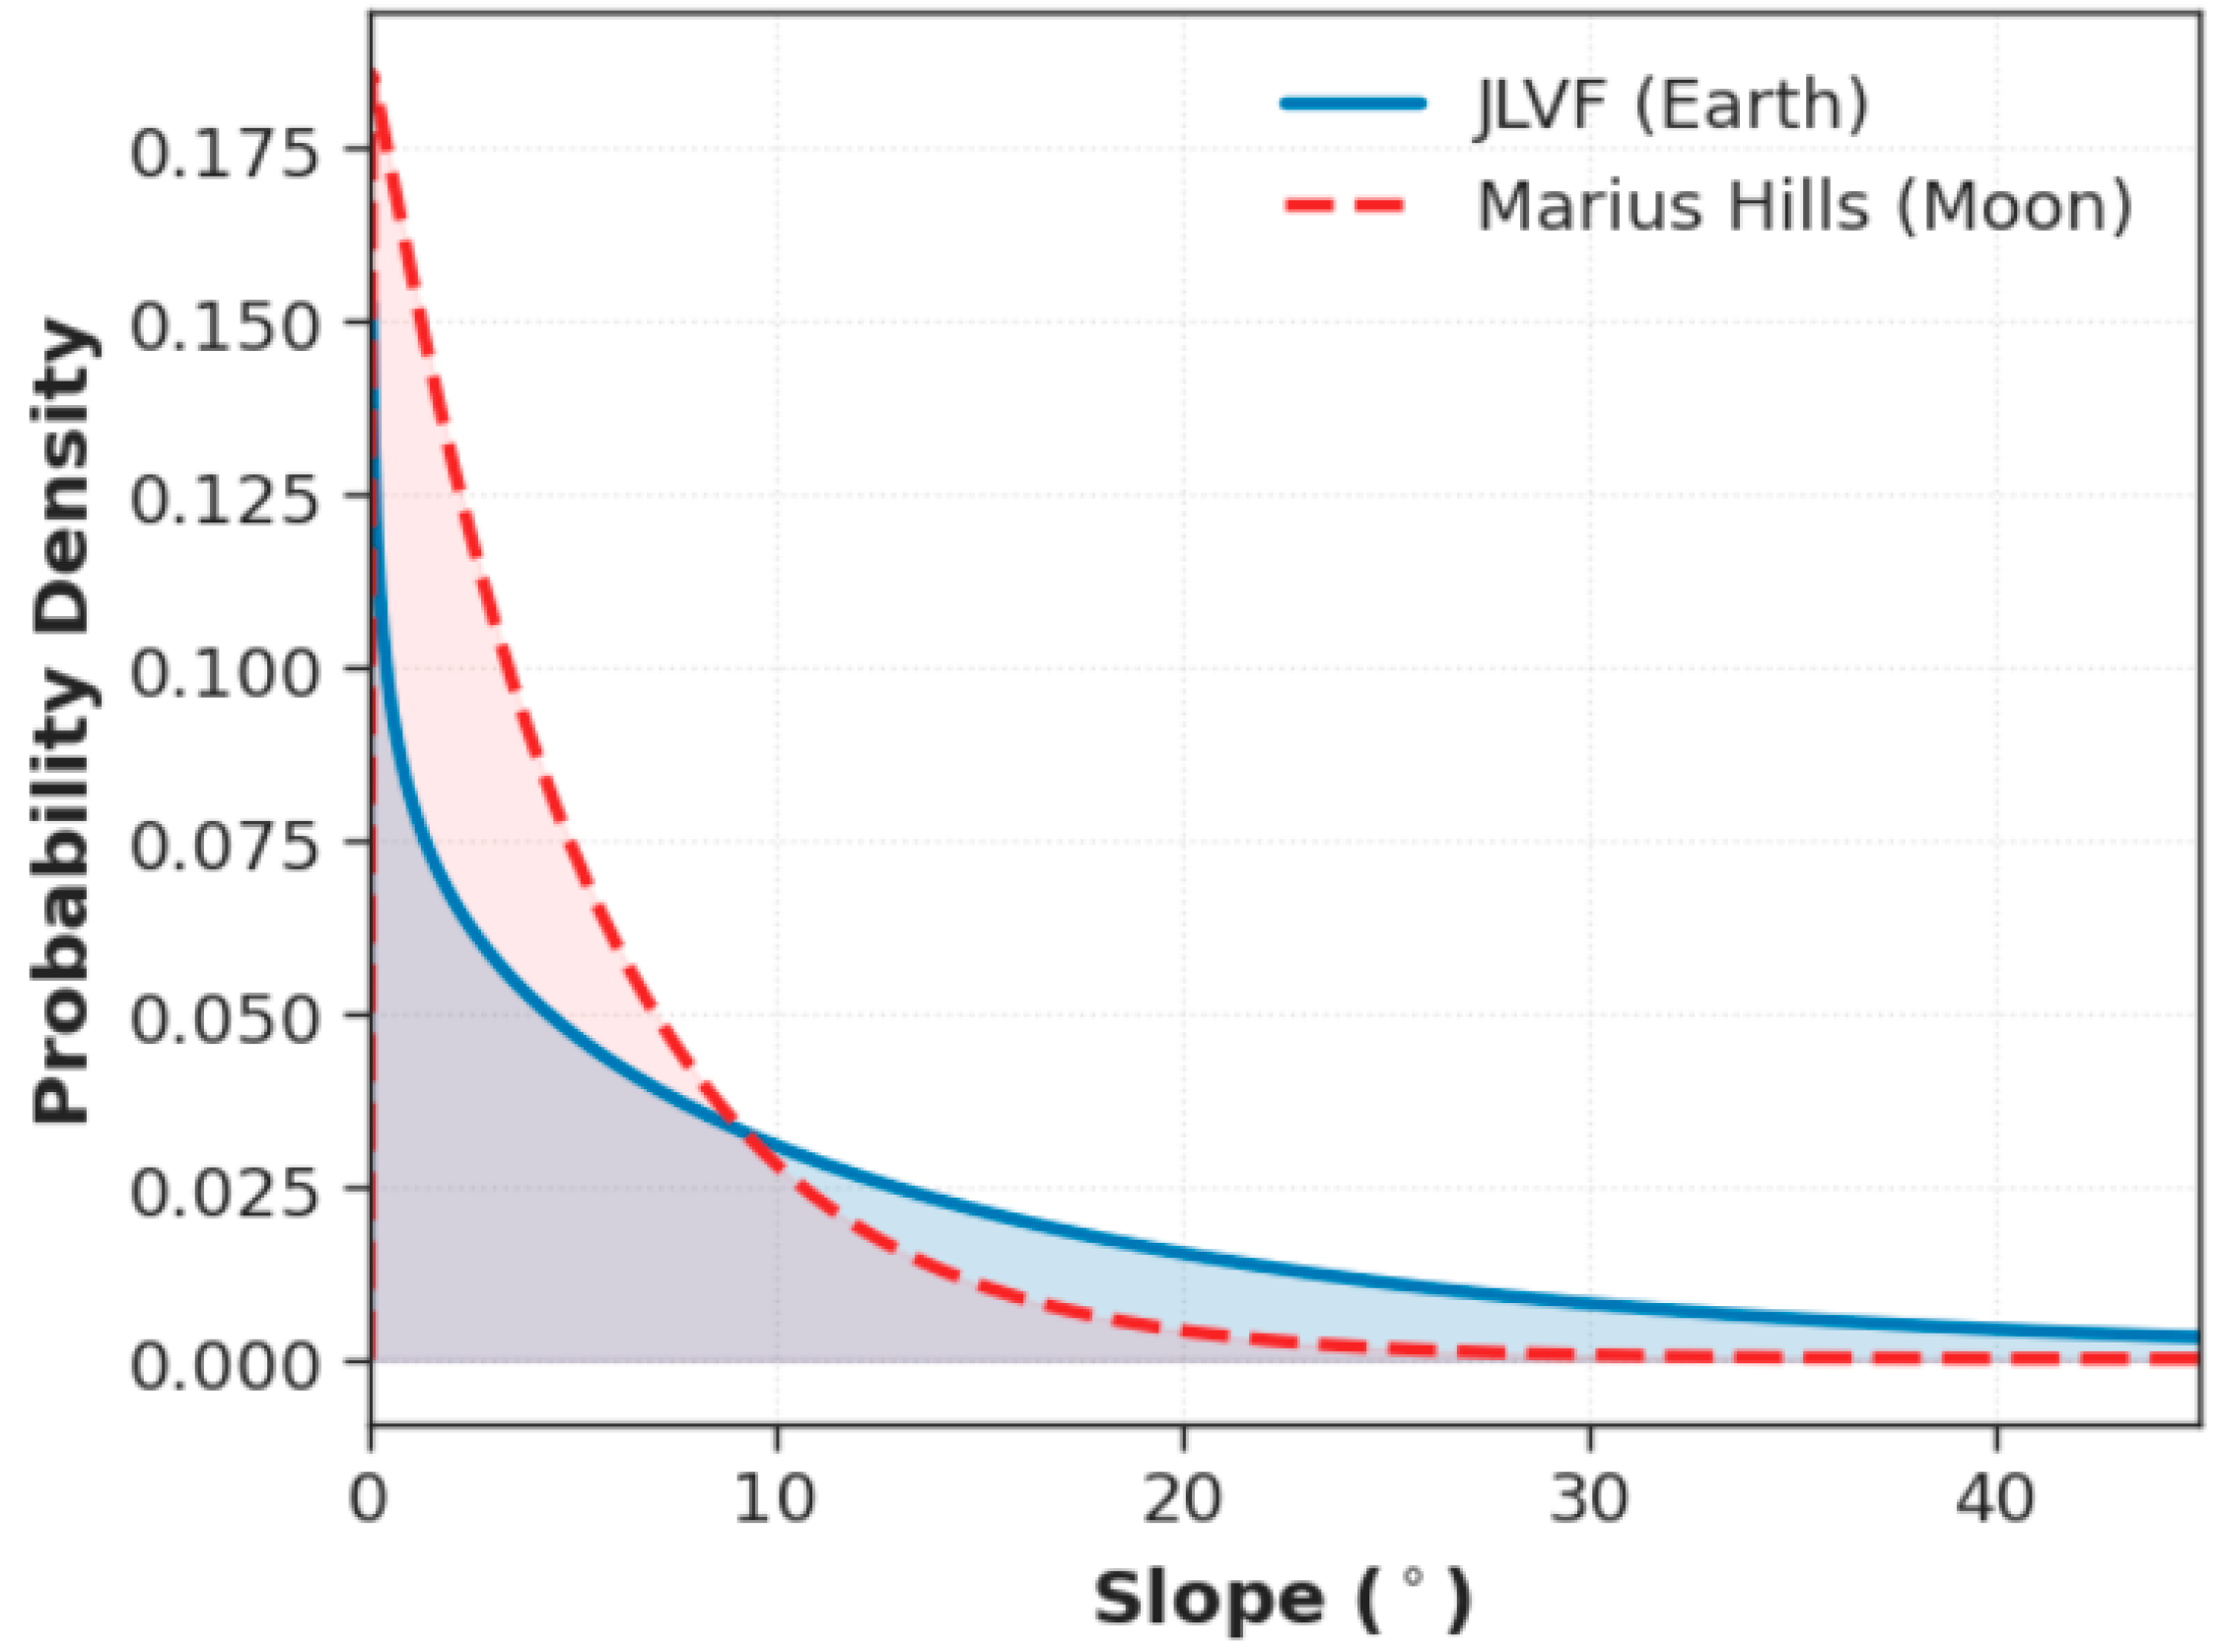
The slope frequency distributions derived from the unified 2 m/px DTMs are presented in Figure 9. Statistically, both the JLVF terrestrial analog and the Marius Hills lunar site exhibit a Gamma-like long-tail distribution, indicating that the majority of both terrains consists of relatively flat surfaces. However, the quantitative descriptors (Table 2) reveal significant morphometric divergences in the tail regions of the distributions.
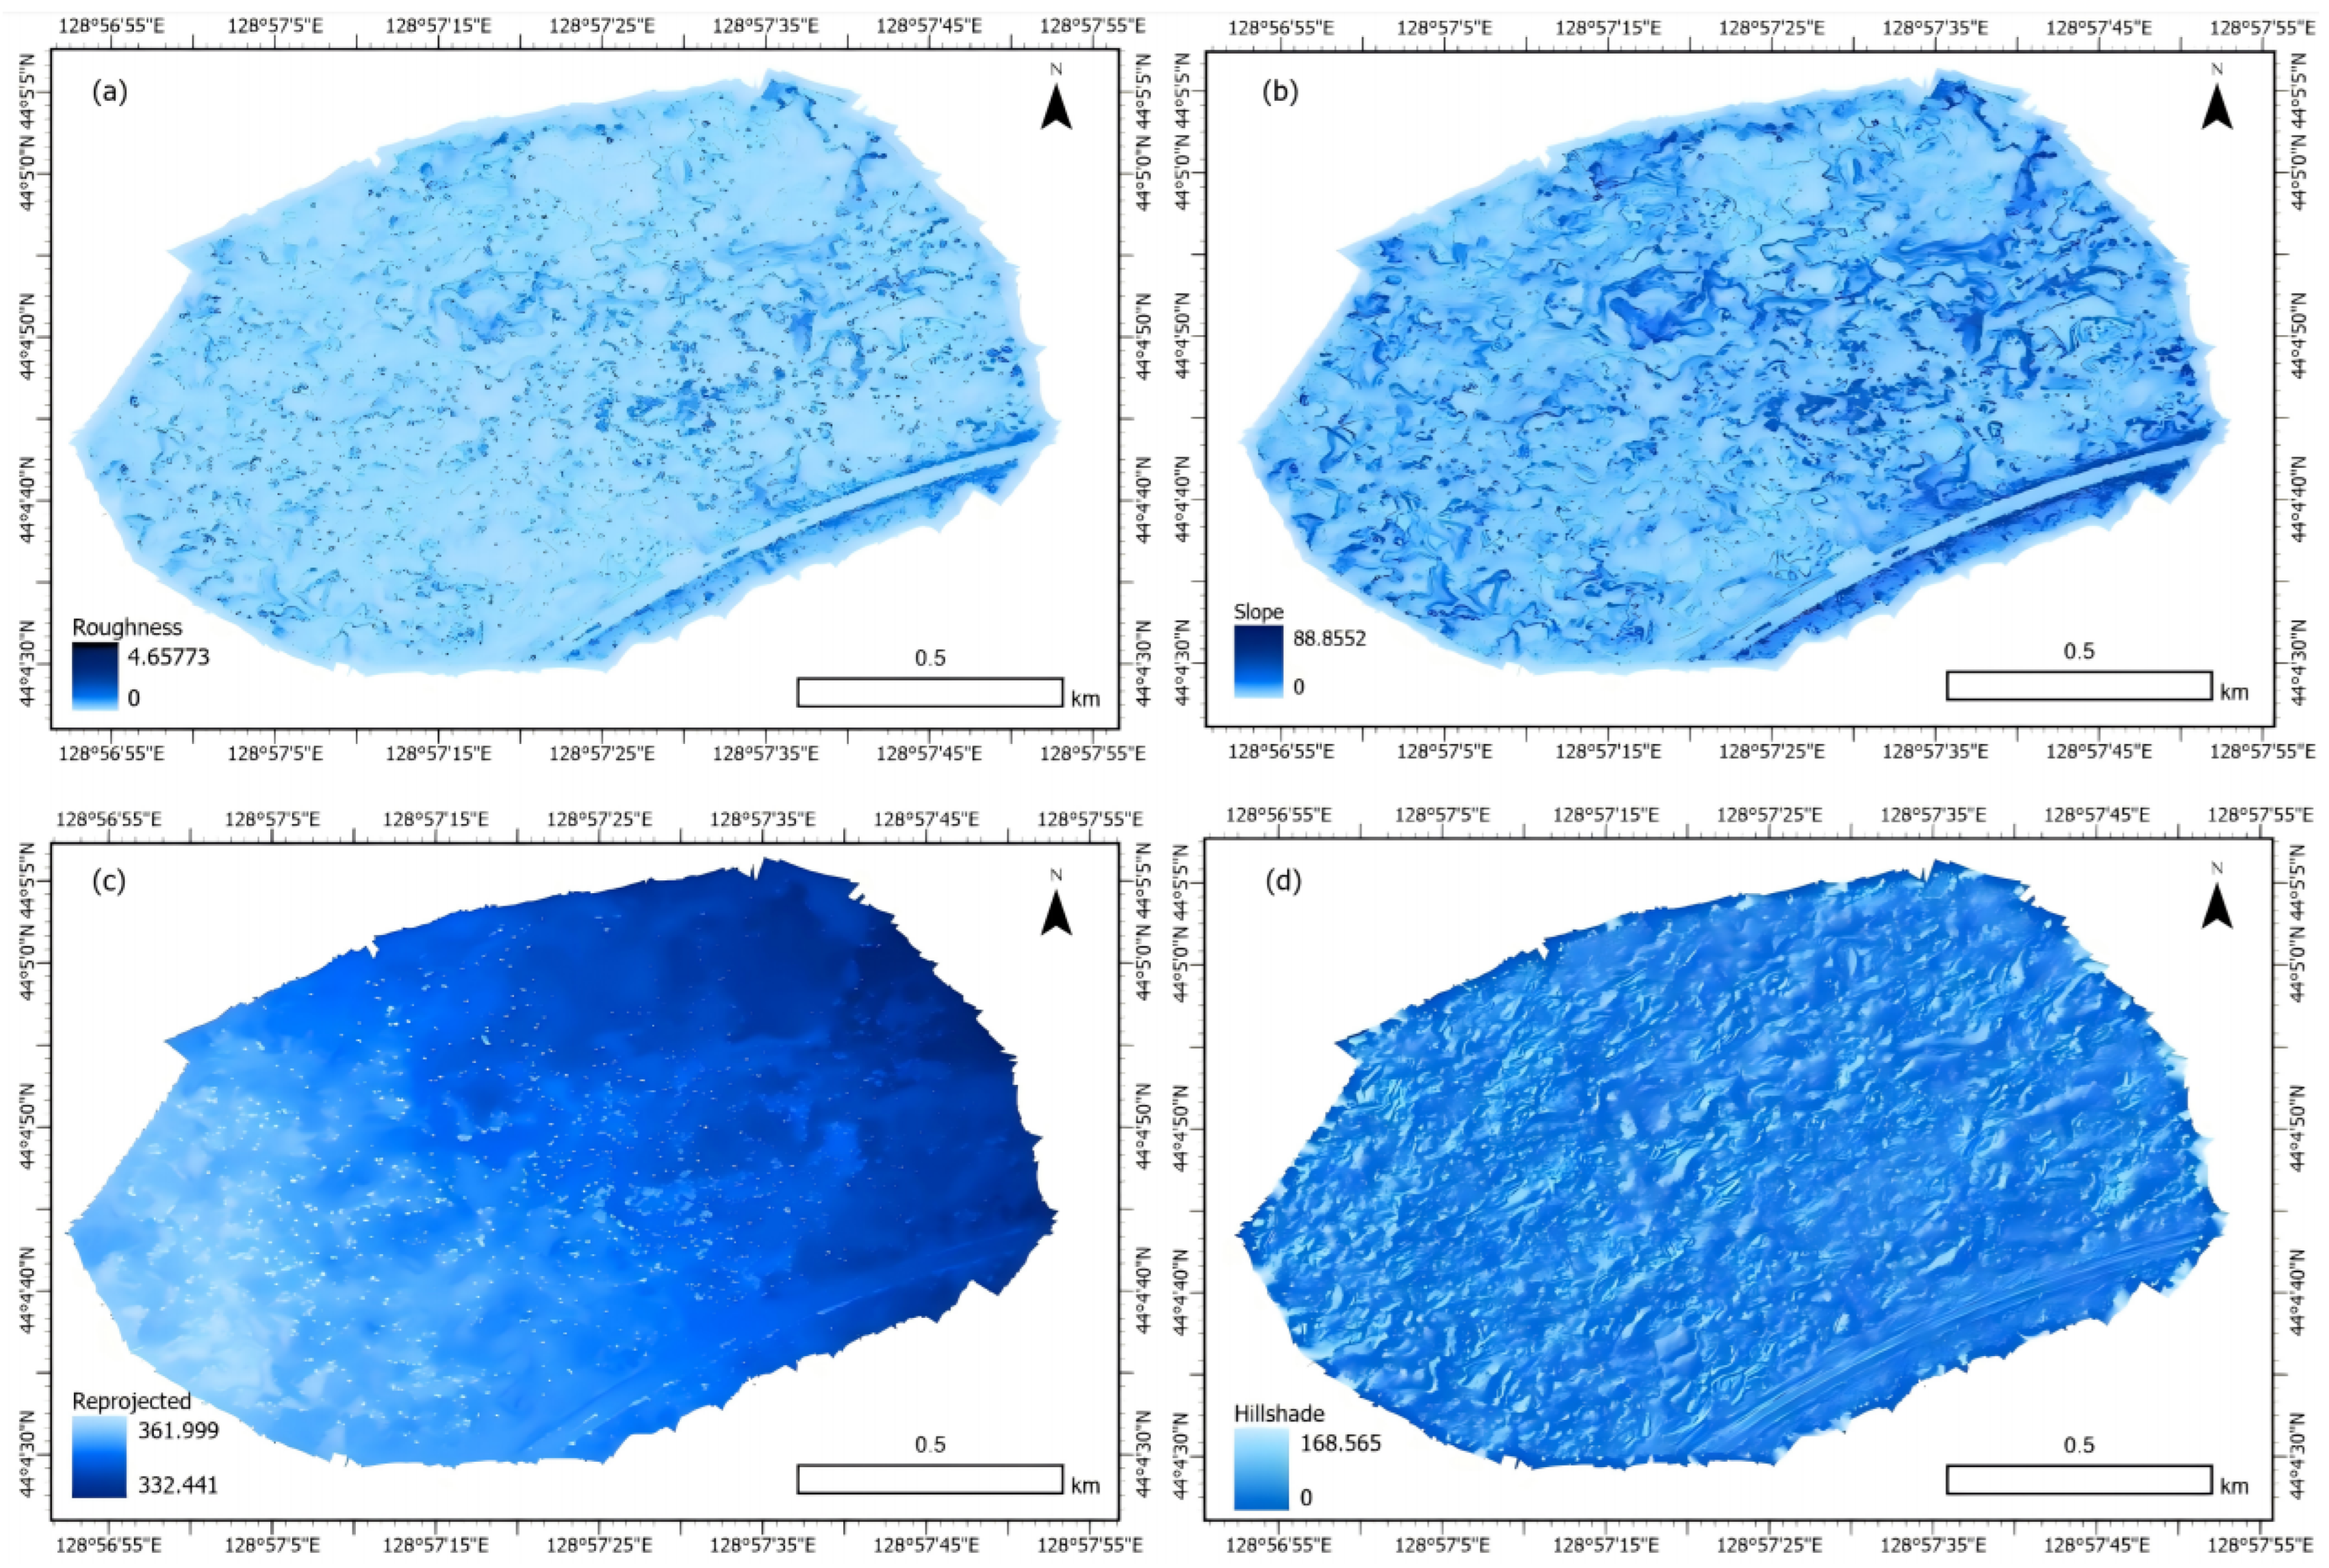
The JLVF dataset is characterized by a mean slope of 14.16° ( σ = 15.86 ° ), which is markedly steeper than the lunar mean of 5.21 ° ( σ = 5.19 ° ). Crucially, the terrestrial histogram exhibits a “heavier tail,” extending to a maximum gradient of 88.88 ° . Spatially, these high-gradient features correspond to the vertical walls of collapsed skylights and the steep ridges of inflation tumuli, as visualized in the slope map (Figure 9). In contrast, the lunar slope distribution is more compressed (Max: 70.16 ° ), with steep terrain confined strictly to crater interiors and rille walls (Figure 10).
This statistical discrepancy indicates that while JLVF shares the fundamental basaltic flow morphology of the Moon, it presents a more rigorous topographic profile. The younger Holocene age of the JLVF flows preserves sharp, pristine volcanic structures that have not yet been smoothed by the extensive impact gardening observed on the lunar mare. Consequently, the JLVF terrain represents a conservative geometric analog, offering a “stress-test” environment where topographic gradients exceed average lunar conditions.
Quantitative comparisons of slope distribution characteristics (Figure 11) elucidate the key interaction between geological age and sensor accuracy. The slope frequency distributions exhibit a shared Gamma-like signature (long-tail), confirming that both terrains are fundamentally governed by the same fluid dynamics of low-viscosity basaltic emplacement. However, the JLVF distribution (blue) displays a distinctly “heavier tail” (mean β 14.16 ° ) compared to the lunar reference (red, mean β 5.21 ° ), reflecting the preservation of pristine, high-gradient volcanic structures—specifically steep skylight walls and inflation tumuli—that have not yet been smoothed by the eons of impact gardening observed on the Moon.

Surface Roughness

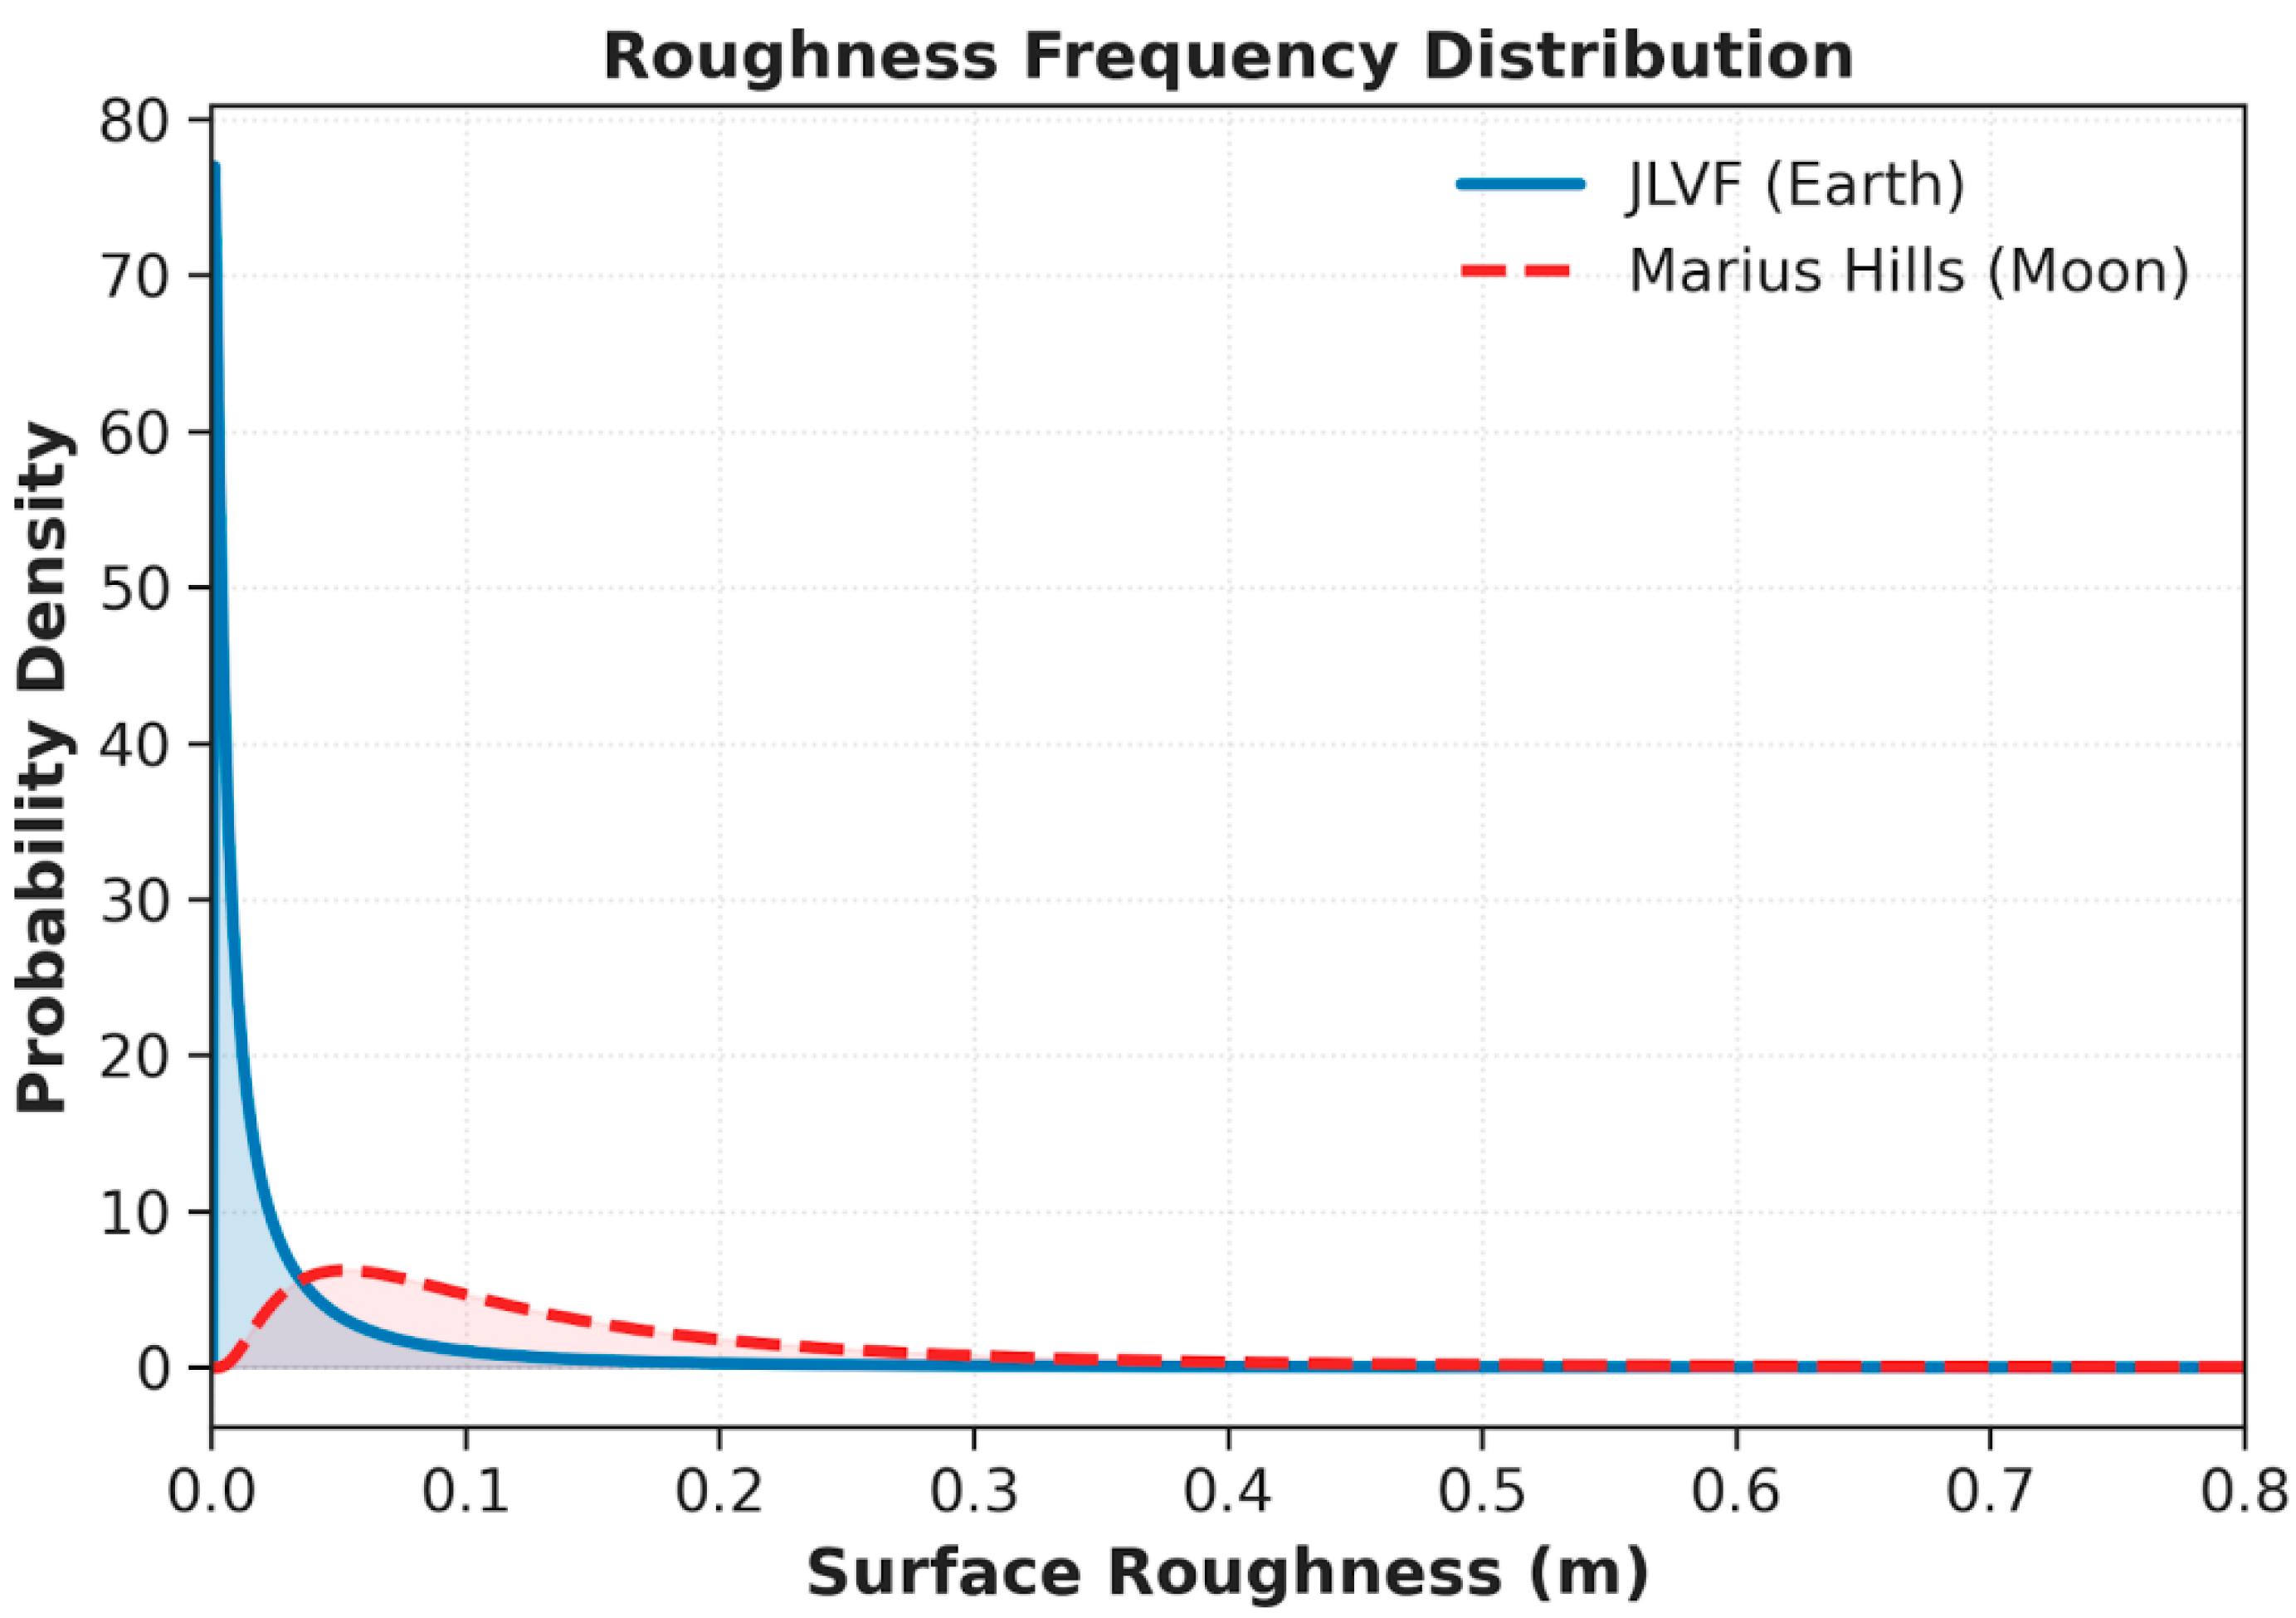
The comparative analysis of RMS height (Surface Roughness) highlights the influence of sensor resolution on morphometric assessment. As shown in Table 2, the JLVF dataset yields a low mean roughness of 0.046 m ( σ = 0.17   m ), whereas the lunar dataset exhibits a higher mean value of 0.155 m ( σ = 0.16   m ).
This inversion—where the visually rugged terrestrial lava appears statistically “smoother” than the lunar mare—is a result of data fidelity. The JLVF roughness map (Figure 9), derived from low-altitude UAV LiDAR, possesses a high signal-to-noise ratio, effectively isolating true geologic micro-topography (e.g., ropy pahoehoe textures and fissures) from flat background terrain. Conversely, the lunar roughness map (Figure 10) is affected by inherent sensor noise in the orbital LROC NAC stereo-photogrammetry, which artificially elevates the baseline roughness values across featureless plains. Therefore, the JLVF data provides a high-fidelity ground truth that resolves sub-meter geometric hazards often obscured by noise in orbital lunar datasets.
The roughness distribution presents a counter-intuitive inversion where the terrestrial surface appears statistically “smoother” than the lunar mare as shown in Figure 12. This discrepancy is diagnostic of data quality rather than physical reality: the broad, elevated peak in the lunar dataset signifies inherent orbital sensor noise (LROC NAC stereo-matching artifacts) which artificially amplifies baseline roughness. In contrast, the sharp, near-zero peak of the JLVF data confirms the high signal-to-noise ratio of the UAV LiDAR, validating it as a reliable ground-truth baseline for calibrating future orbital observations.

4.2. Morphological Similarity Between Collapsed Lava Tubes and Sinuous Rilles

4.2.1. Longitudinal Floor Undulation as a Proxy for Stochastic Failure

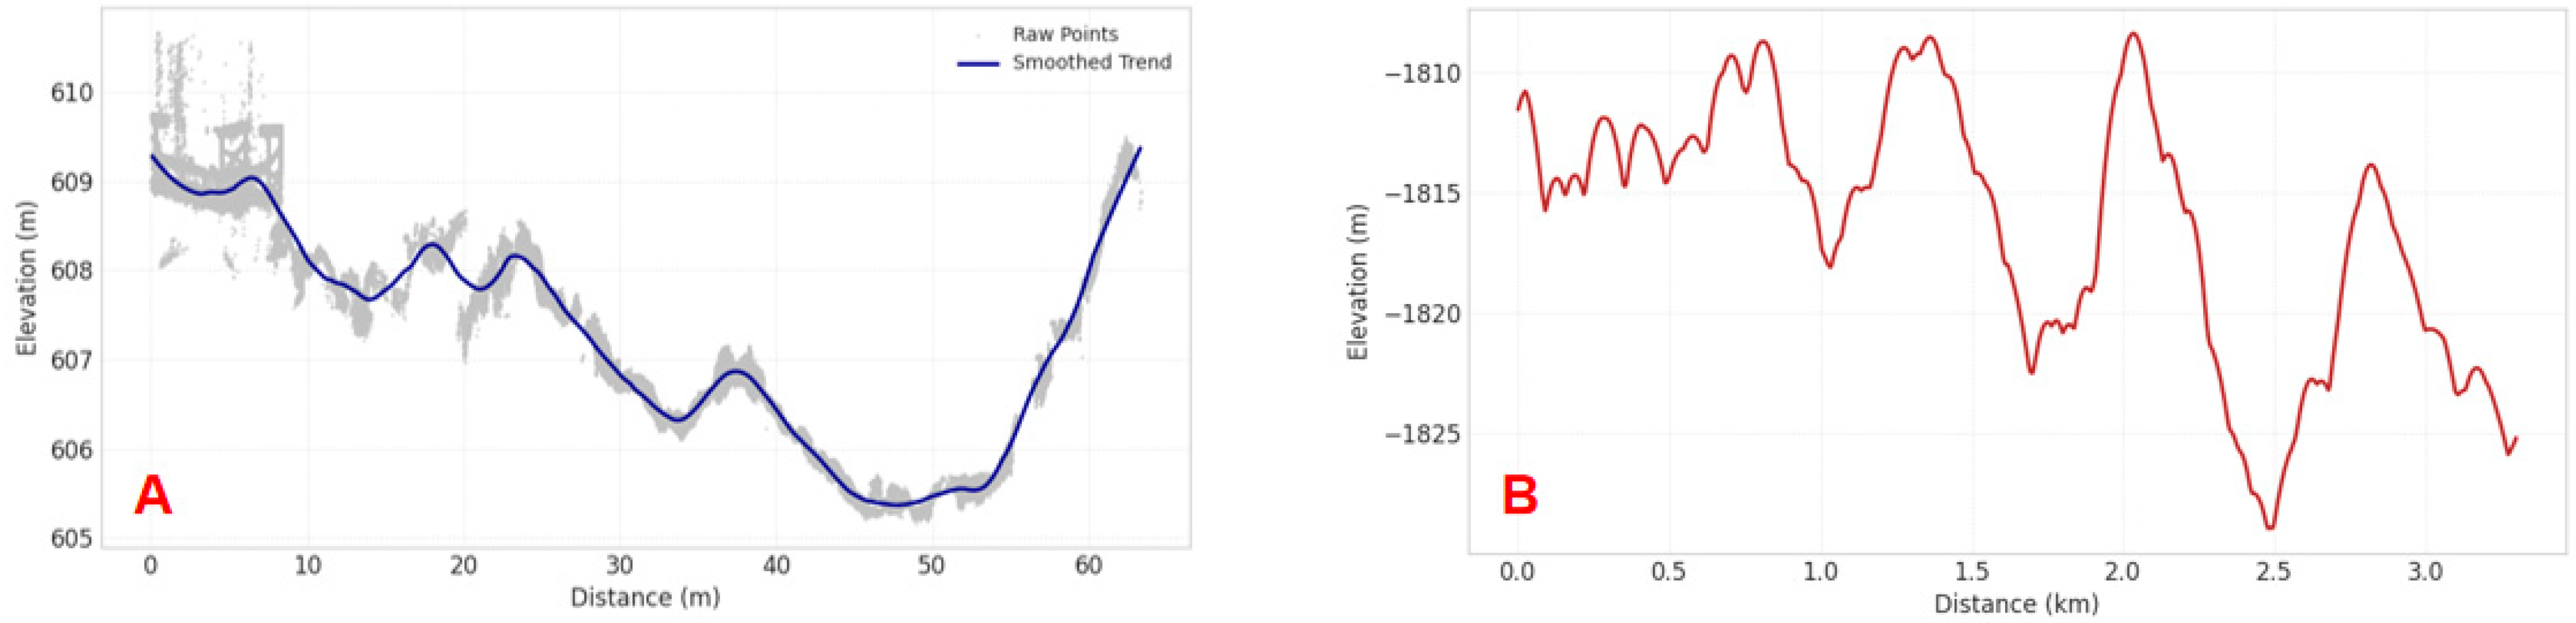
The genesis of the rille floor topography is critically constrained by the longitudinal elevation profiles extracted along the thalweg of both the terrestrial analog JLVF (Figure 13) and Rima Marius (Figure 14). Unlike thermally eroded open tubes, which typically evolve towards a smoothed, graded longitudinal profile to minimize hydraulic resistance, both datasets exhibit distinct quasi-periodic undulations.
In the JLVF Section (Earth), the longitudinal profile manifests a high-frequency “hummocky” terrain with localized elevation variances of 2–4 m over 60 m intervals. These variations directly correspond to the accumulation of collapsed roof blocks (skylight bridges) and subsequent debris piles, as evidenced by the interspersed intact roof segments in the plan view (Figure 13). Crucially, the longitudinal profile of Rima Marius (Figure 14) mirrors this morphological signature, displaying macroscopic undulations with amplitudes of ~100 m over kilometer-scale distances. These topographic highs in the rille floor cannot be adequately explained by lava flow viscosity variations alone; rather, they represent the accumulation of massive roof blocks that have collapsed into the tube. The preservation of these stochastic roughness elements suggests that post-collapse thermal erosion was insufficient to homogenize the floor, supporting a formation sequence where the rille represents a “chain of collapses” that have coalesced into a continuous trench.

4.2.2. Structural Homology in Transverse Geometries

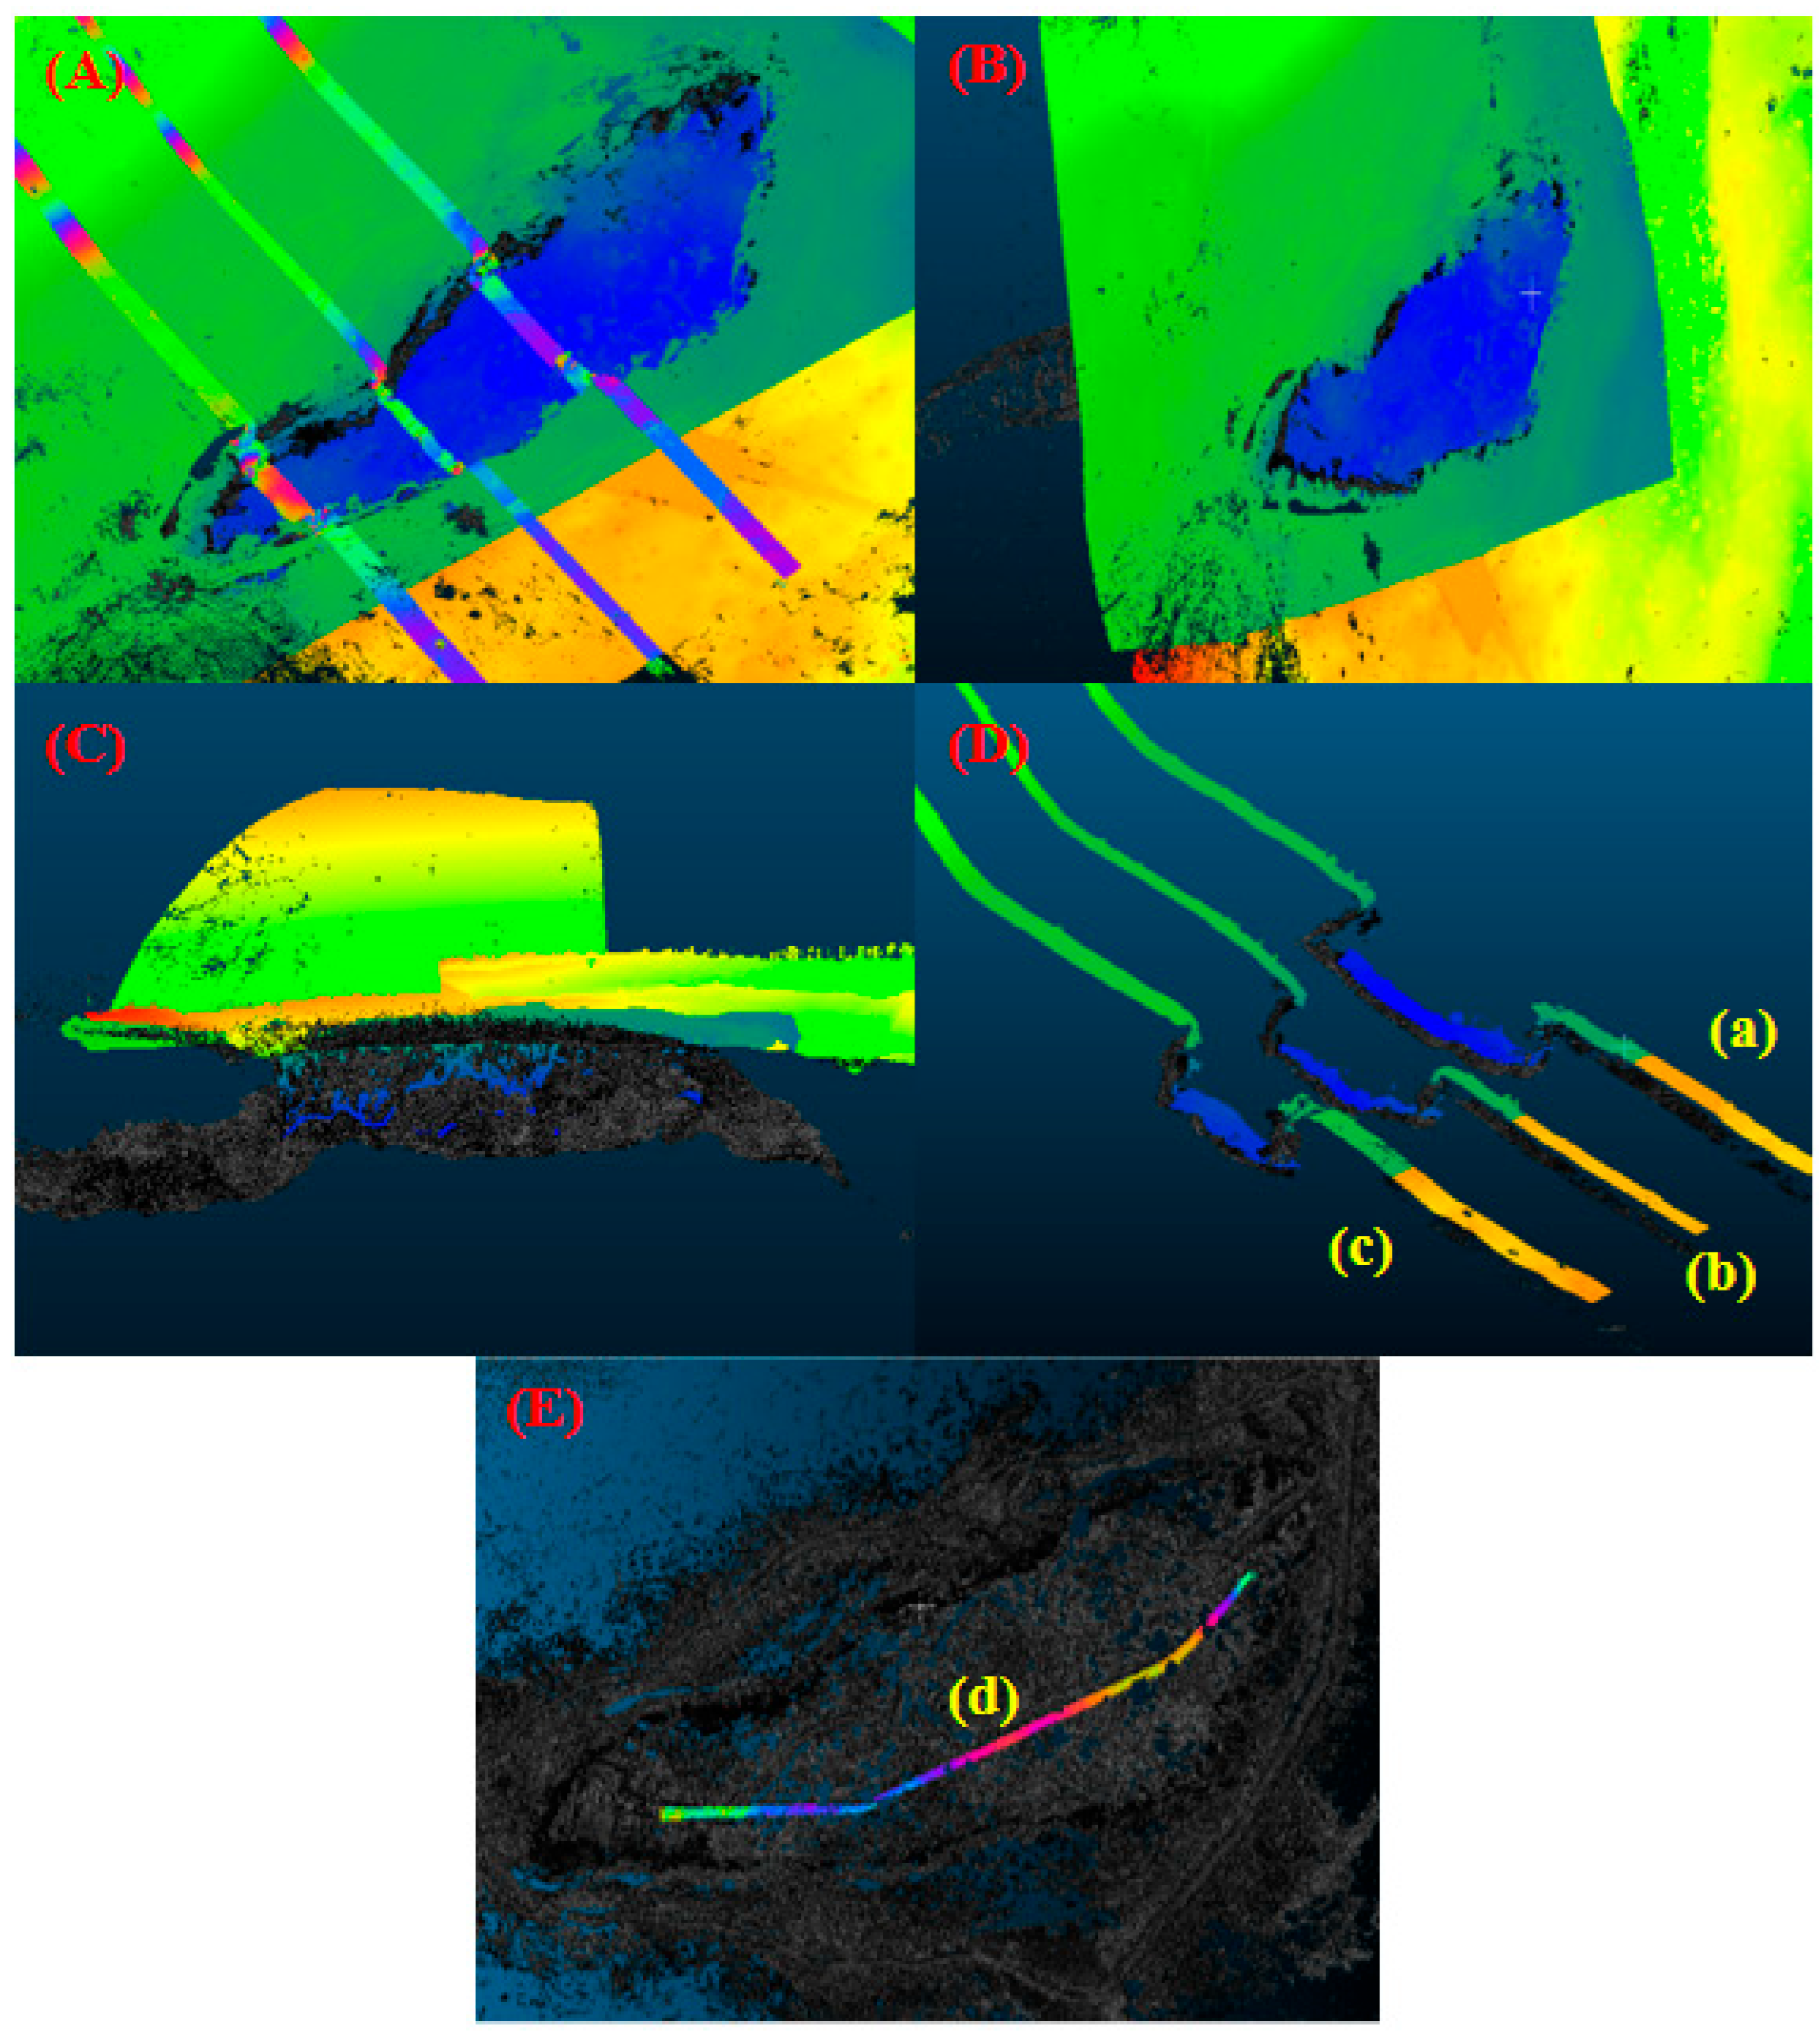
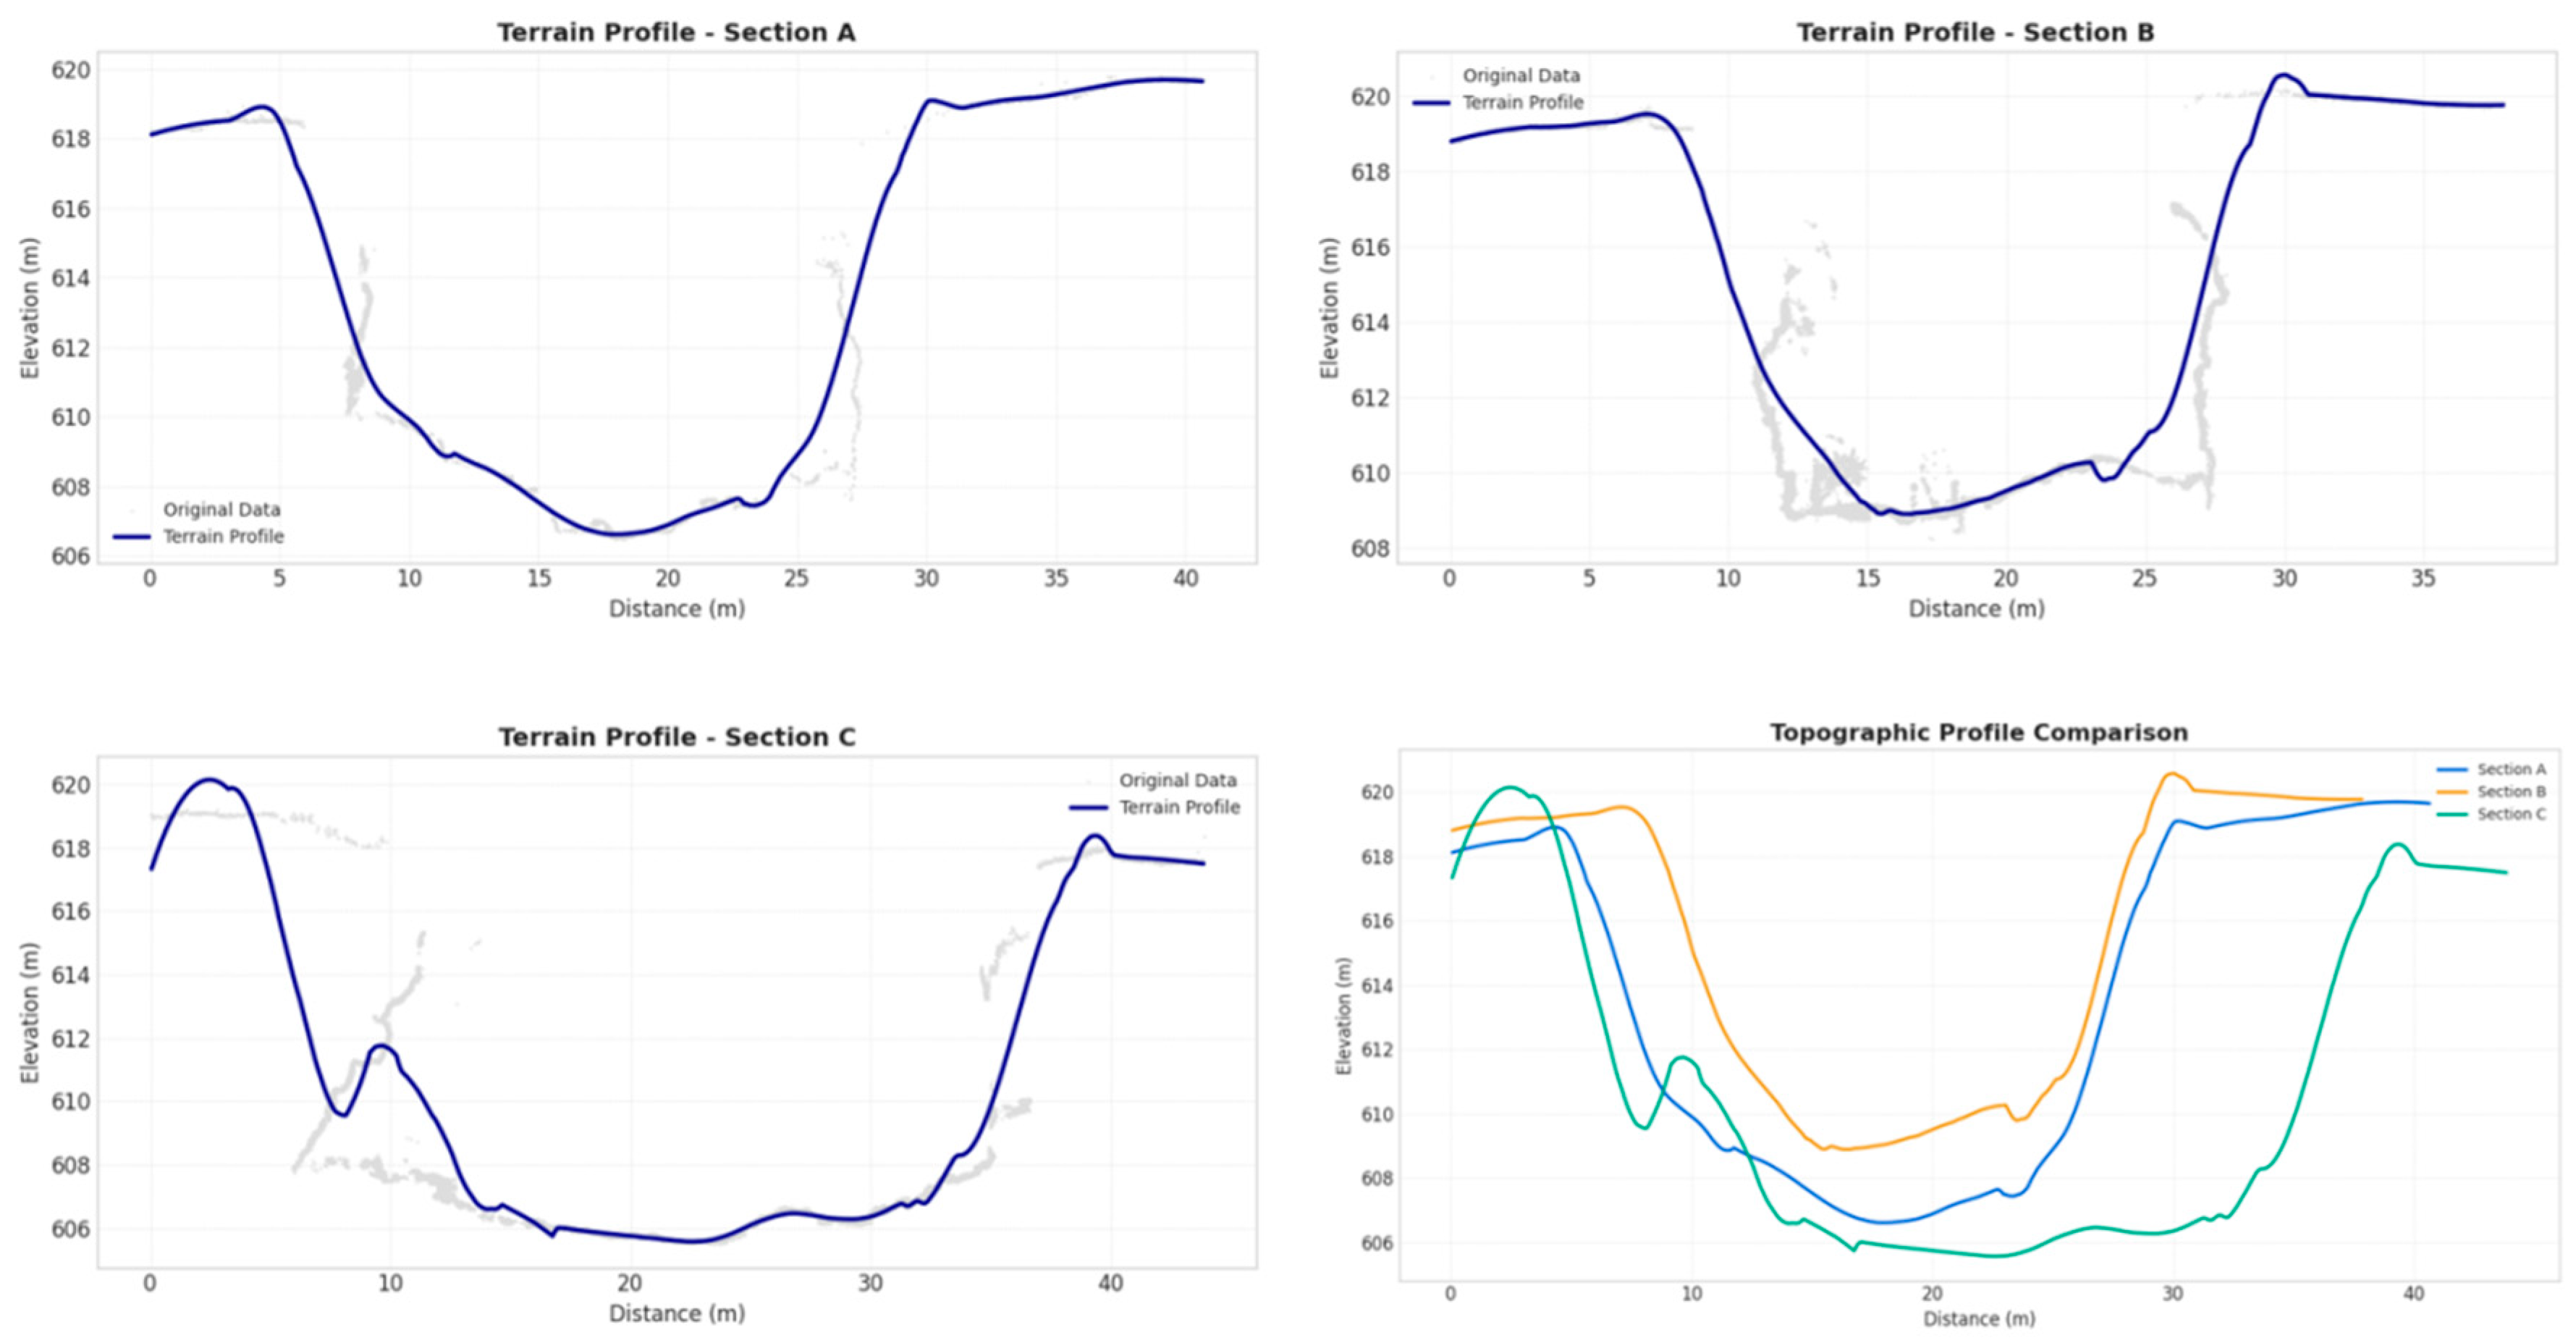
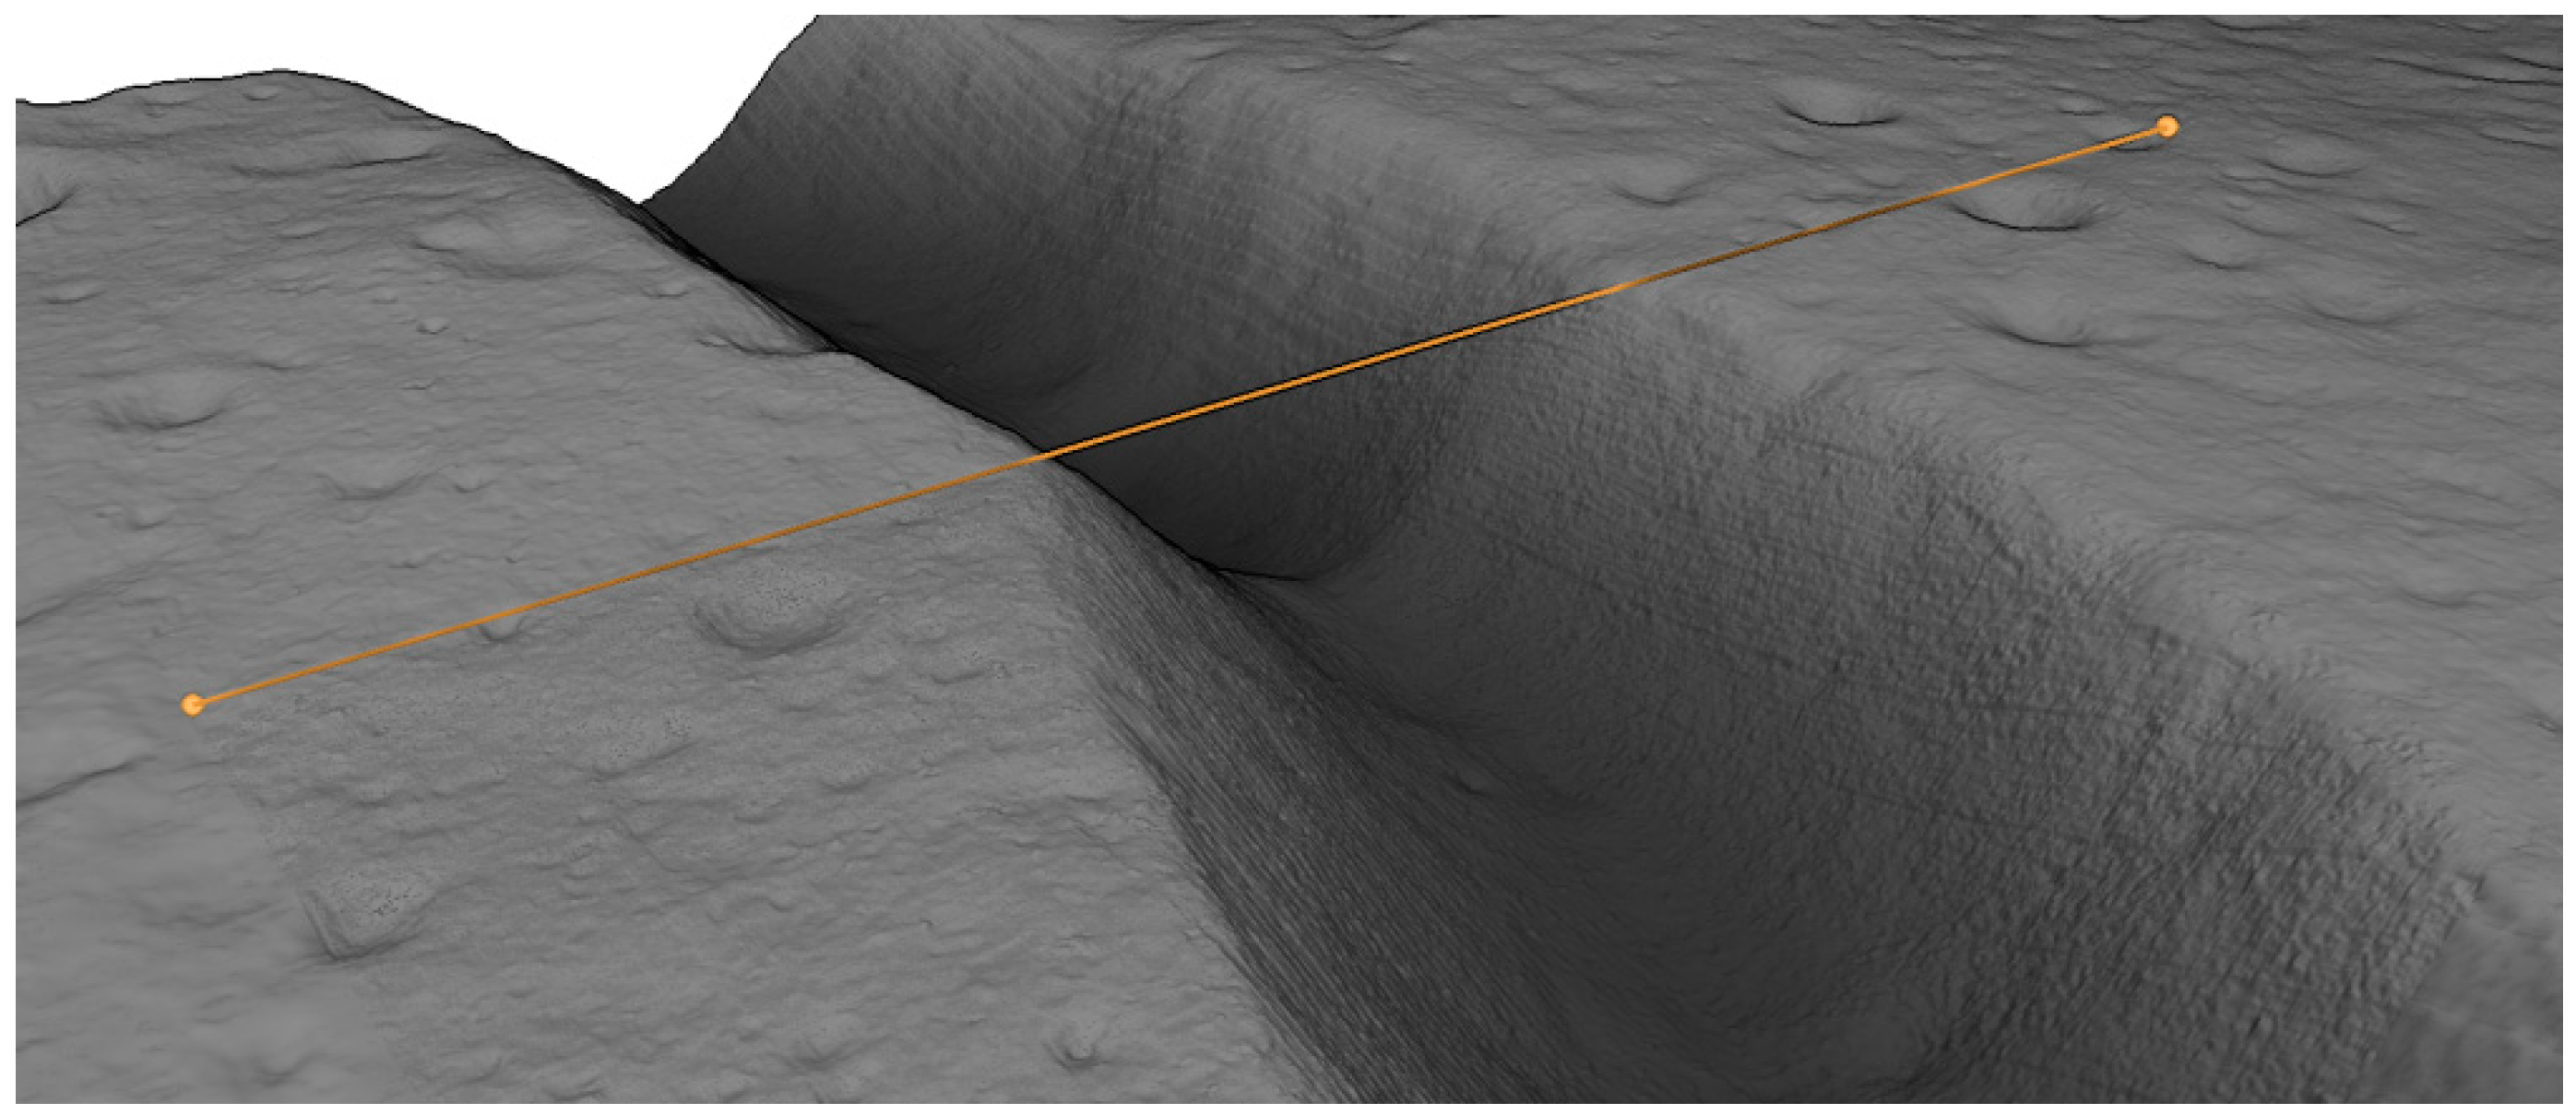
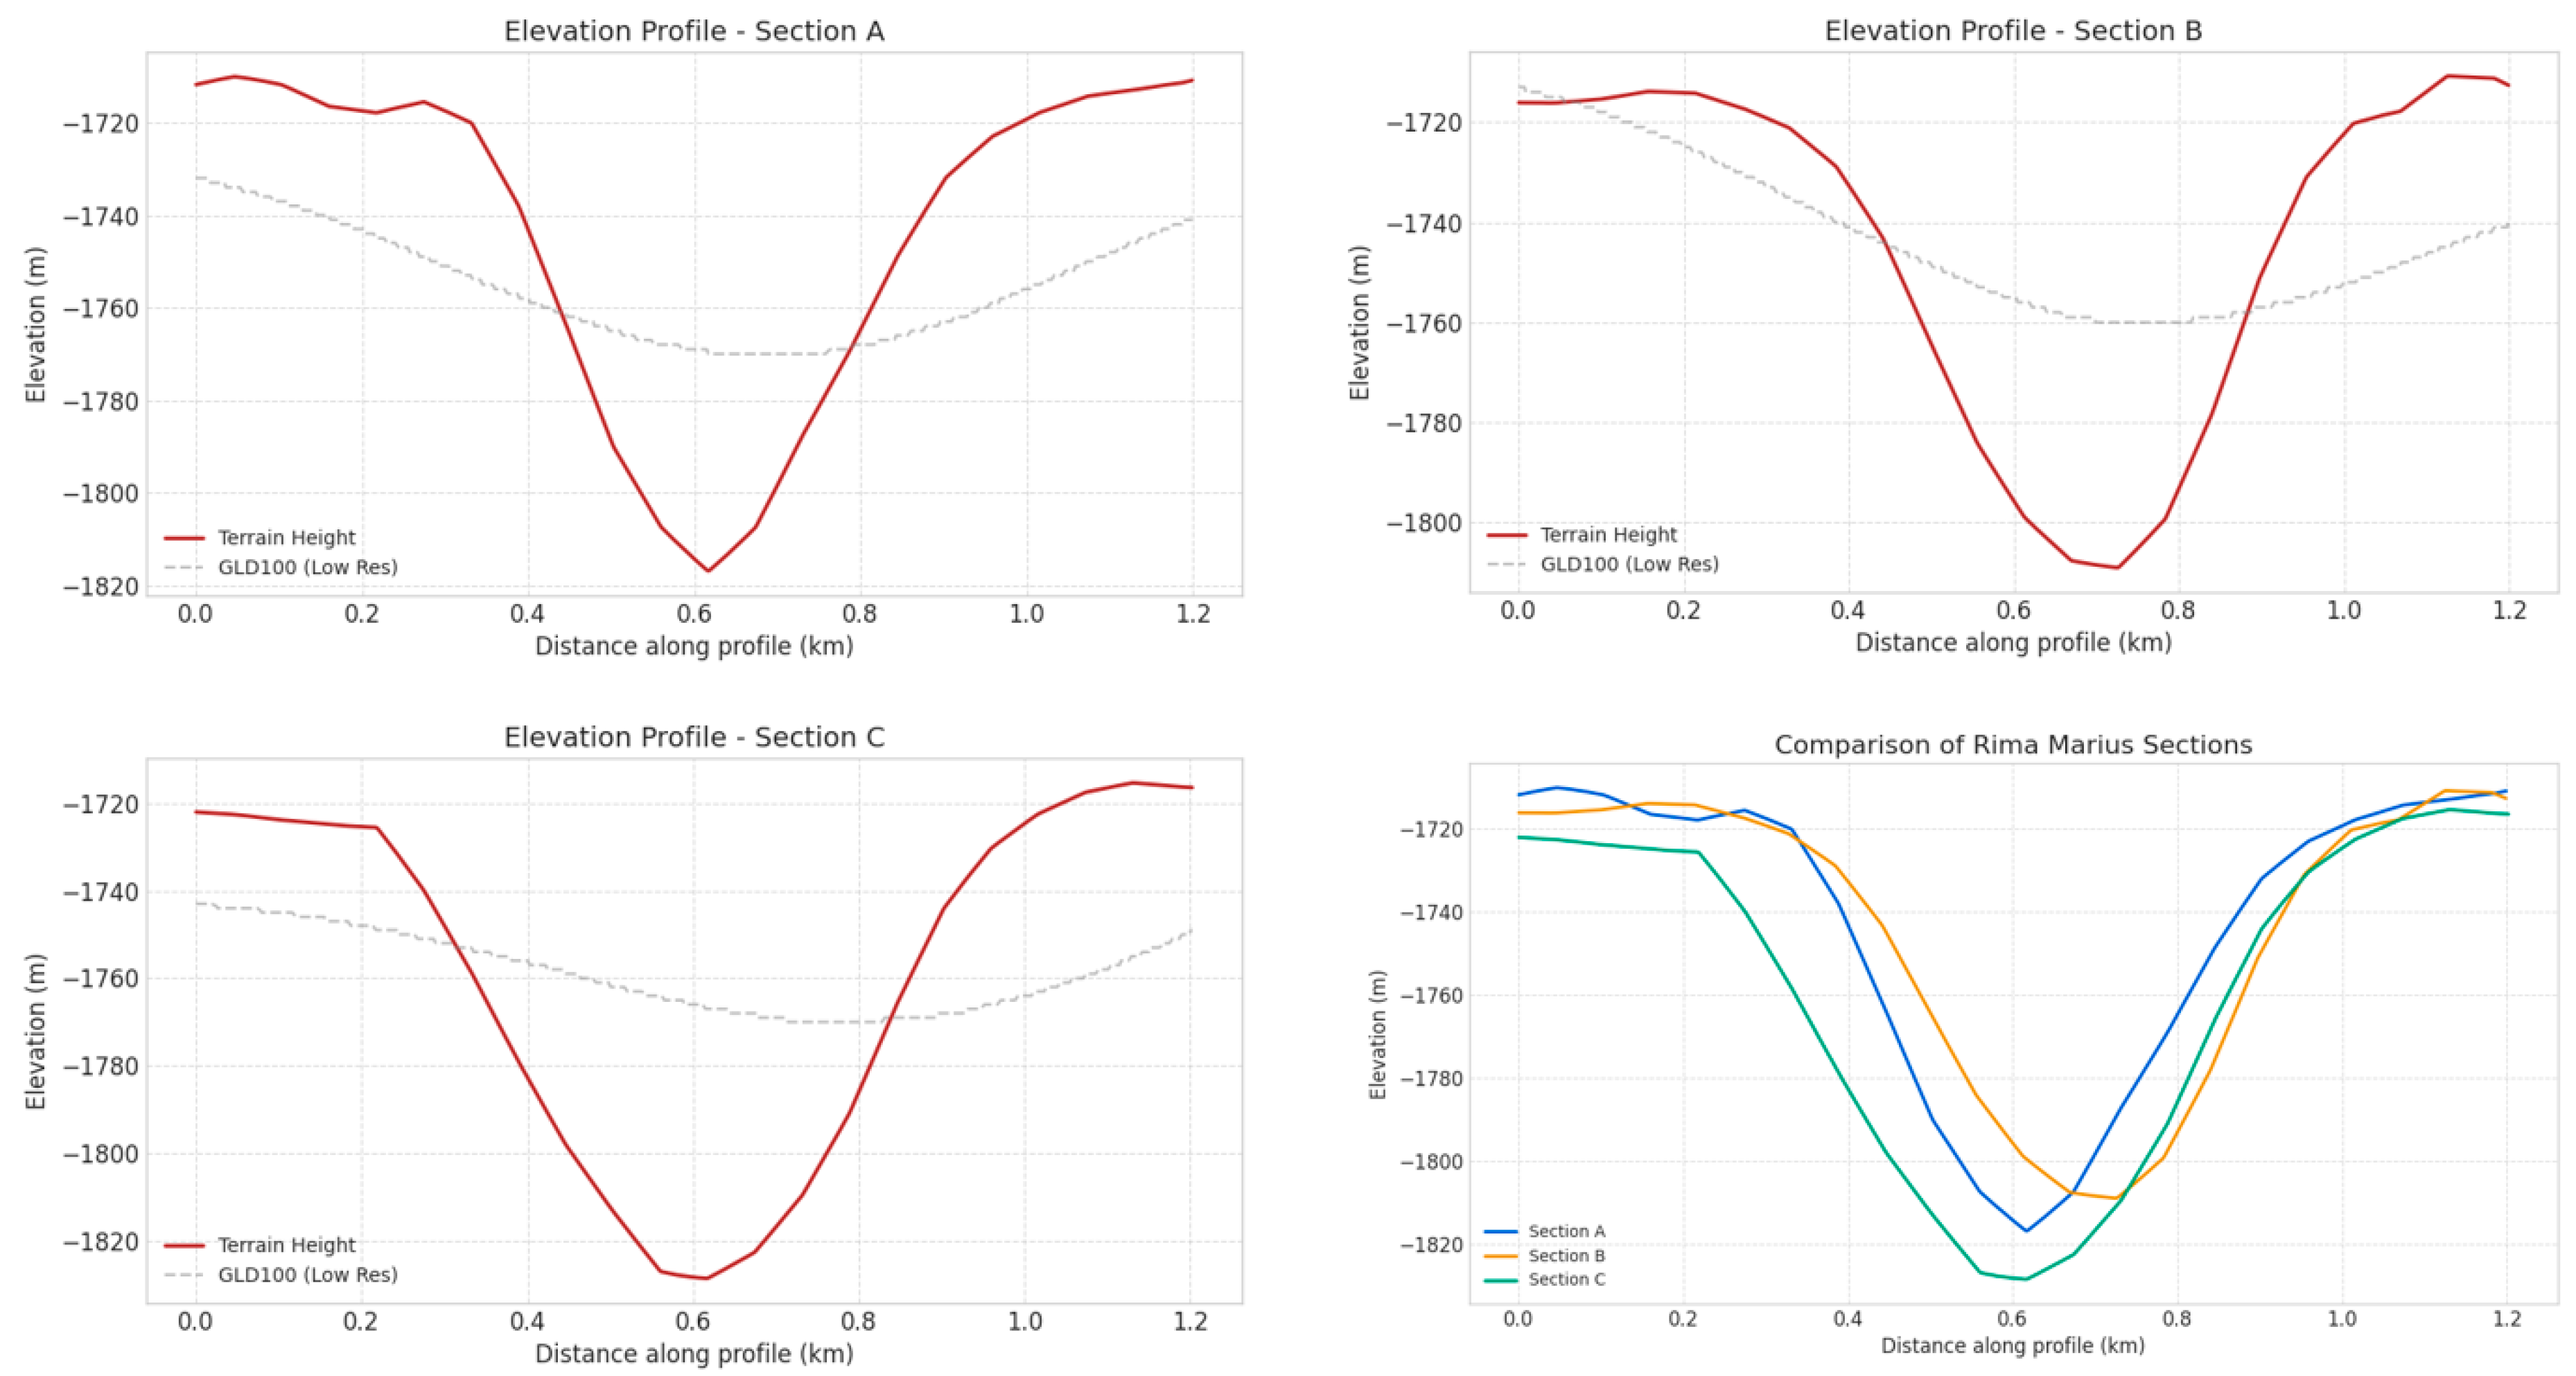
The “collapsed tube” hypothesis is further corroborated by the geometric consistency observed across multiple cross-sections (Sections a, b, c). We compared the terrain profiles of the JLVF collapse pits with those of Rima Marius. Despite the scalar difference—where the lunar rille spans ~1.2 km in width compared to the ~30 m width of terrestrial pits—both systems exhibit a characteristic “U-to-V” transition profile governed by gravitational mass wasting. Specifically, the terrestrial profiles (Figure 15) display steep, near-vertical upper walls originating from the brittle fracture of the basaltic crust, transitioning into a V-shaped floor defined by talus deposits. This morphology is rigorously reproduced in the lunar profiles (Figure 16), where Sections ‘a’, ‘b’, and ‘c’ consistently show a distinct break in slope; Figure 17 shows the cross-section of rima from a real-world three-dimensional perspective. The upper rille walls maintain high gradients, while the floor is dominated by inward-sloping debris aprons meeting at a central axis. Comparison of the 3D topographic reconstruction reveals that while the JLVF system retains distinct “bridges” between pits, Marius Hills represents a more advanced stage of degradation where these bridges have largely failed. However, the consistent cross-sectional geometry along the rille strike (as seen in the superposition of Sections a–c) indicates that the tube was not incised by a waxing and waning flow, which would produce terraced banks, but was formed by the singular, catastrophic failure of a widened tube roof. The “V-shape” bottom is therefore a depositional feature of talus accumulation, validating the terrestrial pit chain as a geomechanically accurate analog for the rille’s structural evolution.
The genesis of the rille floor topography is critically constrained by the longitudinal elevation profiles extracted along the thalweg of both the terrestrial analog JLVF and Rima Marius. Unlike thermally eroded open tubes, which typically evolve towards a smoothed, graded longitudinal profile to minimize hydraulic resistance, both datasets exhibit distinct quasi-periodic undulations. In the JLVF Section (Earth), the longitudinal profile manifests a high-frequency “hummocky” terrain with localized elevation variances of 2–4 m over 60 m intervals as shown in Figure 18. These variations directly correspond to the accumulation of collapsed roof blocks (skylight bridges) and subsequent debris piles, as evidenced by the interspersed intact roof segments in the plan view.
Crucially, the longitudinal profile of Rima Marius Section (Moon) mirrors this morphological signature, displaying macroscopic undulations with amplitudes of ~10–15 m over kilometer-scale distances as shown in Figure 18. The resolution disparity between the UAV-derived DSM (centimeter-scale) and the LRO NAC DTM (meter-scale) inherently influences the textural detail observable in the lunar profiles. The lower resolution of the lunar data acts as a low-pass filter, smoothing out high-frequency roughness analogous to the smaller debris seen in the JLVF. However, these topographic highs in the rille floor cannot be adequately explained by lava flow viscosity variations alone; rather, they represent the accumulation of massive roof blocks that have collapsed into the tube. The preservation of these stochastic roughness elements suggests that post-collapse thermal erosion was insufficient to homogenize the floor, supporting a formation sequence where the rille represents a “chain of collapses” that have coalesced into a continuous trench.

4.2.3. Spectral Continuity and Fractal Homology

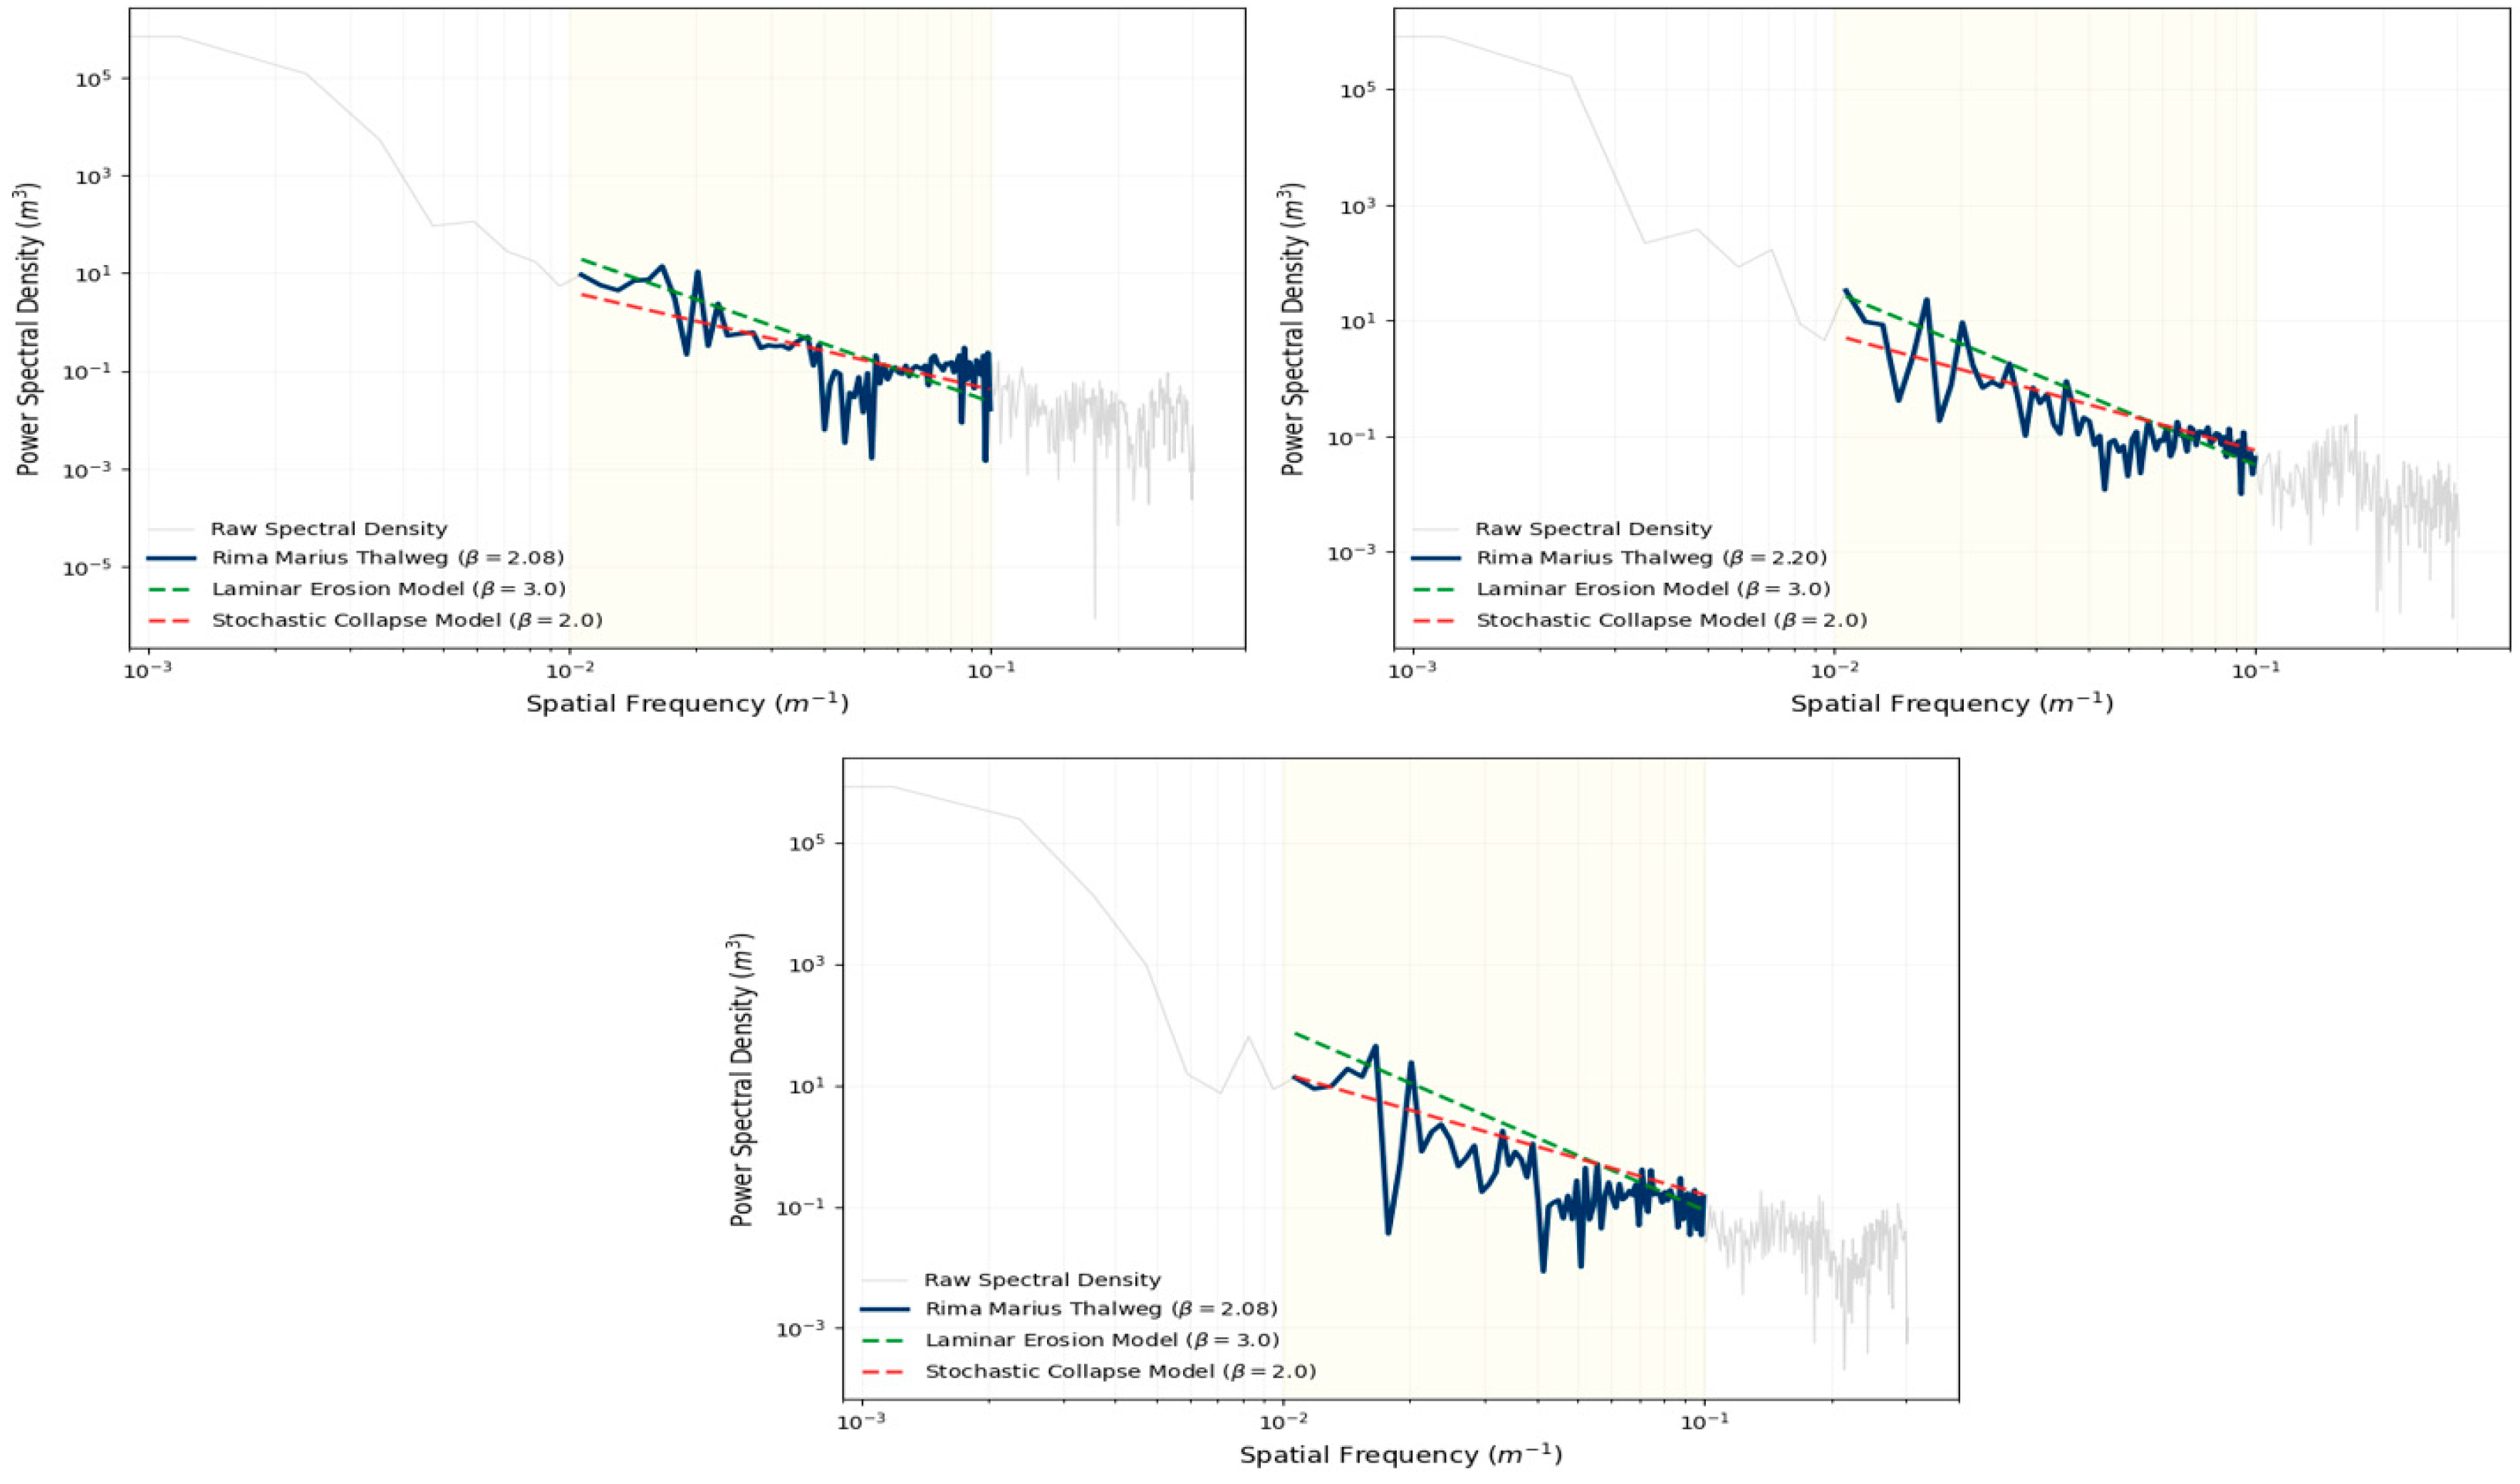
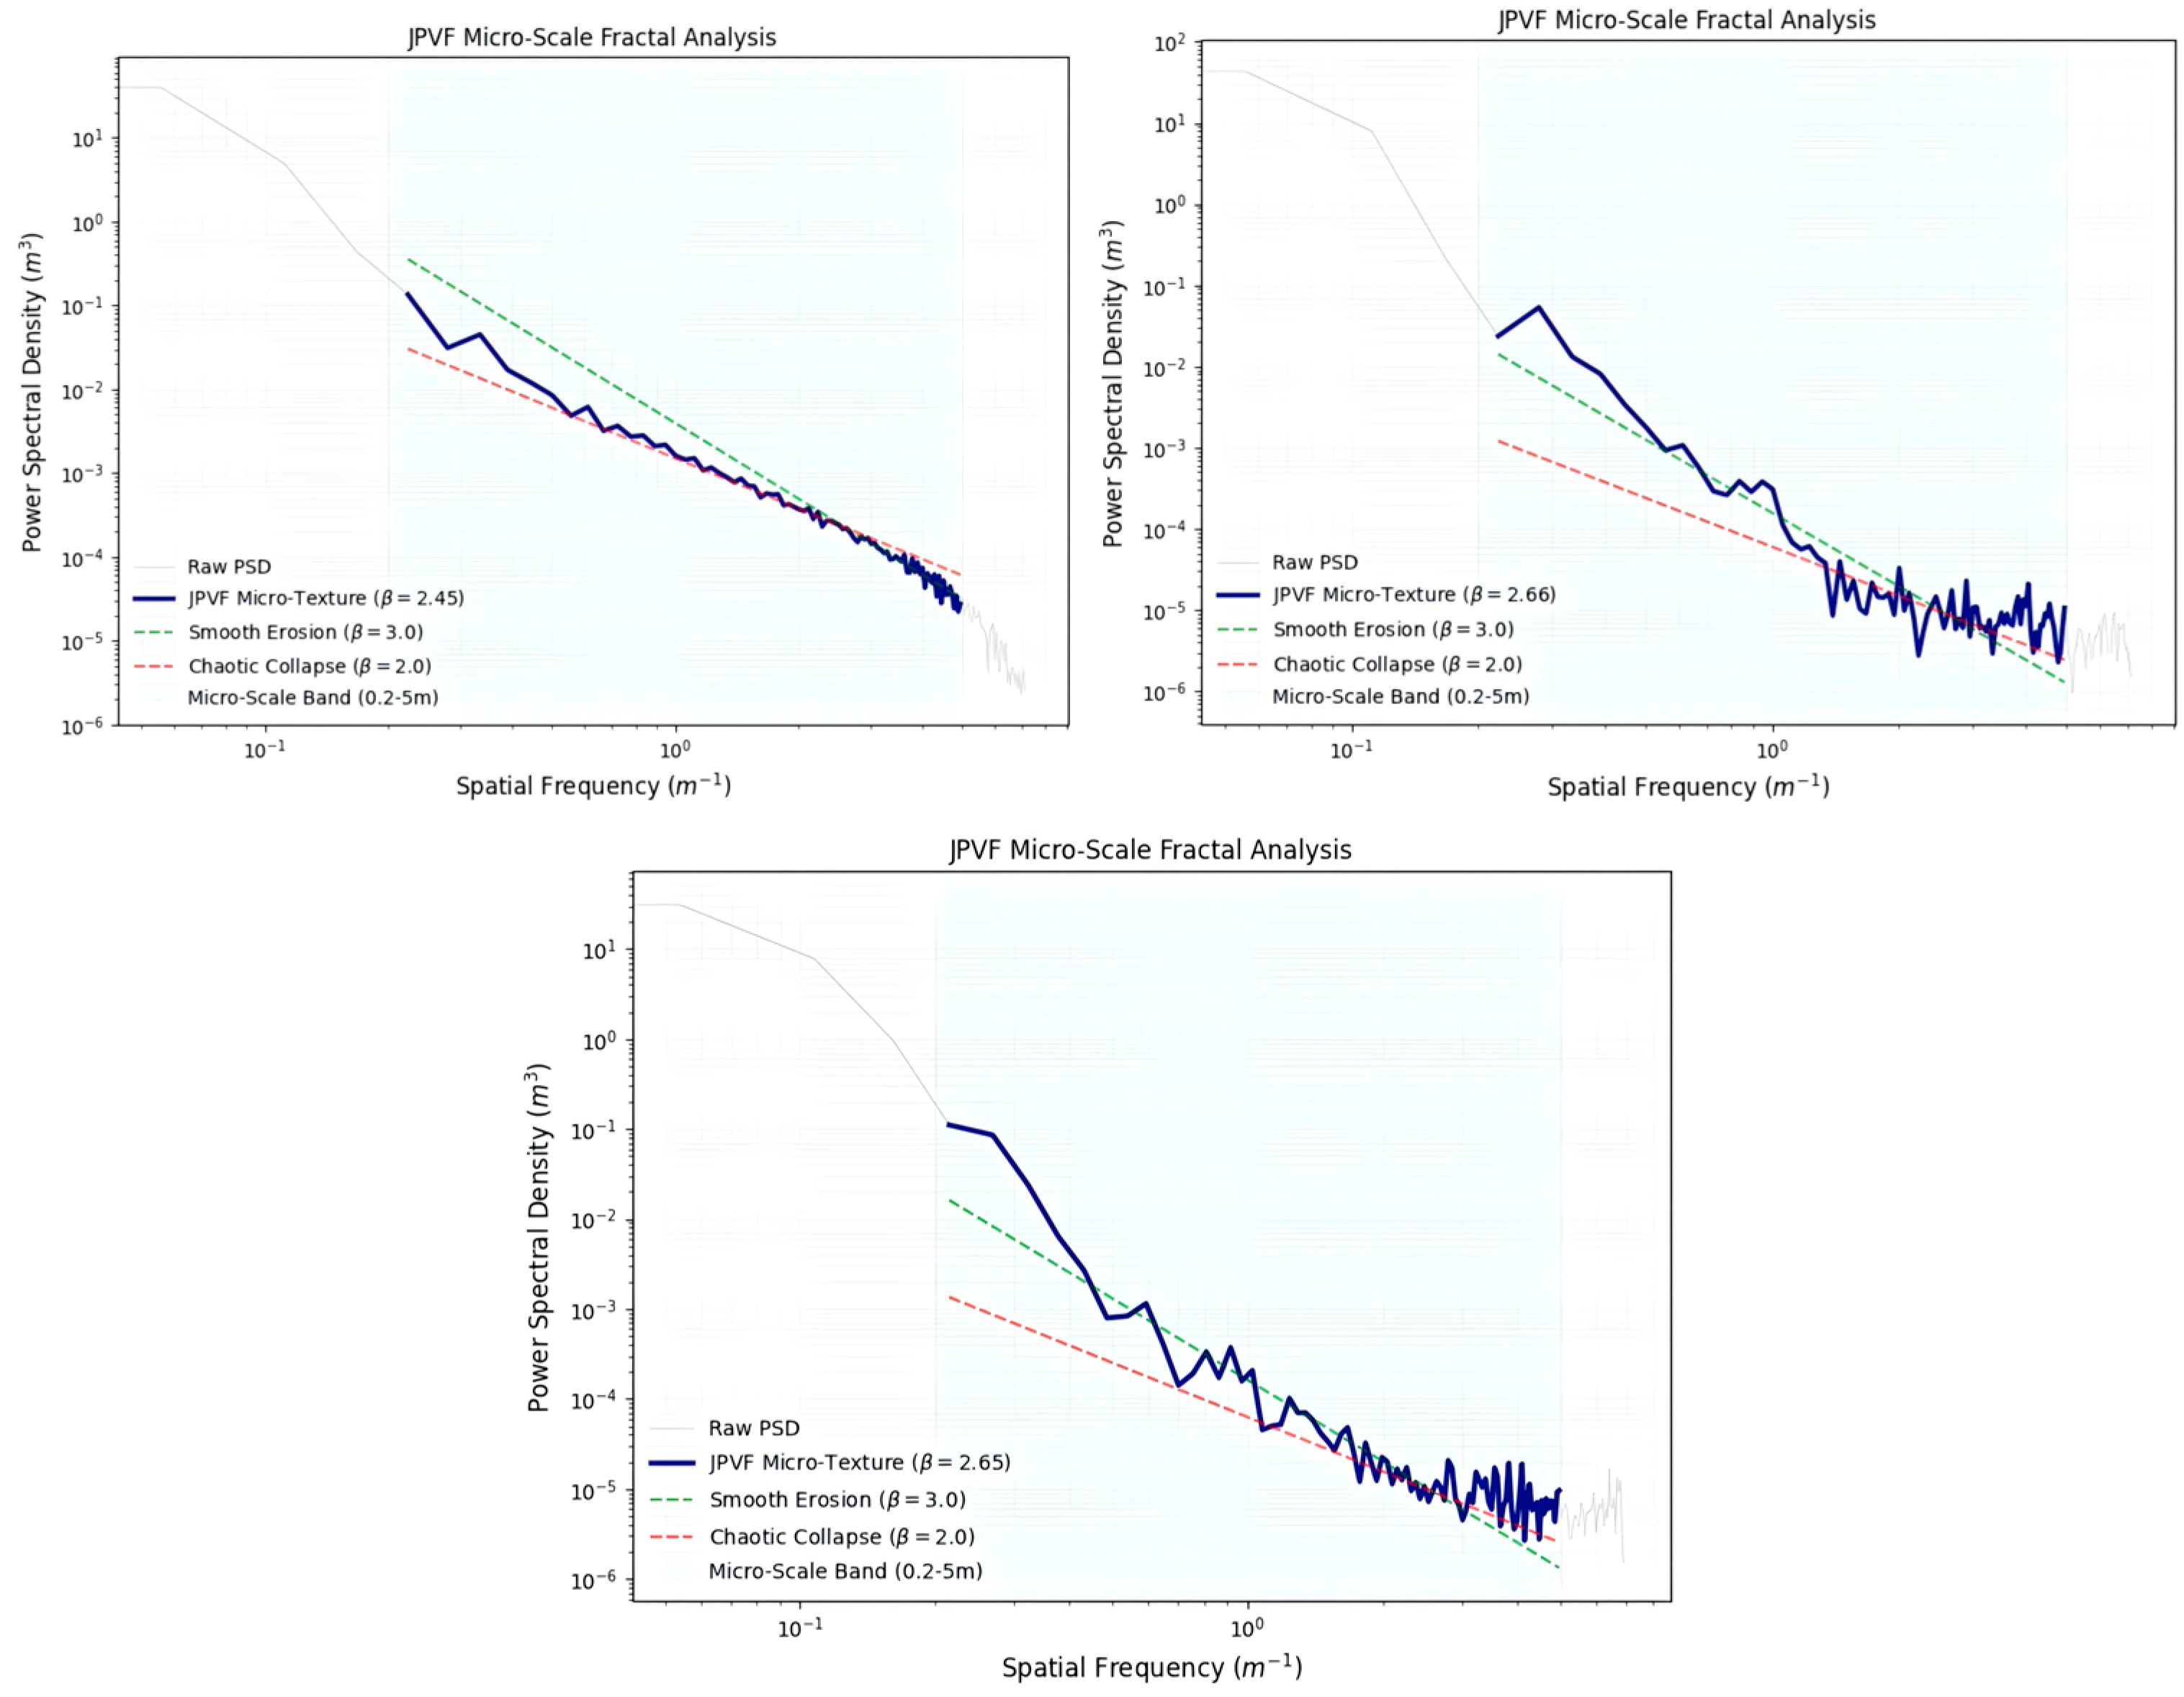
The power spectral density analysis reveals a striking structural coherence between the lunar and terrestrial datasets that transcends the order-of-magnitude difference in their physical dimensions. The longitudinal profiles of Rima Marius exhibit a robust scale-invariant behavior in the low-frequency domain characterized by a mean spectral exponent β of approximately 2.15, with individual sections ranging from 2.08 to 2.20 as shown in Figure 19. This value aligns strictly with the theoretical signature of Pink Noise ( β 2.0 ), which is physically indicative of a stochastic random walk process driven by the accumulation of discrete, large-scale failure events rather than continuous fluid abrasion. In the complementary high-frequency domain, the terrestrial collapse chain at Jingpo Lake maintains this fractal behavior but yields a slightly steeper mean exponent of approximately 2.58, with local variations between 2.45 and 2.66 as shown in Figure 20. It is critical to note that both measured values fall well below the spectral threshold of 3.0 required for smooth fluid erosion signatures. When synthesized into a single spectral plot, these two datasets populate distinct yet connected ends of the spatial frequency spectrum, where the lunar data captures the macroscopic skeleton of the collapse geometry and the terrestrial data resolves the microscopic skin of the surface roughness. The observed transition from a beta value of 2.15 on the Moon to 2.58 on Earth represents a continuous fractal scaling law that links the kilometer-scale periodicity of lunar rilles to the decimeter-scale roughness of terrestrial lava flows.
Beyond gravitational factors, the observed divergence in spectral exponents ( β E a r t h 2.58   &   β M o o n 2.15 ) is also attributable to Surface Process Modification. The terrestrial spectral signature is inevitably modulated by the biosphere and atmospheric weathering; the accumulation of soil and vegetation in rock interstices tends to ‘smooth’ the high-frequency roughness, artificially steepening the spectral slope. We hypothesize that if the signals from fine-grained organic materials could be algorithmically stripped to reveal only the skeletal basaltic boulders, the terrestrial β value would likely converge closer to the lunar value of 2.15. Thus, the current terrestrial dataset represents a ‘damped’ fractal system compared to the ‘raw’ fracture mechanics preserved in the lunar vacuum.

4.3. Characterization of Skylights and Associated Geologic Features

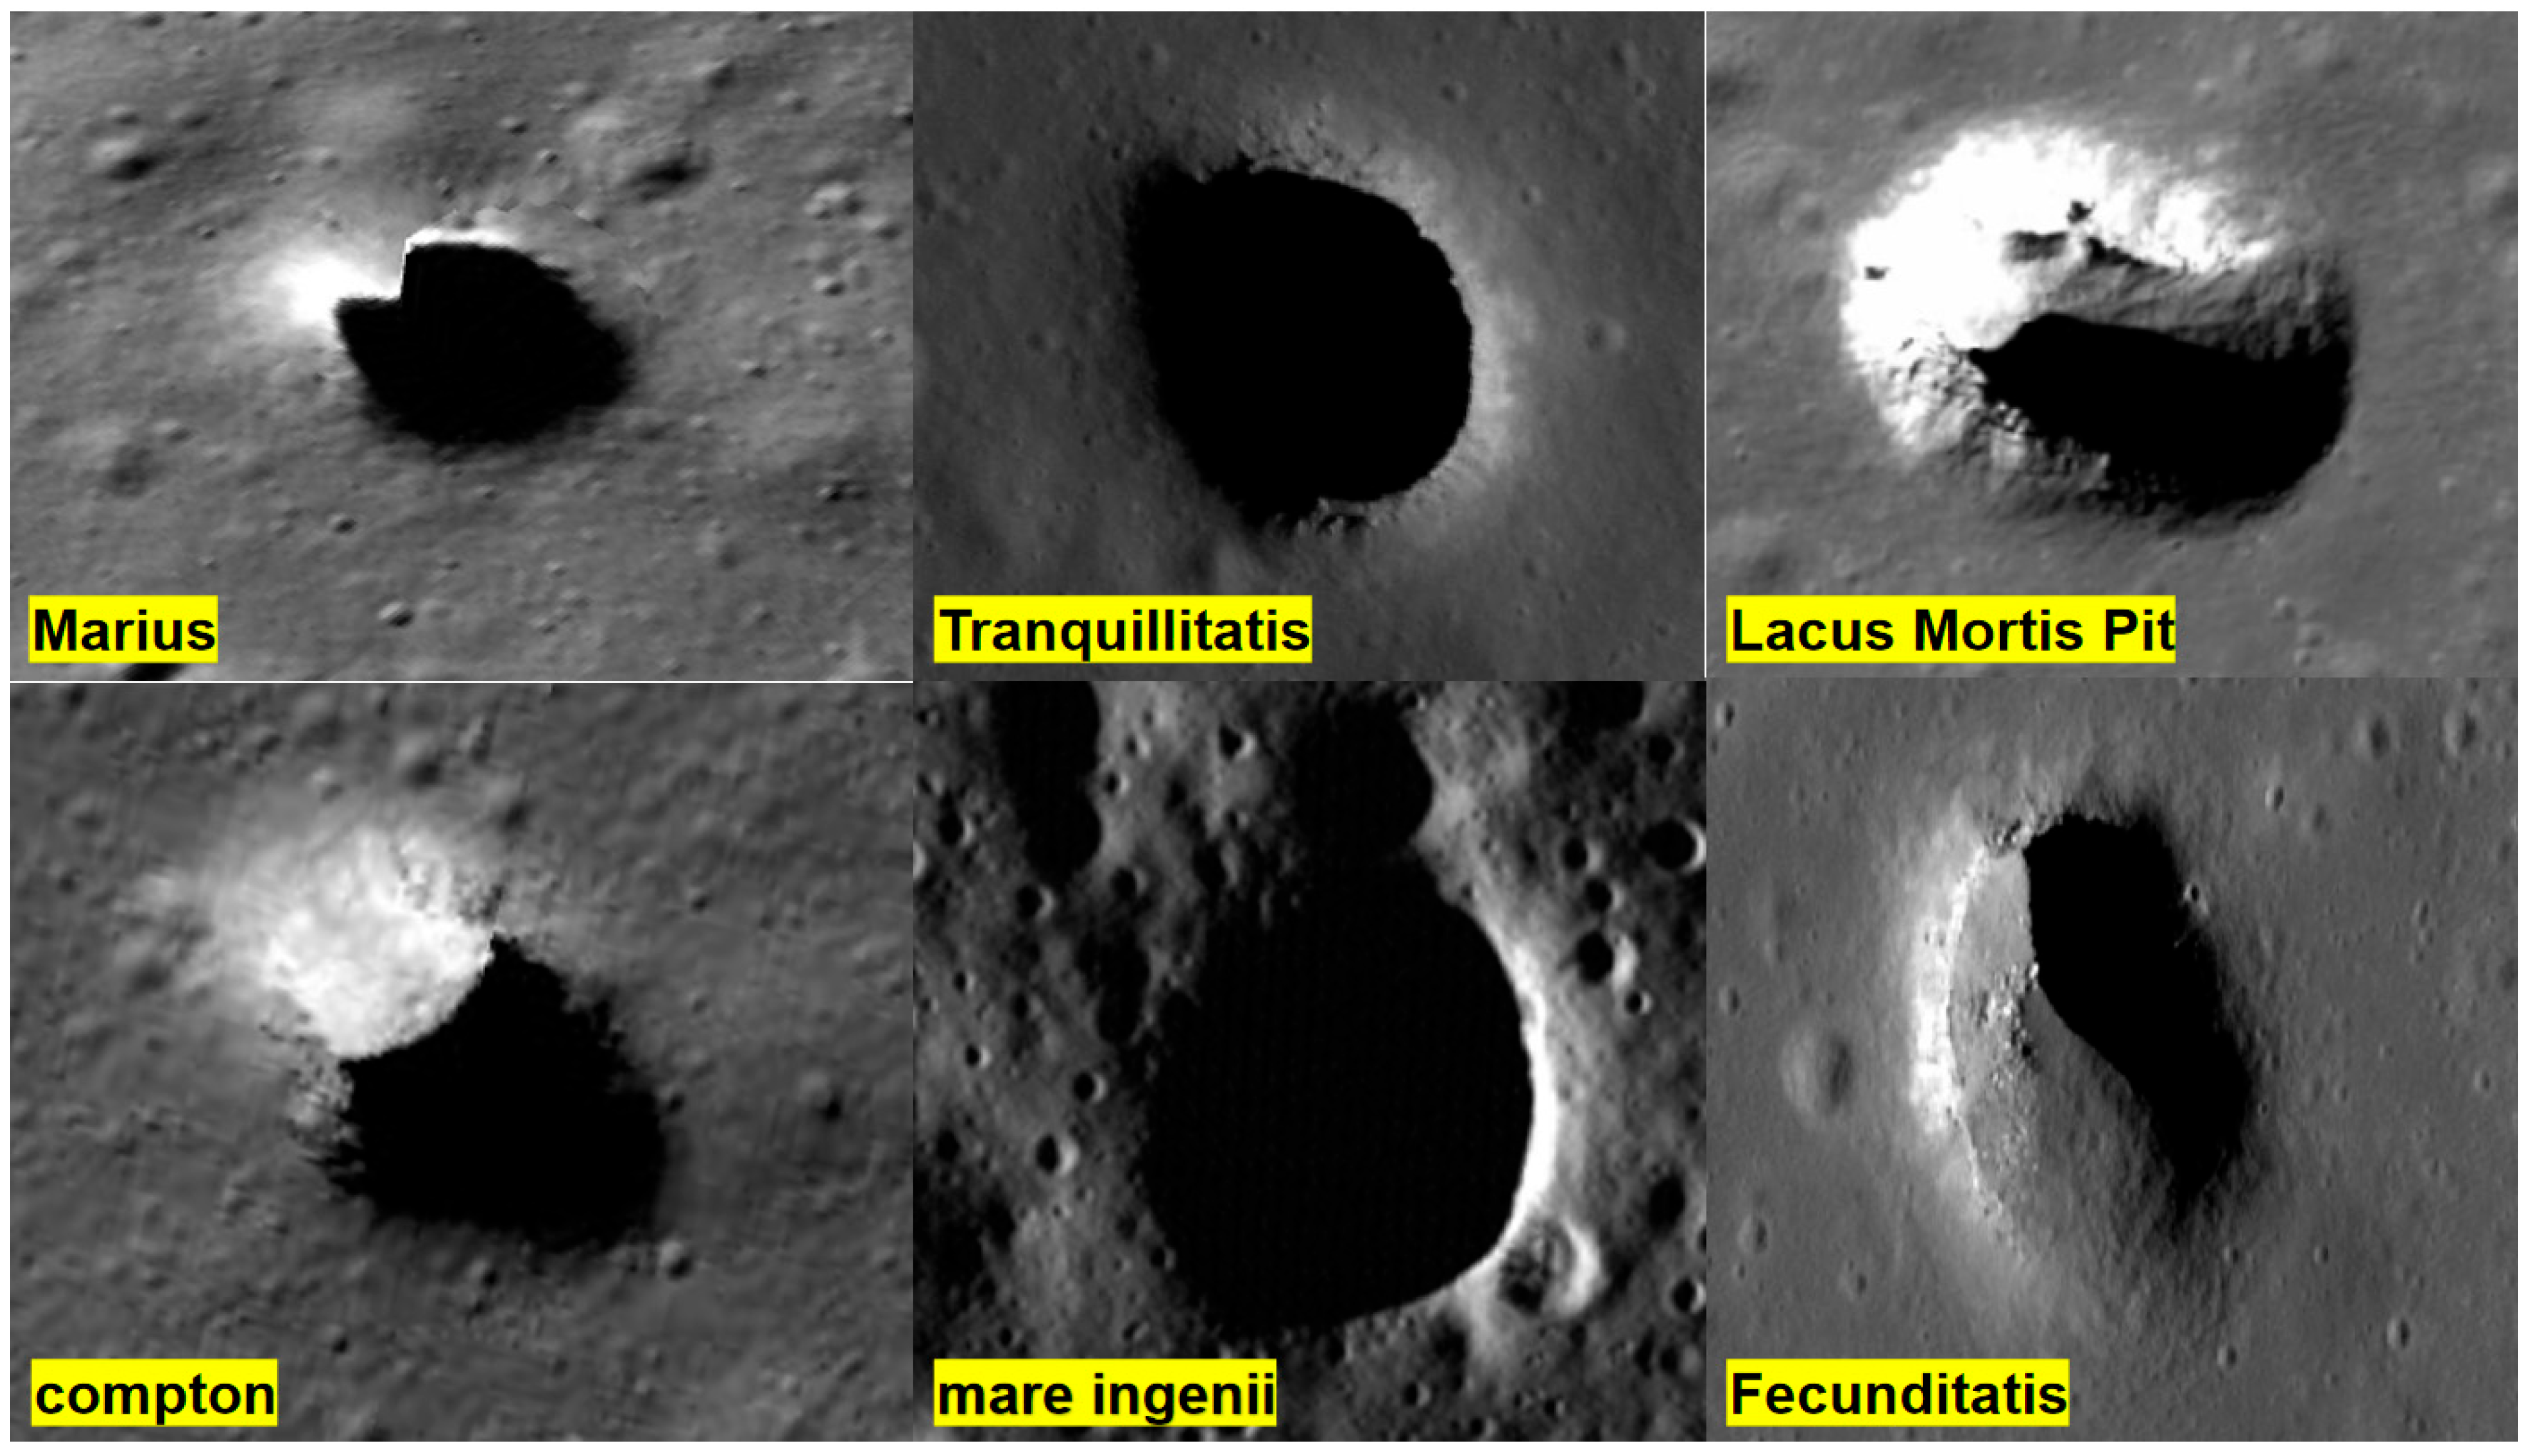
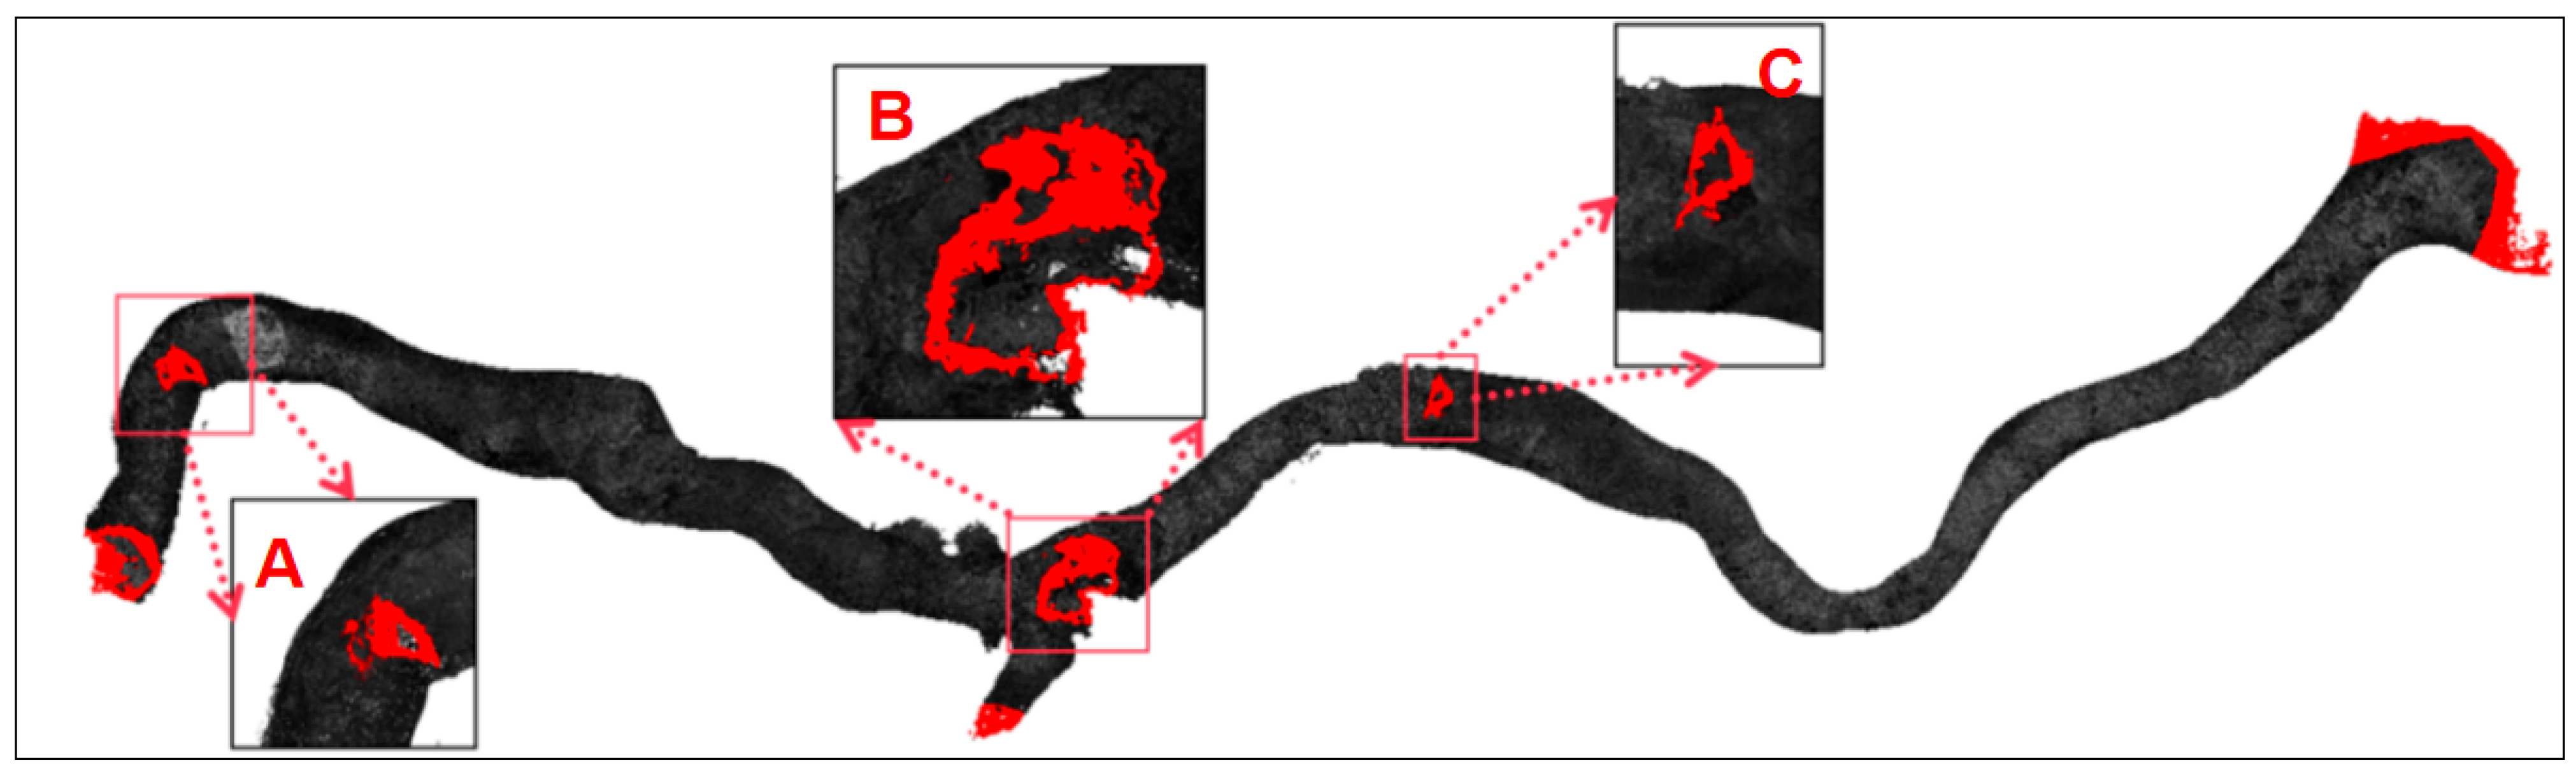
Validating the JLVF as a high-fidelity planetary analog requires situating its features within the broader morphometric context of the lunar inventory. Rather than relying on a singular comparison, we extracted some lava tube skylights from Jingpo Lake and classified the three extracted skylights as skylight A, skylight B, and skylight C as shown in Figure 21. A comprehensive analysis of the six principal lunar mare pits identified by LROC NAC reveals a distinct structural bimodality driven by the Moon’s unique lithostatic conditions ( g = 1.62   m / s 2 ) as shown in Figure 22. The population bifurcates into Class I “deep shafts”, typified by the Marius Hills Hole (MHH) and Mare Tranquillitatis Hole, which exhibit high depth-to-diameter ratios ( d / D > 0.8 ) and steep, rimless walls indicative of stable arch mechanics under thick basaltic roofs; we have summarized the 6 lunar skylight and 3 JLVF lunar skylight as shown in Table 3. Conversely, Class II “Funnel Pits,” such as those in Lacus Mortis and Mare Fecunditatis, display lower aspect ratios ( d / D < 0.5 ) with significant debris ramps, representing a more advanced stage of degradation or roof failure in thinner crustal units.
Although terrestrial analogs are geometrically scaled down by an order of magnitude due to higher gravity ( g = 9.8   m / s 2 ) and the rheological constraints of Holocene pahoehoe flows, the JLVF inventory remarkably reproduces the dimensionless geometric signatures of both lunar classes (Table 3). The terrestrial morphometric domain is anchored by Skylight B, which serves as a structural end-member for the Class II lunar pits. With a wide, elliptical aperture ( D 5.6 ) but limited vertical relief ( d / D < 0.5 ), Skylight B mirrors the “roof-failure” morphology of the Lacus Mortis pit, where the span exceeded the crust’s critical yield strength, resulting in a debris-floored depression ideal for analyzing rover mobility on shallow gradients.
In contrast, Skylights A and C delineate the high-aspect-ratio domain corresponding to the Class I lunar shafts. Despite their diminutive apertures ( D < 1.8   m ), these vents preserve a coherent vertical morphology with depths exceeding twice their width ( d / D > 2.0 ). This “canyon-like” confinement structurally mimics the severe verticality of the Marius Hills and Mare Tranquillitatis pits, reproducing the specific engineering hazards of line-of-sight occlusion and tether friction absent in broader collapse features. Consequently, the JLVF system does not merely offer a singular analog but provides a complete morphometric portfolio: the spectrum of terrestrial vents effectively brackets the geometric diversity of the known lunar skylight population ( d / D range of 0.5–2.1 and Lunar 0.3–1.3), confirming that the distinct mechanical failure modes observed on the Moon are physically replicable in terrestrial basaltic settings. This dual-class fidelity establishes JLVF as a comprehensive testbed, capable of validating mission concepts targeting both the deep, pristine shafts of the Marius Hills and the accessible, ramped entrances of Lacus Mortis.
To further interrogate the formation mechanics and evolutionary maturity of these analogs, we extended the analysis using the Ellipticity and Circularity indices defined in our methodology. The Ellipticity Index effectively decouples stochastic roof failures from tectonically controlled collapse. The Class I lunar shafts (MHH) are characterized by low ellipticity ( E 0.12 ), consistent with a “punch-out” failure mode typical of a stable arch unperturbed by regional stress. Remarkably, the JLVF high-aspect-ratio vents (Skylights A and C) reproduce this structural signature with similarly low values (E ≈ 0.15–0.18), confirming their origin via localized roof puncturing or gas venting rather than linear fissure extension. In stark contrast, the Class II analog, Skylight B, exhibits a significantly higher ellipticity ( E 0.46 ), implying a structural coalescence along the tube axis ( E 1 ). This elongation is physically homologous to the collapse trenches observed in the Schrödinger Basin rilles, validating Skylight B as a representative model for tectonically influenced or widened lunar pits.
The degradation state of the rim, quantified by the Circularity Index, offers a critical boundary condition for sensor validation. While ancient lunar pits exhibit high circularity ( C > 0.9 ) due to eons of micrometeoroid smoothing, the JLVF skylights display a slightly reduced but coherent circularity (C ≈ 0.82–0.88). This specific morphometric divergence is scientifically advantageous: it signifies that the terrestrial rims retain the high-frequency roughness (jaggedness) characteristic of fresh basaltic fractures. By validating navigation and edge-detection algorithms against the complex, lower-circularity margins of JLVF, future missions can ensure robust performance against the “worst-case” sharp edges likely to be encountered in pristine, non-degraded sections of lunar lava tubes, establishing JLVF as a conservative and rigorous testbed for autonomous entry operations.

5. Discussion

5.1. Lava Plateaus as Potential Applications of Surface Contrast Fields in Lunar Volcanic Regions

The validation of the JLVF as a high-fidelity planetary analog rests on a fundamental re-evaluation of how basaltic lava plateaus are characterized across varying gravitational and observational scales. While the geochemical composition of the JLVF alkali olivine basalts differs from the tholeiitic basalts dominant in the lunar maria, specifically the Marius Hills region, their rheological behaviors during emplacement are remarkably convergent [46]. Both magmatic systems erupted at high temperatures exceeding 1100 °C with low viscosity, a critical fluid dynamic trait that facilitates the formation of extensive, flat lava sheets rather than steep stratovolcanic cones [4]. This shared emplacement mechanism suggests that the surface textures observed at JLVF are not unique terrestrial anomalies but are products of universal fluid dynamics—specifically the interplay between shear stress and cooling rates—that are likely replicated on the Moon [25].
A primary insight derived from the JLVF lava terraces is the omnipresence of the “Laminar Pahoehoe” facies, which serves as a fossilized record of the inflation mechanism. In the terrestrial field [33,47], this texture manifests as decimeter-scale ropy ridges with wavelengths of 10–30 cm and amplitudes of 2–5 cm, formed by the compressional folding of a viscoelastic crust over a flowing liquid core. Critically, current orbital sensors studying the Moon, such as the LROC NAC, typically possess a resolution limit of 2–5 m per pixel, which fundamentally fails to resolve these sub-meter textural intricacies [48]. Consequently, the vast lunar mare plains are often classified as “smooth” or featureless in orbital datasets solely due to this resolution gap. The JLVF ground-truth data challenges this assumption, suggesting that the “smooth” radar-dark regions of the lunar maria are likely not featureless plains, but are instead characterized by complex networks of micro-scale ropy ridges and solidified turbulence [49].
This realization has profound implications for the interpretation of lunar volcanic history. The presence of such textures indicates that the lunar lava flows, much like their terrestrial counterparts, utilized an efficient thermal insulation mechanism. The rapidly solidified surface crust observed at JLVF acts as an insulating carapace, minimizing radiative heat loss and allowing the internal fluid core to remain active over distances exceeding 26 km. If similar inflation horizons exist on the Moon, as the rheological similarities suggest, it implies that lunar flood basalts could have been emplaced over vast distances not merely due to high effusion rates, but through the development of sophisticated, self-insulating sheet flow systems. Therefore, the JLVF lava plateau serves as a critical “super-resolution” template: by mathematically inverting the known noise patterns and roughness signatures of these terrestrial basalts, planetary scientists can predict the sub-pixel roughness of lunar landing sites, transitioning from a model of idealized flatness to one of realistic, rugged micro-topography.
Beyond surface texture, the internal architecture of the JLVF lava plateau reveals a distinct class of structural hazards and opportunities that are largely invisible to orbital reconnaissance but are critical for surface operations. The process of inflation—where internal hydrostatic pressure uplifts the solidifying crust to form a flat-topped plateau—inevitably generates significant geomechanical instability. At JLVF, this results in the formation of “Inflation Fissures,” which are deep, linear axial clefts ranging from decimeters to meters in width that penetrate the upper crust. Furthermore, the margins of these inflated lobes frequently host “Lateral Subsurface Cavities,” which are horizontal or oblique voids preserved beneath the solidified crustal shelf where the liquid core has partially drained.
These morphological features represent a “blind spot” in current lunar exploration strategies. Unlike the massive vertical collapse pits (skylights) that are easily identified in nadir-viewing orbital imagery, these fissures and lateral cavities are effectively invisible from space due to their narrow apertures and the shadowing effects of overhanging crust. On the Moon, similar features are likely widespread along the margins of inflated sheet flows and the crests of wrinkle ridges. For a lunar rover, these cryptic features function as “stealth traps,” presenting a severe entrapment risk in terrain that orbital data would otherwise classify as safe, flat plains. A wheel designed for regolith trafficability may face catastrophic failure when encountering the sharp, brittle edges of a hidden inflation fissure.
However, these features also present a unique scientific opportunity. The lateral cavities observed at JLVF function as natural, non-collapsed entrances to the subsurface environment. Unlike vertical skylights, which require complex winching systems or rappelling technologies to access, these side-openings offer accessible, ramp-like entry points. This suggests that future lunar missions targeting the margins of mare basalt flows could potentially access shielded subsurface environments using standard micro-rovers, bypassing the immense engineering challenge of descending into deep vertical shafts.
In this context, the JLVF lava plateau functions as a “conservative surface contrast field” or a “worst-case” boundary condition for engineering validation. The terrain exhibits steeper slopes (mean 14.16°) and higher obstacle frequency than average lunar conditions due to the lack of impact gardening [44]. A mobility system that can successfully navigate the labyrinthine fracture networks and brittle auto-breccia of the JLVF plateau inherits a significant safety margin when deployed to the impact-smoothed lunar surface.

5.2. Geomorphological Implications: The Tube-Fed Origin of Sinuous Rilles

The debate regarding the genesis of lunar sinuous rilles has persisted for decades, bifurcating into two competing paradigms: the “thermal erosion model,” which postulates open-tube incision driven by turbulent, superheated low-viscosity lava, and the “collapsed tube model,” which argues for the catastrophic structural failure of roofed conduits. While planimetric geometries—such as meandering sinuosity—often yield ambiguous interpretations applicable to both surface tubes and subsurface tubes, the longitudinal floor topography analyzed a definitive, quantitative discriminator between these divergent mechanisms [12,15]. By integrating the high-resolution terrestrial ground-truth from the JLVF with the LROC NAC profiles of Rima Marius, we identify a specific geomorphic signature suggesting that the hydrodynamic equilibrium of thermal erosion alone is insufficient to explain the observed floor topography [50].
Theoretical fluid dynamics dictates that a thermally eroding open tube, functioning under gravity-driven flow, inevitably evolves towards a “graded profile.” In this regime, the continuous shear stress of the flowing lava acts to abrade bedrock irregularities, smoothing the thalweg (tube floor) to minimize hydraulic resistance and establish thermal equilibrium. Consequently, if Rima Marius were formed primarily by surface incineration, its longitudinal profile should exhibit a monotonic, smooth gradient with minimal high-frequency roughness [3,4]. However, the empirical data presented in Figure 18 reveal a significantly more complex reality. The longitudinal profile of Rima Marius is characterized by a distinct, quasi-periodic undulation pattern, displaying macroscopic elevation anomalies with vertical amplitudes of 10–15 m over kilometer-scale wavelengths. These rhythmic topographic highs are mechanically inconsistent with the behavior of a cooling lava stream; viscosity fluctuations or flow surges typically produce lobate, overlapping flow fronts rather than the chaotic, blocky variance observed. Instead, this ‘hummocky’ signature implies that while thermal erosion likely initiated the tube incision, a subsequent stochastic depositional process (roof collapse) has overprinted the original bed [51], becoming the dominant factor in the rille’s present-day morphology [50].
The physical validity of this interpretation is rigorously corroborated by the JLVF analog. At the terrestrial site, where the transition from intact tube to collapsed trench is structurally continuous, our ground-truth survey confirms that the observed longitudinal roughness (elevation variances of 2–4 m) is the direct geomorphic expression of discrete roof collapse events. The topographic peaks along the trench floor correspond precisely to talus cones—pyramidal accumulations of collapsed roof blocks—while the troughs represent structural “bridges” or zones of lesser debris accumulation. Crucially, the “spectral homology” identified between the terrestrial and lunar datasets demonstrates that this morphological fingerprint is scale-invariant. The Rima Marius profile reproduces the stochastic roughness of the JLVF collapse chain with high fidelity, merely scaled up by the lower lunar gravity and thicker distinct crustal units. This spectral alignment serves as a “fossilized kinematic record,” indicating that the visible floor of the lunar rille is not a pristine tube bed but a chaotic graveyard of foundered roof blocks.
Furthermore, this longitudinal evidence seamlessly integrates with the transverse geometric constraints established. The “U-to-V” transition observed in the cross-sectional profiles of both JLVF and Rima Marius reinforces the collapse model. An erosional tube would typically maintain a U-shaped or parabolic cross-section governed by fluid shear. In contrast, the V-shaped floors observed in our data are depositional features, formed by the bi-directional accumulation of talus from the collapsing sidewalls, governed strictly by the angle of repose for basaltic rubble (~30–35°). The synthesis of these longitudinal and transverse morphometric signatures leads to a refined geological conclusion, supporting a coupled ‘Erosion-Collapse’ evolutionary model. We propose that thermal erosion provided the requisite laminar flow conditions for tube formation, while catastrophic roof collapse is the primary mechanism responsible for the chaotic floor textures observed today. This evolutionary sequence is visually synthesized in Figure 23. While previous models often treated thermal erosion and tube collapse as mutually exclusive origins, our data suggest they are sequential stages of the same lifecycle.
This implies that the observed trench is not the product of surficial downcutting alone, but the result of a “chain of collapses” where a once-competent roofed conduit has undergone catastrophic failure, coalescing into a continuous linear depression. Therefore, the “tube” visible from orbit is physically a “roofless tube,” and its floor roughness is the primary diagnostic evidence of its subsurface origin, validating the JLVF pit chain as the precise evolutionary analog for these lunar megastructures. When comparing the transverse profiles, it is critical to account for the immense chronological disparity between the two datasets. The JLVF skylights represent a ‘fresh’ collapse state, retaining steep, pristine shear walls. In contrast, the lunar rilles are ancient features (>3 Ga) that have undergone extensive slope degradation driven by micrometeoroid bombardment (Impact Gardening) [51].
We propose that the wider, flatter ‘U-shape’ of the lunar rilles is not solely a primary formation feature but the result of diffusive mass wasting over billions of years. By applying a Slope Diffusion Model, one could theoretically infer that the primitive morphology of the Marius Hills was significantly deeper and steeper—structurally homologous to the current JLVF pits. Therefore, the terrestrial analog serves as a proxy for the initial state of the lunar rille collapse, before the ‘geological blurring’ of deep time took effect.

6. Summary and Outlook

As the strategic frontier of lunar exploration transitions from the ephemeral orbital reconnaissance of the Apollo era to the sustained surface operations envisioned by the Artemis program and the International Lunar Research Station (ILRS), the planetary science community confronts a critical epistemological barrier known as the “resolution gap”. Current orbital sensors, while capable of mapping the Moon at meter-scales, fundamentally fail to resolve the decimeter-scale regolith textures and subsurface geometries that govern the safety of rover mobility and the structural stability of underground habitats. This study bridges this divide by validating the JLVF not merely as a visual lookalike, but as a high-fidelity process analog that preserves the physical fingerprints of lunar volcanism across distinct gravitational environments. Through a rigorous, multi-dimensional morphometric framework integrating UAV photogrammetry, handheld LiDAR, and theoretical scaling laws, we demonstrate that the Holocene basaltic flows of Northeast China function as a dynamic, fractal laboratory capable of simulating the complex interplay between volcanic construction and mechanical degradation on the Moon.
Our comparative investigation resolves the long-standing dichotomy regarding the genesis of lunar sinuous rilles by proposing a unified, coupled evolutionary paradigm. While theoretical fluid dynamics suggests that thermal erosion by low-viscosity lava is essential for the initial incision of these meandering tubes, our Power Spectral Density (PSD) analysis of the Marius Hills floor reveals a quasi-periodic “hummocky” topography that defies the hydraulic equilibrium of a pure erosion model. By correlating this lunar signature with the ground-truth stratigraphy of the JLVF collapse chain, we identify these floor undulations as the fossilized kinematic record of discrete roof failure events. Thus, we argue that sinuous rilles are products of a hybrid mechanism: thermal erosion provided the requisite depth and stable laminar flow conditions for tube formation, while the subsequent catastrophic unzipping of the roof created the chaotic, debris-filled trench observed today. This redefinition fundamentally shifts exploration strategies, indicating that rille floors are not pristine highways but chaotic graveyards of unstable macro-debris, necessitating a pivot from simple wheel-based traversal to complex obstacle-negotiation capabilities.
Beyond geometric morphology, this study establishes a novel rheological correspondence between the terrestrial cryosphere and the lunar regolith. We identify the seasonal snowpack at JLVF as a superior physical proxy for lunar soil compared to traditional dry sand simulants. The thermodynamic sintering of ice grains in the winter snowpack creates microscopic bonds that replicate the interlocking cohesion of vacuum-welded lunar agglutinates, while the low density of the snow naturally compensates for Earth’s higher gravity, aligning the soil’s self-weight stress gradient with lunar conditions. This finding transforms JLVF into a unique “all-season” testbed where the “soft-over-hard” stratigraphy of snow mantling basaltic bedrock accurately simulates the deceptive nature of the regolith-covered lunar maria. This analog environment is critical for calibrating Ground Penetrating Radar (GPR) algorithms, challenging them to detect subsurface voids through a volume-scattering medium that physically mimics the electromagnetic clutter of the lunar subsurface.
The morphometric divergences identified in this study—specifically the steeper slopes and higher obstacle frequency at JLVF—constitute its value as a “conservative surface contrast field”. We demonstrate that the JLVF terrain functions as a geometric superset of the lunar maria, representing a “worst-case” boundary condition. A mobility system verified against the sharp, unweathered inflation tumuli and the labyrinthine fracture networks of JLVF inherits a significant safety margin when deployed to the impact-smoothed lunar surface. This explicitly validates the site for stress-testing next-generation rover chassis and autonomous navigation algorithms, ensuring they are robust enough to conquer the “Yellow Zone” of brittle auto-breccia and the “Red Zone” of gravitational talus slopes where slip ratios frequently exceed critical thresholds.
Looking forward, the high-fidelity analog data generated at JLVF provides the foundation for a new generation of data-driven lunar exploration tools. The paired datasets of noisy orbital-scale simulations and pristine ground-truth scans offer an ideal training ground for Deep Learning algorithms aimed at “super-resolution” de-noising of existing LROC imagery. By mathematically inverting the noise patterns characterized at JLVF, we can potentially reveal sub-pixel roughness features on the Moon before a rover ever touches down. Furthermore, the structural homology of the JLVF skylights, which reproduce the aspect ratios of both the deep Marius Hills shafts and the wider Lacus Mortis pits, positions the site as a premier training ground for cave-entry technologies. As humanity prepares to return to the Moon to stay, the JLVF stands as a critical bridge between Earth-bound testing and extraterrestrial reality, ensuring that our systems are designed not for an idealized model, but for the rugged, magnificent complexity of the lunar frontier.

Author Contributions

Conceptualization, H.Y. and Z.K.; Methodology, H.Y., T.H. and Z.K.; Software, H.Y. and L.Q.; Validation, T.H.; Formal analysis, H.Y. and T.H.; Investigation, H.Y., T.H., L.G., C.P., C.Y. and H.H.; Resources, Z.K.; Data curation, H.Y., L.G., L.Q., C.P., C.Y. and H.H.; Writing—original draft, H.Y. and L.Q.; Writing—review & editing, T.H. and Z.K.; Visualization, H.Y., L.G., L.Q., C.P., C.Y. and H.H.; Supervision, Z.K.; Project administration, Z.K.; Funding acquisition, Z.K. All authors have read and agreed to the published version of the manuscript.

Funding

This research was funded by Major Program of the National Natural Science Foundation of China, Grant No. 62495033; National Natural Science Foundation of China, Grant No. 42371453.

Data Availability Statement

The original contributions presented in the study are included in the article, further inquiries can be directed to the corresponding author.

Conflicts of Interest

The authors declare no conflict of interest.

References

  1. Hargitai, H.; Kereszturi, Á. (Eds.) Encyclopedia of Planetary Landforms; Springer: New York, NY, USA, 2015. [Google Scholar] [CrossRef]
  2. Spudis, P.D.; Swann, G.A.; Greeley, R. The formation of Hadley Rille and implications for the geology of the Apollo 15 region. Lunar Planet. Sci. Conf. Proc. 1988, 18, 243–254. [Google Scholar]
  3. Oberbeck, V.R.; Quaide, W.L.; Greeley, R. On the origin of lunar sinuous rilles. Mod. Geol. 1969, 1, 75–80. [Google Scholar]
  4. Greeley, R. Lava tubes and channels in the lunar Marius Hills. Moon 1971, 3, 289–314. [Google Scholar] [CrossRef]
  5. Cruikshank, D.P.; Wood, C.A. Lunar rilles and Hawaiian volcanic features: Possible analogues. Moon 1972, 3, 412–447. [Google Scholar] [CrossRef]
  6. Kaku, T.; Haruyama, J.; Miyake, W.; Kumamoto, A.; Ishiyama, K.; Nishibori, T.; Yamamoto, K.; Crites, S.T.; Michikami, T.; Yokota, Y. Detection of intact lava tubes at Marius Hills on the Moon by SELENE (Kaguya) Lunar Radar Sounder. Geophys. Res. Lett. 2017, 44, 10155–10161. [Google Scholar] [CrossRef]
  7. Haruyama, J.; Hioki, K.; Shirao, M.; Morota, T.; Hiesinger, H.; van der Bogert, C.H.; Miyamoto, H.; Iwasaki, A.; Yokota, Y.; Ohtake, M. Possible lunar lava tube skylight observed by SELENE cameras. Geophys. Res. Lett. 2009, 36, L21206. [Google Scholar] [CrossRef]
  8. Sood, R.; Chappaz, L.; Melosh, H.J.; Howell, K.C.; Milbury, C. Detection of Buried Empty Lunar Lava Tubes Using GRAIL Gravity Data. In Proceedings of the 47th Lunar and Planetary Science Conference, The Woodlands, TX, USA, 21–25 March 2016; p. 1509. [Google Scholar]
  9. Chappaz, L.; Sood, R.; Melosh, H.J.; Howell, K.C.; Blair, D.M.; Milbury, C.; Zuber, M.T. Evidence of large empty lava tubes on the Moon using GRAIL gravity. Geophys. Res. Lett. 2017, 44, 105–112. [Google Scholar] [CrossRef]
  10. Cushing, G.E.; Titus, T.N.; Wynne, J.J.; Christensen, P.R. THEMIS observes possible cave skylights on Mars. Geophys. Res. Lett. 2007, 34, L17201. [Google Scholar] [CrossRef]
  11. Cushing, G.E. Candidate cave entrances on Mars. J. Cave Karst Stud. 2012, 74, 33–47. [Google Scholar] [CrossRef]
  12. Hulme, G. Turbulent lava flow and the formation of lunar sinuous rilles. Mod. Geol. 1973, 4, 107–118. [Google Scholar]
  13. Carr, M.H. The role of lava erosion in the formation of lunar rilles and Martian channels. Icarus 1974, 22, 1–23. [Google Scholar] [CrossRef]
  14. Head, J.W.; Wilson, L. Lunar sinuous rille formation by thermal erosion: Eruption conditions, rates and durations. Lunar Planet. Sci. Conf. 1981, 12, 427–429. [Google Scholar]
  15. Williams, D.A.; Fagents, S.A.; Greeley, R. A reevaluation of the emplacement and erosional potential of turbulent, low-viscosity lavas on the Moon. J. Geophys. Res. Planets 2000, 105, 20189–20205. [Google Scholar] [CrossRef]
  16. Brož, P.; Bohacek, P.; Kereszturi, A.; Hargitai, H. LUnar Geology Orbiter concept to study lunar Irregular Mare Patches and lava tubes from orbit. Acta Astronaut. 2025, 234, 154–174. [Google Scholar] [CrossRef]
  17. Allred, K.; Allred, C. Development and morphology of Kazumura Cave, Hawaii. J. Cave Karst Stud. 1997, 59, 67–80. [Google Scholar]
  18. Sauro, F.; Pozzobon, R.; Massironi, M.; De Berardinis, P.; Santagata, T.; De Waele, J. Lava tubes on Earth, Moon and Mars: A review on their size and morphology revealed by comparative planetology. Earth-Sci. Rev. 2020, 209, 103288. [Google Scholar] [CrossRef]
  19. Carracedo, J.C.; Paterne, M.; Guillou, H.; Perez Torrado, F.J.; Paris, R.; Rodriguez Badiola, E.; Hansen, A. Dataciones radiométricas (14C y K/Ar) del Teide y el rift noroeste, Tenerife, Islas Canarias. Estud. Geol. 2003, 59, 15–29. [Google Scholar] [CrossRef]
  20. Stefánsson, A.B.; Hróarsson, B.; Gíslason, S.R. The lava caves of Hallmundarhraun. In Proceedings of the 17th International Symposium on Vulcanospeleology, Ocean View, HI, USA, 6–12 February 2016; pp. 26–36. [Google Scholar]
  21. Woo, K.S.; Son, I.; Kim, R.; Kim, L. Geological heritage of the Jeju Island Geopark, Korea. Episodes 2013, 36, 221–230. [Google Scholar]
  22. Dong, Y.L.; Mu, H.X.; Zhang, L.B.; Zhao, Z.W.; Chen, H.X.; Zhao, Z.Z. Investigation of typical lava tubes in Haikou Shishan Volcanic Field Geopark. In 34th Annual Conference of the Tourism Geoscience and Geoparks Research Branch, Geological Society of China: Construction and Tourism Development Seminar of Fujian Longyan Geopark, Longyan, Fujian, China, 2019; Tourism Geoscience and Geoparks Research Branch, Geological Society of China, Chinese Academy of Geological Sciences, People’s Government of Longyan City, Eds.; Tourism Geoscience Series (Volume 26); Chinese Academy of Geological Sciences Institute of Geomechanics: Beijing, China; China Fangshan Global Geopark: Beijing, China; Haikou Shishan Volcanic Field National Geopark: Beijing, China, 2019. [Google Scholar]
  23. Zhan, T.; Zhang, H.Y.; Zhang, J.; Li, E.; Li, X.; Wang, Q.Y.; Wang, K.Y.; Wang, K.M.; Liu, D.Y.; Wang, H. Distribution characteristics and genesis of lava tubes in Jingpo Lake UNESCO Global Geopark. J. Harbin Norm. Univ. (Nat. Sci. Ed.) 2017, 33, 87–93. [Google Scholar]
  24. Chen, H.; Ma, B.; Gao, F. Holocene volcanic eruption characteristics of Jingpo Lake. Earthq. Res. China 2005, 360–368. [Google Scholar]
  25. Fan, Q.C.; Sun, Q.; Li, N.; Yin, J.H.; Chen, H.Z.; Gao, F.; Zhang, X.J. Holocene tephra stratigraphy and eruption history of Jingpo Lake volcanoes. Seismol. Geol. 2003, 25, 3–11. [Google Scholar]
  26. Zhang, M.L.; Wang, X.; Liu, J.Q.; Guo, Z.F. 14C dating of Holocene volcanic rocks of the Jingpohu Region, Heilongjiang Province, and characteristics of their source regions. Acta Geol. Sin. 2000, 74, 279–286. [Google Scholar]
  27. Fan, Q.; Sun, Q.; Li, N.; Wang, T. Holocene volcanic rocks in Jingbo Lake region--diversity of magmatism. Prog. Nat. Sci. 2006, 16, 65–71. [Google Scholar]
  28. Liu, J.; Chu, G.; Han, J.; Rioual, P.; Jiao, W.; Wang, L. Holocene vegetation and climate in Northeast China revealed from Jingbo Lake sediment. Quat. Int. 2011, 229, 67–73. [Google Scholar] [CrossRef]
  29. You, H.-T.; Liu, J.-Q. High-resolution climate evolution derived from the sediment records of Erlongwan Maar Lake since 14 ka BP. Chin. Sci. Bull. 2012, 57, 3610–3616. [Google Scholar] [CrossRef]
  30. Robinson, M.S.; Brylow, S.M.; Tschimmel, M.; Humm, D.; Lawrence, S.J.; Thomas, P.C.; Denevi, B.W.; Bowman-Cisneros, E. Lunar Reconnaissance Orbiter Camera (LROC) instrument overview. Space Sci. Rev. 2010, 150, 81–124. [Google Scholar] [CrossRef]
  31. Whitford-Stark, J.L.; Head, J.W. Stratigraphy of the Marius Hills volcanic province. J. Geophys. Res. Solid Earth 1980, 85, 6579–6609. [Google Scholar]
  32. Carrier, W.D.; Olhoeft, G.R.; Mendell, W.W. Physical Properties of the Lunar Surface Lunar Sourcebook: A User’s Guide to the Moon; Cambridge University Press: Cambridge, UK, 1991; pp. 475–594. [Google Scholar]
  33. Hon, K.; Kauahikaua, J.; Denlinger, R.; Mackay, K. Emplacement and inflation of pahoehoe sheet flows: Observations and measurements of active lava flows on Kilauea Volcano, Hawaii. Geol. Soc. Am. Bull. 1994, 106, 351–370. [Google Scholar] [CrossRef]
  34. Self, S.; Keszthelyi, L.; Thordarson, T. The importance of pahoehoe. Annu. Rev. Earth Planet. Sci. 1998, 26, 81–110. [Google Scholar] [CrossRef]
  35. Keszthelyi, L. A preliminary thermal budget for lava tubes on the Earth and Moon. J. Geophys. Res. Planets 1995, 100, 20411–20420. [Google Scholar] [CrossRef]
  36. Campbell, B.A.; Carter, L.M.; Phillips, R.J.; Plaut, J.J.; Putzig, N.E.; Safaeinili, A.; Seu, R.; Biccari, D.; Egan, A.F.; Orosei, R. SHARAD radar sounding of the vastitas borealis formation in Amazonis Planitia. J. Geophys. Res. Planets 2009, 113, E12010. [Google Scholar] [CrossRef]
  37. Whitford-Stark, J.L.; Head, J.W. The Marius Hills volcanic complex. Lunar Sci. Conf. Proc. 1977, 8, 2705–2724. [Google Scholar]
  38. Weitz, C.M.; Head, J.W. Spectral properties of the Marius Hills volcanic complex and implications for the formation of lunar domes and cones. J. Geophys. Res. Planets 1999, 104, 18933–18956. [Google Scholar] [CrossRef]
  39. Head, J.W.; Wilson, L. Lunar mare volcanism: Stratigraphy, eruption conditions, and the evolution of secondary crusts. Geochim. Cosmochim. Acta 1992, 56, 2155–2175. [Google Scholar] [CrossRef]
  40. Hiesinger, H.; Jaumann, R.; Neukum, G.; Head, J.W. Ages of mare basalts on the lunar nearside. J. Geophys. Res. Planets 2000, 105, 29239–29275. [Google Scholar] [CrossRef]
  41. Zhang, W.; Qi, J.; Wan, P.; Wang, H.; Xie, D.; Wang, X.; Yan, G. An Easy-to-Use Airborne LiDAR Data Filtering Method Based on Cloth Simulation. Remote Sens. 2016, 8, 501. [Google Scholar] [CrossRef]
  42. Horn, B.K.P. Hill shading and the reflectance map. Proc. IEEE 1981, 69, 14–47. [Google Scholar] [CrossRef]
  43. Shepard, M.K.; Campbell, B.A.; Bulmer, M.H.; Farr, T.G.; Gaddis, L.R.; Plaut, J.J. The roughness of natural terrain: A planetary and remote sensing perspective. J. Geophys. Res. Planets 2001, 106, 32777–32795. [Google Scholar] [CrossRef]
  44. Rosenburg, M.A.; Aharonson, O.; Head, J.W.; Kreslavsky, M.A.; Mazarico, E.; Neumann, G.A.; Smith, D.E.; Torrence, M.H.; Zuber, M.T. Global surface roughness of the Moon from the Lunar Orbiter Laser Altimeter. J. Geophys. Res. Planets 2011, 116, E02001. [Google Scholar] [CrossRef]
  45. Smith, W.H.F.; Sandwell, D.T. Global sea floor topography from satellite altimetry and ship depth soundings. Science 1997, 277, 1956–1962. [Google Scholar] [CrossRef]
  46. Besse, S.; Sunshine, J.M.; Staid, M.I.; Petro, N.E.; Boardman, J.W.; Green, R.O.; Head, J.W.; Isaacson, P.J.; Mustard, J.F.; Pieters, C.M. Compositional variability of the Marius Hills volcanic complex from the Moon Mineralogy Mapper (M3). J. Geophys. Res. 2011, 116, E00G13. [Google Scholar] [CrossRef]
  47. Walker, G.P.L. Structure, and origin by injection of lava under surface crust, of tumuli, “lava rises”, “lava-rise pits”, and “lava-inflation clefts” in Hawaii. Bull. Volcanol. 1991, 53, 546–558. [Google Scholar] [CrossRef]
  48. Peterson, D.W.; Swanson, D.A. Observed formation of lava tubes. Stud. Speleol. 1974, 2, 209–222. [Google Scholar]
  49. Calvari, S.; Pinkerton, H. Formation of lava tubes and extensive flow field during the 1991–1993 eruption of Mount Etna. J. Geophys. Res. Solid Earth 1998, 103, 27291–27301. [Google Scholar] [CrossRef]
  50. Hurwitz, D.M.; Head, J.W.; Hiesinger, H. Lunar sinuous rilles: Distribution, characteristics, and implications for their origin. Planet. Space Sci. 2013, 79, 1–38. [Google Scholar] [CrossRef]
  51. Gustafson, J.O.; Bell, J.F., III; Gaddis, L.R.; Hawke, B.R.; Giguere, T.A. Characterization of previously unidentified lunar pyroclastic deposits using Lunar Reconnaissance Orbiter Camera data. J. Geophys. Res. Planets 2012, 117, E00H25. [Google Scholar] [CrossRef]
Figure 1. Location of volcanic vents in the JLVF. (A) The volcanic vent area, marked by the red region. (B) The distribution of lava tubes and continuous collapse chains along the flow trajectory. (C) The extensive lava plateau formed by effusive eruptions [23].
Remotesensing 18 00512 g001
Figure 2. Columnar jointing in the JLVF.
Remotesensing 18 00512 g002
Figure 3. Typical Laminar Pahoehoe texture and inflation fissure at the JLVF. The image captures the high-frequency micro-topography of the basaltic terrace. The diagnostic ropy texture, characterized by wavelengths of 10–30 cm, represents the compressional folding of a viscoelastic crust during laminar flow. The prominent axial fissure dissecting the structure provides physical evidence of the inflation mechanism, where internal hydrostatic pressure uplifted and fractured the solidified crust. This ground-truth texture serves as a high-fidelity proxy for the sub-pixel roughness likely present on the “smooth” lunar mare plains.
Remotesensing 18 00512 g003
Figure 4. Typical Laminar Pahoehoe surface texture and associated inflation fissure at the JLVF.
Remotesensing 18 00512 g004
Figure 5. Surface fissures in lava plateau region.
Remotesensing 18 00512 g005
Figure 6. Orientation of lava tube cavities and openings beneath the lava plateau, with the red box indicating the location of the lava tube cavity opening.
Remotesensing 18 00512 g006
Figure 7. Location map of the Marius Hills region uses LROC NAC data. The map identifies key geological features, including the Marius Hills Volcanic Field, Rima Marius (indicated by the cyan arrow), and Marius Crater (circled in yellow).
Remotesensing 18 00512 g007
Figure 8. Point cloud data of the lava plateau area in the JLVF after CSF filtering.
Remotesensing 18 00512 g008
Figure 9. High-resolution morphometric characterization of the JLVF lava terraces derived from UAV data. (a) Surface roughness map indicating local topographic variability. (b) Slope map illustrating the gradient distribution (0–88°). (c) Reprojected Digital Elevation Model (DEM) showing the absolute elevation range. (d) Hillshade visualization revealing high-frequency surface textures, including pahoehoe ropes and tumuli structures.
Remotesensing 18 00512 g009
Figure 10. Comparative morphometric analysis of the Marius Hills lunar reference site. The panels illustrate the terrain layers derived from LROC NAC DTMs: (a) Surface Roughness (RMS Height) map, showing higher baseline values due to impact gardening and sensor noise. (b) Reprojected Digital Terrain Model (DTM) providing the regional elevation context for Rima Marius. (c) Slope gradient map, delineating the steep topography of the rille walls and impact craters.
Remotesensing 18 00512 g010
Figure 11. Comparative Slope Probability Density Distributions. The plot displays the probability density functions of topographic gradients for the terrestrial analog (JLVF, blue solid line) and the lunar reference (Marius Hills, red dashed line).
Remotesensing 18 00512 g011
Figure 12. Comparative Surface Roughness Frequency Distribution. The plot quantifies the vertical surface deviations (RMS Height). The discrepancy between the sharp terrestrial peak (Blue) and the diffuse lunar peak (Red) highlights the “resolution gap,” demonstrating that UAV-derived ground truth effectively resolves sub-meter smoothness obscured by noise in orbital lunar datasets.
Remotesensing 18 00512 g012
Figure 13. High-fidelity 3D geometric reconstruction and structural extraction of the JLVF continuous collapse chain. The panels illustrate the multi-perspective analysis of the terrestrial analog site derived from integrated UAV and handheld LiDAR point clouds: (A) Integrated 3D model visualizing the spatial continuity between the intact lava tube roof (yellow/green) and the collapsed trench floor (blue/black), confirming the structural link between subsurface voids and surface depressions. The colored horizontal dividing lines are the results of horizontal point cloud extraction. (B) Nadir (top-down) view of the target collapse zone used for morphometric delineation, highlighting the sharp boundary between the stable rim and the debris-filled interior. (C,D) Transverse Profile Extraction Strategy: (C) shows the placement of orthogonal transects across the collapse feature, and (D) displays the resulting cross-sectional point cloud slices. These profiles reveal the characteristic steep upper walls and V-shaped talus accumulation floor, validating the “U-to-V” structural transition hypothesis. (a–c) represents the extracted point cloud cross-sectional information of the lava tube, corresponding to the colored dividing lines in Figure (A). (E) Longitudinal Profile Extraction: Extraction of the thalweg profile along the collapse axis. This data stream captures the high-frequency floor undulations (hummocky terrain) indicative of stochastic roof block failure, serving as the ground-truth signature for the “tube-fed” origin of lunar rilles, (d) shows the section labels extracted along the collapse axis.
Remotesensing 18 00512 g013
Figure 14. Multi-scale localization and profile extraction strategy along Rima Marius. The panels illustrate the hierarchical selection of the lunar reference dataset derived from LROC NAC imagery: (A) Regional context of the Marius Hills volcanic complex, highlighting the prominent sinuous geometry of Rima Marius within the mare basalt plains. (B) Enlarged view of the target tube segment, exhibiting the characteristic meandering morphology selected for comparative analysis. (C) High-resolution detail showing the precise placement of the three orthogonal transects (blue lines) as shown in section (a–c). These transects correspond to the cross-sectional profiles used to validate the “U-to-V” structural transition and confirm the tube-fed collapse origin of the rille as shown in section (d).
Remotesensing 18 00512 g014
Figure 15. High-resolution morphometric architecture of the JLVF collapse chain. Terrain profiles extracted from terrestrial LiDAR point clouds across three orthogonal transects (Sections A, B, C). The “Topographic Profile Comparison” (bottom right) illustrates the structural continuity of the collapse trench, highlighting the characteristic transition from vertical upper walls to a V-shaped debris floor.
Remotesensing 18 00512 g015
Figure 16. Cross-sectional elevation profiles of Rima Marius derived from orbital altimetry. The panels compare high-precision LROC NAC profiles (Red, “Terrain Height”) with low-resolution GLD100 data (Grey). The detailed geometry confirms that the rille floor is not flat (as suggested by low-res data) but exhibits a distinct V-shaped confinement, homologous to the depositional mechanics observed in terrestrial tube collapses.
Remotesensing 18 00512 g016
Figure 17. Rima Marius 3D Terrain Reconstruction.
Remotesensing 18 00512 g017
Figure 18. (A) Elevation variation profile of continuous collapse direction in the JLVF. (B) Elevation variation map of the Rima in the MHVF.
Remotesensing 18 00512 g018
Figure 19. Macroscopic Power Spectral Density (PSD) analysis of Rima Marius longitudinal profiles. The plots illustrate the low-frequency spectral behavior derived from LROC NAC DTMs. The observed spectral exponent aligns closely with the Stochastic Collapse Model rather than the Laminar Erosion Model, physically indicating that the rille floor topography is governed by discrete roof block failures rather than fluid abrasion.
Remotesensing 18 00512 g019
Figure 20. Micro-scale fractal roughness characterization of the JLVF collapse chain. Derived from high-resolution terrestrial LiDAR, these plots resolve the high-frequency textural signature of the basaltic debris field. The spectral exponent reflects the roughness of the “skin” of the collapsed talus, providing a ground-truth extension to the macroscopic “skeleton” observed on the Moon.
Remotesensing 18 00512 g020
Figure 21. Skylight markings for lava tube sections in the JLVF.Skylights in the lava pipe point cloud data were identified using void identification. Since the inlet and outlet of the lava pipe are also voids, they are colored red in the figure. For easy identification, the lava pipe skylights are marked in the figure and labeled A, B, and C according to the flow direction.
Remotesensing 18 00512 g021
Figure 22. Orthophoto of a portion of the lava tube skylight on the moon.
Remotesensing 18 00512 g022
Figure 23. Schematic illustration of the formation and evolution of a lava tube into a sinuous rille. (a) Open tube flow: Active lava flows through a surface tube. (b) Roofing: The surface of the lava flow cools and solidifies, forming a crust that roofs over the tube. (c) Drainage: The molten lava inside drains away, leaving behind a hollow subsurface void (lava tube). (d) Collapse: The roof of the lava tube collapses due to lack of support or gravity, forming a sinuous rille (rima) on the surface.
Remotesensing 18 00512 g023
Table 1. Morphometric parameters of the craters in the Jingpo Lake Volcanic Field.
Crater NumberLocationElevation/mRelief/mCrater MorphologyCrater Diameter/mCrater Depth/mBreach Direction
Isubterranean forest1070250circular400–470132east
IIsubterranean forest1030350circular7050absent
IIIsubterranean forest1000320peach-shaped250–30090southwest
IVsubterranean forest970250circular350–500120southeast
VDaganpao75030circular25030west
V-1Daganpao northwest
VIWudaogou870100crescent-shaped230–48085West
VIIHamatang800180armchair-shaped500 southeast, northwest
VIIIWudaogou865110circular120–250 northwest
IXWudaogou840110circular60–200 northwest
XMihunzhen900120circular25
XIMihunzhen910 elliptical170–200 west
Table 2. Mean, standard deviation, and maximum values of slope and roughness in the study areas of the Moon and Earth.
MetricRegionMean (μ)Std Dev (σ)Max Value
Slope ( ° )JLVF (Earth)14.1615.8688.88
Marius Hills (Moon)5.215.1970.16
Roughness (m)JLVF (Earth)0.0460.1725.03
Marius Hills (Moon)0.1550.1604.53
Table 3. Comparative morphometric inventory of lunar mare pits and terrestrial JLVF analogs. The table categorizes the distinct “Deep Shaft” (Class I) and “Funnel Pit” (Class II) morphologies. Note that despite the order-of-magnitude scale difference driven by gravitational disparity, the terrestrial JLVF skylights (A, B, C) successfully reproduce the dimensionless geometric ratios of both lunar end-members.
Feature NameGenetic ClassDiameterDepthRatio
Lunar Inventory
Marius HillsClass I Deep Shaft~65 m~88 m1.35
Mare TranquillitatisClass I Deep Shaft~100 m~107 m1.07
Lacus MortisClass II Funnel Pit~140 m~60 m0.43
Compton PitClass II Funnel Pit~140 m~40 m0.43
Mare IngeniiHybrid Transition~118 m~70 m0.59
Mare FecunditatisClass II Funnel Pit~130 m~45 m0.35
Terrestrial Inventory (JLVF)
Skylight A & CVertical Shafts<1.8 m~3.0 m>2.0
Skylight BCollapse Pit~5.6 m~2.8 m<0.5
Disclaimer/Publisher’s Note: The statements, opinions and data contained in all publications are solely those of the individual author(s) and contributor(s) and not of MDPI and/or the editor(s). MDPI and/or the editor(s) disclaim responsibility for any injury to people or property resulting from any ideas, methods, instructions or products referred to in the content.