Article

DBYOLO: Dual-Backbone YOLO Network for Lunar Crater Detection

1
Hubei Provincial Key Laboratory of Green Intelligent Computing Power Network, School of Computer Science, Hubei University of Technology, Wuhan 430068, China
2
State Key Laboratory of Information Engineering in Surveying Mapping and Remote Sensing, Wuhan University, Wuhan 430072, China
*
Author to whom correspondence should be addressed.
Remote Sens. 2025, 17(19), 3377; https://doi.org/10.3390/rs17193377
Submission received: 25 July 2025 / Revised: 24 September 2025 / Accepted: 4 October 2025 / Published: 7 October 2025

Abstract

Highlights

What are the main findings?
  • Designed a lightweight dual-backbone network to extract texture and edge features from LROC CCD images and terrain depth features from DTM data.
  • Proposed a feature fusion module based on attention mechanisms to dynamically integrate features from multi-source data at different scales.
What are the implications of the main findings?
  • mAP50 improved by 3.1% compared to the baseline model.
  • The model’s prediction plot better fits the ground truth compared to other mainstream models.

Abstract

Craters are among the most prominent and significant geomorphological features on the lunar surface. The complex and variable environment of the lunar surface, which is characterized by diverse textures, lighting conditions, and terrain variations, poses significant challenges to existing crater detection methods. To address these challenges, this study introduces DBYOLO, an innovative deep learning framework designed for lunar crater detection, leveraging a dual-backbone feature fusion network, with two key innovations. The first innovation is a lightweight dual-backbone network that processes Lunar Reconnaissance Orbiter Camera (LROC) CCD images and Digital Terrain Model (DTM) data separately, extracting texture and edge features from CCD images and terrain depth features from DTM data. The second innovation is a feature fusion module with attention mechanisms that is used to dynamically integrate multi-source data, enabling the efficient extraction of complementary information from both CCD images and DTM data, enhancing crater detection performance in complex lunar surface environments. Experimental results demonstrate that DBYOLO, with only 3.6 million parameters, achieves a precision of 77.2%, recall of 70.3%, mAP50 of 79.4%, and mAP50-95 of 50.4%, representing improvements of 3.1%, 1.8%, 3.1%, and 2.6%, respectively, over the baseline model before modifications. This showcases an overall performance enhancement, providing a new solution for lunar crater detection and offering significant support for future lunar exploration efforts.

1. Introduction

Craters are prominent geomorphic features formed by high-speed impacts of meteoroids on the lunar surface. Precise identification and statistical analysis of their spatial distribution and morphological characteristics provide reliable data for determining the geological age of the lunar surface and facilitate the construction of high-precision impact chronology models. Moreover, a high-quality crater catalog offers essential scientific guidance for selecting landing sites for future lunar exploration missions. Consequently, accurate detection of lunar crater distribution not only establishes a robust foundation for deep space exploration but also serves as a vital reference for crater analysis on other planetary bodies [1,2].
Traditional crater identification methods primarily rely on manual annotation or automated approaches based on single-modality data, such as CCD images or a DTM [3]. However, these two data modalities each possess distinct advantages and inherent limitations. Single-modality crater detection methods face significant challenges when applied to the complex lunar surface environment. As shown in Figure 1, CCD images provide rich textural and chromatic information, facilitating the identification of crater shapes and rim characteristics, but they are constrained by illumination conditions and shadows, which may prevent accurate capture of complete crater outlines in certain regions. DTMs effectively capture the three-dimensional topographic features of the lunar surface, including crater depth and contour information, but elevation data lacks texture and color information, when used alone for crater identification, it is prone to interference from topographic noise, resulting in reduced recognition accuracy [4,5].
Current object detection algorithms include Convolutional Neural Network (CNN)-based models, like Faster R-CNN [6] and the You Only Look Once (YOLO) [7] series, and Transformer-based [8] models such as RT-DETR [9] and Swin Transformer [10]. They usually rely on a single data source for training. However, CCDs are susceptible to illumination variations, which may cause data loss, while DTM data lack texture details. These factors often lead to reduced recognition accuracy as well as missed and false detections. Existing multi-source fusion methods (such as SuperYOLO [11] and DEYOLO [12]) have attempted to fuse visible and infrared images, but their core computation is still based on feature concatenation or weighted fusion strategies, which are not specifically optimized for crater detection tasks. When applied to CCD images and DTM data, such methods are prone to cross-modal interference and feature redundancy, thereby limiting the accuracy of crater recognition.
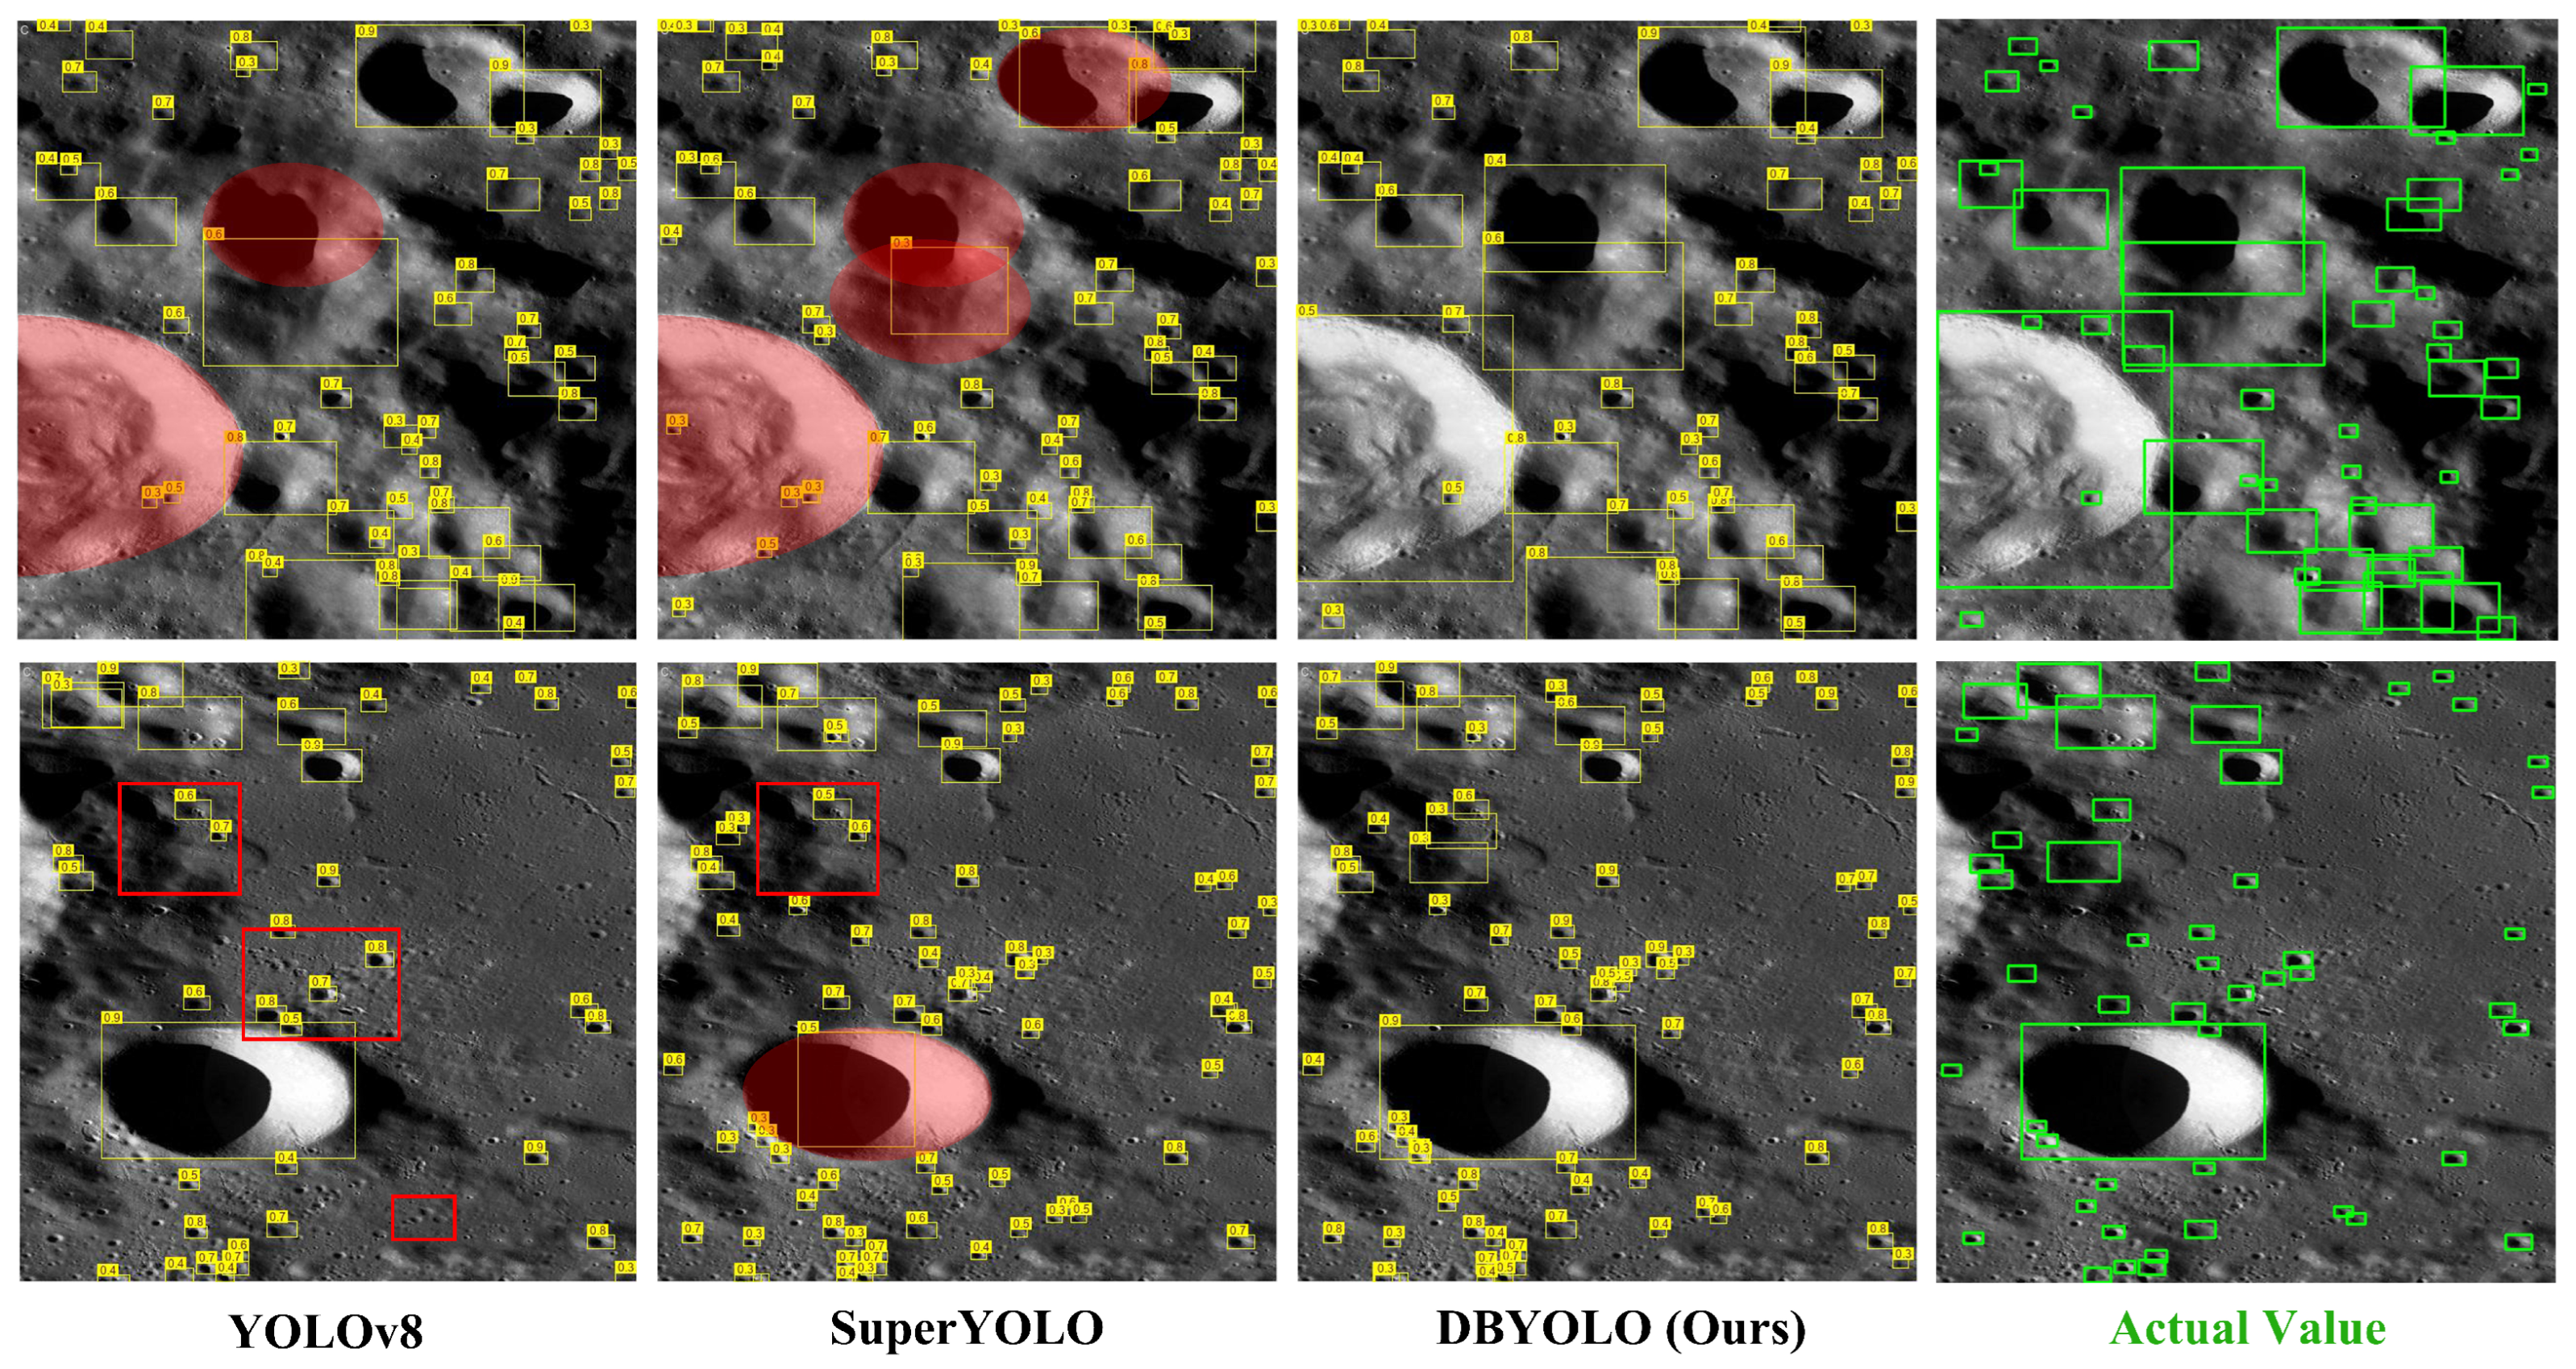
Figure 2 presents a comparative visualization of the prediction results for models trained with a single data source (CCD images) versus multi-source data (including CCD and DTM data). Analysis indicates that the YOLOv8 network, trained on a single CCD data source, exhibits significant limitations in regions with poor lighting conditions, failing to effectively capture crater features and accurately detect their locations. The SuperYOLO model, trained on multi-source data, is impacted by inter-modal interference issues, resulting in suboptimal performance when identifying larger craters. These observations highlight the limitations of single-modality methods and insufficiently optimized multi-source methods under complex lunar surface conditions. Therefore, effectively fusing the complementary information from CCD images and DTM data and designing a high-precision detection model tailored for crater recognition remains a pressing scientific challenge.
To address the aforementioned challenges, this paper proposes DBYOLO, a lightweight dual-backbone feature fusion network model designed for lunar crater detection. The model leverages the complementary information from CCD images and DTM to significantly enhance the precision and accuracy of crater identification in complex lunar surface environments. The prediction results of DBYOLO in Figure 2 demonstrate that, compared to existing methods, DBYOLO can more accurately fit ground truth labels, effectively addressing the accuracy degradation caused by illumination variations in models trained on single data sources, while significantly mitigating inter-modal interference and feature redundancy issues in models trained on multi-source data. By designing a lightweight dual-backbone network, the model separately extracts high-resolution texture details from CCD images and low-frequency elevation features from the DTM. The backbone network optimizes downsampling by employing wavelet transforms and data-slicing convolution computations, effectively balancing performance and computational efficiency, making it suitable for resource-constrained scenarios. DBYOLO includes an attention-based feature fusion module that efficiently integrates multi-source features by combining DTM elevation data with CCD image features, enabling precise crater detection in the YOLO network’s fusion layer. This study not only provides an innovative technical solution for efficient and accurate lunar crater identification but also offers a reliable method for constructing high-precision crater catalogs, with the potential for extension to crater detection on other planetary bodies. The research holds significant theoretical and practical value, laying a solid foundation for advancing lunar scientific research, deep space exploration, and related fields.

2. Related Work

This section reviews various methods used by researchers for lunar crater detection, including manual detection, deep learning approaches, feature fusion strategies, and the application of YOLO-series algorithms in multispectral object detection, with a particular focus on implementations in planetary remote sensing.

2.1. Manual and Early Automation Methods

Traditional lunar crater detection was primarily conducted through manual visual inspection. For example, Robbins [13] and Head [14] et al.’s study used manual labeling of craters, which is a process that is time-consuming, subjective, and prone to error. Some researchers developed automated detection algorithms based on image processing techniques, typically involving edge detection and the Hough Transform (HT) [15] to extract features for crater identification. For instance, Kim et al. extracted handcrafted features such as edges, contours, and depressions, and employed template matching to locate craters. However, such methods often struggle to generalize to larger surface areas and a wide range of crater diameters, limiting their scalability for global lunar surface analysis [16]; Galloway et al. proposed an automated crater detection and counting method based on the Hough Transform, which successfully identified sub-kilometer-scale craters from high-resolution Martian surface imagery and demonstrated applicability to large-scale datasets [17]. However, in complex terrain (e.g., multiple craters overlapping or non-flat areas), the method may be disturbed and the detection results are not generalizable.

2.2. Deep Learning for Crater Detection

With the advancement of deep learning, the field of remote sensing increasingly adopts deep learning methods to enhance data processing and analysis capabilities [18,19]. Automated crater detection has achieved significant progress [20,21]. Most existing studies have focused on single-modality data. For example, Xuxin Lin et al. employed methods such as Region-based Detection Network, Anchor-based Detection Network, and Point-based Detection Network to detect craters in lunar Digital Elevation Map (DEM) data [22]. Shuowei Zhang et al. applied the CenterNet model to detect small-scale craters, highlighting the advantage of optical imagery in capturing shape and edge details [23]. Sudong Zang proposed a semi-supervised deep learning approach for lunar crater detection in the study titled “Semi-Supervised Deep Learning for Lunar Crater Detection” [24]. These studies show that single-modal data performs well under specific conditions, but it cannot fully overcome data limitations, such as the lack of texture in point cloud data, low DEM resolution, illumination effects on CCD data, and complex terrain interference.

2.3. Multi-Source Remote Sensing Image Fusion

To overcome the limitations of a single data source, many researchers have actively explored multispectral remote sensing image fusion techniques by leveraging the characteristics of remote sensing images [25,26]. Several studies have explored multi-source data fusion to improve crater detection performance. Atal Tewari proposed an approach that integrates optical images, DEM, and slope maps at the input stage and employs Mask R-CNN for crater detection. This method was evaluated on the Head-LROC and Robbins crater catalogs and achieved a recall rate of 93.94%, demonstrating the complementary advantages of multi-source data [27]. However, this approach does not utilize a dual-backbone architecture; it directly fuses multiple inputs at the early stage, which may lead to feature interference during the learning process. Chen Yang et al. first accurately aligned the spatial coordinates of Digital Orthophoto Maps (DOM) and Digital Elevation Models (DEM) using the Chang’e satellite’s orbital parameters and known large-scale craters as control points. They then concatenated these two types of feature data into a 5-channel comprehensive feature map, which served as the input to the model. Next, they fine-tuned the detection model based on ResNet101 using the Chang’e-1 dataset, and subsequently transferred the well-trained model directly to the Chang’e-2 dataset for crater detection [28].

2.4. Application of YOLO in Crater Detection

The YOLO model has important applications in the field of remote sensing due to its light weight and high efficiency. Studies have demonstrated that YOLO models can rapidly process high-resolution imagery, making them well-suited for space exploration tasks, especially lunar crater detection [29]. Manish Sharma and colleagues developed YOLOrs, a real-time object detection model based on YOLOv3, which employs mid-level fusion and orientation prediction to process multimodal remote sensing images (e.g., RGB, infrared, SAR), achieving improved detection performance for small and arbitrarily oriented targets on the VEDAI dataset [30]. Jiahao Tang proposed SCCA-YOLO [31], which uses Spatial Channel Fusion and Context-Aware modules to detect craters in a self-constructed Chang’e-6 dataset, achieving promising results with an mAP50 of 96.5% and an mAP50-95 of 81.5%. Jiaqing Zhang and colleagues developed SuperYOLO, a YOLOv5-based object detection model that utilizes pixel-level multimodal fusion and a super-resolution auxiliary branch to handle multimodal remote sensing images, achieving an mAP50 of 75.09% on the VEDAI dataset, significantly enhancing small target detection accuracy while reducing parameters by approximately 18 times and computational load by 3.8 times, balancing high precision and low computational cost. Wei Zuo developed a deep learning framework, YOLO-SCNet, for small-scale crater detection, incorporating a new small object detection head, dynamic anchor boxes, and a multi-scale feature fusion architecture, achieving an accuracy of 90.2%, a recall of 88.7%, and an F1 score of 89.4% [32].

3. Methods

This section introduces the used data, data preprocessing procedures, the overall architecture and implementation details of the proposed DBYOLO algorithm, and the relevant evaluation metrics.

3.1. Data Preparation

This study utilizes data acquired by the LROC aboard NASA’s Lunar Reconnaissance Orbiter (LRO). We use the WAC Global Morphologic Map at a wavelength of 643 nm, captured at an altitude of 50 km with a spatial resolution of 100 m [33]. In addition, the study employs the Global Lunar DTM with a resolution of 100 m, derived from over 69,000 Wide Angle Camera (WAC) stereo images [34]. The selected study area spans the following:
Longitude : 90 ° W to 180 ° E ;
Latitude : 0 ° N to 60 ° N .
It covers diverse lunar terrain types such as basaltic plains (e.g., Mare Imbrium and Mare Tranquillitatis) and mountain ranges (e.g., the Caucasus Mountains). These regions encompass the Moon’s major geomorphological features and provide a rich and diverse set of training samples for accurately representing lunar surface characteristics. The image scale is 100.00 m per pixel, with a resolution of 303.23 pixels per degree.
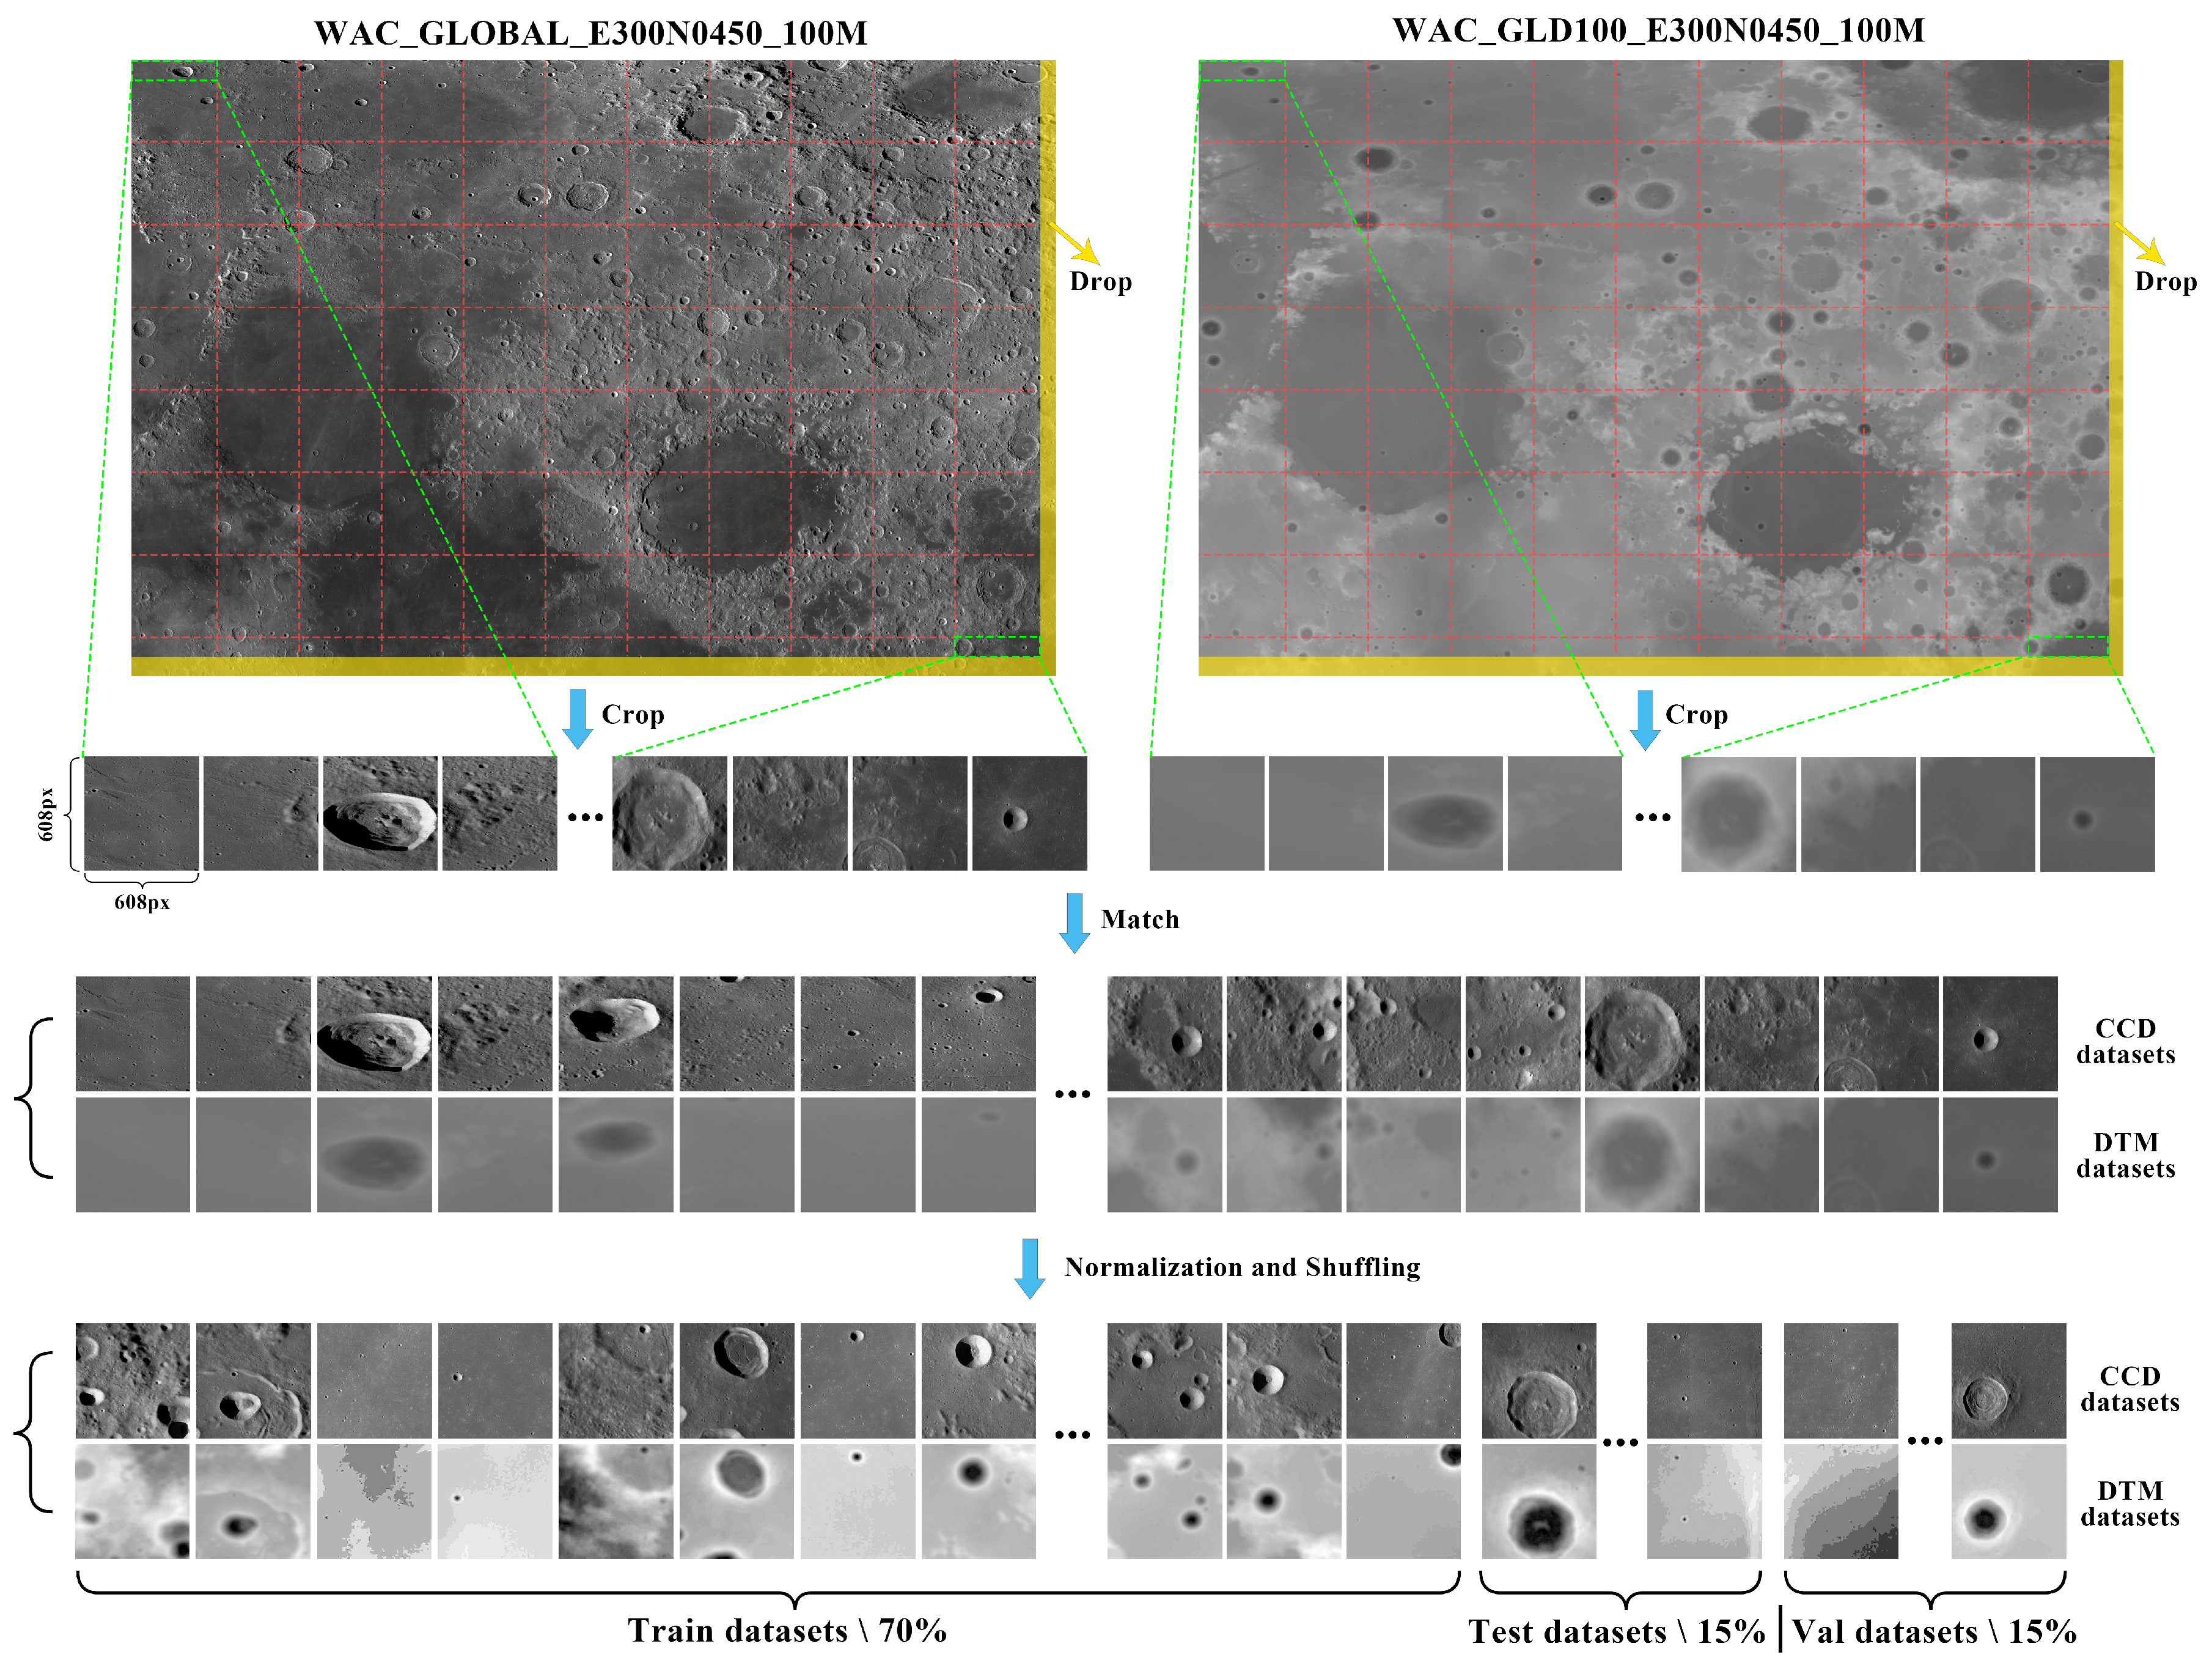
The detailed data preprocessing workflow is shown in Figure 3: First, both the original DTM and CCD images are clipped into 608 × 608 pixel patches using the GDAL library in Python. Subsequently, a matching step is performed to further align the dataset, ensuring that the cropped CCD images and DTM patches correspond precisely in spatial terms and maintain a consistent arrangement order. Normalization is applied to all image patches to scale pixel values to the 0–255 range, eliminating data distribution biases and enhancing model generalization. The image order is then shuffled. The resulting standardized DTM and CCD datasets are divided into a train dataset (70%), a test dataset (15%), and a validation dataset (15%) for subsequent model training and evaluation.
This study used the global crater catalog LU1319373, which contains latitude and longitude coordinates, diameter, depth, and 3D morphometric data of crater centers and covers data from about 1.32 million lunar craters with diameters greater than or equal to 1 km [35]. To address image distortion and stretching caused by the equirectangular projection of the WAC Global Morphologic Map, a custom Python script was developed. This script calculates and draws bounding boxes based on the crater center coordinates and diameter data. Specifically, the width of the labeling box is taken as the diameter of the crater, and the length is the diameter of the crater multiplied by the cotangent (cot) to correct for the distortion caused by the projection. All bounding boxes are normalized to ensure accurate representation of crater positions and size on the images.
Let D denote the crater diameter, ϕ the latitude, and I W and I H the image width and height. The normalized bounding box width W ^ and height H ^ are calculated as
W ^ = D I W
H ^ = D · cot ( ϕ ) I H
In addition, the center coordinates of the bounding boxes ( C x , C y ) are also normalized to ensure spatial consistency across the dataset:
C ^ x = C x I W , C ^ y = C y I H
Through this method, the labeled bounding boxes can be accurately overlaid on the image, ensuring that the position and size of each crater are precisely represented.

3.2. DBYOLO Architecture

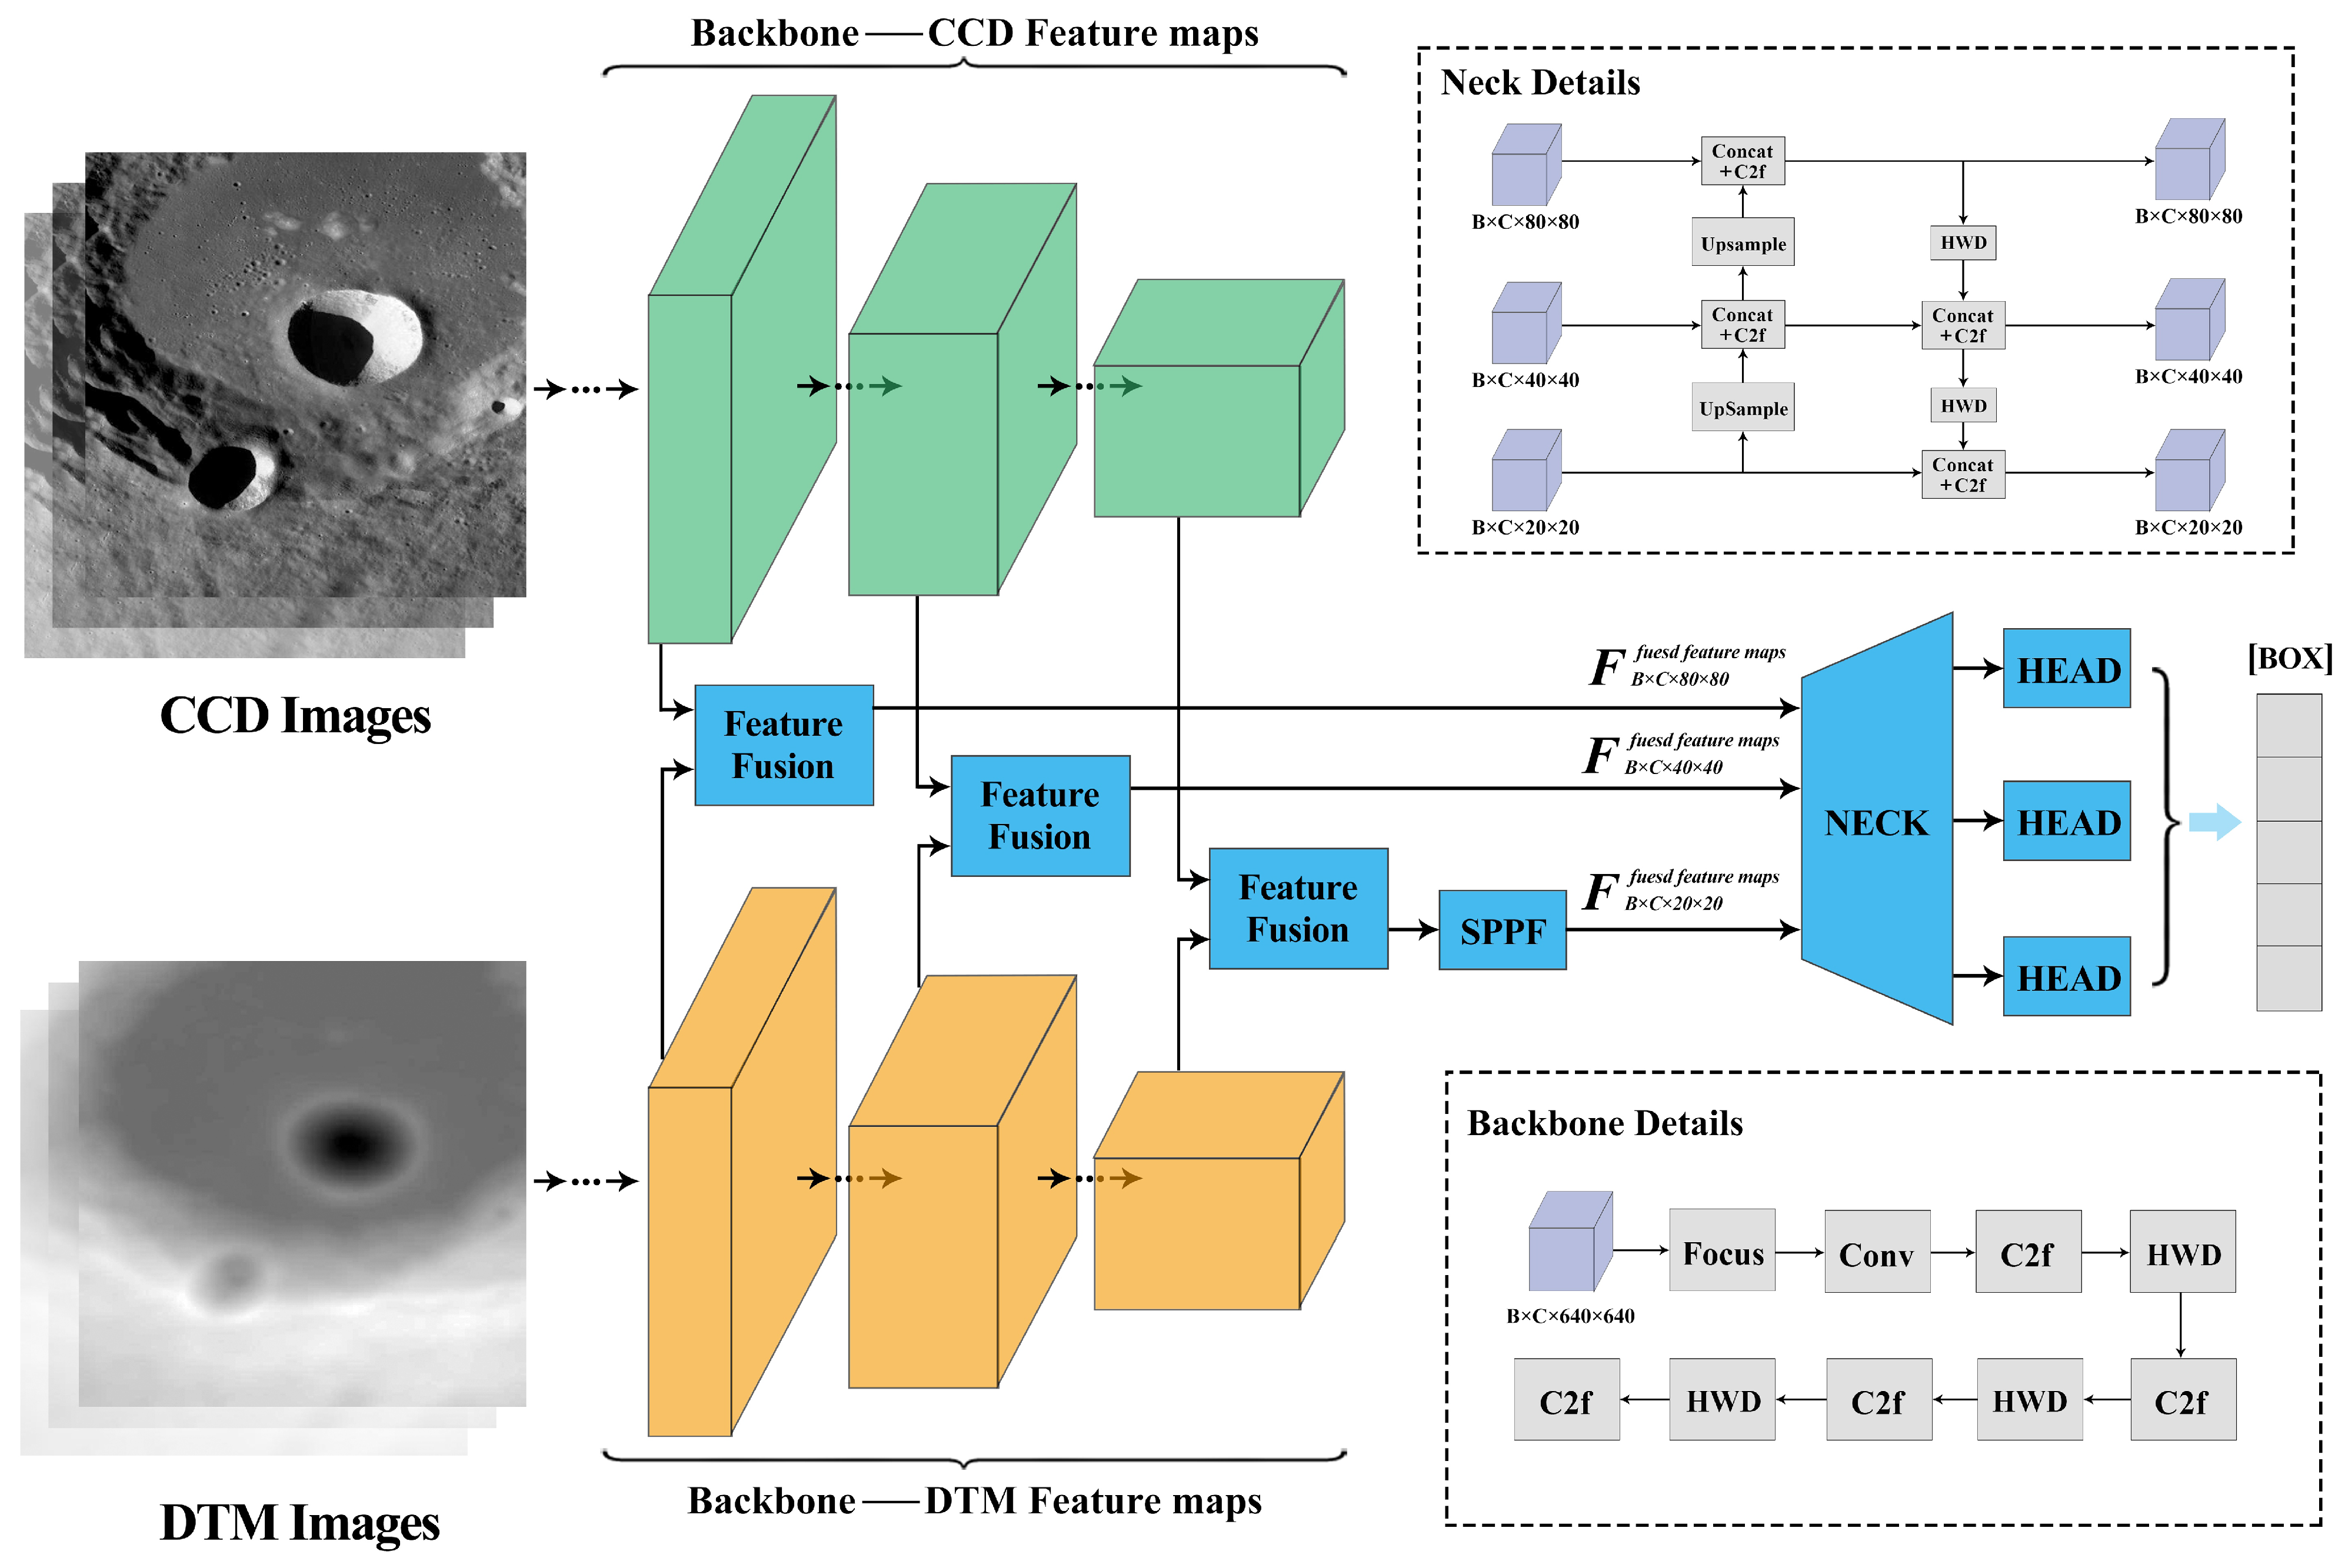
DBYOLO is a lightweight dual-backbone lunar crater detection model designed to process multi-source image features. The dual-backbone fusion mechanism enables more effective integration of CCD images and the DTM, enhancing feature representation and achieving accurate crater detection. The overall architecture is inspired by the YOLOv8 design, with targeted adaptations and enhancements. The network consists of three main components: the feature extraction layer, the feature fusion layer, and the detection head. The overall architecture is illustrated in Figure 4.
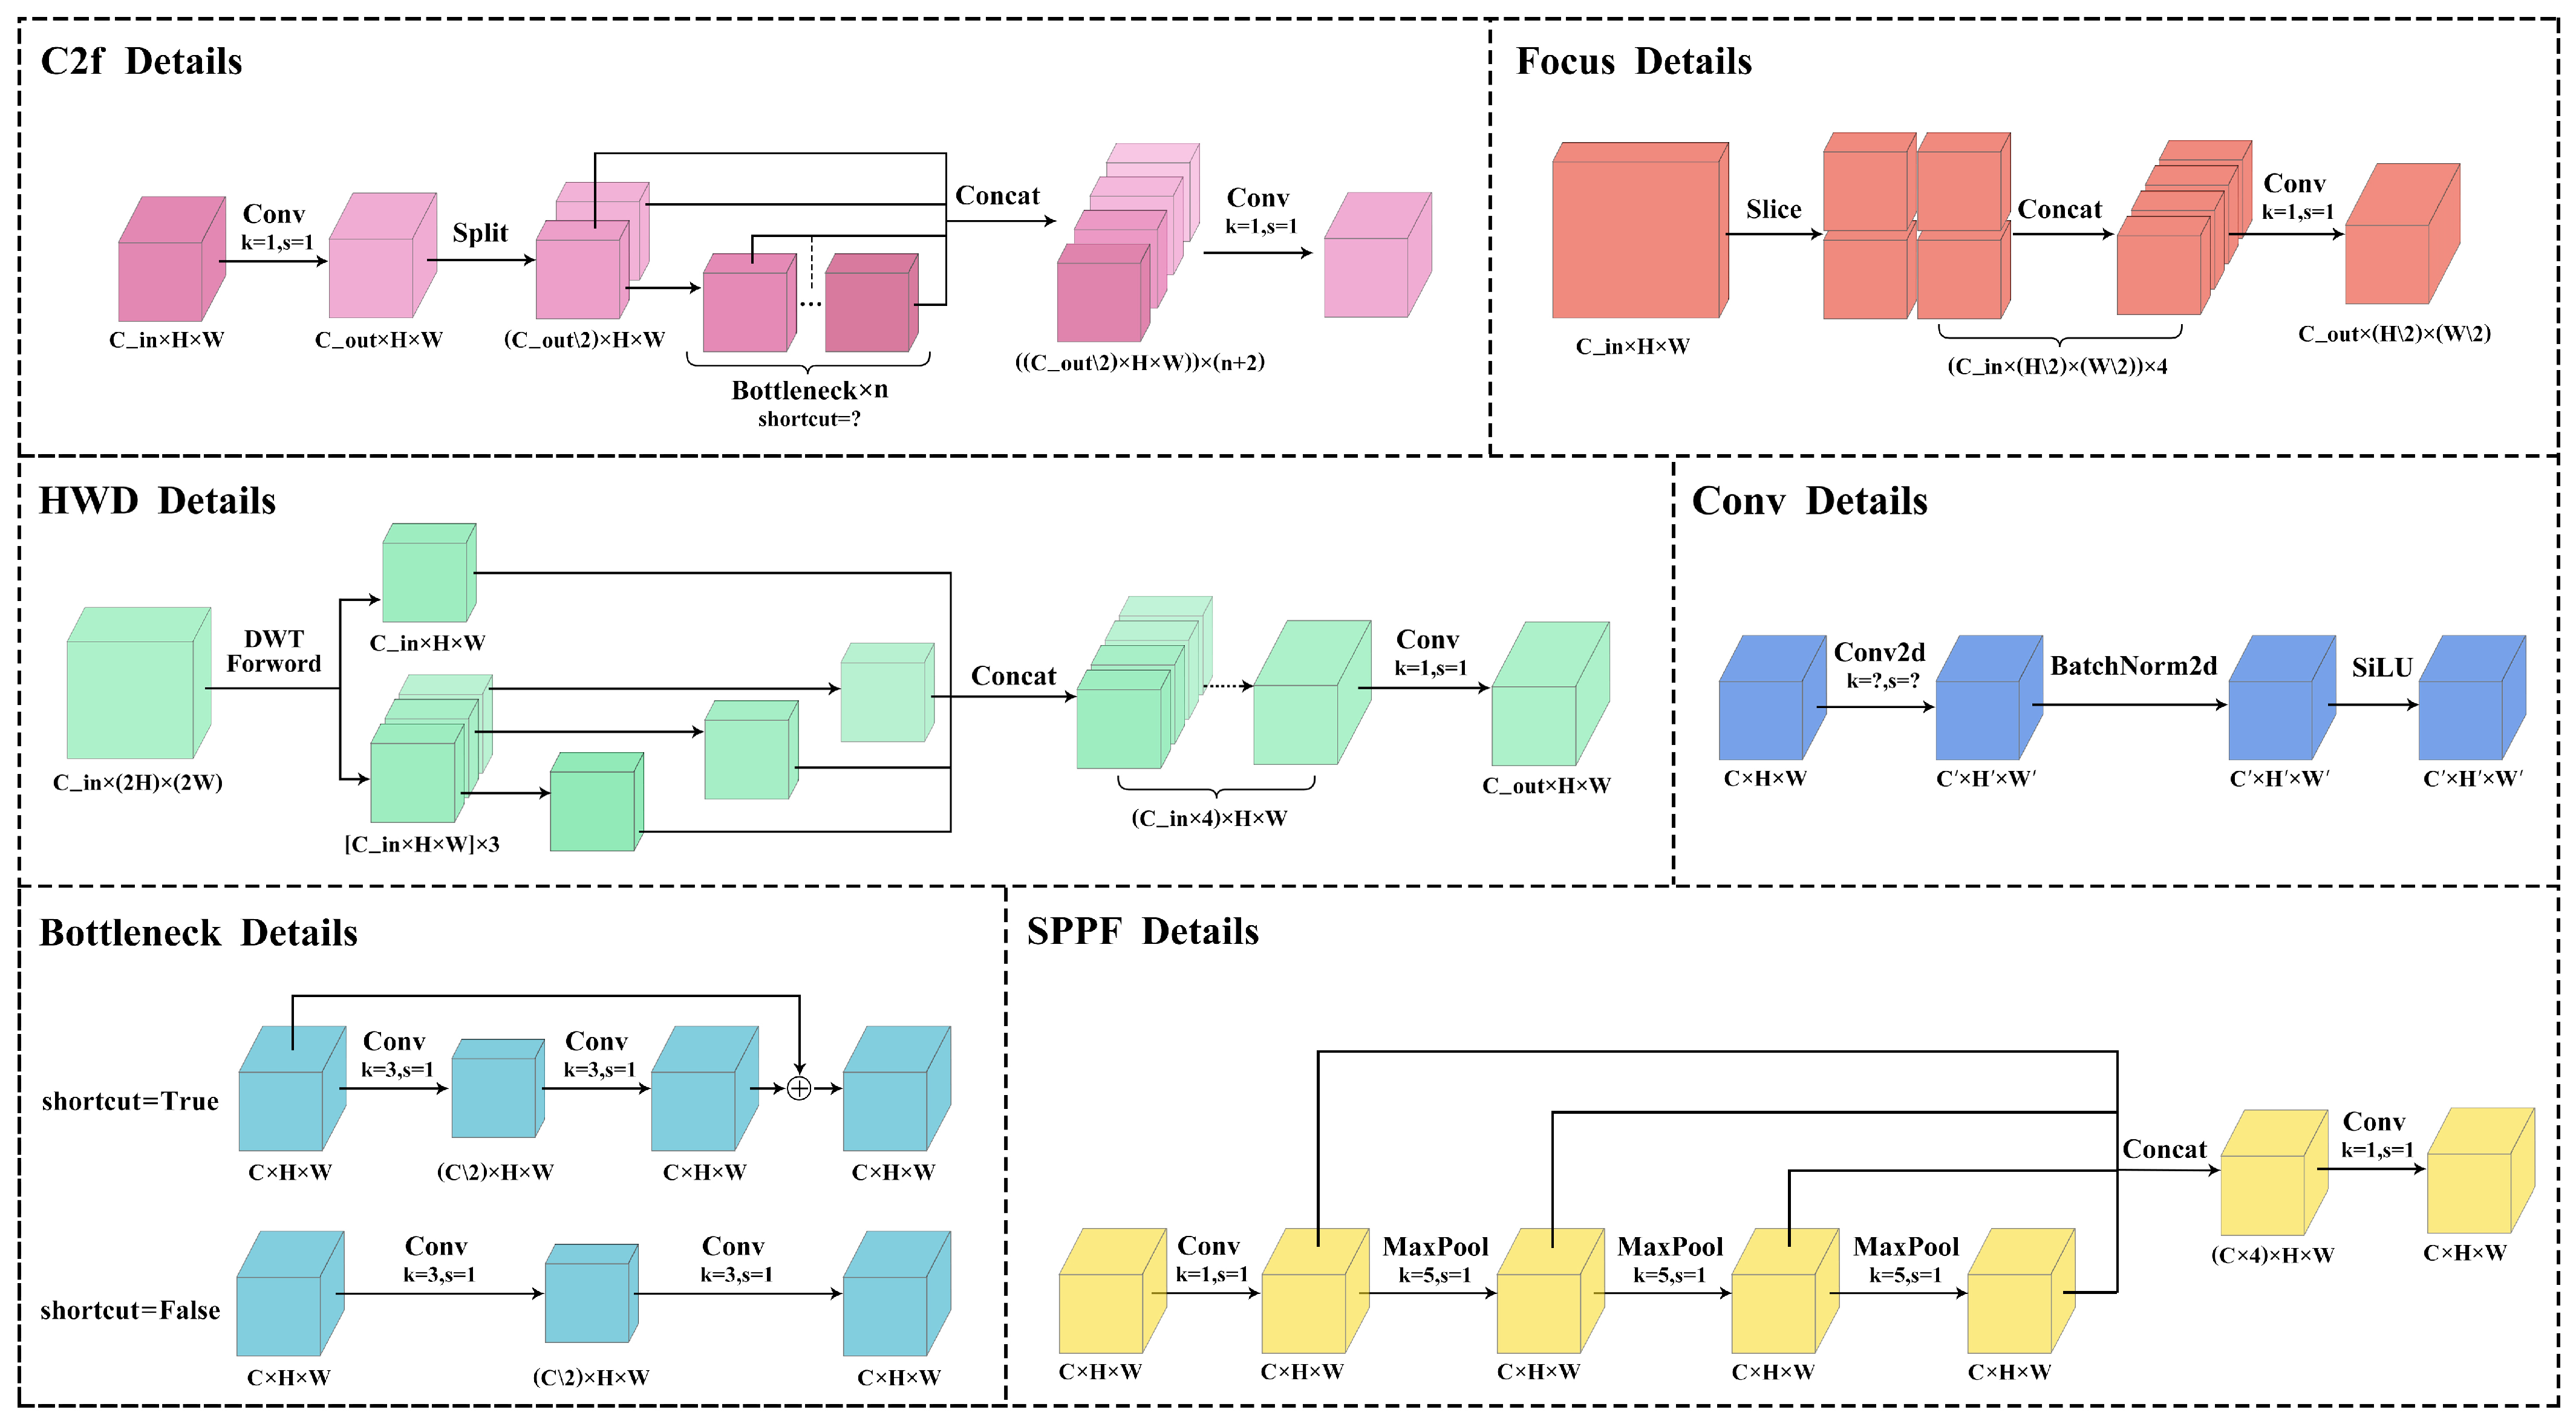
In the feature extraction phase, a more lightweight backbone network is employed to derive data feature representations, primarily composed of four modules. The module details are shown in Figure 5.
Firstly, The foundational building block of the network is the Conv module, comprising two-dimensional Convolution, Batch Normalization, and the SILU activation function. This module extracts low-level features, such as edges and textures, from the input images, while the non-linear transformation induced by the activation function enhances the representational capacity of the extracted features, thereby establishing a robust initial feature set for subsequent detection tasks.The C2f module, a variant of the Cross-Stage Partial (CSP) structure [36], incorporates Partial Residual Connections [37], significantly reducing computational cost through layered feature fusion and parameter sharing while mitigating the gradient vanishing problem in deep networks. This enhances the model’s learning efficiency for complex terrain features, such as crater depth and edge contours. The Focus module [38] segments high-resolution images into multiple sub-regions and performs channel-wise concatenation, effectively compressing spatial resolution information and reducing computational overhead. Simultaneously, by integrating multi-scale features, it boosts the model’s sensitivity to small-sized craters, optimizing localization accuracy in target detection. The downsampling process is handled by the Haar Wavelet Downsampling (HWD) module [39], which encodes the high-frequency and low-frequency spatial information of the image into the channel dimension using the Haar wavelet transform. This approach maximally preserves critical information while reducing the spatial resolution of the feature map, followed by pointwise convolution to extract discriminative features. This approach reduces the parameter count and spatial dimensions of feature maps while preserving critical terrain information, ensuring lightweight deployment and maintaining detection performance, which are suitable for resource-constrained lunar exploration scenarios. By iteratively applying these modules, the backbone network extracts feature representations at three scales: large, medium, and small. Following the extraction of these multi-source features, they are dynamically integrated via the Attention Fusion module, with detailed design specifics outlined in Section 3 of this chapter. This module primarily employs an attention mechanism to adaptively weight and fuse features from CCD and DTM sources, emphasizing critical regional information and subsequently passing the processed results to the feature fusion layer.
Extensive experiments validate the backbone network’s high efficiency in processing CCD and DTM data, excelling in lunar remote sensing image analysis. Specifically, it extracts high-resolution optical features from CCD data, including micro-textures, albedo, shadows, and reflectance properties. These features provide essential cues for identifying crater morphology, edge characteristics, and illumination-induced deformations. On the other hand, the DTM feature maps, through the analysis of elevation data, precisely extract three-dimensional spatial information closely related to crater morphology, such as terrain slope, depression depth, aspect distribution, and surface undulations. These parameters are particularly critical in lunar terrain analysis, enabling effective differentiation of crater geometry from surrounding topographic features, thereby significantly enhancing the model’s detection accuracy and robustness under complex lunar terrain conditions.
In the feature fusion phase, the Spatial Pyramid Pooling-Fast (SPPF) module is employed to facilitate multi-scale feature learning [40]. Through multi-level pooling operations, it effectively captures spatial context information across various scales and transmits the processed results to the neck layer. The neck layer similarly leverages the four foundational modules of the backbone network, integrating them into a structure combining PANet [41] and FPN [42]. This design adopts a bidirectional path fusion mechanism, encompassing top-down and bottom-up pathways, to address the limited receptive field of shallow networks. This optimization significantly enhances the aggregation of cross-scale features and improves the flow of semantic information to lower-level features, particularly boosting performance in small target detection. The top-down path fusion further refines the balance between spatial resolution and semantic information in the feature maps, enhancing the precision of bounding box localization.
Subsequently, three detection heads operate in parallel across different scales to predict bounding boxes, class probabilities, and confidence scores, thereby achieving high-precision lunar crater detection under complex lunar surface conditions.

3.3. Attention Feature Fusion Module Architecture

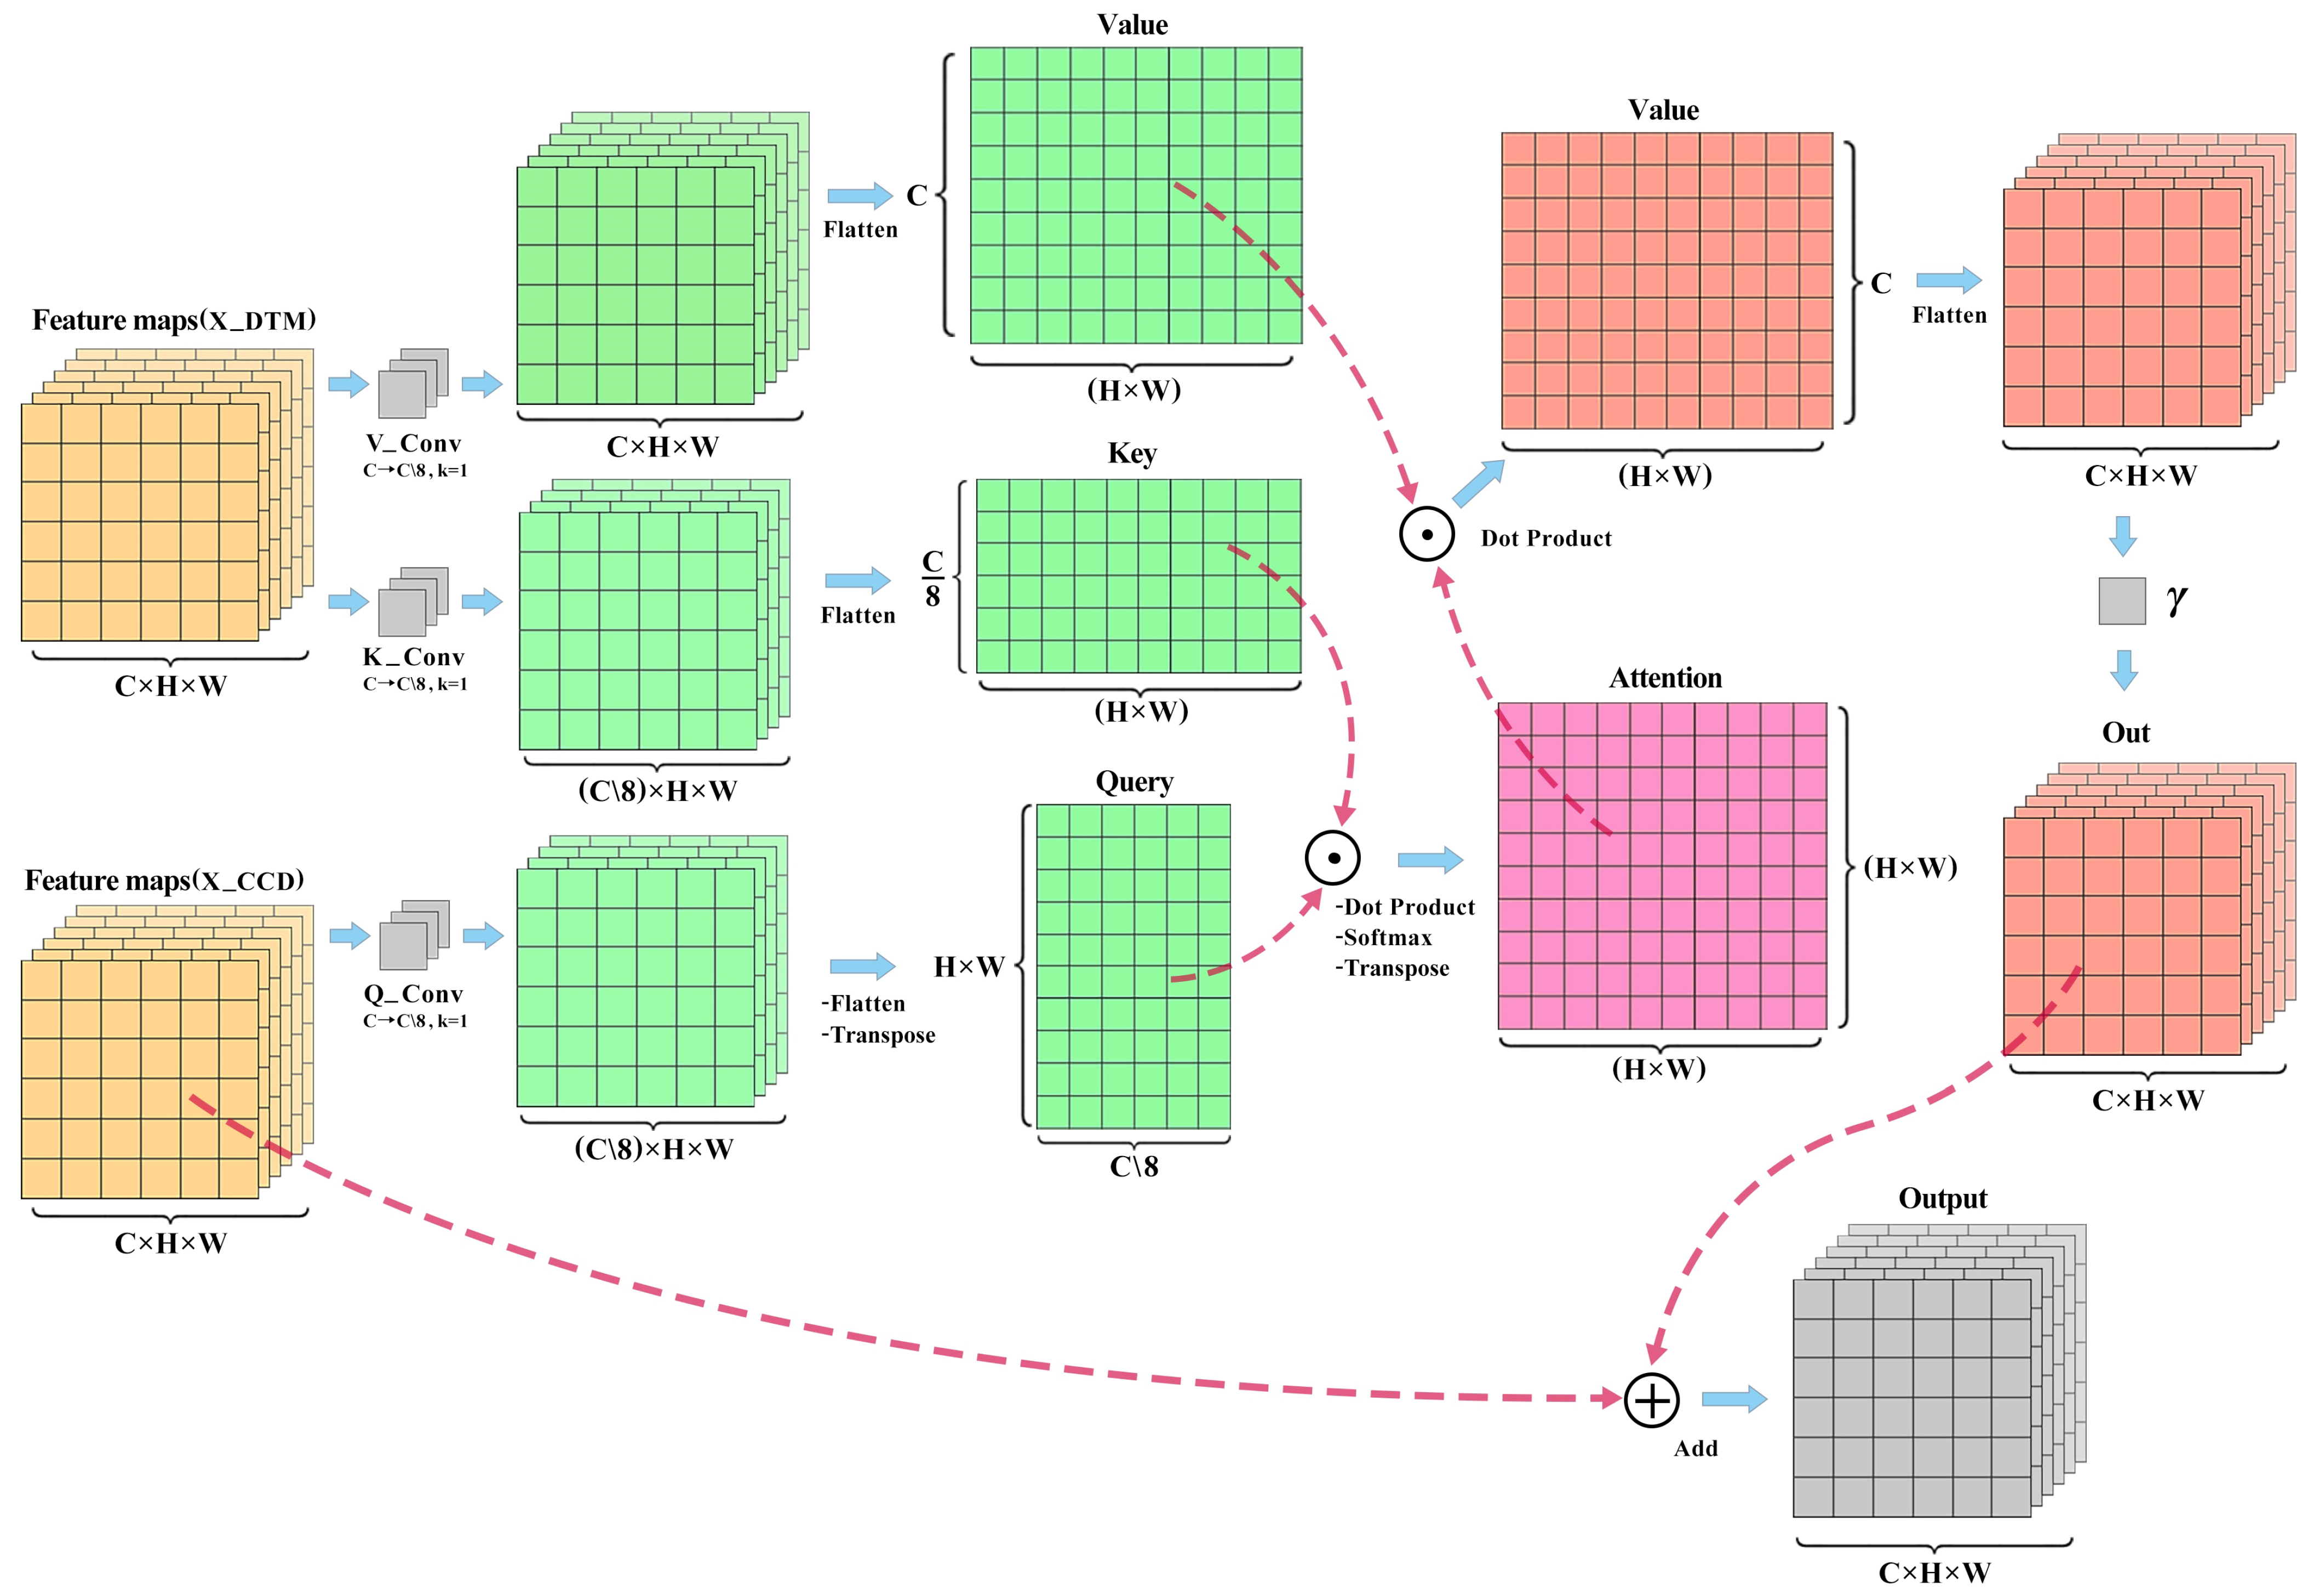
In the core challenge of multi-source image fusion, effectively integrating features from different data modalities is critical for achieving high-performance lunar crater detection. This study proposes an Attention Feature Fusion module, inspired by the Across Attention mechanism [43], specifically designed to fuse CCD images and DTM data to enhance the robustness and accuracy of the detection task. The architecture of this module, as illustrated in Figure 6, centers on generating Query, Key, and Value representations using 1 × 1 convolutional layers. To reduce computational overhead, the channel dimension of the input feature maps is compressed from C to C / 8 , which is a design that maintains feature representation capability while significantly decreasing parameter count and computational complexity. Subsequently, the Query and Key tensors are reshaped and transposed, and spatial attention weights are computed via batch matrix multiplication. A bilinear attention mechanism, combined with Softmax normalization, is employed to generate the attention distribution, ensuring the model adaptively focuses on the most critical regional information related to crater morphology. The Value features are then combined with the attention weights through another batch matrix multiplication, producing a weighted feature representation that preserves multi-scale contextual information and highlights key terrain characteristics.
Experimental validation demonstrates that the model increasingly focuses on texture information during the learning process. To further enhance the fusion efficacy of the module, a residual connection is incorporated, fusing the weighted feature representation with the original CCD features. This approach preserves the raw input feature information and mitigates the risk of overfitting. Additionally, a learnable scalar parameter γ is introduced, dynamically adjusting the contribution weights of each modality through parameter optimization during training. This mechanism enables the model to adaptively balance the optical features of CCD images (e.g., texture and albedo variations) with the terrain information from DTM data (e.g., slope and depression depth), thereby achieving effective integration of multi-source information. Overall, the Attention Feature Fusion module, through its structured attention mechanism and residual fusion strategy, not only enriches feature representation but also provides high-performance support for target detection under complex lunar surface conditions.
Let the input feature maps be X C C D R B × C × H × W and X D T M R B × C × H × W , the output is Y, and the computation steps are as follows:
  • Feature Dimension Reduction:
    Q = reshape Conv 1 × 1 X CCD , C C 8 T R ( B , H × W , C 8 )
    K = reshape Conv 1 × 1 X DEM , C C 8 R ( B , C 8 , H × W )
    V = reshape Conv 1 × 1 X DEM , C C R ( B , C , H × W ) .
  • Attention Computation:
    A = s o f t m a x ( Q · K ) R ( B , H × W , H × W )
    O = r e s h a p e ( V · A T ) R ( B , C , H , W )
  • Residual Connection:
    Y = γ · O + X C C D
  • Gradient Calculation of the Loss Function with respect to γ :
    F γ = F Y · O
The optimizer updates the learnable parameter γ based on the computed gradients, enabling it to dynamically adapt to the characteristics of the input data during each training iteration. The initial value of γ is set to 0, which means the incremental contribution of DTM features starts from zero.

3.4. Evaluation Metrics

In this study, we adopt precision, recall, and mean average precision (mAP) as evaluation metrics, which are widely used in the field of object detection. Specifically, precision measures the proportion of samples predicted as craters that are actually craters. A high precision indicates fewer false predictions, reflecting the reliability of the model’s predictions. Recall, also known as the true positive rate, measures the proportion of actual crater samples correctly identified by the model, demonstrating the model’s ability to cover true craters. A high recall indicates that the model can detect a greater number of true craters. The Intersection over Union (IoU) is used to assess the overlap between predicted and ground-truth bounding boxes, calculated as the ratio of the intersection to the union of the predicted and ground-truth boxes. We decompose mAP into two metrics: mAP50, which represents the mean average precision at an IoU threshold of 0.5, used to evaluate the model’s overall performance, and mAP50-95, which represents the mean average precision across IoU thresholds from 0.5 to 0.95, used to assess the model’s ability to precisely predict crater locations based on varying IoU thresholds.
Let False Negative (FN) denote the number of positive samples not detected by the model, True Positive (TP) denote the number of correctly predicted positive samples, and False Positive (FP) denote the number of negative samples incorrectly predicted as positive. P denotes precision, and R denotes the recall rate. The formulas for the above evaluation metrics are as follows:
P = T P T P + F P
R = T P T P + F N
AP measures the area under the precision–recall curve, where p ( r ) denotes the precision at recall rate r, B pred denotes the predicted bounding box, and B gt denotes the ground truth bounding box:
A P IoU = τ = 0 1 p ( r ) d r
IoU = | B pred B gt | | B pred B gt |
mAP 50 = A P IoU = 0.5
mAP 50 - 95 = 1 10 j = 1 10 A P IoU = τ j τ j { 0.50 , 0.55 , , 0.95 }
These metrics comprehensively reflect the detection accuracy and localization precision of the model, providing an objective basis for evaluating the performance of DBYOLO.

4. Experiments

4.1. Experiment Configurations

To ensure the reproducibility and consistency of experimental results, all experiments were conducted under a standardized hardware environment and training parameter configuration.
Experimental Environment: The experiments were performed on a Windows 10 Professional system equipped with an NVIDIA RTX 3060 graphics processor and implemented using the PyTorch framework (version 2.3.1). The NVIDIA RTX 3060 was selected for its excellent parallel computing performance, which efficiently supports the training and inference requirements of deep learning models. The PyTorch framework was chosen due to its widespread use in computer vision, flexible programming interface, and high compatibility with the YOLOv8n model. Detailed hardware and software configurations are listed in Table 1.
Training Parameters: The model was trained for 200 epochs with a batch size of 8, an initial learning rate of 0.01, and a cosine annealing learning rate scheduling strategy. The choice of 200 epochs ensures sufficient convergence of model parameters while controlling computational resource consumption to improve experimental efficiency. A batch size of 8 was selected to balance the 8GB memory capacity of the NVIDIA RTX 3060 and the stability of gradient updates. A larger batch size may lead to memory overflow, while a smaller batch size may introduce random noise, affecting model convergence. The initial learning rate of 0.01, combined with the cosine annealing strategy, enables rapid parameter optimization in the early stages of training and stable convergence in later stages through progressive learning rate decay. A weight decay parameter of 0.0005 was applied to impose moderate regularization effectively mitigating the risk of overfitting while maintaining the model’s ability to fit the data.
Original images were cropped to 608 × 608 pixels to generate more sub-images from a single image, significantly expanding the sample size of the training, validation, and test datasets to enhance the model’s generalization ability. During the training and inference phase, the YOLOv8n model automatically resamples input images to 640 × 640 pixels. If the crop size is too small (e.g., 320 × 320 or 416 × 416 pixels), resampling to 640 × 640 pixels may cause image feature stretching or distortion, leading to the loss of critical information. The crop size of 608 × 608, being close to the model’s input resolution of 640 × 640, maximizes the retention of original image details during resampling while balancing data augmentation effects and computational efficiency. The training, validation, and test datasets contain 2769, 574, and 574 CCD and DTM images, respectively. The data split ensures a balanced sample distribution, providing a reliable foundation for comprehensive model training and performance evaluation. Detailed parameter configurations are provided in Table 2.

4.2. Comparison Experiments and Analysis

4.2.1. Comparing Mainstream Detection Models Using a Single Dataset

To comprehensively validate the detection performance of our proposed backbone network, we initially adopted an experimental design utilizing single data sources, employing CCD images and DTM as inputs. This approach facilitated a systematic comparison of our backbone architecture with state-of-the-art target detection models, including RetinaNet [44], Faster R-CNN, RT-DETR, YOLOv8, YOLOv10 [45], YOLOv11 [46], and YOLOv12 [47]. These models have demonstrated exceptional detection capabilities in their respective developments and are widely applied across diverse scenarios. Each model was independently trained on CCD and DTM to evaluate its performance on single-modality data. To ensure the fairness and comparability of the experimental results, all models were trained on the same dataset. Benchmark testing of these models provides a comprehensive assessment of the detection accuracy, computational complexity, and overall efficacy of the backbone network employed in DBYOLO. The overall comparative experimental results are presented in Table 3.
Experimental results demonstrate significant performance variations among different detection models in the lunar crater detection task. Specifically, Faster R-CNN achieves an mAP50 of 0.654 and an mAP50-95 of only 0.431 on CCD images, while RetinaNet records an mAP50 of 0.603 on the same dataset. Their relatively weak performance in lunar detection tasks can be attributed to inherent limitations in their algorithmic design. Faster R-CNN employs a two-stage detection process combined with spatial pooling of candidate regions, which results in suboptimal performance when processing small, densely distributed craters with blurred boundaries. This limitation is particularly pronounced in high-resolution lunar images, where the reduction in spatial resolution further diminishes its ability to capture fine-grained features. Similarly, RetinaNet’s lack of multi-scale feature extraction and global context reasoning capabilities hinders its ability to effectively differentiate non-crater structures on the lunar surface from actual craters, thereby constraining its detection accuracy. In contrast, RT-DETR outperforms both models, with its Transformer-based attention mechanism enhancing feature representation. However, it is noteworthy that Faster R-CNN, RetinaNet, and RT-DETR exhibit parameter counts of 28M, 36M, and 20M, respectively, which significantly exceed those of the YOLO series. This substantial parameter overhead limits the applicability of these three models in resource-constrained scenarios or real-time processing tasks.
In contrast, the YOLO series models demonstrate significant advantages in lunar crater detection tasks, owing to their multi-scale detection mechanisms, lightweight network architectures, and efficient feature fusion capabilities. These attributes enable the models to adapt to the diverse target detection requirements presented by the complex terrain of the lunar surface. Experimental data indicate that YOLOv8 achieves a precision of 0.741 and a recall of 0.685 on CCD images, with an mAP50 of 0.763, substantially outperforming traditional models such as Faster R-CNN and RetinaNet. Moreover, YOLOv8 maintains a parameter count of only 3M, which is significantly lower than the 28M to 36M of conventional methods, underscoring the alignment of the YOLO series with the demands of lunar detection tasks. Subsequent iterations, such as YOLOv11 and YOLOv12, have undergone further optimization, with newer versions achieving network lightweighting through a modest trade-off in detection performance. This reflects the positive contributions of attention mechanisms and feature fusion strategies, which effectively enhance the models’ ability to extract multi-scale features. However, this optimization comes at a cost: YOLOv12, while preserving its lightweight design, exhibits a diminished capacity for precise object prediction. This is evidenced by its mAP50-95 of 0.466 on CCD images, a 1.2% reduction compared to YOLOv8’s 0.478, indicating a decline in localization accuracy at higher IoU thresholds.
Based on the above experimental results and analysis, YOLOv8 performs comparably to other YOLO models in terms of precision and recall but outperforms them on the key evaluation metrics mAP50 and mAP50-95. Therefore, YOLOv8 was selected as the baseline model. To comprehensively evaluate the performance of the YOLOv8 series models in the lunar crater detection task, we selected the high-performing CCD dataset to test five variants of different scales: YOLOv8n, YOLOv8s, YOLOv8m, YOLOv8l, and YOLOv8x. Table 4 presents the experimental data of these models on the CCD image dataset.
As the smallest variant in the YOLOv8 series, YOLOv8n has significantly lower computational resource requirements compared to larger models such as YOLOv8s or YOLOv8m, which is critical for our research as we aim to develop a model deployable in resource-constrained environments, which is a common scenario in remote sensing applications. The compact architecture of YOLOv8n achieves faster inference speeds while maintaining a high mAP on our CCD dataset. According to the experimental data in Table 4, YOLOv8n achieves an mAP50 of 0.763 with only 3 million parameters, which is slightly lower than larger models like YOLOv8s or YOLOv8m, but with significantly fewer parameters and an inference speed of 0.8 ms, which is notably faster than YOLOv8m (2.4 ms) and YOLOv8l (2.7 ms). Additionally, YOLOv8n’s training time is 1.1 h, which is much shorter than YOLOv8m (2.1 h) and YOLOv8l (2.6 h). The selection of YOLOv8n is based on its optimal balance between model size, computational efficiency, and performance in the lunar crater detection task. Therefore, the DBYOLO proposed in this study is improved upon the foundation of YOLOv8n to meet the needs of resource-constrained scenarios, enhancing the model’s practicality.
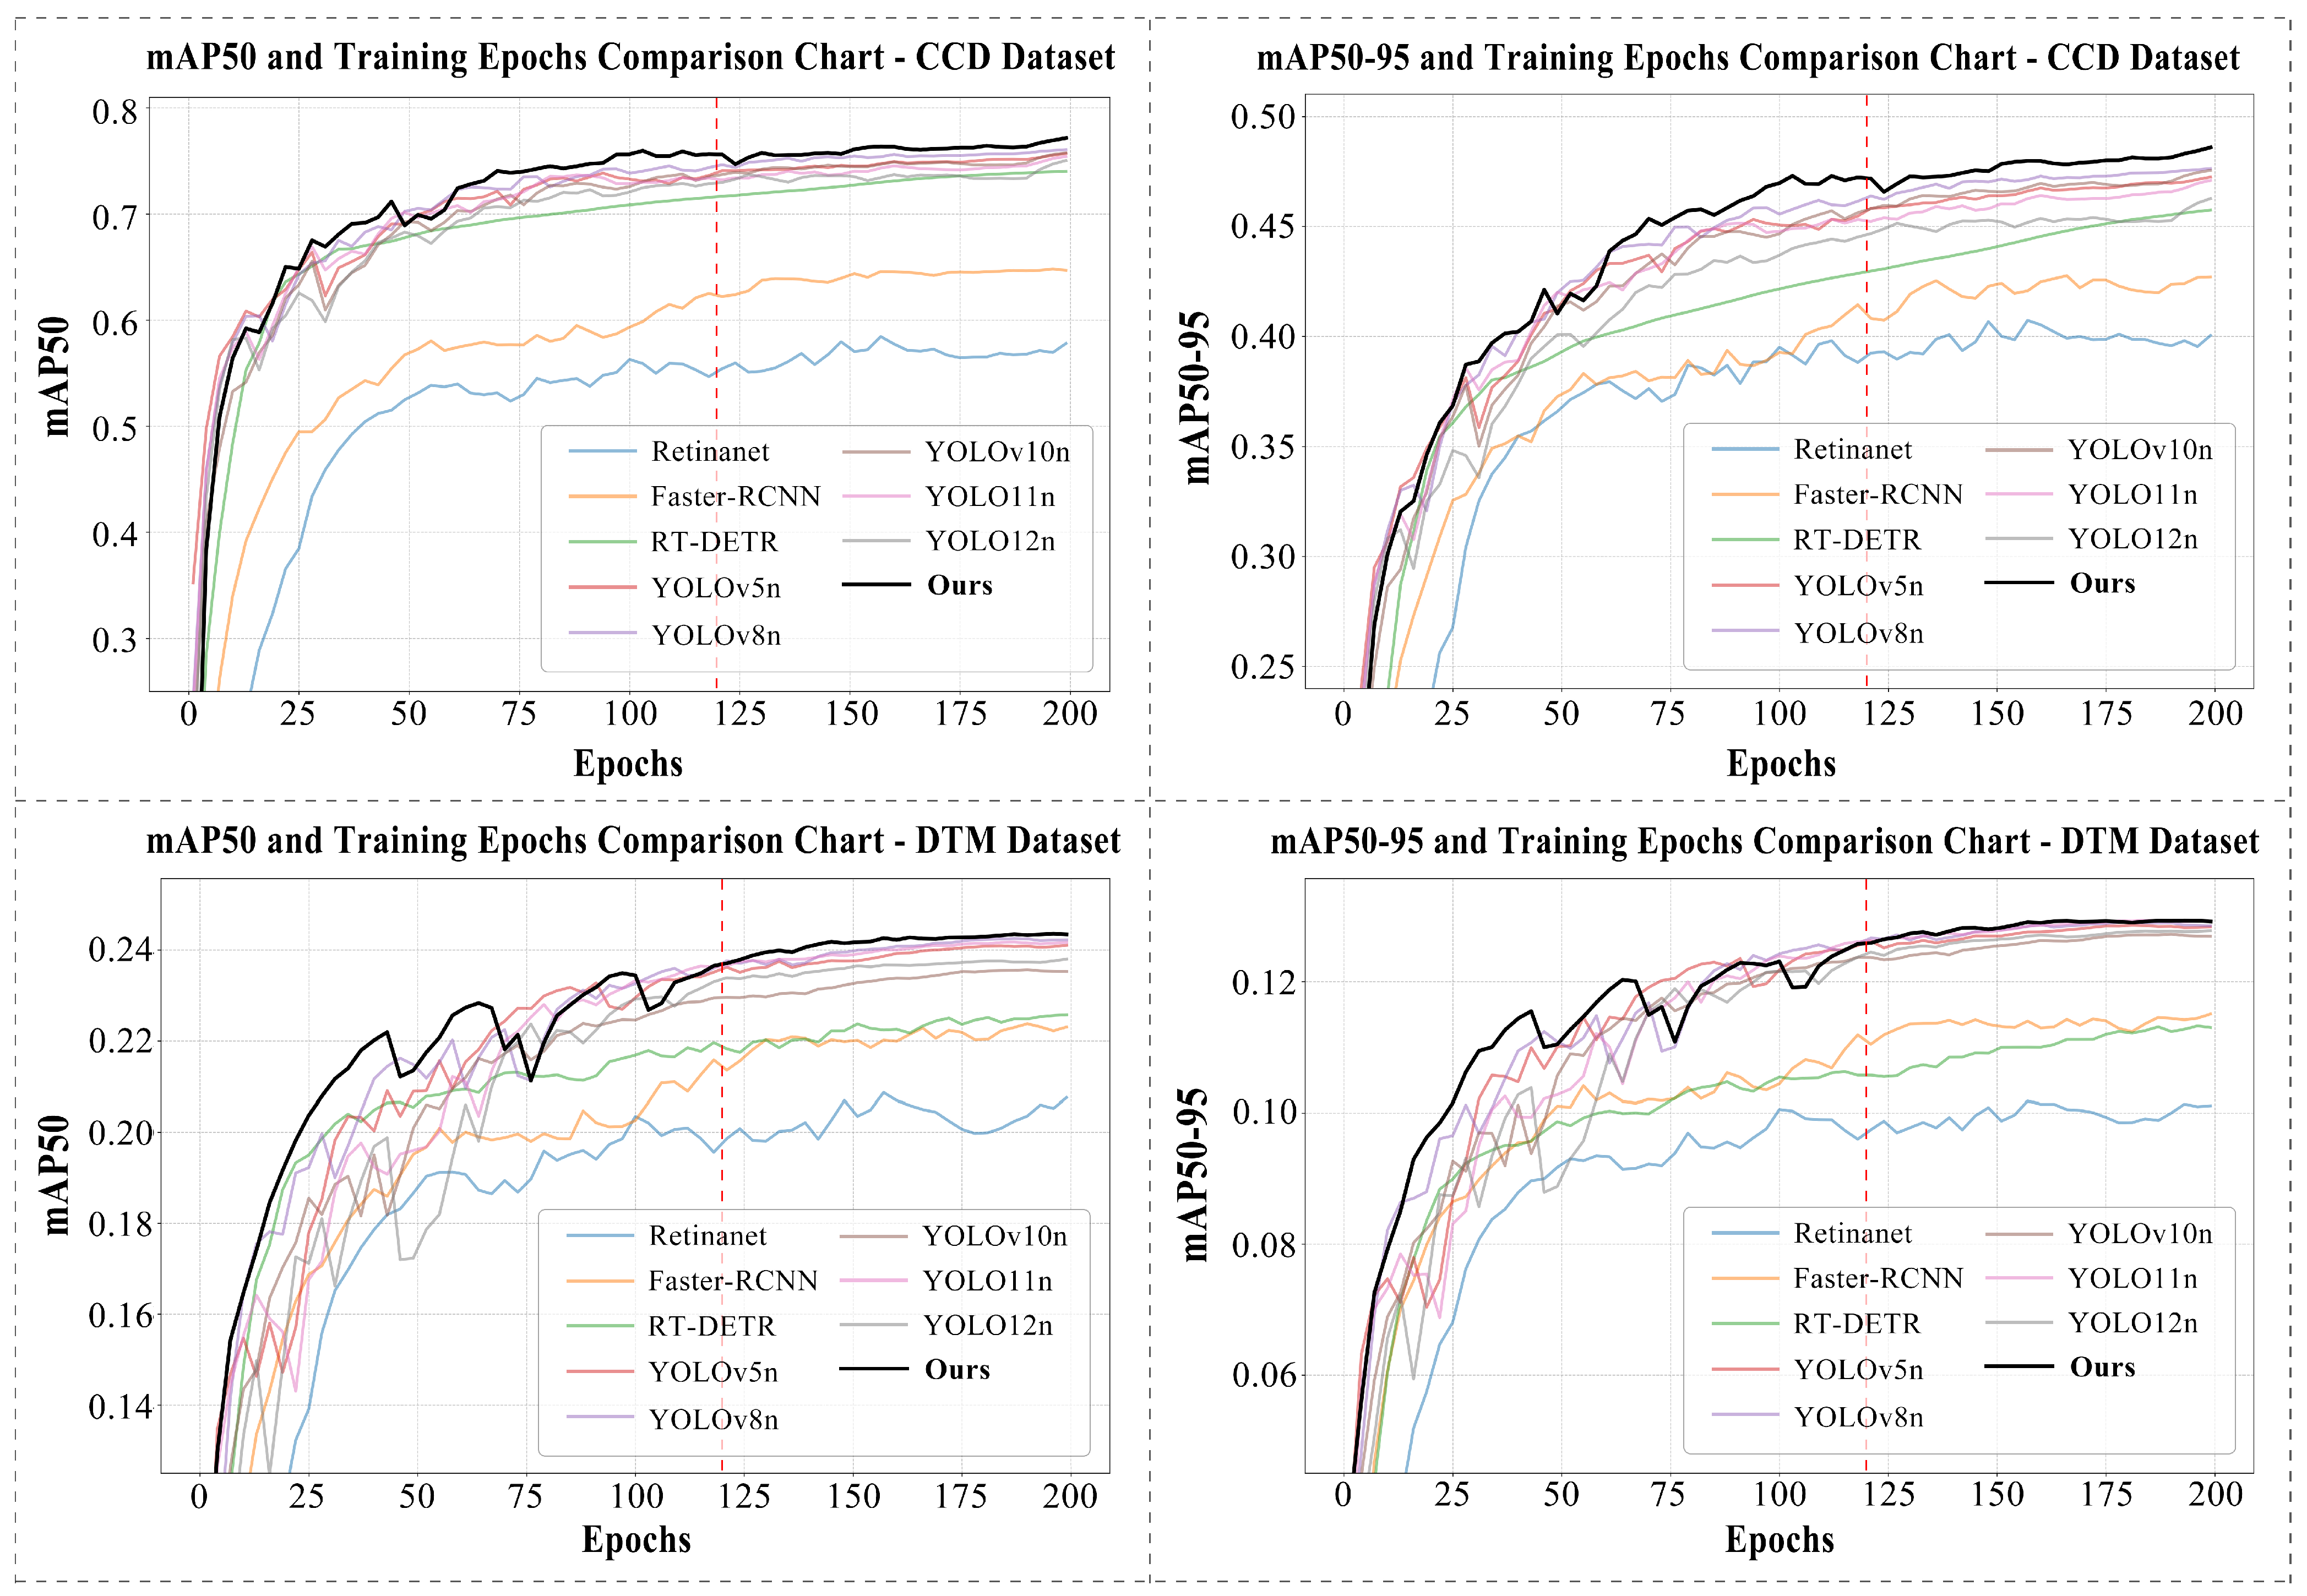
In the comparison of all models, training with the DBYOLO single-backbone network outperformed baseline models in the key detection performance metrics mAP50 and mAP50-95 on both CCD and DTM datasets. On the CCD dataset, the DBYOLO single-backbone network achieved a precision of 75%, recall of 69.5%, mAP50 of 77.6%, and mAP50-95 of 48.9%, representing improvements of 0.9%, 1%, 1.3%, and 1.1% over YOLOv8n, respectively. On the DTM dataset, performance also showed slight improvements. In terms of parameter count, the DBYOLO backbone performed well with only 2.6M parameters. While the performance gain on the DTM dataset was less pronounced, DBYOLO effectively balanced computational efficiency and detection performance, demonstrating strong robustness and generalization in lunar crater detection. As shown in Figure 7, the mAP versus training epoch plot further validates its superior performance.
The line chart illustrates the performance comparison of different models on the CCD and DTM datasets, based on training epochs, in terms of mAP50 and mAP50-95 metrics. The model trained with the DBYOLO backbone exhibits faster convergence and more stable performance improvements in the early stages, ultimately achieving higher detection accuracy. This advantage stems from the wavelet transform’s ability to effectively extract key features such as crater edges, depth, and texture through high-pass filtering. This significantly enhances the model’s capability to capture multi-scale features of lunar craters, thereby providing more precise feature representations for detection decisions. The line chart comparison shows significant fluctuations in the performance curve during the first 120 epochs, followed by a steady and gradual upward trend in the final 80 epochs without notable oscillations, disabling mosaic data augmentation results in smoother performance improvements. By reducing the number of channels instead of using pooling operations, HWD effectively minimizes parameter complexity, making it well-suited for high-resolution crater images. Based on the analysis of Figure 7 and Table 3, it is evident that the model’s performance on the CCD dataset significantly surpasses that on the DTM dataset, providing a theoretical basis for prioritizing CCD dataset feature maps as residual connections in the dual-backbone network fusion module.

4.2.2. Comparing Mainstream Detection Models Using Multiple Datasets

To systematically evaluate the detection performance of DBYOLO in multi-source data scenarios, we extended the experimental design by adopting CCD and DTM datasets as joint inputs to thoroughly validate the model’s capabilities in multi-source data fusion. Based on the experimental results presented in Table 3, we selected high-performing YOLO series models, including YOLOv5, YOLOv8, YOLOv10, YOLOv11, and YOLOv12, as the backbone networks for comparative experiments. These YOLO models were modified to incorporate a dual-backbone structure to separately process feature extraction for CCD and DTM data. The Attention Feature Fusion module proposed in this paper is used for feature fusion, thereby exploring the potential of multi-source data fusion at the feature level.
To ensure the comprehensiveness and validity of the comparisons, we selected several state-of-the-art multi-source fusion networks as baseline models, including DEYOLO, CDC-YOLOFusion [48], and SuperYOLO. These models have demonstrated excellent performance in multi-source data fusion tasks, particularly in scenarios involving the fusion of visible and infrared images, achieving superior results on the LLVIP pedestrian dataset and the VEDAI vehicle remote sensing dataset. To maintain consistency in experimental conditions, we configured these baseline models to also use CCD and DTM datasets as inputs, enabling an evaluation of their generalization capabilities under novel multi-source data combinations.
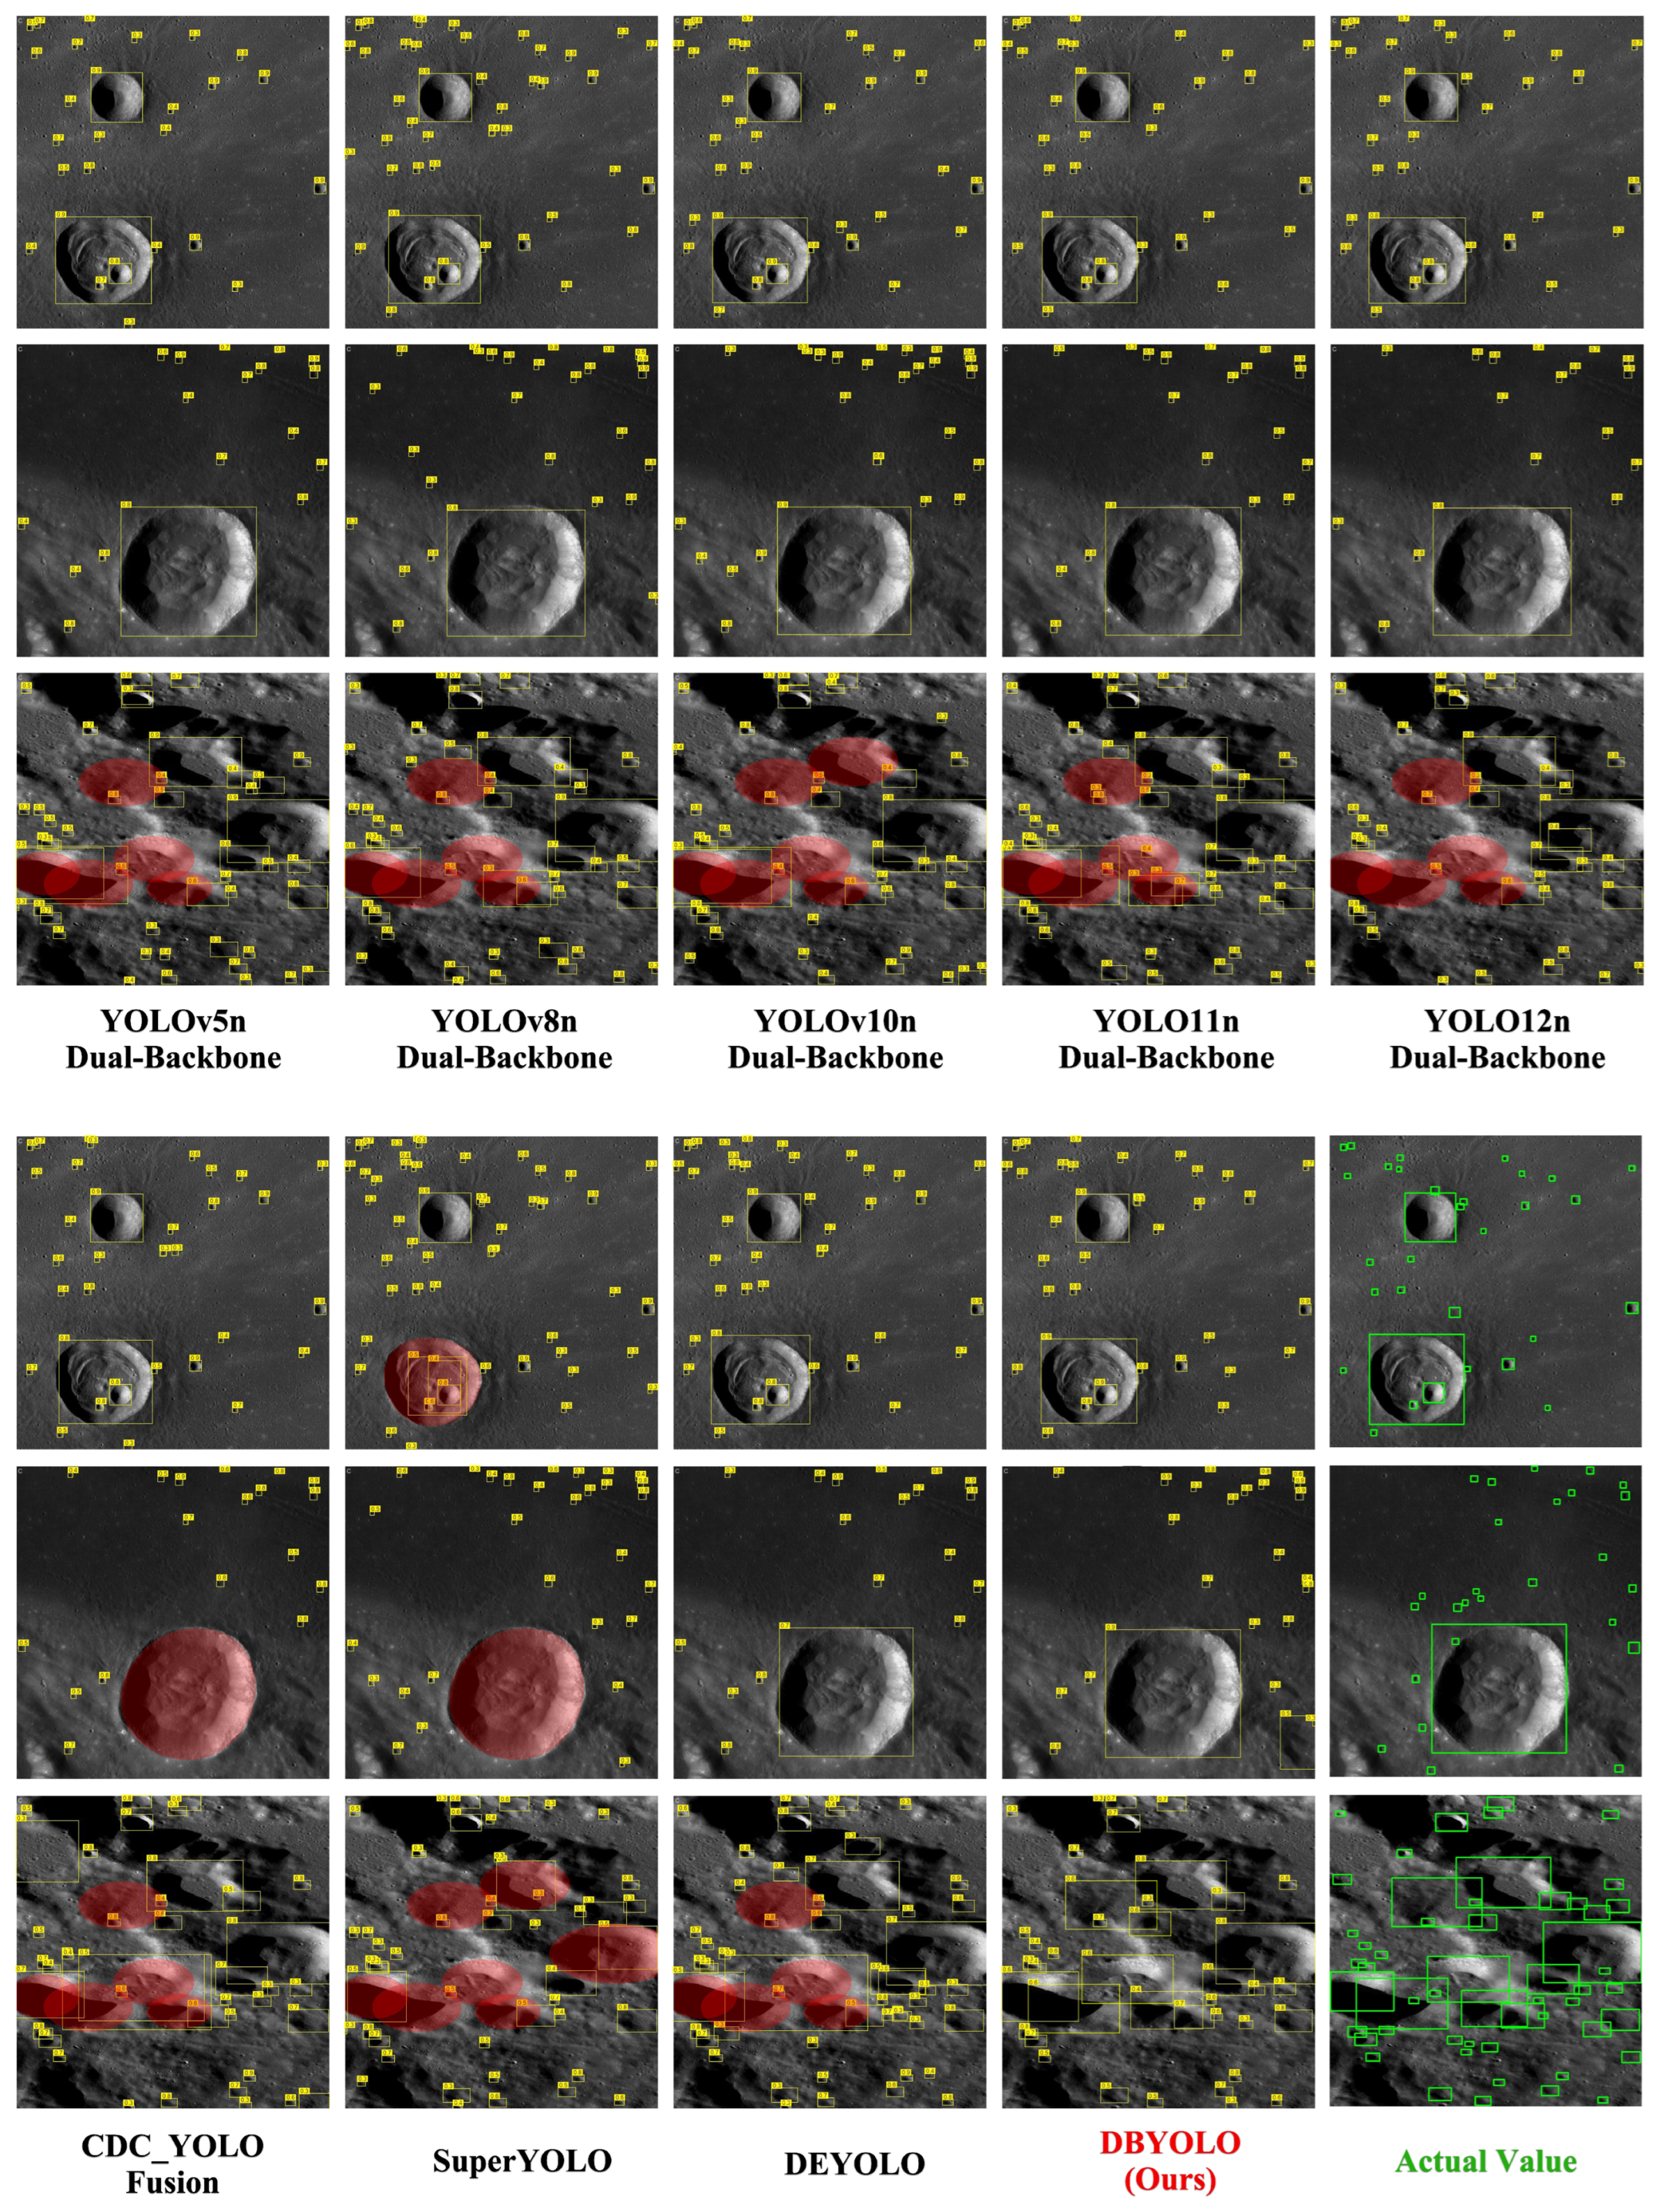
By comparing the dual-backbone YOLO series models with the aforementioned multi-source fusion networks in terms of detection accuracy (e.g., mAP) and parameter count, we aim to further elucidate the potential advantages and limitations of DBYOLO and the baseline models in practical application scenarios. The experimental results are presented in Table 5. In addition, model prediction maps were generated using three lunar CCD images, as shown in the Figure 8, to visually compare the performance of different models.
In multi-source data fusion scenarios, mainstream fusion network models such as DEYOLO, CDC-YOLOFusion, and SuperYOLO significantly underperform compared to DBYOLO across all evaluation metrics (precision, recall, mAP50, mAP50-95). The reasons can be analyzed in depth from aspects such as model architecture, feature fusion strategies, and data adaptability. SuperYOLO employs the SENet attention mechanism to fuse multi-source data before feature extraction and adopts a single detection head design. This simplified architecture limits its feature representation capability in complex multi-source fusion tasks, failing to fully capture the heterogeneity and complementarity of CCD (high-frequency texture details) and DTM (elevation information) data, resulting in lower mAP50 (0.625) and mAP50-95 (0.357).
In contrast, DEYOLO and CDC-YOLOFusion perform well on RGB-IR datasets, mainly due to the relatively balanced feature contributions of RGB and infrared data, although their fusion strategies typically do not emphasize modeling spatial structural relationships. However, in the CCD-DTM fusion scenario, CCD data provides high-resolution texture information, while DTM data contains spatial elevation information. The significant modal differences between the two require models to effectively model spatial geometric relationships and cross-modal complementary characteristics during feature fusion. DEYOLO (mAP50: 0.713, mAP50-95: 0.446) and CDC-YOLOFusion (mAP50: 0.692, mAP50-95: 0.404) rely on convolution-based fusion modules with high parameter counts (6,008,143 and 9,116,115, respectively). However, their lack of optimization for the heterogeneous characteristics of CCD-DTM data leads to inadequate spatial feature modeling, lower fusion efficiency, and limited detection performance. YOLO series dual-backbone models (e.g., YOLOv5n, YOLOv8n) demonstrate stronger fusion capabilities through Attention Feature Fusion modules, outperforming convolution-based DEYOLO and CDC-YOLOFusion. This indicates that attention mechanisms are more effective in focusing on the spatial structural relationships of heterogeneous data, showing advantages in the crater detection task.
In contrast, DBYOLO employs a lightweight dual-backbone network that leverages wavelet transforms and slicing for feature map downsampling, combined with an Attention Feature Fusion module, to effectively integrate semantic and spatial information from CCD and DTM data. With only 3.6M parameters, DBYOLO significantly outperforms other models in precision (77.2%), recall (70.3%), mAP50 (79.4%), and mAP50-95 (50.4%). Compared to the best-performing modified dual-backbone YOLOv8n, DBYOLO achieves a 1.4% higher mAP50 and a 1.5% higher mAP50-95. Additionally, compared to the best performance of the unmodified single-backbone YOLOv8n on CCD images, DBYOLO achieves improvements in precision (74.1%) by 3.1%, recall (68.5%) by 1.8%, mAP50 (76.3%) by 3.1%, and mAP50-95 (47.8%) by 2.6%. To further validate the detection capabilities of various dual-backbone models, we randomly selected two untrained images from the lunar maria region and one from a non-maria region, conducted crater detection, and generated prediction maps for nine models along with a true crater distribution map, totaling ten image sets. From Figure 8, it is observed that the modified dual-backbone networks of the YOLO family exhibit superior detection performance, with prediction boxes showing higher alignment with true labels compared to CDC-YOLOFusion, SuperYOLO, and DEYOLO. Notably, CDC-YOLOFusion and SuperYOLO failed to detect the largest craters shown in the two maria region images, whereas DBYOLO demonstrated exceptional performance in the more complex non-maria region. Its prediction boxes for larger craters exhibited a significantly higher overlap with the green ground truth boxes compared to other models. In the maria region, DBYOLO’s detection performance was comparable to other YOLO models. These experimental results and prediction maps effectively validate that DBYOLO, through optimized architectural design and efficient feature fusion strategies, successfully addresses the shortcomings of other models in adapting to the spatial characteristics of CCD-DTM data fusion and balancing model complexity with performance. It achieves accurate localization and robust detection capabilities in complex terrain environments, showcasing excellent generalization and practical application potential.

4.2.3. Experimental Comparison of Mainstream Fusion Modules

To systematically evaluate the effectiveness of the proposed Attention Feature Fusion module, we replaced it in the DBYOLO model with several commonly used feature fusion methods in the remote sensing domain for comparative experiments. These methods include the following: (1) basic fusion operations in deep learning: Add with Normalization and Concat with PointwiseConv; (2) modules demonstrating excellent performance in multi-source remote sensing image fusion: TFAM [49] and DFM [50]; and (3) feature map fusion modules widely applied in general object detection: MDFM [51] and BiFPN [52]. Through these comparative experiments, we comprehensively validate the performance advantages of the Attention Feature Fusion module in multi-source data fusion tasks and its contribution to the overall detection performance of the model. The experimental results are presented in Table 6.
The experimental results in Table 6 reveal significant performance variations across different feature fusion modules in terms of precision, recall, mAP50, and mAP50-95. Simple fusion strategies, such as Add with Normalization and Concat with PointwiseConv, overlook the complex relationships between multi-source data, leading to feature dilution and information loss, resulting in the poorest performance. TFAM (precision 0.659, recall 0.540, mAP50 0.584, mAP50-95 0.325) employs channel and spatial attention mechanisms for feature fusion but is not optimized for the heterogeneous characteristics of CCD and DTM data, yielding moderate performance. DFM (precision 0.599, recall 0.534, mAP50 0.549, mAP50-95 0.287), as a simple dual-modal fusion method, lacks adaptive weighting mechanisms, making it difficult to distinguish critical features from noise, thus resulting in poor performance. MDFM (precision 0.679, recall 0.598, mAP50 0.655, mAP50-95 0.371) demonstrates some advantages through multi-dimensional feature integration but is not specifically optimized for the complex requirements of lunar crater detection, leading to limited fusion efficiency. BiFPN (precision 0.612, recall 0.527, mAP50 0.548, mAP50-95 0.289) excels in single-modal multi-scale feature fusion but struggles to effectively handle the heterogeneity of CCD and DTM data in multimodal scenarios, performing similarly to DFM. The aforementioned modules all rely on convolutional operations, which are constrained by the local receptive fields of convolutional kernels, capturing only local features and requiring multiple convolutional layers to indirectly model global information. This can lead to the loss of long-range dependencies or reduced modeling efficiency. In contrast, the Attention Feature Fusion module significantly outperforms other modules with a precision of 0.770, recall of 0.703, mAP50 of 0.794, and mAP50-95 of 0.504. Its core strength lies in leveraging cross-attention, which computes the correlation between each element in CCD and DTM features and all other elements through dot-product operations. This enables the module to capture global dependencies in just two computations, effectively integrating the complementary characteristics of multimodal data.
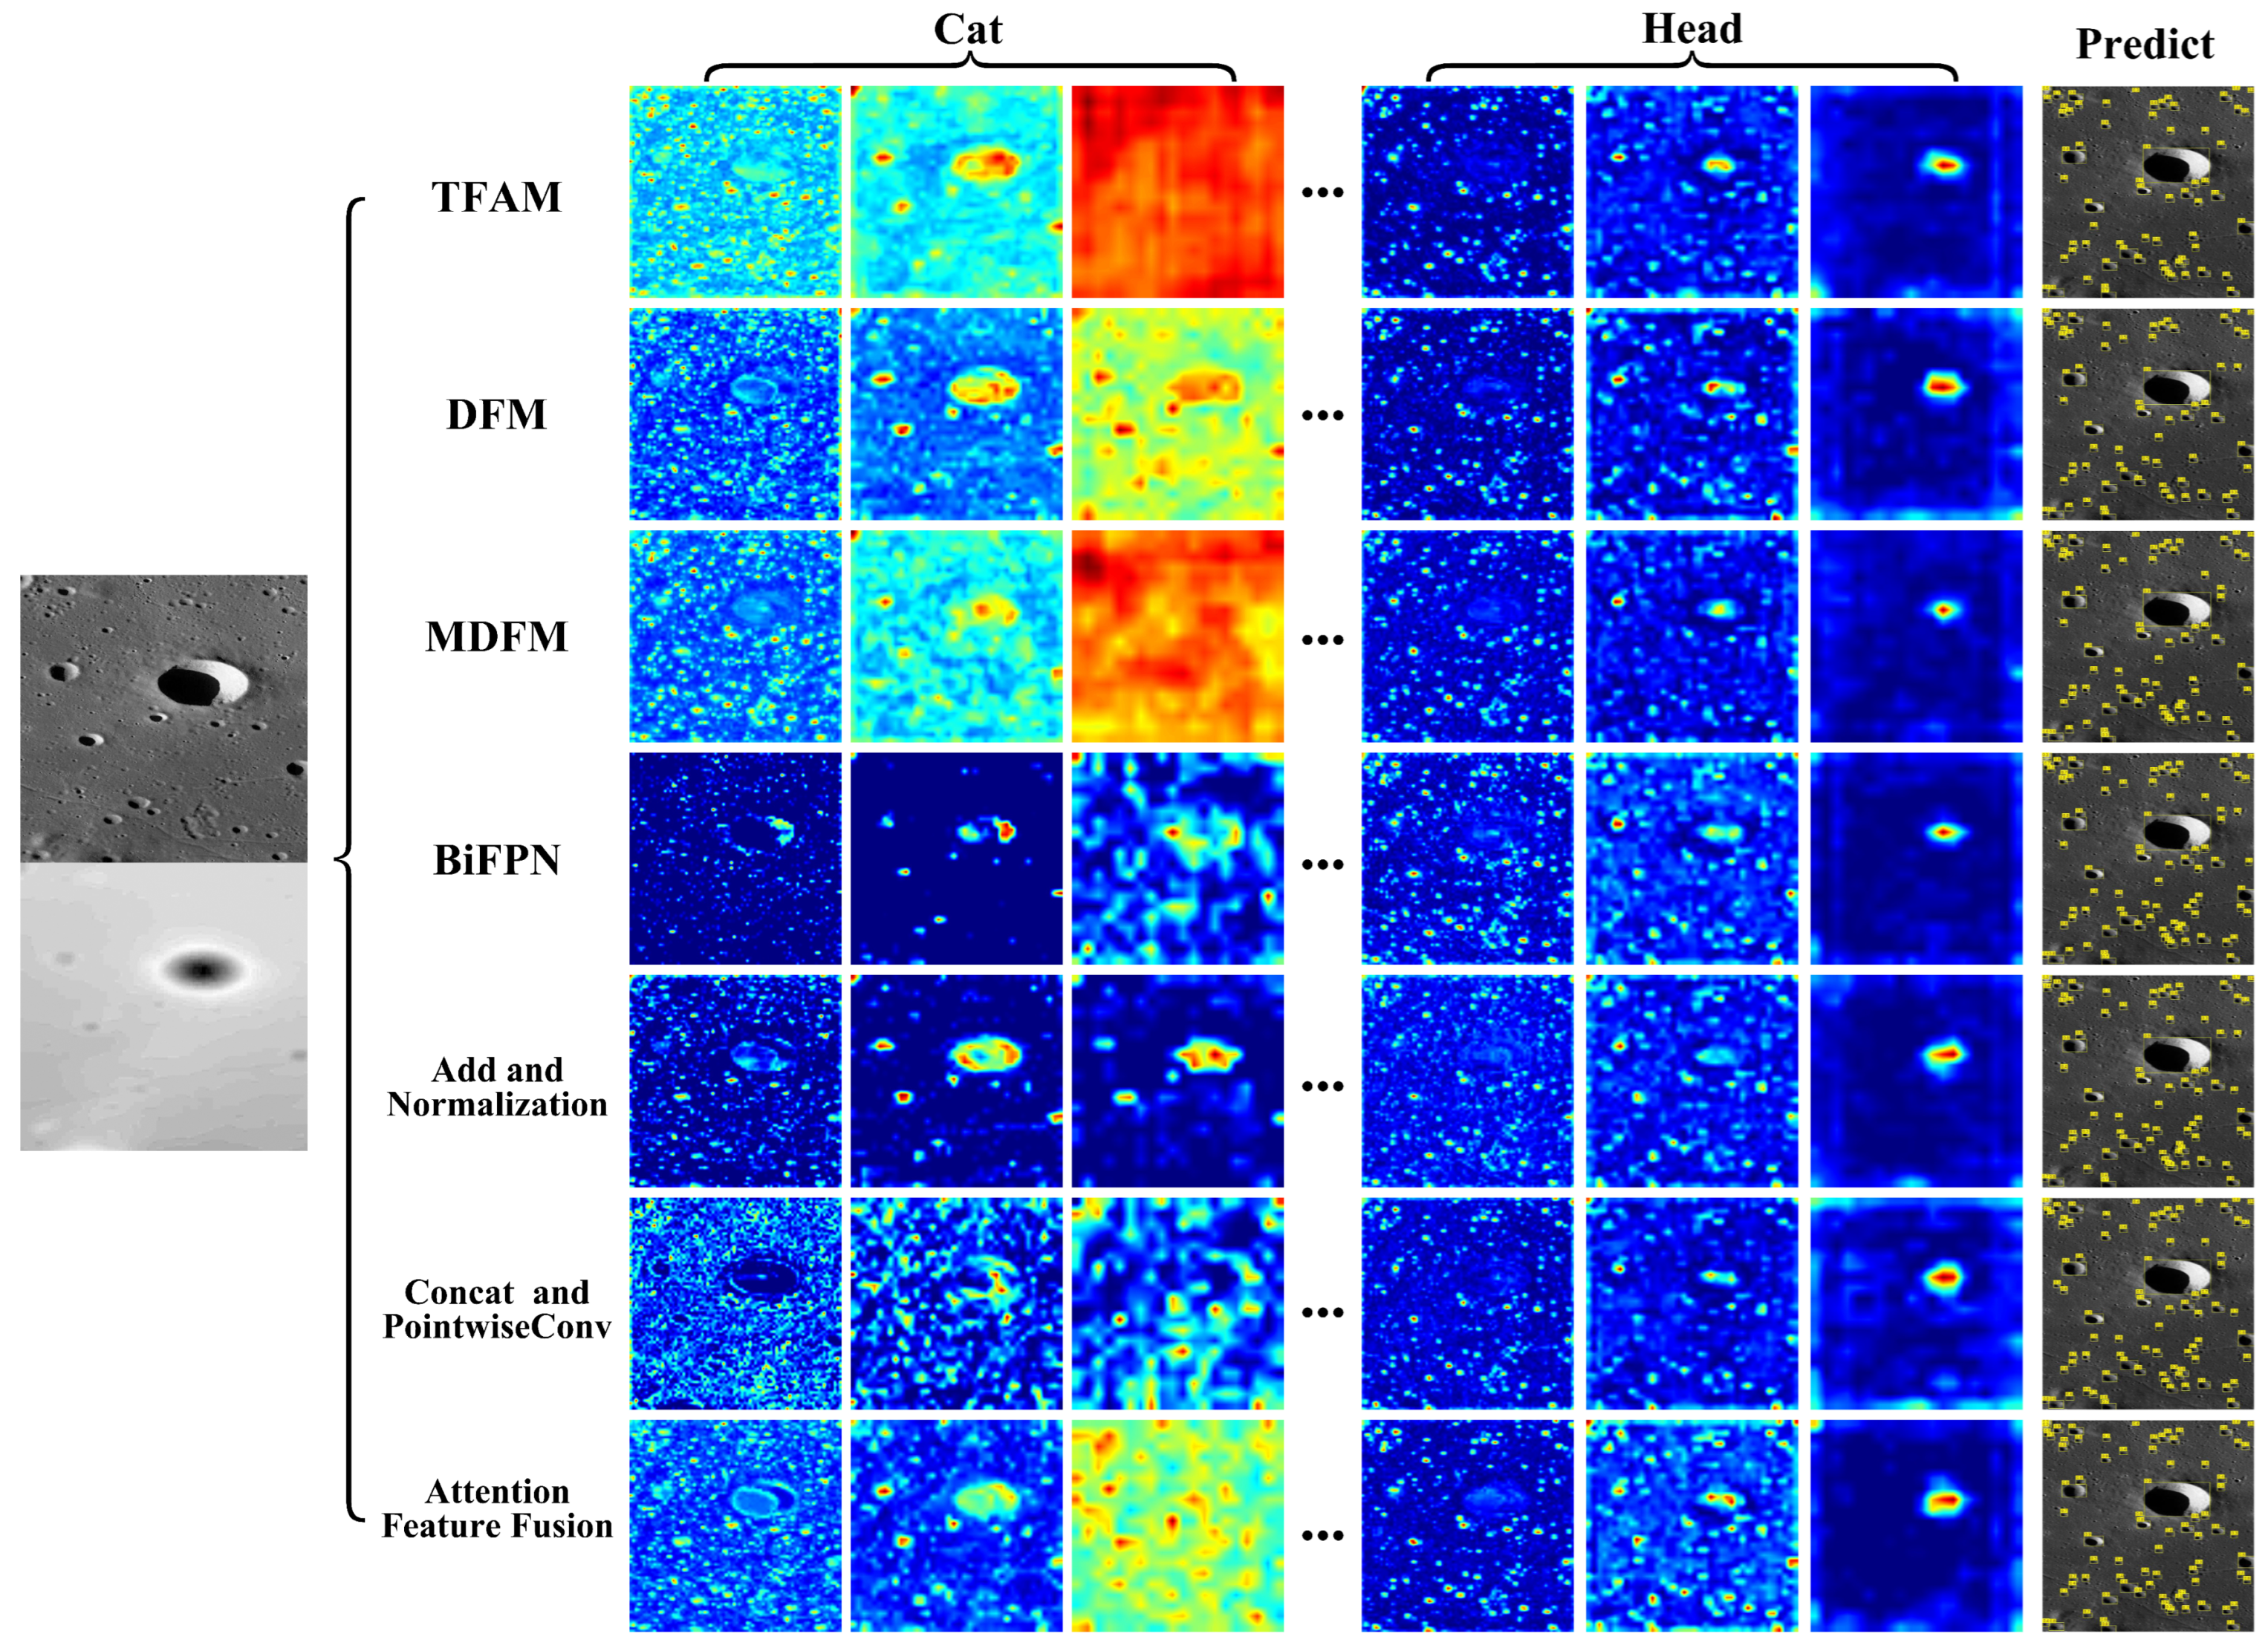
According to the heatmaps in Figure 9, DBYOLO exhibits distinct attention distribution variations when employing different feature fusion strategies. Each row represents the attention distribution of a fusion module across different network layers, with network depth increasing from left to right. Deeper layers, with larger receptive fields, are suited for detecting small-, medium-, and large-scale craters. After processing features of different scales through various fusion modules, the experimental results show that DFM, MDFM, Concat, and the Attention Feature Fusion module perform exceptionally well in small-scale feature fusion, while Concat and Attention Feature Fusion modules excel in medium-scale feature fusion. However, the absence of larger-scale crater features in the selected data causes TFAM and MDFM to mistakenly treat global features as crater features, while other modules display relatively cluttered attention distributions in their heatmaps. Overall, the Attention Feature Fusion module significantly outperforms other modules in multi-scale feature fusion, demonstrating superior adaptability and robustness.

4.3. Ablation Experiments and Analysis

To evaluate the learning effectiveness of the backbone network on different source data and the fusion module’s performance in integrating features from CCD and DTM data, we conducted two sets of ablation experiments. These experiments assessed the contributions of the Focus and HWD modules to the backbone network’s learning and training process, as well as the contributions of cross-attention, residual connections, and the adjustable weight γ to data integration. The experimental results were evaluated using metrics such as precision, recall, mAP50, and mAP50-95, with detailed analyses provided below.

4.3.1. Ablation Experiments on the Backbone

The first set of ablation experiments analyzed the effects of Focus and HWD learning. The experimental results in Table 7 show that the baseline model, consistent with the dual-backbone network of YOLOv8n and without the Focus and HWD modules, achieved a precision of 0.757, a recall of 0.696, an mAP50 of 0.780, and an mAP50-95 of 0.489. When the Focus module was introduced alone, precision, mAP50, and mAP50-95 improved, while the recall remained unchanged. The Focus module essentially slices the input data, expanding one portion into four and performing concatenation and pointwise convolution. Applying this module at the initial stage of the network effectively augments the dataset, enabling the model to learn more diverse features. Similarly, when the HWD module was introduced alone, while the mAP50 improvement was marginal, the mAP50-95 increased by 0.9%, indicating that wavelet transformations effectively captured high-frequency texture features, facilitating subsequent learning by the model. The best performance was achieved when both Focus and HWD modules were used together, with a precision of 0.775, a recall of 0.703, an mAP50 of 0.794, and an mAP50:95 of 0.504. This demonstrates a synergistic effect between the Focus and HWD modules, enabling comprehensive feature learning.
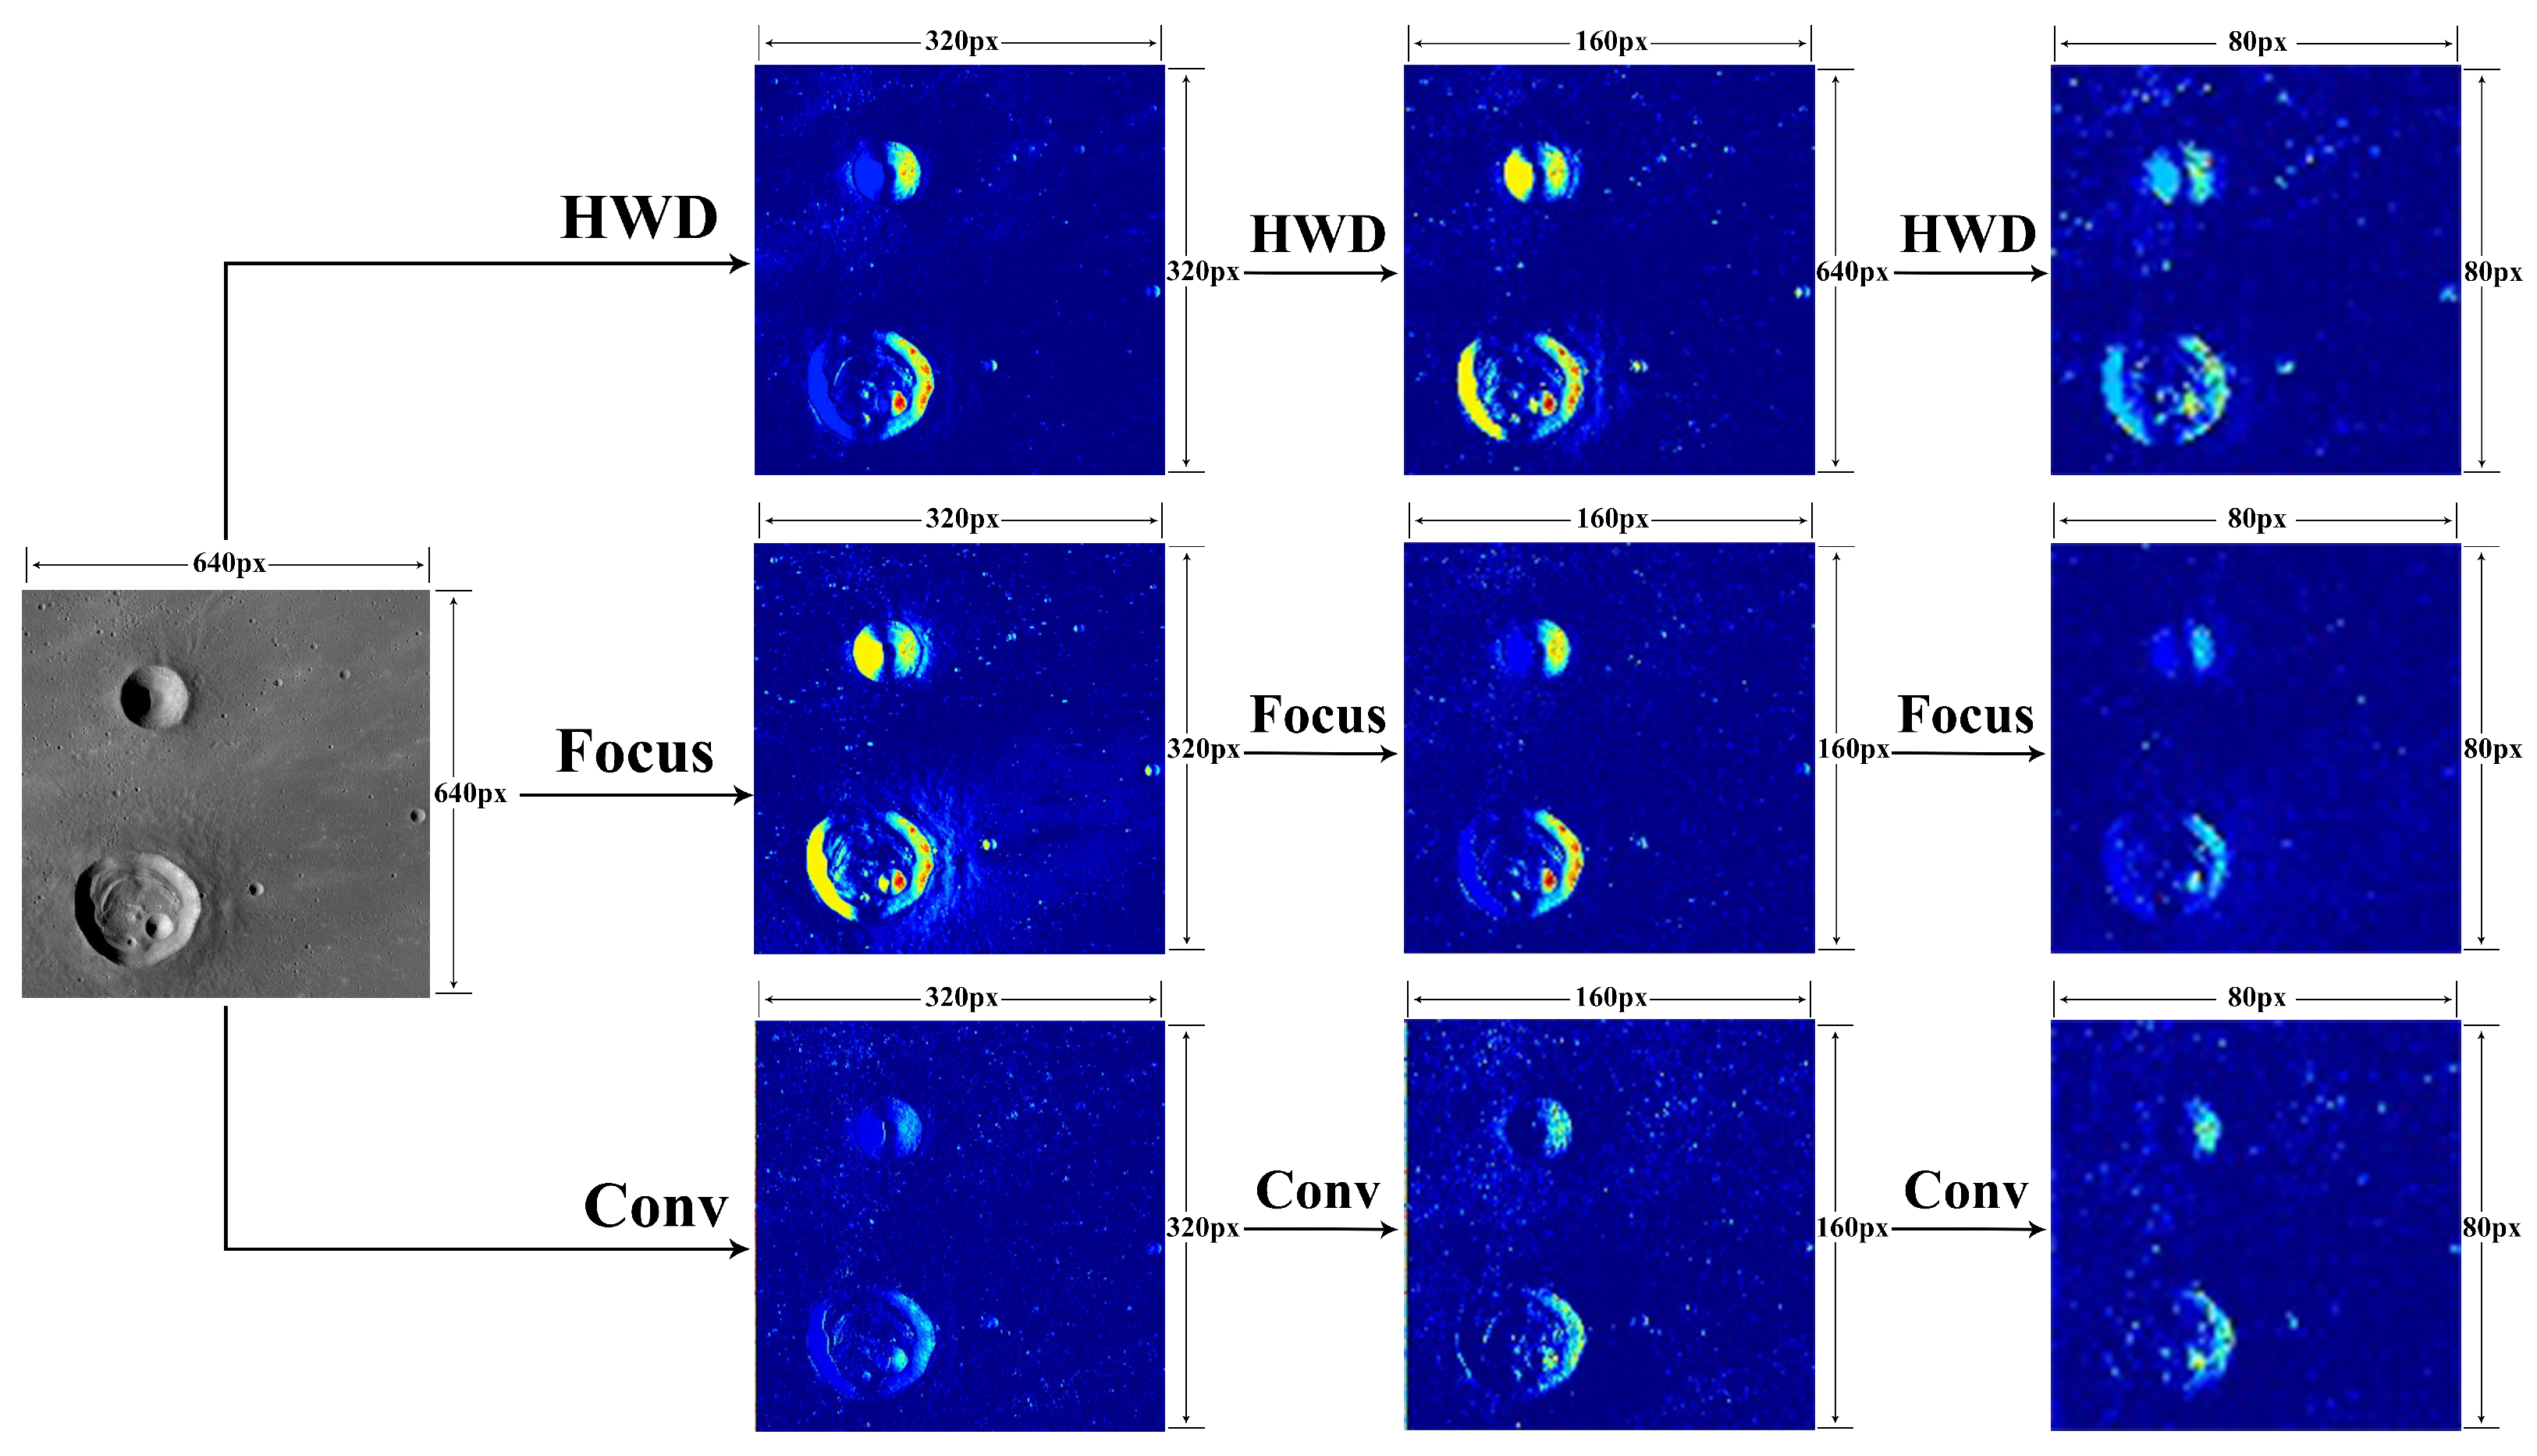
To provide a more intuitive demonstration of the effects of the Focus and HWD modules, we selected a high-resolution CCD image dataset for analysis. By comparing the heatmaps generated after three computational iterations of the baseline Conv module, the Focus module, and the HWD module, we evaluated their respective feature extraction capabilities at each learning stage. Since all three modules employ a convolution stride of 2, the output resolution is reduced by half compared to the input. To facilitate a clear comparison, all images were annotated with precise dimensional information and uniformly resized to a consistent scale, as shown in Figure 10.
A detailed analysis of the heatmaps from the three iterations revealed significant performance differences among the modules. After the first iteration, the Focus module effectively highlighted the unique data features of the impact craters, with the HWD module performing second best. In contrast, the Conv module exhibited the weakest feature extraction capability. Following the second iteration, the HWD module surpassed the Focus module, demonstrating a robust iterative enhancement. By the third iteration, the differences became more pronounced: the HWD module, leveraging wavelet transformations, progressively optimized its learning of the fine details of the crater features, while the Conv module failed to achieve effective focusing. Consequently, in the optimized backbone network, we positioned the Focus module at the initial layer, placed the HWD module in the intermediate layers, and incorporated multiple layers to replace the underperforming Conv module, thereby improving the overall efficacy of the network.

4.3.2. Ablation Experiments on the Fusion Module

The second set of experiments evaluated the roles of cross-attention, ResNet, and γ adjustment. The experimental data is shown in Table 8. Using cross-attention alone (without ResNet or γ adjustment) resulted in a precision of 0.757, a recall of 0.683, an mAP50 of 0.773, and an mAP50:95 of 0.482, outperforming the baseline but with room for improvement. Using ResNet alone (without cross-attention or γ adjustment) led to a significant performance drop, with a precision of 0.587 and an mAP50:95 of 0.267, indicating its inability to effectively capture complex relationships between CCD and DTM data. Incorporating γ adjustment slightly improved the ResNet model’s performance (precision of 0.603, mAP50:95 of 0.273), but it remained inferior to cross-attention. Combining cross-attention with ResNet yielded a precision of 0.767 and an mAP50:95 of 0.498, showing effective integration of modal features and deep feature extraction. The best performance was achieved when cross-attention, ResNet, and γ adjustment were used together, with a precision of 0.770, a recall of 0.703, an mAP50 of 0.794, and an mAP50:95 of 0.504, highlighting that cross-attention’s dynamic modeling of inter-modal relationships, combined with ResNet’s feature extraction and γ adjustment’s optimization, significantly enhances fusion performance.
These results reveal that cross-attention is the primary driver of performance gains by capturing complementary modal interactions. ResNet alone fails to exploit such interactions, but when combined with cross-attention, it contributes to richer feature extraction. The γ adjustment further stabilizes the fusion process, offering marginal yet consistent improvements. Together, the three components exhibit strong complementarity, underscoring the necessity of their joint design.

5. Conclusions

The key contribution of this study is the proposal of a lightweight dual-backbone DBYOLO model, which processes CCD imagery and DTM data separately to fully leverage their complementary information, overcoming the limitations of single-modal approaches in complex lunar surface environments. Additionally, the designed Attention Feature Fusion module, utilizing dynamic weighting through an attention mechanism and residual connections, effectively mitigates feature interference between multi-source data, enhancing the quality and robustness of fused features. Experimental results demonstrate that DBYOLO achieves a mean average precision (mAP50) of 79.4% on our constructed lunar crater dataset, surpassing existing methods such as SuperYOLO (mAP50: 62.5%). Furthermore, ablation studies and visualizations clearly illustrate the effectiveness and superiority of the dual-backbone network in multi-source remote sensing image detection tasks, providing a novel technical approach and methodology for lunar crater detection.
Although DBYOLO has achieved relatively good results in lunar crater detection, several challenges persist. Prediction results indicate that small craters, due to their limited size and indistinct features, are susceptible to interference from background noise or adjacent terrain, resulting in suboptimal detection accuracy, with mAP50-95 values not reaching exceptionally high levels. Additionally, compared to YOLOv8n, the introduction of the dual-backbone architecture and attention mechanism significantly increases parameter count and computational cost, limiting its direct deployment in resource-constrained scenarios such as real-time spacecraft navigation. To further optimize and enhance model performance, future research may focus on the following directions:
  • Optimization for Small Crater Detection: By incorporating a local feature fusion module, a multi-scale feature fusion framework, and a local attention pyramid module, the feature representation of small targets is enhanced, improving the detection accuracy of small lunar craters [53].
  • Model Lightweighting and Efficient Deployment: The current model involves high computational complexity and a large number of parameters. Future work can explore techniques such as model pruning and knowledge distillation to reduce the parameter count and computational overhead, thereby improving inference efficiency on low-power or resource-constrained devices [54,55].
  • Expansion of Multimodal Data Sources: This study integrates only CCD imagery and DTM data. In the future, additional modalities such as infrared imagery and spectral data could be incorporated to further enrich feature representations and enhance detection performance [56].
The significance of this study lies not only in providing an efficient solution for lunar crater detection but also in exploring the precision of dual-backbone networks and attention-based fusion mechanisms in remote sensing image processing. In the future, with further optimization of model performance and expansion into broader application domains, DBYOLO has the potential to play a greater role in planetary geology research, deep space exploration navigation, resource prospecting, and other related fields.

Author Contributions

Conceptualization, Y.L., F.C., D.Q. and W.L.; methodology, F.C. and D.Q.; software, F.C. and D.Q.; writing—original draft preparation, F.C., D.Q. and W.L.; writing—review and editing, Y.L., W.L. and J.Y.; visualization, F.C. and W.L. All authors have read and agreed to the published version of the manuscript.

Funding

This work is supported by the China Postdoctoral Science Foundation (2025T180106, 2025M770396); the Open Fund of Key Laboratory of Urban Land Resources Monitoring and Simulation, Ministry of Natural Resources (KF-2023-08-16); Doctoral research start-up fund (XJ2023006801).

Data Availability Statement

The global lunar CCD and DTM can be downloaded from https://data.lroc.im-ldi.com/lroc/rdr_product_select (accessed on 20 September 2024), the global lunar crater catalog can be obtained from https://zenodo.org/records/4983248 (accessed on 21 September 2024), and the source code for the proposed method can be downloaded from https://github.com/cfk4563/Dbyolo (accessed on 25 August 2025).

Conflicts of Interest

The authors declare no conflicts of interest.

Abbreviations

The following abbreviations are used in this manuscript:
CCDCharge-Coupled Device
DTMDigital Terrain Model
LROCLunar Reconnaissance Orbiter Camera
CNNConvolutional Neural Network
YOLOYou Only Look Once
HTHough Transform
DEMDigital Elevation Map
DOMDigital Orthophoto Map
RGBRed, Green, Blue
SARSynthetic Aperture Radar
LROLunar Reconnaissance Orbiter
WACWide Angle Camera
SPPFSpatial Pyramid Pooling-Fast
mAPmean Average Precision
IoUIntersection over Union
FNFalse Negative
TPTrue Positive
FPFalse Positive

References

  1. Salih, A.L.; Schulte, P.; Grumpe, A.; Wöhler, C.; Hiesinger, H. Automatic crater detection and age estimation for mare regions on the lunar surface. In Proceedings of the 2017 IEEE 25th European Signal Processing Conference (EUSIPCO), Kos, Greece, 28 August–2 September 2017; pp. 518–522. [Google Scholar]
  2. Strom, R.G.; Malhotra, R.; Ito, T.; Yoshida, F.; Kring, D.A. The origin of planetary impactors in the inner solar system. Science 2005, 309, 1847–1850. [Google Scholar] [CrossRef] [PubMed]
  3. Tewari, A.; Prateek, K.; Singh, A.; Khanna, N. Deep learning based systems for crater detection: A review. arXiv 2023, arXiv:2310.07727. [Google Scholar] [CrossRef]
  4. Weiming, C.; Qiangyi, L.; Jiao, W.; Wenxin, G.; Jianzhong, L. A preliminary study of classification method on lunar topography and landforms. Adv. Earth Sci. 2018, 33, 885. [Google Scholar]
  5. Richardson, M.; Malagón, A.A.P.; Lebofsky, L.A.; Grier, J.; Gay, P.; Robbins, S.J.; Team, T.C. The CosmoQuest Moon mappers community science project: The effect of incidence angle on the Lunar surface crater distribution. arXiv 2021, arXiv:2110.13404. [Google Scholar] [CrossRef]
  6. Ren, S.; He, K.; Girshick, R.; Sun, J. Faster R-CNN: Towards real-time object detection with region proposal networks. IEEE Trans. Pattern Anal. Mach. Intell. 2016, 39, 1137–1149. [Google Scholar] [CrossRef]
  7. Redmon, J.; Divvala, S.; Girshick, R.; Farhadi, A. You only look once: Unified, real-time object detection. In Proceedings of the IEEE Conference on Computer Vision and Pattern Recognition, Las Vegas, NV, USA, 27–30 June 2016; pp. 779–788. [Google Scholar]
  8. Vaswani, A.; Shazeer, N.; Parmar, N.; Uszkoreit, J.; Jones, L.; Gomez, A.N.; Kaiser, Ł.; Polosukhin, I. Attention is all you need. Adv. Neural Inf. Process. Syst. 2017, 30. [Google Scholar] [CrossRef]
  9. Carion, N.; Massa, F.; Synnaeve, G.; Usunier, N.; Kirillov, A.; Zagoruyko, S. End-to-end object detection with transformers. In Proceedings of the European Conference on Computer Vision, Glasgow, UK, 23–28 August 2020; Springer: Cham, Switzerland, 2020; pp. 213–229. [Google Scholar]
  10. Liu, Z.; Lin, Y.; Cao, Y.; Hu, H.; Wei, Y.; Zhang, Z.; Lin, S.; Guo, B. Swin transformer: Hierarchical vision transformer using shifted windows. In Proceedings of the IEEE/CVF International Conference on Computer Vision, Virtual, 11–17 October 2021; pp. 10012–10022. [Google Scholar]
  11. Zhang, J.; Lei, J.; Xie, W.; Fang, Z.; Li, Y.; Du, Q. SuperYOLO: Super resolution assisted object detection in multimodal remote sensing imagery. IEEE Trans. Geosci. Remote Sens. 2023, 61, 3258666. [Google Scholar] [CrossRef]
  12. Chen, Y.; Wang, B.; Guo, X.; Zhu, W.; He, J.; Liu, X.; Yuan, J. DEYOLO: Dual-feature-enhancement YOLO for cross-modality object detection. In Proceedings of the International Conference on Pattern Recognition, Kolkata, India, 1–5 December 2024; Springer: Cham, Switzerland, 2024; pp. 236–252. [Google Scholar]
  13. Robbins, S.J. A new global database of lunar impact craters > 1–2 km: 1. Crater locations and sizes, comparisons with published databases, and global analysis. J. Geophys. Res. Planets 2019, 124, 871–892. [Google Scholar] [CrossRef]
  14. Head, J.W., III; Fassett, C.I.; Kadish, S.J.; Smith, D.E.; Zuber, M.T.; Neumann, G.A.; Mazarico, E. Global distribution of large lunar craters: Implications for resurfacing and impactor populations. Science 2010, 329, 1504–1507. [Google Scholar] [CrossRef]
  15. Michael, G. Coordinate registration by automated crater recognition. Planet. Space Sci. 2003, 51, 563–568. [Google Scholar] [CrossRef]
  16. Kim, J.R.; Muller, J.P.; van Gasselt, S.; Morley, J.G.; Neukum, G. Automated crater detection, a new tool for Mars cartography and chronology. Photogramm. Eng. Remote Sens. 2005, 71, 1205–1217. [Google Scholar] [CrossRef]
  17. Galloway, M.J.; Benedix, G.K.; Bland, P.A.; Paxman, J.; Towner, M.C.; Tan, T. Automated crater detection and counting using the Hough transform. In Proceedings of the 2014 IEEE International Conference on Image Processing (ICIP), Paris, France, 27–30 October 2014; pp. 1579–1583. [Google Scholar]
  18. Zhu, X.X.; Tuia, D.; Mou, L.; Xia, G.S.; Zhang, L.; Xu, F.; Fraundorfer, F. Deep learning in remote sensing: A comprehensive review and list of resources. IEEE Geosci. Remote Sens. Mag. 2017, 5, 8–36. [Google Scholar] [CrossRef]
  19. Ma, L.; Liu, Y.; Zhang, X.; Ye, Y.; Yin, G.; Johnson, B.A. Deep learning in remote sensing applications: A meta-analysis and review. ISPRS J. Photogramm. Remote Sens. 2019, 152, 166–177. [Google Scholar] [CrossRef]
  20. Hu, Y.; Xiao, J.; Liu, L.; Zhang, L.; Wang, Y. Detection of Small Impact Craters via Semantic Segmenting Lunar Point Clouds Using Deep Learning Network. Remote Sens. 2021, 13, 1826. [Google Scholar] [CrossRef]
  21. Minaee, S.; Boykov, Y.; Porikli, F.; Plaza, A.; Kehtarnavaz, N.; Terzopoulos, D. Image segmentation using deep learning: A survey. IEEE Trans. Pattern Anal. Mach. Intell. 2021, 44, 3523–3542. [Google Scholar] [CrossRef] [PubMed]
  22. Lin, X.; Zhu, Z.; Yu, X.; Ji, X.; Luo, T.; Xi, X.; Zhu, M.; Liang, Y. Lunar Crater Detection on Digital Elevation Model: A Complete Workflow Using Deep Learning and Its Application. Remote Sens. 2022, 14, 621. [Google Scholar] [CrossRef]
  23. Zhang, S.; Zhang, P.; Yang, J.; Kang, Z.; Cao, Z.; Yang, Z. Automatic detection for small-scale lunar impact crater using deep learning. Adv. Space Res. 2024, 73, 2175–2187. [Google Scholar] [CrossRef]
  24. Zang, S.; Mu, L.; Xian, L.; Zhang, W. Semi-Supervised Deep Learning for Lunar Crater Detection Using CE-2 DOM. Remote Sens. 2021, 13, 2819. [Google Scholar] [CrossRef]
  25. Li, J.; Zheng, K.; Li, Z.; Gao, L.; Jia, X. X-shaped interactive autoencoders with cross-modality mutual learning for unsupervised hyperspectral image super-resolution. IEEE Trans. Geosci. Remote Sens. 2023, 61, 3300043. [Google Scholar] [CrossRef]
  26. Li, J.; Zheng, K.; Liu, W.; Li, Z.; Yu, H.; Ni, L. Model-guided coarse-to-fine fusion network for unsupervised hyperspectral image super-resolution. IEEE Geosci. Remote Sens. Lett. 2023, 20, 3309854. [Google Scholar] [CrossRef]
  27. Tewari, A.; Verma, V.; Srivastava, P.; Jain, V.; Khanna, N. Automated crater detection from co-registered optical images, elevation maps and slope maps using deep learning. Planet. Space Sci. 2022, 218, 105500. [Google Scholar] [CrossRef]
  28. Yang, C.; Zhao, H.; Bruzzone, L.; Benediktsson, J.A.; Liang, Y.; Liu, B.; Zeng, X.; Guan, R.; Li, C.; Ouyang, Z. Lunar impact crater identification and age estimation with Chang’E data by deep and transfer learning. Nat. Commun. 2020, 11, 6358. [Google Scholar] [CrossRef]
  29. Mu, L.; Xian, L.; Li, L.; Liu, G.; Chen, M.; Zhang, W. YOLO-crater model for small crater detection. Remote Sens. 2023, 15, 5040. [Google Scholar] [CrossRef]
  30. Sharma, M.; Dhanaraj, M.; Karnam, S.; Chachlakis, D.G.; Ptucha, R.; Markopoulos, P.P.; Saber, E. YOLOrs: Object detection in multimodal remote sensing imagery. IEEE J. Sel. Top. Appl. Earth Obs. Remote Sens. 2020, 14, 1497–1508. [Google Scholar] [CrossRef]
  31. Tang, J.; Gu, B.; Li, T.; Lu, Y.B. SCCA-YOLO: Spatial Channel Fusion and Context-Aware YOLO for Lunar Crater Detection. Remote Sens. 2025, 17, 2380. [Google Scholar] [CrossRef]
  32. Zuo, W.; Gao, X.; Wu, D.; Liu, J.; Zeng, X.; Li, C. YOLO-SCNet: A Framework for Enhanced Detection of Small Lunar Craters. Remote Sens. 2025, 17, 1959. [Google Scholar] [CrossRef]
  33. Speyerer, E.; Robinson, M.; Denevi, B.; LROC Science Team. Lunar Reconnaissance Orbiter Camera global morphological map of the Moon. In Proceedings of the 42nd Annual Lunar and Planetary Science Conference, The Woodlands, TX, USA, 7–11 March 2011; No. 1608. p. 2387. [Google Scholar]
  34. Smith, D.E.; Zuber, M.T.; Neumann, G.A.; Lemoine, F.G.; Mazarico, E.; Torrence, M.H.; McGarry, J.F.; Rowlands, D.D.; Head, J.W., III; Duxbury, T.H.; et al. Initial observations from the lunar orbiter laser altimeter (LOLA). Geophys. Res. Lett. 2010, 37, L18204. [Google Scholar] [CrossRef]
  35. Wang, Y.; Wu, B.; Xue, H.; Li, X.; Ma, J. An improved global catalog of lunar impact craters (≥ 1 km) with 3D morphometric information and updates on global crater analysis. J. Geophys. Res. Planets 2021, 126, e2020JE006728. [Google Scholar] [CrossRef]
  36. Wang, C.Y.; Liao, H.Y.M.; Wu, Y.H.; Chen, P.Y.; Hsieh, J.W.; Yeh, I.H. CSPNet: A new backbone that can enhance learning capability of CNN. In Proceedings of the IEEE/CVF Conference on Computer Vision and Pattern Recognition Workshops, Seattle, WA, USA, 14–19 June 2020; pp. 390–391. [Google Scholar]
  37. He, K.; Zhang, X.; Ren, S.; Sun, J. Deep residual learning for image recognition. In Proceedings of the IEEE Conference on Computer Vision and Pattern Recognition, Las Vegas, NV, USA, 27–30 June 2016; pp. 770–778. [Google Scholar]
  38. Zhu, X.; Lyu, S.; Wang, X.; Zhao, Q. TPH-YOLOv5: Improved YOLOv5 based on transformer prediction head for object detection on drone-captured scenarios. In Proceedings of the IEEE/CVF International Conference on Computer Vision, Virtual, 11–17 October 2021; pp. 2778–2788. [Google Scholar]
  39. Xu, G.; Liao, W.; Zhang, X.; Li, C.; He, X.; Wu, X. Haar Wavelet Downsampling: A Simple but Effective Downsampling Module for Semantic Segmentation. Pattern Recognit. 2023, 143, 109819. [Google Scholar] [CrossRef]
  40. He, K.; Zhang, X.; Ren, S.; Sun, J. Spatial Pyramid Pooling in Deep Convolutional Networks for Visual Recognition. In Computer Vision—ECCV 2014; Springer International Publishing: Cham, Switzerland, 2014; pp. 346–361. [Google Scholar] [CrossRef]
  41. Liu, S.; Qi, L.; Qin, H.; Shi, J.; Jia, J. Path aggregation network for instance segmentation. In Proceedings of the IEEE Conference on Computer Vision and Pattern Recognition, Salt Lake City, UT, USA, 18–22 June 2018; pp. 8759–8768. [Google Scholar]
  42. Lin, T.Y.; Dollár, P.; Girshick, R.; He, K.; Hariharan, B.; Belongie, S. Feature pyramid networks for object detection. In Proceedings of the IEEE Conference on Computer Vision and Pattern Recognition, Honolulu, HI, USA, 21–26 July 2017; pp. 2117–2125. [Google Scholar]
  43. Lin, H.; Cheng, X.; Wu, X.; Shen, D. Cat: Cross attention in vision transformer. In Proceedings of the 2022 IEEE International Conference on Multimedia and Expo (ICME), Taipei, Taiwan, 18–22 July 2022; pp. 1–6. [Google Scholar]
  44. Lin, T.Y.; Goyal, P.; Girshick, R.; He, K.; Dollár, P. Focal loss for dense object detection. In Proceedings of the IEEE International Conference on Computer Vision, Venice, Italy, 22–29 October 2017; pp. 2980–2988. [Google Scholar]
  45. Wang, A.; Chen, H.; Liu, L.; Chen, K.; Lin, Z.; Han, J.; Ding, G. Yolov10: Real-time end-to-end object detection. Adv. Neural Inf. Process. Syst. 2024, 37, 107984–108011. [Google Scholar]
  46. Khanam, R.; Hussain, M. Yolov11: An overview of the key architectural enhancements. arXiv 2024, arXiv:2410.17725. [Google Scholar] [CrossRef]
  47. Tian, Y.; Ye, Q.; Doermann, D. Yolov12: Attention-centric real-time object detectors. arXiv 2025, arXiv:2502.12524. [Google Scholar]
  48. Wang, Z.; Liao, X.; Yuan, J.; Yao, Y.; Li, Z. Cdc-yolofusion: Leveraging cross-scale dynamic convolution fusion for visible-infrared object detection. IEEE Trans. Intell. Veh. 2024, 10, 2080–2093. [Google Scholar] [CrossRef]
  49. Zhao, S.; Zhang, X.; Xiao, P.; He, G. Exchanging dual-encoder–decoder: A new strategy for change detection with semantic guidance and spatial localization. IEEE Trans. Geosci. Remote Sens. 2023, 61, 3327780. [Google Scholar] [CrossRef]
  50. Chen, P.; Zhang, B.; Hong, D.; Chen, Z.; Yang, X.; Li, B. FCCDN: Feature constraint network for VHR image change detection. ISPRS J. Photogramm. Remote Sens. 2022, 187, 101–119. [Google Scholar] [CrossRef]
  51. Shao, S.; Xing, L.; Xu, R.; Liu, W.; Wang, Y.J.; Liu, B.D. MDFM: Multi-decision fusing model for few-shot learning. IEEE Trans. Circuits Syst. Video Technol. 2021, 32, 5151–5162. [Google Scholar] [CrossRef]
  52. Tan, M.; Pang, R.; Le, Q.V. Efficientdet: Scalable and efficient object detection. In Proceedings of the IEEE/CVF Conference on Computer Vision and Pattern Recognition, Seattle, WA, USA, 14–19 June 2020; pp. 10781–10790. [Google Scholar]
  53. Zheng, X.; Qiu, Y.; Zhang, G.; Lei, T.; Jiang, P. ESL-YOLO: Small object detection with effective feature enhancement and spatial-context-guided fusion network for remote sensing. Remote Sens. 2024, 16, 4374. [Google Scholar] [CrossRef]
  54. Deng, C.; Jing, D.; Ding, Z.; Han, Y. Sparse channel pruning and assistant distillation for faster aerial object detection. Remote Sens. 2022, 14, 5347. [Google Scholar] [CrossRef]
  55. Himeur, Y.; Aburaed, N.; Elharrouss, O.; Varlamis, I.; Atalla, S.; Mansoor, W.; Al Ahmad, H. Applications of knowledge distillation in remote sensing: A survey. Inf. Fusion 2024, 115, 102742. [Google Scholar] [CrossRef]
  56. Sun, L.; Li, Y.; Zheng, M.; Zhong, Z.; Zhang, Y. MCnet: Multiscale visible image and infrared image fusion network. Signal Process. 2023, 208, 108996. [Google Scholar] [CrossRef]
Figure 1. The left image shows a CCD image of a lunar crater, where the red-framed region, due to insufficient illumination or other factors, could not be effectively recorded by the sensor, appearing as a black missing area. The right image depicts the DTM. The green frame in the figure indicates the model’s predicted result.
Remotesensing 17 03377 g001
Figure 2. Comparison of prediction results and ground truth for single-source and multi-source data trained models in lunar crater detection. Transparent red filling and red bounding boxes are used to highlight crater regions that show large differences compared with the ground truth.
Remotesensing 17 03377 g002
Figure 3. Flowchart of dataset preprocessing. The dataset comprises six image scenes, from which two scenes covering the region between 0 ° 60 ° north latitude and 0 ° 90 ° east longitude were selected. The yellow areas in the images represent redundant regions after cropping, which were discarded.
Remotesensing 17 03377 g003
Figure 4. DBYOLO model architecture.
Remotesensing 17 03377 g004
Figure 5. Computational details of DBYOLO modules.
Remotesensing 17 03377 g005
Figure 6. Attention Feature Fusion module architecture.
Remotesensing 17 03377 g006
Figure 7. A line chart displays the comparison of training epochs versus mAP50 and mAP50-95 for different object detection algorithms on the CCD and DTM datasets. A red dashed line marks epoch 120, indicating that mosaic augmentation was disabled after this epoch. The evaluation metrics are smoothed using Exponential Weighted Moving Average.
Remotesensing 17 03377 g007
Figure 8. Crater prediction maps of multiple dual-backbone network models compared with ground truth crater annotations, showing only CCD image predictions. Transparent red annotations are used to highlight crater regions that show large differences compared with the ground truth.
Remotesensing 17 03377 g008
Figure 9. Heatmap visualization and prediction result of different fusion modules.
Remotesensing 17 03377 g009
Figure 10. Heatmap Comparison of feature extraction across Conv, Focus, and HWD modules over three iterations.
Remotesensing 17 03377 g010
Table 1. Experimental environment.
Experimental EnvironmentDetails
GPUNVIDIA RTX 3060 8G
CPUIntel(R) Core(TM) i7-12700
Operating SystemWindow 10 Professional
FrameworkPyTorch 2.3.1
Python Version3.10.11
CUDA Version11.8
Table 2. Training parameters.
Training ParametersDetails
Epochs200
Batch Size8
Learning Rate0.01
Close Mosaic80
Image Resolution 608 × 608
Model input Resolution 640 × 640
Weight_decay0.0005
PretrainFalse
Train datasets2769 CCD and DTM
Val datasets574 CCD and DTM
Test datsets574 CCD and DTM
Table 3. Detection performance comparison of the DBYOLO single-backbone and mainstream models on single-modality datasets.
ModelParametersDatasetPrecisionRecallmAP50mAP50-95
RetinaNet [44]36,383,010CCD0.5830.5670.6030.424
DTM0.3080.2860.2150.105
Faster-RCNN [6]28,328,501CCD0.6150.6030.6540.431
DTM0.3200.2920.2250.116
RT-DETR [9]20,184,464CCD0.7210.6920.7410.459
DTM0.4070.2240.2260.114
YOLOv5n2,503,139CCD0.7360.6860.7600.474
DTM0.4750.2040.2410.128
YOLOv8n3,005,843CCD0.7410.6850.7630.478
DTM0.4790.2060.2420.129
YOLOv10n [45]2,265,363CCD0.7390.6790.7600.476
DTM0.4630.2010.2360.127
YOLO11n [46]2,582,347CCD0.7300.6870.7570.472
DTM0.4680.2070.2420.129
YOLO12n [47]2,556,923CCD0.7350.6800.7560.466
DTM0.4550.2050.2380.127
DBYOLO
Single-Backbone
2,693,603CCD0.7500.6950.7760.489
DTM0.4800.2090.2440.130
Table 4. Performance comparison of different scale YOLOv8 models on the CCD dataset.
ModelsParametersInference SpeedTrain Time (Hours)PrecisionRecallmAP50mAP50-95
YOLOv8n3,005,8430.8 ms1.1160.7410.6850.7630.478
YOLOv8s11,125,9711.3 ms1.6760.7450.6940.7660.483
YOLOv8m25,840,3392.4 ms2.1110.7460.7010.7770.490
YOLOv8l43,607,3792.7 ms2.6020.7570.7040.7870.498
YOLOv8x68,124,5314.0 ms3.3870.7590.7050.7880.497
Table 5. Detection performance comparison of DBYOLO and mainstream models on the CCD-DTM combined dataset.
ModelsParametersDatasetsPrecisionRecallmAP50mAP50-95
YOLOv5n
Dual-Backbone
3,490,726CCD_DTM0.7570.6940.7790.486
YOLOv8n
Dual-Backbone
4,219,846CCD_DTM0.7570.6960.7800.489
YOLOv10n
Dual-Backbone
3,584,969CCD_DTM0.7390.6820.7640.481
YOLO11n
Dual-Backbone
3,654,614CCD_DTM0.7400.6840.7630.477
YOLO12n
Dual-Backbone
3,280,070CCD_DTM0.7530.6860.7620.478
DEYOLO [12]6,008,143CCD_DTM0.7440.6750.7130.446
CDC-YOLOFusion [48]9,116,115CCD_DTM0.7390.6630.6920.404
SuperYOLO [11]1,932,919CCD_DTM0.6620.5670.6250.357
DBYOLO (Ours)3,689,958CCD_DTM0.7720.7030.7940.504
Table 6. Comparative experimental results of different feature fusion modules.
ModulePrecisionRecallmAP50mAP50-95
TFAM [49]0.6590.5400.5840.325
DFM [50]0.5990.5340.5490.287
MDFM [51]0.6790.5980.6550.371
BiFPN [52]0.6120.5270.5480.289
Add and Normalization0.5680.4810.4850.244
Concat and PointwiseConv0.6210.5260.5520.278
Attention Feature Fusion0.7720.7030.7940.504
Table 7. Ablation experiments on the backbone.
FocusHWDPrecisionRecallmAP50mAP50-95
--0.7570.6960.7800.489
-0.7720.6960.7880.501
-0.7670.6910.7840.498
0.7720.7030.7940.504
Table 8. Ablation experiments on the fusion module.
AttentionResnet γ PrecisionRecallmAP50mAP50-95
--0.7570.6830.7730.482
--0.5870.5040.5210.267
-0.6030.5050.5280.273
-0.7670.6990.7870.498
0.7720.7030.7940.504
Disclaimer/Publisher’s Note: The statements, opinions and data contained in all publications are solely those of the individual author(s) and contributor(s) and not of MDPI and/or the editor(s). MDPI and/or the editor(s) disclaim responsibility for any injury to people or property resulting from any ideas, methods, instructions or products referred to in the content.