Article

Dense Representative Points-Guided Rotated-Ship Detection in Remote Sensing Images
1
School of Astronautics, Beihang University, Beijing 102206, China
2
China Academy of Space Technology, Beijing 100094, China
3
Tianmushan Laboratory, Beihang University, Hangzhou 311115, China
4
Key Laboratory of Spacecraft Design Optimization and Dynamic Simulation Technology, Ministry of Education, Beijing 102206, China
*
Author to whom correspondence should be addressed.
Remote Sens. 2026, 18(3), 458; https://doi.org/10.3390/rs18030458
Submission received: 21 December 2025 / Revised: 24 January 2026 / Accepted: 29 January 2026 / Published: 1 February 2026

Highlights

What are the main findings?
  • Our DenseRRSD method demonstrated exceptional detection accuracy, achieving a mean Average Precision of 91.2% on the HRSC2016 dataset and 83.2% on the DOTA-SHIP dataset. These results validate the model’s high precision in detecting rotated ships.
  • The integration of dense RepPoints representation with the edge sampling strategy, the Weighted Residual Feature Pyramid Network, and the Weighted Chamfer Loss enables robust detection performance even under challenging conditions, such as high object density, arbitrary orientations, and complex backgrounds.
What are the implications of the main findings?
  • Dense representative points can significantly improve the precision of detecting geometrically complex objects, not just ships, but also aircraft or buildings in aerial images.
  • The framework of DenseRRSD can be adapted to other object detection and image analysis tasks that require high precision and robustness.

Abstract

Withcontinuous advancements in remote sensing technology, object detection in remote sensing images has emerged as a critical research direction in maritime surveillance, port management, and national defense. Among these applications, ship detection is a key task. Due to the fact that ships in images typically exhibit arbitrary rotations, multi-scale distributions, and complex backgrounds, conventional detection methods based on horizontal or rotated bounding boxes often fail to adequately capture the fine-grained information of the targets, thereby compromising detection accuracy. This paper proposes the Dense Representative Points-Guided Rotated-Ship Detection (DenseRRSD) method. The proposed approach represents ship objects using dense representative points (RepPoints) to effectively capture local semantic information, thereby avoiding the background noise issues associated with traditional rectangular bounding box representations. To further enhance detection accuracy, an edge region sampling strategy is devised to uniformly sample RepPoints from critical ship parts, and a Weighted Residual Feature Pyramid Network (WRFPN) is introduced to efficiently fuse the multi-scale features through residual connections and learnable weights. In addition, a Weighted Chamfer Loss (WCL) combined with a staged localization loss strategy is employed to progressively refine localization from coarse to fine stages. Experimental results on both the HRSC2016 dataset and the newly constructed DOTA-SHIP dataset demonstrate that DenseRRSD achieves state-of-the-art detection accuracy, with mean Average Precision (mAP) scores of 91.2% and 83.2%, respectively, significantly outperforming existing methods. These results verify the effectiveness and robustness of the proposed approach in rotated-ship detection under diverse conditions.

1. Introduction

Over the past few years, target-detection technology has advanced at a rapid pace, making substantial progress and continuously setting new records [1,2,3,4]. Meanwhile, it has also opened up new research directions in the field of target detection. Currently, these detection algorithms, widely applied in scenarios such as unmanned aerial vehicle (UAV) monitoring and security, are undergoing continual updates and iterations [5,6].
A considerable body of research on object detection has concentrated on horizontal bounding boxes, and these achievements have likewise spurred the development of detection in remote sensing images. In the context of ship detection, a number of CNN-based methods have been proposed to improve robustness under complex maritime environments. For example, AIS-FCANet [7] introduces an attention-informed feature coupling mechanism to enhance discriminative feature representation, thereby improving detection performance in cluttered backgrounds. MSRIHL-CNN [8] focuses on multi-scale representation and hierarchical learning to cope with large scale variations of ships, while MKSFF-CNN [9] adopts a multi-kernel spatial feature-fusion strategy to strengthen the modeling of ship structures across different resolutions. These approaches have achieved promising results on ship detection benchmarks and have significantly promoted the application of deep learning in maritime target detection.
Horizontal bounding boxes are well-suited for natural scene images such as those in the COCO [10] and Pascal VOC [11] datasets; however, most existing ship detection methods, including the aforementioned CNN-based approaches, still rely on horizontal bounding box representations, which are not the optimal detection strategy for text-based images or the remote sensing images discussed in this paper. In particular, remote sensing platforms capture images from high altitudes, resulting in targets that appear at arbitrary orientations. Additionally, the ship targets of interest here often exhibit a large aspect ratio, which in turn leads to extensive background interference within horizontal bounding boxes. When ships are densely arranged near the coast, horizontal bounding boxes overlap, making it visually challenging to distinguish individual ships, as shown in Figure 1. Moreover, the closely spaced responses of densely arranged ships on feature maps interfere with each other, complicating accurate localization. In post-processing, non-maximum suppression (NMS) has become an indispensable step in object detection. However, for densely packed ships with horizontal bounding boxes, even if all targets are accurately detected, the extremely high Intersection over Union (IoU) values can lead to the elimination of lower-confidence targets.
Given the importance of rotated-object detection in remote sensing, methods based on rotated bounding boxes have evolved from classical algorithms. These methods are typically categorized as five-parameter approaches [12,13], which add angle regression to horizontal bounding boxes, and eight-parameter approaches [14,15], which regress the four polygon vertices directly. However, both approaches face boundary ambiguity and localization limitations. To address this, RPDet [16] represents objects with dense representative points instead of bounding boxes, mitigating angular discontinuities and improving localization for arbitrarily oriented targets. Inspired by RPDet, our DenseRRSD (Dense Representative Points-Guided Rotated-Ship Detection) further incorporates edge region sampling and multi-scale feature fusion to enhance rotated-ship detection in complex remote sensing scenarios. Although oriented-RCNN [17] and oriented representative points (RepPoints) [18] improve performance, they still rely on rotated bounding boxes and inherit angular constraints, limiting fine-grained spatial modeling.
These challenges underscore the need for a novel detection framework that robustly represents object localization while mitigating angular discontinuities. Our proposed DenseRRSD method tackles these issues by leveraging dense RepPoints and advanced feature-fusion strategies, thereby achieving more precise and robust rotated-ship detection.
To address these issues, this paper proposes the DenseRRSD method. Unlike conventional approaches, DenseRRSD employs a set of dense RepPoints to represent ship objects, enabling a more precise capture of object shapes and orientations while overcoming the excessive background noise inherent in rectangular representations. To verify both detection accuracy and generalization, we evaluated the performance of DenseRRSD on two challenging datasets: HRSC2016 and DOTA-SHIP. The model achieved 91.2% mAP on HRSC2016 and 83.2% mAP on DOTA-SHIP, significantly outperforming state-of-the-art approaches on both. The results confirm that the proposed dense RepPoints representation, combined with edge sampling, WRFPN, and WCL loss, leads to robust detection performance even in the presence of high object density, arbitrary orientations, and complex backgrounds. The main contributions of this work are summarized as follows:
(a)
Dense Representative Points Description: By predicting dense RepPoints, the method fully exploits local semantic information to provide a fine-grained description of objects, thereby enhancing the representation of rotated ships.
(b)
Edge Region Sampling Strategy: Considering the critical structural features of ships, such as the bow and hull, an edge region sampling strategy is devised to uniformly sample RepPoints from the object periphery, thereby providing more precise supervisory signals.
(c)
Weighted Residual Feature Pyramid Network (WRFPN): Building upon the traditional Feature Pyramid Network (FPN), residual connections and learnable weights are incorporated to achieve efficient fusion of multi-scale features, thus reducing network learning cost and optimizing feature representation.
(d)
Weighted Chamfer Loss and Staged Localization Strategy: The Weighted Chamfer Loss is employed to ensure a semantically uniform distribution of RepPoints, while a staged localization loss strategy is used to progressively refine localization from coarse to fine stages, thereby improving detection accuracy.
The remainder of this paper is organized as follows. Section 2 reviews related work on ship detection and rotated-object detection. Section 3 details the proposed DenseRRSD framework, including its dense RepPoints representation, edge region sampling strategy, WRFPN module, and loss functions. Section 4 presents the experimental results on the HRSC2016 and DOTA-SHIP datasets, and conducts ablation studies to analyze the contributions of key components. Section 5 discusses the strengths, limitations, and potential future directions of DenseRRSD. Finally, Section 6 concludes the paper.

2. Relation Work

2.1. Ship Detection

Compared with conventional object detection in natural images, remote-sensing ship detection exhibits unique challenges: ships are often clustered, arbitrarily oriented, and undergo large scale variations, in contrast to the small-scale changes and predominantly single orientation in most natural scenes [19]. Early methods based on handcrafted features commonly adopt a two-stage paradigm of region proposal and target confirmation. In the proposal stage, low-cost algorithms (e.g., saliency-based algorithms [20,21,22], wavelet-transform-based algorithms [23], image-segmentation-based algorithms [24,25], anomaly-detection-based algorithms [26], or shape-characteristic-based algorithms [23]) select candidate regions likely to contain ships, thus reducing search space. Notably, shape-based methods [23] can provide strong structural cues for isolating ships in high-clutter backgrounds, whereas anomaly detection approaches [26] can robustly address unseen or rare ship appearances by treating them as outliers. The subsequent confirmation stage then verifies each candidate to eliminate non-ship regions [20,22,24,26,27]; while some approaches integrate prior knowledge to further refine detection [21,23], handcrafted features in general cannot guarantee robustness across diverse conditions, limiting their effectiveness when encountering large variations in ship size, orientation, or illumination.
Recent advances in computing hardware have enabled convolutional neural networks (CNNs) to excel at numerous image-based tasks. Consequently, deep learning has been introduced into ship detection, typically splitting the process into region proposal and target confirmation [28]. For instance, ref. [29] proposed a near real-time strategy to extract candidate bounding boxes from large images, combining efficient proposal generation with robust feature extraction; ref. [30] introduced a Rotated-Region-based CNN (RR-CNN) to handle oriented bounding boxes by performing rotational ROI pooling (RRoI-Pooling) that better accommodates arbitrary ship orientations. SVDNet [31] further merges eigenvalue decomposition with CNN features for more discriminative representations, tackling issues such as large-scale clutter and subtle ship outlines in remote-sensing images. Recognizing that ships exhibit significant scale variation, HSFNet [32] introduces a multi-scale feature-selection layer to retain high-resolution details while also mitigating performance loss on very small or very large ships. Other multi-task networks [33] integrate classification and detection simultaneously, employing techniques such as transformation-based cropping or proposal simulation (PSG) to augment training data; however, these expansions do not always resolve dataset imbalances if the underlying training distribution remains skewed.
Further research extends from mere ship detection to multi-class ship recognition. RR-CNN [30] is capable of detecting multiple ship categories but does not employ a dedicated secondary classifier to differentiate specific subcategories. Moreover, in non-maximum suppression, inconsistent labeling of the same target can arise if classification capacity is limited or if overlapping proposals cause confusion. RR-CNN alleviates this through a task-specific extreme-value suppression approach, which yields more coherent category assignments. In [34], sequence information (Sequence Local Context, SLC) refines detection accuracy by incorporating row-wise contextual cues, thereby reducing false positives in densely packed scenarios. Meanwhile, adaptive bounding boxes and data augmentation strategies (e.g., spatial transform cropping) address issues of insufficient or imbalanced training, especially when real-world datasets lack coverage of certain ship types.
Despite these efforts, rotated-ship detection and ship recognition still face persistent challenges. For detection, oriented bounding boxes reduce reliance on anchor angles in CNN detectors, yet potential mismatches in data or modeling require further study. Complex scenes with overlapping ships or significant background interference may cause angle-estimation errors to propagate through the pipeline. For recognition, most work addresses only a limited set of ship types or suffers from data scarcity, complicating any attempt at comprehensive, fine-grained categorization. Consequently, future research may explore advanced feature-encoding methods tailored to high aspect ratios and multi-scale contexts, along with more robust strategies for anchor design and rotational invariance, to facilitate both accurate detection and nuanced ship-type classification.
In addition to detection frameworks that explicitly focus on bounding box design and orientation modeling, recent studies have explored enhancing synthetic aperture radar (SAR) ship detection and recognition from the perspective of SAR-specific representation learning, self-supervision, and cross-modal priors. For instance, self-supervised despeckling strategies based solely on SAR intensity images [35] have been proposed to suppress speckle noise while preserving structural information, thereby improving the quality of downstream feature extraction. DINO-Based Optical-Prior-Driven GAN(DOGAN) [36] further introduces optical-domain priors through a DINO-based GAN framework to translate SAR images into optical-like representations, enabling the transfer of rich semantic cues across modalities. From the recognition perspective, Prototype-Guided Multimodal Network(PGMNet) [37] leverages prototype-guided multimodal learning to bridge feature discrepancies between SAR and auxiliary modalities, achieving more discriminative ship representations. Meanwhile, transformer-based approaches have incorporated key scattering point aggregation and contextual feature refinement [38] to better capture long-range dependencies and structural patterns in SAR ship scenes. Although these methods demonstrate the effectiveness of exploiting SAR imaging characteristics, self-supervised learning, and contextual modeling, they primarily aim at feature enhancement or semantic alignment. Consequently, they do not explicitly address the fundamental challenges of precise localization and geometric representation for densely distributed, arbitrarily oriented ships, which remain critical limitations in rotated-ship detection. This gap motivates the development of more robust localization representations, as pursued in our proposed DenseRRSD framework.

2.2. Rotated-Object Detection

Unlike object detection in natural scenes, ship detection in remote-sensing images faces additional challenges, such as cluttered ocean backgrounds, varied ship orientations, significant scale differences, and densely arranged targets. Horizontal bounding boxes (HBBs) [39,40] inherently exhibit limitations in such complex environments. By contrast, oriented bounding boxes (OBBs) [41,42] provide a powerful solution, offering more accurate localization under complex scenarios than HBBs. Through angle alignment, OBBs effectively address the drawbacks of HBBs, performing especially well in the presence of arbitrarily oriented ships [43,44,45] or densely populated scenes [46,47,48].
However, despite these advances, OBB-based methods continue to suffer from insufficient rotational invariance when handling irregular orientations or large rotation angles. For ships, which often exhibit extreme aspect ratios, employing preset angle anchors not only causes the number of anchors to grow exponentially but also yields low recall. Even slight angular deviations can rapidly degrade the Intersection over Union (IoU), thus limiting detection performance. For example, R2CNN [49] alleviated these issues by using horizontal anchors in the Region Proposal Network (RPN) and then employing multiple RoI pooling configurations (e.g., 7 × 7, 3 × 11, and 11 × 3) to better capture features corresponding to different aspect ratios. Building on this idea, the RoI–Transformer proposed in [50] extracts features from horizontal anchors and then predicts an angle offset through fully connected layers to transform the features into Rotated RoIs. Similarly, RR-CNN [30] introduced a Rotated RoI pooling layer to directly pool features within rotated regions, and R3Det [51] further refined the one-stage RetinaNet framework by incorporating a feature refinement module to address misalignment issues in rotated features.
While these approaches focus on optimizing anchor design and feature extraction, they do not fundamentally address the challenges in localization representation. The commonly used five-parameter formulation (center coordinates, width, height, and angle) suffers from angular boundary issues. Specifically, when using Smooth L1 Loss, even minor deviations near the angle boundaries can produce large loss values, forcing the network to predict values very close to the ground truth and sometimes causing undesirable swapping between width and height parameters. Such issues adversely affect the overall detection performance.
To further mitigate these challenges, SCRDet [52] was proposed with a combination of feature-fusion and attention mechanisms along with an IoU–Smooth L1 Loss that regularizes both the gradient direction and magnitude, thereby stabilizing training. Nevertheless, it remains debatable whether IoU–Smooth L1 Loss truly resolves the angular discontinuity issue or merely prevents sudden loss spikes.
Another research direction focuses on direct quadrilateral detection. However, this approach faces inherent ambiguity in defining the order of four vertices. The Gliding Vertex proposed in [13] is a novel representation, first detecting a horizontal box and then predicting normalized offsets for the vertices relative to the box’s sides, thereby reducing vertex ordering ambiguity. Yet, its performance degrades for near-horizontal objects, necessitating the introduction of a learnable slant factor—a compromise rather than a fundamental solution. RSDet [14] further tackled the vertex ordering problem by applying a vertex sorting algorithm and a modulated rotation loss to compute the vertex-wise loss. Despite these efforts, direct vertex regression remains suboptimal due to spatial discrepancies between the predicted and ground truth vertices.
More recently, CSL [15] redefines the angle prediction task by converting the continuous regression problem into a discrete classification task. By employing circular smooth labels, CSL confines the angle predictions within a predefined range and mitigates discontinuity at the boundaries. However, this approach introduces a heavy classification head and suffers from quantization errors, necessitating careful tuning of the angle interval parameter to balance classification complexity and angular accuracy.
In contrast, recent methods such as Oriented-Reppoints [18] and Oriented-RCNN [17] have been proposed to further improve rotated-object detection. Despite their innovations, these methods also exhibit limitations. Oriented-Reppoints, which directly model objects using representative points, may struggle to accurately capture the geometry of extremely elongated objects or to handle complex background interference. Meanwhile, Oriented-RCNN still relies on rotated bounding box representations and thus inherits similar angular boundary challenges and limitations in capturing fine-grained spatial details due to conventional pooling operations.
These limitations across both traditional and recent approaches underscore the necessity for a novel methodology that addresses the core challenges in rotated-object detection—particularly robust localization representation and effective mitigation of angular boundary effects. Our proposed DenseRRSD method is designed with these challenges in mind, leveraging dense RepPoints and advanced feature-fusion strategies to achieve superior detection performance.

3. Method

3.1. Overview

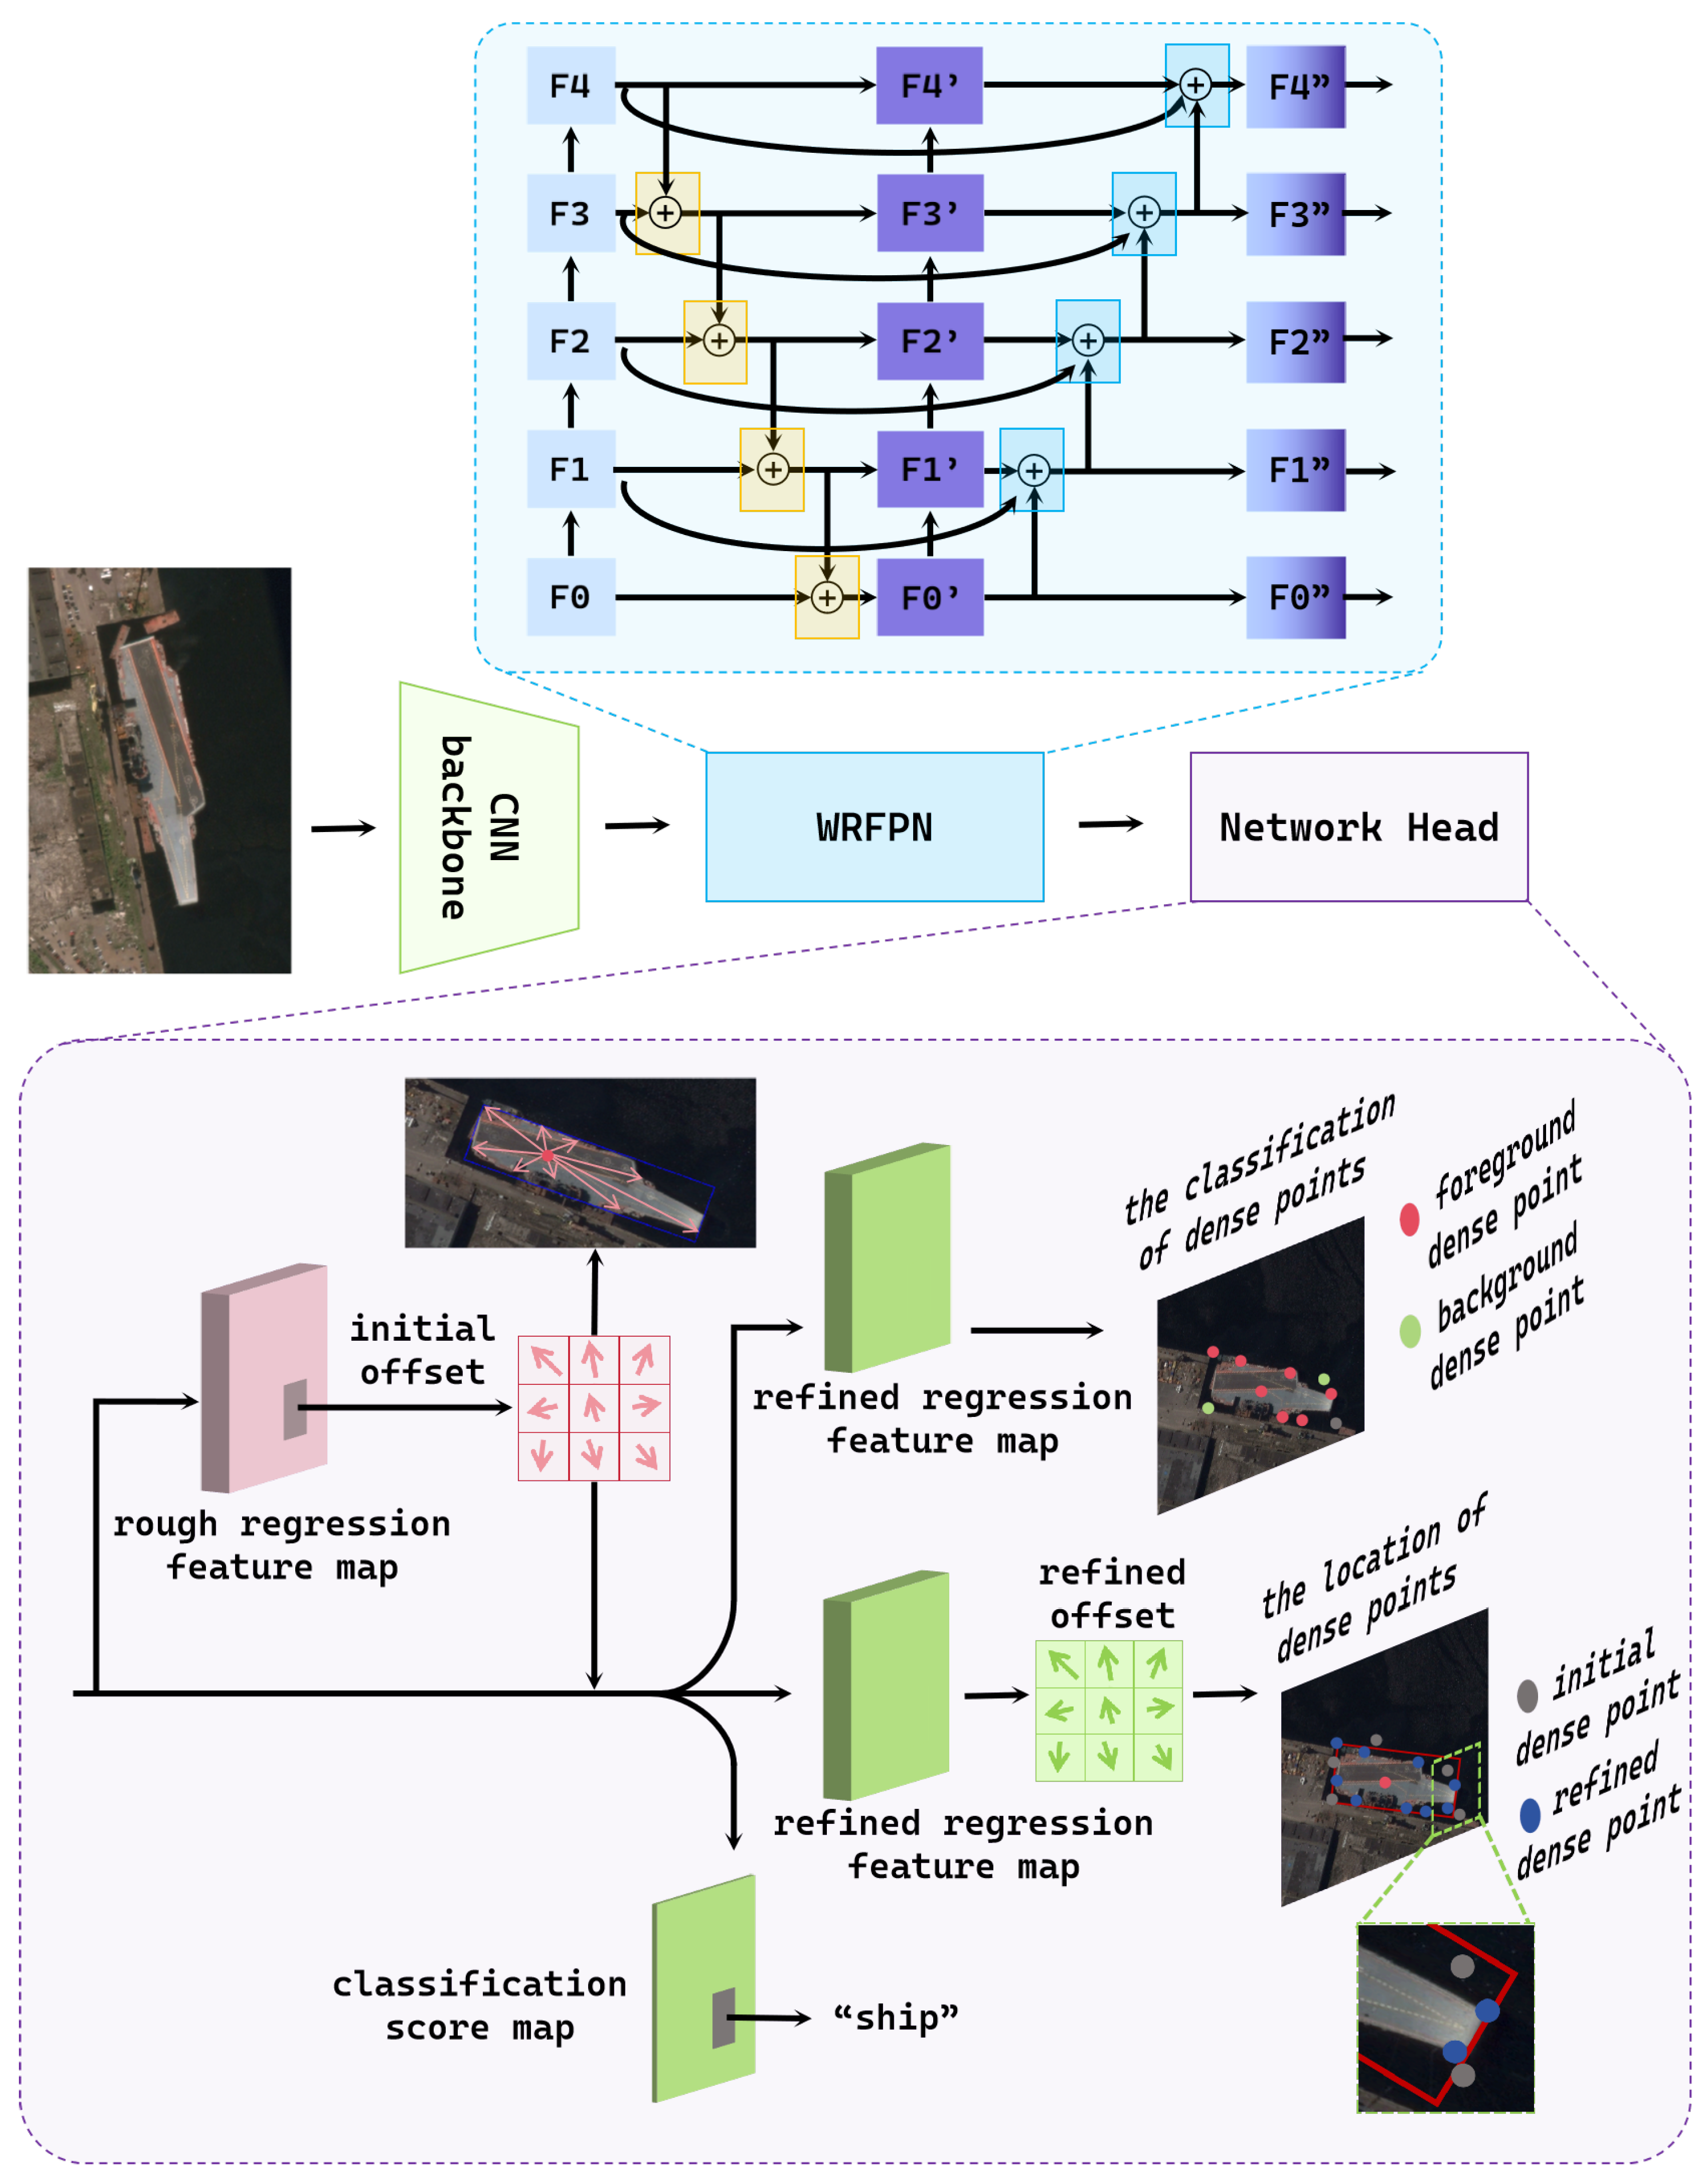
Figure 2 presents the overall architecture of the proposed DenseRRSD. Given an input remote sensing image, a CNN backbone first extracts hierarchical feature maps { F 0 , F 1 , F 2 , F 3 , F 4 } , capturing multi-scale spatial and semantic information. These feature maps are then processed by the proposed Weighted Residual Feature Pyramid Network (WRFPN), which integrates top–down and bottom–up pathways with residual connections and learnable fusion weights to produce enhanced multi-scale features { F 0 , F 1 , F 2 , F 3 , F 4 } .
On top of the fused features, the detection head follows a coarse-to-fine dense RepPoints prediction strategy. An initial regression branch predicts coarse offsets for dense RepPoints, while a parallel classification branch outputs corresponding confidence scores for foreground and background regions. A refinement branch then adjusts these coarse offsets to improve the spatial accuracy of each RepPoint. The predicted foreground points are subsequently aggregated through a post-processing step to generate the final rotated bounding boxes of ships.
This design enables DenseRRSD to densely capture object boundaries and internal structural details, while simultaneously suppressing background noise. By combining hierarchical feature fusion, coarse-to-fine localization, and confidence-guided filtering, the proposed framework achieves precise and robust rotated-object detection, particularly for elongated and direction-sensitive targets such as ships in remote sensing imagery.

3.2. Representative Points

RPDet proposes a refined object detection representation paradigm in which each object is modeled as a set of representative points, encoding both positional and semantic information. Unlike traditional detectors that rely on rigid rectangular bounding boxes, RPDet adopts a point-based approach that is inherently more flexible and geometry-aware. As a horizontal detection method, it addresses the limitations of rectangular bounding box predictions, which often capture excessive background and lead to degraded feature quality—particularly in the case of objects with irregular shapes or extreme aspect ratios.
To overcome this, RPDet learns a set of freely placed RepPoints distributed around the object. These points can adaptively capture important object boundaries and internal semantic cues. The learned RepPoints serve as a soft structure that guides both classification and localization, enabling the network to focus on more informative regions.
Mathematically, the RPDet representation is formulated as:
S = { p i } i = 1 n , p i = ( x + Δ x i , y + Δ y i )
where S denotes the set of representative points, p i is the i-th RepPoint, ( x , y ) is the central coordinate of the current receptive field, and ( Δ x i , Δ y i ) represents the offset of the RepPoint from the center. In the original RPDet design, n is typically set to 9, meaning each object is modeled by 9 learnable points, allowing sufficient coverage for general-purpose object detection in natural scenes.
Due to its flexibility and fine-grained nature, the concept of representative points has also been extended beyond object detection. For instance, in image segmentation tasks or dense pose estimation, a higher number of prediction points—such as 729—can be used to capture intricate contours of objects like circular shapes, curved boundaries, or elongated structures [53]. This extension improves localization accuracy by densely sampling along the object edges.
To structure the scattered points into coherent object shapes, RPDet introduces a Delaunay Triangulation mechanism that connects neighboring points into triangles. This triangulated representation allows for the reconstruction of object masks or approximate boundaries with higher fidelity. Although increasing the number of RepPoints may exponentially raise the computational cost, practical engineering strategies like grouped pooling and shared convolutional features ensure that the added complexity remains tractable.
In the context of rotated-object detection, especially for ships in remote sensing imagery, RPDet’s standard horizontal representation remains limited. It does not account for object orientation, and the default sparse 9-point layout may fail to capture subtle shape changes along elongated or rotated structures. Therefore, in our proposed DenseRRSD, we build upon the core idea of RPDet and significantly extend it by employing a larger set of dense representative points. This dense point representation, combined with orientation-aware sampling and loss design, provides a more powerful and rotation-invariant foundation for detecting ships in challenging aerial scenarios.

3.3. Edge Region Sampling Strategy

The proposed method detects dense RepPoints through prediction. A critical challenge lies in effectively representing these dense RepPoints as sampling targets. In segmentation tasks, binary masks or annular sampling strategies are commonly employed to sample target regions. Binary-mask-based sampling is widely used due to its simplicity and broad applicability. The annular sampling structure can effectively capture fine-grained details. However, in detection tasks, where the hierarchical representation of targets is essential, existing methods fail to accurately capture the foreground regions of specific targets.
Considering the current annotation schemes and the common use of binary masks and annular sampling in target representation, we propose an edge region sampling strategy to sample dense RepPoints. The obtained dense RepPoints serve as high-quality training data, providing richer supervision signals. In this section, we introduce a sampling strategy to obtain more precise target locations for detection. Specifically, an object’s annotation is a rotated bounding box, and we define an annular sampling region extending a fixed distance around the annotation. RepPoints within this region are uniformly sampled at a fixed rate, whereas those outside the annular band are excluded to achieve targeted sampling of the edge region.
Since ships often exhibit elongated and narrow structures, an appropriate sampling strategy should emphasize critical regions such as the V-shaped bow and the main hull section. To address this, the ship’s annotation mask is adaptively expanded into a rectangular region to cover a larger edge sampling area. The sampling process can be formulated as:
I ( p ) = g ( D ( p ) )
D ( p ) = min b β p b max b , b β b x b x · max b , b β b y b y
g ( x ) = 1 , x φ 0 , x > φ
where I ( p ) is the sampling indicator function at position p, and D ( p ) represents the function computing the normalized distance between the annular region and candidate sampling point p. The function g ( x ) acts as a threshold function. In the above formulation, p belongs to the annular sampling set, while b represents an arbitrary RepPoint within the annular region. When the candidate sampling point p is within the threshold distance φ , the threshold function g ( x ) outputs 1, indicating that the point is sampled. Otherwise, it outputs 0, meaning the point is not sampled.
Although the proposed edge region sampling strategy is primarily designed to emphasize elongated ship structures, it also demonstrates favorable robustness under more challenging scenarios. For small-scale ships, despite their limited pixel coverage, boundary contours usually remain distinguishable, allowing RepPoints to be effectively sampled along high-gradient regions. In cases of partial occlusion, the sampling strategy relies on visible contour fragments rather than complete object shapes, enabling the network to exploit available structural cues. Moreover, since the sampling process does not assume any predefined geometric template, it remains inherently adaptable to ships with irregular or non-standard shapes. Consequently, the proposed edge region sampling strategy maintains stable localization behavior across diverse ship scales and appearance variations.
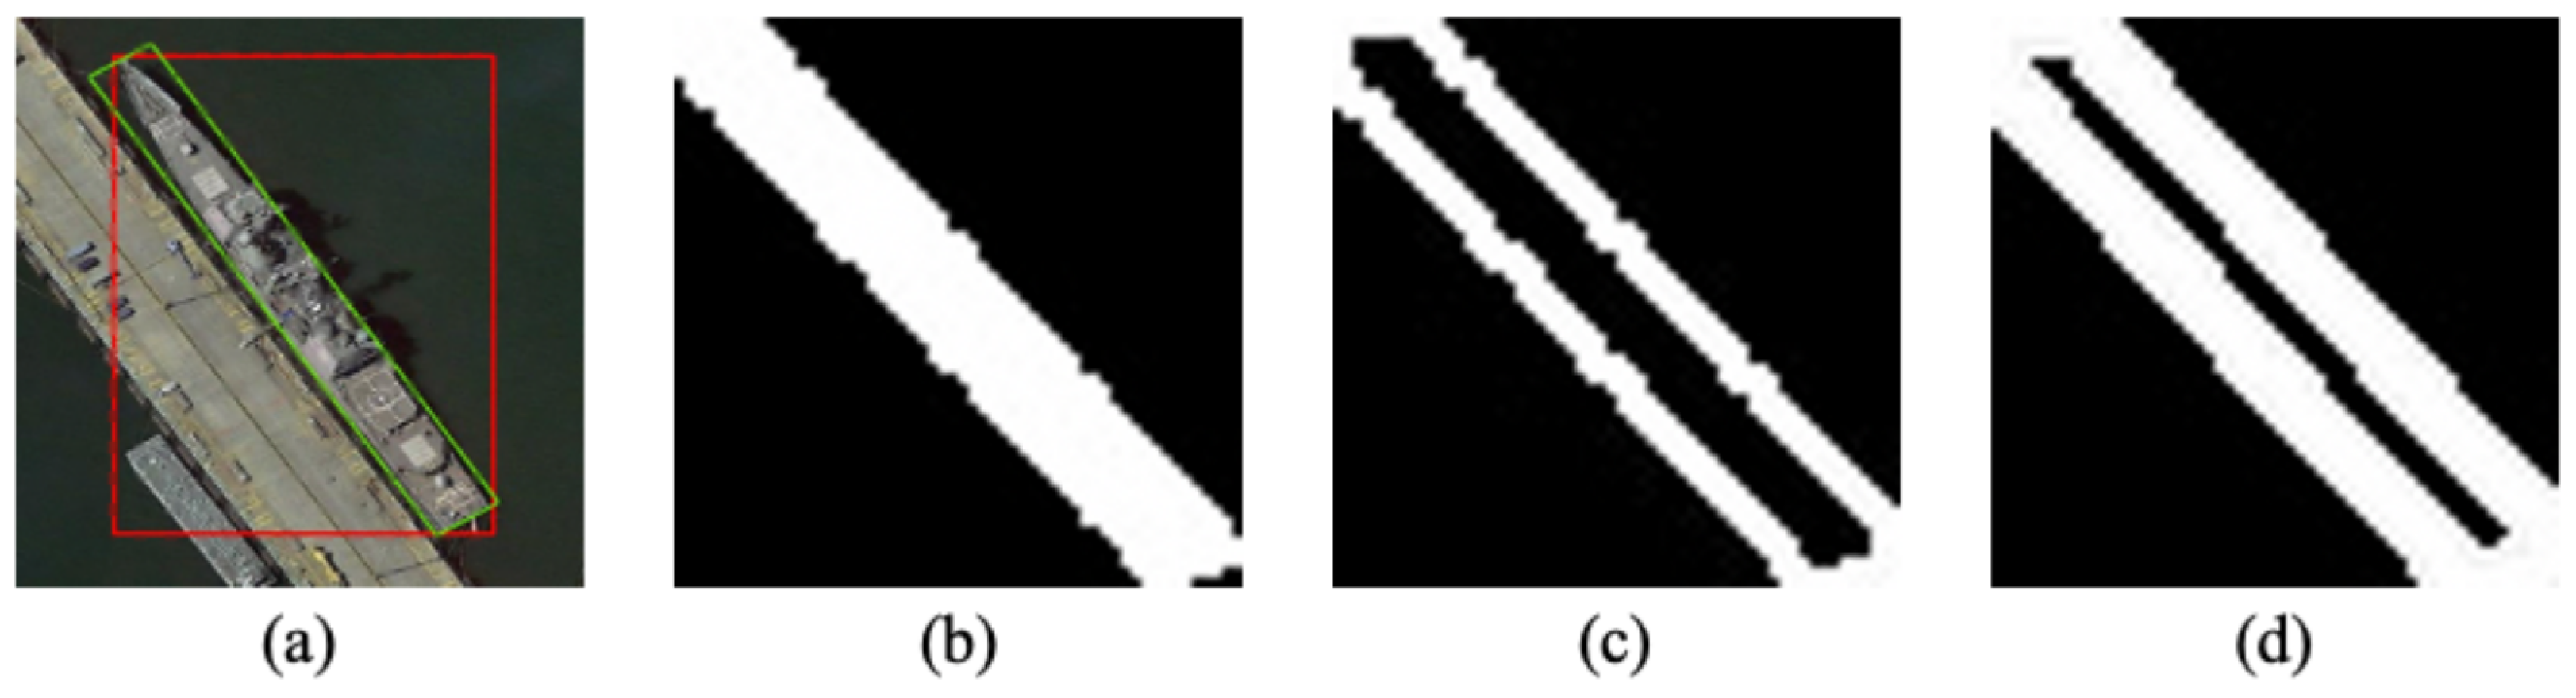
Figure 3 visualizes the sample strategy using a V-shaped bow destroyer as an example. Figure 3a shows the original target image segmentation, where the red bounding box represents the horizontal detection box, and the green bounding box represents the rotated detection box. It can be observed that the intersection region between the red and green boxes already closely aligns with the ship’s body. Taking the horizontal box as the display range, Figure 3b highlights the intersection region in white. Figure 3c depicts the ship’s wheelhouse as outlined by the current method, while Figure 3d presents the final sampled region after applying the border sampling strategy. Assuming the ship’s bow is oriented approximately at 31° west–north, the original rectangular region enclosing the ship’s superstructure is scaled and expanded accordingly to achieve relatively dense sampling. The effect becomes even more pronounced as the ship’s orientation approaches horizontal or vertical alignment. Additionally, the final sampled region includes both the ship’s internal region and its external boundary area. This ensures that the sampling strategy not only focuses on the ship itself but also comprehensively considers the surrounding contextual information. By doing so, the localization accuracy is significantly improved.

3.4. Weighted Residual Feature Pyramid Network

Multi-scale feature fusion is a strategy to aggregate features from different hierarchical levels. In the problem of feature fusion, a set of multi-scale features is defined as: P i n = ( P l 1 i n , P l 2 i n , ) . The objective is to find a transformation function f that effectively aggregates features from different levels and outputs a series of new features, P o u t = f ( P i n ) , where P l i i n represents the feature at level l i extracted from the backbone network.
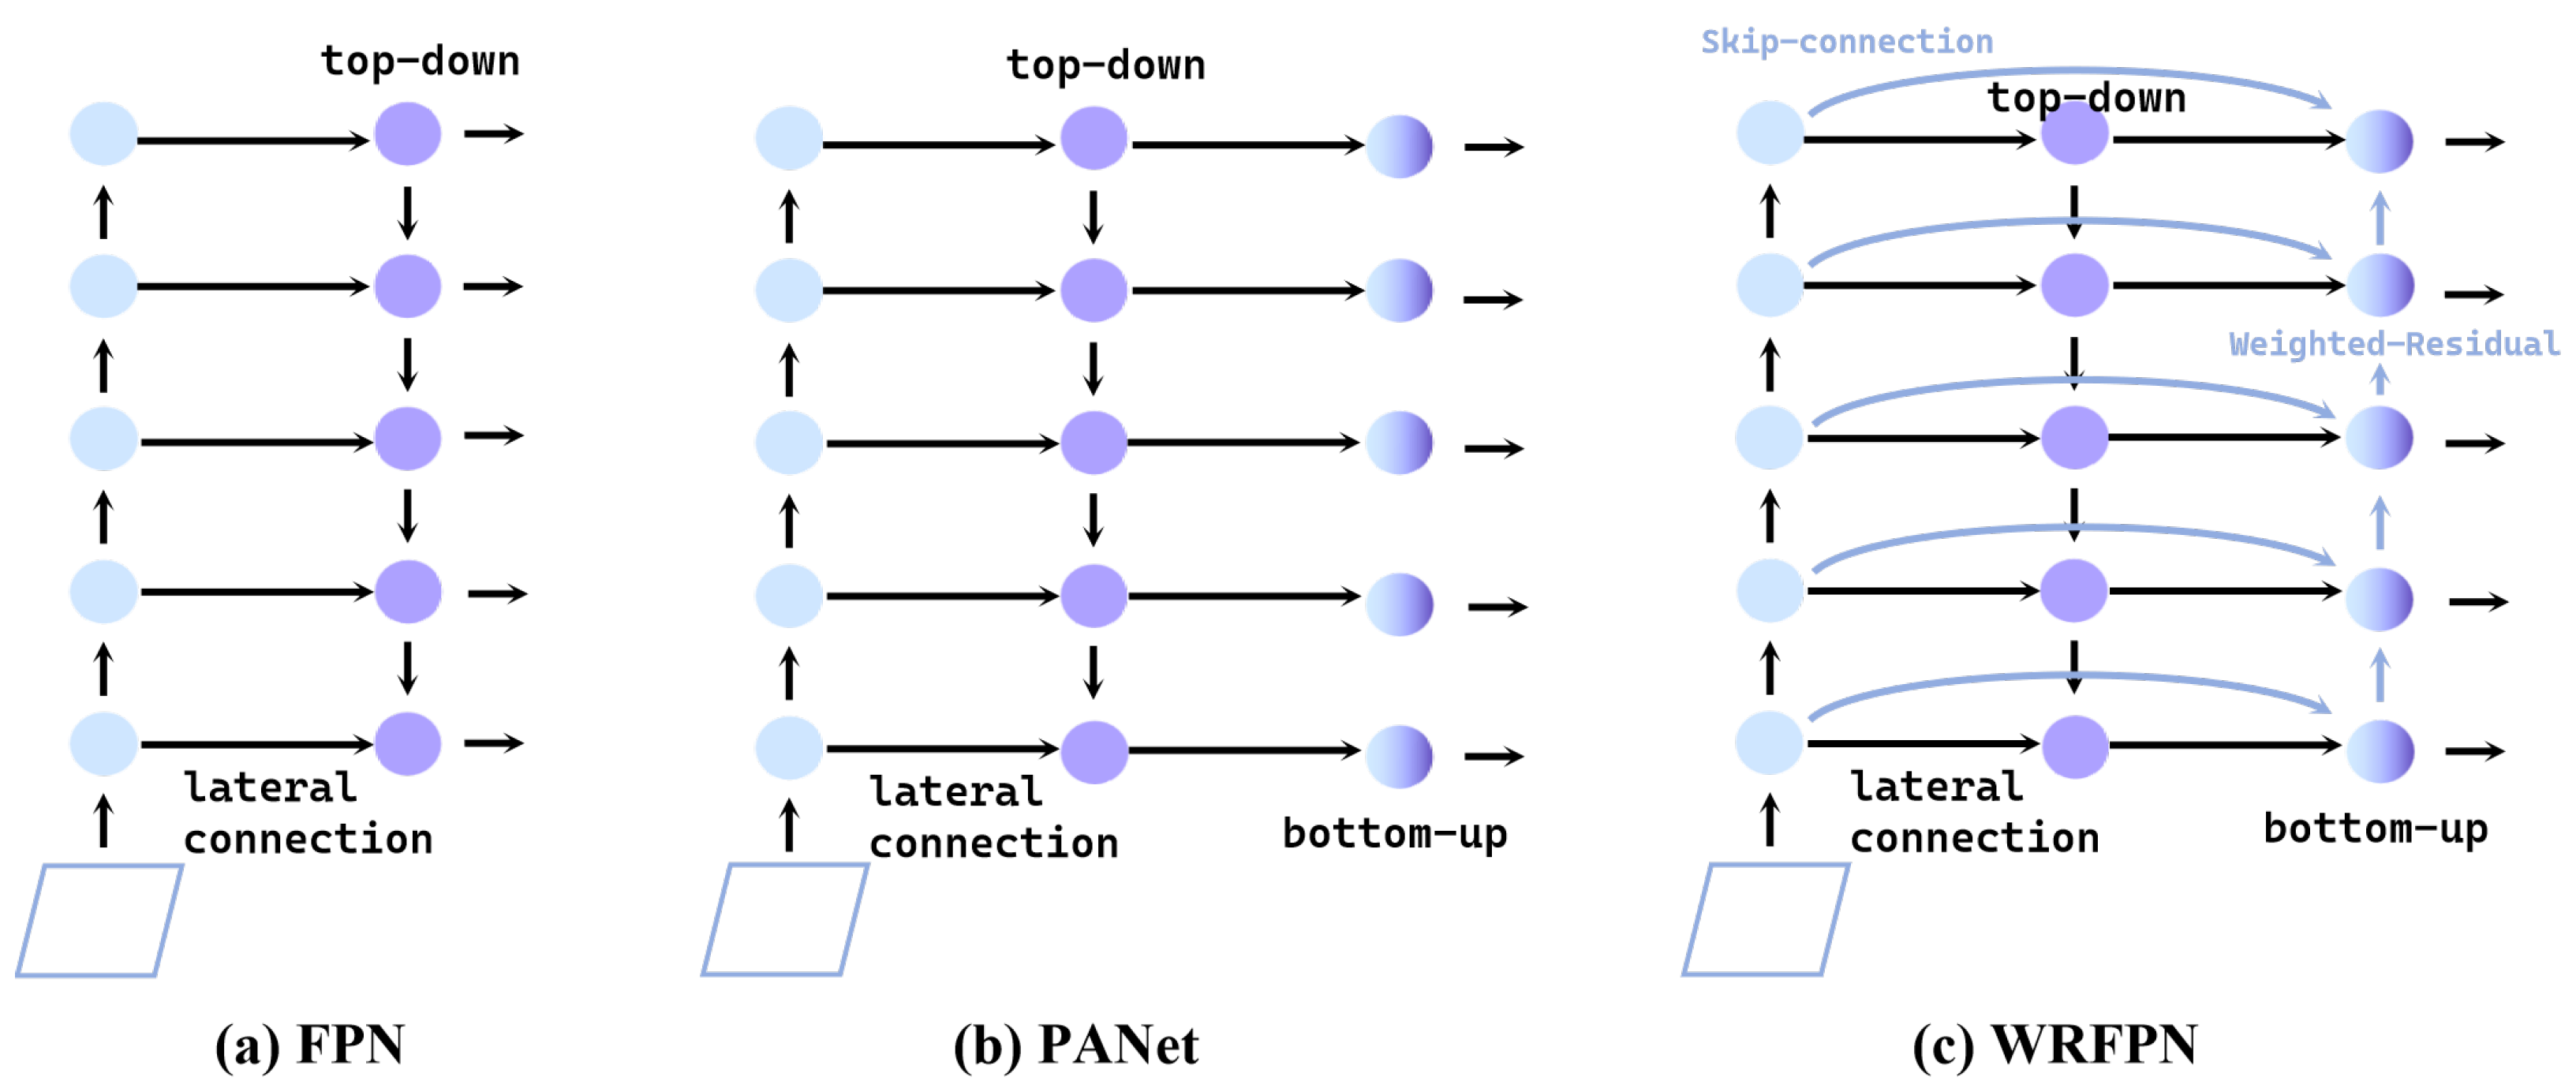
Feature Pyramid Networks [54] are commonly used components in modern object detection architectures. As shown in Figure 4a, an Feature Pyramid Network(FPN) can integrate features via lateral connections and top–down pathways, allowing shallow, spatially-sensitive features to be fused with high-level, semantically strong representations, thereby enhancing detection performance. Taking the output feature at the fourth level as an example, its formulation can be expressed as:
P 4 o u t = C o n v l a t e r a l ( P 4 i n ) + U p S a m p l i n g ( P 5 o u t )
where C o n v denotes a convolutional operation applied to the fused features, l a t e r a l represents a 1 × 1 convolution applied to the lateral connection, and U p S a m p l i n g denotes the upsampling operation.
Based on FPN, Path Aggregation Network(PANet) [55] introduces an additional bottom–up pathway to shorten the distance between high-level and low-level features, thereby better preserving spatial information from lower layers, as illustrated in Figure 4b. We propose an improvement based on PANet by introducing skip connections to form a residual structure. Unlike traditional feature-fusion methods, our approach integrates features from different hierarchical levels with weighted feature fusion to obtain richer feature representations. We name this module the Weighted Residual Feature Pyramid Network (WRFPN).
Specifically, we add a skip connection from the input feature P i n to the output feature to incorporate more informative representations. This residual structure helps reduce network learning costs and optimizes feature output. Additionally, previous methods treated features from different hierarchical levels equally during fusion, despite the fact that they have different resolutions and contribute differently to the final output.
To address this issue, in the WRFPN, we employ a weighted summation strategy for feature fusion. The weights are learnable and can be adjusted through gradient-based optimization during training. Moreover, the skip connections facilitate adaptive learning of weights, enhancing the flexibility of the output features. Taking the fourth-level output feature as an example, the WRFPN can be formulated as:
P 4 m d = C o n v l a t e r a l ( P 4 i n ) + U p S a m p l i n g ( P 5 o u t ) P i o u t = C o n v w 1 · l a t e r a l ( P i i n ) + P i m d + w 2 · D o w n s a m p l i n g ( P i 1 o u t )
where P 4 m d represents the intermediate feature at level 4, equivalent to the output in FPN. w 1 is the weight for the skip connection, and w 2 represents the weight for feature fusion across different levels. The operation D o w n s a m p l i n g denotes downsampling.

3.5. Network Head Architecture

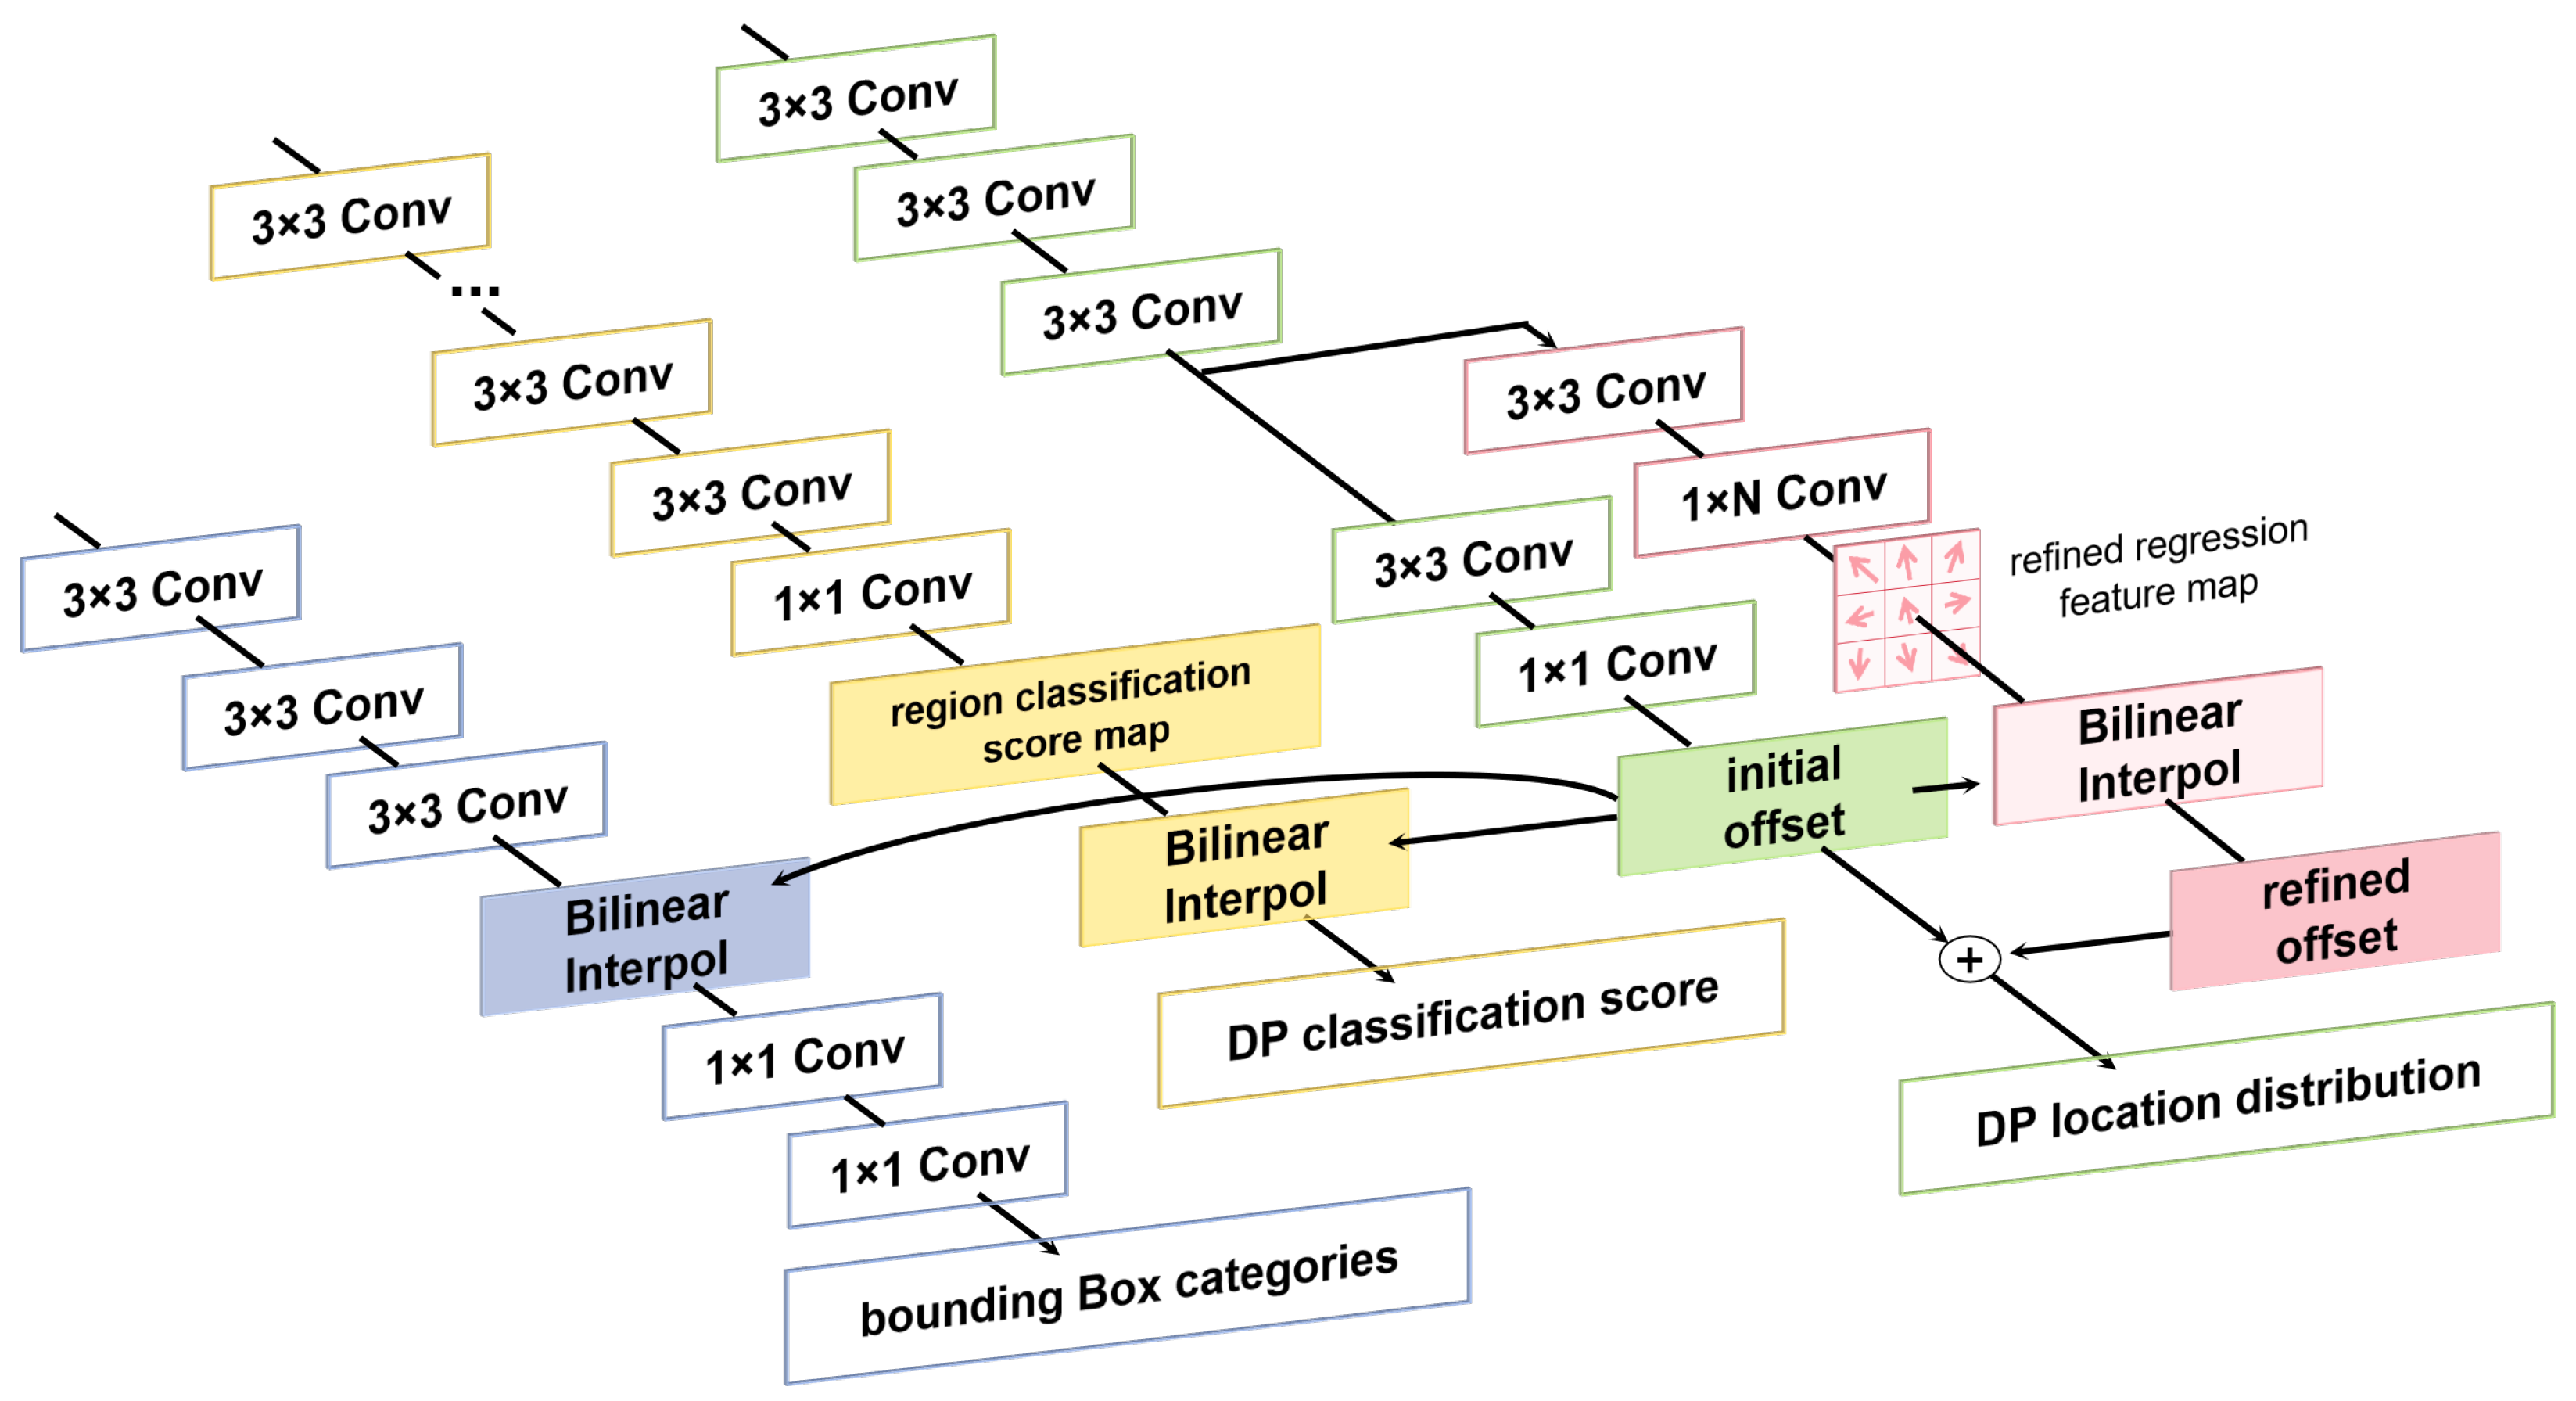
As illustrated in Figure 5, the detection head network of DenseRRSD primarily consists of three branches: the dense RepPoint localization branch, the dense RepPoint classification branch, and the detection classification branch. Our method replaces the traditional detection localization branch with the first two branches. All three branches utilize the features extracted from the WRFPN.
For the dense RepPoint localization branch, we first compute the coarse displacement field relative to the feature center, which estimates the coarse offset from the predicted RepPoint to the relative feature center. This coarse displacement is then refined by interpolating finer-grained offset features, ultimately producing the final RepPoint localization by adding the refined displacement to the initial prediction. For the dense RepPoint classification branch, the refined displacement serves as the basis for obtaining a corresponding feature map in the specific region, from which bilinear interpolation is used to extract classification results for each RepPoint. For the detection classification branch, the coarse displacement prediction is leveraged as the foundation for classification feature extraction, followed by bilinear interpolation. The interpolated feature is then passed through fully connected layers to output the final classification result.
DenseRRSD detects a large number of dense RepPoints, requiring significant computational resources to process relevant feature information. To address this, our method adopts an efficient computation strategy inspired by the work of [53]. In [53], the feature maps used for classification prediction are represented as high-dimensional tensors of shape N × H × W . However, these feature maps are spatially fixed, meaning that the extracted classification features for each representative point must be interpolated from the corresponding locations in the N × H × W feature space. This process increases computational costs significantly, as it results in an output tensor of shape 729 × N × H × W . To mitigate this issue, the feature map is grouped into K groups, where each RepPoint is assigned to a group, and the corresponding feature is interpolated. This results in a lower-dimensional tensor of shape N × K × H × W , thereby significantly reducing computational complexity.
However, practical experiments have shown that during this grouping process, it is necessary to calculate K feature groups of size N × K × H × W , and then further refine each group’s feature representation to obtain a final output tensor of size K × N × H × W . Our method enhances the original grouping approach by refining the bilinear interpolation process. Instead of performing a rigid grouping strategy, our method selects feature offsets more flexibly from the dense RepPoint set, generating a refined classification feature tensor of size K × N × H × W . This selection process helps improve classification accuracy while maintaining computational efficiency, making it a practical and acceptable solution for dense classification tasks.

3.6. Loss Function

Since the ground-truth dense RepPoints are sampled using an edge-region sampling strategy, RepPoints near the object’s boundary are uniformly sampled within a certain range. This results in some RepPoints belonging to the foreground while others belong to the background. Therefore, during location prediction, it is necessary to simultaneously predict their categories. The loss function of our method can be divided into four parts, defined as follows:
L = L c l s b + L l o c b + L c l s p + L l o c p
where the sequence follows detection classification, detection localization, dense RepPoint classification, and dense RepPoint localization. More precisely, detection localization and dense RepPoint localization are further divided into coarse detection localization and refined localization, expressed as:
L l o c b = L l o c i n i t _ b + L l o c r e f i n e _ b
L l o c p = L l o c i n i t _ p + L l o c r e f i n e _ p
where i n i t represents the coarse detection stage, and r e f i n e denotes the refinement stage. The detection classification loss function adopts Focal Loss, while the dense RepPoint classification loss function utilizes cross-entropy loss. Notably, the ground truth for dense RepPoint classification is determined based on the positional relationship between the predicted RepPoints in the current training iteration and the annotated rotated ground-truth positions. RepPoints within the detection bounding box are treated as foreground, while others are considered background.
For dense RepPoint localization, we employ an assignment-based supervision strategy, meaning that each predicted RepPoint is assigned to a ground-truth RepPoint for supervision. The loss function is defined as follows:
L l o c p ( R , R ) = 1 n i = 1 n ( x i , y i ) ( x i , y i )
where R represents the set of predicted dense RepPoints, and R represents the set of ground-truth dense RepPoints ( x i , y i ) R , with n denoting the number of dense RepPoints. This approach essentially assigns a precise spatial position to each predicted RepPoint, avoiding excessive network training complexity while maintaining an orderly distribution of RepPoints.
Thus, the dense RepPoint localization loss function incorporates the chamfer distance loss, transforming it into the Weighted Chamfer Loss (WCL). The proposed WCL loss is formulated as:
L l o c p ( R , R ) = w 1 2 n i = 1 n min j ( x i , y i ) ( x j , y j ) + w 2 2 m j = 1 m min i ( x i , y i ) ( x j , y j )
By incorporating the weighted chamfer distance, the proposed WCL encourages dense RepPoints to concentrate on semantically significant ship structures, such as the bow and hull boundaries, which are critical for accurate maritime ship localization. Notably, the weights w 1 and w 2 are intentionally allowed to take negative values. This design does not imply a negative loss value; instead, negative weighting reverses the contribution of specific distance terms during backpropagation, effectively modulating gradient directions rather than loss magnitudes. From an optimization perspective, this mechanism introduces an implicit gradient-rebalancing effect that suppresses the influence of less informative or ambiguous background regions while emphasizing structurally discriminative ship contours. As a result, the predicted RepPoints form a more uniform and geometry-aware distribution, leading to improved robustness for elongated and direction-sensitive ship targets.
We propose a two-stage localization loss strategy: In the early training phase, dense RepPoints are mapped to horizontal bounding boxes, and the Smooth L1 Loss is used to measure the distance between the predicted and ground-truth horizontal bounding boxes. Once the predicted results become more accurate, we employ IoU Loss to further refine the localization of rotated bounding boxes. This process is formulated as:
L l o c b ( p , g ) = i { x 1 , y 1 , x 2 , y 2 } s m o o t h L 1 ( p i g i ) , epoch E i { x 1 , y 1 , , x 4 , y 4 } log ( I o U ( p i , g i ) ) , epoch > E
where p represents the detection results, g denotes the ground truth, and E is the training epoch at which the loss function transitions. During the early stages, Smooth L1 Loss is used to optimize the top-left and bottom-right corner points of the horizontal detection bounding box, where p = ( x 1 p , y 1 p , x 2 p , y 2 p ) and g = ( x 1 g , y 1 g , x 2 g , y 2 g ) . In the later stage, IoU Loss optimizes the shape of the rotated bounding box by calculating the intersection-over-union (IoU) of the quadrilateral edges formed by the corner points.

4. Experimental Results and Analysis

4.1. Dataset and Evaluation Metrics

To thoroughly evaluate the effectiveness and generalization ability of the proposed DenseRRSD method, we conduct experiments on two publicly available remote sensing datasets: HRSC2016 and DOTA-SHIP.
(1) HRSC2016 [56]: HRSC2016 is a widely used benchmark for ship detection in remote sensing images. It contains 1061 high-resolution images with varying resolutions ranging from 300 × 300 to 1500 × 900 pixels. Each image is annotated with rotated bounding boxes that provide both orientation and category information. Following the official split, we use 617 images (containing 1748 ship instances) for training and 444 images (with 1228 instances) for testing. Since our task focuses on detecting ships rather than classifying ship types, we adopt the first-level annotation scheme, treating all ships as a single category.
(2) DOTA-SHIP [57]: To evaluate DenseRRSD under more diverse and challenging conditions, we construct a new dataset named DOTA-SHIP, derived from the DOTA aerial image dataset. DOTA-SHIP includes 420 cropped image patches (1024 × 1024 pixels), containing a total of 36,258 ship instances. These images are selected from the original DOTA dataset, which spans a wide range of resolutions (800 × 800 to 4000 × 4000) and imaging conditions. We randomly split the dataset into 315 training images and 105 testing images. Compared to HRSC2016, DOTA-SHIP presents more complex backgrounds, denser object distributions, and greater variation in object scale and orientation, providing a more rigorous test for generalization.
For performance evaluation, we adopt the standard mean Average Precision (mAP) metric. Since DenseRRSD is designed as a single-class detector (ships only), the mAP is equivalent to the Average Precision (AP) of the ship category. In addition, Precision, Recall, and F1-score are reported to provide a more comprehensive assessment of detection accuracy and completeness. This evaluation protocol ensures consistency and enables fair comparison with previous state-of-the-art methods.

4.2. Experimental Setup

DenseRRSD is designed to detect ships by predicting a large number of RepPoints distributed around the object contour. In our experiments, we set the number of dense RepPoints to 225, which provides a good balance between localization accuracy and computational efficiency. Each RepPoint is supervised by an edge region sampling strategy, where we adopt a parameter of φ = 0.09 to ensure that RepPoints are densely concentrated on the ship’s periphery. In addition, we set γ = 9 to achieve a balanced global distribution of RepPoints, preventing excessive clustering in any single local region.
To effectively extract features for these predicted dense RepPoints, we construct the network head with three groups of 3 × 3 convolutional layers. Furthermore, a specialized 4 × 3 × 3 convolutional structure is introduced to refine the classification of each RepPoint. This design captures subtle ship boundary cues (e.g., at the bow or along the hull) without overly increasing the computational overhead.
For the classification task, we employ the Focal Loss with parameters α = 0.25 and γ = 1 . This choice mitigates the class imbalance issue by down-weighting easily classified examples and focusing on harder samples. To guide RepPoint localization, we use a Weighted Chamfer Loss (WCL) with hyperparameters w 1 = 3 and w 2 = 1 , thus allowing the model to penalize spatial deviations in a more flexible manner and assign higher importance to critical or semantically meaningful points. Additionally, we integrate a stage-wise localization loss scheme that first utilizes Smooth L1 Loss for coarse alignment and then switches to an IoU-based loss, controlled by an energy term E = 18 , for refined bounding box adjustment.
The overall loss function can be expressed as:
L = L c l s b + 0.5 × L l o c init , b + L l o c refine , b + L c l s p + 0.5 × L l o c init , p + L l o c refine , p ,
where { L c l s b , L c l s p } are the classification losses (for bounding box and dense points, respectively), and { L l o c init , b , L l o c refine , b , L l o c init , p , L l o c refine , p } represent localization losses in their coarse and refined stages. Following the common practice in the RepPoints family of methods, including Oriented RepPoints, the coarse localization losses are assigned a lower weight of 0.5. This design is not arbitrary but aims to balance the contributions of the initial and refined localization stages. Specifically, the coarse stage mainly provides a rough geometric prior to guide subsequent optimization, whereas the refined stage directly determines the final localization accuracy. Down-weighting the initial localization loss helps prevent overly strong constraints in the early training phase, thereby facilitating stable optimization and allowing the refinement stage to play a dominant role in precise target localization.
We trained DenseRRSD on an Nvidia RTX-4090 GPU for 36 epochs using Stochastic Gradient Descent (SGD) with a batch size of 1. The initial learning rate was 1.25 × 10 3 , reduced by a factor of 10 at epochs 24 and 33. To stabilize convergence, a warmup strategy was employed for the first 500 iterations. Data augmentation included random flipping and random rotation within the range [ 0 , 90 ] , thereby enhancing the model’s robustness to various ship orientations.
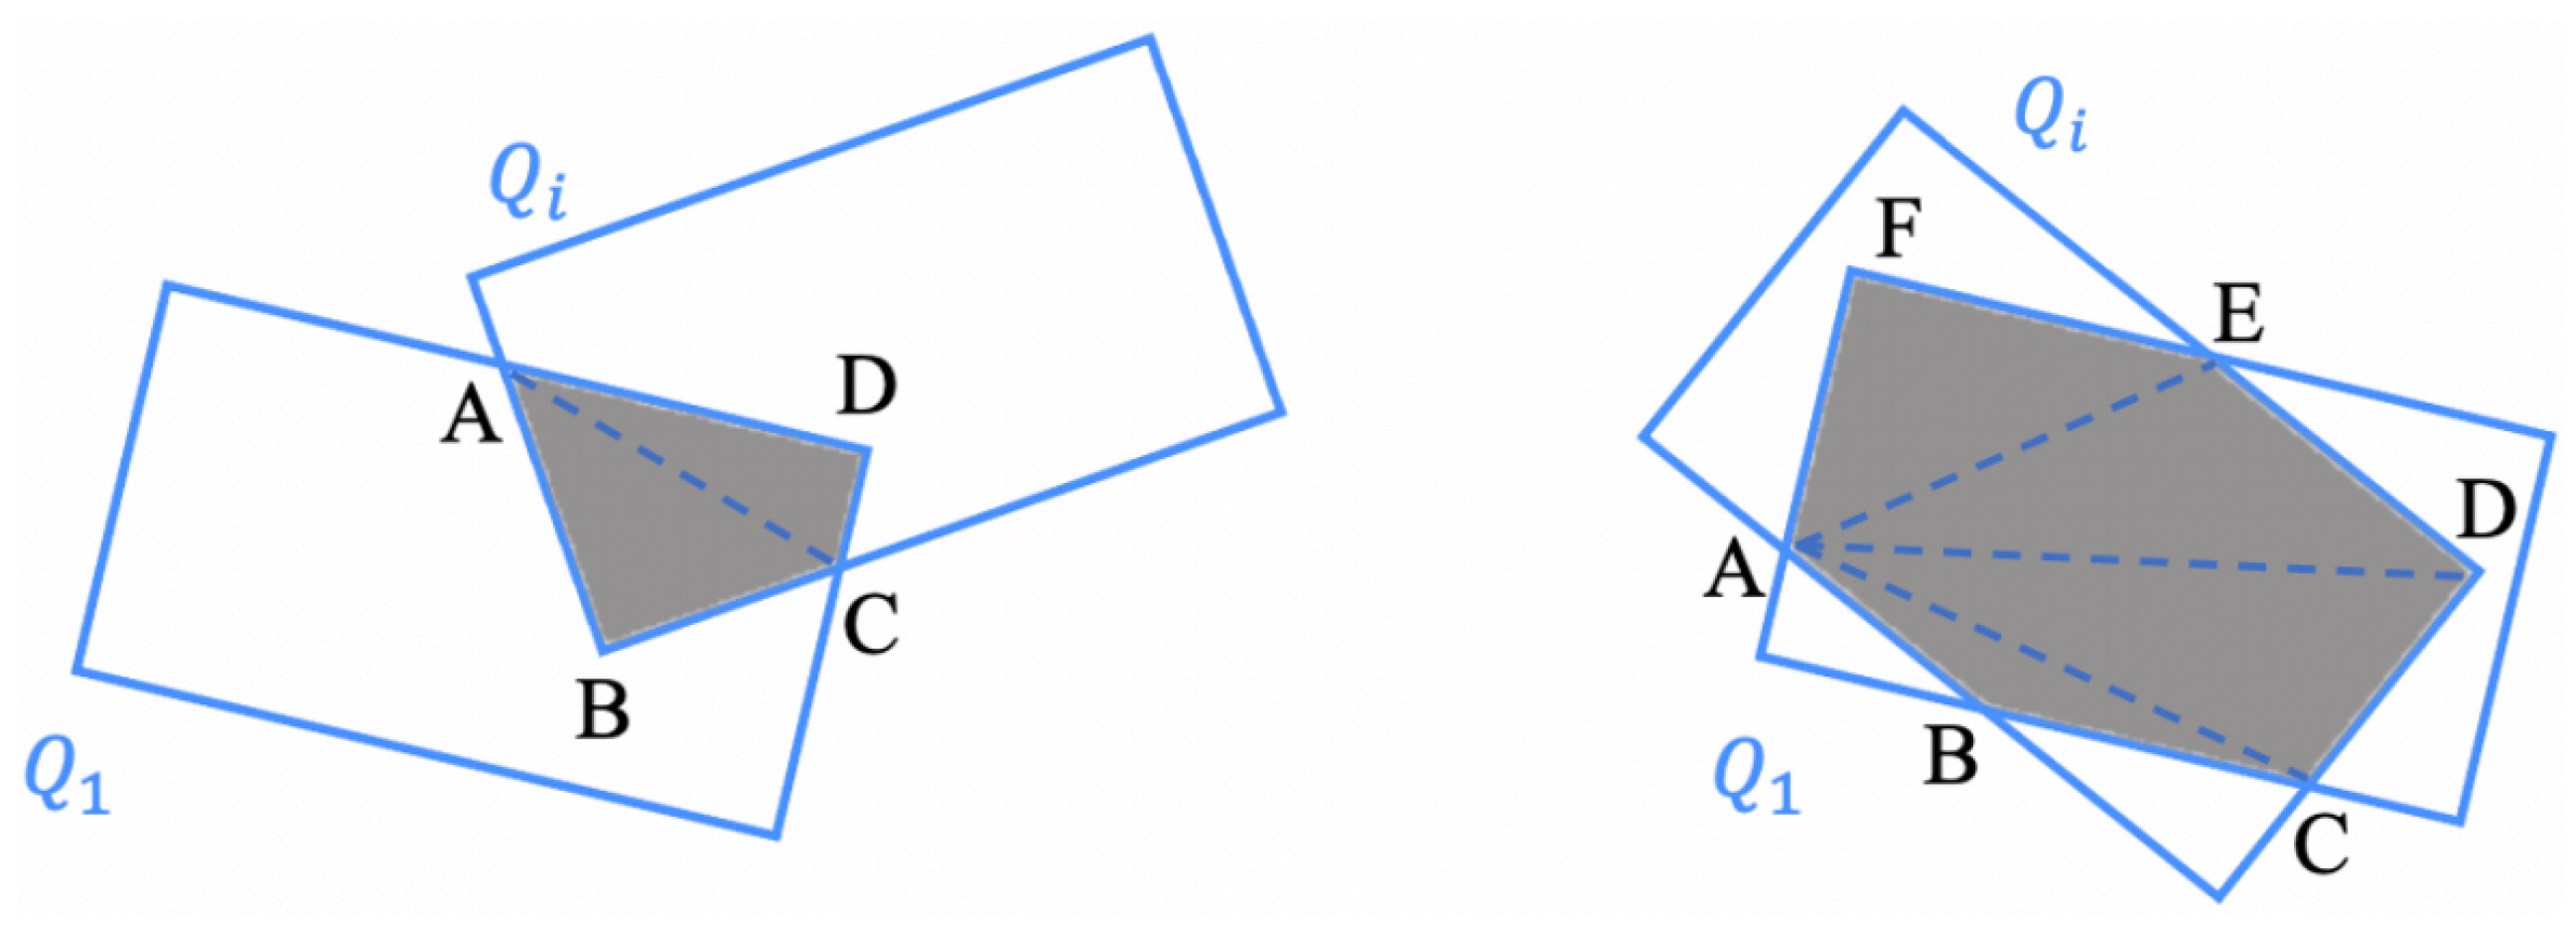
As shown in Figure 6, given a set of quadrilaterals ( Q 1 , Q 2 , . . . , Q N ) , to compute the rotated IoU between Q 1 and another quadrilateral Q i , the first step is to identify the intersection points between Q 1 and Q i , as well as the vertices of Q 1 inside Q i and vice versa. These three sets of points are then sorted in counterclockwise order and partitioned into multiple triangles. By summing the areas of these triangles, the intersection region can be determined, which allows the computation of the rotated IoU.

4.3. Comparative Experimental Results

To further evaluate DenseRRSD, we compare its performance against other high-precision oriented object detection methods. Table 1 presents the results of DenseRRSD in comparison with these methods. Besides the evaluation metric mAP, the table also specifies the backbone networks used and the input image sizes.
From the results, it can be observed that our method DenseRRSD achieves an mAP of 91.2% on the HRSC2016 dataset. In addition, DenseRRSD attains a Precision of 80.4%, Recall of 93.7%, and F1-score of 86.5%, indicating that it not only accurately identifies ships but also detects a high proportion of true targets. Compared to other methods, DenseRRSD improves CSL by 1.6 mAP, which addresses classification angular ambiguity issues. It also surpasses R3Det by 1.9 mAP, which utilizes feature reconfiguration strategies. Similarly, Oriented-RCNN and Oriented-Reppoints exhibit lower accuracy, each trailing by 0.8 mAP. These results demonstrate the effectiveness of employing a set of dense RepPoints for ship detection, achieving a strong balance between detection completeness and correctness.
To evaluate the generalization ability of DenseRRSD, we conduct experiments on the DOTA-SHIP dataset and compare it with other state-of-the-art rotated-object detection methods. The results, summarized in Table 2, show that DenseRRSD achieves the highest mAP of 83.2%, with a Precision of 78.1%, Recall of 89.5%, and F1-score of 83.4%. These results indicate that DenseRRSD maintains robust detection accuracy and completeness across complex scenes with ships of varying sizes and orientations. Notably, it outperforms Oriented-Reppoints by 1.8% in mAP, further demonstrating its strong generalization capability.
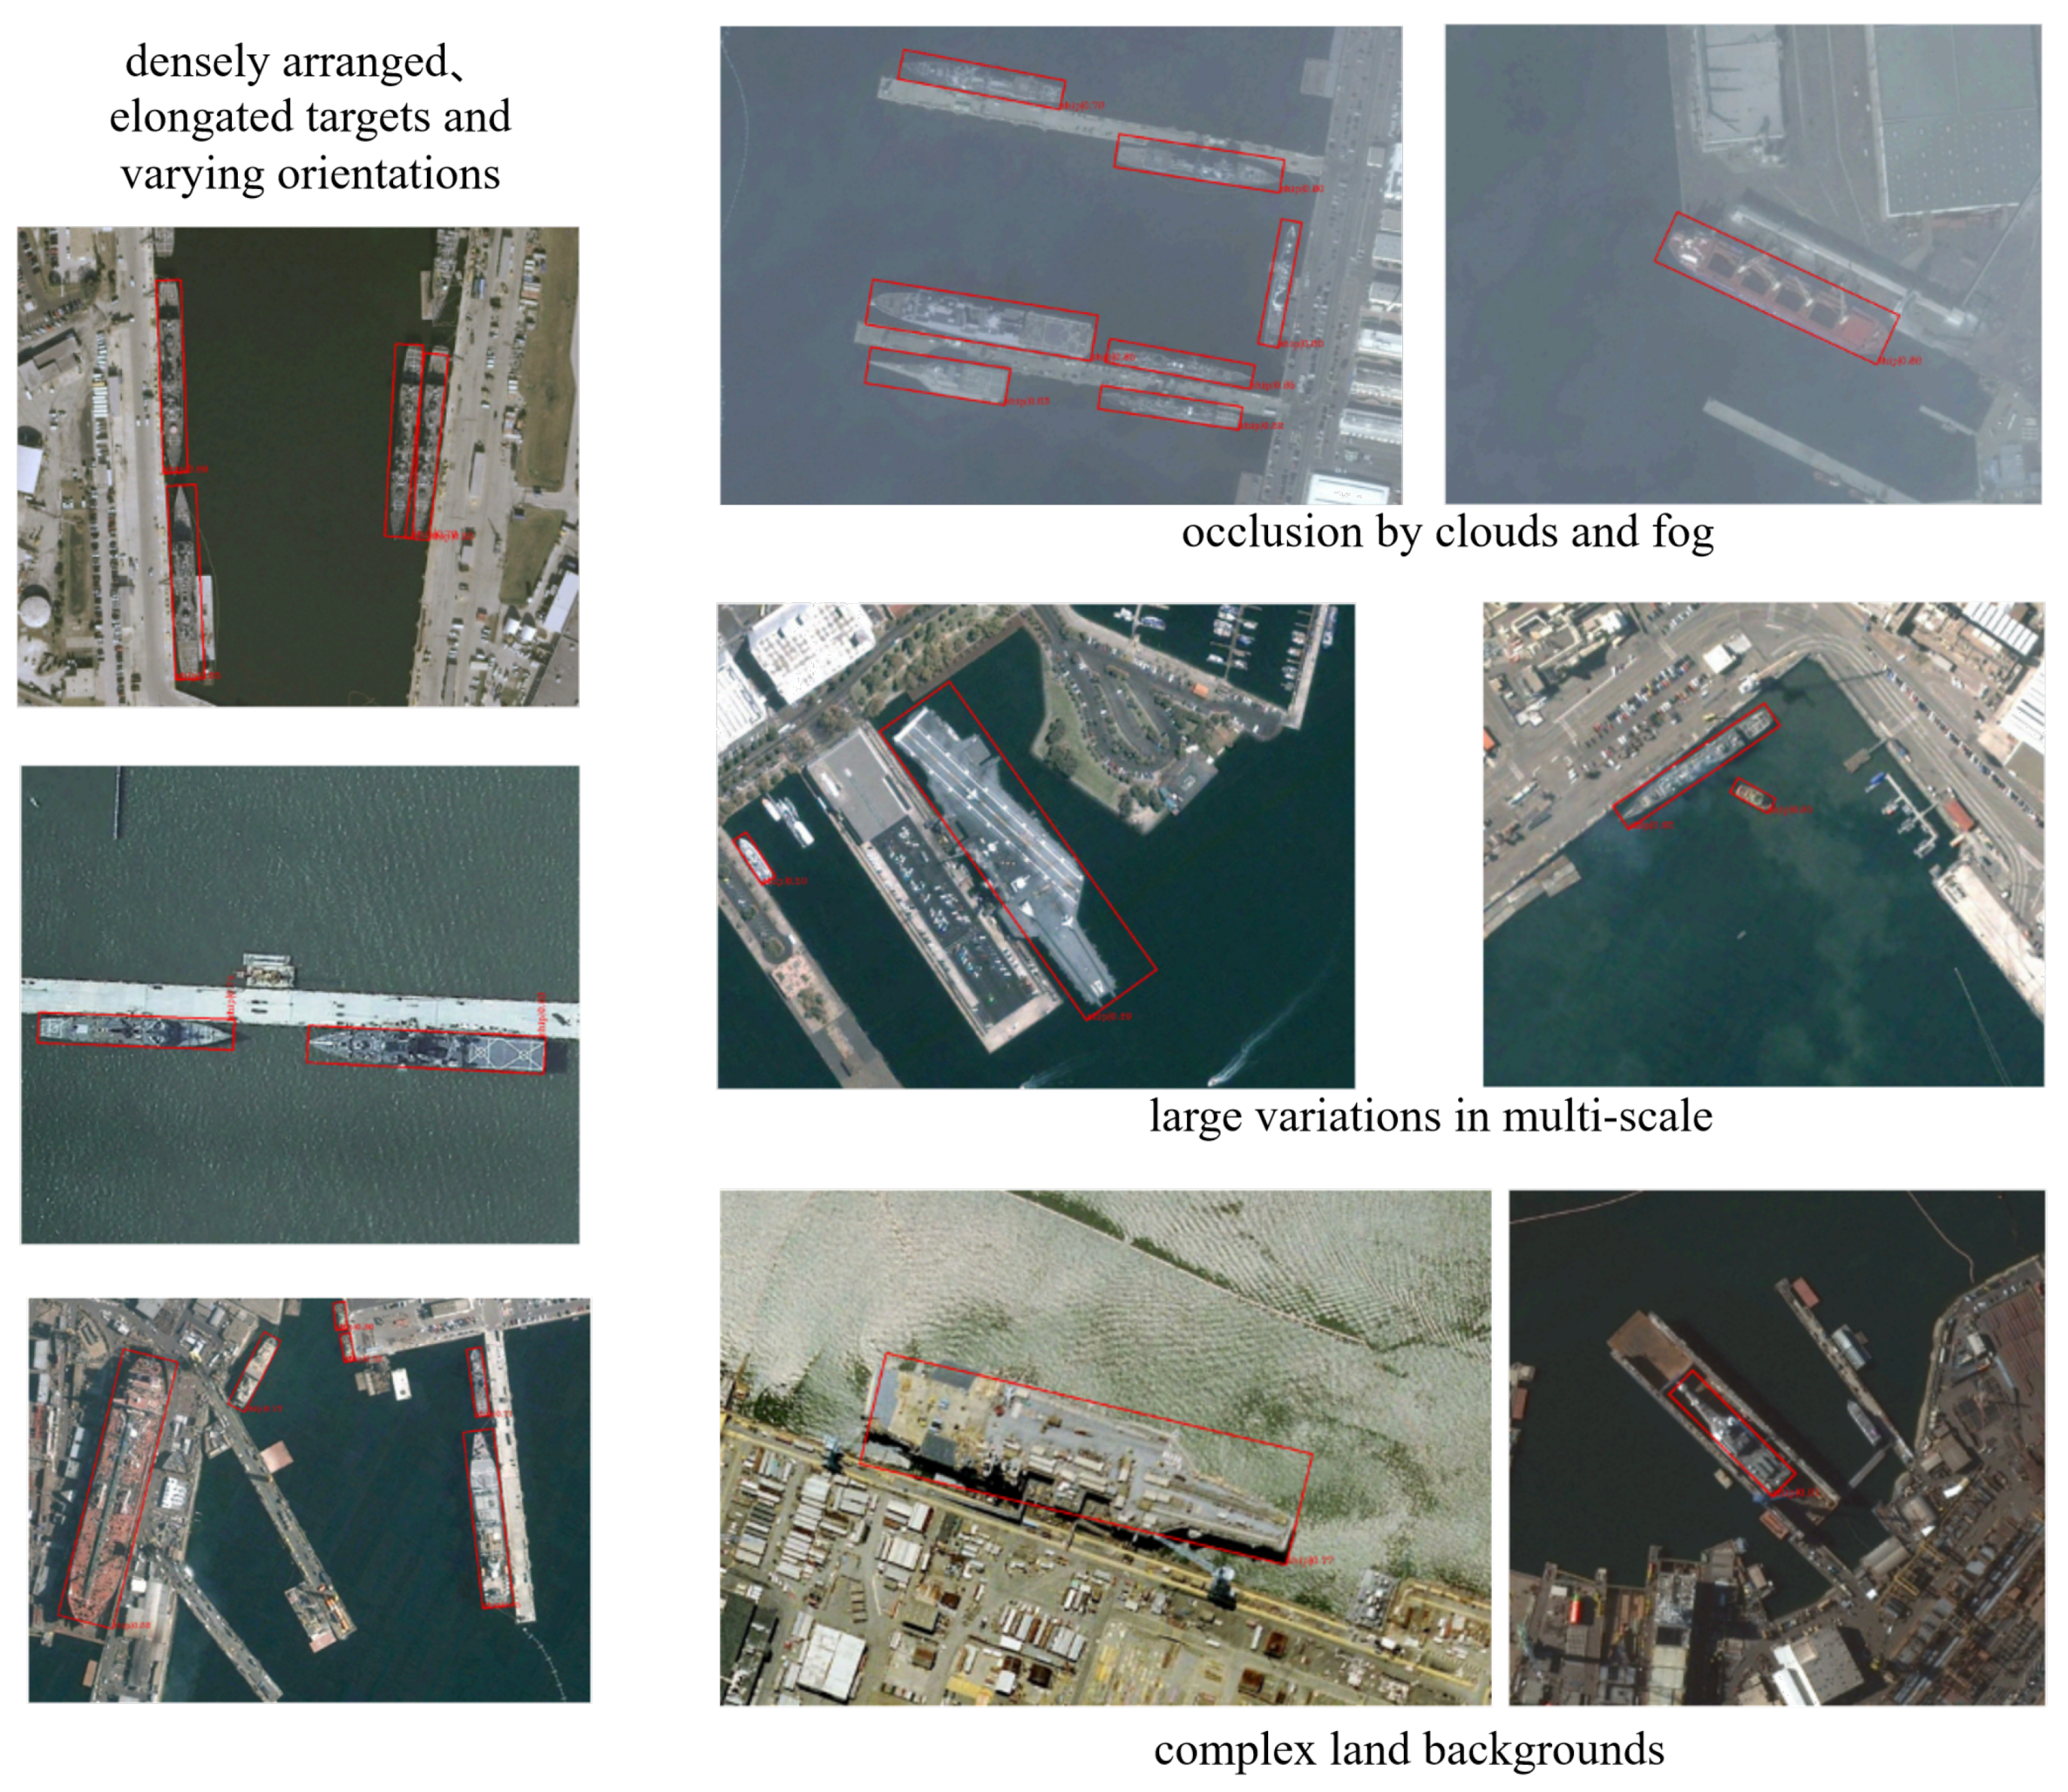
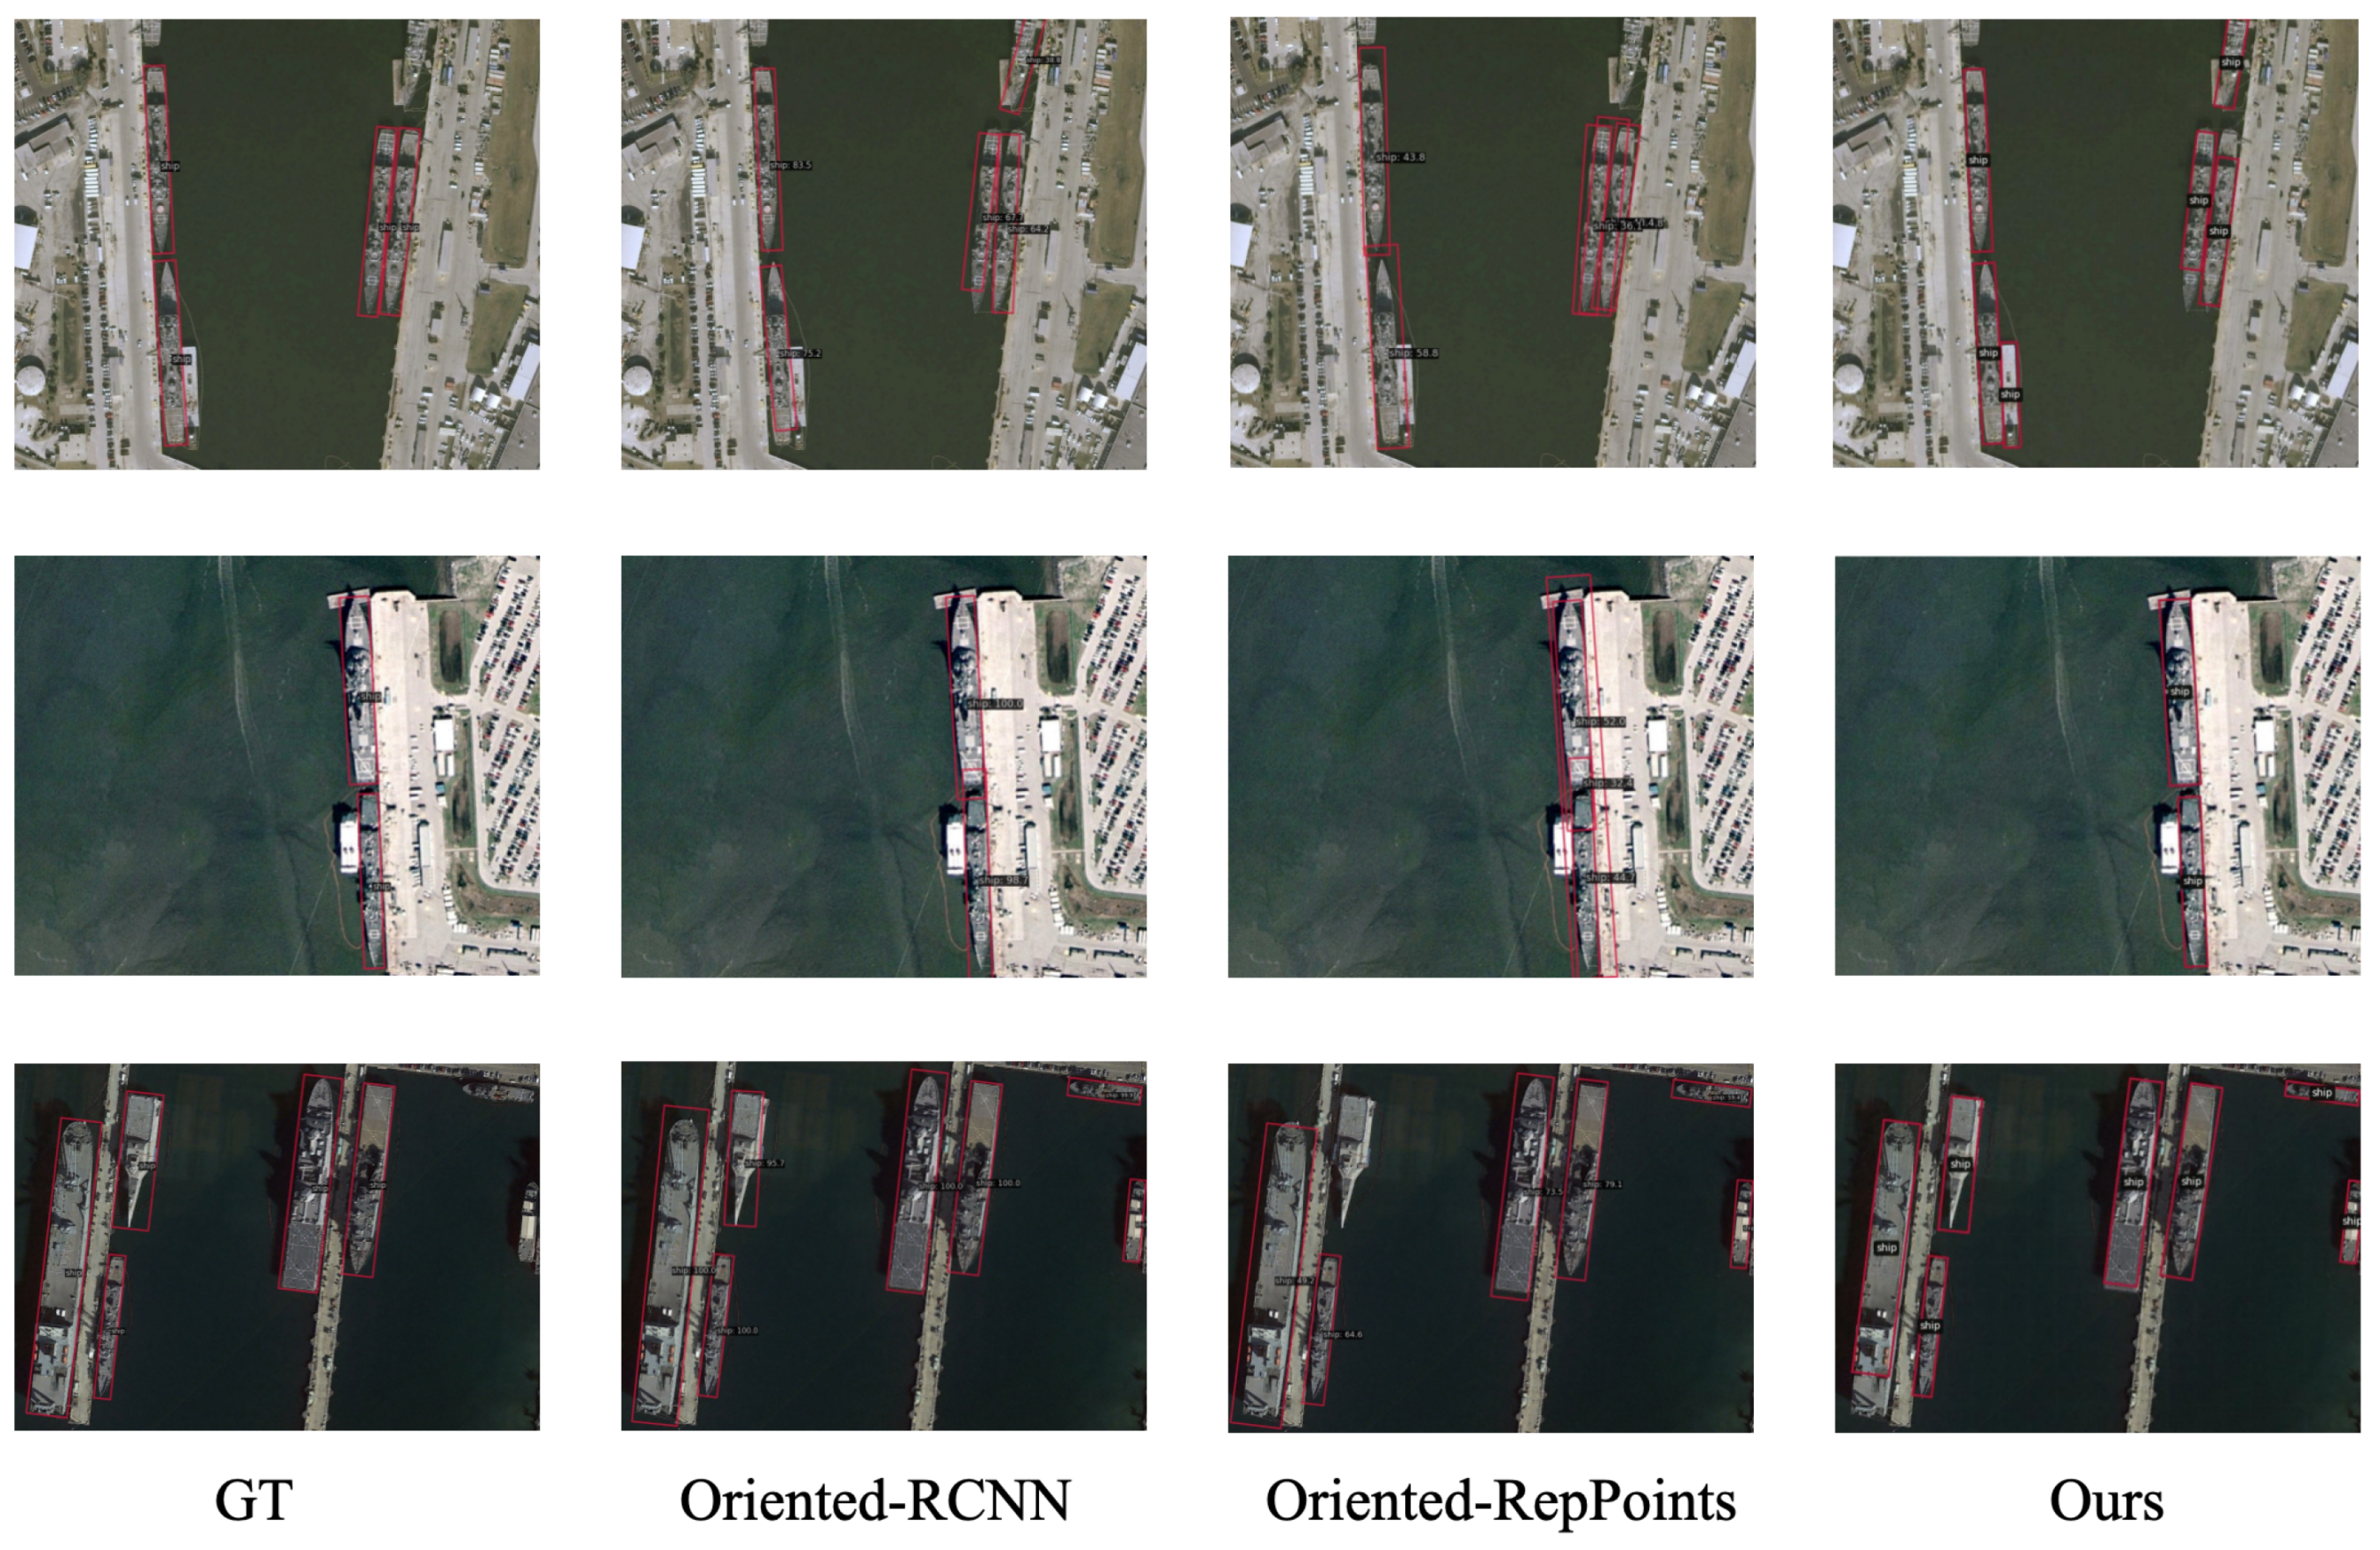
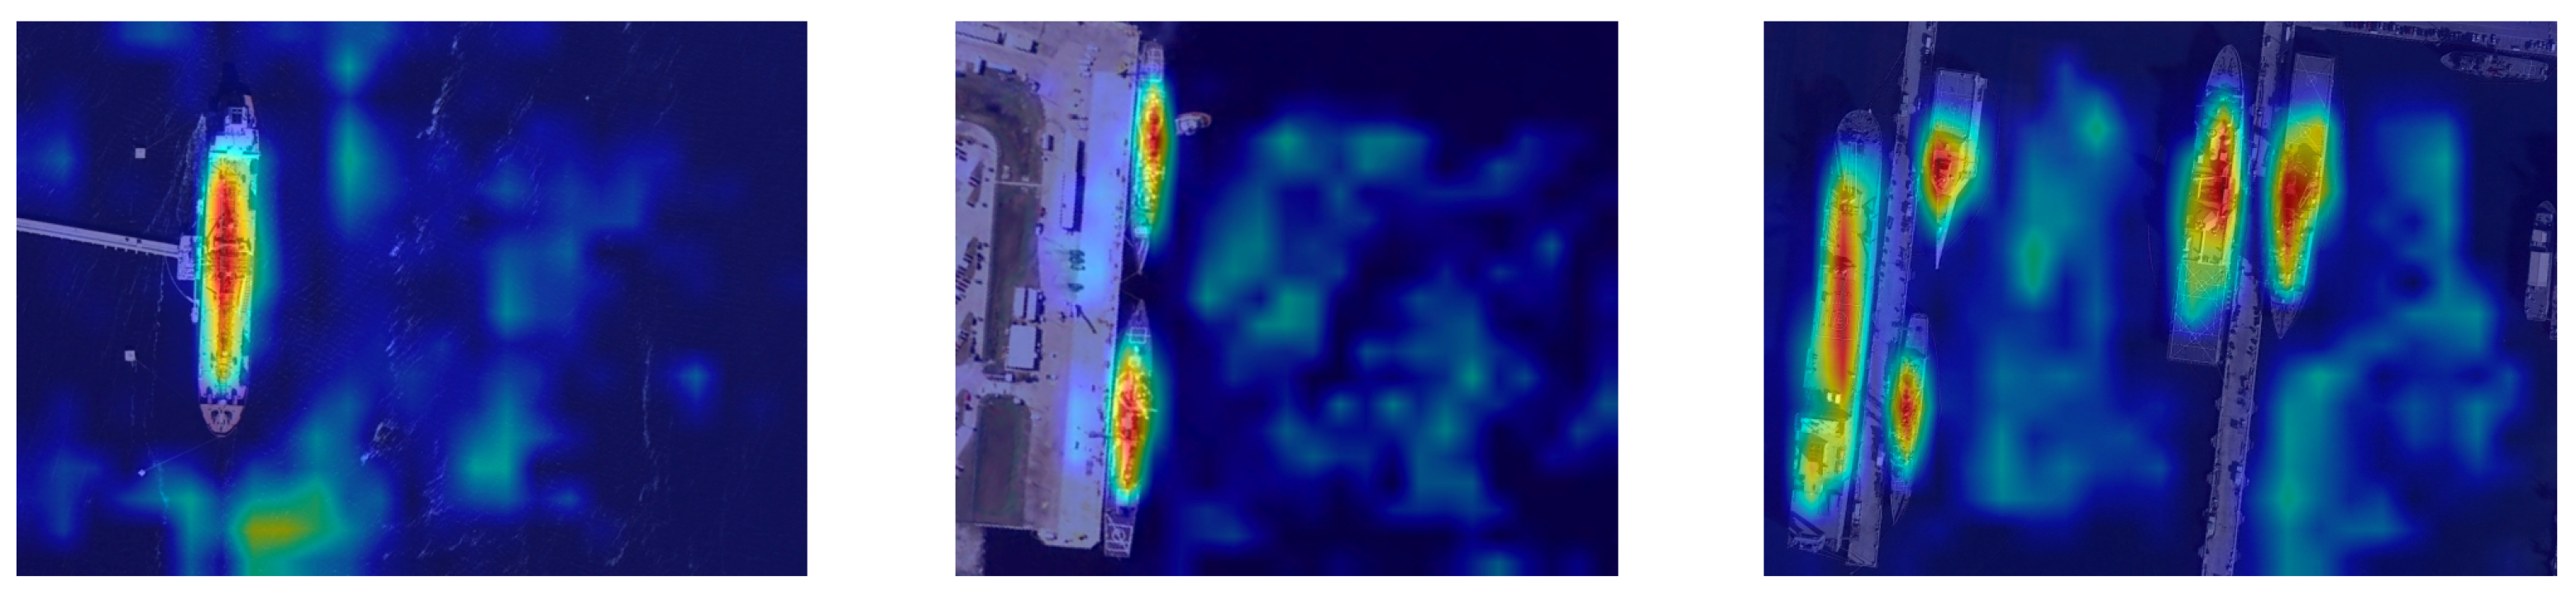
Figure 7 shows detection results on several test images with a confidence threshold of 0.3. Our method achieves accurate detection under challenging conditions such as densely arranged ships, occlusion by clouds or fog, varying aspect ratios, and complex backgrounds, demonstrating robustness and effectiveness. Figure 8 provides a qualitative comparison with existing methods, where our approach yields more precise localization and orientation estimation. Figure 9 visualizes the heatmap generated by DenseRRSD, with warmer colors indicating stronger network responses and highlighting key target regions, further confirming the accuracy and interpretability of the method.

4.4. Ablation Study

Our proposed method employs a set of dense RepPoints to guide ship localization. In this section, we first analyze the influence of RepPoint density on detection performance, and then investigate the effectiveness of different components and internal design choices in DenseRRSD.
We examine the impact of different RepPoint densities on detection performance, as shown in Table 3. Using a higher number of RepPoints generally leads to improved detection accuracy. However, as the RepPoint number increases, the performance gains gradually saturate. Specifically, when the number of RepPoints increases from 81 to 225, the mAP improves from 90.3% to 91.2%. This indicates that while dense RepPoints are beneficial for accurately modeling ship structures, excessively increasing the number of RepPoints yields diminishing returns while introducing additional computational cost.
To further validate the effectiveness of the proposed components, we conduct ablation experiments on WRFPN and WCL, as reported in Table 4.
In the baseline configuration, WRFPN is replaced by a standard FPN, the weighted consistency loss (WCL) is replaced by a Non-Weighted Chamfer Loss, and Smooth L1 Loss is adopted for bounding box regression. As shown in column B1, introducing the stage-wise localization strategy improves the mAP from 87.5% to 88.6%, indicating that progressive RepPoint refinement contributes to better localization accuracy. In B2, the standard FPN is replaced by the PAFPN module from PANet, resulting in an mAP of 90.3%, which highlights the importance of enhanced multi-scale feature fusion. Finally, incorporating both WRFPN and WCL in DenseRRSD yields the best performance, achieving an mAP of 91.2%.
Beyond module-level evaluation, we further conduct fine-grained ablation experiments to analyze key internal design choices within the proposed modules. The results are summarized in Table 5.
Specifically, we replace the proposed edge region sampling strategy with uniform sampling while keeping the RepPoints formulation unchanged. This modification leads to a noticeable performance drop, indicating that emphasizing edge regions is critical for accurately modeling elongated and oriented ship structures. In addition, removing the learnable fusion weights in WRFPN and adopting fixed equal weights for multi-scale feature fusion also degrades detection performance, demonstrating that adaptive weighting plays an important role in balancing semantic and spatial information across different feature scales.
Overall, these ablation results demonstrate that the performance gains of DenseRRSD stem not only from the overall module design but also from carefully designed internal components.

5. Discussion

In this work, we introduced a novel approach, DenseRRSD, for the challenging task of rotated-ship detection in remote sensing images. By representing ships with dense RepPoints rather than traditional rectangular or rotated bounding boxes, our method effectively captures fine-grained structural information and mitigates the issues posed by angular discontinuities. Through extensive experiments on the HRSC2016 dataset, DenseRRSD achieved an mAP of 91.2%, demonstrating its superior performance compared to existing state-of-the-art methods.
One of the key strengths of DenseRRSD is its ability to more precisely depict complex ship contours, including bow and hull regions, by uniformly sampling dense RepPoints in these crucial areas. This dense representation is especially relevant in settings where ships exhibit significant within-class variation, multiple orientations, and large aspect ratios. Moreover, by integrating the edge region sampling strategy, the network focuses on the critical boundaries of ships, thus reducing background interference and refining localization accuracy. The introduced Weighted Residual Feature Pyramid Network (WRFPN) further enhances detection robustness by fusing multi-scale features and mitigating information loss through residual connections and learnable weights. Additionally, the Weighted Chamfer Loss (WCL) encourages a coherent and uniform distribution of RepPoints along the target contour, enabling the model to retain structural details even in cluttered or occluded scenes.
Despite these advantages, several aspects merit further consideration. First, while increasing the density of RepPoints generally improves detection performance, it also elevates computation and memory usage, which may be challenging for real-time applications or for deployment on resource-constrained devices. Efficient RepPoint clustering or adaptive RepPoint allocation strategies could be explored to reduce computational overhead while maintaining high detection accuracy. Second, although our edge region sampling approach effectively captures crucial boundary information, it may be suboptimal when dealing with extremely small ships or targets with highly irregular outlines. Future research could incorporate adaptive or shape-aware sampling schemes to handle such scenarios more flexibly. Third, DenseRRSD currently detects only a single class (ships). In realistic maritime environments, there may be a need to detect and classify various ship categories or even other maritime objects. Extensions that integrate multi-class oriented detection modules or domain adaptation strategies would be valuable for broader real-world applications.
Finally, it is worth investigating how DenseRRSD generalizes to more diverse remote sensing datasets, including those with higher image resolutions, stronger background clutter (e.g., busy shorelines), or adverse weather conditions (e.g., heavy cloud or fog). Domain-specific data augmentation, semi-supervised learning, or active learning strategies could be incorporated to improve robustness under such challenging conditions. Notwithstanding these open questions, our experimental results underscore the effectiveness of the proposed DenseRRSD architecture. By leveraging dense representative points and advanced multi-scale feature fusion, our method demonstrates a promising new paradigm for rotated-object detection in remote sensing images.

6. Conclusions

In this paper, we propose a novel ship detection method that utilizes a set of dense RepPoints to guide the detector in accurately localizing ships. The RepPoints are processed through simple post-processing techniques to generate oriented bounding boxes encompassing all foreground RepPoints. Our method effectively avoids the challenges associated with directly predicting rotation angles or structured vertices for multi-sided polygons. To enhance performance, we employ an edge-region sampling strategy, an enhanced residual feature-fusion module (WRFPN), a stage-wise localization loss strategy, and a Weighted Chamfer Loss (WCL). These improvements contribute to the robustness and accuracy of our approach.We conduct extensive experiments on two benchmark datasets. On HRSC2016, DenseRRSD achieves 91.2% mAP, while on the newly constructed DOTA-SHIP dataset, it reaches 83.2% mAP—both outperforming state-of-the-art methods. These results validate the generalization ability and effectiveness of DenseRRSD for rotated-ship detection in various complex scenarios.

Author Contributions

Conceptualization, N.Z., J.S. and H.Z.; methodology, N.Z., T.Z. and J.S.; software, N.Z., Y.X. and T.Z.; validation, N.Z., Y.X., T.Z. and J.S.; formal analysis, N.Z., Y.X. and T.Z.; investigation, N.Z., Y.X., T.Z. and J.S.; resources, Z.J. and H.Z.; data curation, Y.X. and T.Z.; writing—original draft preparation, N.Z., Y.X. and T.Z.; writing—review and editing, Z.J. and H.Z.; visualization, N.Z., Y.X. and T.Z.; supervision, Z.J. and H.Z.; project administration, Z.J. and H.Z.; funding acquisition, H.Z. All authors have read and agreed to the published version of the manuscript.

Funding

This research was funded in part by the National Natural Science Foundation of China (Grant No. 62271018).

Data Availability Statement

No new data were created or analyzed in this study. Data sharing is not applicable to this article.

Conflicts of Interest

The authors declare no conflicts of interest.

References

  1. Xie, X.; Cheng, G.; Rao, C. Oriented object detection via contextual dependence mining and penalty-incentive allocation. IEEE Trans. Geosci. Remote Sens. 2024, 62, 5618010. [Google Scholar] [CrossRef]
  2. Ren, S.; He, K.; Girshick, R. Faster R-CNN: Towards real-time object detection with region proposal networks. IEEE Trans. Pattern Anal. Mach. Intell. 2017, 39, 1137–1149. [Google Scholar] [CrossRef]
  3. He, K.; Gkioxari, G.; Dollár, P. Mask R-CNN. In Proceedings of the IEEE International Conference on Computer Vision, Venice, Italy, 22–29 October 2017; pp. 2961–2969. [Google Scholar]
  4. Redmon, J.; Divvala, S.; Girshick, R. You only look once: Unified, real-time object detection. In Proceedings of the IEEE Conference on Computer Vision and Pattern Recognition, Las Vegas, NV, USA, 27–30 June 2016; pp. 779–788. [Google Scholar]
  5. Bi, F.; Hou, J.; Chen, L. Ship detection for optical remote sensing images based on visual attention enhanced network. Sensors 2019, 19, 2271. [Google Scholar] [CrossRef]
  6. Sun, Z.; Leng, X.; Zhang, X. Arbitrary-direction SAR ship detection method for multi-scale imbalance. IEEE Trans. Geosci. Remote Sens. 2025, 63, 5208921. [Google Scholar]
  7. Xue, W.; Ai, J.; Zhu, Y.; Chen, J.; Zhuang, S. AIS-FCANet: Long-Term AIS Data Assisted Frequency-Spatial Contextual Awareness Network for Salient Ship Detection in SAR Imagery. IEEE Trans. Aerosp. Electron. Syst. 2025, 61, 15166–15171. [Google Scholar] [CrossRef]
  8. Ai, J.; Tian, R.; Luo, Q.; Jin, J.; Tang, B. Multi-Scale Rotation-Invariant Haar-Like Feature Integrated CNN-Based Ship Detection Algorithm of Multiple-Target Environment in SAR Imagery. IEEE Trans. Geosci. Remote Sens. 2019, 57, 10070–10087. [Google Scholar] [CrossRef]
  9. Ai, J.; Mao, Y.; Luo, Q.; Jia, L.; Xing, M. SAR Target Classification Using the Multikernel-Size Feature Fusion-Based Convolutional Neural Network. IEEE Trans. Geosci. Remote Sens. 2022, 60, 5214313. [Google Scholar] [CrossRef]
  10. Lin, T.-Y.; Maire, M.; Belongie, S. Microsoft COCO: Common objects in context. In Proceedings of the European Conference on Computer Vision, Zurich, Switzerland, 6–12 September 2014; pp. 740–755. [Google Scholar]
  11. Vicente, S.; Carreira, J.; Agapito, L. Reconstructing PASCAL VOC. In Proceedings of the IEEE Conference on Computer Vision and Pattern Recognition, Columbus, OH, USA, 23–28 June 2014; pp. 41–48. [Google Scholar]
  12. Zhang, Z.; Guo, W.; Zhu, S. Toward arbitrary-oriented ship detection with rotated region proposal and discrimination networks. IEEE Geosci. Remote Sens. Lett. 2018, 15, 1745–1749. [Google Scholar] [CrossRef]
  13. Xu, Y.; Fu, M.; Wang, Q. Gliding vertex on the horizontal bounding box for multi-oriented object detection. IEEE Trans. Pattern Anal. Mach. Intell. 2021, 43, 1452–1459. [Google Scholar] [CrossRef] [PubMed]
  14. Qian, W.; Yang, X.; Peng, S. Learning modulated loss for rotated object detection. In Proceedings of the AAAI Conference on Artificial Intelligence, Virtual, 2–9 February 2021; Volume 35, pp. 2458–2466. [Google Scholar]
  15. Yang, X.; Yan, J. Arbitrary-oriented object detection with circular smooth label. In Proceedings of the European Conference on Computer Vision, Glasgow, UK, 23–28 August 2020; pp. 677–694. [Google Scholar]
  16. Yang, Z.; Liu, S.; Hu, H. RepPoints: Point set representation for object detection. In Proceedings of the IEEE/CVF International Conference on Computer Vision, Seoul, Republic of Korea, 27 October–2 November 2019; pp. 9657–9666. [Google Scholar]
  17. Xie, X.; Cheng, G.; Wang, J. Oriented R-CNN for object detection. In Proceedings of the IEEE/CVF International Conference on Computer Vision, Montreal, QC, Canada, 11–17 October 2021; pp. 3520–3529. [Google Scholar]
  18. Li, W.; Chen, Y.; Hu, K. Oriented RepPoints for aerial object detection. In Proceedings of the IEEE/CVF Conference on Computer Vision and Pattern Recognition, New Orleans, LA, USA, 19–24 June 2022; pp. 1829–1838. [Google Scholar]
  19. Zhang, C.; Zhang, X.; Gao, G.; Lang, H.; Liu, G.; Cao, C.; Song, Y.; Guan, Y.; Dai, Y. Development and application of ship detection and classification datasets: A review. IEEE Geosci. Remote Sens. Mag. 2024, 12, 12–45. [Google Scholar] [CrossRef]
  20. Zhang, H.; Wen, S.; Wei, Z. High-resolution feature generator for small-ship detection in optical remote sensing images. IEEE Trans. Geosci. Remote Sens. 2024, 62, 5617011. [Google Scholar] [CrossRef]
  21. Qi, S.; Ma, J.; Lin, J. Unsupervised ship detection based on saliency and S-HOG descriptor from optical satellite images. IEEE Geosci. Remote Sens. Lett. 2015, 12, 1451–1455. [Google Scholar]
  22. Zhao, T.; Wang, Y.; Li, Z. Ship detection with deep learning in optical remote-sensing images: A survey of challenges and advances. Remote Sens. 2024, 16, 1145. [Google Scholar] [CrossRef]
  23. Jubelin, G.; Khenchaf, A. Multiscale algorithm for ship detection in mid, high and very high resolution optical imagery. In Proceedings of the IEEE Geoscience and Remote Sensing Symposium, Quebec City, QC, Canada, 13–18 July 2014; pp. 2289–2292. [Google Scholar]
  24. Zhu, C.; Zhou, H.; Wang, R. A novel hierarchical method of ship detection from spaceborne optical image based on shape and texture features. IEEE Trans. Geosci. Remote Sens. 2010, 48, 3446–3456. [Google Scholar] [CrossRef]
  25. Chen, F.; Yu, W.; Liu, X. Graph-based ship extraction scheme for optical satellite image. In Proceedings of the IEEE International Geoscience and Remote Sensing Symposium, Vancouver, BC, Canada, 24–29 July 2011; pp. 491–494. [Google Scholar]
  26. Ren, Z.; Tang, Y.; Yang, Y. SASOD: Saliency-aware ship object detection in high-resolution optical images. IEEE Trans. Geosci. Remote Sens. 2024, 62, 5611115. [Google Scholar] [CrossRef]
  27. Tang, J.; Deng, C.; Huang, G. Compressed-domain ship detection on spaceborne optical image using deep neural network and extreme learning machine. IEEE Trans. Geosci. Remote Sens. 2015, 53, 1174–1185. [Google Scholar] [CrossRef]
  28. Li, L.; Shi, Y.; Lv, M. Infrared and visible image fusion via sparse representation and guided filtering in Laplacian pyramid domain. Remote Sens. 2024, 16, 3804. [Google Scholar] [CrossRef]
  29. Liu, Z.; Wang, H.; Weng, L. Ship rotated bounding box space for ship extraction from high-resolution optical satellite images with complex backgrounds. IEEE Geosci. Remote Sens. Lett. 2016, 13, 1074–1078. [Google Scholar] [CrossRef]
  30. Liu, Z.; Hu, J.; Weng, L. Rotated region based CNN for ship detection. In Proceedings of the IEEE International Conference on Image Processing, Beijing, China, 17–20 September 2017; pp. 900–904. [Google Scholar]
  31. Zou, Z.; Shi, Z. Ship detection in spaceborne optical image with SVD networks. IEEE Trans. Geosci. Remote Sens. 2016, 54, 5832–5845. [Google Scholar] [CrossRef]
  32. Li, Q.; Mou, L.; Liu, Q. HSF-Net: Multiscale deep feature embedding for ship detection in optical remote sensing imagery. IEEE Trans. Geosci. Remote Sens. 2018, 56, 7147–7161. [Google Scholar] [CrossRef]
  33. Lin, H.; Shi, Z.; Zou, Z. Fully convolutional network with task partitioning for inshore ship detection in optical remote sensing images. IEEE Geosci. Remote Sens. Lett. 2017, 14, 1665–1669. [Google Scholar] [CrossRef]
  34. Feng, Y.; Diao, W.; Sun, X. Towards automated ship detection and category recognition from high-resolution aerial images. Remote Sens. 2019, 11, 1901. [Google Scholar] [CrossRef]
  35. Chen, L.; Yin, Y.; Shi, H.; He, J.; Li, W. Self-Supervised Despeckling Based Solely on SAR Intensity Images: A General Strategy. ISPRS J. Photogramm. Remote Sens. 2026, 231, 854–873. [Google Scholar] [CrossRef]
  36. He, J.; Chen, L.; Shi, H.; Chen, Y.; Yang, J.; Li, W. DOGAN: DINO-Based Optical-Prior-Driven GAN for SAR-to-Optical Image Translation. IEEE Trans. Geosci. Remote Sens. 2025, 63, 5220116. [Google Scholar] [CrossRef]
  37. Chen, L.; Li, J.; Zhong, H.; Shi, H.; Yang, Z.; Li, W. PGMNet: A Prototype-Guided Multimodal Network for Ship Recognition in SAR Images. IEEE Trans. Geosci. Remote Sens. 2025, 63, 5215517. [Google Scholar] [CrossRef]
  38. Yin, Y.; Yang, Z.; Shi, H.; Meng, F.; Li, W. Ship Detection Transformer in SAR Images Based on Key Scattering Points Feature Aggregation and Context Feature Refinement. IEEE J. Sel. Top. Appl. Earth Obs. Remote Sens. 2025, 18, 17820–17836. [Google Scholar] [CrossRef]
  39. Yang, Z.; Kong, J.; Zheng, B. Object detection in remote sensing images with balanced rotational and horizontal bounding boxes. IEEE Geosci. Remote Sens. Lett. 2022, 19, 6516905. [Google Scholar] [CrossRef]
  40. Nie, G.; Huang, H. Multi-oriented object detection in aerial images with double horizontal rectangles. IEEE Trans. Pattern Anal. Mach. Intell. 2023, 45, 4932–4944. [Google Scholar] [CrossRef] [PubMed]
  41. Wang, K.; Wang, Z.; Li, Z. Oriented object detection in optical remote sensing images using deep learning: A survey. Artif. Intell. Rev. 2025, 58, 350. [Google Scholar] [CrossRef]
  42. Yi, J.; Wu, P.; Liu, B. Oriented object detection in aerial images with box boundary-aware vectors. In Proceedings of the IEEE/CVF Winter Conference on Applications of Computer Vision, Waikoloa, HI, USA, 3–8 January 2021; pp. 2150–2159. [Google Scholar]
  43. Zhang, C.; Su, J.; Ju, Y. Efficient inductive vision transformer for oriented object detection in remote sensing imagery. IEEE Trans. Geosci. Remote Sens. 2023, 61, 5616320. [Google Scholar] [CrossRef]
  44. Hua, W.; Liang, D.; Li, J. SOOD: Towards semi-supervised oriented object detection. In Proceedings of the IEEE/CVF Conference on Computer Vision and Pattern Recognition, Vancouver, BC, Canada, 18–22 June 2023; pp. 15558–15567. [Google Scholar]
  45. Zhao, W.; Kang, Y.; Chen, H. Adaptively attentional feature fusion oriented to multiscale object detection in remote sensing images. IEEE Trans. Instrum. Meas. 2023, 72, 5008111. [Google Scholar] [CrossRef]
  46. Jiang, X.; Wu, Y. Remote sensing object detection based on convolution and Swin transformer. IEEE Access 2023, 11, 38643–38656. [Google Scholar] [CrossRef]
  47. Zhang, C.; Lam, K.-M.; Wang, Q. COF-Net: A progressive coarse-to-fine framework for object detection in remote-sensing imagery. IEEE Trans. Geosci. Remote Sens. 2023, 61, 5600617. [Google Scholar] [CrossRef]
  48. Zhang, Y.; Guo, W.; Wu, C. FANet: An arbitrary direction remote sensing object detection network based on feature fusion and angle classification. IEEE Trans. Geosci. Remote Sens. 2023, 61, 5608811. [Google Scholar] [CrossRef]
  49. Pang, J.; Li, C.; Shi, J. R2CNN: Fast tiny object detection in large-scale remote sensing images. IEEE Trans. Geosci. Remote Sens. 2019, 57, 5512–5524. [Google Scholar] [CrossRef]
  50. Ding, J.; Xue, N.; Long, Y. Learning RoI transformer for oriented object detection in aerial images. In Proceedings of the IEEE/CVF Conference on Computer Vision and Pattern Recognition, Long Beach, CA, USA, 15–20 June 2019; pp. 2849–2858. [Google Scholar]
  51. Yang, X.; Yan, J.; Feng, Z. R3Det: Refined single-stage detector with feature refinement for rotating object. In Proceedings of the AAAI Conference on Artificial Intelligence, Virtual, 2–9 February 2021; Volume 35, pp. 3163–3171. [Google Scholar]
  52. Yang, X.; Yang, J.; Yan, J. SCRDet: Towards more robust detection for small, cluttered and rotated objects. In Proceedings of the IEEE/CVF International Conference on Computer Vision, Seoul, Republic of Korea, 27 October–2 November 2019; pp. 8232–8241. [Google Scholar]
  53. Yang, Z.; Xu, Y.; Xue, H. Dense RepPoints: Representing visual objects with dense point sets. In Proceedings of the European Conference on Computer Vision, Glasgow, UK, 23–28 August 2020; pp. 227–244. [Google Scholar]
  54. Lin, T.-Y.; Dollár, P.; Girshick, R. Feature pyramid networks for object detection. In Proceedings of the IEEE Conference on Computer Vision and Pattern Recognition, Honolulu, HI, USA, 21–26 July 2017; pp. 2117–2125. [Google Scholar]
  55. Liu, S.; Qi, L.; Qin, H. Path aggregation network for instance segmentation. In Proceedings of the IEEE Conference on Computer Vision and Pattern Recognition, Salt Lake City, UT, USA, 18–23 June 2018; pp. 8759–8768. [Google Scholar]
  56. Liu, Z.; Yuan, L.; Weng, L. A high resolution optical satellite image dataset for ship recognition and some new baselines. In Proceedings of the International Conference on Pattern Recognition Applications and Methods, Porto, Portugal, 24–26 February 2017; Volume 2, pp. 324–331. [Google Scholar]
  57. Xia, G.-S.; Bai, X.; Ding, J. DOTA: A large-scale dataset for object detection in aerial images. In Proceedings of the IEEE Conference on Computer Vision and Pattern Recognition, Salt Lake City, UT, USA, 18–23 June 2018; pp. 3974–3983. [Google Scholar]
  58. Ma, J.; Shao, W.; Ye, H. Arbitrary-oriented scene text detection via rotation proposals. IEEE Trans. Multimed. 2018, 20, 3111–3122. [Google Scholar] [CrossRef]
  59. Yang, Z.; Liu, Y.; Gao, Z. Attention enhancement with parallel groups for remote sensing object detection. In Proceedings of the IEEE International Conference on Image Processing, Abu Dhabi, United Arab Emirates, 27–30 October 2024; pp. 1032–1036. [Google Scholar]
  60. Li, Y.; Gong, T.; Chu, Q.; Liu, B.; Yu, N. Remote Sensing Target Detector with Multi-Scale Attention Mechanism. In Proceedings of the IEEE International Conference on Image Processing, Anchorage, AK, USA, 14–17 September 2025; pp. 1450–1455. [Google Scholar]
  61. Jocher, G.; Qiu, J. Ultralytics YOLO11 [Computer Software]. 2024. Available online: https://github.com/ultralytics/ultralytics (accessed on 9 October 2024).
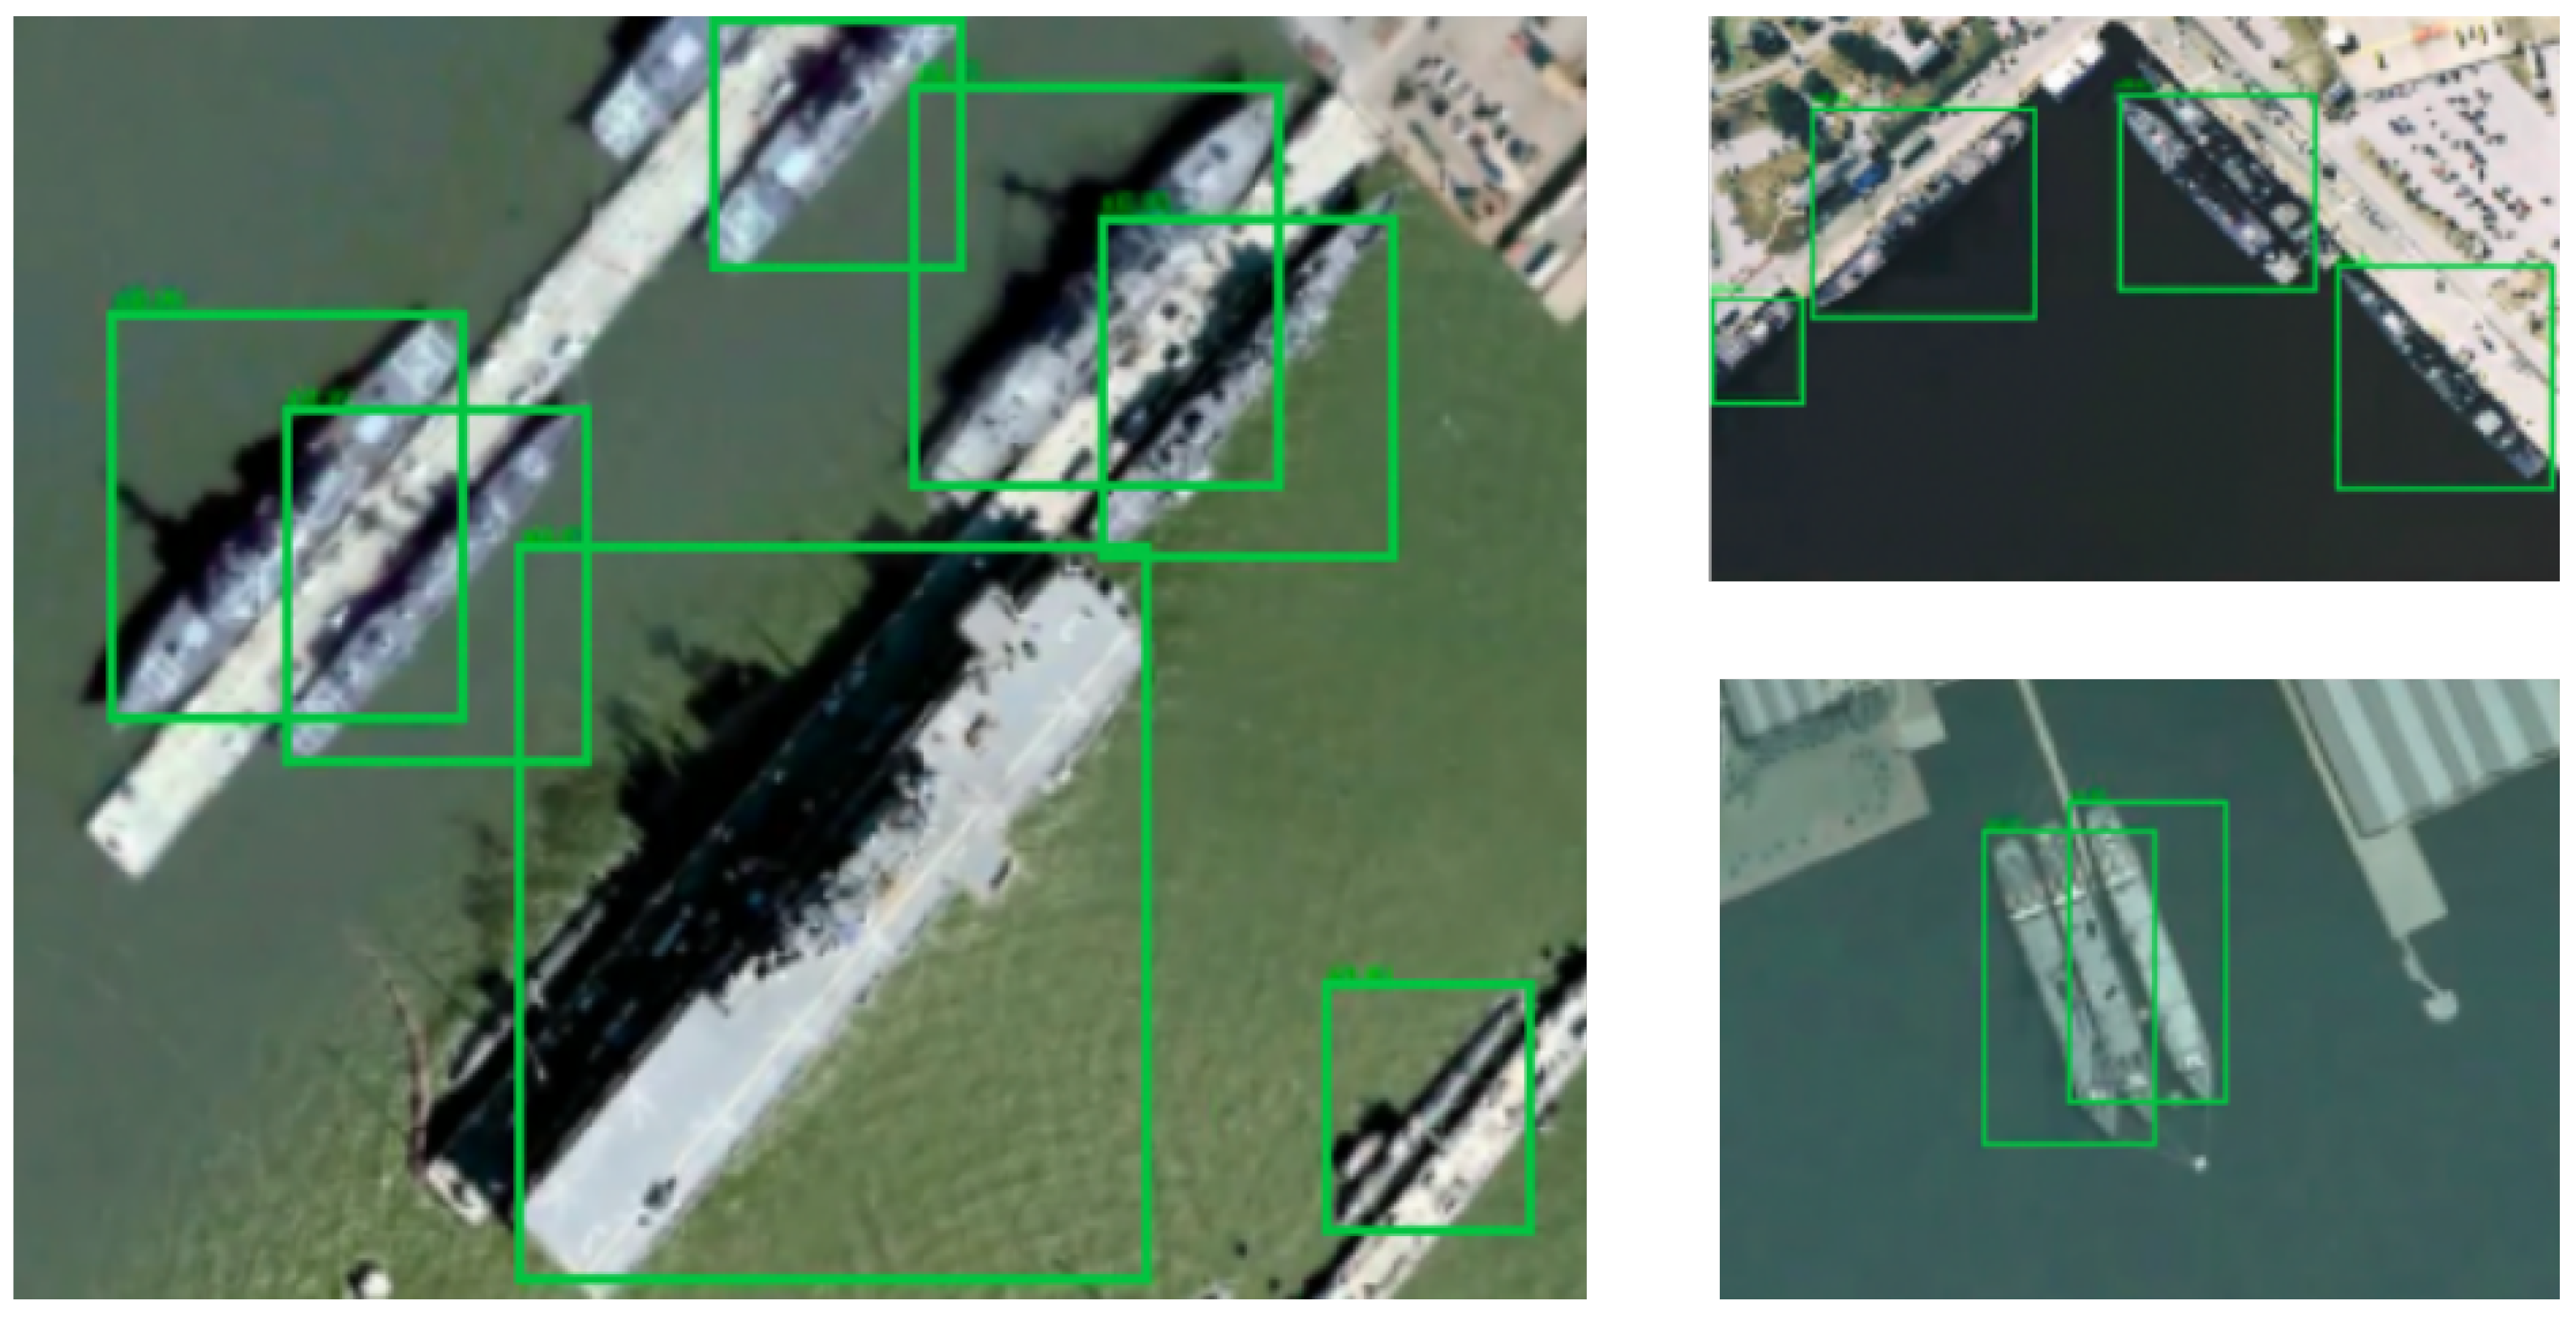
Figure 1. Disadvantages of horizontal bounding box detection.
Remotesensing 18 00458 g001
Figure 2. The overall architecture of the proposed method.
Remotesensing 18 00458 g002
Figure 3. Illustration of the proposed edge-aware sampling process. (a) Original target image detection with horizontal (red) and rotated (green) detection boxes. (b) Intersection region of the two boxes highlighted in white within the horizontal detection range. (c) Ship superstructure region extracted by the proposed method. (d) Final sampled region after edge region sampling, where the region is adaptively expanded according to the target orientation to achieve denser sampling while preserving surrounding contextual information.
Remotesensing 18 00458 g003
Figure 4. Comparison of feature fusion structures: (a) FPN, (b) PANet, and (c) the proposed weighted residual feature pyramid network (WRFPN).
Remotesensing 18 00458 g004
Figure 5. Architecture of the DenseRRSD detection head. The network consists of three branches: the dense RepPoint localization branch, the dense RepPoint classification branch, and the detection classification branch.
Remotesensing 18 00458 g005
Figure 6. Rotated IoU calculation example.
Remotesensing 18 00458 g006
Figure 7. Detection results of DenseRRSD under different conditions.
Remotesensing 18 00458 g007
Figure 8. Qualitativecomparison of OBB detection results on remote sensing images. Our method achieves more accurate localization and orientation estimation of ships compared with existing methods.
Remotesensing 18 00458 g008
Figure 9. Visualization of the heatmap generated by our method. Warmer colors indicate higher response intensity, highlighting regions with higher confidence or importance for ship detection.
Remotesensing 18 00458 g009
Table 1. Comparison of different methods on the HRSC2016 dataset. Precision, Recall, and F1-score are reported only for recent methods, since many earlier approaches did not provide these metrics or adopt consistent evaluation settings. For methods whose source code is not publicly available (e.g., AEPG and MAMNet), the corresponding results are directly cited from the original papers.
MethodBackbonePrecisionRecallF1-ScoremAP
R2CNN [49]ResNet-101---73.1
RR-CNN [30]VGG-16---75.7
RRPN [58]ResNet-101---79.1
R2PN [12]VGG-16---79.6
RoI–Transformer [50]ResNet-101---86.2
Gliding-Vertex [13]ResNet-101---88.2
Retina-RResNet-10175.389.181.689.2
R3Det [51]ResNet-15270.292.179.789.3
CSL [15]ResNet-5072.891.281.089.6
AEPG [59]ResNet-101---90.6
MAMNet [60]ResNet-50---90.6
YOLO11s [61]-87.391.489.390.1
Oriented-RCNN [17]ResNet-10174.692.382.590.5
Oriented-Reppoints [18]ResNet-5075.391.882.790.4
DenseRRSD (Ours)ResNet-5080.493.786.591.2
Table 2. Comparison of different methods on the DOTA-SHIP dataset. Precision, Recall, and F1-score are reported only for recent methods, since many earlier approaches did not provide these metrics or adopt consistent evaluation settings. For methods whose source code is not publicly available (e.g., AEPG and MAMNet), the corresponding results are directly cited from the original papers.
MethodBackbonePrecisionRecallF1-ScoremAP
R2CNN [49]ResNet-101---54.8
RRPN [58]ResNet-101---56.4
RoI–Transformer [50]ResNet-101---79.3
Retina-RResNet-10167.480.273.275.6
R3Det [51]ResNet-15260.877.668.261.7
CSL [15]ResNet-5070.479.374.672.1
YOLO11s [61]-80.387.283.682.6
Oriented-RCNN [17]ResNet-10174.780.677.579.8
Oriented-Reppoints [18]ResNet-5075.482.678.881.4
DenseRRSD (Ours)ResNet-5078.189.583.483.2
Table 3. Impact of RepPoint density on performance.
RepPoints92581225
mAP (%)35.587.590.391.2
Table 4. Ablation study results for DenseRRSD. The checkmarks ✓ indicate which components are included in each variant of the model.
BaselineB1B2DenseRRSD
PAFPN
WRFPN
WCL
mAP (%)87.588.690.391.2
Table 5. Internal ablation study of key design choices in DenseRRSD.
MethodEdge Region SamplingLearnable Fusion WeightsmAP (%)
DenseRRSD (Full)91.2
w/o Edge Sampling 89.7
w/o Learnable Weights 90.1
Disclaimer/Publisher’s Note: The statements, opinions and data contained in all publications are solely those of the individual author(s) and contributor(s) and not of MDPI and/or the editor(s). MDPI and/or the editor(s) disclaim responsibility for any injury to people or property resulting from any ideas, methods, instructions or products referred to in the content.