Article

Spatiotemporal Characteristics and Attribution of Global Wildfire Burned

by
Anqi Sun
1,
Yan Xia
2,
Fei Xie
2,
Guocan Wu
1 and
Yuna Mao
1,*
1
State Key Laboratory of Earth Surface Processes and Disaster Risk Reduction, Faculty of Geographical Science, Beijing Normal University, Beijing 100875, China
2
Faculty of Geographical Science, School of Systems Science, Beijing Normal University, Beijing 100875, China
*
Author to whom correspondence should be addressed.
Remote Sens. 2026, 18(2), 262; https://doi.org/10.3390/rs18020262
Submission received: 19 December 2025 / Revised: 12 January 2026 / Accepted: 13 January 2026 / Published: 14 January 2026
(This article belongs to the Section Atmospheric Remote Sensing)

Highlights

What are the main findings?
  • Global wildfires show distinct seasonal peaks (Jul–Sep and Dec–Jan) and significant regional variations across different fire-prone zones.
  • The global burned area increased significantly from 1982 to 2018, a trend not seen in northern and temperate regions.
  • Key fire drivers vary by region: climate and fuel in tropics; fuel availability in arid zones; surface dryness in boreal forests.
What are the implications of the main findings?
  • This study systematically elucidates the spatiotemporal patterns of the global wildfire burned area, providing critical evidence for understanding long-term wildfire dynamics and their governing mechanisms across different regions.
  • By identifying the dominant drivers of fire activity across regions, this study provides a scientific basis for developing differentiated fire risk prediction models and supporting ecosystem-based adaptive management.

Abstract

Wildfires profoundly impact carbon cycles, climate, and human societies. However, a comprehensive understanding of the long-term spatiotemporal characteristics and influencing factors of global wildfires remains limited. This study analyzes the spatiotemporal patterns and influencing factors of wildfires from 1982 to 2018 using a global satellite-derived burned area (BA) product. We classified fire-prone regions into four types based on climate: Tropical dry season (Tr-ds), Arid fuel-limited (Ar-fl), Boreal hot season (Bo-hs), and Temperate dry and hot season (Te-dhs). Major fire hotspots include Africa, northern Australia, South America’s Brazilian highlands, the Indochina Peninsula, and Central Asia. The global multi-year average BA is 4.59 × 10⁸ ha yr−1, with Africa (3.04 × 10⁸ ha yr−1) and northern Australia (2.83 × 10⁷ ha yr−1) being the most affected. Fire activity peaks annually in July–September and December–January. From 1982 to 2018, both the global and sub-regional BA show significant increasing trends, except northern and temperate areas, though reduced burn-down areas from shorter periods have been reported during the MODIS era. At both the global scale and in the Tr-ds region, wildfire activity is strongly associated with hot and dry conditions in combination with abundant fuel availability. Fire activity in the Ar-fl region is mainly constrained by fuel availability. Surface dryness plays a dominant role in fire activity in the Bo-hs. In contrast, fire activity in the Te-dhs region shows no clear pattern. The influence of different factors on the BA is subject to threshold effects. These findings contribute to a deeper understanding of long-term wildfire dynamics across different regions globally.

1. Introduction

Wildfires pose a significant threat to ecosystems, human health, and socio-economic activities. They profoundly influence the distribution and evolution of regional biota, disrupt the global carbon balance, alter energy fluxes, and exert substantial impacts on the water cycle [1]. In recent years, the frequency and intensity of wildfire activity have increased globally, driven by the impacts of climate change [2,3,4,5]. Extreme wildfire events are projected to become increasingly severe, posing escalating threats to ecosystems across diverse biomes and amplifying global risks [4,6,7]. Gaining a comprehensive understanding of global wildfire characteristics and their driving factors is essential for enhancing fire management strategies, safeguarding the ecological environment, and improving the ability to predict wildfire activity under future climate scenarios.
Globally, the majority of wildfires occur between July and September, with frequent activity observed between 15°E and 30°E, primarily concentrated in tropical and plateau regions [8,9]. Climate change has extended the duration of the wildfire seasons in most regions [10,11]. A considerable number of existing studies have predominantly focused on wildfire variations in specific regions, such as Africa [12], Australia [13,14], Canada [15], western Himalayas [16,17] and the western United States [18,19], or on extreme wildfire events in particular years, such as the 2020 California wildfires [20,21], or on global short-term analysis [22,23,24,25,26]. These studies mostly rely on local fire databases, such as the Alaska Fire Emissions Database (AKFED) and the Canadian National Fire Database (CNFDB), with global studies primarily utilizing satellite-based global fire products. Most global studies focus on burned area (BA) data post-1998, which indicate a reduction of approximately 25% in global BA over the past decade [6,11]. However, satellite datasets have limited temporal coverage, and data with relatively short periods of coverage (15–20 years) often struggle to robustly quantify the long-term trends in BA changes.
Several studies have examined changes in wildfire activity and their driving factors. For instance, in Central South America and the savannah regions of Africa, BA has decreased primarily due to land cover conversion to agricultural land [2,12]. In contrast, rapid warming and persistent drought have significantly increased BA in Australian forests [13,14]. A similar rising trend in BA has been observed across large parts of North America, including western Canada and Alaska, largely driven by climate warming and associated factors [15,27]. Conversely, in Sweden, the implementation of local wildfire management policies has contributed to consistent declines in forest fires since the late 19th century [28]. Simultaneously, numerous studies indicate that, at broader spatiotemporal scales, fire dynamics are predominantly driven by climate and vegetation, with climate-related factors serving as the primary controls of global fire activity [29,30,31,32]. Under future warmer and drier climatic conditions, the frequency, magnitude, and occurrence of extreme wildfires are projected to increase, accompanied by a prolonged fire season [2,33].
The impact of wildfires is expected to intensify in many regions globally in the future. However, the understanding of global wildfire activity remains insufficient, highlighting the urgent need for comprehensive investigations into its long-term trends and underlying driving factors. Therefore, this study utilizes long-term satellite-based gridded products to analyze the spatiotemporal dynamics of global BA from 1982 to 2018 and its driving factors. Compared with previous global studies that primarily focus on the post-2000 period, the extended temporal coverage enables a more robust assessment of long-term burned area trends and helps reconcile contrasting trend signals reported in shorter-term analyses. In addition, by integrating a consistent climate-based fire-regime classification, this study offers new insights into how fire-climate relationships vary across regions with different climatic controls.
The global BA is classified into four categories, with the climatology, interannual variability, and long-term trends examined for each category. Furthermore, the study evaluates the influence of multiple climate and environmental factors on wildfire activity, including climate variables (precipitation, air temperature (Ta), relative humidity (RH), solar radiation (Rs), evapotranspiration (ET), atmospheric vapor pressure deficit (VPD) and wind speed (WS)), surface soil moisture (SSM) and vegetation cover. This research will provide valuable scientific guidance for natural resource management, fire management, and wildfire prediction in the context of changing climatic conditions.

2. Materials and Methods

2.1. Data

2.1.1. Global Burned Area

We utilized the global burned area product LTDR Fire-cci BA v1.1 (FireCCILT11), developed by the European Space Agency (ESA) Fire Disturbance Climate Change Initiative (CCI) project, based on satellite observations [34]. The product provides monthly gridded global BA data from 1982 to 2018 at a spatial resolution of 0.25°. It is derived from the spectral information of NASA’s Advanced Very High-Resolution Radiometer (AVHRR) Land Long-Term Data Record (LTDR) dataset v5. However, it should be noted that the burned area for 1994 is excluded due to missing input data. FireCCILT11 incorporates enhanced cloud masking methods, expanded random forest modeling techniques, and updated training datasets, resulting in significant improvements over the previous beta version of the dataset, FireCCILT10 [35]. During the overlapping time series, the annual variation trends of FireCCILT11, as well as its monthly burned area estimates, show a high correlation with those of the existing Moderate Resolution Imaging Spectroradiometer (MODIS) BA products, MCD64A1 [23] and FireCCI51 [36]. Furthermore, temporal trend comparisons between FireCCILT11 and official fire perimeter records from regions such as Australia and Canada demonstrate good performance [34]. FireCCILT11 provides a consistent global BA dataset based on the AVHRR sensor, complementing existing BA products. More importantly, it extends the temporal coverage by almost 20 years relative to existing burned area datasets [37], which is beneficial for exploring the characteristics and quantifying the trends of global burned areas over a longer temporal scale.

2.1.2. Climate and Environmental Datasets

Our study comprehensively gathers a range of data that may influence wildfire dynamics. Ta, Rs, and WS data were obtained from the historical component of Multi-Source Weather (MSWX), referred to as MSWX-Past [38]. This dataset spans from 1979 onward and has a spatial resolution of 0.1°. It is based on bias-corrected European Centre for Medium-Range Weather Forecasts (ECMWF)’s fifth-generation atmospheric reanalysis (ERA5) data. Humidity was calculated using dew point temperature and Ta from ERA5. VPD was calculated from Ta and RH [39].
Precipitation was obtained from the Multi-Source Weighted Ensemble Precipitation (MSWEP v2.8) product [40]. SSM and ET data were derived from the Global Land Evaporation Amsterdam Model (GLEAM). We used GLEAM V3.6a version, with daily temporal resolution and 0.25° × 0.25° spatial resolution, covering the period from January 1980 to December 2021. Numerous studies have confirmed the high accuracy of GLEAM products, particularly in ET estimates [41,42,43,44,45]. Vegetation cover is represented by the NDVI, using the Global Inventory Modeling and Mapping Studies-Third Generation V1.2 (GIMMS-3G+) NDVI data, with a temporal coverage from 1982 to 2022 and a spatial resolution of 0.08333° [46].
To ensure consistency across datasets, all of the aforementioned data were aggregated to a spatial resolution of 0.25° and a temporal resolution of one month.

2.2. Methods

2.2.1. Fire-Climate Classification

To comprehensively analyze the spatiotemporal variations in BA, we adopted and simplified the fire-climate classification method proposed by Senande-Rivera et al. [47], with detailed implementation as follows. First, global fire-prone areas were initially partitioned into four subregions (Boreal [Bo], Temperate [Te], Tropical [Tr], and Arid [Ar]) based on the Köppen–Geiger climate classification, which serves as the foundational framework aligning with broad climatic characteristics of fire seasons. Then, dynamic climatic thresholds rather than fixed calendar periods to define fire-prone conditions were quantified. Climate thresholds (e.g., temperature minima/maxima, precipitation limits) were quantitatively derived by contrasting the probability distributions of key climate variables (temperature and precipitation) between pixels with high fire activity (annual BA ≥ 100 ha) and low fire activity (annual BA < 100 ha) within each subregion. These thresholds were then used to define four fire-prone classes that reflect distinct fire-regime characteristics: Tropical dry season fires (Tr-ds), Arid fuel-limited fires (Ar-fl), Temperate dry and hot season fires (Te-dhs), and Boreal hot season fires (Bo-hs) (Figure 1).
Unlike Senande-Rivera et al. [47], which further subdivided climate categories, we implemented a unified four-class system to enhance interpretability and applied the classification to a longer burned-area record (1982–2018), thus improving consistency across both space and time.
In addition, compared to the widely used Global Fire Emissions Database (GFED) fire regions [48], which are geographically delineated based on biogeographic and administrative boundaries, the fire-climate classification adopted herein offers two advantages for attribution analysis. First, it relies on consistent, quantifiable climatic thresholds that directly link to fire-regime drivers (fuel moisture, combustion conditions), enabling unambiguous attribution of BA variations to climatic factors. Second, the classification uniformly applies across global scales without arbitrary geographic discontinuities, ensuring that observed spatiotemporal BA patterns are interpreted within a consistent climatic framework. So, it is particularly suitable for large-scale analyses of climate–fire interactions.

2.2.2. Trend Analysis and Significance Test

This study employs ordinary least squares (OLS) linear regression to quantify annual BA trends at the grid, regional, and global levels for the period 1982–2018. The regression model is expressed as follows:
BAₜ = α + βt + εₜ,
where BAt represents BA in year t; α is the intercept; β represents the slope of the regression line (indicating the annual trend magnitude and direction); t is the independent variable representing the year [49]; and εₜ is the random error term. A two-tailed t-test was applied to evaluate whether the estimated trend (β) differs significantly from zero, with p-value < 0.05 indicating a statistically significant trend. All regression analyses were conducted in MATLAB R2020b [50].

2.2.3. Correlation Analysis

Pearson correlation analysis was conducted to evaluate the relationships between BA and potential influencing factors. Statistical significance was determined using a t-test, with a p-value < 0.05 indicating a significant correlation.

3. Results

3.1. Spatial Patterns and Seasonal Dynamics of Global Burned Area

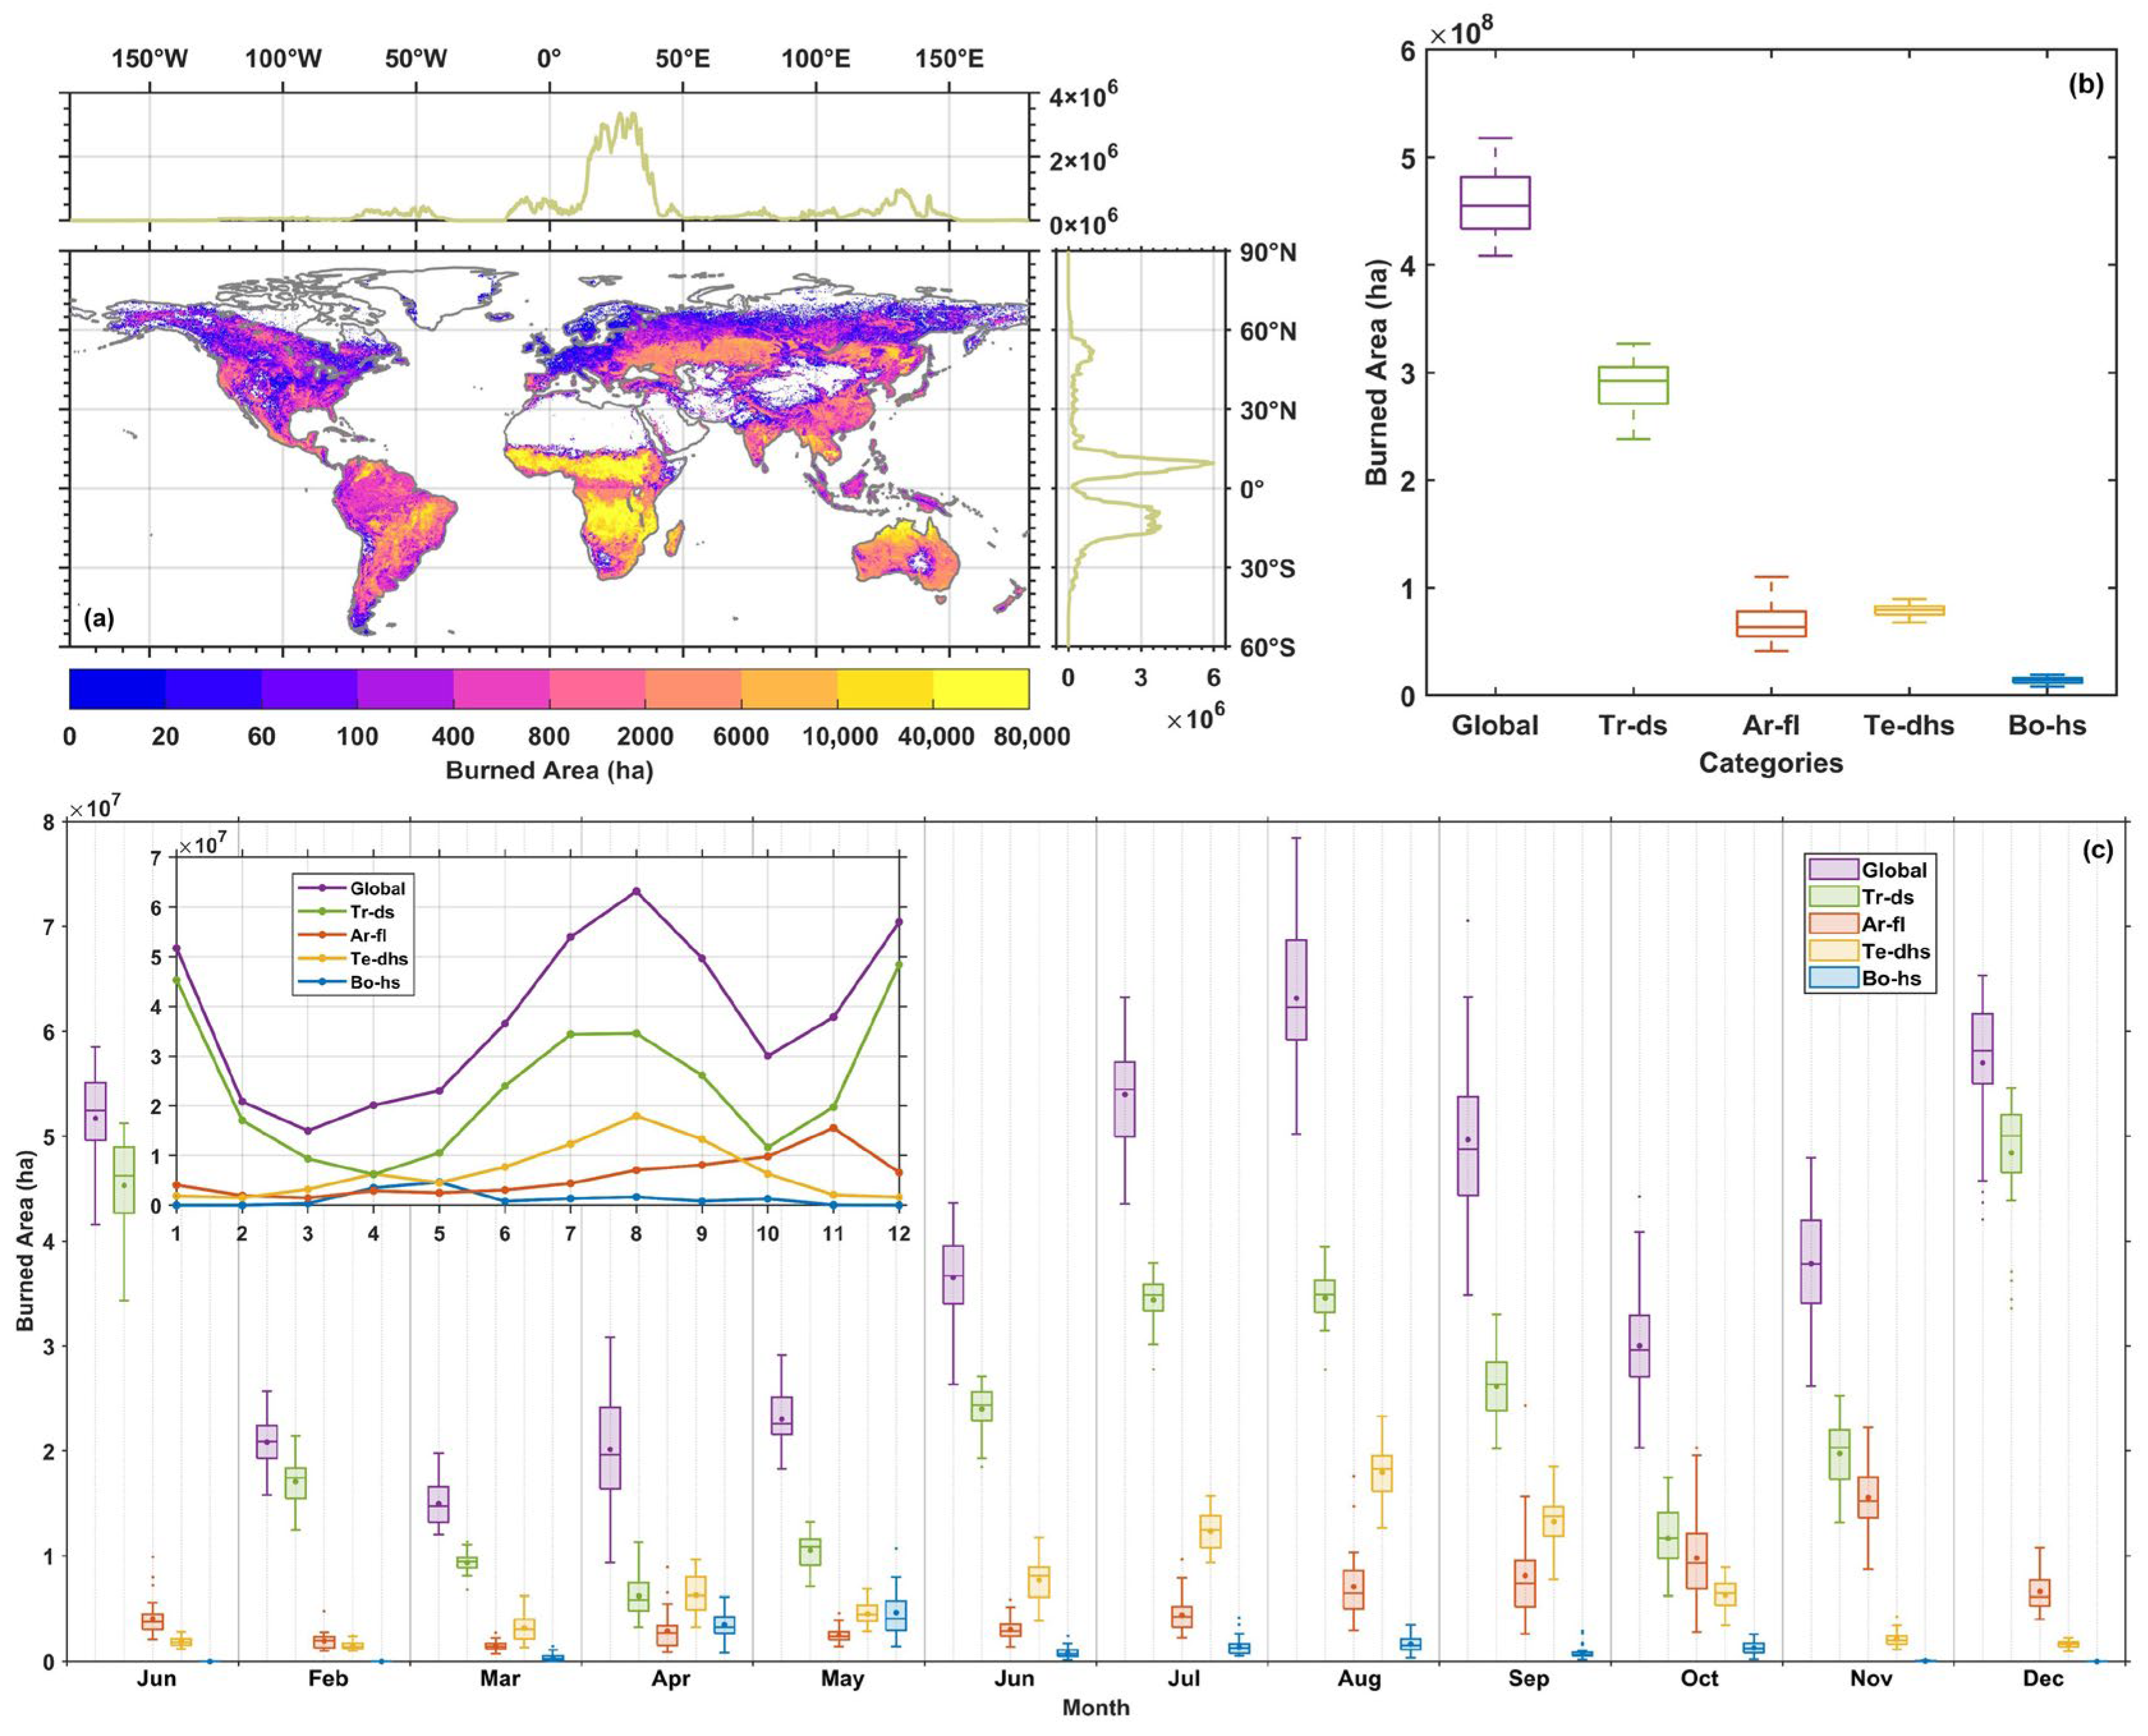
From 1982 to 2018, the global multi-year average BA is approximately 4.59 × 10⁸ ha yr−1, with Bo-hs contributing 1.44 × 10⁷ ha yr−1, Te-dhs contributing 7.87 × 10⁷ ha yr−1, Tr-ds contributing 2.87 × 10⁸ ha yr−1, and Ar-fl contributing 6.74 × 10⁷ ha yr−1 (Figure 2a). The mean annual BA is predominantly high in regions such as Africa, northern Australia, the Brazilian Highlands in South America, the Indochina Peninsula, and Central Asia (Figure 2a), with the Tr-ds category being the dominant contributor (Figure 2b). On the grid scale, the maximum multi-year average BA reaches approximately 7.39 × 10⁴ ha. Regions with low burned areas are primarily located in North Africa, Western and Eastern Europe, and the northern parts of Central Asia (Figure 2a), predominantly within the Bo-hs regions (Figure 2b). Longitudinally, the highest BA is observed between 10°E and 40°E, while latitudinally, two distinct high-burned area regions are evident: one around 10°N and another between 5°S and 20°S (Figure 2a).
At monthly scale, the global BA exhibits a distinct bimodal distribution (Figure 2c). The primary wildfire periods occur from July to September and December to January of the following year, accounting for roughly 68.3% of the total annual BA. Wildfire activity peaks in August, with an average BA of 6.31 × 10⁷ ha, while March and October exhibit the lowest BA. The seasonal characteristics of BA vary significantly across different fire-climate regions (Figure 2c). Tr-ds contributes the largest share of global BA and has the longest fire season among the fire-climate types. Its seasonal cycle also shows a bimodal distribution similar to the global pattern, although with relatively lower variability. Te-dhs likewise exhibits a weak bimodal pattern. However, its peak distribution differs from the global pattern, with maxima occurring in April and August. In contrast, the seasonal cycles of Ar-fl and Bo-hs BA follow a unimodal pattern, with peaks occurring in November and May, respectively. Te-dhs mainly occurs from June to October, especially from July to September, contributing approximately 55.4% of its annual BA. Compared to the other three fire types, Bo-hs shows relatively low BA, except in April and May.

3.2. Interannual Variability and Long-Term Trend of Global Burned Area

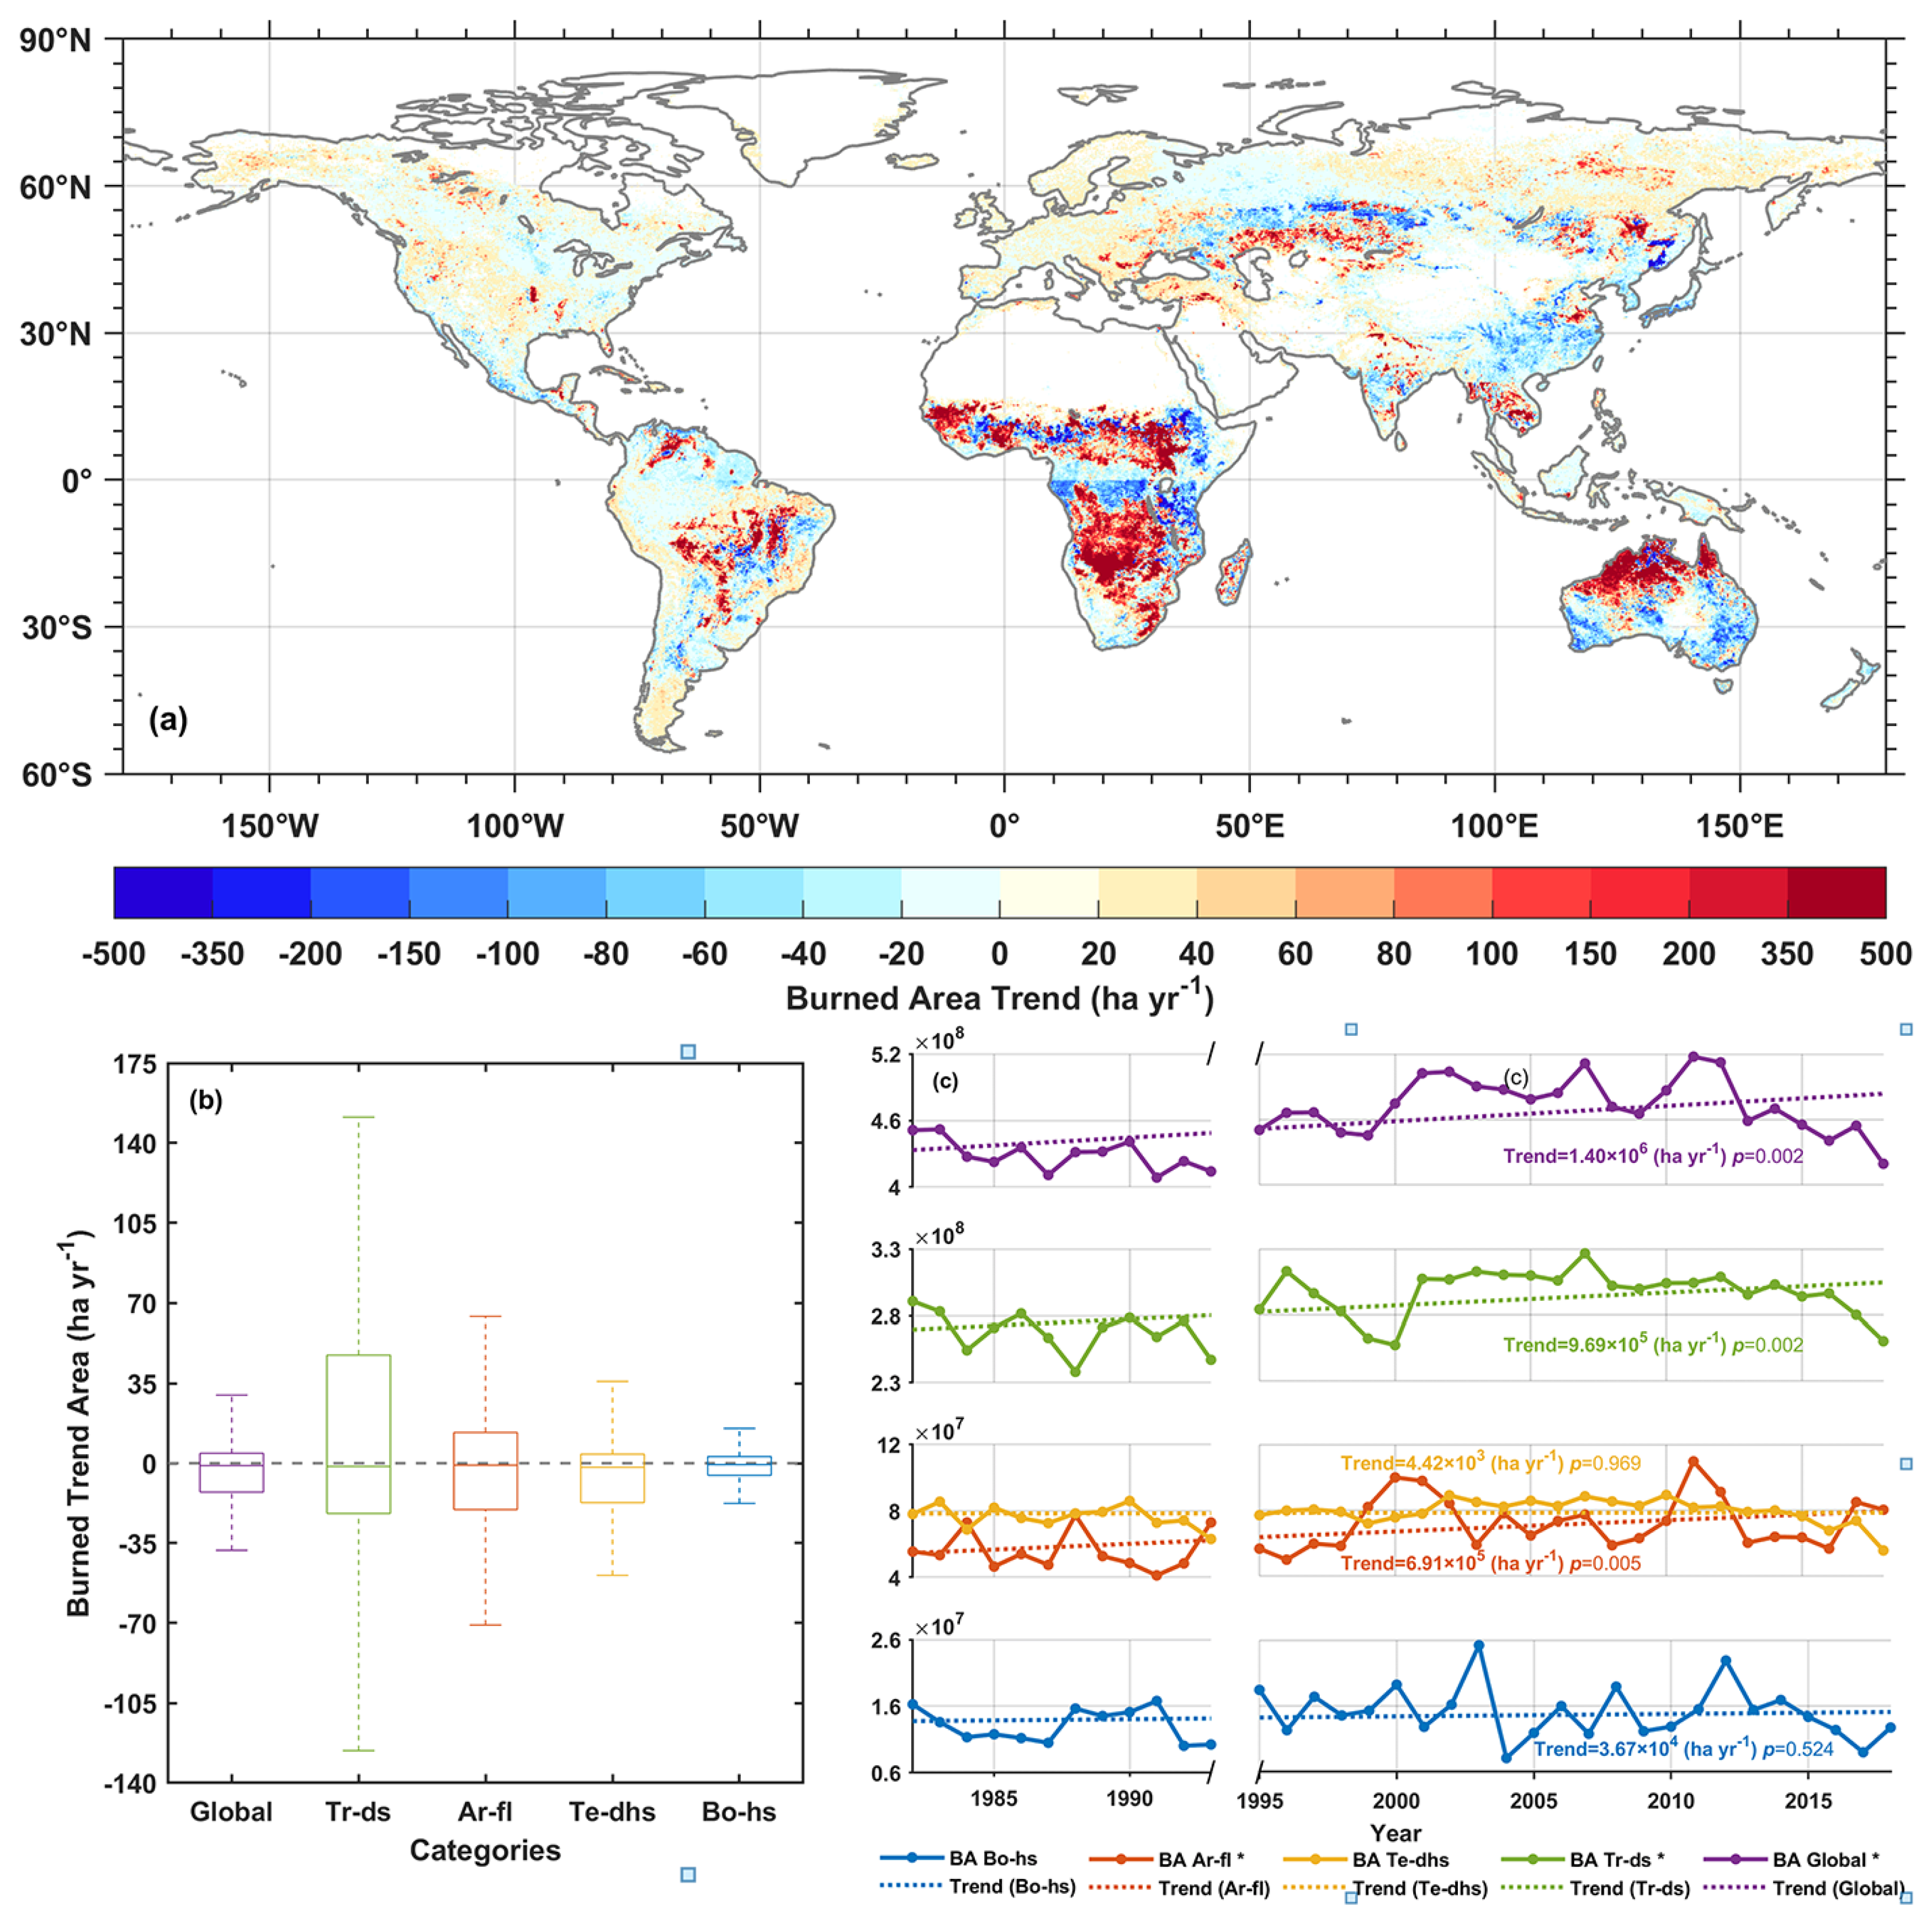
The trend of global BA from 1982 to 2018 shows significant spatial heterogeneity (Figure 3a,b). In most regions, BA show an increasing trend, particularly in the Tr-ds region. The most pronounced increases are observed in northern and central sub-Saharan Africa, Central South America, and northern Australia. Conversely, certain regions, such as Eastern Africa and southern Australia, show a decreasing trend in BA. These reductions are predominantly observed in Ar-fl and Te-dhs regions. Among the four fire-climate types, Bo-hs shows insignificant changes in BA.
Significant interannual variations in global BA are evident from 1982 to 2018 (Figure 3c). The most intense wildfire years are 2007, 2011, 2012, and 2015, with 2011 recording the highest BA of 5.18 × 10⁸ ha. In contrast, years such as 1987, 1991, and 2018 exhibit relatively lower BA values, at 4.11 × 10⁸ ha, 4.09 × 10⁸ ha, and 4.20 × 10⁸ ha, respectively. From 1982 to 2018, the global total BA shows a significant increasing trend, rising at a rate of 1.40 × 10⁶ ha yr−1 (p < 0.01). This increase is primarily driven by Tr-ds, which exhibits a significant increase of 9.69 × 10⁵ ha yr−1 (p < 0.01). Ar-fl BA exhibit substantial interannual fluctuations, with a significant upward trend of 6.91 × 10⁵ ha yr−1 (p < 0.01). Both Te-dhs and Bo-hs regions show relatively insignificant upward trends in BA. Te-dhs demonstrates minimal variability in BA over the years, with the smallest increase of 4.42 × 10³ ha yr−1. Bo-hs indicates relatively low annual BA, with an increase of 3.67 × 10⁴ ha yr−1. However, Bo-hs experiences extreme wildfire years, such as 2003 and 2012, when BA exceeds 2.25 × 10⁷ ha—2~3 times higher than in fire-deficient years like 2004 and 2017.

3.3. Attribution of Spatiotemporal Changes in Burned Area

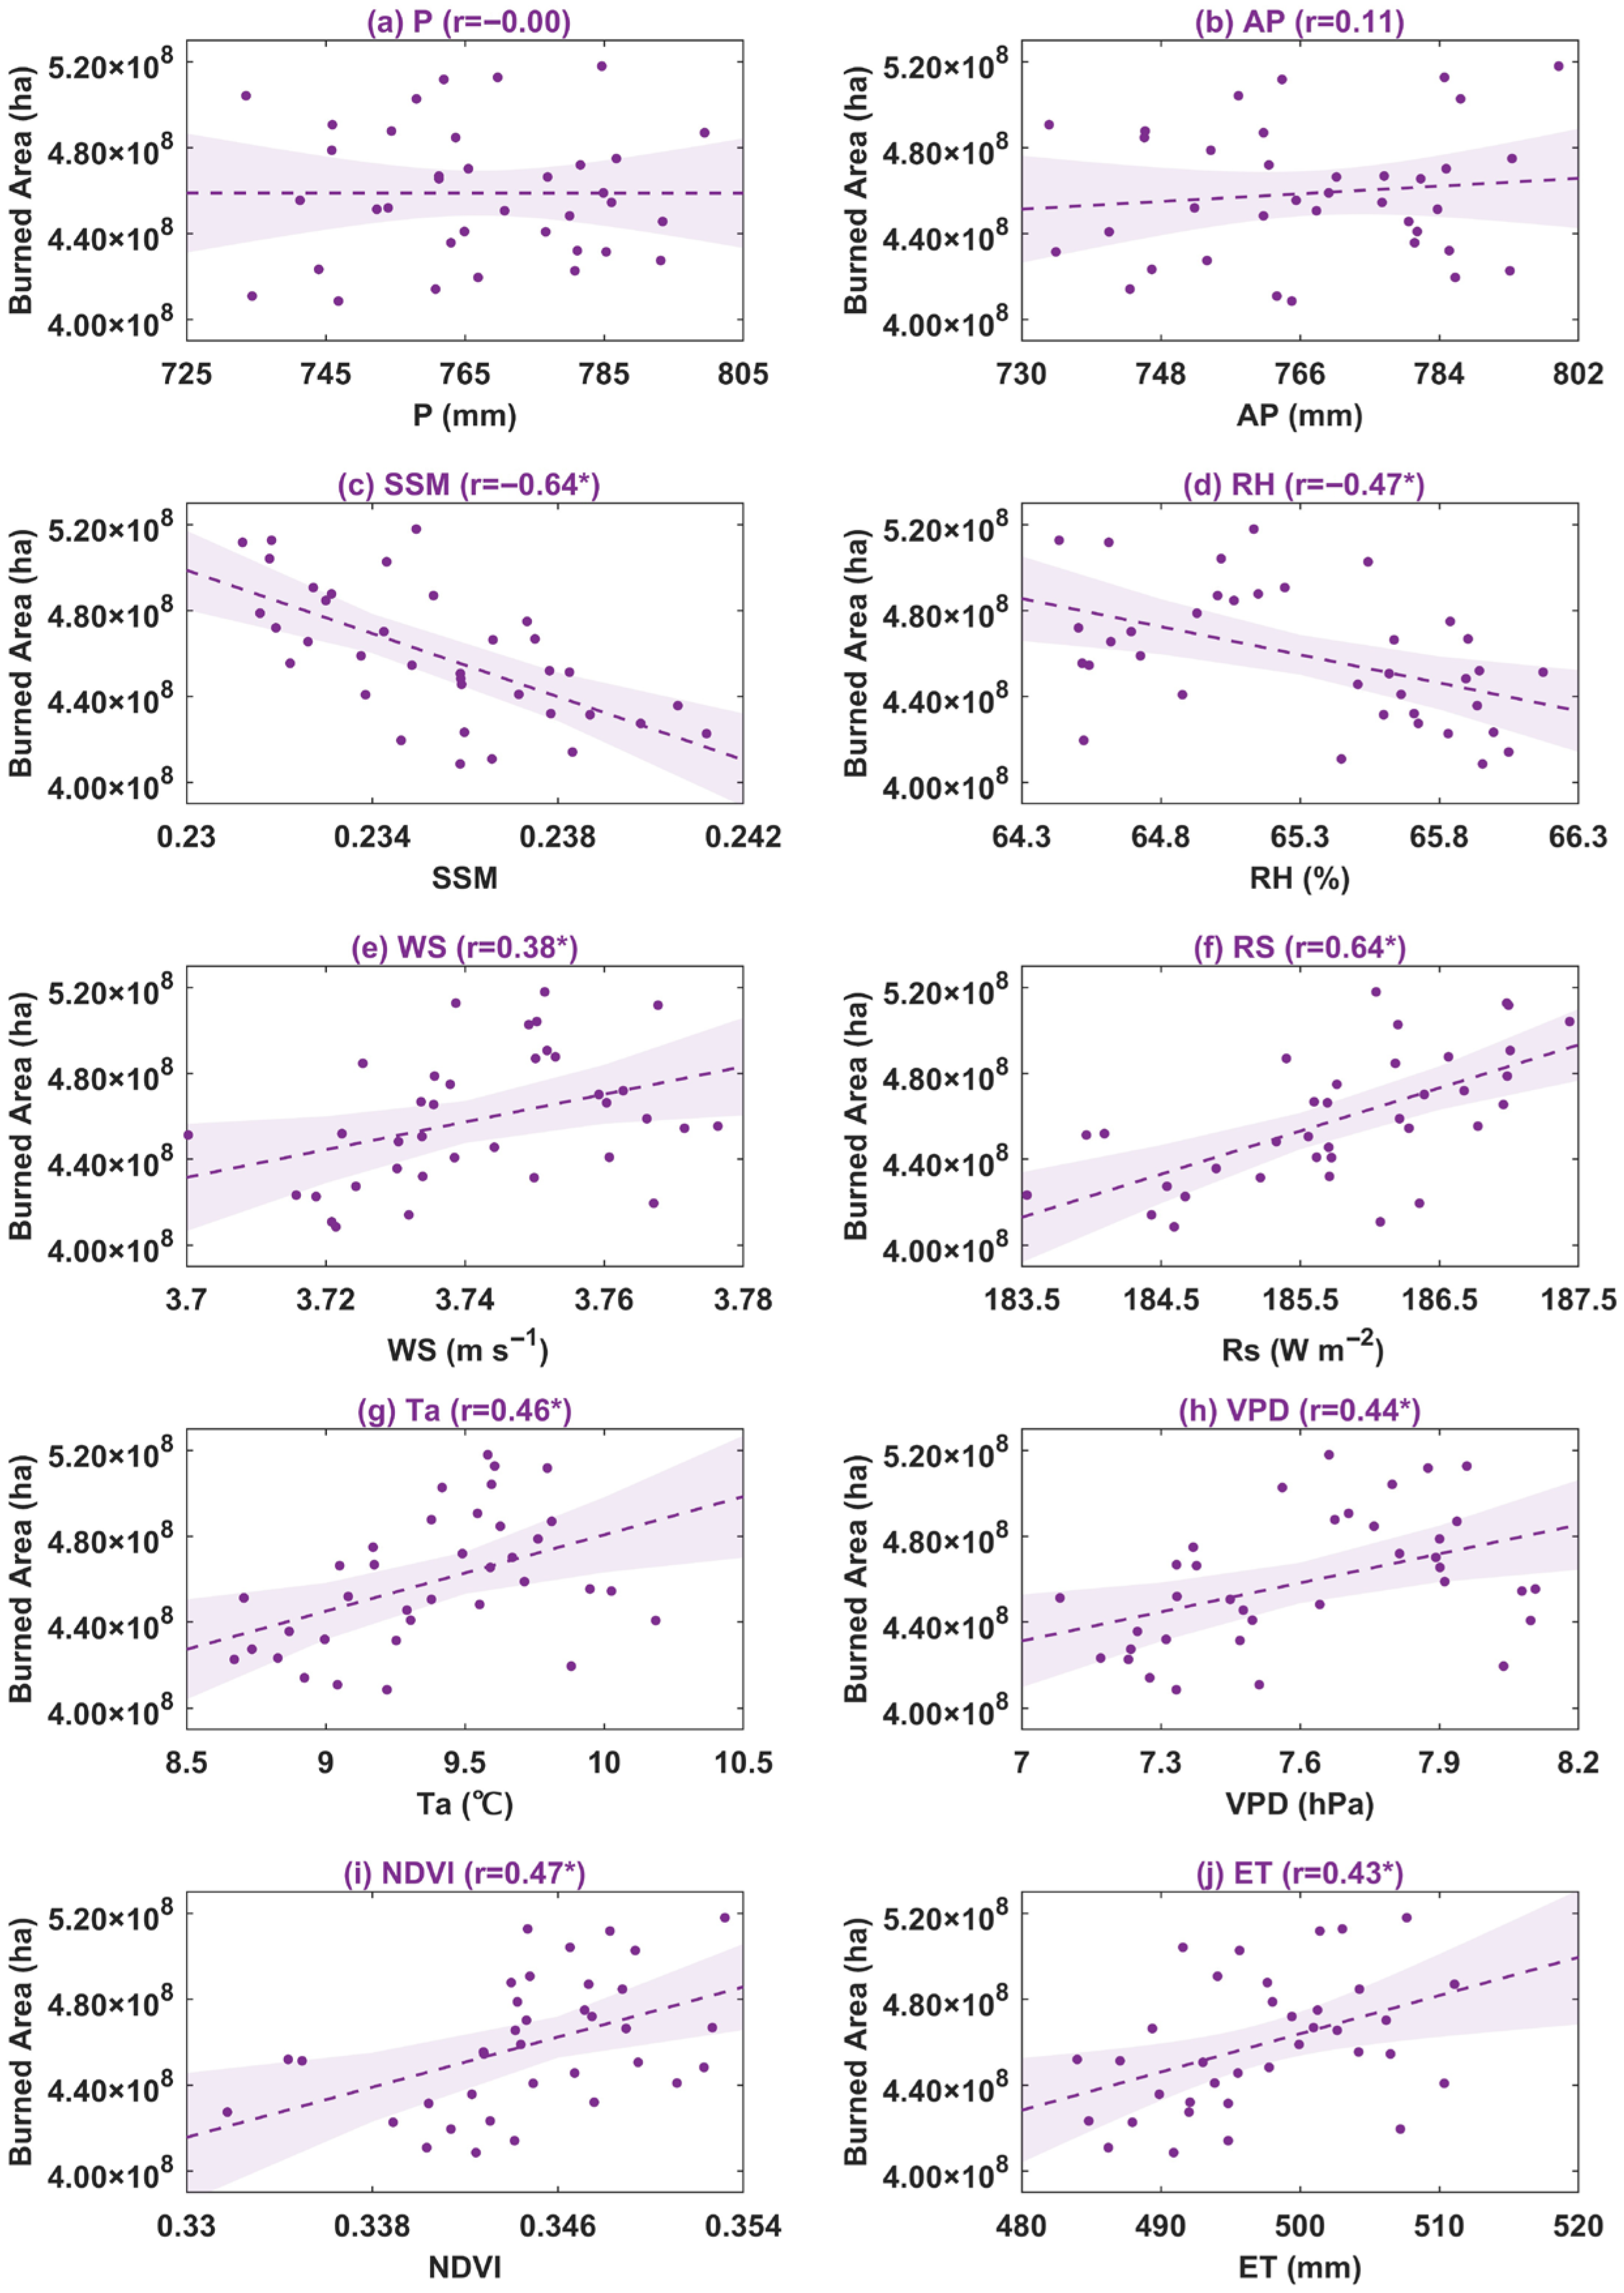
The correlation analysis indicates that the driving factors of BA in different fire-climate zones show significant differences (Figure 4, Figure 5, Figure 6, Figure 7 and Figure 8). Specifically, at the global scale, previous-year precipitation (AP) and current-year precipitation (P) show weak correlations with BA, while the other eight factors all exhibit significant correlations (Figure 4). BA exhibited significant positive correlations with several vegetation and climatic indicators, including Rs (r = 0.64), NDVI (r = 0.47), Ta (r = 0.46), VPD (r = 0.44), ET (r = 0.43), and WS (r = 0.38). These results indicate that hot and dry atmospheric conditions, as well as abundant vegetation biomass, promote fire activity at the global level. Conversely, SSM and RH showed significant negative correlations with BA (r = −0.64 and −0.47, respectively), highlighting the suppressive effect of moist conditions on wildfire occurrence and spread.
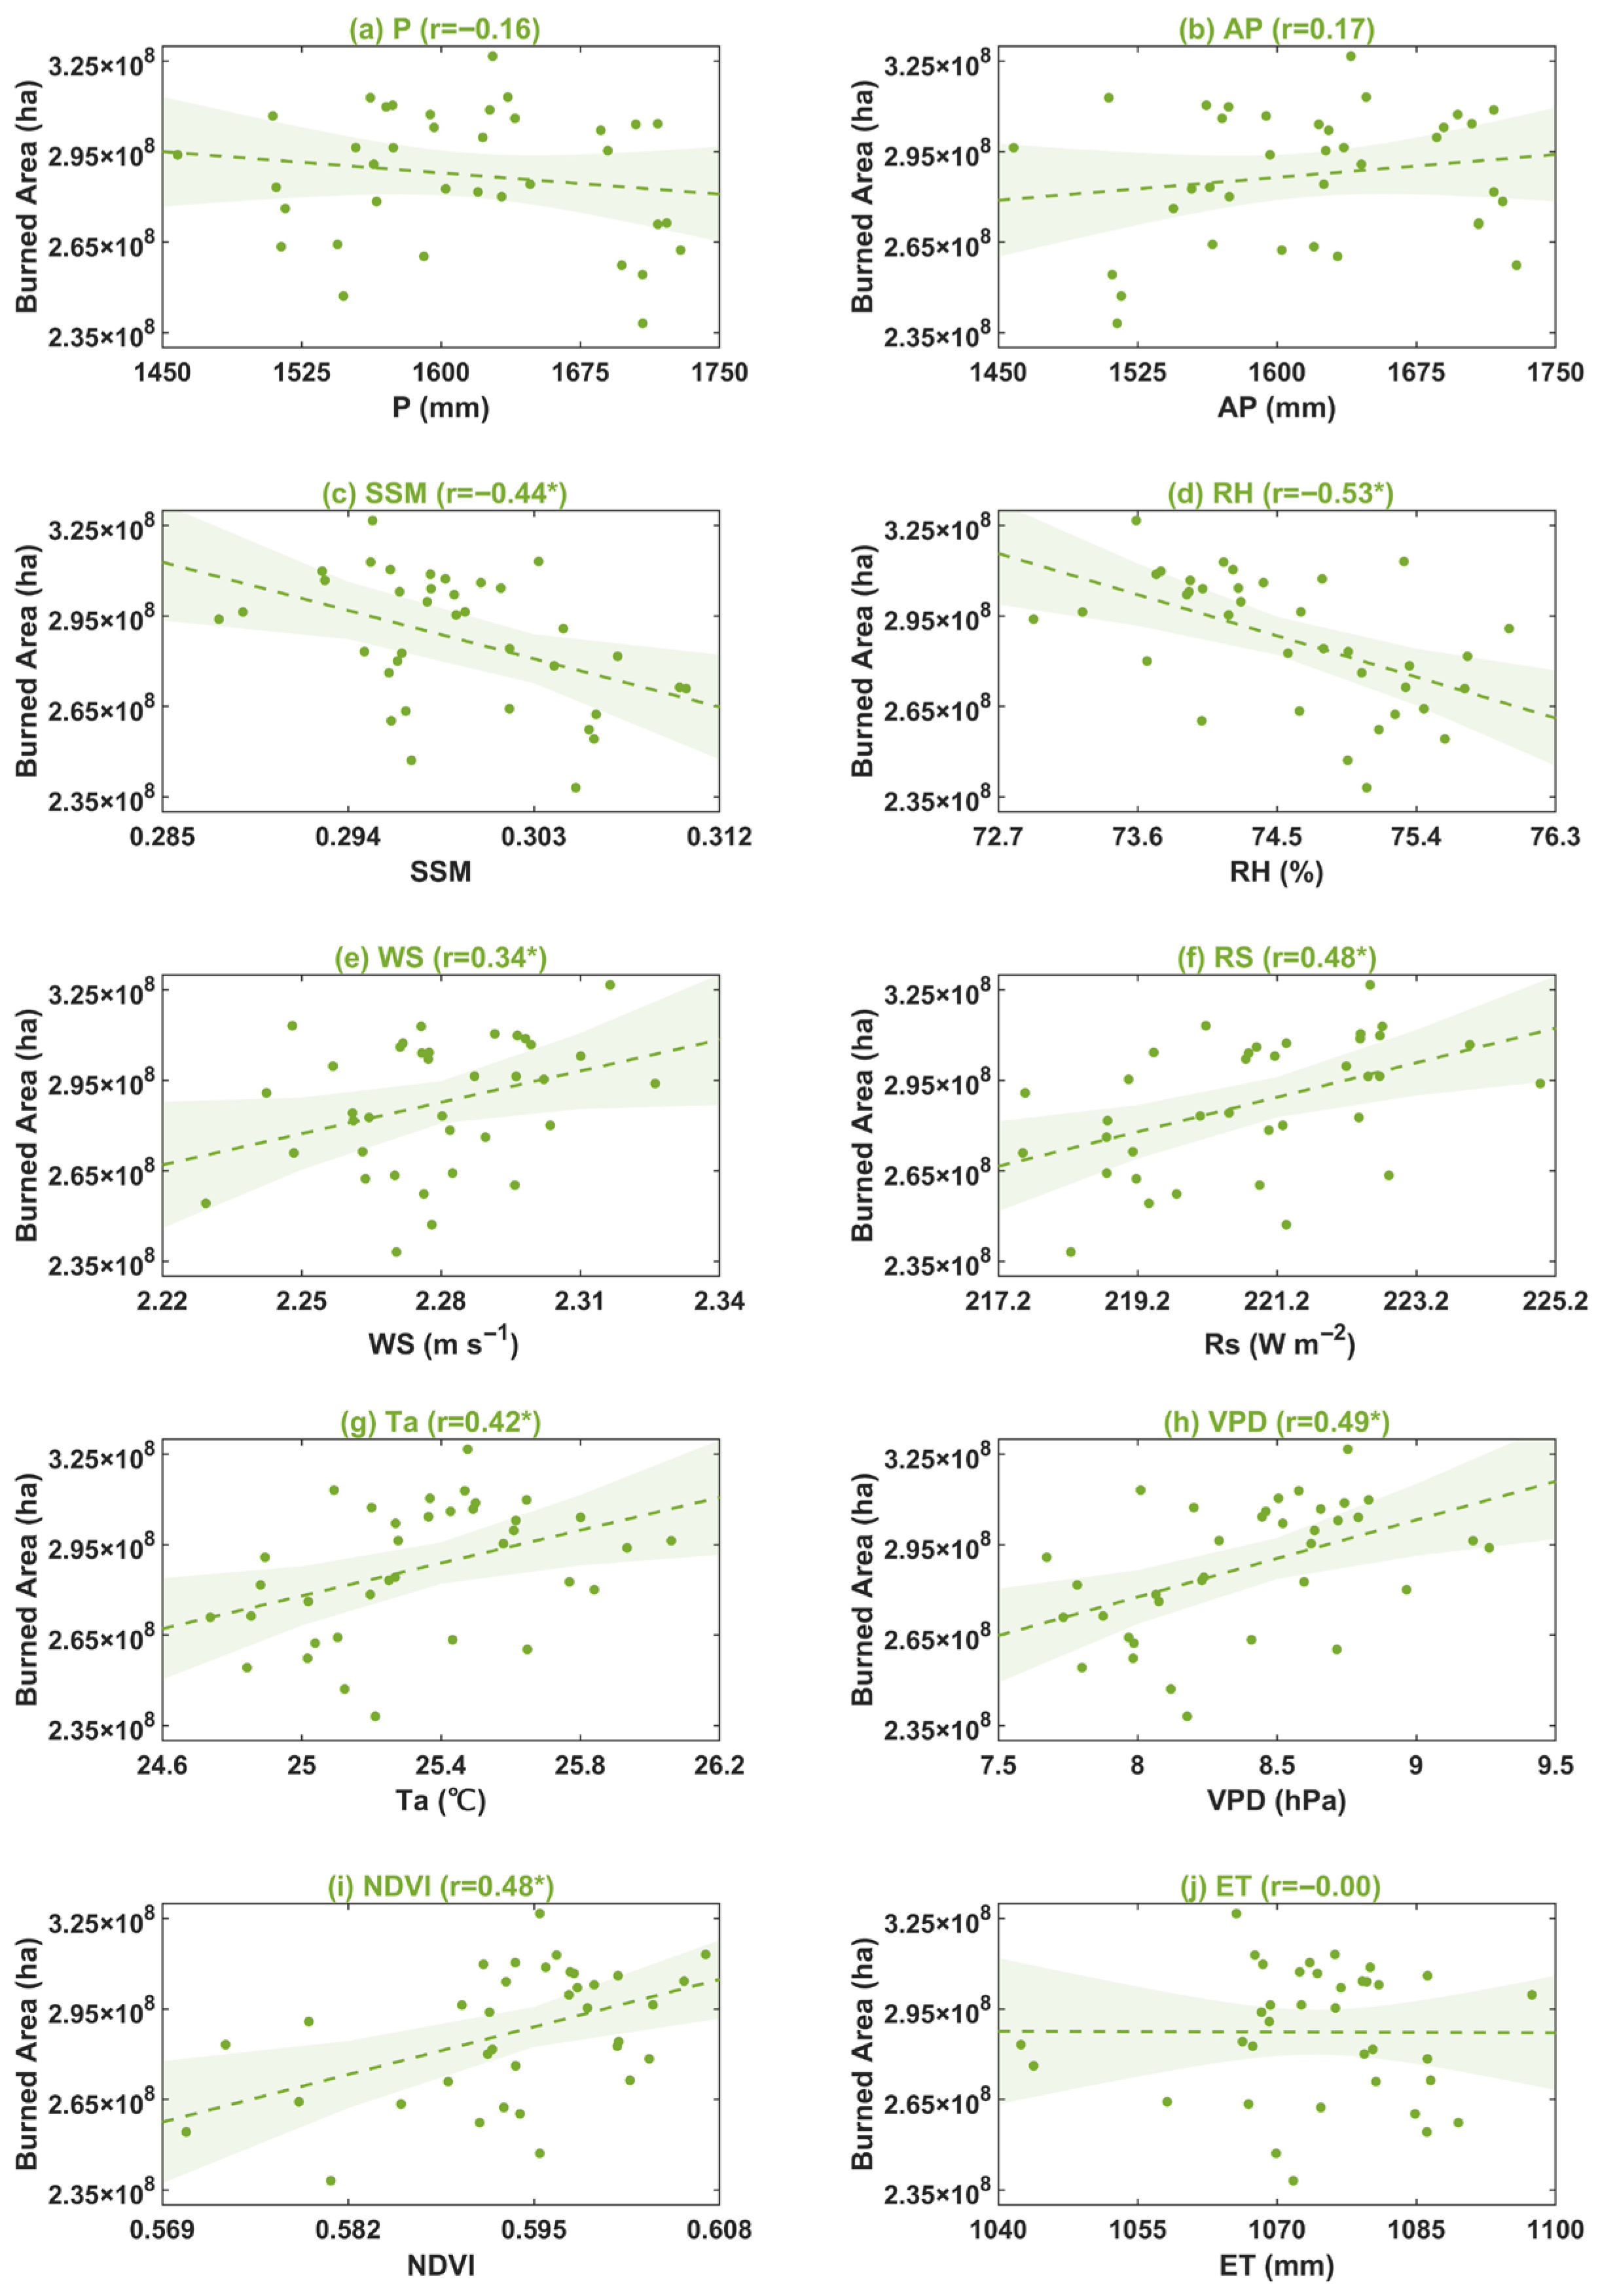
In the Tr-ds region, the influence of factors on BA is basically consistent with the global pattern (Figure 5). Therefore, the fire activities in this region are also strongly associated with vegetation abundance and dry-hot conditions. Notably, ET shows no obvious correlation with BA. Moreover, precipitation is negatively correlated with BA, which further emphasizes the importance of dry surface conditions.
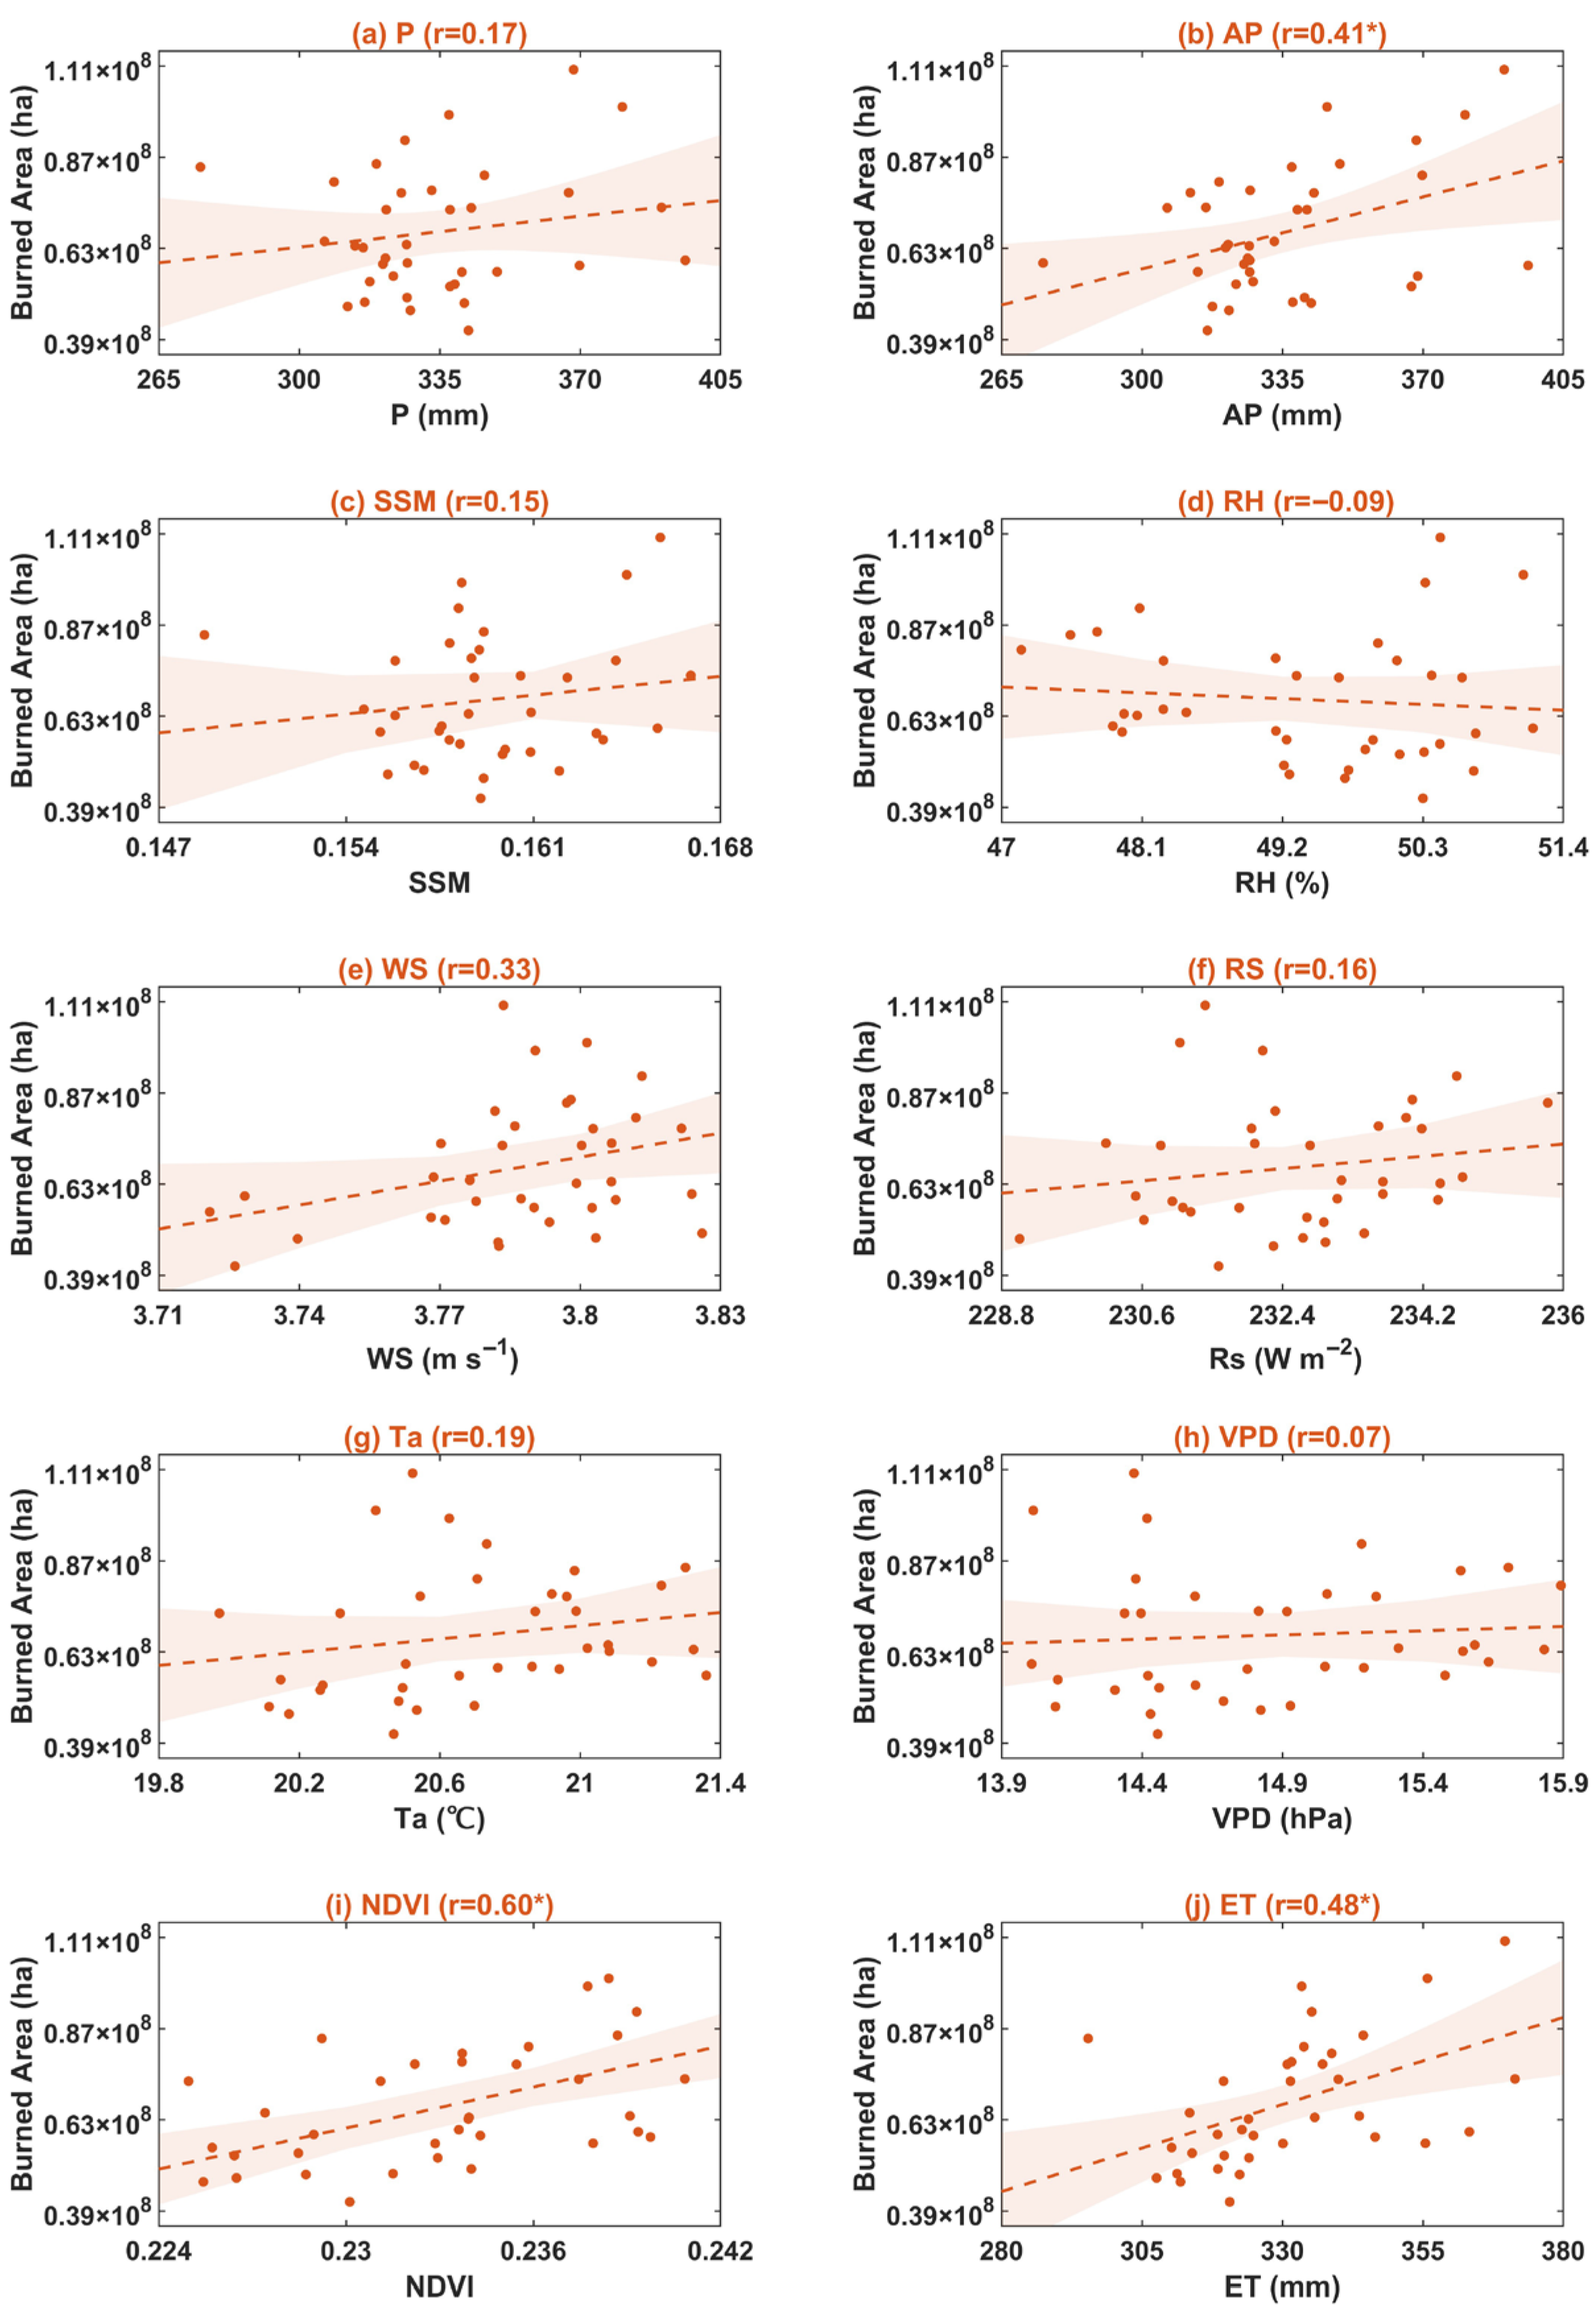
In the Ar-fl region, BA was most strongly associated with fuel-related variables. NDVI, AP and ET show significant positive correlations with BA. Among these, NDVI shows the strongest correlation (r = 0.60), followed by ET (r = 0.48) and AP (r = 0.41). The WS and precipitation also have a certain positive correlation with BA, while other climatic variables show weak or insignificant associations (Figure 6).
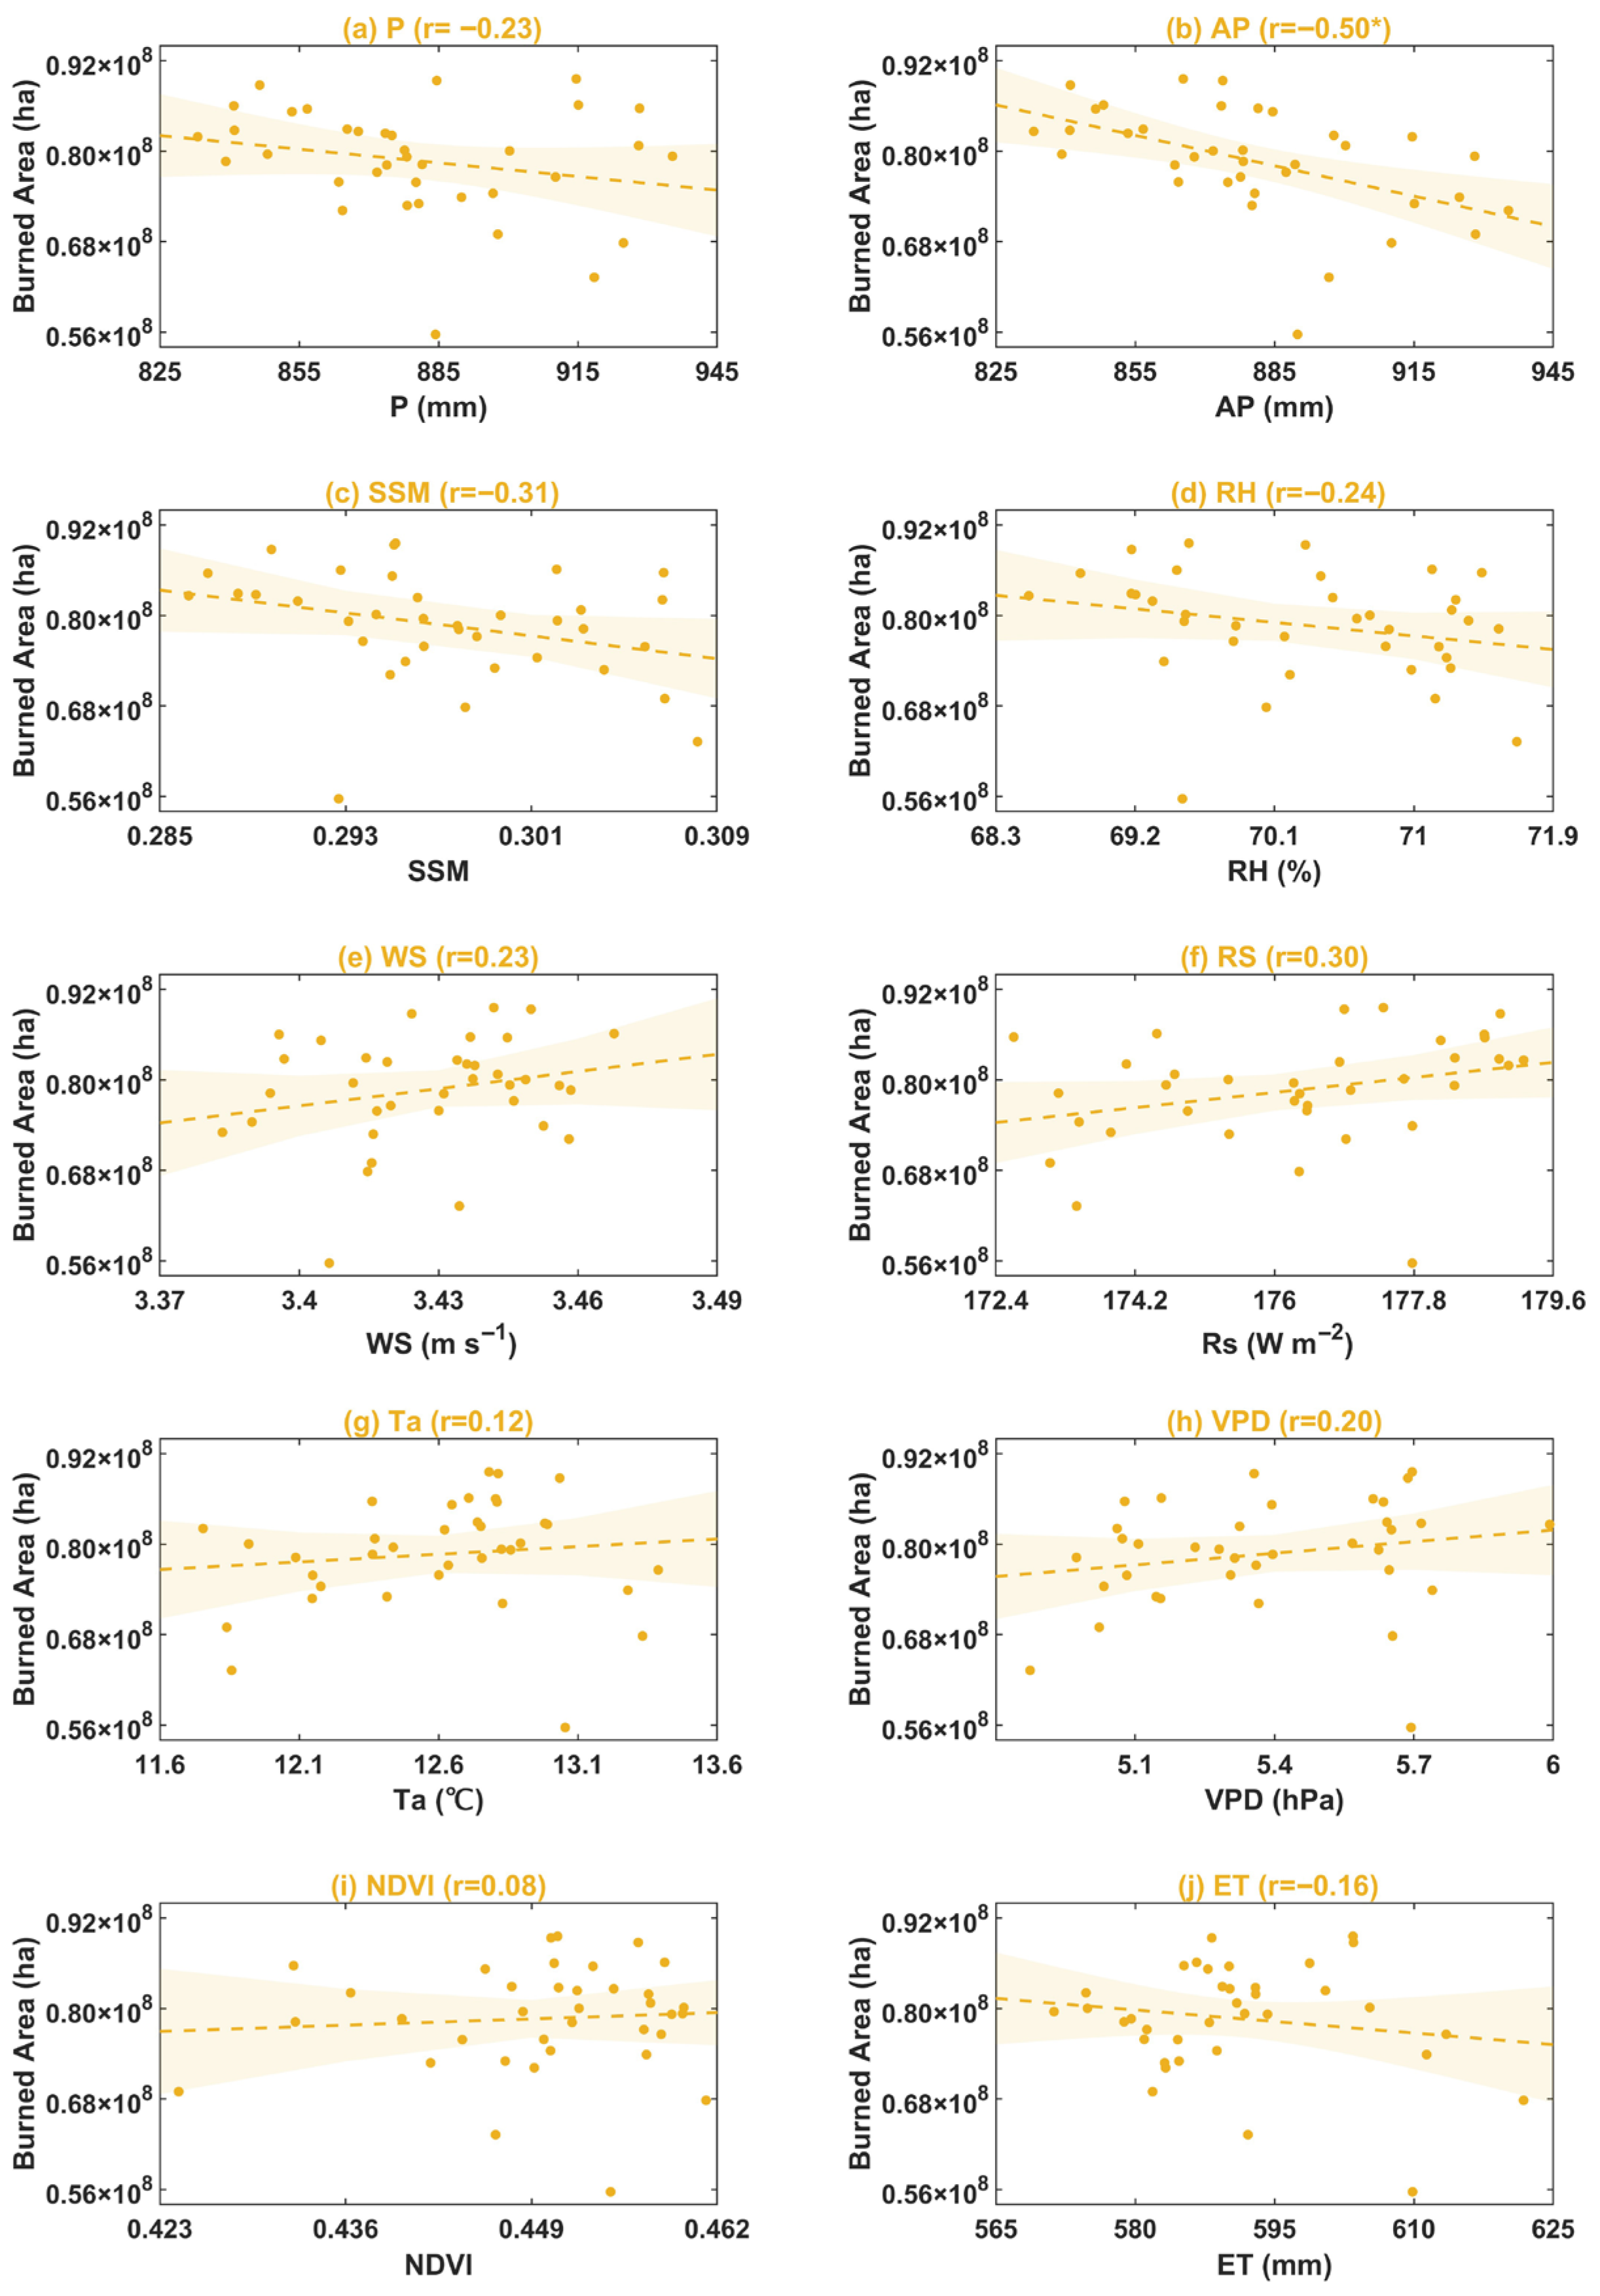
In the Te-dhs region, only AP shows a significant negative correlation with BA (r = −0.50), while the remaining factors—such as Rs, WS, and RH—show no statistically significant correlation with BA (Figure 7). This suggests that fire activity in Te-dhs may be influenced by a more complex interplay of drivers.
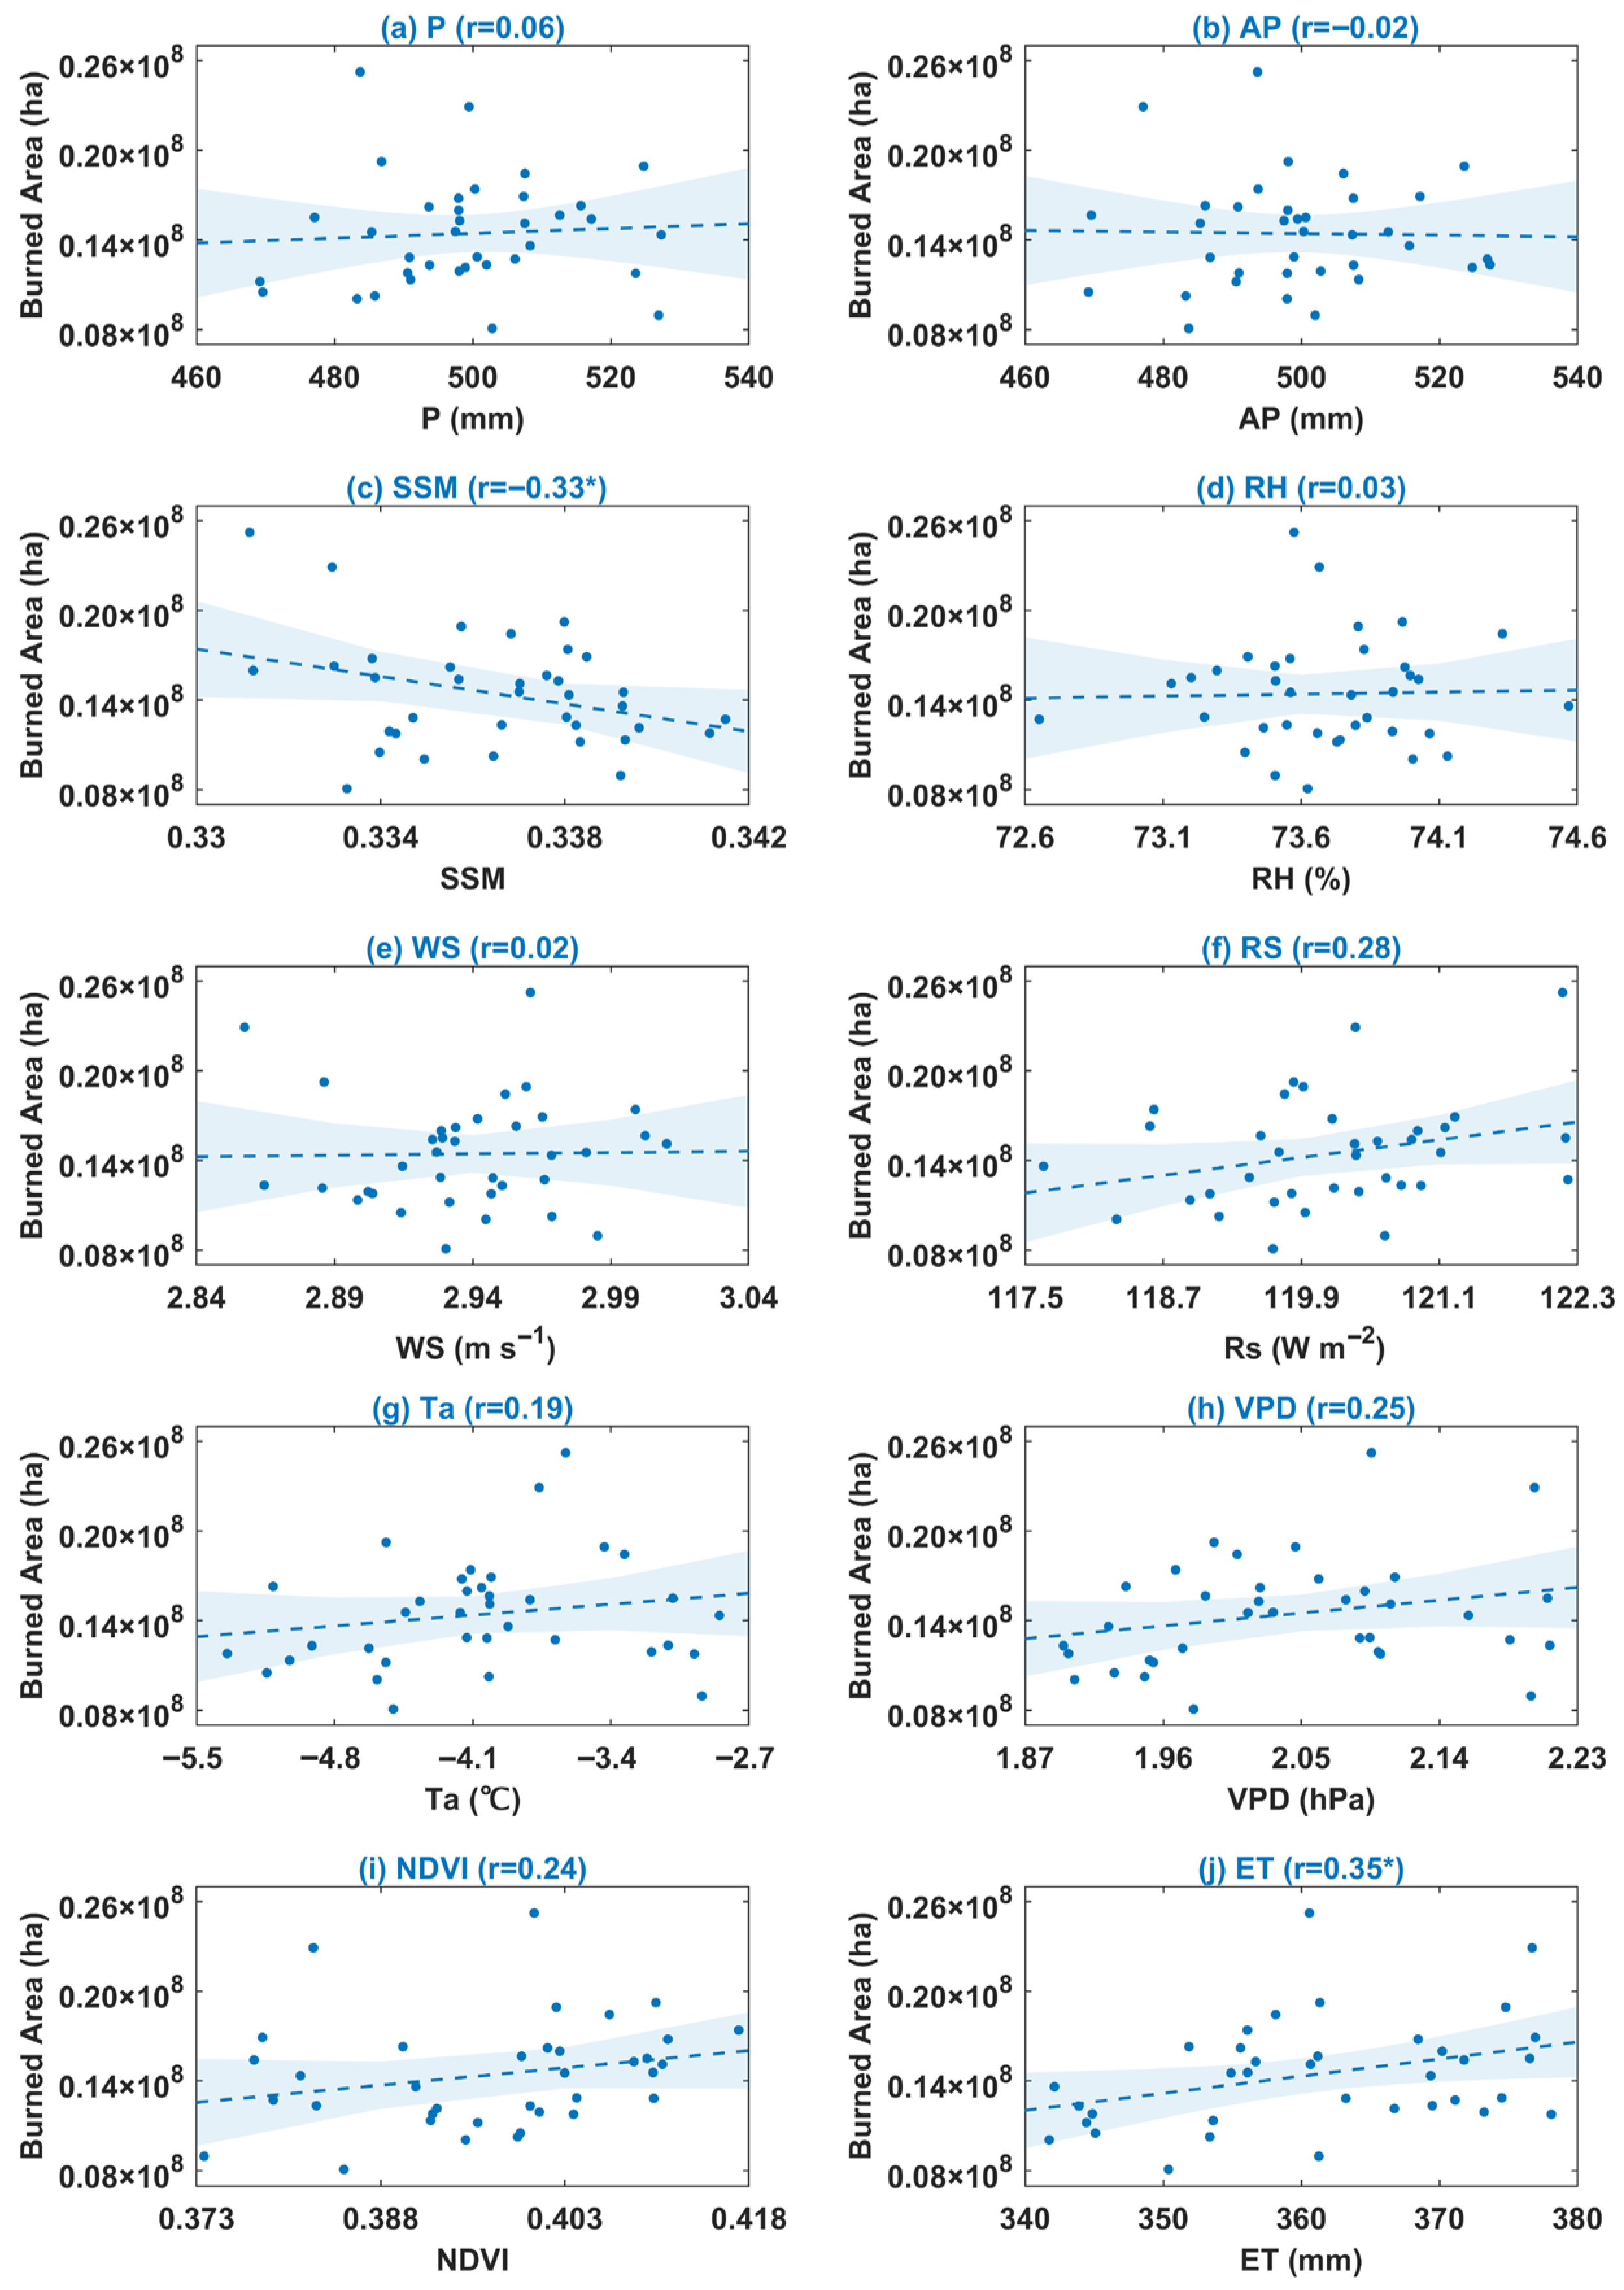
In the Bo-hs region, BA was negatively associated with SSM (r = −0.33), implying the importance of surface dryness in facilitating fire activity. In contrast, ET shows a significant positive correlation (r = 0.35). RH and precipitation-related variables exhibited minimal associations (Figure 8).
Overall, these results indicate that although dry heat conditions and fuel supply are the main drivers of global wildfire activities, their relative importance varies by region. In the Tr-ds and Ar-fl regions, vegetation and humidity conditions dominate, while in the Bo-hs region, the influence of surface dryness seems to be greater. Furthermore, the fire activities in the Te-dhs region may be more influenced by the complex interactions among multiple factors.

4. Discussion

4.1. Spatiotemporal Pattern

The results indicate that global wildfire BA exhibits distinct spatial variation, with major concentrations in certain tropical regions, consistent with previous studies [8]. This distribution is predominantly influenced by the intricate interplay among climate, vegetation, and human activities. Climatic factors, particularly temperature and precipitation, have a significant impact on burned areas [2,51]. They influence wildfire activity by regulating vegetation productivity (fuel availability) and fuel moisture (fire ignition potential). Additionally, human ignition plays the most direct role in wildfire occurrence, especially in tropical forests, tropical savannas, and agricultural regions [52].
Furthermore, wildfires generally occur during the warmer and drier months, with peak activity observed in the northern hemisphere, such as North America, from June to August. In contrast, in the southern hemisphere, particularly in Australia, wildfire events are most frequent between December and January [13,53].
Wildfires in the Tr-ds region exhibit two distinct seasonal peaks, occurring approximately from December to January and June to September. The Tr-ds region corresponds to the tropical savanna climate and is strongly influenced by the seasonal precipitation cycle [52,54,55]. Wildfires predominantly occur during the dry season, which typically extends from November to April in the Northern Hemisphere and from May to October in the Southern Hemisphere. As the dry season progresses, sustained evaporation depletes moisture levels, leading to vegetation desiccation and heightened fire activity. Given that the Tr-ds region accounts for the largest proportion of global BA, the seasonal cycle of the global BA also exhibits a similar bimodal pattern. Regions where Ar-fl are predominantly distributed exhibit a pronounced annual wet-dry seasonal cycle. The fire season typically begins at some point during the dry season [12,54], which explains why Ar-fl activity is primarily concentrated between October and December. In the regions where Te-dhs is present and the dry season coincides with the warm season, wildfire activity and interannual variations in burned area correlate strongly with high temperatures and seasonal precipitation [18,56,57,58].
Our study reveals a significant increasing trend in global burned area from 1982 to 2018, which contrasts with results from studies focusing on the past decade or so [2,6,11]. This discrepancy is likely due to the limited time span of satellite datasets, where trend identification is strongly influenced by years with unusually high or low values at the beginning and end of the time series. As noted in the study by Forkel et al. [11], if the first analysis year is between 1998 and 2002, and the last year is 2014 or 2015, most of the data exhibit a declining trend over this shorter time span. Within this shorter overlapping period, the trend in the data used in our study is consistent with previous research. For example, during 2003–2015, the BA declined at a rate of −1.47 × 10⁶ ha yr−1, aligning with the trend observed in the MCD64A1 product reported by Andela et al. [6]. Similarly, from 2001 to 2015, the decline rate was −1.85 × 10⁶ ha yr−1, consistent with the trend of −0.66% yr−2 for the FireCCI50 product described by Forkel et al. [11]. Furthermore, the BA trend during 2002–2013 also aligns with prior studies [2], exhibiting a decreasing trend at a rate of −5.04 × 10⁵ ha yr−1. In contrast, this study employs a globally consistent BA dataset from 1982 to 2018, enabling a more reliable trend quantification over a longer time scale.

4.2. Driving Factors

The regional heterogeneity between the BA and driving variables reflects the complex interactions among climate, vegetation, and fire dynamics under different environmental conditions [30,32]. Our research indicates that hot and dry conditions, along with abundant fuel, have dominated wildfire activity globally and in the Tr-ds region. While fire activity in the Ar-fl region appears to be mainly constrained by fuel availability. Surface dryness plays a dominant role in fire activity in the Bo-hs, highlighting the critical role of moisture limitation in high-latitude fire regimes. In the Te-dhs region, a more complex interplay among multiple factors may collectively influence the burned area.
Generally, humidity factors (such as SSM and RH) are significantly negatively correlated with BA, as moist conditions hinder the drying of plants and soil, reducing the likelihood of fire ignition [1]. Notably, however, a weak positive correlation is observed between SSM and BA in the Ar-fl region. This positive association contrasts with the negative correlations observed in other regions, such as Tr-ds and Bo-hs, where moisture typically suppresses fire spread by inhibiting flammability. In Ar-fl, however, higher SSM may enhance vegetation productivity and biomass accumulation over time, thereby indirectly increasing fuel availability and fire potential. This reflects that moisture is a prerequisite for the development of burnable biomass [59]. Therefore, the results emphasize the need to consider the fuel–moisture–fire dynamics in specific regions when predicting fire models, especially in arid environments.
While precipitation factors (including AP and P) show a weak correlation with BA at the global scale (Figure 4), their influence appears to vary substantially across regions, likely due to threshold effects. Aldersley et al. [60] identified the existence of an “optimal” precipitation range influencing burned area in their global and regional analysis of wildfire–climate interactions. This threshold behavior suggests that precipitation can have dual and opposing impacts: in regions such as Ar-fl, where vegetation growth is moisture-limited, precipitation can enhance fire potential by promoting vegetation growth and increasing fuel availability. Conversely, in more temperate regions like Te-dhs, precipitation factors exhibit negative correlations with BA, likely reflecting precipitation’s suppressive effect on fire through increased soil and fuel moisture. Therefore, it is necessary to consider the impacts of precipitation nonlinearity and regional heterogeneity on wildfire activity, especially in models predicting future wildfire behavior under changing climatic conditions.
ET and VPD generally exhibit a positive correlation with burned area, as they influence fuel moisture and overall environmental aridity, both of which promote fire activity [2,61]. However, our results show that while ET shows a significant positive correlation with BA in most regions, it exhibits a weak negative correlation in the Te-dhs region. This discrepancy may reflect the distinct hydrological and ecological conditions in the Te-dhs. In this region, higher ET is often associated with increased water availability and denser vegetation, which may reduce fire occurrence by maintaining higher fuel moisture.
Increasing solar radiation and higher temperatures are more likely to trigger wildfire activity, which is consistent with previous studies [62,63]. Intense solar radiation elevates the surface temperature, dehydrating surface vegetation and combustibles, and rendering them highly inflammable. Similarly, as the temperature increases, vegetation and combustibles dry out more readily, frequently triggering more fire activities.
Our study demonstrates vegetation-related factors are generally positively correlated with BA (Figure 5). Krawchuk et al. [64] also found that biomass combustion is essential for wildfire occurrence, using net primary productivity (NPP) as an indicator. Consistent with the findings of Lasslop and Kloster [61], WS generally plays a key role in fire spread.

4.3. Accomplishments and Limitations

This study provides a comprehensive assessment of global wildfire dynamics over an extended multi-decadal period (1982–2018) using a consistent satellite-based burned-area dataset. By integrating long-term fire observations with a climate-based fire-regime classification, the analysis reveals how wildfire activity responds to distinct climatic environments and fuel–climate interactions across biomes. The findings help reconcile contrasting trends reported in shorter-term studies and contribute to a clearer understanding of the spatial heterogeneity and environmental controls shaping global fire activity.
The use of global satellite burn area data from the FireCCILT11 product provides good data consistency and benefits from a long-term time series. However, inevitable biases exist in satellite image acquisition and data processing.
For instance, the boundary of its processing region exhibits significant spatial discontinuity, especially in regions such as South America and Africa. Moreover, Giglio and Roy [65] noted that Advanced Very High-Resolution Radiometer (AVHRR) sensors and satellite platforms were not specifically designed for fire monitoring. Variations in solar zenith angle (SZA) induced by sensor-related factors such as orbital drift can lead to misclassification of fire signals, particularly in tropical and frigid zones [34]. Changes in SZA affect the radiometric accuracy of visible channels; in low-latitude regions, high solar angles during afternoon overpasses may enhance the apparent fire signal, whereas in high-latitude regions, the absence of nighttime observations in winter can result in data gaps (e.g., the United States).
Additionally, the coarse spatial resolution of the dataset (0.05°) limits its ability to detect small-scale fires accurately, introducing uncertainty into estimates of fire frequency and spatial distribution. For example, small and localized burning events may be overlooked due to pixel-mixing effects, leading to underestimation of local fire risks (e.g., agricultural areas in Europe). In regions with intensive human activity, such as South Asia, there is also a risk of overestimating burned area, as signals from urban heat islands, industrial sources, or scattered anthropogenic fires may be misclassified as large, contiguous fire events [66].
An additional limitation arises from the differing spatial resolutions among datasets, including FireCCILT11 BA (0.25°), MSWX meteorological variables (0.10°), and NDVI (0.083°). Although all datasets were aggregated to 0.25°, resolution mismatch may introduce spatial smoothing effects.
At the same time, in correlation analysis, linear models may not adequately capture the complex interactions between climate factors and BA. In reality, these relationships may be nonlinear and subject to threshold effects in different regions. For instance, in some areas, higher temperatures and increased vegetation cover may raise the likelihood of fire occurrence, but when temperature or vegetation cover exceeds certain thresholds, other factors such as precipitation or humidity may limit fire activity, thereby influencing fire dynamics. And it should be noted that the attribution analysis is based on statistical correlations, which reflect associations rather than direct causal relationships between burned areas and environmental drivers. The existing correlation results cannot be directly interpreted as the causes of BA changes. The use of annual averages in the study may overlook seasonal variations, particularly the dynamic shifts in climate factors during the fire season. And errors in observational data, the simplicity of geographic partitioning considerations [47], and the variability of climate factors themselves, may all influence the interpretation and generalization of the research results.
Furthermore, the occurrence and extent of wildfires are influenced by a series of more complex interacting factors, which are beyond the scope of our analysis. For instance, localized weather conditions, convective activities and lightning strikes are all crucial ignition mechanisms [67,68,69]. In specific contexts or fire events, ignition sources—whether lightning or human-caused—may play a more significant role than climatic variables such as temperature or precipitation [70]. Climate teleconnections—such as the Indian Ocean Dipole, and the North Atlantic Oscillation—have also been shown to influence regional fire regimes by modulating temperature and precipitation anomalies over large spatial and temporal scales [71]. Additionally, anthropogenic factors, including land-use change, population density, fire suppression policies, and accidental or intentional ignitions, can significantly alter fire dynamics and contribute to interannual variability [25,60].
These omitted variables highlight the importance of incorporating both biophysical and socio-environmental drivers into future fire prediction models to more comprehensively understand and simulate wildfire dynamics, particularly under rapidly evolving climate and land-use conditions. Future research could further improve the robustness of wildfire attribution by integrating multiple burned area datasets to reduce product-specific uncertainties. In addition, applying nonlinear or machine-learning-based approaches to capture threshold effects and complex interactions and incorporating human influences and ignition-related factors could develop a more comprehensive understanding of global wildfire dynamics.

5. Conclusions

Our research utilized a longer time series of BA data to comprehensively analyze the spatiotemporal patterns, interannual variability, and long-term trends in BA globally and across different fire-climate regions from 1982 to 2018. Additionally, the driving factors influencing BA were systematically investigated. The key findings are summarized as follows:
  • Spatial Distribution of BA: The global multi-year average BA from 1982 to 2018 is 4.59 × 10⁸ ha yr−1, with the main burning regions located in Africa, northern Australia, the Brazilian Plateau in South America, the Indochina Peninsula, and Central Asia. The largest BA values are concentrated between 10°E and 40°E, with two primary high-burn zones situated around 10°N and between 5°S and 20°S.
  • Seasonal and Interannual Variability: Wildfire activity globally primarily occurs during two seasons: July to September and December to January, corresponding to the hot and dry seasons in many regions. The interannual variability in BA is substantial, and both global and regional BA (across four fire-climate zones) exhibit increasing trends, with statistically significant increases observed globally, as well as in the Tr-ds and Ar-fl regions.
  • Long-Term Trends: From 1982 to 2018, most regions globally show declining trends in BA, while increases are primarily observed in the Tr-ds region. The most pronounced increases occur in the northern and central sub-Saharan Africa, central South America, and northern Australia. The regions with decreasing BA are mainly concentrated in the Ar-fl and Te-dhs regions.
  • Driving Factors of BA: The driving factors of BA exhibit regional variability. Globally, BA is primarily influenced by fuel availability (e.g., NDVI) and atmospheric dryness (e.g., VPD, Ta), while precipitation-related variables show limited influence. In the Tr-ds region, BA is also primarily promoted by hot and dry conditions combined with ample fuel, reflected by strong positive correlations with NDVI, Rs, and vapor pressure deficit, and negative correlations with SSM and RH. In contrast, BA in the Ar-fl region is strongly regulated by fuel limitations, with antecedent precipitation and NDVI emerging as key predictors. The Te-dhs region shows more complex interactions, with no single dominant factor, suggesting that multiple drivers and human influences may jointly shape fire regimes. In the Bo-hs region, surface dryness, as indicated by low surface soil moisture, is the primary limiting factor, while the role of meteorological variables remains secondary.
The research findings highlight the importance of incorporating region-specific drivers into fire prediction models. Considering spatial heterogeneity and fuel-climate interactions is critical for improving fire risk assessments under climate change. By advancing the understanding of the spatiotemporal dynamics and key influencing factors of global wildfires, this study provides valuable insights for enhancing predictive capabilities and developing targeted mitigation strategies to reduce the potential impacts of future wildfire activity.

Author Contributions

Conceptualization, Y.M.; investigation, A.S.; resources, Y.X., F.X., G.W. and Y.M.; writing—original draft preparation, A.S.; writing—review and editing, Y.X., F.X., G.W. and Y.M.; visualization, A.S.; supervision, Y.M.; funding acquisition, Y.M. All authors have read and agreed to the published version of the manuscript.

Funding

This research was funded by the National Basic Research Program of China (No. 2022YFF0801301). This research is also funded by the National Basic Research Program of China (No. 2020YFA0608201) and National Natural Science Foundation of China (No. 42005127).

Data Availability Statement

The FireCCILT11 dataset was developed within the ESA Climate Change Initiative (CCI) programme’s Fire_cci project. The data is freely available through the CCI Open Data Portal (https://climate.esa.int/en/data/#/dashboard, accessed on 2 August 2023). MSWX is available at https://www.gloh2o.org/mswx/ (accessed on 5 May 2021). ERA5 data can be downloaded from https://www.ecmwf.int/en/forecasts/datasets (accessed on 18 May 2021). MSWEP data can be downloaded from https://www.gloh2o.org/mswep/ (accessed on 16 May 2021). GLEAM data can be downloaded from https://www.gleam.eu/ (accessed on 10 November 2022). Global Vegetation Greenness (NDVI) from AVHRR GIMMS-3G+ can be downloaded at https://daac.ornl.gov/cgi-bin/dsviewer.pl?ds_id=2187 (accessed on 24 July 2023).

Conflicts of Interest

The authors declare no conflicts of interest.

References

  1. Grillakis, M.; Voulgarakis, A.; Rovithakis, A.; Seiradakis, K.D.; Koutroulis, A.; Field, R.D.; Kasoar, M.; Papadopoulos, A.; Lazaridis, M. Climate Drivers of Global Wildfire Burned Area. Environ. Res. Lett. 2022, 17, 045021. [Google Scholar] [CrossRef] [Scilit]
  2. Wu, C.; Venevsky, S.; Sitch, S.; Mercado, L.M.; Huntingford, C.; Staver, A.C. Historical and Future Global Burned Area with Changing Climate and Human Demography. One Earth 2021, 4, 517–530. [Google Scholar] [CrossRef] [Scilit]
  3. Parks, S.A.; Abatzoglou, J.T. Warmer and Drier Fire Seasons Contribute to Increases in Area Burned at High Severity in Western US Forests From 1985 to 2017. Geophys. Res. Lett. 2020, 47, e2020GL089858. [Google Scholar] [CrossRef] [Scilit]
  4. Cardil, A.; Rodrigues, M.; Ramirez, J.; de-Miguel, S.; Silva, C.A.; Mariani, M.; Ascoli, D. Coupled Effects of Climate Teleconnections on Drought, Santa Ana Winds and Wildfires in Southern California. Sci. Total Environ. 2021, 765, 142788. [Google Scholar] [CrossRef] [Scilit]
  5. Liu, G.; Li, J.; Ying, T.; Su, H.; Huang, X.; Yu, Y. Increasing Fire Weather Potential over Northeast China Linked to Declining Bering Sea Ice. Geophys. Res. Lett. 2023, 50, e2023GL105931. [Google Scholar] [CrossRef] [Scilit]
  6. Andela, N.; Morton, D.C.; Giglio, L.; Chen, Y.; van der Werf, G.R.; Kasibhatla, P.S.; DeFries, R.S.; Collatz, G.J.; Hantson, S.; Kloster, S.; et al. A Human-Driven Decline in Global Burned Area. Science 2017, 356, 1356–1362. [Google Scholar] [CrossRef] [Scilit] [PubMed]
  7. Yu, Y.; Mao, J.; Wullschleger, S.D.; Chen, A.; Shi, X.; Wang, Y.; Hoffman, F.M.; Zhang, Y.; Pierce, E. Machine Learning–Based Observation-Constrained Projections Reveal Elevated Global Socioeconomic Risks from Wildfire. Nat. Commun. 2022, 13, 1250. [Google Scholar] [CrossRef] [Scilit]
  8. Li, P.; Xiao, C.; Feng, Z.; Li, W.; Zhang, X. Occurrence Frequencies and Regional Variations in Visible Infrared Imaging Radiometer Suite (VIIRS) Global Active Fires. Glob. Change Biol. 2020, 26, 2970–2987. [Google Scholar] [CrossRef] [Scilit]
  9. Xiao, C.; Feng, Z.; Li, P. Active Fires Show an Increasing Elevation Trend in the Tropical Highlands. Glob. Change Biol. 2022, 28, 2790–2803. [Google Scholar] [CrossRef] [Scilit]
  10. Jolly, W.M.; Cochrane, M.A.; Freeborn, P.H.; Holden, Z.A.; Brown, T.J.; Williamson, G.J.; Bowman, D.M.J.S. Climate-Induced Variations in Global Wildfire Danger from 1979 to 2013. Nat. Commun. 2015, 6, 7537. [Google Scholar] [CrossRef] [Scilit]
  11. Forkel, M.; Dorigo, W.; Lasslop, G.; Chuvieco, E.; Hantson, S.; Heil, A.; Teubner, I.; Thonicke, K.; Harrison, S.P. Recent Global and Regional Trends in Burned Area and Their Compensating Environmental Controls. Environ. Res. Commun. 2019, 1, 051005. [Google Scholar] [CrossRef] [Scilit]
  12. Ichoku, C.; Ellison, L.T.; Willmot, K.E.; Matsui, T.; Dezfuli, A.K.; Gatebe, C.K.; Wang, J.; Wilcox, E.M.; Lee, J.; Adegoke, J.; et al. Biomass Burning, Land-Cover Change, and the Hydrological Cycle in Northern Sub-Saharan Africa. Environ. Res. Lett. 2016, 11, 095005. [Google Scholar] [CrossRef] [Scilit]
  13. Canadell, J.G.; Meyer, C.P.; Cook, G.D.; Dowdy, A.; Briggs, P.R.; Knauer, J.; Pepler, A.; Haverd, V. Multi-Decadal Increase of Forest Burned Area in Australia Is Linked to Climate Change. Nat. Commun. 2021, 12, 6921. [Google Scholar] [CrossRef] [Scilit]
  14. Shi, G.; Yan, H.; Zhang, W.; Dodson, J.; Heijnis, H.; Burrows, M. Rapid Warming Has Resulted in More Wildfires in Northeastern Australia. Sci. Total Environ. 2021, 771, 144888. [Google Scholar] [CrossRef] [Scilit] [PubMed]
  15. Hanes, C.C.; Wang, X.; Jain, P.; Parisien, M.-A.; Little, J.M.; Flannigan, M.D. Fire-Regime Changes in Canada over the Last Half Century. Can. J. For. Res. 2018, 49, 256–269. [Google Scholar] [CrossRef] [Scilit]
  16. Dobriyal, M.; Bijalwan, A. Forest Fire in Western Himalayas of India: A Review. N. Y. Sci. J. 2017, 10, 39–46. [Google Scholar]
  17. Kumar, S.; Kumar, A. Hotspot and Trend Analysis of Forest Fires and Its Relation to Climatic Factors in the Western Himalayas. Nat. Hazards 2022, 114, 3529–3544. [Google Scholar] [CrossRef] [Scilit] [PubMed]
  18. Marlon, J.R.; Bartlein, P.J.; Gavin, D.G.; Long, C.J.; Anderson, R.S.; Briles, C.E.; Brown, K.J.; Colombaroli, D.; Hallett, D.J.; Power, M.J.; et al. Long-Term Perspective on Wildfires in the Western USA. Proc. Natl. Acad. Sci. USA. 2012, 109, E535–E543. [Google Scholar] [CrossRef] [Scilit]
  19. Ren, L.; Yang, Y.; Wang, H.; Wang, P.; Yue, X.; Liao, H. Widespread Wildfires Over the Western United States in 2020 Linked to Emissions Reductions During COVID-19. Geophys. Res. Lett. 2022, 49, e2022GL099308. [Google Scholar] [CrossRef] [Scilit] [PubMed]
  20. McEvoy, D.J.; Pierce, D.W.; Kalansky, J.F.; Cayan, D.R.; Abatzoglou, J.T. Projected Changes in Reference Evapotranspiration in California and Nevada: Implications for Drought and Wildland Fire Danger. Earth’s Future 2020, 8, e2020EF001736. [Google Scholar] [CrossRef] [Scilit]
  21. Keeley, J.E.; Syphard, A.D. Large California Wildfires: 2020 Fires in Historical Context. Fire Ecol. 2021, 17, 22. [Google Scholar] [CrossRef] [Scilit]
  22. Liu, Y.; Stanturf, J.; Goodrick, S. Trends in Global Wildfire Potential in a Changing Climate. For. Ecol. Manag. 2010, 259, 685–697. [Google Scholar] [CrossRef] [Scilit]
  23. Giglio, L.; Boschetti, L.; Roy, D.P.; Humber, M.L.; Justice, C.O. The Collection 6 MODIS Burned Area Mapping Algorithm and Product. Remote Sens. Environ. 2018, 217, 72–85. [Google Scholar] [CrossRef] [Scilit]
  24. Tang, R.; Mao, J.; Jin, M.; Chen, A.; Yu, Y.; Shi, X.; Zhang, Y.; Hoffman, F.M.; Xu, M.; Wang, Y. Interannual Variability and Climatic Sensitivity of Global Wildfire Activity. Adv. Clim. Change Res. 2021, 12, 686–695. [Google Scholar] [CrossRef] [Scilit]
  25. Jones, M.W.; Abatzoglou, J.T.; Veraverbeke, S.; Andela, N.; Lasslop, G.; Forkel, M.; Smith, A.J.P.; Burton, C.; Betts, R.A.; van der Werf, G.R.; et al. Global and Regional Trends and Drivers of Fire Under Climate Change. Rev. Geophys. 2022, 60, e2020RG000726. [Google Scholar] [CrossRef] [Scilit]
  26. Luo, M.; Xie, W.; Li, D.; Wan, T.L. The Rising Threat of Wildfire: An Examination of Global Forest Fire Occurrence over the Past Two Decades. Int. Forest. Rev. 2024, 26, 224–233. [Google Scholar] [CrossRef] [Scilit]
  27. Bowman, D.M.J.S.; Kolden, C.A.; Abatzoglou, J.T.; Johnston, F.H.; Van Der Werf, G.R.; Flannigan, M. Vegetation Fires in the Anthropocene. Nat. Rev. Earth Environ. 2020, 1, 500–515. [Google Scholar] [CrossRef] [Scilit]
  28. Drobyshev, I.; Bergeron, Y.; de Vernal, A.; Moberg, A.; Ali, A.A.; Niklasson, M. Atlantic SSTs Control Regime Shifts in Forest Fire Activity of Northern Scandinavia. Sci. Rep. 2016, 6, 22532. [Google Scholar] [CrossRef] [Scilit]
  29. Harris, R.M.B.; Remenyi, T.A.; Williamson, G.J.; Bindoff, N.L.; Bowman, D.M.J.S. Climate–Vegetation–Fire Interactions and Feedbacks: Trivial Detail or Major Barrier to Projecting the Future of the Earth System? Wiley Interdiscip. Rev. Clim. Change 2016, 7, 910–931. [Google Scholar] [CrossRef] [Scilit]
  30. Abatzoglou, J.T.; Williams, A.P.; Boschetti, L.; Zubkova, M.; Kolden, C.A. Global Patterns of Interannual Climate–Fire Relationships. Glob. Change Biol. 2018, 24, 5164–5175. [Google Scholar] [CrossRef] [Scilit]
  31. Molinari, C.; Carcaillet, C.; Bradshaw, R.H.W.; Hannon, G.E.; Lehsten, V. Fire-Vegetation Interactions during the Last 11,000 Years in Boreal and Cold Temperate Forests of Fennoscandia. Quat. Sci. Rev. 2020, 241, 106408. [Google Scholar] [CrossRef] [Scilit]
  32. Scholten, R.C.; Jandt, R.; Miller, E.A.; Rogers, B.M.; Veraverbeke, S. Overwintering Fires in Boreal Forests. Nature 2021, 593, 399–404. [Google Scholar] [CrossRef] [Scilit] [PubMed]
  33. Lambert, A.; Lasslop, G.; Kloster, S. Wildfires in a Warmer Climate: Emission Fluxes, Emission Heights, and Black Carbon Concentrations in 2090–2099. J. Geophys. Res. Atmos. 2016, 121, 3195–3223. [Google Scholar] [CrossRef] [Scilit]
  34. Otón, G.; Lizundia-Loiola, J.; Pettinari, M.L.; Chuvieco, E. Development of a Consistent Global Long-Term Burned Area Product (1982–2018) Based on AVHRR-LTDR Data. Int. J. Appl. Earth Obs. Geoinf. 2021, 103, 102473. [Google Scholar] [CrossRef] [Scilit]
  35. Otón, G.; Ramo, R.; Lizundia-Loiola, J.; Chuvieco, E. Global Detection of Long-Term (1982–2017) Burned Area with AVHRR-LTDR Data. Remote Sens. 2019, 11, 2079. [Google Scholar] [CrossRef] [Scilit]
  36. Lizundia-Loiola, J.; Otón, G.; Ramo, R.; Chuvieco, E. A Spatio-Temporal Active-Fire Clustering Approach for Global Burned Area Mapping at 250 m from MODIS Data. Remote Sens. Environ. 2020, 236, 111493. [Google Scholar] [CrossRef] [Scilit]
  37. Chuvieco, E.; Mouillot, F.; van der Werf, G.R.; San Miguel, J.; Tanase, M.; Koutsias, N.; García, M.; Yebra, M.; Padilla, M.; Gitas, I.; et al. Historical Background and Current Developments for Mapping Burned Area from Satellite Earth Observation. Remote Sens. Environ. 2019, 225, 45–64. [Google Scholar] [CrossRef] [Scilit]
  38. Beck, H.E.; van Dijk, A.I.J.M.; Larraondo, P.R.; McVicar, T.R.; Pan, M.; Dutra, E.; Miralles, D.G. MSWX: Global 3-Hourly 0.1° Bias-Corrected Meteorological Data Including Near-Real-Time Updates and Forecast Ensembles. Bull. Am. Meteorol. Soc. 2022, 103, E710–E732. [Google Scholar] [CrossRef] [Scilit]
  39. Prévosto, B.; Helluy, M.; Gavinet, J.; Fernandez, C.; Balandier, P. Microclimate in Mediterranean Pine Forests: What Is the Influence of the Shrub Layer? Agric. For. Meteorol. 2020, 282–283, 107856. [Google Scholar] [CrossRef] [Scilit]
  40. Beck, H.E.; Pan, M.; Roy, T.; Weedon, G.P.; Pappenberger, F.; van Dijk, A.I.J.M.; Huffman, G.J.; Adler, R.F.; Wood, E.F. Daily Evaluation of 26 Precipitation Datasets Using Stage-IV Gauge-Radar Data for the CONUS. Hydrol. Earth Syst. Sci. 2019, 23, 207–224. [Google Scholar] [CrossRef] [Scilit]
  41. Wang, L.; Zhou, J.; Li, Y.; Sun, F.; Fu, G.; Li, X.; Sang, Y. A Worldwide Evaluation of Basin-Scale Evapotranspiration Estimates against the Water Balance Method. J. Hydrol. 2016, 538, 82–95. [Google Scholar] [CrossRef] [Scilit]
  42. Martens, B.; Miralles, D.; Lievens, H.; Fernández-Prieto, D.; Verhoest, N.E.C. Improving Terrestrial Evaporation Estimates over Continental Australia through Assimilation of SMOS Soil Moisture. Int. J. Appl. Earth Obs. Geoinf. 2016, 48, 146–162. [Google Scholar] [CrossRef] [Scilit]
  43. Bai, P.; Liu, X. Intercomparison and Evaluation of Three Global High-Resolution Evapotranspiration Products across China. J. Hydrol. 2018, 566, 743–755. [Google Scholar] [CrossRef] [Scilit]
  44. Zhu, W.; Tian, S.; Wei, J.; Jia, S.; Song, Z. Multi-Scale Evaluation of Global Evapotranspiration Products Derived from Remote Sensing Images: Accuracy and Uncertainty. J. Hydrol. 2022, 611, 127982. [Google Scholar] [CrossRef] [Scilit]
  45. Mao, Y.; Bai, J.; Wu, G.; Xu, L.; Yin, C.; Feng, F.; He, Y.; Zhang, Z.; Wang, K. Terrestrial Evapotranspiration Over China From 1982 to 2020: Consistency of Multiple Data Sets and Impact of Input Data. J. Geophys. Res. Atmos. 2024, 129, e2023JD039387. [Google Scholar] [CrossRef] [Scilit]
  46. Pinzon, J.E.; Pak, E.W.; Tucker, C.J.; Bhatt, U.S.; Frost, G.V.; Macander, M.J. Global Vegetation Greenness (NDVI) from AVHRR GIMMS-3G+, 1981–2022; NASA: Washington, DC, USA, 2023. [Google Scholar] [CrossRef]
  47. Senande-Rivera, M.; Insua-Costa, D.; Miguez-Macho, G. Spatial and Temporal Expansion of Global Wildland Fire Activity in Response to Climate Change. Nat. Commun. 2022, 13, 1208. [Google Scholar] [CrossRef] [Scilit] [PubMed]
  48. Giglio, L.; van der Werf, G.R.; Randerson, J.T.; Collatz, G.J.; Kasibhatla, P. Global Estimation of Burned Area Using MODIS Active Fire Observations. Atmos. Chem. Phys. 2006, 6, 957–974. [Google Scholar] [CrossRef] [Scilit]
  49. Diskin, M.H. Definition and Uses of the Linear Regression Model. Water Resour. Res. 1970, 6, 1668–1673. [Google Scholar] [CrossRef] [Scilit]
  50. The MathWorks Inc. MATLAB, Version: 9.9.0 (R2020b); The MathWorks Inc.: Natick, MA, USA, 2020. Available online: https://www.mathworks.com (accessed on 17 April 2022).
  51. Bond, W.J.; Keeley, J.E. Fire as a Global ‘Herbivore’: The Ecology and Evolution of Flammable Ecosystems. Trends Ecol. Evol. 2005, 20, 387–394. [Google Scholar] [CrossRef] [Scilit]
  52. Archibald, S.; Roy, D.P.; Van Wilgen, B.W.; Scholes, R.J. What Limits Fire? An Examination of Drivers of Burnt Area in Southern Africa. Glob. Change Biol. 2009, 15, 613–630. [Google Scholar] [CrossRef] [Scilit]
  53. Littell, J.S.; McKenzie, D.; Wan, H.Y.; Cushman, S.A. Climate Change and Future Wildfire in the Western United States: An Ecological Approach to Nonstationarity. Earth’s Future 2018, 6, 1097–1111. [Google Scholar] [CrossRef] [Scilit]
  54. Cahoon, D.R.; Stocks, B.J.; Levine, J.S.; Cofer, W.R.; O’Neill, K.P. Seasonal Distribution of African Savanna Fires. Nature 1992, 359, 812–815. [Google Scholar] [CrossRef] [Scilit]
  55. Van Der Werf, G.R.; Randerson, J.T.; Collatz, G.J.; Giglio, L. Carbon Emissions from Fires in Tropical and Subtropical Ecosystems. Glob. Change Biol. 2003, 9, 547–562. [Google Scholar] [CrossRef] [Scilit]
  56. Littell, J.S.; McKenzie, D.; Peterson, D.L.; Westerling, A.L. Climate and Wildfire Area Burned in Western U.S. Ecoprovinces, 1916–2003. Ecol. Appl. 2009, 19, 1003–1021. [Google Scholar] [CrossRef] [Scilit]
  57. Sousa, P.M.; Trigo, R.M.; Pereira, M.G.; Bedia, J.; Gutiérrez, J.M. Different Approaches to Model Future Burnt Area in the Iberian Peninsula. Agric. For. Meteorol. 2015, 202, 11–25. [Google Scholar] [CrossRef] [Scilit]
  58. Turco, M.; Von Hardenberg, J.; AghaKouchak, A.; Llasat, M.C.; Provenzale, A.; Trigo, R.M. On the Key Role of Droughts in the Dynamics of Summer Fires in Mediterranean Europe. Sci. Rep. 2017, 7, 81. [Google Scholar] [CrossRef] [Scilit]
  59. O, S.; Hou, X.; Orth, R. Observational Evidence of Wildfire-Promoting Soil Moisture Anomalies. Sci. Rep. 2020, 10, 11008. [Google Scholar] [CrossRef] [Scilit] [PubMed]
  60. Aldersley, A.; Murray, S.J.; Cornell, S.E. Global and Regional Analysis of Climate and Human Drivers of Wildfire. Sci. Total Environ. 2011, 409, 3472–3481. [Google Scholar] [CrossRef] [Scilit] [PubMed]
  61. Lasslop, G.; Kloster, S. Human Impact on Wildfires Varies between Regions and with Vegetation Productivity. Environ. Res. Lett. 2017, 12, 115011. [Google Scholar] [CrossRef] [Scilit]
  62. Flannigan, M.D.; Wotton, B.M.; Marshall, G.A.; de Groot, W.J.; Johnston, J.; Jurko, N.; Cantin, A.S. Fuel Moisture Sensitivity to Temperature and Precipitation: Climate Change Implications. Clim. Change 2016, 134, 59–71. [Google Scholar] [CrossRef] [Scilit]
  63. Descals, A.; Gaveau, D.L.A.; Verger, A.; Sheil, D.; Naito, D.; Peñuelas, J. Unprecedented Fire Activity above the Arctic Circle Linked to Rising Temperatures. Science 2022, 378, 532–537. [Google Scholar] [CrossRef] [Scilit] [PubMed]
  64. Krawchuk, M.A.; Moritz, M.A.; Parisien, M.-A.; Van Dorn, J.; Hayhoe, K. Global Pyrogeography: The Current and Future Distribution of Wildfire. PLoS ONE 2009, 4, e5102. [Google Scholar] [CrossRef] [Scilit] [PubMed]
  65. Giglio, L.; Roy, D.P. Satellite Artifacts Modulate FireCCILT11 Global Burned Area. Nat. Commun. 2024, 15, 2079. [Google Scholar] [CrossRef] [Scilit]
  66. Giglio, L.; Roy, D.P. Assessment of Satellite Orbit-Drift Artifacts in the Long-Term AVHRR FireCCILT11 Global Burned Area Data Set. Sci. Remote Sens. 2022, 5, 100044. [Google Scholar] [CrossRef] [Scilit]
  67. Krawchuk, M.A.; Moritz, M.A. Constraints on Global Fire Activity Vary across a Resource Gradient. Ecology 2011, 92, 121–132. [Google Scholar] [CrossRef] [Scilit]
  68. Moritz, M.A.; Parisien, M.-A.; Batllori, E.; Krawchuk, M.A.; Van Dorn, J.; Ganz, D.J.; Hayhoe, K. Climate Change and Disruptions to Global Fire Activity. Ecosphere 2012, 3, 1–22. [Google Scholar] [CrossRef] [Scilit]
  69. Su, H.; Yu, Y.; Guo, W.; Mao, J. Convective Potential and Fuel Availability Complement Near-Surface Weather in Regulating Global Wildfire Activity. Sci. Adv. 2025, 11, eadp7765. [Google Scholar] [CrossRef] [Scilit]
  70. Keeley, J.E.; Guzman-Morales, J.; Gershunov, A.; Syphard, A.D.; Cayan, D.; Pierce, D.W.; Flannigan, M.; Brown, T.J. Ignitions Explain More than Temperature or Precipitation in Driving Santa Ana Wind Fires. Sci. Adv. 2021, 7, eabh2262. [Google Scholar] [CrossRef] [Scilit]
  71. Cardil, A.; Rodrigues, M.; Tapia, M.; Barbero, R.; Ramírez, J.; Stoof, C.R.; Silva, C.A.; Mohan, M.; de-Miguel, S. Climate Teleconnections Modulate Global Burned Area. Nat. Commun. 2023, 14, 427. [Google Scholar] [CrossRef] [Scilit] [PubMed]
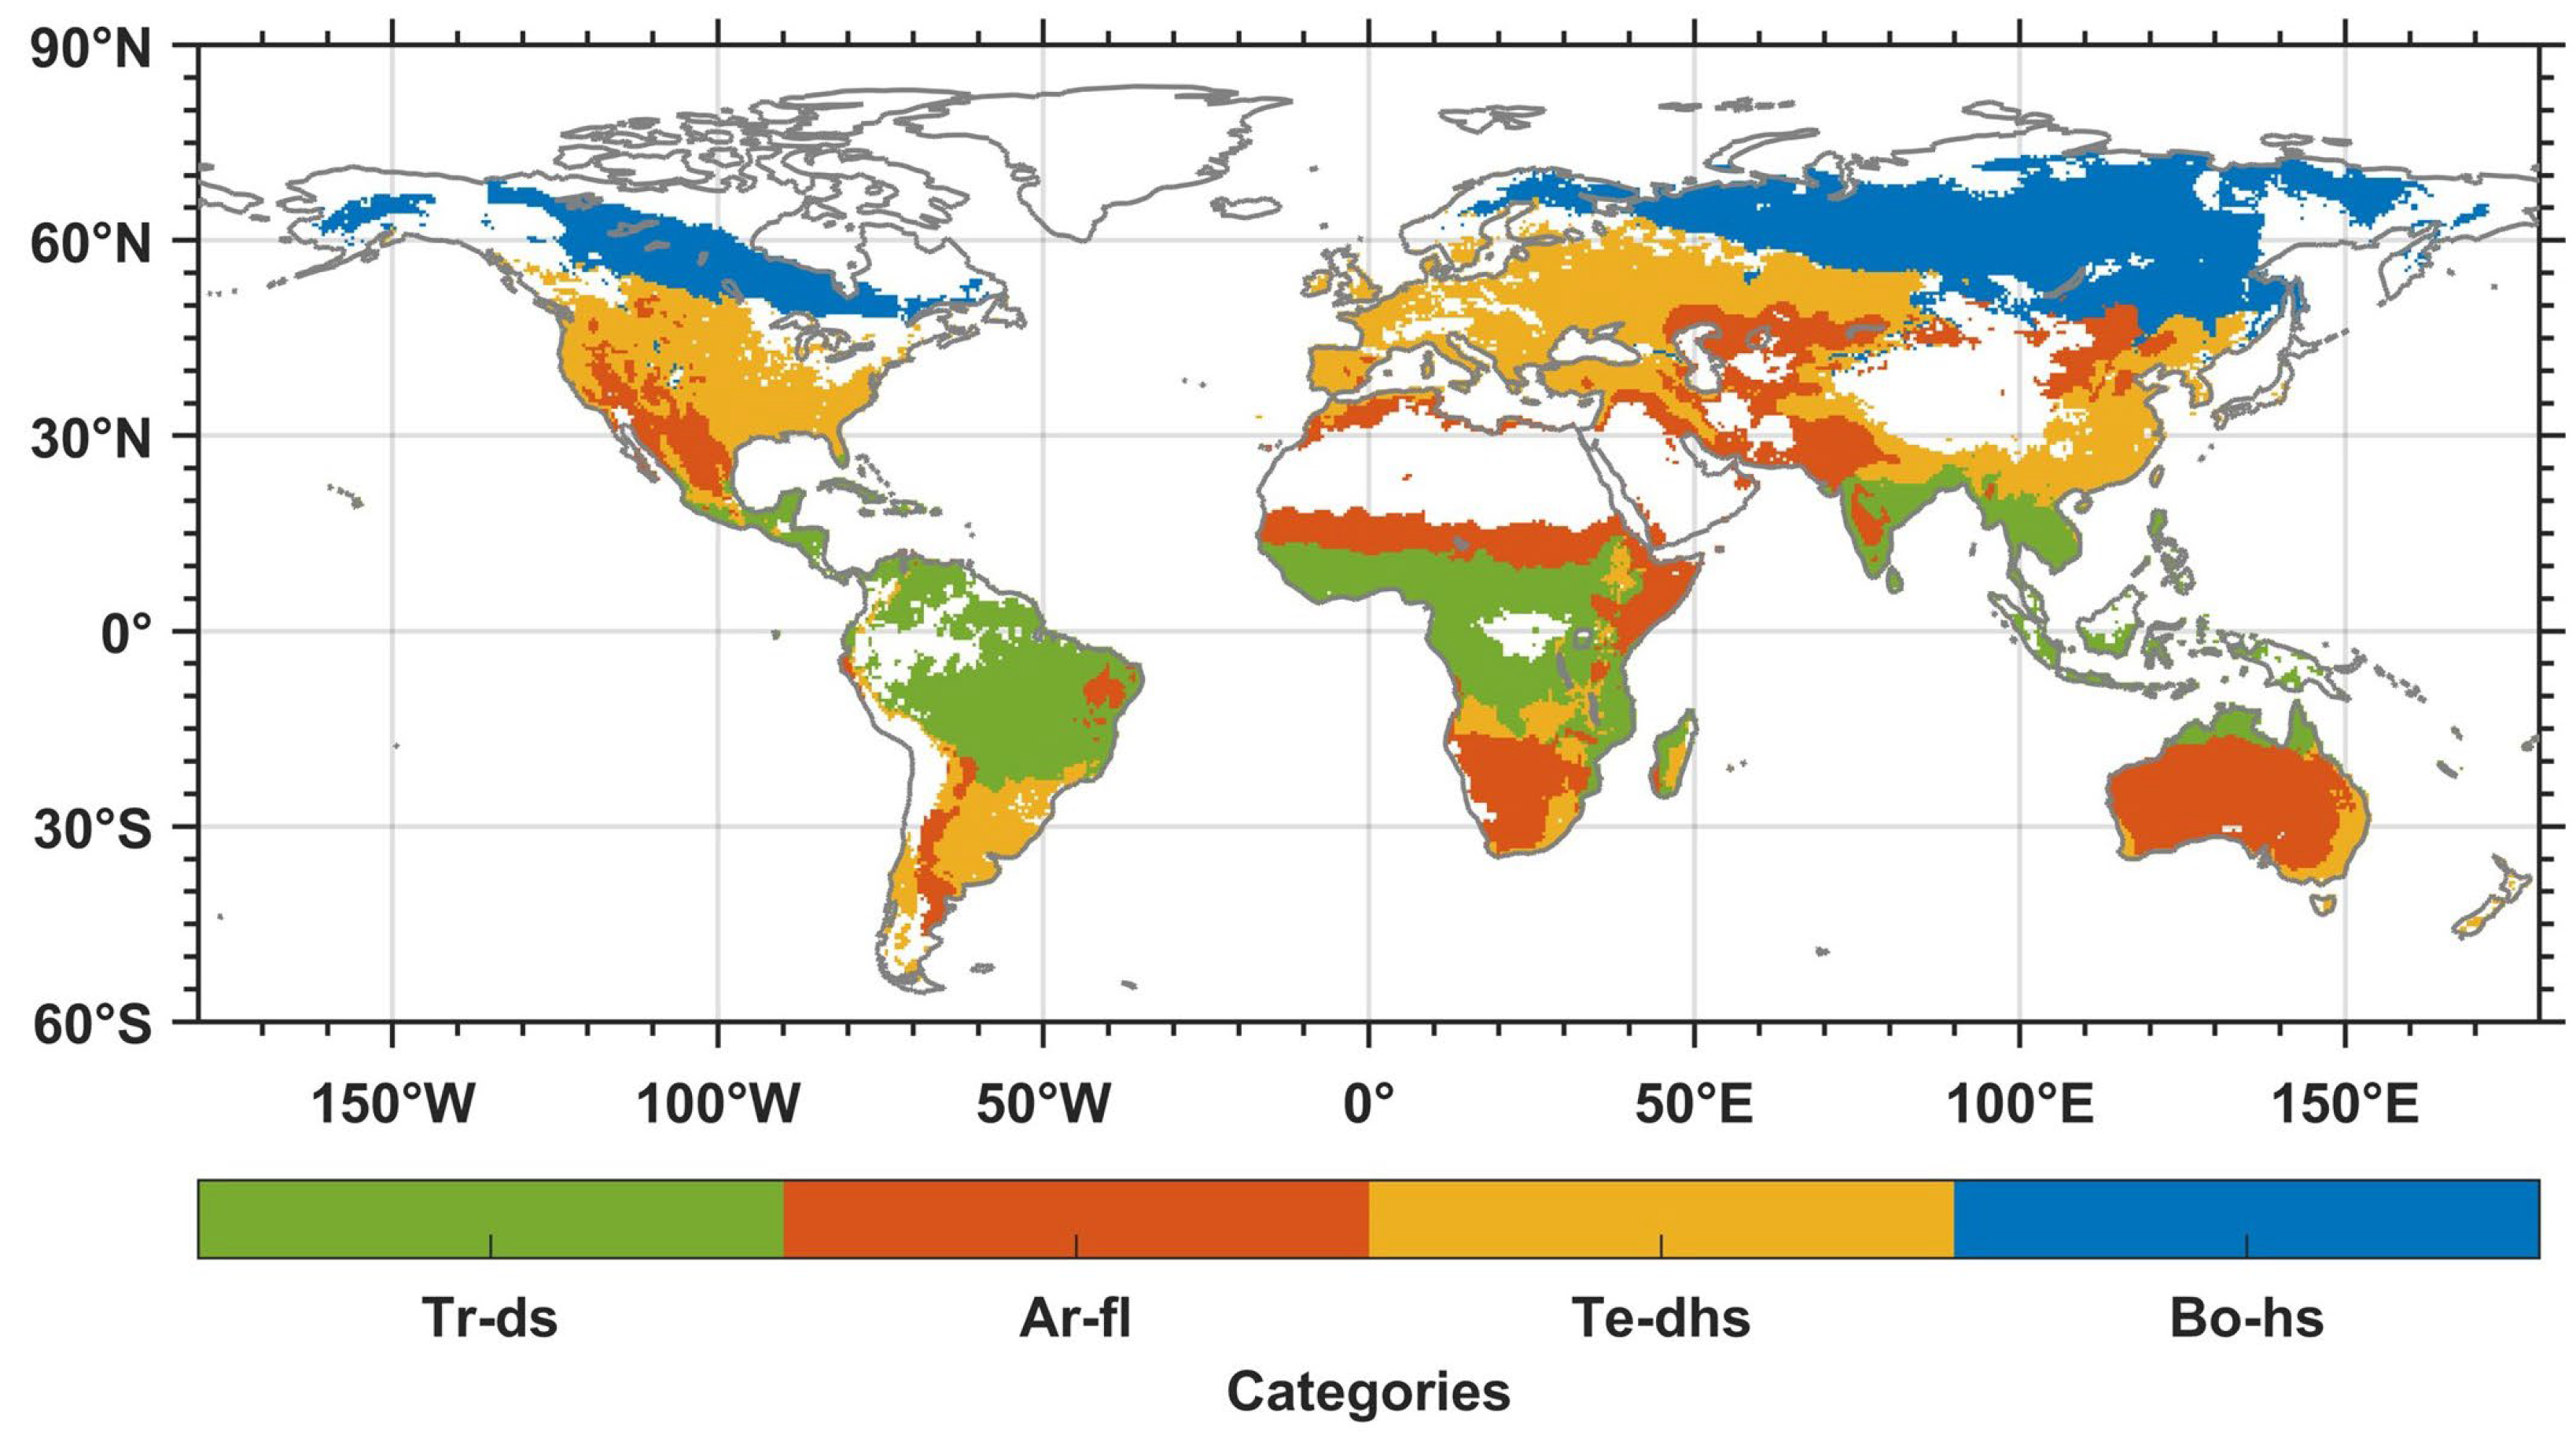
Figure 1. Fire-prone region classification. Tropical dry season fires (Tr-ds), Arid fuel-limited fires (Ar-fl), Temperate dry and hot season fires (Te-dhs), and Boreal hot season fires (Bo-hs).
Remotesensing 18 00262 g001
Figure 2. (a) Spatial distribution of the global multi-year average BA from 1982 to 2018, with longitudinal and latitudinal sums calculated at 0.25° intervals. (b) The range of annual BA for global and regional fire-climate categories from 1982 to 2018 (excluding outliers). (c) Monthly average and range of burned area from 1982 to 2018 for the global and fire-climate regions. In the box plots (b,c), the whiskers represent the minimum and maximum values, the box edges represent the 25th and 75th percentiles, and the horizontal line inside the box represents the 50th percentile. In (c), the solid circles inside and outside the box represent the mean and outliers, respectively.
Remotesensing 18 00262 g002
Figure 3. (a) Spatial distribution of long-term trends in the global burned area from 1982 to 2018. (b) The range of the burned area trends at the grid scale for the global and four fire-climate regions from 1982 to 2018 (excluding outliers). The whiskers represent the minimum and maximum values, the box edges represent the 25th and 75th percentiles, and the horizontal line inside the box represents the 50th percentile. (c) Time series and corresponding trends of annual burned area from 1982 to 2018 globally and in four fire-climate zones, accompanied by statistical significance analyses. “*” indicates statistical significance at the 95% confidence level (p < 0.05).
Remotesensing 18 00262 g003
Figure 4. Relationship between burned area and different influencing factors on a global scale. The influencing factors include: (a) P (current-year precipitation), (b) AP (previous-year precipitation), (c) SSM (surface soil moisture), (d) RH (relative humidity), (e) WS (wind speed), (f) Rs (solar radiation), (g) Ta (air temperature), (h) VPD (atmospheric saturation vapor pressure deficit), (i) NDVI (normalized difference vegetation index), and (j) ET (evapotranspiration). Scatter points represent the annual burned area and annual mean values for each factor; the dashed line denotes the linear relationship between the two variables, and the shaded area indicates the 95% confidence interval of the fitting line. The Pearson correlation coefficient is shown in each subplot title where “*” denotes a statistically significant correlation.
Remotesensing 18 00262 g004
Figure 5. Relationship between burned area and different influencing factors for the Tr-ds region. The influencing factors are consistent with those in Figure 4: (a) P, (b) AP, (c) SSM, (d) RH, (e) WS, (f) Rs, (g) Ta, (h) VPD, (i) NDVI, and (j) ET. Scatter points represent the annual burned area and annual mean values of each factor; the dashed line denotes the linear relationship between the two variables, and the shaded area indicates the 95% confidence interval of the fitting line. The Pearson correlation coefficient is shown in each subplot title, where “*” denotes a statistically significant correlation.
Remotesensing 18 00262 g005
Figure 6. Relationship between burned area and different influencing factors for the Ar-fl region. The influencing factors are consistent with those in Figure 4: (a) P, (b) AP, (c) SSM, (d) RH, (e) WS, (f) Rs, (g) Ta, (h) VPD, (i) NDVI, and (j) ET. Scatter points represent the annual burned area and annual mean values of each factor; the dashed line denotes the linear relationship between the two variables, and the shaded area indicates the 95% confidence interval of the fitting line. The Pearson correlation coefficient is shown in each subplot title, where “*” denotes a statistically significant correlation.
Remotesensing 18 00262 g006
Figure 7. Relationship between burned area and different influencing factors for the Te-dhs region. The influencing factors are consistent with those in Figure 4: (a) P, (b) AP, (c) SSM, (d) RH, (e) WS, (f) Rs, (g) Ta, (h) VPD, (i) NDVI, and (j) ET. Scatter points represent the annual burned area and annual mean values of each factor; the dashed line denotes the linear relationship between the two variables, and the shaded area indicates the 95% confidence interval of the fitting line. The Pearson correlation coefficient is shown in each subplot title, where “*” denotes a statistically significant correlation.
Remotesensing 18 00262 g007
Figure 8. Relationship between burned area and different influencing factors for the Bo-hs region. The influencing factors are consistent with those in Figure 4: (a) P, (b) AP, (c) SSM, (d) RH, (e) WS, (f) Rs, (g) Ta, (h) VPD, (i) NDVI, and (j) ET. Scatter points represent the annual burned area and annual mean values of each factor; the dashed line denotes the linear relationship between the two variables, and the shaded area indicates the 95% confidence interval of the fitting line. The Pearson correlation coefficient is shown in each subplot title, where “*” denotes a statistically significant correlation.
Remotesensing 18 00262 g008
Disclaimer/Publisher’s Note: The statements, opinions and data contained in all publications are solely those of the individual author(s) and contributor(s) and not of MDPI and/or the editor(s). MDPI and/or the editor(s) disclaim responsibility for any injury to people or property resulting from any ideas, methods, instructions or products referred to in the content.