Article

Long-Term Time-Series Dynamics of Lake Water Storage on the Qinghai–Tibet Plateau via Multi-Source Remote Sensing and DEM-Based Underwater Bathymetry Reconstruction


1
Laboratory of Water Ecological Management and Protection in River Source Areas, Ministry of Water Resources, Xining 810016, China
2
State Key Laboratory of Plateau Ecology and Agriculture, Qinghai University, Xining 810016, China
3
State Key Laboratory of Water Resources Engineering and Management, Wuhan University, Wuhan 430072, China
4
Xining Natural Resources Comprehensive Survey Center, China Geological Survey, Xining 810021, China
*
Author to whom correspondence should be addressed.
Remote Sens. 2026, 18(2), 225; https://doi.org/10.3390/rs18020225
Submission received: 16 October 2025 / Revised: 27 December 2025 / Accepted: 3 January 2026 / Published: 9 January 2026

Highlights

What are the main findings?
  • A method for estimating absolute lake water storage based solely on DEM data.
  • A long-term (1990–2021) water storage dataset for 120 lakes on the Qinghai–Tibet Plateau.
What are the implications of the main findings?
  • Filling the data gap in absolute water storage monitoring for the region.
  • Providing technical reference and methodological guidance for lake monitoring in other remote areas worldwide.

Abstract

Lakes on the Qinghai–Tibet Plateau are important indicators of global climate change, and variations in their water storage strongly influence regional hydrological cycles and ecosystems. However, existing studies have largely focused on relative changes in lake volume, while the precise quantification of absolute water storage remains insufficient, largely due to the lack of long-term, high-accuracy water storage time series. Constrained by harsh natural conditions and limited in situ observations, conventional approaches struggle to achieve the accurate long-term monitoring of lake water storage across the Plateau. To address this challenge, we propose a DEM-based underwater topography extrapolation method. Under the assumption of continuity between surrounding onshore terrain and submerged lakebed morphology, nearshore DEM data are extrapolated to reconstruct lake bathymetry. By integrating multi-source remote sensing observations of lake area and water level, we estimate and reconstruct 30-year absolute water storage time series for 120 Plateau lakes larger than 50 km2. This method does not require measured water depth data and is particularly suitable for data-scarce, topographically complex, high-altitude lake regions, effectively overcoming key limitations of conventional methods used for absolute water storage monitoring. Validation shows strong agreement between our estimates and an independent validation dataset, with an overall correlation coefficient of 0.95; the reconstructed time series are highly reliable, with correlation coefficients exceeding 0.6. During the study period, the total lake water storage of the Qinghai–Tibet Plateau exhibited a significant increasing trend, with a cumulative growth of approximately 137.297 billion m3, representing a 20.73% increase, and showing notable spatial heterogeneity. The water storage dataset constructed in this study provides reliable data support for research on water cycles, climate change assessment, and regional water resource management on the Qinghai–Tibet Plateau.

1. Introduction

Lakes are vital freshwater reservoirs on Earth, accounting for 95% of the planet’s surface liquid freshwater resources [1]. As crucial components of global water resources, they play an essential role in climate regulation and the hydrological cycle. Located in the heart of the Eurasian continent, the Qinghai–Tibet Plateau is the source region of many major rivers in China and Southeast Asia [2]. The Qinghai–Tibet Plateau hosts the world’s highest-elevation inland lake system, with the highest number of lakes and the largest total lake area, making it one of the most lake-dense regions in China [3]. In recent decades, global warming has been accelerating, and climate change in the Qinghai–Tibet Plateau is particularly pronounced [4,5]. Increasing precipitation and the accelerated melting of glaciers and permafrost [6] have led to significant changes in lakes across the Plateau. Such variations inevitably affect local populations and surrounding infrastructure [7], while the increase in lake water volume also heightens the risk of dam failure.
Since the 19th century, scientists have been observing and investigating changes in lake water volume on the Qinghai–Tibet Plateau. Early exploratory expeditions and subsequent large-scale scientific surveys provided foundational datasets for lake studies in this region and revealed the high sensitivity of Plateau lakes to climate variability. Over recent decades, both in situ observations and multi-source remote sensing records consistently indicate that, under climate change, lake area and water storage across the Plateau have been rapidly expanding. It is projected that, by 2100, the total area of inland lakes may increase by more than 50% [8,9]. Studies of large lakes such as Nam Co and Selin Co further show sustained increases in lake water volume in recent decades [10,11]. This widespread trend is generally attributed to the combined effects of increased precipitation under a warming climate, glacier retreat, and accelerated permafrost thaw [12]. Such changes not only reshape regional water cycling and ecosystem stability but also amplify potential hazards, including glacial lake outburst floods and other flood risks [13]. However, a key limitation remains in the existing research: most studies quantify only relative changes in lake water volume rather than absolute lake water storage. This limitation primarily arises because acquiring high-accuracy, spatially continuous bathymetric data over large areas is still challenging, even though such information is essential for converting observed lake level and area into absolute water storage. In this context, using Digital Elevation Models (DEMs) is a potentially effective method for lake volume estimation [14].
The accurate estimation of absolute lake water storage requires joint information on lake water level, lake area, and underwater topography [15]. Currently, satellite altimetry (e.g., ICESat and CryoSat-2) provides the principal means of monitoring Plateau lake levels, and multiple lake-level products have been developed [16]. Techniques for extracting lake area are also well established; based on Landsat and other optical imagery, several long-term lake area datasets have been produced [17]. By contrast, obtaining underwater topography remains the major bottleneck. It is extremely difficult to conduct conventional boat-based surveys for the Plateau’s vast and often inaccessible lakes [18]. Remote sensing alternatives are available but have clear limitations: spectral bathymetry is only applicable to shallow, clear waters, with a typical maximum penetration depth of <30 m and strong dependence on water clarity [19,20]; synthetic aperture radar (SAR) approaches are susceptible to environmental noise and therefore have limited applicability [21,22]; and although recent machine learning advances show promise, they still require large training datasets [23,24,25]. Consequently, due to the lack of high-precision and spatially continuous depth data, most existing studies remain restricted to estimating relative lake volume changes, leaving a significant gap in long-term, lake-specific absolute water storage monitoring across the Qinghai–Tibet Plateau.
Moreover, Digital Elevation Models (DEMs) provide valuable terrain information around lakes, such as slope, aspect, lake boundaries, and water surface elevation. By exploring the relationships between exposed topography and underwater morphology, the submerged terrain can be extrapolated to estimate lake volume. In this process, the initial conditions for the extrapolated terrain are defined by the water surface elevation together with the lake boundary, while the slope and aspect are directly incorporated into the model as key parameters for profile fitting. In single-lake studies, extrapolating surrounding slope and elevation parameters into the lake basin proves effective and data-efficient, particularly for data-scarce regions such as the Qinghai–Tibet Plateau. Therefore, this study developed a DEM-based underwater terrain extrapolation model, integrating multi-source remote sensing data to reconstruct 30-year lake water storage sequences across the Plateau. Validation was conducted at individual lake scales, aiming to address the scarcity of hydrological observations. The results provide crucial data for understanding water cycle processes, glacier–lake interactions, and their responses to climate change.

2. Study Area

The Qinghai–Tibet Plateau, located in central Asia, stretches from the Himalayas in the south to the Kunlun, Altun, and Qilian Mountains in the north, bounded by the Pamirs and Karakoram Mountains in the west and connecting with the Qinling and Loess Plateau to the east and northeast. Known as the “Roof of the World,” it is hailed as the “Third Pole of the Earth” [26,27,28]. The region has an average elevation above 4000 m, complex geological structures, and harsh climatic and environmental conditions [29]. Due to its rugged terrain, severe climate, and sparse population, human activities are minimal, and most lakes remain in their natural state, responding sensitively to climate variations. Limited by natural conditions, most lakes cannot be effectively monitored by conventional surface water methods [30,31].
The Plateau is densely covered with lakes—over 1400 with areas exceeding 1 km2—covering a total of approximately 50,000 km2 (Figure 1), which accounts for about 50% of China’s total lake area. Many major Asian rivers originate from this region, supplying water to more than one billion people living downstream and earning the Plateau the title of “Asia’s Water Tower” [32,33]. Plateau lakes constitute a critical component of surface water resources and play an essential role in sustaining regional climate regulation and ecosystem functioning [34]. They also serve as a key nexus linking the atmosphere, hydrosphere, and cryosphere (e.g., glaciers, snow cover, and permafrost) [35]. Most lakes on the Qinghai–Tibet Plateau are situated in large valleys or intermontane basins aligned parallel to major mountain ranges, whereas medium-sized lakes such as glacial and landslide-dammed lakes are mainly distributed in canyon regions. Endorheic lakes are concentrated in the interior of the Plateau, while exorheic freshwater lakes occur primarily in the outflow regions of the Yangtze, Yellow, and Yarlung Tsangpo river basins [36]. Variations in lake water volume not only reflect changes in surface water balance but also provide indicators of the coupled effects of precipitation, evaporation, and surface–groundwater interactions [37,38,39]. Changes in lake water storage across the Qinghai–Tibet Plateau essentially represent an integrated response of regional hydrological processes to climate change. These changes are governed by the balance among several key components: replenishment dominated by precipitation, water loss dominated by evaporation, and additional runoff contributions from glacier retreat and permafrost thaw. Under ongoing global warming, precipitation regimes across the Plateau have shifted, while rising temperatures have accelerated glacier melt and permafrost degradation, jointly increasing runoff inputs to lakes. Meanwhile, although evaporation has also intensified, many inland basins exhibit a net increase in water gain, driving widespread lake expansion. Understanding the complex interactions among these drivers and their pronounced spatial heterogeneity is central to elucidating the climate–lake linkages on the Plateau.

3. Data Sources

3.1. DEM Data

This study used the SRTM DEM V3 dataset with a spatial resolution of 90 m provided by the United States Geological Survey (USGS) (data source: https://earthexplorer.usgs.gov/ (accessed on 3 July 2025)). The 30 m DEM, while capable of depicting finer nearshore terrain features such as small gullies, gravel beaches, and local scarps—thereby improving lake boundary delineation at local scales—tends to introduce notable vertical spatial noise for bathymetric inversion and water volume estimation of large lakes. Such noise will cause irregular localized fluctuations in the water level–area relationship, thereby obscuring the extraction of overall lake topographic trends. In contrast, the 90 m resolution DEM inherently smooths these localized terrain details while preserving the integrity of the lacustrine landscape, effectively serving as a pre-applied spatial filter tailored for trend analysis, thereby contributing to more stable simulation of macroscale topographic changes. Moreover, increasing the resolution from 90 m to 30 m would substantially increase data volume and computational cost, posing a considerable burden on long-term, multi-lake, large-scale simulations. Hence, adopting a 90 m resolution is a scientifically balanced choice that balances trend reliability, computational feasibility, and regional processing efficiency. In terms of accuracy, numerous studies have demonstrated that SRTM DEM performs well in the complex terrain of the Qinghai–Tibet Plateau, exhibiting good vertical accuracy [40]. Specifically, this dataset shows relatively low root mean square error at the Plateau scale with limited data voids, and its suitability for terrain analysis and hydrological modeling has been widely recognized [41,42].

3.2. Remote Sensing Data

The vector boundary data of lakes used in this study were obtained from the National Tibetan Plateau Data Center, based on a dataset extracted by Zhang [43] through the visual interpretation of GeoCover Landsat mosaic 2000 imagery. The dataset delineates the boundaries of all visible lakes within the study region in 2000. It was primarily used to identify the spatial locations of individual lakes and to provide a spatial reference extent for extracting surrounding terrain in subsequent analyses.
The lake water level variation series were integrated from two independent multi-source satellite altimetry datasets. The first dataset, developed by Peng [44], is based on ICESat, CryoSat-2, Sentinel-3, and ICESat-2 data, where the lake levels of 161 lakes larger than 50 km2 across the Qinghai–Tibet Plateau from 2003 to 2020 were retrieved using a waveform retracking algorithm. The second dataset, provided by Xu [45], contains data from 2010 to 2020, integrating observations of CryoSat-2, ICESat-2, and Sentinel-3A/3B satellites, stored in a text format.
The lake area variation series were derived from a dataset constructed by Qi [46] on the Google Earth Engine platform using Landsat 5/7/8 imagery. Based on NDWI water body identification, combined with Canny edge detection and Otsu adaptive thresholding, a “global–local” optimization strategy was employed to achieve the accurate extraction of lake area changes across the Qinghai–Tibet Plateau over the past three decades.

3.3. Validation Data

Changes in lake water volume are difficult to obtain through direct observation and must be indirectly estimated using other measurable hydrological variables. To verify the reliability of the long-term lake water storage series constructed in this study, three independent datasets were used for cross-validation. All validation data were obtained from the National Tibetan Plateau Data Center (https://data.tpdc.ac.cn/home (accessed on 22 July 2025)), specifically including the following data:
(1) A dataset of lake water volume changes on the Qinghai–Tibet Plateau (1976–2020) derived from satellite stereo imagery and multispectral inversion by Zhang [47,48], covering lakes with an area greater than 1 km2 and providing water volume change data at five-year intervals, hereinafter referred to as “Dataset I”;
(2) A dataset published by Pang [49] on interannual variations in lake area and water volume across different regions of the Qinghai–Tibet Plateau (1976–2019), including 20 lakes larger than 100 km2, with data gaps between 1978 and 1985, hereinafter referred to as “Dataset II”;
(3) A simulated lake water storage dataset constructed by Han [50,51] based on ICESat-2 laser altimetry data and a self-affine theoretical empirical equation, covering estimated water storage results of 2022 for lakes larger than 0.01 km2 on the Plateau, hereinafter referred to as “Dataset III.”
In subsequent analyses, the terms “Dataset I/II/III” will uniformly refer to the three datasets mentioned above.

4. Method for Constructing Lake Water Storage Series

4.1. Underwater Topography Construction

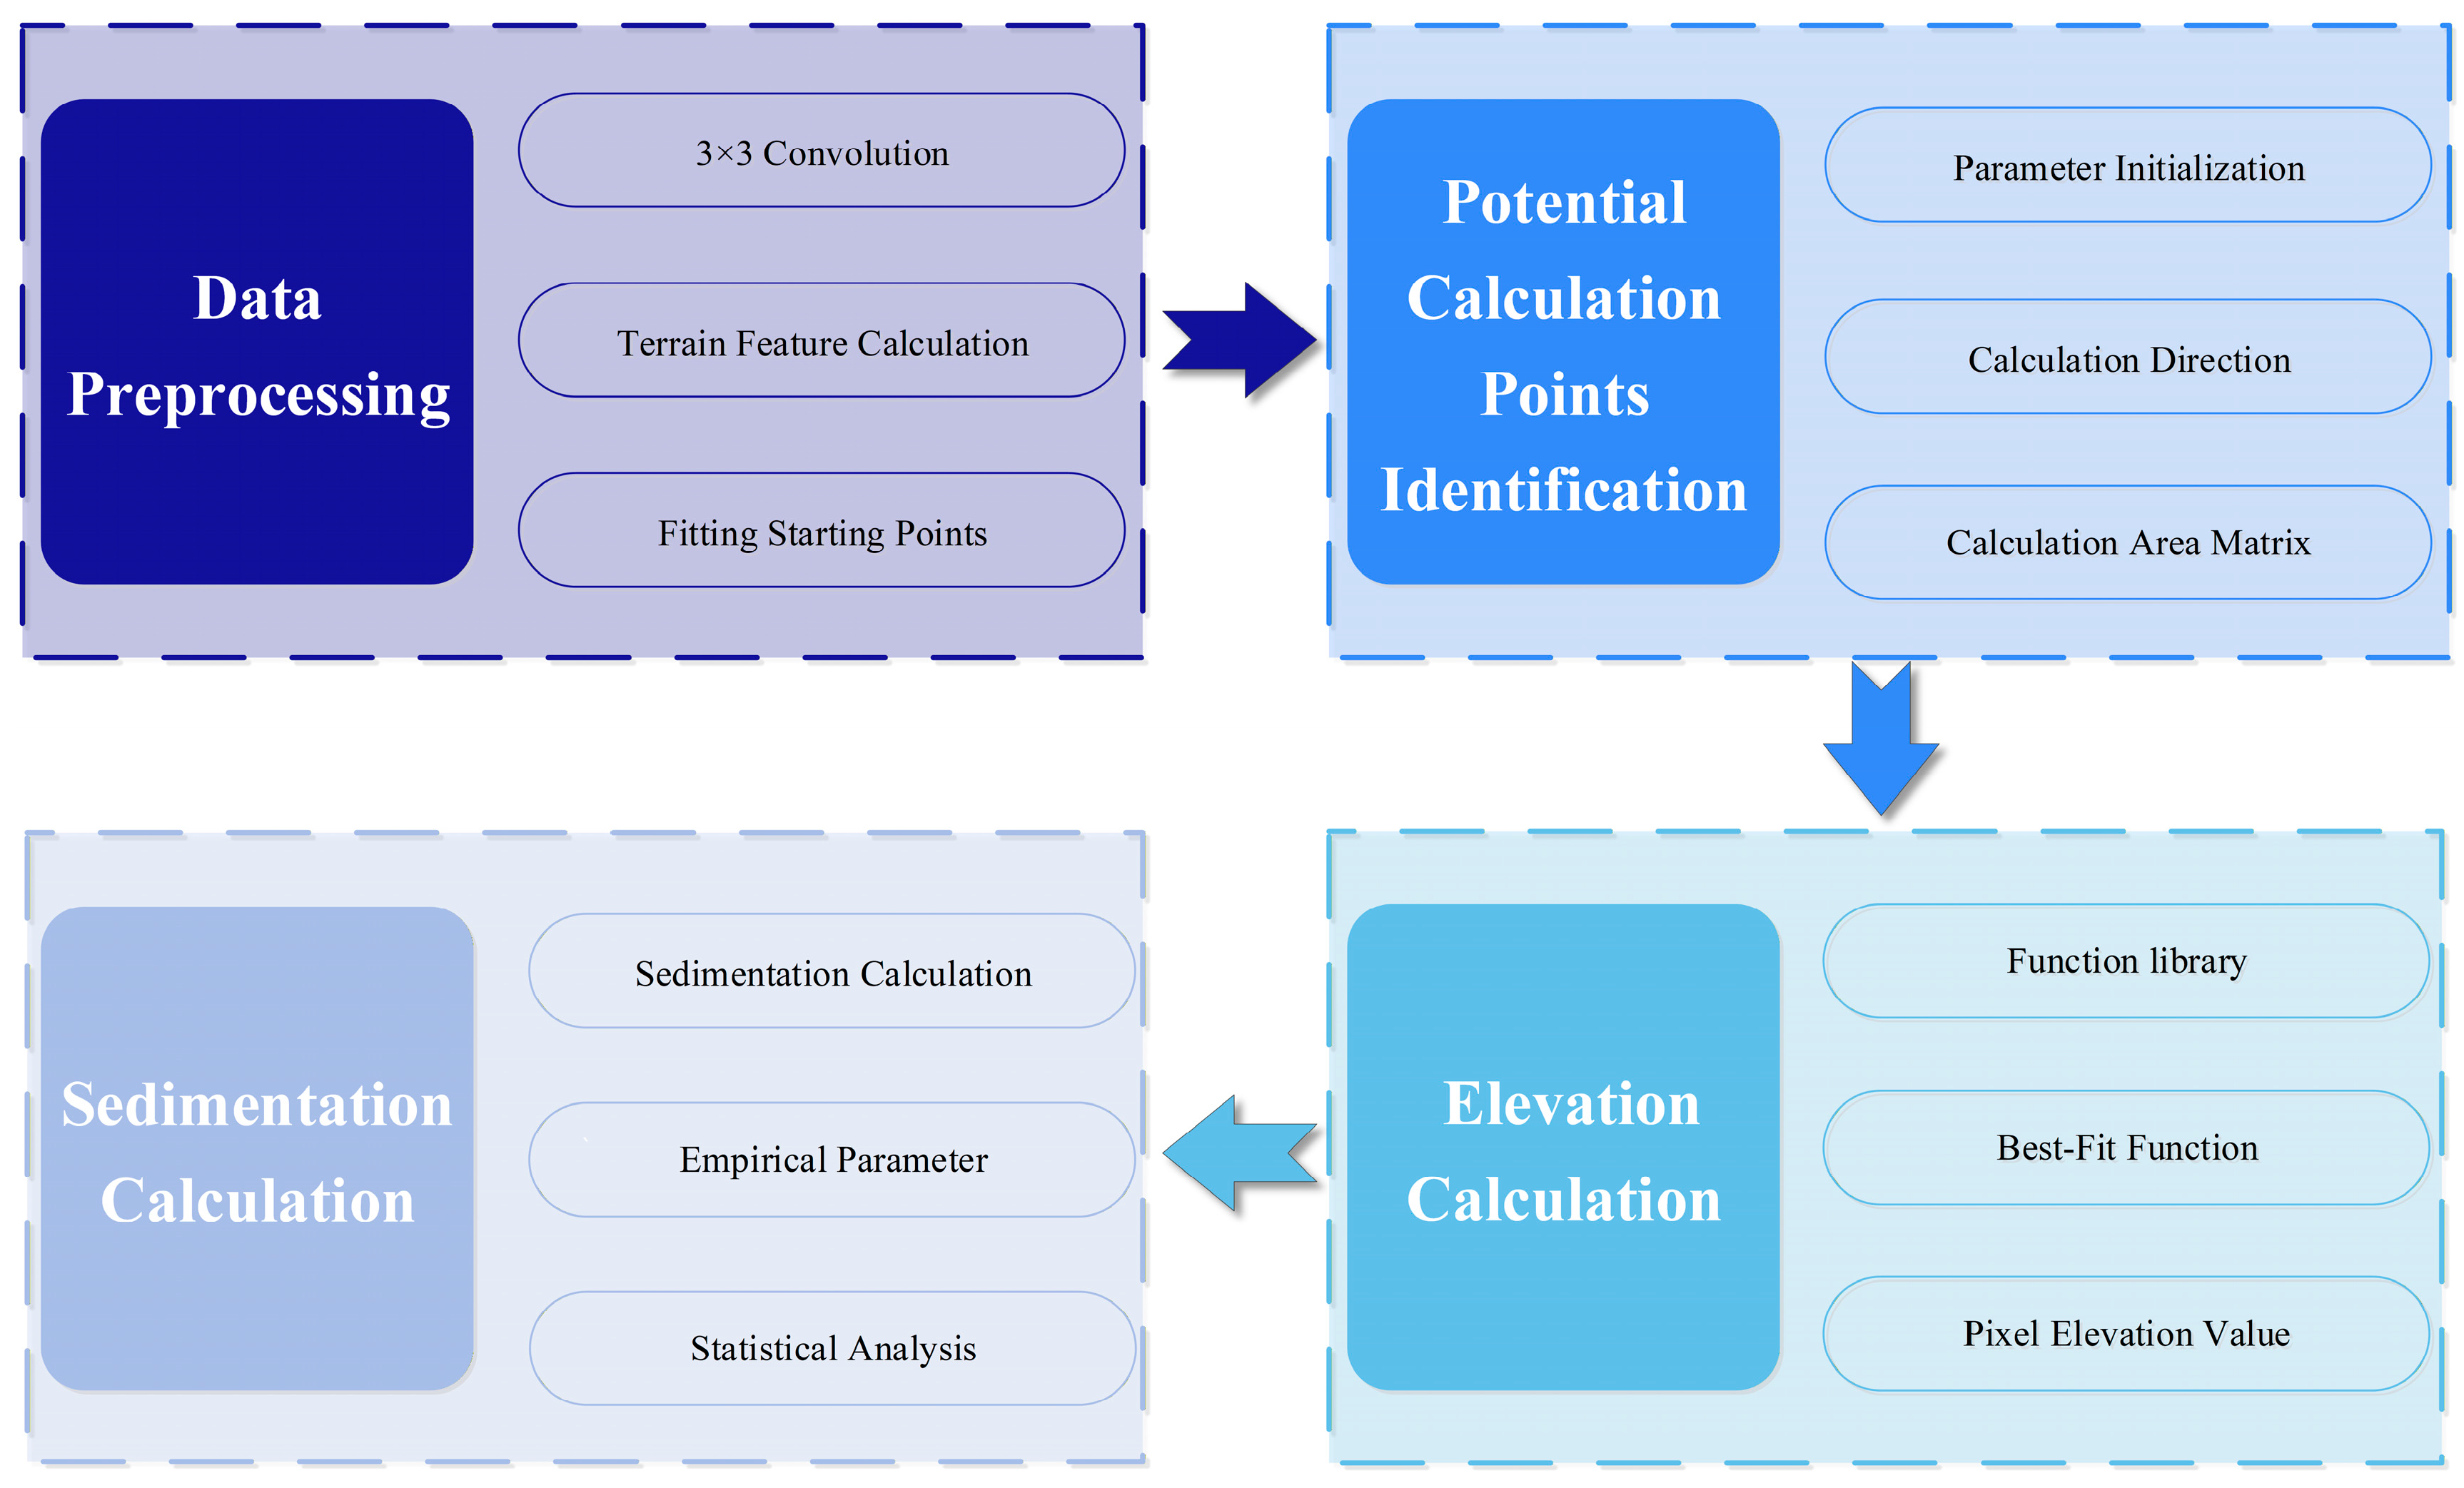
Lake basin morphology is typically controlled by the combined effects of regional tectonics, long-term erosion, and sedimentation, which collectively shape geomorphic features with inherent continuity across the basin and its surrounding areas. Based on this principle of geological continuity, lake bathymetry can be regarded as an extension of the surrounding terrestrial topography. However, owing to the harsh environmental conditions and limited observational capacity on the Qinghai–Tibet Plateau, most lakes lack sufficient in situ depth measurements to provide effective constraints, making direct extrapolation subject to considerable uncertainty. To ensure the physical plausibility of extrapolated results, appropriate constraints and a robust mathematical framework are required. Accordingly, building on the theoretical premise proposed by Zhu [52] that “the surrounding terrestrial topography of a lake can serve as a predictor for water depth,” this study develops a DEM-only underwater topography extrapolation model. The method does not rely on large amounts of field data and thus exhibits strong applicability in data-scarce regions, particularly on the Qinghai–Tibet Plateau. It introduces reasonable mathematical mechanisms to adapt to spatial heterogeneity and designs dynamic fitting strategies that can capture local terrain changes. Therefore, in the absence of measured water depth control points, the model can also make reasonable inferences about the underwater terrain. The model consists of four main steps—data preprocessing, the identification of potential calculation points, elevation calculation, and sediment correction—ultimately producing a digital bathymetric model for each lake. The specific computational workflow is illustrated in Figure 2.
(1)
Data Preprocessing
The data preprocessing stage includes the following key steps: binary water–land matrix segmentation, 3 × 3 convolution, buffer zone clipping, terrain feature calculation, and the selection of fitting starting points.
First, the water surface elevation in the DEM is used as a threshold to identify and distinguish between water and land pixels, generating a binary water–land matrix. To eliminate the interference of scattered noise pixels in subsequent analyses, the matrix is processed with a 3 × 3 convolution. Previous studies have shown that there is a significant correlation between lake area and basin morphological parameters (such as maximum depth), and these parameters are closely related to slope variations at different distances around the lake [53]. To avoid introducing irrelevant terrain information for small lakes or omitting key terrain features for large lakes, this study determined differentiated buffer radii for data clipping based on lake area. The buffer radius was calculated using the following formula:
D = 2 · A π
where D denotes the equivalent diameter, m, and A denotes the lake area, m2. Overall, 25%, 50%, 75%, and 100% of the equivalent diameter were used as the optimal buffer sizes. For lakes with in situ depth measurements, the optimal value is determined by comparing the extrapolation accuracy across four buffer zones; for lakes without measured data, we directly adopt the optimal ratio identified for the lake whose area is most similar. During bathymetry extrapolation, relying solely on elevation-based extension can yield physically implausible results, whereas incorporating slope information can substantially improve the realism of the reconstructed lakebed. In this study, pixel-wise slope was computed using a four-neighborhood (four-connected) approach. Compared with more complex neighborhood systems, such as eight-connectivity, the four-connectivity scheme offers greater computational efficiency and robustness while effectively avoiding topographic artifacts introduced by diagonal connections. The derived slope information is used not only to characterize local topographic relief but also to support the subsequent identification of fitting starting points and to constrain the extrapolation direction along profiles. Essentially, the construction of underwater topography can be regarded as a combination of extrapolations along multiple directional profiles; for a single profile direction, it can be simplified into a two-dimensional terrain extrapolation problem, where the amount of data involved in fitting is crucial. Therefore, this study defined two criteria for identifying fitting starting points (Figure 3): (1) critical pixels where the slope of land pixels changes from positive to negative and (2) pixels where the elevation change exceeds three times the regional mean elevation difference. The fitting starting points identified based on the above criteria can more accurately capture terrain transition features, providing reliable initial conditions for subsequent profile fitting.
(2)
Identification of Potential Calculation Points
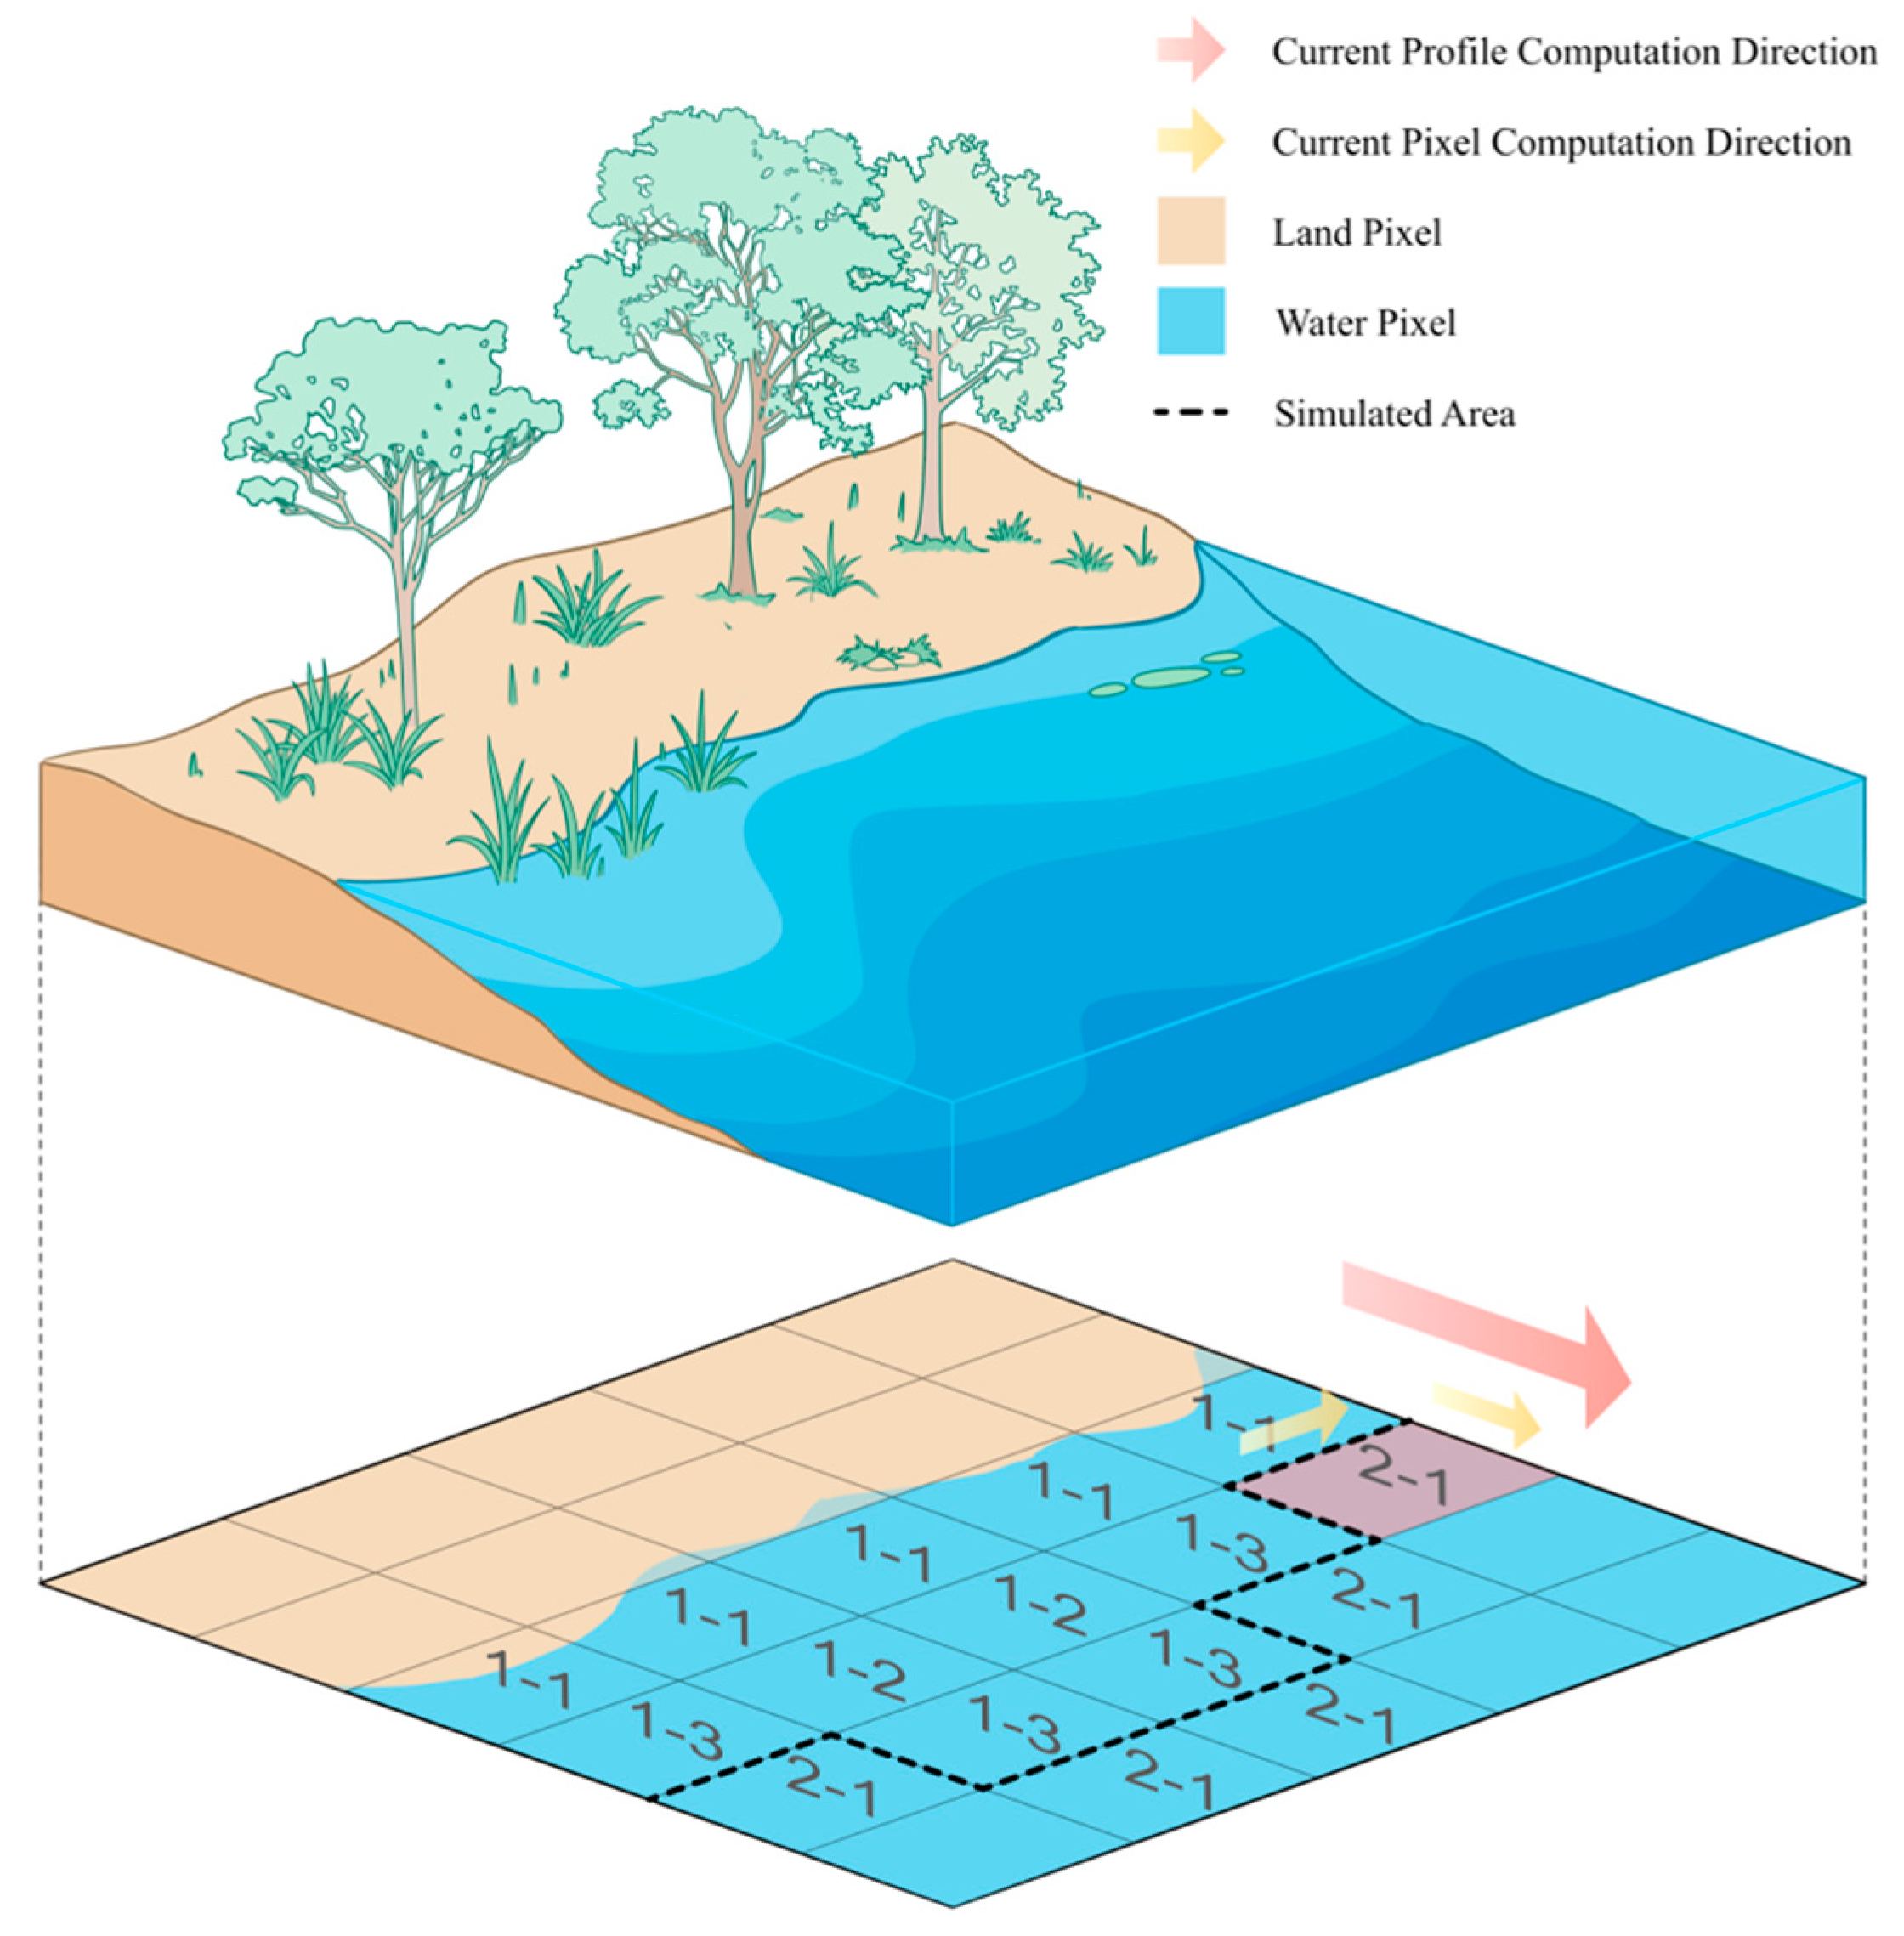
The iterative computation of the model begins with the identification and determination of “potential calculation points,” which form the basis for constructing the current computation matrix. The model uses elevation as a looping control parameter and adopts a gradient descent strategy to ensure that each computation result lies on the same elevation plane. To improve computational rationality, the algorithm employs a multi-directional neighborhood extension iteration: while computing the current profile, it simultaneously determines whether the two adjacent pixels in the orthogonal direction meet the calculation conditions. This approach increases the diversity of computation directions, allowing the model to more effectively capture spatial relationships among complex terrain features, thereby enhancing the accuracy of the final results. During a single elevation loop, the same profile may undergo multiple calculations. The model assigns the final value of a pixel using different strategies according to the order in which calculations occur. If a pixel is simultaneously identified as a “potential calculation point” from multiple directions during the same iteration within a given elevation loop, the model computes multiple provisional elevation values in parallel and takes their mean as the final elevation for that pixel. However, if a pixel has already been calculated and assigned an elevation earlier in the same elevation loop and is subsequently re-identified as a “potential calculation point” in later calculations, a “first valid value” rule is applied: once the pixel is successfully computed for the first time, its elevation is locked and retained, and any subsequent recalculated values are ignored in later iterations. The termination condition is reached when the elevations of all potential calculation points at the current iteration fall below the set elevation level. In Figure 4, “2-1” denotes the first computation in the second elevation loop.
(3)
Elevation Calculation
For a two-dimensional planar extrapolation model, the number of valid pixels involved in fitting is one of the key parameters affecting the reliability of the results. Extensive experiments indicate that, when more than eight pixels are used, the inclusion of more distant terrain information—whose correlation with the target location is weaker—often introduces substantial noise. Conversely, when fewer than two pixels are available, the limited information content prevents the model from reliably capturing local topographic trends. Therefore, in this study, the number of pixels participating in each fit is constrained within a flexible range of 2–8. Given the complex and diverse morphological characteristics of lake cross-sections (Figure 5), underwater terrain commonly exhibits a mosaic of geomorphic units, including steep slopes, shallow shelves, gullies, and relatively flat platforms. Consequently, a single fitting function cannot adequately represent such variable topography. An adaptive fitting strategy that accommodates different terrain features is thus required to accurately reflect cross-sectional shape variations. Accordingly, this study constructed a multi-type function library comprising quadratic, exponential, trigonometric, and transformed variants of these functions. During fitting, the model aims not only to maximize the coefficient of determination (R2) but also to incorporate geomorphological constraints. Based on the longitudinal profile continuity assumption and the extremum principle, the derivative at the lowest point of a profile is set to zero. This strategy ensures that the selected functional form both follows the terrain-variation trend and conforms to the natural macroscopic evolution of lake basin morphology, thereby balancing mathematical fitting with geomorphological realism. The specific fitting procedure is as follows:
(i) Minimization of the loss function: For a candidate function form f ( x , θ ) , the objective of the model is to minimize the loss function:
S θ = i = 1 n ( y i f ( x i , θ ) ) 2
where x i , y i represents the DEM elevation, f ( x , θ ) denotes the fitting function, and θ represents the set of parameters to be fitted.
(ii) The derivative of the loss function is taken to obtain the optimal parameters, and the coefficient of determination R2 is calculated to evaluate the fitting accuracy:
R 2 = 1 i = 1 n ( y i f ( x i , θ ) ) 2 i = 1 n ( y i y ¯ ) 2
where ȳ denotes the mean value of the DEM data, m. According to the fitting results, the function with the coefficient of determination R2 closest to 1 is selected as the optimal fitting function.
(4)
Sediment Correction
Current underwater topographic measurement techniques generally capture only the surface morphology of sediment layers, while the actual terrain evolution is continuously influenced by sedimentation and erosion processes. These processes play a crucial role in the long-term geomorphic evolution of lakes; however, since sedimentation rates are affected by complex factors such as upstream geological conditions, climate change, and vegetation coverage, a precise prediction is difficult. Therefore, to correct the systematic overestimation of water depth caused by neglecting sediment layers, this study introduces a sediment coefficient (Sc) to estimate the mean thickness of lacustrine sediments and to apply a physical correction to the simulated lake depths. The purpose of incorporating Sc is to enable a regionally consistent, systematic adjustment of model outputs through a reasonable physical mechanism in the absence of lake-wide measured sediment profile data, thereby improving the realism and comparability of the resulting water storage estimates.
S c = h d a t a h m o d e l
where Sc represents the sedimentation coefficient, h d a t a represents the measured or collected average depth of the lake, m, and h m o d e l represents the simulated average depth of the lake generated by the model, m. Lake sedimentation is a complex process controlled by multiple factors, with its rate, type, and spatial distribution primarily governed by the combined effects of sediment supply from the catchment, climatic and hydrodynamic conditions, and the internal lake environment [54]. Lakes with similar hydrogeological characteristics are likely to have undergone comparable geomorphic evolution and sedimentary processes. Based on this premise, we selected multidimensional indicators closely related to sedimentation from a dataset of lake-characteristic properties [55], including geological substrate, catchment topography, surface cover, and lake morphology. Using hierarchical cluster analysis, we objectively grouped the lakes. Subsequently, the sediment coefficients calculated from lakes with measured data within each category were transferred to data-scarce lakes in the same group, thereby enabling the estimation of sedimentation for lakes lacking in situ measurements.

4.2. Lake Water Volume Calculation

Based on the constructed digital bathymetric model of the lake, the lowest point of the lakebed elevation is taken as the reference surface, and discrete elevation data are generated using a fixed step size of 1 m. On this basis, the lake area corresponding to each discrete elevation is calculated using the following formula:
S ( h k ) = i = 1 n c e l l s i z e 2 × f ( h i < h k )
In the above formula, S ( h k ) represents the lake area corresponding to the water level elevation hk, m2; cellsize denotes the grid resolution of the digital bathymetric model, which is 90 m in this study; f ( h i < h k ) represents the indicator function; and h i denotes the elevation value of the current grid cell, m. When hi < hk, the function value is 1; otherwise, it is 0. The indicator function is used to filter grid cells below the current elevation and calculate the lake area at different elevations.
The stratified accumulation method is employed to calculate lake water volume by summing the incremental volumes between adjacent elevation layers. The volume increment between any two adjacent elevations h k and h k 1 is calculated using Equation (6), and cumulative summation is performed using Equation (7) to obtain the lake water storage at different elevations. This method characterizes the influence of basin morphology on the spatial distribution of water volume through stratification, significantly improving the accuracy of water storage estimation, especially for morphologically complex water bodies.
V = 1 3 ( h k h k 1 ) × ( S k + S k 1 + S k 1 × S k )
V k = k = 1 n V
In the above formula, ∆V represents the volume increment between adjacent elevations, m3; Sk and Sk−1 denote the lake areas at elevations hk and hk−1, respectively, m2, as derived from Equation (4); Vk represents the lake water storage at elevation hk, m3.
Notably, for bathymetry generated purely through DEM-based extrapolation, errors may accumulate as depth increases. In this study, such uncertainty is mitigated through the dynamic fitting strategy and the sediment-correction mechanism incorporated into the model. Considering Nam Co as an example, the lake surface elevation is 4724 m, while the simulated elevation at the deepest point is 4621 m, corresponding to a maximum water depth of 103 m. Table 1 summarizes the relationship between lake area and water volume at different elevations using a 5 m interval. Previous field measurements indicate that the maximum depth of Nam Co exceeds 90 m and that its central region is characterized by a broad, flat basin [56], which is consistent with our simulation results. Nevertheless, it should be acknowledged that, in the absence of lake-wide measured bathymetric constraints, the reconstruction of the deepest central portion of the lake inevitably remains uncertain.
Before constructing the lake water volume series, to enhance data consistency and result accuracy, all water level and area data were first unified to the WGS_84 ellipsoid and the EGM_2008 geoid. Subsequently, the statistical relationships among lake water level elevation, area, and volume were analyzed, and appropriate curves were selected for fitting to establish the water level–volume and area–volume relationship curves. During data processing, outliers were identified and removed to minimize their impact on the water volume series results.
To further analyze the dynamic variation process of lake water volume, this study employed the differential method to examine its long-term series variation characteristics. This method effectively characterizes water volume fluctuations between adjacent time steps [57] and reveals the temporal evolution pattern of lake water storage. By constructing the water volume change series, it becomes possible to further explore the response mechanisms of lakes to influencing factors such as air temperature, precipitation, evapotranspiration, and recharge. The specific calculation formula is as follows:
V t t + 1 = V t + 1 V t ( t = 1 ,   2 ,   ,   t 1 )
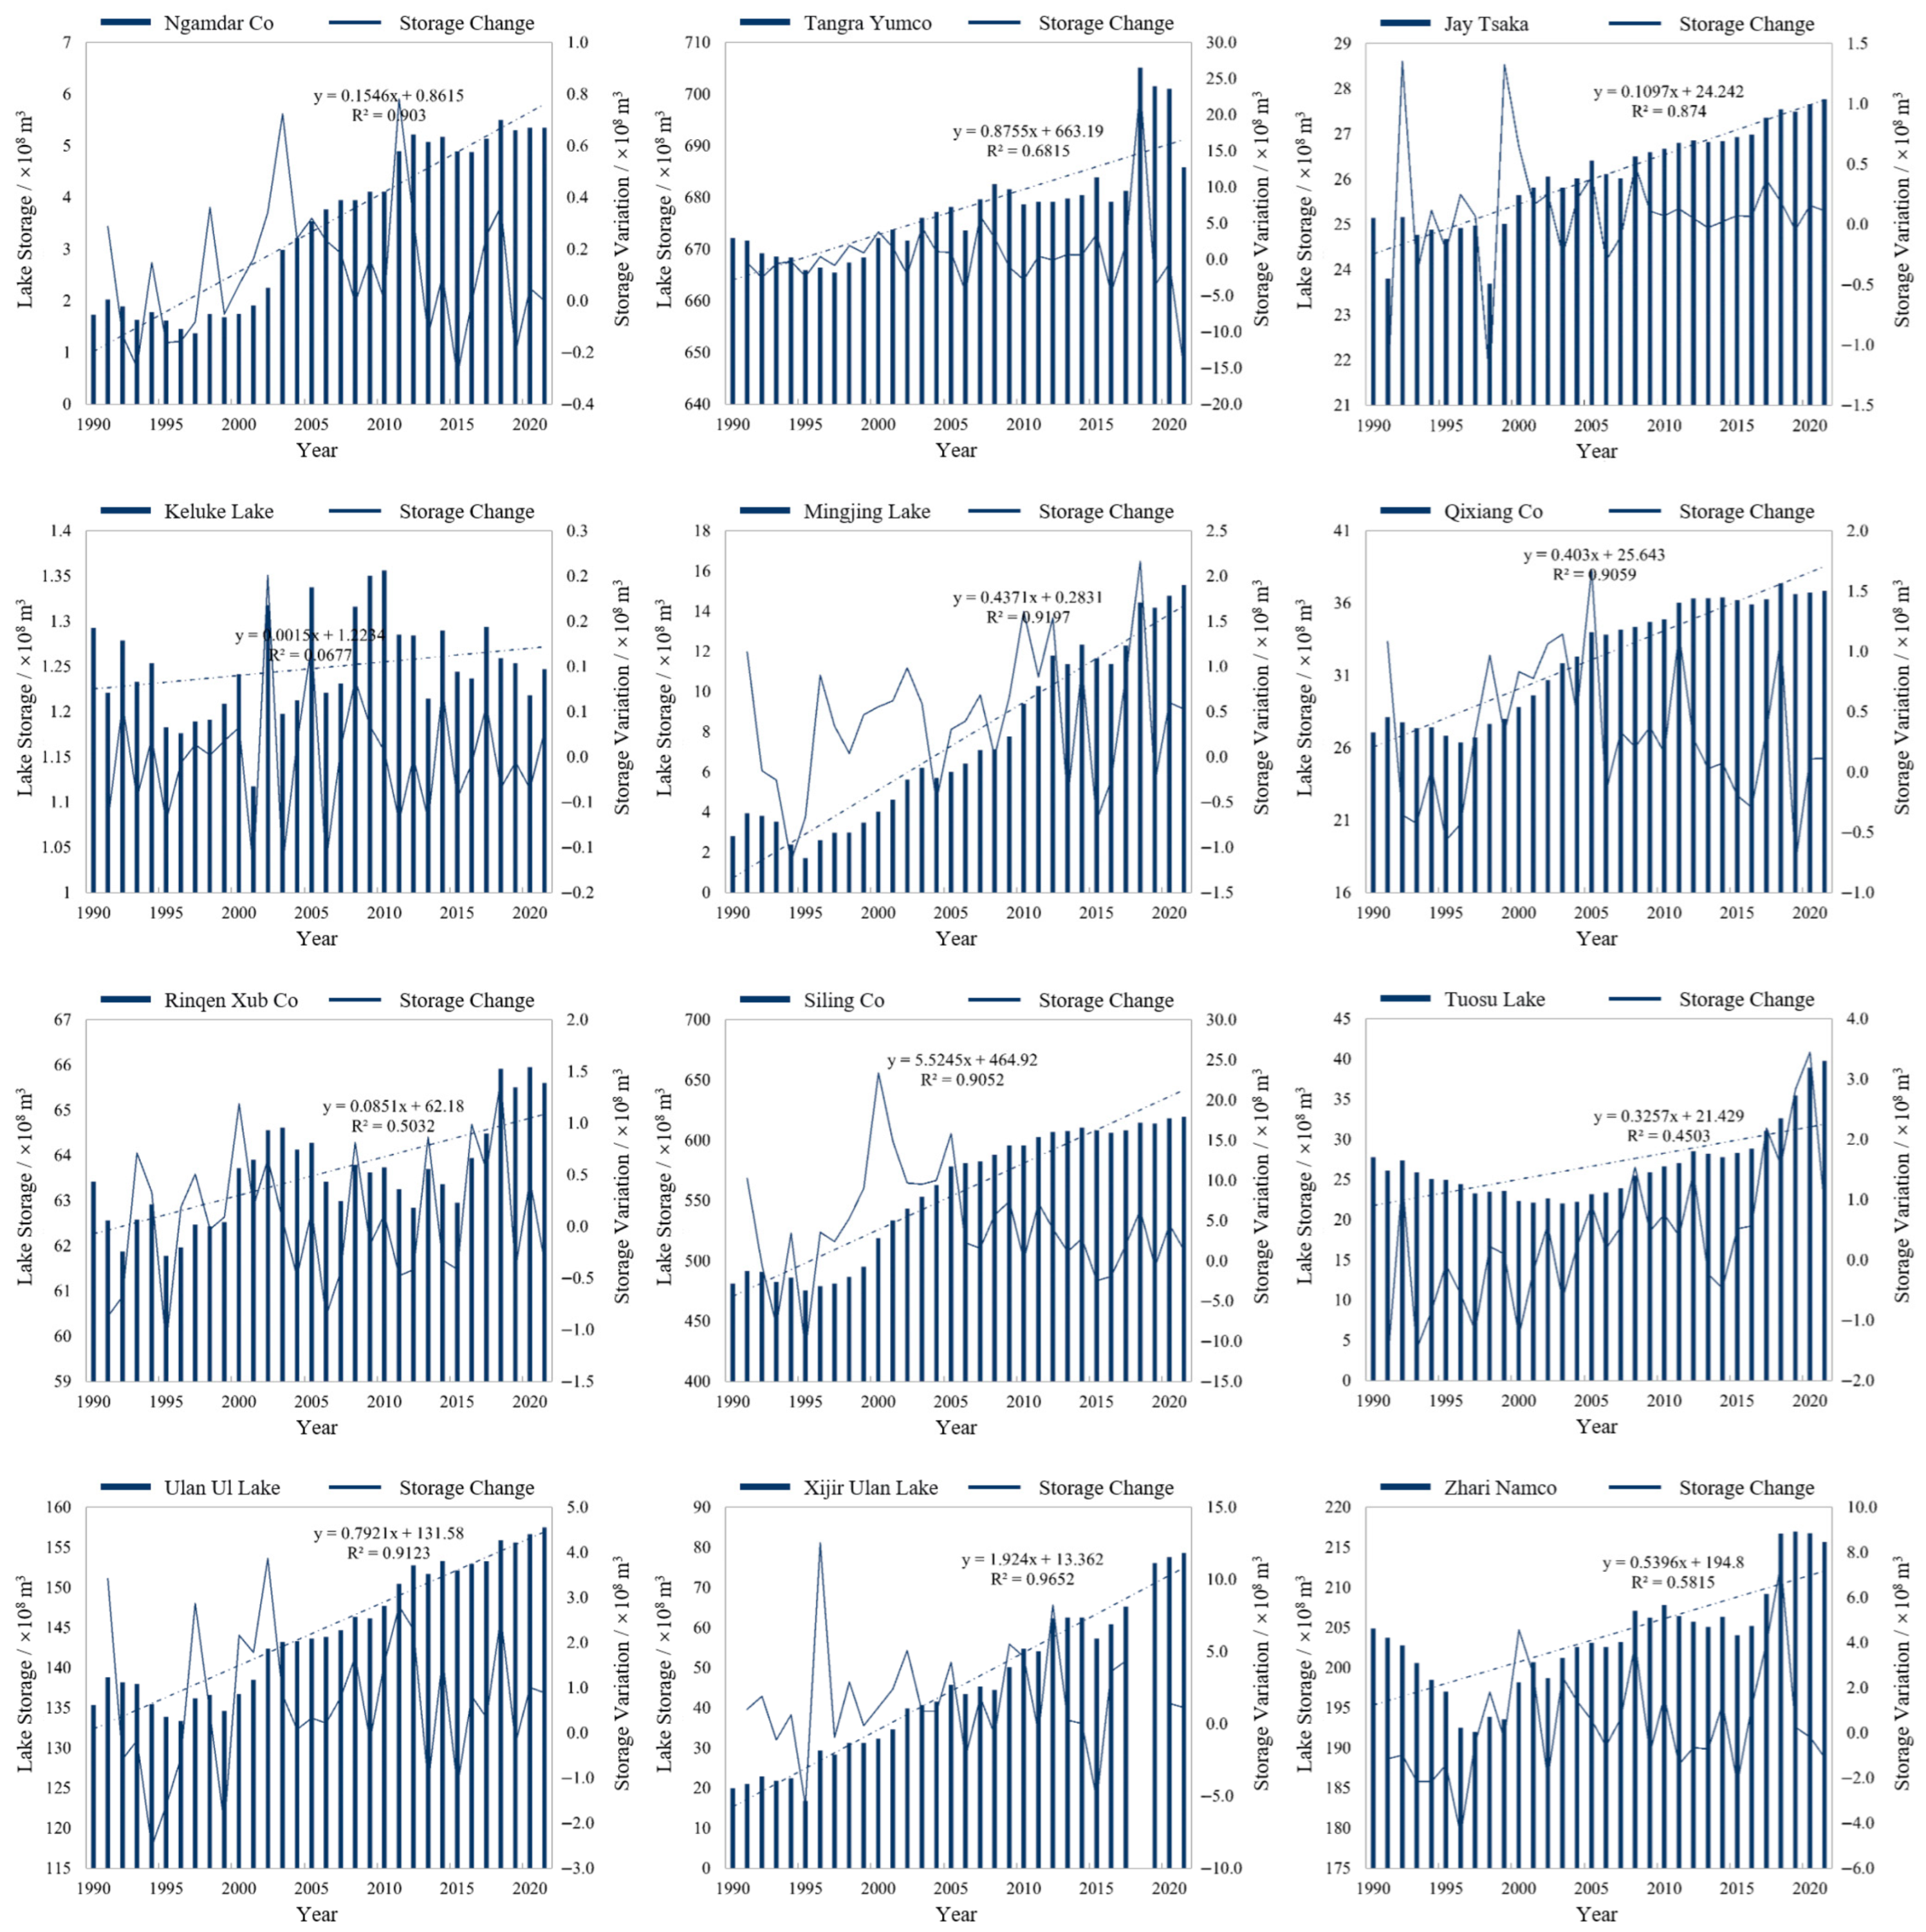
In the above formula, V t t + 1 represents the change in lake water volume from time t to t + 1, m3; V t + 1 and V t correspond to the lake water volumes at times t + 1 and t, respectively, m3. Figure 6 presents several representative examples produced by the proposed model. The resulting water storage time series visually captures the dynamic evolution of lake water volume across the Qinghai–Tibet Plateau from 1990 to 2021. This visualization provides evidence of the model’s capability to reproduce long-term lake dynamics.

5. Accuracy Verification

To systematically evaluate the reliability of the lake water volume series constructed in this study, three independent validation datasets were selected for cross-validation. To quantitatively assess the accuracy of the results, five statistical indicators were used, i.e., relative error (RE), absolute error (AE), root mean square error (RMSE), mean absolute error (MAE), and Pearson correlation coefficient (r).

5.1. Verification of Lake Water Storage Estimation on the Qinghai–Tibet Plateau

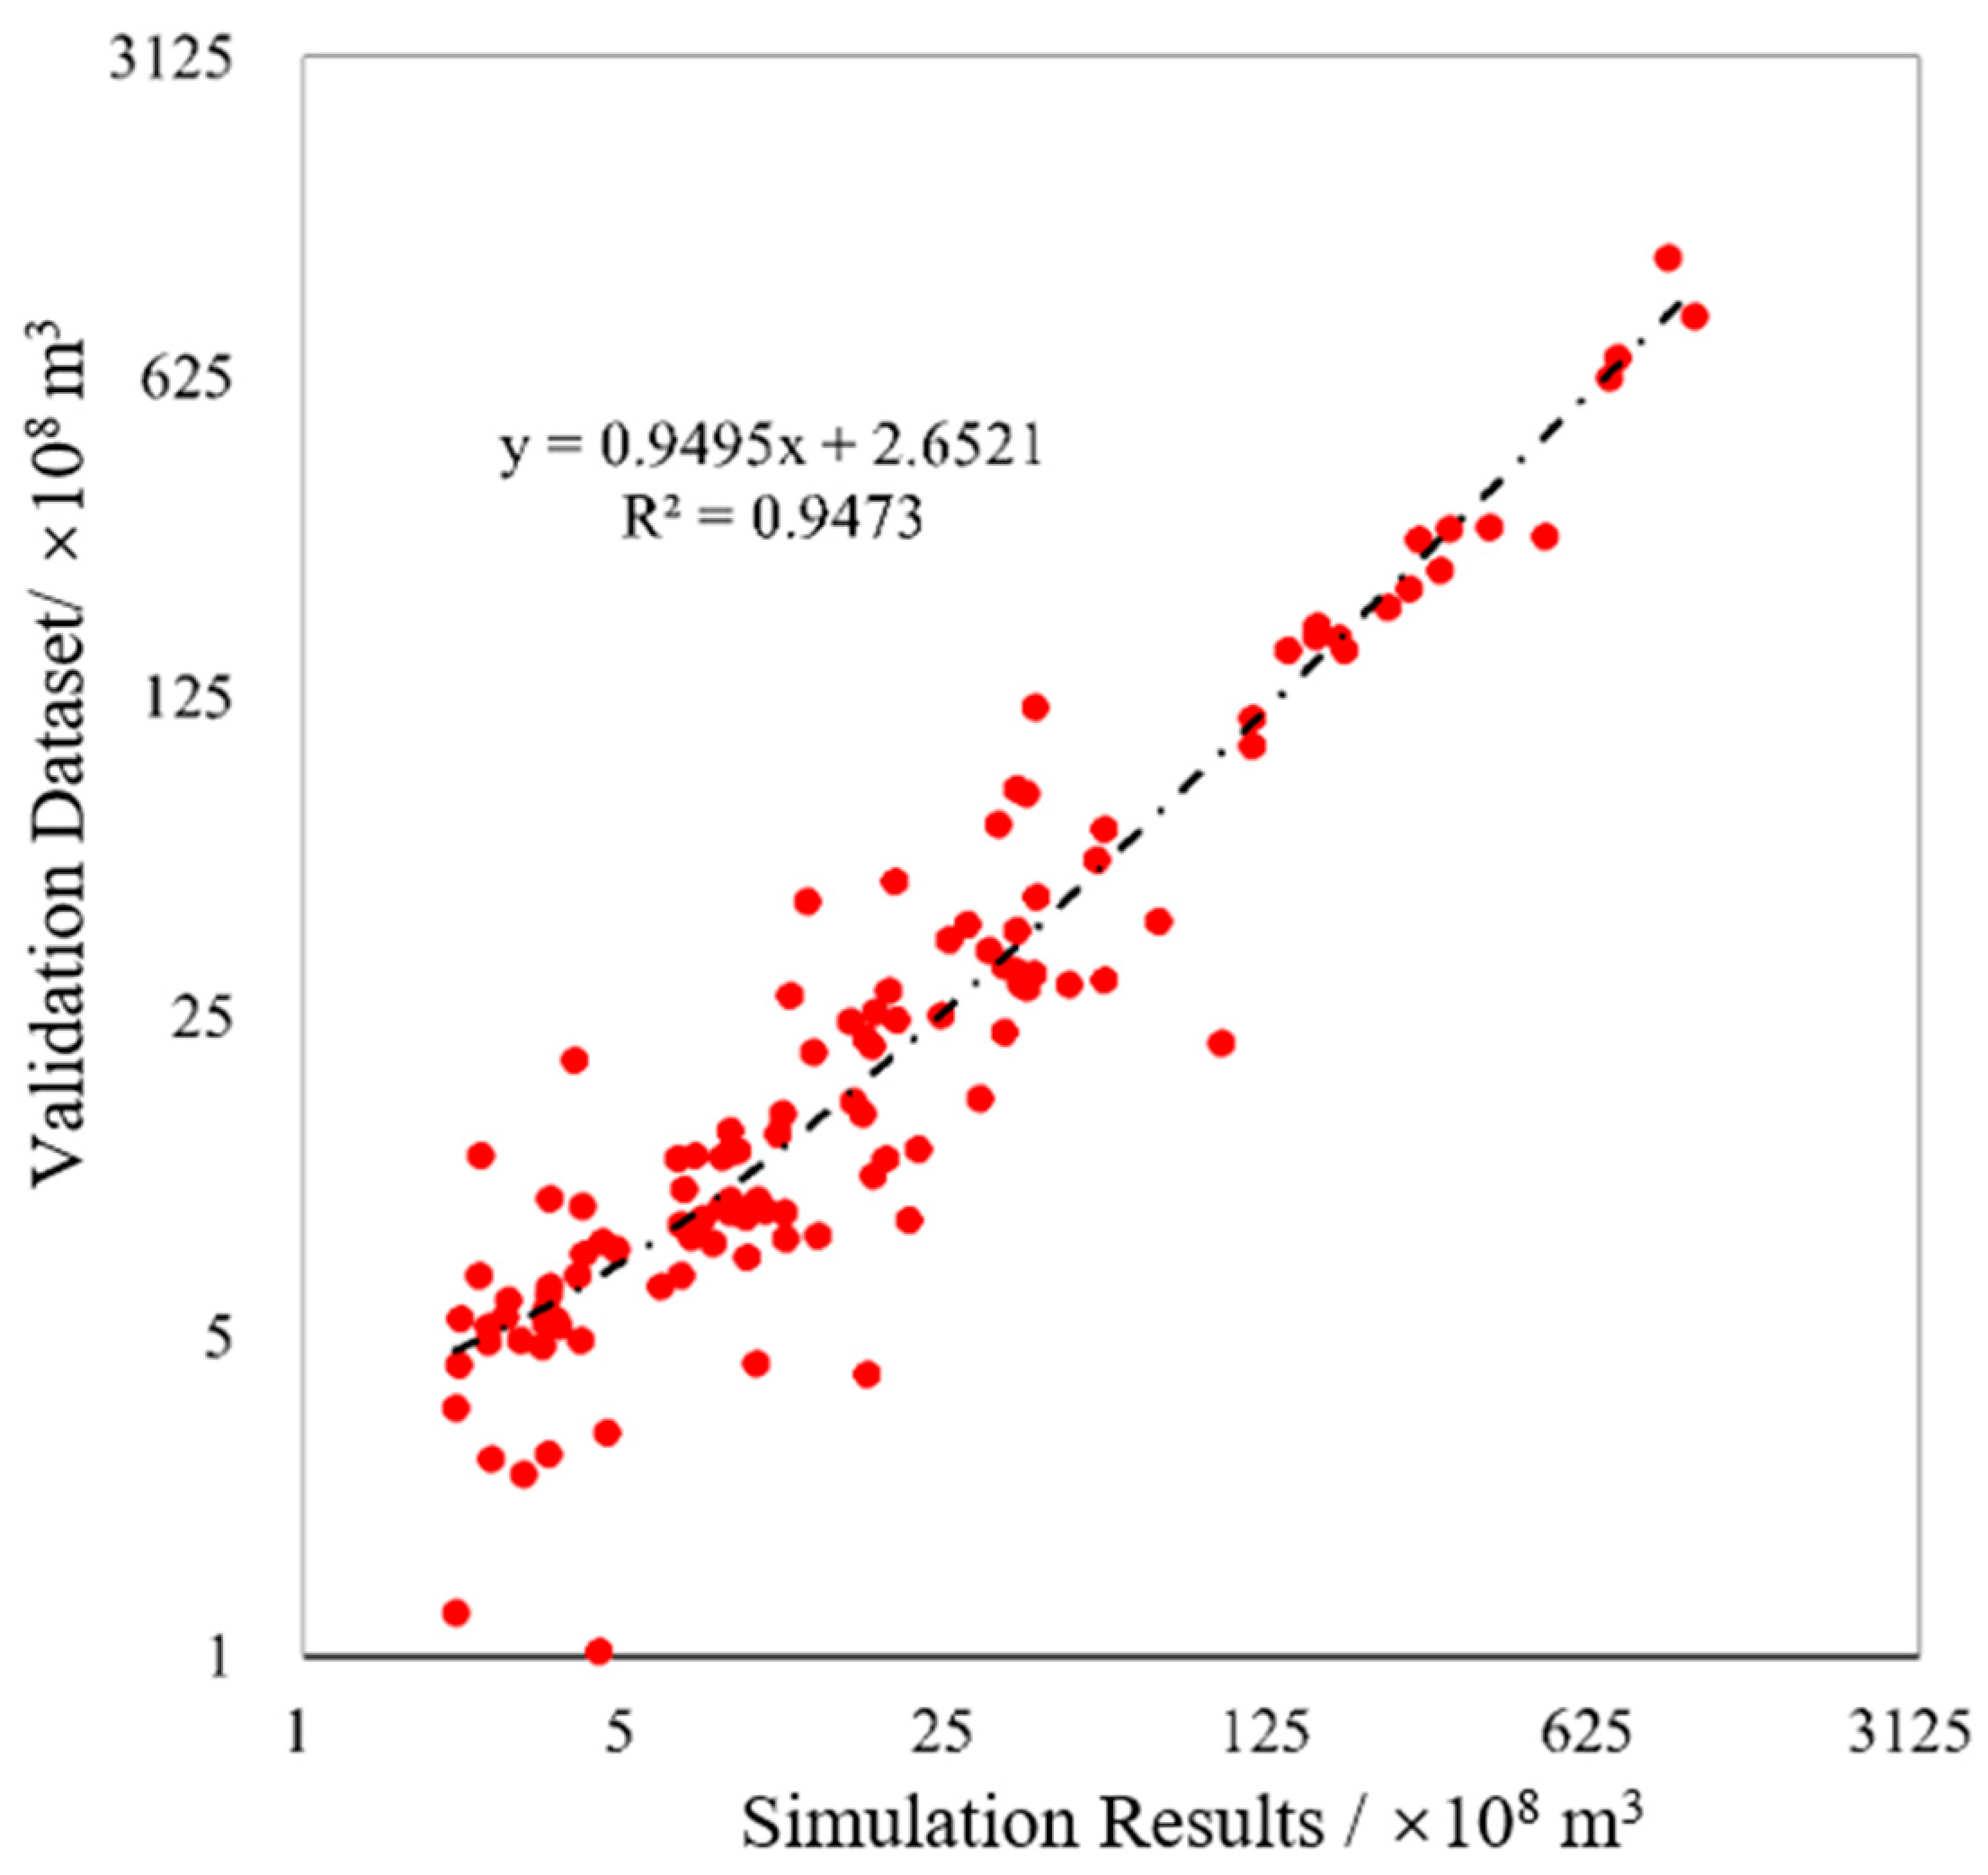
Using Dataset III as the validation reference, the cross-validation of the study results was conducted (Supplementary Table S1). Figure 7 shows the correlation analysis between the estimated water storage from this study and the validation data. Overall, the two datasets show a high level of agreement, with a coefficient of determination (R2) of 0.95, indicating that the model has strong global predictive capability. Further analysis reveals a clear dependence of estimation accuracy on lake size. For lakes with larger water storage, the model tends to produce relatively smaller errors, yielding robust and reliable results. In contrast, larger errors are observed for some lakes with smaller water storage. This pattern may be attributed to the higher sensitivity of small lakes to input data uncertainty (e.g., shoreline delineation and DEM resolution) and to the potentially more complex relationship between basin morphology and surrounding terrain in small-lake settings. To further evaluate the relationship between model performance and lake size, the lakes were categorized into four groups based on area (Table 2), and accuracy analyses were conducted for each group.
The analysis results show that the simulated estimates are in good overall agreement with the validation dataset, with particularly strong performance for large lakes. Specifically, for lakes with an area greater than 100 km2, the simulated results are highly consistent with the reference data, with the Pearson correlation coefficient reaching 0.95. Further group analysis indicates that the correlation coefficients for the 100–500 km2 and 500–1000 km2 lake groups are 0.92 and 0.95, respectively, demonstrating that the model has good stability and applicability for larger lakes. Although some deviations exist for lakes larger than 1000 km2, the simulated results remain within a reasonable range due to the large base volume of these lakes. In contrast, the estimation accuracy for smaller lakes is relatively lower, likely influenced by multiple factors such as the precision limitations of the Digital Elevation Model (DEM) data, boundary extraction errors, and the resolution of remote sensing imagery.
This study demonstrates that the proposed method achieves high accuracy and reliability in simulating lake water storage on the Qinghai–Tibet Plateau, showing good consistency with independent validation datasets. The findings provide valuable data support and methodological reference for research on the water cycle processes of the Plateau, the analysis of lake–climate interaction mechanisms, and regional water resource management and climate change response assessments.

5.2. Validation of Lake Water Volume Series on the Qinghai–Tibet Plateau

Several representative lakes were selected as study objects to analyze the accuracy of the constructed water storage series. First, using Dataset I as a reference, the cumulative water volume changes in each lake between 2000 and 2021 were compared and analyzed. The model demonstrates good regional-scale consistency and reliability, effectively capturing the dynamic trends of water storage variations, although the accuracy of absolute storage estimates for some small lakes still needs improvement. As shown in Table 3, the absolute error in cumulative water volume change is within 300 million m3 for most lakes. However, several lakes (e.g., Darucuo and Xiaochaidan Lake) exhibit relatively large relative errors. The possible reasons include the following: (1) limitations of the 90 m DEM in representing small lakes or complex shorelines, where insufficient spatial details may introduce biases in shoreline delineation and in the extraction of surrounding slopes, thereby affecting bathymetry extrapolation; and (2) non-typical basin morphologies for these lakes that deviate from the model assumptions, leading to systematic overestimation or underestimation.
On this basis, considering data completeness, geographic coverage, and lake-specific characteristics, we selected 10 lakes for full time-series correlation validation against Dataset II (Table 4). The results show a significant correlation between the water storage series constructed in this study and Dataset II, with correlation coefficients exceeding 0.6 for all lakes. This finding effectively verifies the capability and precision of the proposed method in capturing the dynamic variation trends of lake water storage.
Notably, the accuracy of the lake water storage series largely depends on the accuracy of the input data—particularly lake water level and area data. High-precision water level and area data are fundamental to ensuring accurate water storage estimation. Differences in data sources for water level and area between this study and the validation datasets may be one of the main causes of certain discrepancies. Furthermore, the current validation data still lack direct support from in situ observations, which may affect the certainty of the validation results to some extent. Future research will focus on validation using measured data to further enhance the accuracy and practical applicability of the water storage series.

6. Analysis of Lake Water Volume Changes on the Qinghai–Tibet Plateau

6.1. Spatiotemporal Variations in Lake Water Volume on the Qinghai–Tibet Plateau

Based on the water storage series of 120 lakes with areas greater than 50 km2 across the Qinghai–Tibet Plateau from 1990 to 2021 (Supplementary Table S2), this study systematically analyzed the spatiotemporal variation characteristics of regional lake water storage. The total area of the studied lakes is 30,134.32 km2, accounting for more than 60% of the total lake area on the Plateau, with a total water storage of 799.654 billion m3, showing strong regional representativeness. During the study period, the total water storage of the 120 lakes exhibited a continuous increasing trend, rising from 662.357 billion m3 to 799.654 billion m3, with a cumulative net increase of 137.297 billion m3 and a growth rate of 20.73%, indicating that the lakes on the Qinghai–Tibet Plateau have experienced a significant increase in water volume over the past three decades.
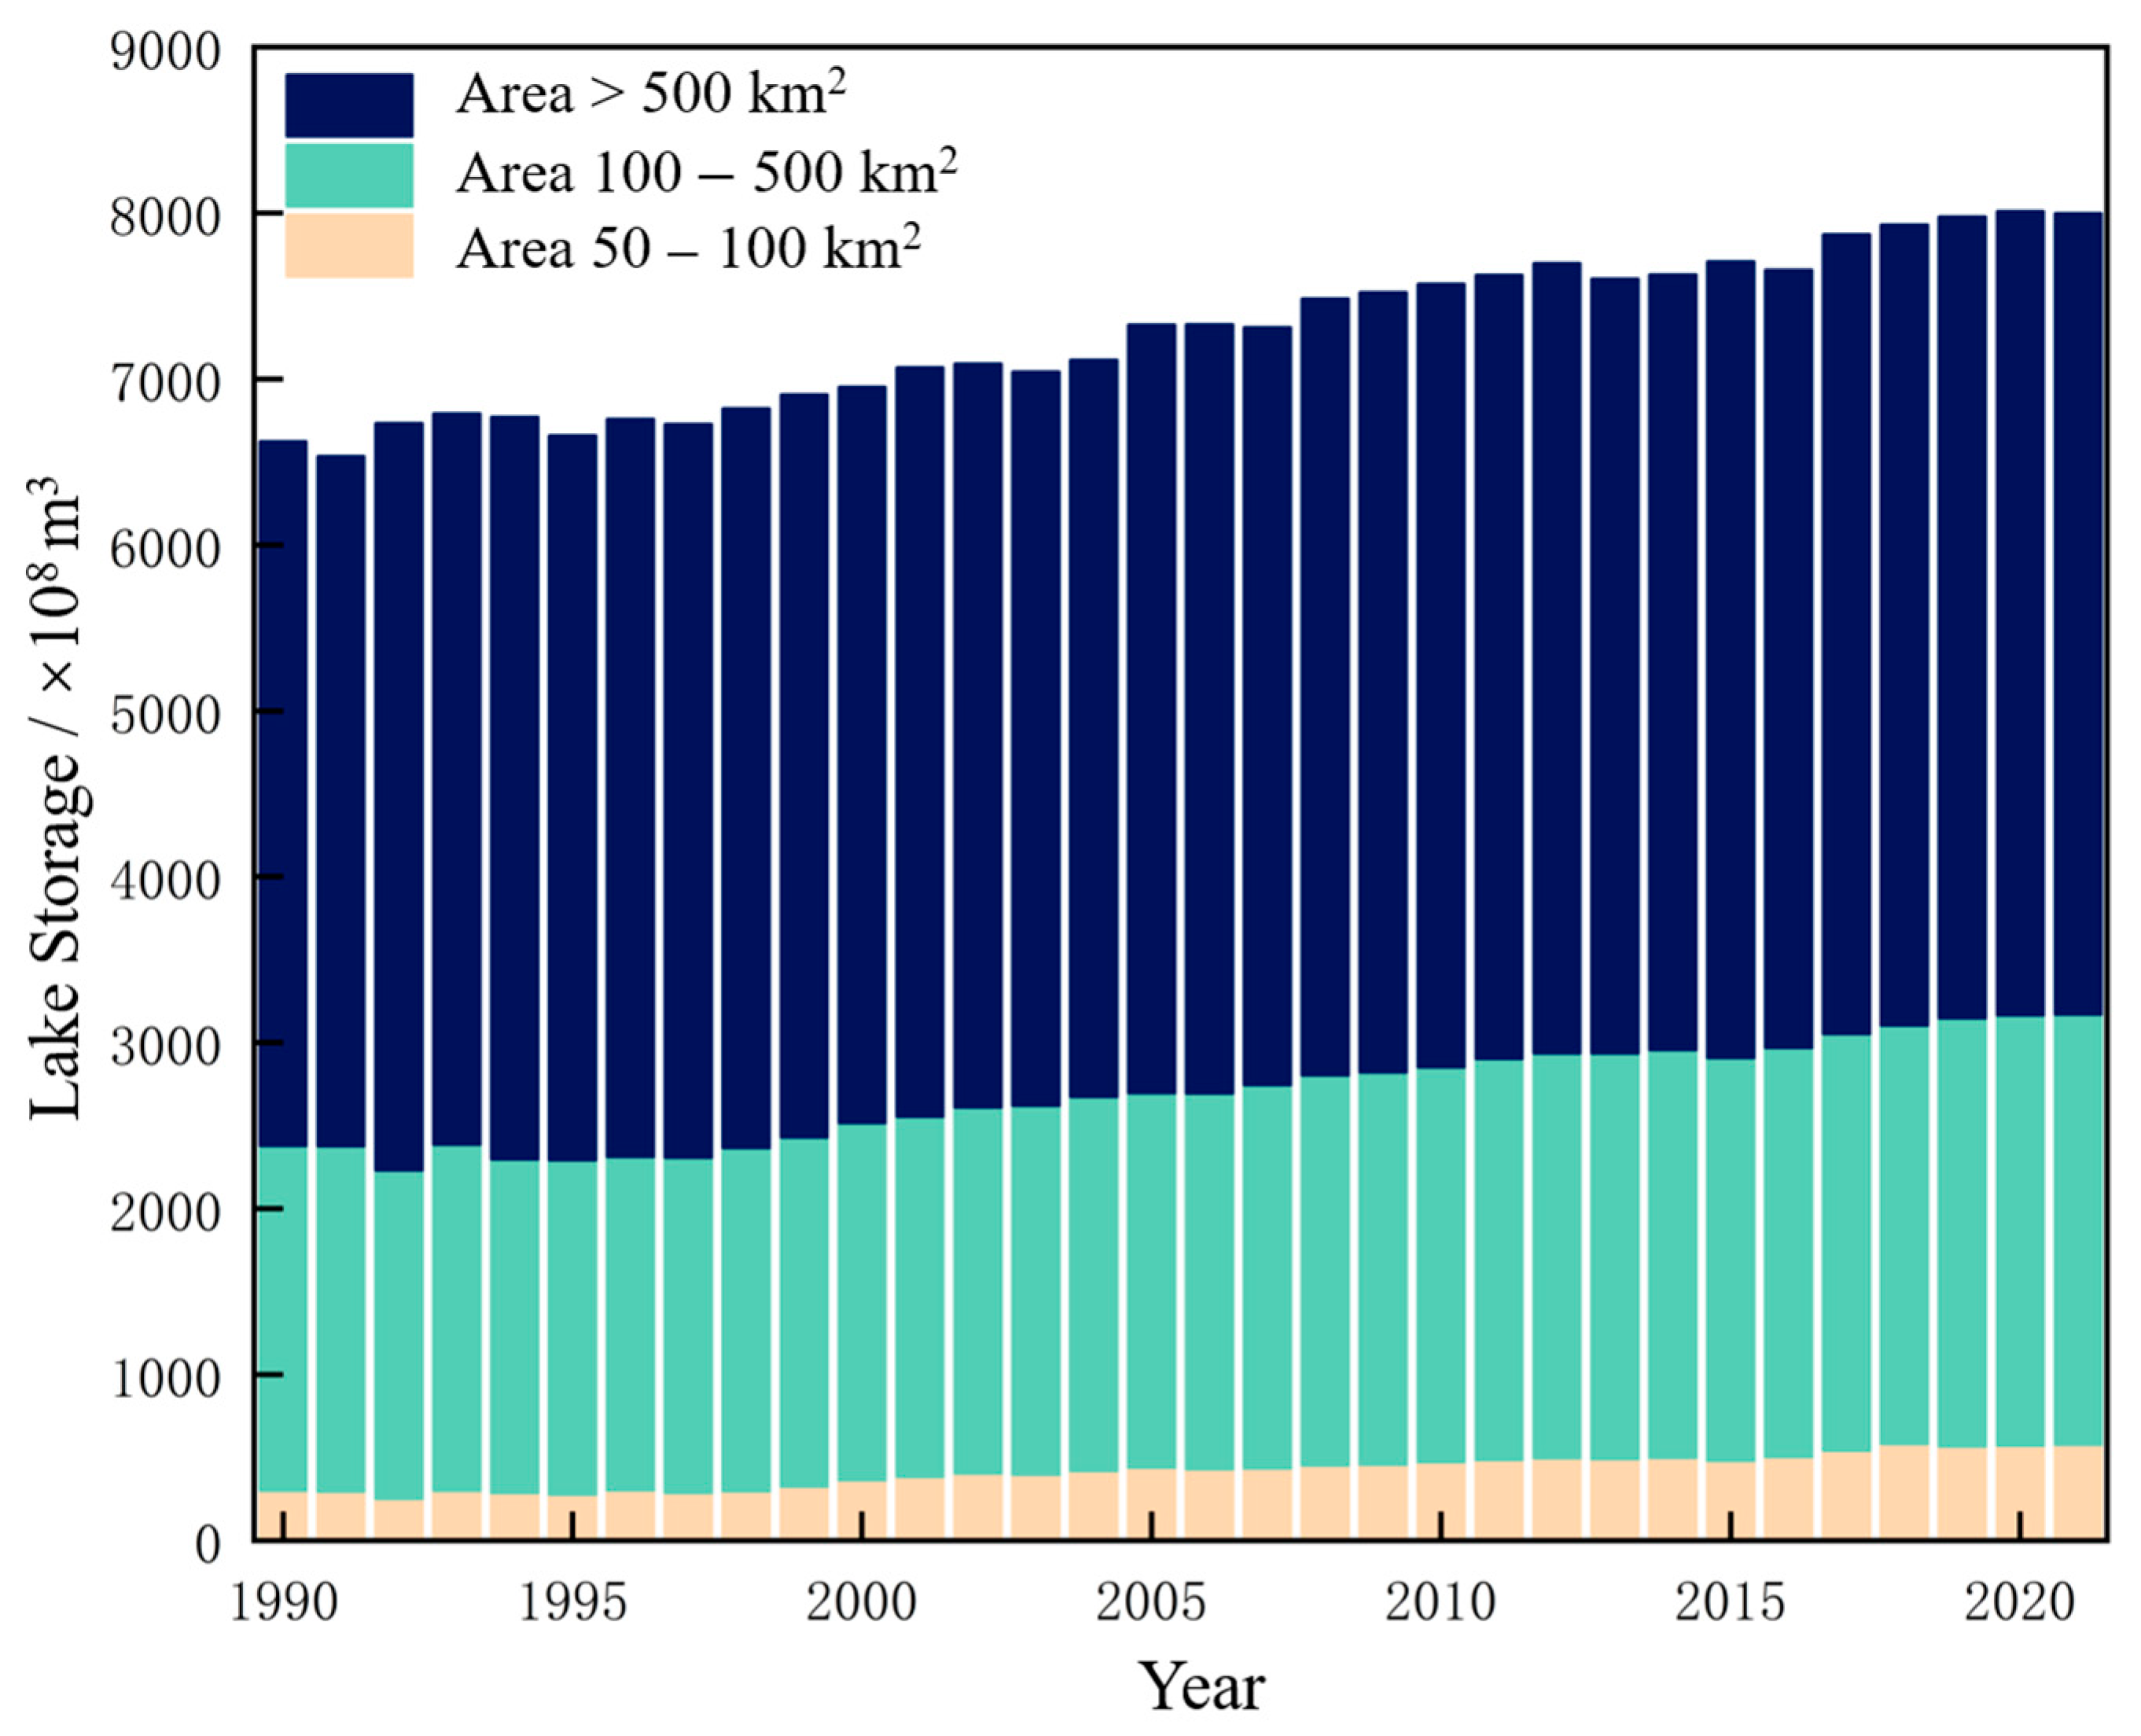
To investigate how lakes of different sizes contribute to regional water storage changes, we classified lakes into three categories based on surface area and systematically analyzed their water storage dynamics from 1990 to 2021 (Figure 8). The results indicate that total water storage increased markedly across all size classes, although the magnitude of increase differed substantially among them. The results show that the total water storage of lakes in all area ranges increased significantly, but the magnitude of growth varied: lakes with an area of 50–100 km2 saw their total water storage increase from 30.033 billion m3 to 57.860 billion m3, with an average annual growth rate as high as 92.65%, representing the most substantial increase. Lakes with an area of 100–500 km2 experienced an increase from 207.851 billion m3 to 259.235 billion m3, with an average annual growth rate of 24.72%. Large lakes with areas exceeding 500 km2 increased their total water storage from 424.473 billion m3 to 482.559 billion m3, with an average annual growth rate of 13.68%. Although large lakes exhibit a relatively lower mean annual growth rate, their substantial initial storage means that they still dominate the absolute increase in water volume. This contrast indicates pronounced scale-dependent characteristics in the hydrological changes in Qinghai–Tibet Plateau lakes. These findings provide a quantitative basis for understanding the roles of lakes of different sizes in regional water cycling and water balance regulation.
Under the background of continuous global warming, the Qinghai–Tibet Plateau has experienced significant temperature rise, intensified glacier melt, and altered precipitation patterns, all of which jointly drive the continuous increase in lake water storage that is likely to persist in the foreseeable future. These changes have profound impacts on the regional water cycle, ecosystem stability, and surrounding environmental evolution.
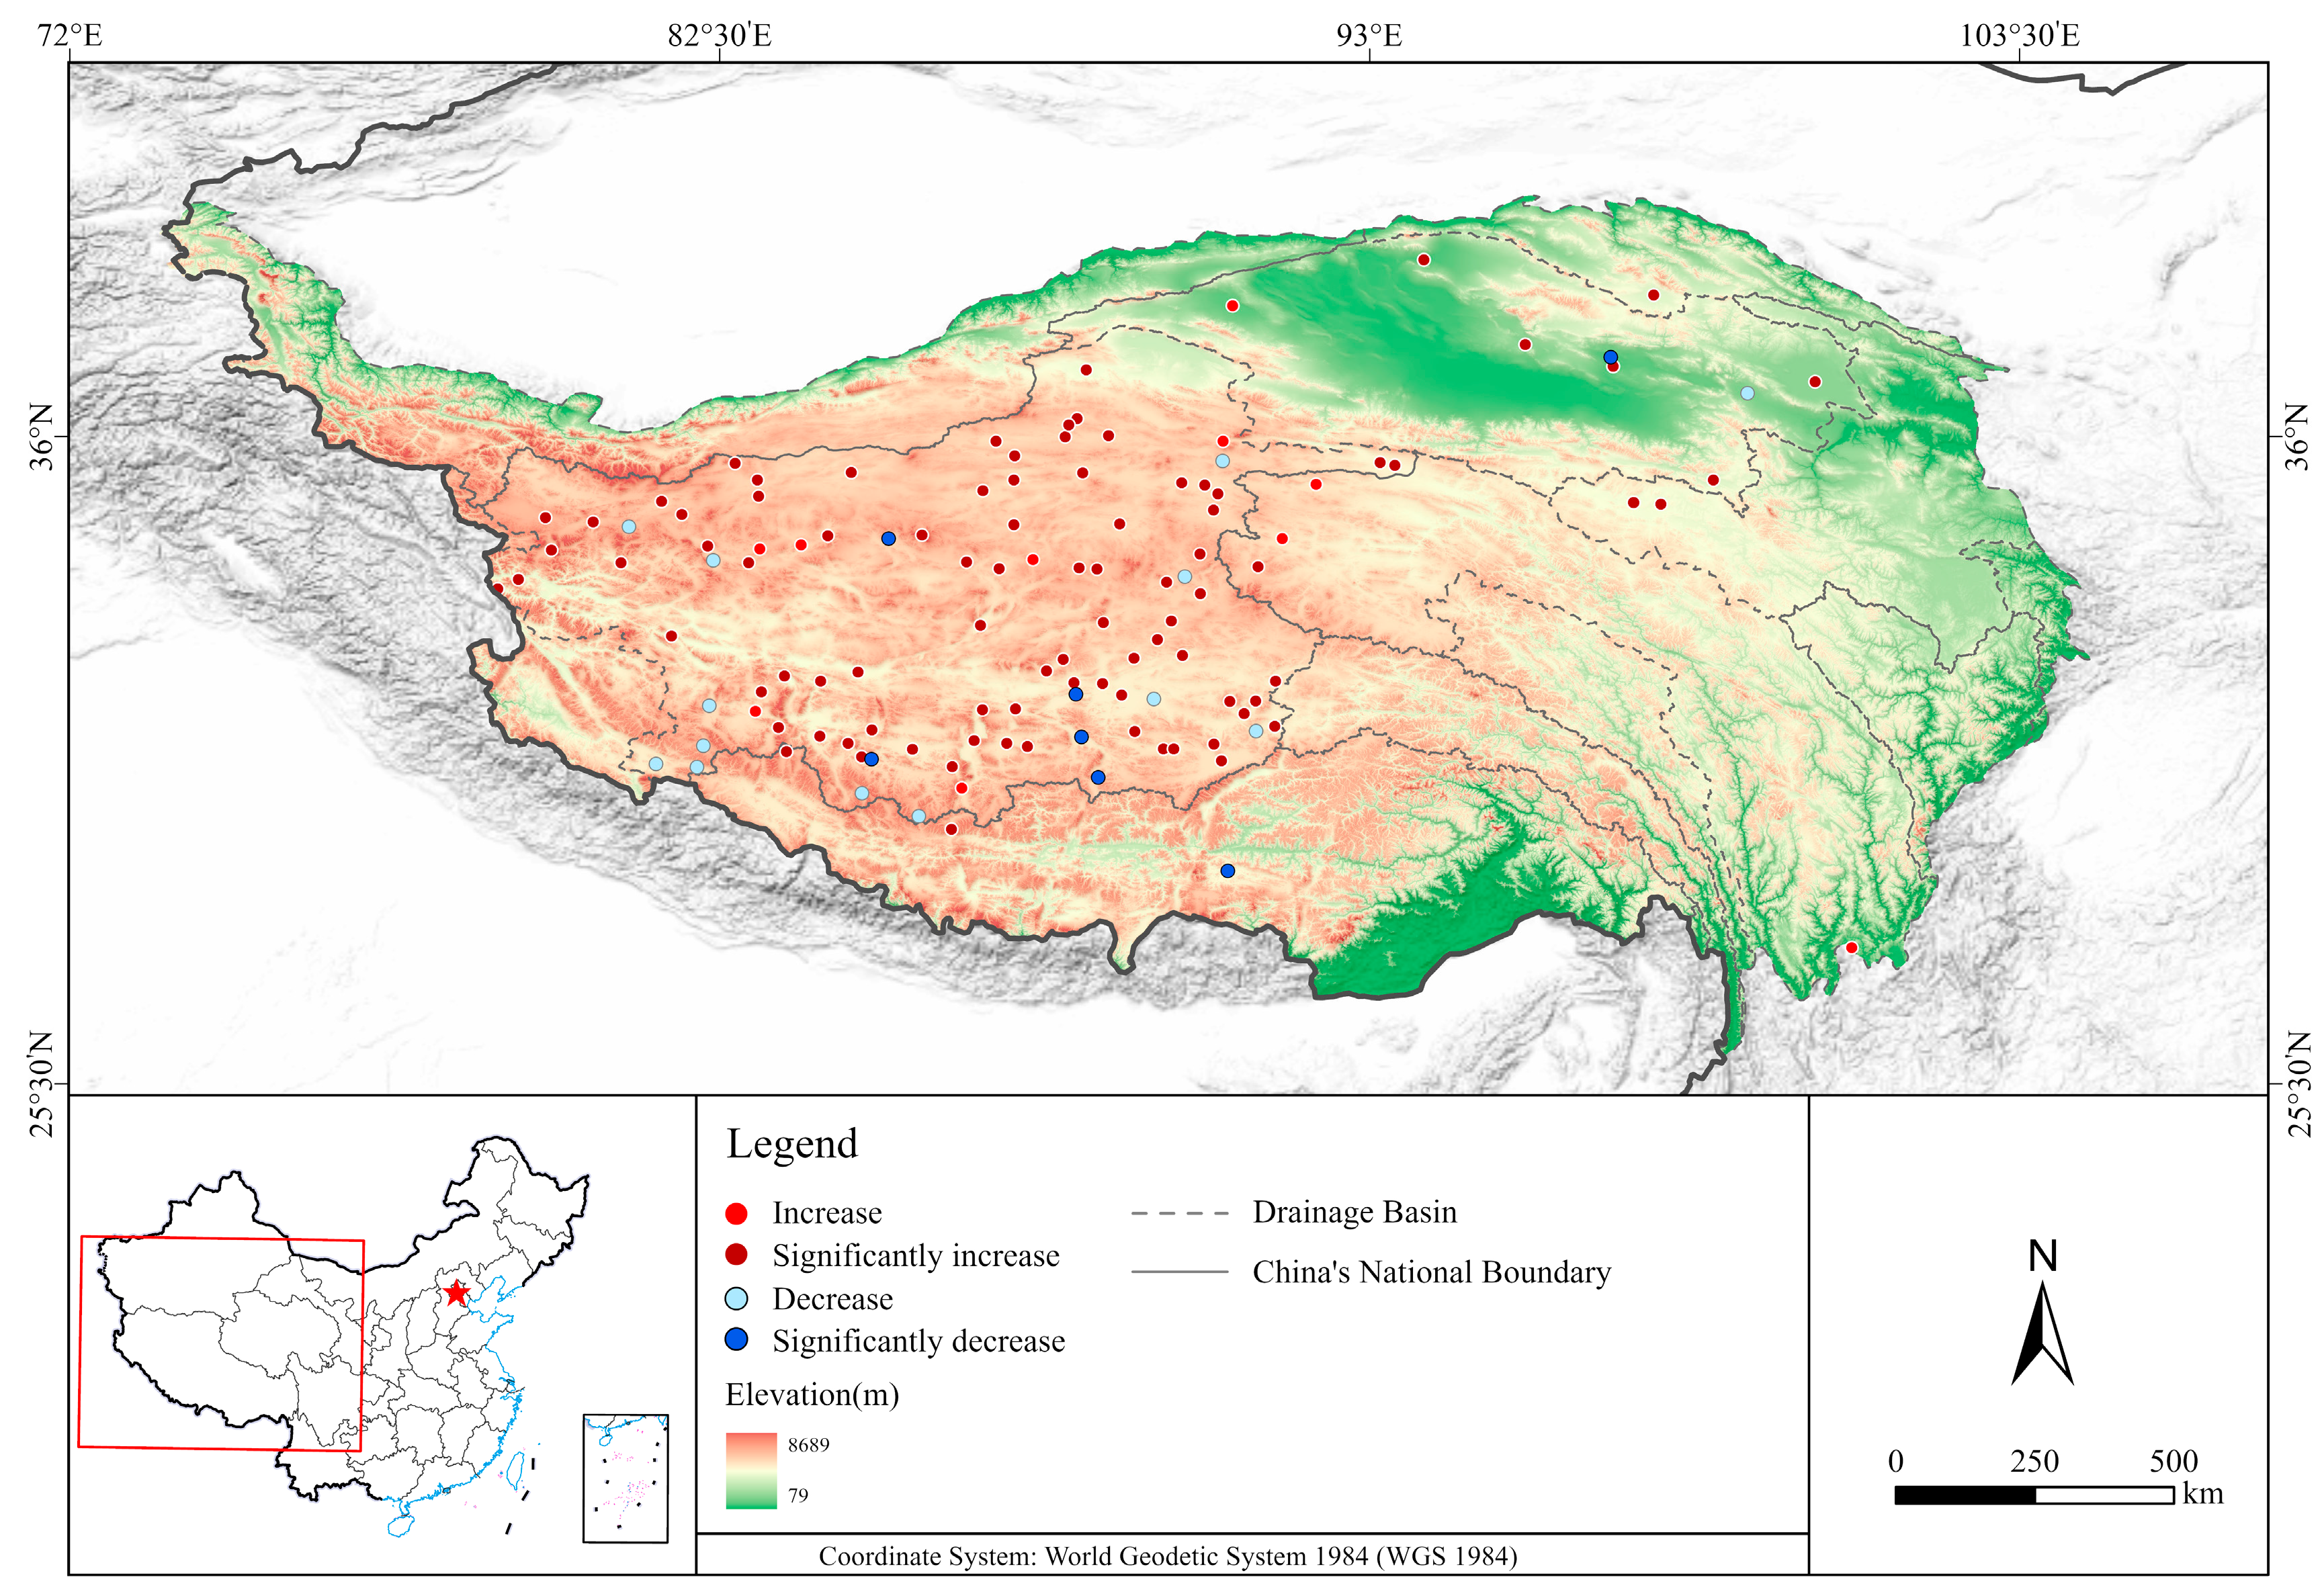
In terms of spatial distribution (Figure 9), the changes in lake water storage show evident regional differences. Lakes with increased water storage are widely distributed, occurring primarily in the central endorheic basins of Tibet and the northeastern part of the Plateau. The primary drivers may include increased precipitation, enhanced meltwater supply from accelerated glacier and permafrost thawing, and the combined effects of warming and relatively small increases in evaporation. In contrast, lakes exhibiting decreased water storage are more spatially clustered in the southwestern Qinghai–Tibet Plateau, with a few scattered across the northeastern and central inland regions. This pattern may reflect the regulating influence of local factors—such as basin geomorphology, surface–groundwater exchange, or human activities—suggesting that, against the backdrop of broad regional coherence, lake-response mechanisms still exhibit notable local complexity. Overall, the spatial heterogeneity of lake water storage changes results from the combined effects of regional water–energy balance, cryospheric change, and catchment characteristics, further highlighting the non-uniform and complex response of the Plateau hydroclimatic system to global change. Future work should integrate regional climate model outputs with hydrological process observations to enable a more quantitative attribution of the underlying drivers.

6.2. Trends in Lake Water Volume Changes on the Qinghai–Tibet Plateau

The Mann–Kendall (M–K) trend test, known for its strong robustness against outliers and extreme values and for not requiring data to follow a normal distribution, has been widely used in the trend analysis of hydrological and climatic time series [58]. In this study, the M–K test with a 95% confidence interval was applied to classify the significance of water storage change trends for 120 lakes (Table 5).
Statistical results show that, among all lakes, 100 lakes (83.3%) exhibited a positive annual rate of water storage change, indicating that most lakes demonstrated an increasing trend in water volume. Of these, 90 lakes (75%) showed a significant upward trend, while 10 lakes (8.3%) increased without statistical significance. Conversely, 20 lakes (16.7%) had a negative annual rate of change, including 7 lakes (5.9%) that showed a significant downward trend and 13 lakes (10.8%) with an insignificant decline.
In terms of change rate, Zhenquan Lake exhibited the fastest increase in water storage, with an average annual growth rate of 13.26%, resulting in a cumulative increase of 0.876 billion m3 over 30 years. Amu Co also showed a relatively rapid increase, with an average annual growth rate exceeding 10%. In addition, 14 lakes, including Xiachaidan Lake, Chaoyang Lake, and Xianhe Lake, had annual growth rates between 5% and 10%. Among the lakes with declining water storage, Chaka Salt Lake showed the most significant decrease, with an average annual decline rate of 6.04% and a cumulative reduction of 0.08 billion m3; the remaining lakes with declining water storage had annual decline rates below 5%.

7. Discussion

Although the model developed in this study shows strong reliability and consistency in reconstructing lake water storage time series across the Qinghai–Tibet Plateau, the uncertainties in the results still warrant careful discussion. First, uncertainties primarily arise from the input data and model assumptions. The input datasets—such as time series of lake level and lake area—inevitably contain systematic errors, which can be particularly pronounced for small lakes or in regions with complex lakeshore topography. In addition, the 90 m DEM used in this study has inherent limitations. For small lakes, the limited number of DEM pixels may distort shoreline geometry; in rugged terrain, the coarse resolution may fail to capture local cliffs or gullies, leading to an overly smoothed representation of bathymetry during extrapolation. Moreover, Plateau lakes have diverse origins. For lakes with highly irregular morphologies, such as glacial lakes, or for relatively unstable landslide-dammed lakes, the similarity between underwater topography and surrounding terrain may be lower, directly reducing model accuracy in these specific settings.
Future work can improve model accuracy and general applicability in several ways. Using higher-resolution DEMs (e.g., 30 m or 12.5 m) would provide more detailed lake boundaries and slope information, thereby substantially enhancing reconstruction performance for small lakes and topographically complex areas. Although higher-resolution data increase computational demand and runtime, ongoing advances in computing hardware and algorithmic efficiency are expected to enable resolution improvements without prohibitive losses in processing efficiency. In addition, improving model transferability across lake types requires better calibration of the sediment coefficient. Lake sedimentation is influenced by multiple factors—including surrounding soil properties, lakebed geology, lake genesis, and water quality—yet the current approach aggregates these effects into a single coefficient; therefore, further validation using additional field observations is needed. Finally, exploring the integration of advanced methods such as machine learning to enable the adaptive learning of the complex relationships between subaerial and submerged terrain across different geomorphic units represents another promising direction. With these improvements, the model is expected to support the higher-accuracy monitoring of lake water storage dynamics over broader regions.

8. Conclusions

This study developed a DEM-based underwater topography extrapolation model and, by integrating multi-source remote sensing data, reconstructed the water storage time series of 120 lakes on the Qinghai–Tibet Plateau from 1990 to 2021, filling the long-term monitoring gap in absolute lake water storage for this region. Cross-validation with three independent datasets demonstrated the high accuracy of the constructed series, providing key data support for studies on the long-term evolution of the Plateau’s water cycle and its response to climate change. The main conclusions are as follows:
(1) The underwater topography extrapolated from the surrounding DEM data effectively supports the estimation of lake water storage. Cross-validation with existing datasets indicates that, for lakes with an area greater than 100 km2, the Pearson correlation coefficient reaches 0.95, showing high consistency; although the estimation accuracy for small lakes is slightly lower, the overall results still align well with the validation data.
(2) The constructed water storage series for 120 lakes on the Qinghai–Tibet Plateau from 1990 to 2021 demonstrates high reliability upon verification. A comparison with existing datasets shows that the absolute error of cumulative water volume change for most lakes is less than 300 million m3, and the correlation coefficients of the water storage series generally exceed 0.6, indicating that the proposed method has good capability and practical accuracy in capturing dynamic variations in lake water storage.
(3) From 1990 to 2021, the total water storage of the 120 lakes increased from 662.357 billion m3 to 799.654 billion m3, representing a 20.73% increase, with distinct differences in growth rates across different lake size categories. Among them, 100 lakes exhibited an upward trend, of which 90 lakes (75%) showed a significant increase, and 20 lakes showed a decrease, with only 7 lakes (5.9%) exhibiting a significant decline. Spatially, lakes with increasing water storage were mainly concentrated in the central inland basins of Tibet and the northeastern Qinghai–Tibet Plateau, while those with decreasing storage were mostly distributed in the southwest, with only a few in the northeast and central inland regions.
This study systematically revealed the significant expansion trend of lake water storage on the Qinghai–Tibet Plateau over the past three decades, reflecting a marked hydrological response of the region under global warming. The constructed long-term water storage series fills the data gap in the systematic monitoring of Plateau lakes, providing an essential foundation for related research.

Supplementary Materials

The following supporting information can be downloaded at https://www.mdpi.com/article/10.3390/rs18020225/s1. Table S1: Comparison of Reconstructed and Validated Lake Water Volumes on the Qinghai–Tibet Plateau; Table S2: Long-Term Time Series of Lake Water Storage on the Qinghai–Tibet Plateau (1990–2021).

Author Contributions

X.Z. was responsible for the overall conceptualization of the study, data integration, and manuscript writing. Z.X. contributed to the development of the remote sensing data processing framework and statistical analysis of lake water storage variation. C.Q. assisted in the model construction and validation of DEM-based underwater topography extrapolation. D.X. participated in the collection and preprocessing of multi-source remote sensing and hydrological data. Y.C. provided methodological guidance, theoretical support, and critical revision of the manuscript. H.P. supervised the entire research process, coordinated project administration and funding acquisition, and finalized the manuscript. All authors have read and agreed to the published version of the manuscript.

Funding

This research was funded by the Major Science and Technology Project of Qinghai Province (No. 2024-SF-A6).

Data Availability Statement

The original contributions presented in this study are included in the article/Supplementary Materials. Further inquiries can be directed to the corresponding author.

Conflicts of Interest

The authors declare no conflicts of interest.

References

  1. Woolway, R.I.; Kraemer, B.M.; Lenters, J.D.; Merchant, C.J.; O’Reilly, C.M.; Sharma, S. Global Lake Responses to Climate Change. Nat. Rev. Earth Environ. 2020, 1, 388–403. [Google Scholar] [CrossRef]
  2. Yang, K.; Yao, F.; Dong, D.; Dong, W.; Luo, J.C. Dynamic Monitoring of Lake Area Changes on the Qinghai–Tibet Plateau. J. Geo-Inf. Sci. 2017, 19, 972–982. [Google Scholar]
  3. Su, Q.; Shahab, A.; Huang, L.; Ubaid Ali, M.; Cheng, Y.; Yang, J.; Xu, H.; Sun, Z.; Zou, Q.; Chen, Z.; et al. Heavy Metals in Surface Sediment of Plateau Lakes in Tibet, China: Occurrence, Risk Assessment, and Potential Sources. Toxics 2023, 11, 804. [Google Scholar] [CrossRef] [PubMed]
  4. Dai, Y.; Wang, T.; Sheng, Y.; Wang, L.; Chen, H.B. Westerly-Triggered Lake-Effect Snowfall Enhanced with Climate Warming over the Tibetan Plateau. Sci. Bull. 2024, 69, 968–977. [Google Scholar] [CrossRef] [PubMed]
  5. Zhang, G.; Yao, T.; Xie, H.; Zhang, K.; Zhu, F. Lakes’ State and Abundance across the Tibetan Plateau. Chin. Sci. Bull. 2014, 59, 3010–3021. [Google Scholar] [CrossRef]
  6. Zhang, G.; Yao, T.; Xie, H.; Wang, W.; Yang, W. An Inventory of Glacial Lakes in the Third Pole Region and Their Changes in Response to Global Warming. Glob. Planet. Chang. 2015, 131, 148–157. [Google Scholar] [CrossRef]
  7. Masson-Delmotte, V.; Zhai, P.; Pirani, A.; Connors, S.L.; Péan, C.; Berger, S.; Caud, N.; Chen, Y.; Goldfarb, L.; Gomis, M.I.; et al. (Eds.) Climate Change 2021: The Physical Science Basis. Contribution of Working Group I to the Sixth Assessment Report of the Intergovernmental Panel on Climate Change; Cambridge University Press: Cambridge, UK, 2021; Available online: https://www.ipcc.ch/report/sixth-assessment-report-working-group-i/ (accessed on 17 September 2025).
  8. Li, Y.; Zhao, G.; Allen, G.H.; Gao, H. Diminishing Storage Returns of Reservoir Construction. Nat. Commun. 2023, 14, 3203. [Google Scholar] [CrossRef]
  9. Xu, F.; Zhang, G.; Woolway, R.I.; Yang, K.; Wada, Y.; Wang, J.; Crétaux, J.F. Widespread Societal and Ecological Impacts from Projected Tibetan Plateau Lake Expansion. Nat. Geosci. 2024, 17, 516–523. [Google Scholar] [CrossRef]
  10. Wang, G.; Feng, A.; Xu, L.; Zhang, Q.; Song, W.; Singh, V.P.; Wu, W.; Zhang, K.; Sun, S. Increasing Selin Co Lake Area in the Tibet Plateau with Its Moisture Cycle. Sustainability 2025, 17, 2024. [Google Scholar] [CrossRef]
  11. Zhang, B.; Wu, Y.; Zhu, L.; Wang, J.; Li, J.; Chen, D. Estimation and Trend Detection of Water Storage at Nam Co Lake, Central Tibetan Plateau. J. Hydrol. 2011, 405, 161–170. [Google Scholar] [CrossRef]
  12. Liu, W.; Xie, C.; Zhao, L.; Li, R.; Liu, G.; Wang, W.; Liu, H.; Wu, T.; Yang, G.; Zhang, Y.; et al. Rapid Expansion of Lakes in the Endorheic Basin on the Qinghai-Tibet Plateau since 2000 and Its Potential Drivers. Catena 2021, 197, 104942. [Google Scholar] [CrossRef]
  13. Lu, P.; Han, J.; Li, Z.; Xu, R.; Li, R.; Hao, T.; Qiao, G. Lake Outburst Accelerated Permafrost Degradation on Qinghai-Tibet Plateau. Remote Sens. Environ. 2020, 249, 112011. [Google Scholar] [CrossRef]
  14. Tao, F.; Wang, Y.; Jing, Y.; She, X.; Lu, S.; Li, Y. Integrating Topographic Continuity and Lake Recession Dynamics for Improved Bathymetry Mapping from DEMs. EGUsphere 2025, 2025, 1–28. [Google Scholar] [CrossRef]
  15. Wang, J.; Gao, Y. Monitoring Long-Term Water Storage of Lakes and Reservoirs in Arid Ungauged Basin Based on Underwater Topography Derived from Multi-Source Satellite Data. Sci. Total Environ. 2025, 966, 178662. [Google Scholar] [CrossRef]
  16. Gao, L.; Liao, J.; Shen, G. Monitoring Lake-Level Changes in the Qinghai–Tibetan Plateau Using Radar Altimeter Data (2002–2012). J. Appl. Remote Sens. 2013, 7, 073470. [Google Scholar] [CrossRef]
  17. Song, C.; Huang, B.; Ke, L.; Richards, K.S. Remote Sensing of Alpine Lake Water Environment Changes on the Tibetan Plateau and Surroundings: A Review. ISPRS J. Photogramm. Remote Sens. 2014, 92, 26–37. [Google Scholar] [CrossRef]
  18. Zhang, J.; Liu, F.; Ning, H.; Xia, Y.; Zhang, Z.; Jiang, W.; Chen, S.; Ji, D. Optimizing the Estimation of Water Storage Variation in Lakes with Limited Satellite Altimetry Coverage. Environ. Earth Sci. 2024, 83, 598. [Google Scholar] [CrossRef]
  19. Ai, B.; Wen, Z.; Wang, Z.; Wang, R.; Su, D.; Li, C.; Yang, F. Convolutional Neural Network to Retrieve Water Depth in Marine Shallow Water Area from Remote Sensing Images. IEEE J. Sel. Top. Appl. Earth Obs. Remote Sens. 2020, 13, 2888–2898. [Google Scholar] [CrossRef]
  20. Lyzenga, D.R. Remote Sensing of Bottom Reflectance and Water Attenuation Parameters in Shallow Water Using Aircraft and Landsat Data. Int. J. Remote Sens. 1981, 2, 71–82. [Google Scholar] [CrossRef]
  21. Alpers, W.; Hennings, I. A Theory of the Imaging Mechanism of Underwater Bottom Topography by Real and Synthetic Aperture Radar. J. Geophys. Res. Oceans 1984, 89, 10529–10546. [Google Scholar] [CrossRef]
  22. Shuchman, R.A.; Lyzenga, D.R.; Meadows, G.A. Synthetic Aperture Radar Imaging of Ocean-Bottom Topography via Tidal-Current Interactions: Theory and Observations. Int. J. Remote Sens. 1985, 6, 1179–1200. [Google Scholar] [CrossRef]
  23. Do, K.S.; Akhtar, F.; Goffin, B.; Aryal, A.; Tran, T.N.D.; Lipscomb, M.; Lakshmi, V. Assessing Terrestrial Water Storage Variations in Afghanistan Using GRACE and FLDAS-Central Asia Data. J. Hydrol. Reg. Stud. 2024, 55, 101906. [Google Scholar] [CrossRef]
  24. Liu, K.; Song, C. Modeling Lake Bathymetry and Water Storage from DEM Data Constrained by Limited Underwater Surveys. J. Hydrol. 2022, 604, 127260. [Google Scholar] [CrossRef]
  25. Li, Y.; Gao, H.; Zhao, G.; Tseng, K.H. A High-Resolution Bathymetry Dataset for Global Reservoirs Using Multi-Source Satellite Imagery and Altimetry. Remote Sens. Environ. 2020, 244, 111831. [Google Scholar] [CrossRef]
  26. Xie, H.; Ye, J.; Liu, X.; Chong, Y. Warming and Drying Trends on the Tibetan Plateau (1971–2005). Theor. Appl. Climatol. 2010, 101, 241–253. [Google Scholar] [CrossRef]
  27. Yao, T.D.; Thompson, L.; Yang, W.; Yu, W.S.; Gao, Y.; Guo, X.J.; Yang, X.X.; Duan, K.Q.; Zhao, H.B.; Xu, B.Q.; et al. Different Glacier Status with Atmospheric Circulations in Tibetan Plateau and Surroundings. Nat. Clim. Change 2012, 2, 663–667. [Google Scholar] [CrossRef]
  28. Yao, T.D.; Bolch, T.; Chen, D.L.; Gao, J.; Immerzeel, W.; Piao, S.L.; Su, F.G.; Thompson, L.; Wada, Y.; Wang, L.; et al. The Imbalance of the Asian Water Tower. Nat. Rev. Earth Environ. 2022, 3, 618–632. [Google Scholar] [CrossRef]
  29. Chen, J.J.; Liao, J.J. Monitoring Lake Level Changes in China Using Multi-Altimeter Data (2016–2019). J. Hydrol. 2020, 590, 125544. [Google Scholar] [CrossRef]
  30. Mei, Z. Study on the Variation Characteristics of the Hoh Xil Lake Group Under Climate Change Conditions. Ph.D. Thesis, Changjiang River Scientific Research Institute, Wuhan, China, 2019. [Google Scholar]
  31. The Ad Hoc Group; Vörösmarty, C.; Askew, A.; Grabs, W.; Barry, R.G.; Birkett, C.; Döll, P.; Goodison, B.; Hall, A.; Jenne, R.; et al. Global Water Data: A Newly Endangered Species. EOS Trans. AGU 2001, 82, 54–58. [Google Scholar] [CrossRef]
  32. Zhang, G.; Luo, W.; Chen, W.; Zheng, G. A Robust but Variable Lake Expansion on the Tibetan Plateau. Sci. Bull. 2019, 64, 1306–1309. [Google Scholar] [CrossRef]
  33. Zhang, G.; Wang, M.; Zhou, T.; Chen, W. Advances in Remote Sensing Monitoring of Lake Area, Water Level, and Water Volume Changes on the Qinghai–Tibet Plateau. J. Remote Sens. 2022, 26, 115–125. [Google Scholar] [CrossRef]
  34. Williamson, C.E.; Saros, J.E.; Vincent, W.F.; Smol, J.P. Lakes and Reservoirs as Sentinels, Integrators, and Regulators of Climate Change. Limnol. Oceanogr. 2009, 54, 2273–2282. [Google Scholar] [CrossRef]
  35. Yao, T.; Wu, F.; Ding, L.; Sun, J.; Zhu, L.; Piao, S.; Deng, T.; Ni, X.; Zheng, H.; Ouyang, H. Multispherical Interactions and Their Effects on the Tibetan Plateau’s Earth System: A Review of the Recent Researches. Natl. Sci. Rev. 2015, 2, 468–488. [Google Scholar] [CrossRef]
  36. Wan, W.; Long, D.; Hong, Y.; Ma, Y.; Yuan, Y.; Xiao, P.; Duan, H.; Han, Z.; Gu, X. A Lake Data Set for the Tibetan Plateau from the 1960s, 2005, and 2014. Sci. Data 2019, 6, 160039. [Google Scholar] [CrossRef] [PubMed]
  37. Medina, C.; Gomez-Enri, J.; Alonso, J.J.; Villares, P. Water Volume Variations in Lake Izabal (Guatemala) from in Situ Measurements and ENVISAT Radar Altimeter (RA-2) and Advanced Synthetic Aperture Radar (ASAR) Data Products. J. Hydrol. 2010, 382, 34–48. [Google Scholar] [CrossRef]
  38. Tao, S.; Fang, J.; Ma, S.; Cai, Q.; Xiong, X.; Tian, D.; Zhao, X.; Fang, L.; Zhang, H.; Zhu, J.; et al. Changes in China’s Lakes: Climate and Human Impacts. Natl. Sci. Rev. 2020, 7, 132–140. [Google Scholar] [CrossRef]
  39. Wang, Y.; Gong, Y.; Liu, X.; Jing, Y. Enhanced Satellite Monitoring of Reservoir Water Storage Variations in the Yangtze River Basin from 1990 to 2023. J. Remote Sens. 2025, 5, 0384. [Google Scholar] [CrossRef]
  40. Yao, J.; Chao-lu, Y.; Ping, F. Evaluation of the Accuracy of SRTM3 and ASTER GDEM in the Tibetan Plateau Mountain Ranges. Proc. E3S Web Conf. 2020, 206, 01027. [Google Scholar] [CrossRef]
  41. Hayakawa, Y.S.; Oguchi, T.; Lin, Z. Comparison of New and Existing Global Digital Elevation Models: ASTER G-DEM and SRTM-3. Geophys. Res. Lett. 2008, 35, L17404. [Google Scholar] [CrossRef]
  42. Liu, K.; Song, C.; Ke, L.; Jiang, L.; Pan, Y.; Ma, R. Global Open-Access DEM Performances in Earth’s Most Rugged Region High Mountain Asia: A Multi-Level Assessment. Geomorphology 2019, 338, 16–26. [Google Scholar] [CrossRef]
  43. Zhang, G. The Dataset of All the Lakes on the Tibetan Plateau (2000); National Tibetan Plateau/Third Pole Environment Data Center: Beijing, China, 2019. [Google Scholar]
  44. Peng, H. Construction and Variation Analysis of Lake Water Level Series on the Qinghai–Tibet Plateau. Master’s Thesis, Qinghai University, Xining, China, 2022. [Google Scholar] [CrossRef]
  45. Xu, F.; Zhang, G. Lake-Level over the Tibetan Plateau Using Multi-Sensor Satellite Altimetry Data (2010–2020); National Tibetan Plateau/Third Pole Environment Data Center: Beijing, China, 2021. [Google Scholar]
  46. Qi, C.; Ren, Y.; Peng, H.; Wei, J.H.; Wang, Y.Q.; Li, Q. Lake Area Extraction and Dynamic Changes in the Source Region of the Three Rivers Based on the GEE Cloud Platform. J. Yangtze River Sci. Res. Inst. 2023, 40, 179–190. [Google Scholar] [CrossRef]
  47. Zhang, G. Lake Volume Changes on the Tibetan Plateau during 1976–2020 (>1 km2) v2.0; National Tibetan Plateau/Third Pole Environment Data Center: Beijing, China, 2021. [Google Scholar]
  48. Zhu, L.; Zhang, G.; Yang, R.; Liu, C.; Yang, S.; Qiao, B.; Han, B. Major Characteristics and Development Trends of Lake Changes on the Qinghai–Tibet Plateau over the Past 40 Years. Bull. Chin. Acad. Sci. 2019, 34, 1254–1263. [Google Scholar] [CrossRef]
  49. Pang, S. Interannual Variation in the Area and Water Volume of Lakes in Different Regions of the Tibet Plateau (1976–2019); National Tibetan Plateau/Third Pole Environment Data Center: Beijing, China, 2021. [Google Scholar]
  50. Han, X.; Zhang, G.; Wang, J.; Tseng, K.H.; Li, J.; Woolway, R.I.; Shum, C.K.; Xu, F. Reconstructing Tibetan Plateau Lake Bathymetry Using ICESat-2 Photon-Counting Laser Altimetry. Remote Sens. Environ. 2024, 315, 114458. [Google Scholar] [CrossRef]
  51. Han, X.; Zhang, G. Simulated Lake Volume Dataset on the Tibetan Plateau (2022). 2024. Zenodo. Available online: https://zenodo.org/records/13864780 (accessed on 21 August 2025).
  52. Zhu, S.; Liu, B.; Wan, W.; Xie, H.; Fang, Y.; Chen, X.; Li, H.; Fang, W.; Zhang, G.; Tao, M.; et al. A New Digital Lake Bathymetry Model Using the Step-Wise Water Recession Method to Generate 3D Lake Bathymetric Maps Based on DEMs. Water 2019, 11, 1151. [Google Scholar] [CrossRef]
  53. Heathcote, A.J.; del Giorgio, P.A.; Prairie, Y.T. Predicting Bathymetric Features of Lakes from the Topography of Their Surrounding Landscape. Can. J. Fish. Aquat. Sci. 2015, 72, 643–650. [Google Scholar] [CrossRef]
  54. Shit, P.K.; Bera, B.; Islam, A.; Ghosh, S.; Bhunia, G.S. Introduction to Drainage Basin Dynamics: Morphology, Landscape and Modelling. In Drainage Basin Dynamics: An Introduction to Morphology, Landscape and Modelling; Springer International Publishing: Cham, Switzerland, 2022; pp. 1–9. [Google Scholar]
  55. Lehner, B.; Messager, M.L.; Korver, M.C.; Linke, S. Global Hydro-Environmental Lake Characteristics at High Spatial Resolution. Sci. Data 2022, 9, 351. [Google Scholar] [CrossRef]
  56. Wang, J.; Zhu, L.; Daut, G.; Ju, J.; Lin, X.; Wang, Y.; Zhen, X. Investigation of Bathymetry and Water Quality of Lake Nam Co, the Largest Lake on the Central Tibetan Plateau, China. Limnology 2009, 10, 149–158. [Google Scholar] [CrossRef]
  57. Lipnikov, K.; Manzini, G.; Shashkov, M. Mimetic Finite Difference Method. J. Comput. Phys. 2014, 257, 1163–1227. [Google Scholar] [CrossRef]
  58. Merryman Boncori, J.P. Caveats Concerning the Use of SRTM DEM Version 4.1 (CGIAR-CSI). Remote Sens. 2016, 8, 793. [Google Scholar] [CrossRef]
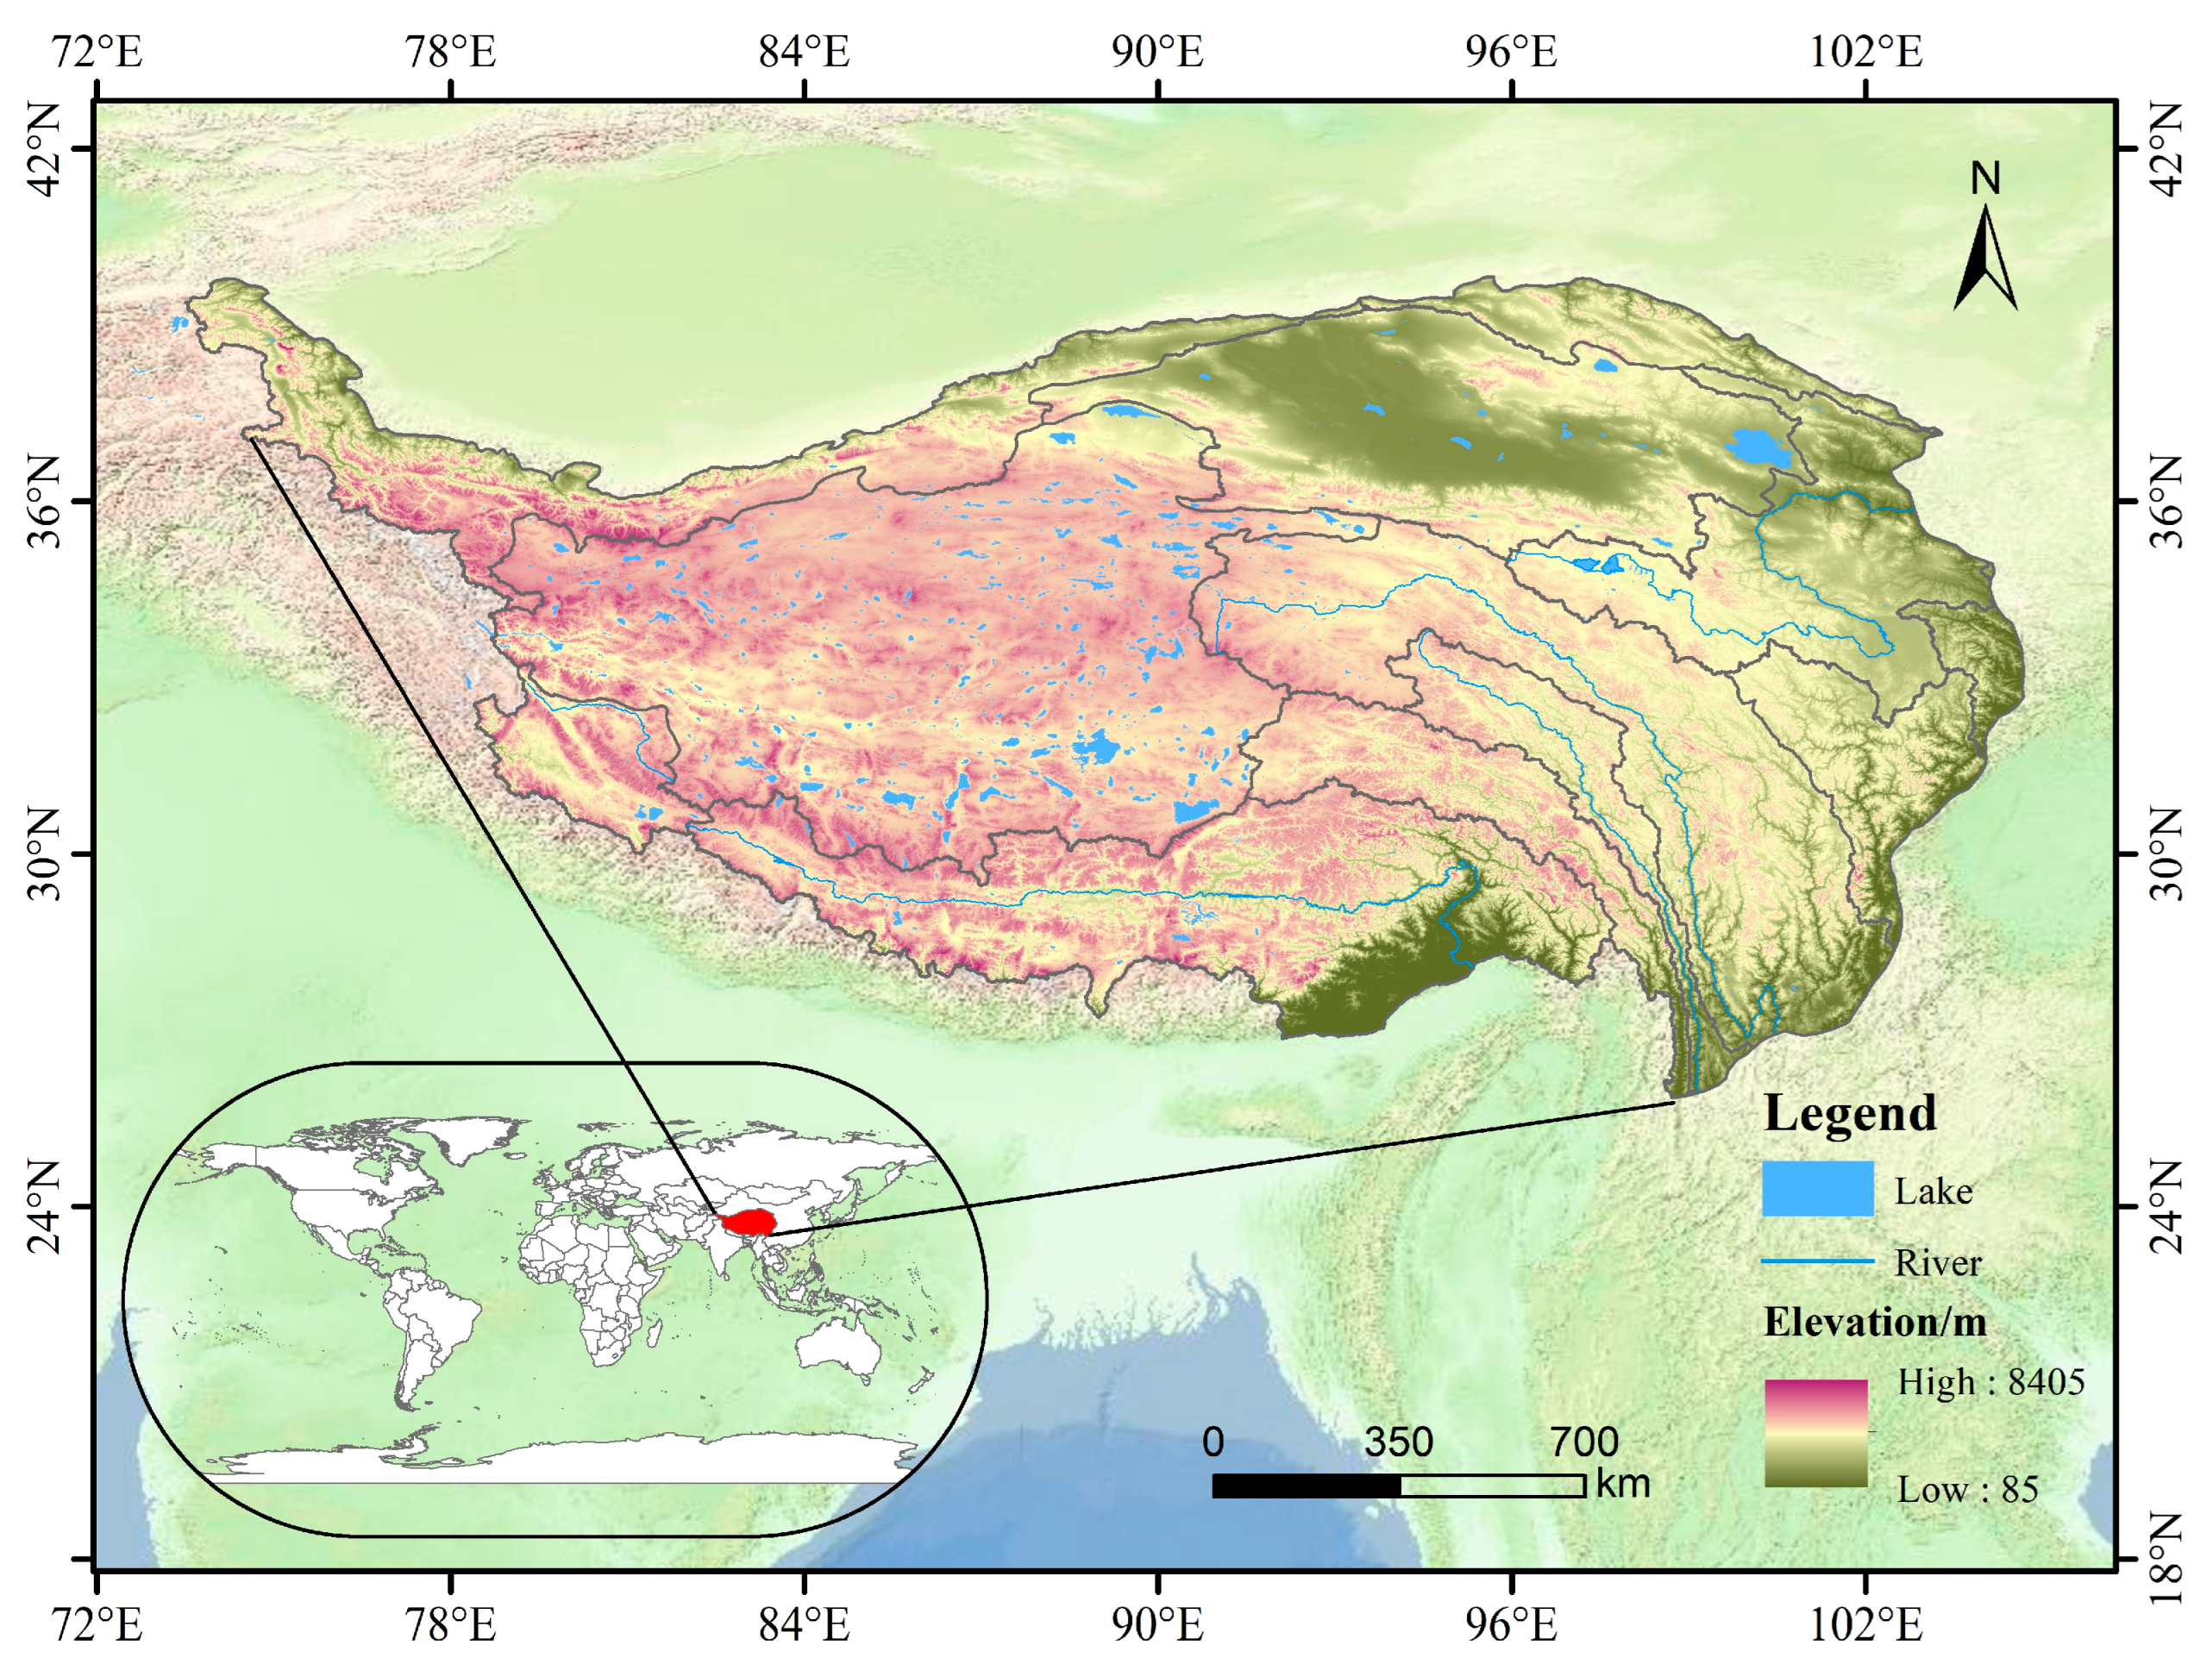
Figure 1. The overview of the study area.
Remotesensing 18 00225 g001
Figure 2. The model computational flowchart.
Remotesensing 18 00225 g002
Figure 3. An illustration of fitting starting point selection.
Remotesensing 18 00225 g003
Figure 4. The model iteration diagram.
Remotesensing 18 00225 g004
Figure 5. The slope feature diagram. (A) The slope gradient decreases with depth. (B) The slope gradient remains unchanged. (C) The slope gradient increases with depth.
Remotesensing 18 00225 g005
Figure 6. Water volume and its variations for selected lakes.
Remotesensing 18 00225 g006
Figure 7. The correlation analysis between this study’s results and Dataset III.
Remotesensing 18 00225 g007
Figure 8. Total water volume changes in lakes in different areas.
Remotesensing 18 00225 g008
Figure 9. The spatial distribution of lake water volume changes on the Qinghai–Tibet Plateau.
Remotesensing 18 00225 g009
Table 1. The correspondence between water level elevation, area, and water volume of Nam Co.
Water Level Elevation/mGrid Count/cellsArea/km2Water Volume/km3Water Level Elevation/mGrid Count/cellsArea/km2Water Volume/km3
4621313625.4004676133,3771079.7920.79
462614,976121.090.284681145,2171176.8524.59
463126,816216.560.894686157,0581271.9928.72
463638,656313.491.824691168,8981368.4933.17
464150,496409.193.084696180,7381463.6737.94
464662,337504.734.654701192,5781559.1343.03
465174,177600.836.544706204,4181656.4148.43
465686,017696.008.754711216,2581750.8954.16
466197,857793.3911.284716228,0981848.3860.21
4666109,697887.8814.134721239,9381944.1266.57
4671121,537985.0917.304724247,0422001.3170.55
Table 2. The accuracy comparison of lake water volume estimation across different lake areas.
Lake Area/km2Number of LakesRelative Error/%CCRMSE/108 m3MAE
/108 m3
50–1004480.690.654.383.23
100–5005545.870.9221.0912.82
500–10001221.600.9565.3436.83
>1000415.980.89150.57124.19
Table 3. The verification of cumulative lake water volume changes from 2010 to 2021.
Lake NameModel Results/108 m3Validation Data/108 m3Relative Error/%Absolute Error/108 m3
Daruchuo2.031.0398.341.01
Dongge Cuona Lake6.744.5847.222.16
Gaerkong Chaka4.913.2352.001.68
Heishibei Lake9.287.2727.692.01
Lingguo Co11.6815.11−22.693.43
Maerxia Co3.792.6841.621.12
Maerguo Chaka0.300.63−51.480.32
Meima Co15.1314.742.640.39
Nairiping Co1.992.18−8.490.18
Rencuo Gongma2.602.437.200.17
Sugan Lake4.533.9713.980.56
Xianhe Lake4.402.9151.331.49
Xiaochaidan Lake6.814.0866.862.73
Yan Lake30.9840.95−24.349.97
Aqikkule Lake42.8957.20−25.0214.31
Dangqiong Co2.083.40−38.831.32
Dangre Yong Co13.6822.54−39.308.86
Gasikule Lake1.071.18−8.930.11
Hala Lake12.7314.00−9.011.26
Laxiong Co1.901.90−0.370.01
Longwei Co1.332.26−41.190.93
Table 4. The accuracy verification of lake water volume change series (1990–2021).
Lake NameCCRMSE/108 m3MAE/108 m3Lake NameCCRMSE/108 m3MAE/108 m3
Jieze Chaka0.950.70.5Selin Co0.73.83
Yibu Chaka0.881.20.9Mapam Yumco0.63.22.6
Dangre Yong Co0.921.20.9Yamdrok Yumco0.980.90.65
Angzi Co0.762.31.8Wulanwula Lake0.653.42.7
Nam Co0.832.51.95Xijinwulan Lake0.910.75
Table 5. The annual change rates and trends of lake water storage on the Qinghai–Tibet Plateau.
Lake NameAnnual Change Rate/%TrendLake NameAnnual Change Rate/%TrendLake NameAnnual Change Rate/%Trend
Ago Co−0.45No TrendGuojialunqu7.68IncreasingRencuo Gongma0.67Increasing
Alu Co−0.21No TrendGuogen Co5.14IncreasingRencuo Yuoma0.78Increasing
Amu Co12.81IncreasingGuomang Co0.96IncreasingRenqingxiubu Co0.11Increasing
Aqikkule Lake0.59IncreasingGuopu Co0.38IncreasingRuola Co3.45Increasing
Aweng Co2.70IncreasingHala Lake0.23IncreasingSaibu Co3.07Increasing
Angdar Co3.83IncreasingHaiding Nor4.04IncreasingSelin Co0.85Increasing
Anglaren Co0.04No TrendHeishibei Lake1.22IncreasingShen Co0.26Increasing
Angzi Co0.61IncreasingJiarebu Co1.75IncreasingSpanggur Lake0.10Increasing
Bairebu Co0.38IncreasingJianshui Lake8.06IncreasingSugan Lake1.84Increasing
Bange Co−0.20No TrendJiesa Co−0.03No TrendTaruo Co0.06Increasing
Pangong Co0.27IncreasingJiezhe Chaka0.33IncreasingTaiyang Lake0.01No Trend
Bangda Co2.42IncreasingKatiao Co5.98IncreasingTuoheping Co2.44No Trend
Beng Co−0.26No TrendKeluuk Lake−0.12No TrendTosu Lake1.20Increasing
Buruo Co0.25IncreasingLaguo Co0.15IncreasingWanquan Lake4.53No Trend
Cangmu Co2.02IncreasingLaxiong Co−0.39DecreasingWoerba Co−0.16No Trend
Chaka Salt Lake−0.60No TrendLaorite Co−0.11No TrendWulanwula Lake0.51Increasing
Chaoyang Lake9.38IncreasingLingguo Co2.51IncreasingXijinwulan Lake4.67Increasing
Chibu Zhang Co0.26IncreasingLiudan Lake1.58IncreasingXianhe Lake8.78Increasing
Cuona0.34IncreasingLongmu Co0.26IncreasingXiangyang Lake0.21No Trend
Cuona Co−0.08No TrendLongwei Co2.94IncreasingXiachaidan Lake5.25Increasing
Cuoni0.55IncreasingLugu Lake0.07No TrendXin Lake5.03Increasing
Daru Co0.82IncreasingMaerxia Co2.40IncreasingXuru Co0.01No Trend
Dawa Co1.66IncreasingMaergai Chaka6.71IncreasingXuelian Lake0.43Increasing
Dajia Co−0.10No TrendMaerguo Chaka0.36IncreasingXuemei Lake5.80Increasing
Dangqiong Co0.61IncreasingMapam Yumco−0.05No TrendYagen Co 12.38Increasing
Dangre Yong Co0.07IncreasingMazhang Cuoqin1.87No TrendYan Lake1.67Increasing
Deyu Lake2.71IncreasingMaiqiong Co2.06IncreasingYam Co7.89Increasing
Dongge Cuona Lake0.37IncreasingMeima Co2.26IncreasingYamdrok Yumco−0.11Decreasing
Dong Co0.59IncreasingMeiriqie Cuomari3.51IncreasingYelusu Lake0.37No Trend
Dong Co2.84IncreasingMingjing Lake5.83IncreasingYibu Chaka9.30Increasing
Duli Stone Lake1.15IncreasingMuco Bingni0.08IncreasingYinbo Lake6.73Increasing
Duoge Cuoren0.34IncreasingNam Co0.09IncreasingYinma Lake−0.26No Trend
Eling Lake0.30IncreasingNairiping Co1.09IncreasingYonghong Lake4.44Increasing
Eya Co3.62IncreasingNuorma Co2.18IncreasingYoubu Co0.56Increasing
Gaerkong Chaka3.97IncreasingPalong Co0.20IncreasingYuye Lake3.63Increasing
Garin Co−0.43DecreasingPeng Co1.15IncreasingYueqia Co−0.18Decreasing
Gasikule Lake1.23No TrendQixiang Co1.03IncreasingZe Co0.29Increasing
Gemang Co0.56IncreasingQiagui Co−0.24DecreasingZhaling Lake0.06Increasing
Geren Co−0.05DecreasingQinghai Lake0.14IncreasingZharinamu Co0.17Increasing
Gongzhu Co−0.18No TrendQuemo Co0.44IncreasingZhenquan Lake13.26Increasing
Disclaimer/Publisher’s Note: The statements, opinions and data contained in all publications are solely those of the individual author(s) and contributor(s) and not of MDPI and/or the editor(s). MDPI and/or the editor(s) disclaim responsibility for any injury to people or property resulting from any ideas, methods, instructions or products referred to in the content.