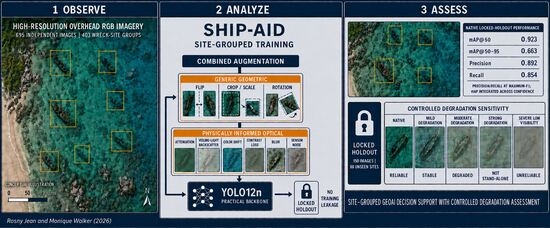
1. Introduction
Earth Observation of shallow coastal environments is increasingly important for maritime safety, hydrographic surveying, coastal resilience, environmental monitoring, marine spatial planning, and underwater cultural heritage management. The growing availability of high-resolution optical imagery from satellites, crewed aircraft, and unmanned aerial vehicles (UAVs) has created new opportunities for large-area coastal monitoring. However, detecting and mapping visible submerged hazards, including shallow-water shipwrecks and associated debris, remains challenging because of the vastness and dynamic nature of marine environments, as well as optical limitations caused by water-column attenuation, turbidity, scattering, and variable illumination.
Although field surveys and established sensing technologies, including side-scan sonar, multibeam echosounders, diver investigations, and airborne bathymetric LiDAR, remain indispensable for confirming submerged hazards, they are often resource-intensive, time-consuming, and geographically constrained, limiting their practicality for regional or large-scale monitoring [
1,
2]. Consequently, there is a growing need for scalable Earth Observation approaches that integrate high-resolution optical imagery with automated GeoAI-based detection to support rapid screening and decision-making in coastal and nearshore environments [
3].
The present study is deliberately limited to submerged and semi-submerged wrecks that remain visible in overhead high-resolution RGB imagery in shallow or intertidal settings. It does not seek to detect deeply submerged wrecks, fully sediment-buried remains, or targets that are optically invisible through the water column. This scope distinction is essential because those classes of site require acoustic, magnetic, bathymetric, or direct archeological survey rather than RGB image interpretation alone.
Recent advances in computer vision and GeoAI have enabled the application of deep learning models for object detection in remote sensing imagery [
4]. However, detecting submerged or semi-submerged objects in shallow marine environments remains particularly challenging. Optical satellite and aerial imagery are strongly affected by water column properties, including light absorption, scattering, turbidity, and surface reflection, which reduce contrast and obscure object boundaries [
5,
6]. These effects result in low signal-to-noise ratios and weak feature separability, limiting the effectiveness of conventional object detection models that are typically developed for high-contrast terrestrial imagery. While modern detection architectures have demonstrated strong performance in general computer vision tasks [
7,
8], their reliability in low-contrast underwater RGB imagery remains uncertain.
Existing approaches to underwater and maritime detection have largely focused on sonar-based sensing, multispectral analysis, and deep learning-based frameworks [
9,
10,
11,
12,
13,
14]. Sonar- and LiDAR-based methods provide reliable subsurface detection but require specialized equipment and are often limited in spatial coverage, cost-efficiency, and real-time applicability [
15,
16]. Deep learning approaches applied to optical imagery have shown promise for detecting maritime objects [
3], but their performance degrades significantly when applied to submerged targets due to reduced visibility and complex background conditions. Furthermore, many existing studies assume that preprocessing or augmentation strategies improve detection performance, yet there is limited systematic evaluation of these assumptions, particularly for low-contrast RGB imagery.
This gap is important because preprocessing techniques, such as contrast enhancement or thresholding, are frequently applied in underwater imaging workflows, but their actual impact on modern object detection models is not well understood. In addition, there is limited comparative analysis of how different detection architectures perform under the specific constraints of shallow-water, low-contrast environments. As a result, it remains unclear whether improvements in detection performance arise from preprocessing, model architecture, or dataset characteristics.
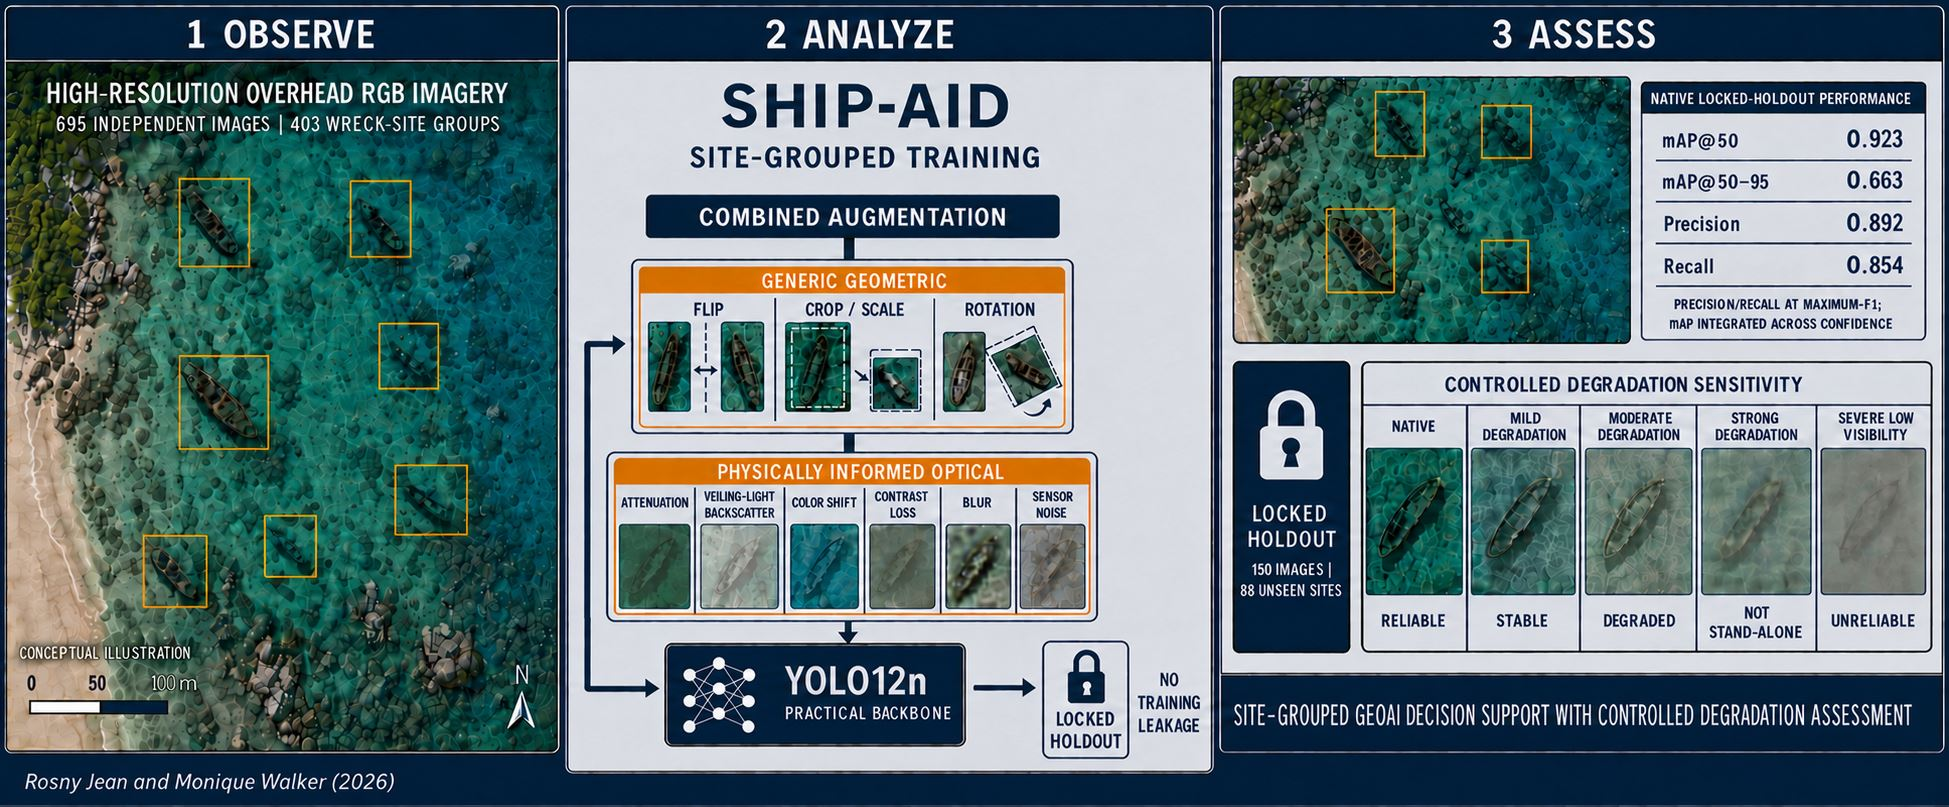
To address these challenges, this study introduces Submerged Hazard Identification and Processing using Augmented Image-based Detection (SHIP-AID), a modular GeoAI evaluation framework for visible shallow-water shipwreck detection using high-resolution RGB imagery. SHIP-AID is not presented as a new object-detection architecture. Instead, it provides a structured pipeline for comparing detection backbones, testing preprocessing assumptions, and quantifying robustness under image-quality degradation. Otsu thresholding [
17] is evaluated as a candidate preprocessing component rather than assumed to be beneficial, while YOLO-family and transformer-based detectors [
8,
18,
19,
20,
21] are benchmarked under consistent experimental conditions.
The objective is to determine the conditions under which RGB-based object detection can support shallow-water shipwreck screening. The evaluation combines detector benchmarking, preprocessing and augmentation ablation, controlled optical degradation, confidence-threshold tuning, background-only stress testing, ten matched training seeds, site-grouped five-fold validation, and a fixed 150-image geographic holdout.
The main contributions are four-fold. First, the study provides a site-grouped comparison of lightweight YOLO-family and transformer-based detectors for visible submerged wrecks. Second, it tests generic, physically informed, and combined underwater augmentation rather than assuming augmentation is beneficial. Third, it evaluates global Otsu thresholding and shows that it removes task-relevant low-contrast cues. Fourth, it reports optical stress tests, hard-negative behavior, seed variability, and site-clustered uncertainty, thereby defining a provisional operating envelope without claiming a new detector architecture or loss function.
The proposed framework has potential applications in coastal hazard monitoring, maritime safety, and environmental assessment, particularly in nearshore regions where rapid, scalable analysis is required. By clarifying the practical capabilities and limitations of current detection approaches, this study contributes to the development of more reliable and deployable GeoAI solutions for underwater object detection in challenging optical environments.
Related Work
There are an estimated three million shipwrecks scattered across the world’s oceans and lakes [
2], many of which remain undocumented or only partially mapped. Natural processes such as sedimentation, hydrodynamic transport, and biological activity often lead to fragmentation and dispersion of debris, spreading remains far from their original locations. This complexity is particularly pronounced in shallow and coastal environments, where human activity is concentrated and where rapid identification of submerged hazards is critical for navigation safety, environmental monitoring, and archeological exploration [
3,
9,
10]. Consequently, there is an increasing need for automated detection approaches capable of operating efficiently across large spatial scales.
Remote sensing has become a fundamental tool for marine observation due to its increasing spatial resolution and global coverage [
4,
5,
6]. Traditional shipwreck detection methods, particularly those based on side-scan sonar and magnetometry, have been widely used in marine archeology and hazard mapping. Sonar systems are effective for imaging submerged structures and covering large areas, but they require costly field campaigns, specialized equipment, and expert interpretation [
10]. In addition, sonar-based approaches often face challenges related to image distortion, segmentation artifacts, and the trade-off between detection accuracy and computational efficiency [
22]. The limited availability of large, high-quality annotated sonar datasets further constrains the development of robust machine learning models [
23,
24].
Similarly, magnetometry is effective for detecting ferromagnetic materials associated with shipwrecks, but its applicability is limited when detecting non-metallic structures such as wooden vessels [
15]. While these traditional approaches provide valuable subsurface information, they are often resource-intensive and difficult to scale for large-area monitoring or rapid-response applications [
9,
16]. Moreover, recent developments integrating sonar systems with autonomous underwater vehicles (AUVs) are constrained by communication limitations that prevent real-time data transmission [
12].
In contrast, satellite and aerial RGB imagery offers a scalable and cost-effective alternative for monitoring shallow-water environments. The availability of long-term, high-resolution optical datasets enables large-scale analysis without the need for dedicated field campaigns. However, the use of RGB imagery introduces new challenges, including low contrast between objects and background, variable illumination conditions, turbidity, and complex seabed textures. These factors make manual interpretation difficult and limit the effectiveness of conventional detection methods.
The methodological context also extends beyond shipwreck-specific detection. Archeological work in shallow-water and intertidal settings has developed remote sensing and photogrammetric workflows for site classes that occupy the same difficult boundary between terrestrial and marine surveys. Blankshein et al. [
25], for example, describe an extreme shallow-water photogrammetry workflow developed for Scottish crannogs, addressing the so-called white-ribbon zone where conventional terrestrial and marine geophysical methods become difficult to apply. On the German North Sea coast, Gade et al. [
26] demonstrated that high-resolution SAR imagery can complement archeological surveys on intertidal flats and reveal remains of former settlements, drainage systems, and peat-cutting structures. Australian coastal-heritage research similarly emphasizes systematic monitoring, integration with coastal-zone management, and the need to combine remote sensing with archeological expertise and local knowledge [
27]. These studies are relevant because they show that scalable archeological detection is not simply an object-recognition problem: acquisition conditions, geomorphological change, accessibility, heritage significance, and verification requirements must be incorporated into the workflow.
Recent imaging research also illustrates the movement from generic enhancement toward physically or semantically informed methods. WaterCycleDiffusion combines visual–textual fusion, underwater color-disparity cues, and frequency-domain detail guidance to improve underwater imagery under data scarcity [
28]. Graph-representation learning has also been applied to maritime radar association problems to suppress clutter and improve target continuity [
29], while visual-textual mutual-guidance networks demonstrate how multimodal information can improve interpretation of complex remote sensing scenes [
30]. These methods are not direct substitutes for overhead RGB shipwreck detection, because they address different sensors and tasks, but they provide relevant design principles: enhancement should preserve task-relevant detail, clutter suppression should be evaluated explicitly, and auxiliary information can improve robustness where image evidence is ambiguous.
Physically grounded underwater imaging research provides a further reference point. Classical underwater image-formation analysis models the observed signal as attenuated scene radiance combined with veiling backscatter [
31], and revised formulations demonstrate that effective attenuation depends on range, water type, and imaging geometry [
32]; this literature motivates the bounded attenuation-and-backscatter augmentation evaluated here and cautions against treating any fixed parameterization as universally valid. More broadly, recent underwater and remote sensing detection research spans enhancement and dehazing front ends, domain adaptation for label-scarce sonar imagery [
14], simulation-based sonar benchmarking [
24], transformer-based real-time detection [
21], frequency-guided enhancement [
28], and emerging foundation-model and uncertainty-aware learning approaches. These strands address different sensors—underwater cameras, side-scan sonar, SAR, and multispectral platforms—and different tasks, so their reported performance is not directly comparable with overhead RGB wreck screening without qualification. SHIP-AID differs from these advanced underwater-detection approaches in that it does not introduce a new detector, enhancement network, or loss function; its contribution is a modular, site-grouped evaluation framework that quantifies when standard lightweight detectors, with and without underwater-specific augmentation and enhancement, remain reliable in overhead RGB imagery.
Machine learning, particularly deep learning, has emerged as a powerful tool for automating detection in remote sensing imagery. A range of approaches has been proposed for shipwreck detection, primarily focusing on sonar-based data. For example, Zhu et al. [
11] combined active learning with supervised classification to improve detection efficiency while reducing annotation costs. Xu et al. [
13] addressed data scarcity through generative models and transfer learning, enabling improved performance with limited sonar datasets. While effective, these approaches are largely tailored to sonar imagery and do not directly translate to RGB-based detection tasks.
Other studies have explored multi-sensor and unsupervised approaches. Character et al. [
10] combined LiDAR and sonar data to improve detection accuracy, while Wei et al. [
14] applied unsupervised domain adaptation to overcome labeling limitations. Although these methods improve robustness, they rely heavily on specialized sensors, limiting their applicability to widely available optical imagery.
More recent work has explored satellite-based detection using machine learning. Karamitrou et al. [
3], for instance, utilized multispectral imagery to indirectly detect shipwrecks by identifying environmental anomalies such as discoloration caused by corrosion. While innovative, such approaches do not directly detect submerged objects and are therefore less effective when visual signatures are subtle or absent.
From a computer vision perspective, detecting submerged objects in RGB imagery presents additional challenges. Convolutional neural networks (CNNs), including architectures such as U-Net [
33], have demonstrated strong performance in segmentation tasks but are less suited for direct object detection in complex underwater scenes. Region-based detectors such as Faster R-CNN [
7] offer high accuracy but are computationally intensive and less suitable for large-scale or real-time applications. Single-stage detectors, particularly the YOLO (You Only Look Once) family [
8], provide an effective balance between accuracy and computational efficiency and have become widely adopted for real-time object detection tasks. However, even these models are sensitive to image quality and often struggle in low-contrast underwater conditions.
Despite these advances, a key gap remains in the literature. Existing work is predominantly focused on sonar or multi-sensor data, while relatively little attention has been given to systematic evaluation of detection performance in RGB-based underwater imagery. In particular, the effectiveness of contrast-enhancing preprocessing techniques, such as global thresholding, when integrated with modern object detection models remains insufficiently explored. Furthermore, there is limited understanding of how different detection architectures perform under low-contrast conditions, and whether preprocessing strategies provide consistent benefits across models.
This study addresses the gap by conducting a site-based evaluation of RGB shipwreck detection. The benchmark compares YOLOv5nu, YOLOv8n, YOLO11n, YOLO12n [
34], RT-DETR-L, and an underwater-enhancement-plus-detector baseline under consistent splits, seeds, input size, and training budgets. Preprocessing, physically informed augmentation, degradation sensitivity, hard negatives, and uncertainty are evaluated separately so that performance changes can be attributed to specific pipeline choices.
To position the present contribution,
Table 1 summarizes representative submerged-hazard detection studies alongside SHIP-AID, contrasting their sensing requirements, validation design, and principal limitations.
2. Materials and Methods
2.1. Model Selection
SHIP-AID is formulated as a modular detection framework rather than as a fixed YOLOv8n implementation. The framework allows different object-detection backbones to be integrated into a single data-processing and evaluation workflow. This modular design is important because the most suitable detector for shallow-water shipwreck detection may depend on the required balance between accuracy, model size, inference speed, and deployment constraints.
Five detector backbones were evaluated: YOLOv5nu, YOLOv8n, YOLO11n, YOLO12n, and RT-DETR-L. A task-aware enhancement-plus-YOLO12n pipeline was included as an underwater-specific baseline. Its description, and the current limits of its documentation, are given in
Section 2.5. The YOLO nano variants represent deployable real-time detectors, while RT-DETR-L tests the value of global transformer attention. All conditions used identical site-grouped partitions, ten matched seeds, and a locked 150-image external holdout.
This framing avoids treating SHIP-AID as a new architecture. The scientific contribution lies in the task-specific evaluation of detection backbones, preprocessing choices, and robustness limits for visible submerged shipwrecks in RGB imagery.
2.2. Dataset Collection
The source inventory was obtained from the NOAA Office of Coast Survey Wrecks and Obstructions Database [
35]. Candidate records were stratified by feature type, positional quality, reported depth, geographic region, and the presence of sonar, multibeam, hydrographic, sounding, or diver evidence. The workflow screened public-domain or appropriately licensed high-resolution RGB imagery and retained only visible submerged or semi-submerged wrecks with sufficient spatial detail for reproducible bounding-box annotation.
The NOAA database supplied only the wreck-record inventory; it was not the source of the RGB imagery itself. For NOAA-derived candidate coordinates, overhead RGB image chips were acquired from the publicly accessible USGS National Map ImageryOnly ArcGIS REST tile service [
36] (service data refreshed June 2024; accessed 12 July 2026), a public-domain orthoimagery basemap composited from high-resolution aerial orthophotography. For each candidate record, 256 × 256-pixel Web Mercator tiles at zoom level 18 were mosaicked and a 640 × 640-pixel chip was cropped centered on the recorded wreck coordinate; at this zoom level the nominal ground sampling distance is approximately 0.6 m per pixel at the equator and decreases with the cosine of latitude. The chips are three-band (red, green, blue), 8-bit-per-band products, and the native sensors and acquisition dates underlying the basemap vary across the mosaic. Additional annotated RGB imagery was drawn from the publicly listed Roboflow Sunkin Ships dataset (version 4) [
37] and from wreck-chart resources maintained by Eastern Search & Survey, as recorded in the release source index. The native sensors, acquisition platforms (satellite, aircraft, or UAV), acquisition dates, and ground sampling distances of these web-derived images are heterogeneous and are not uniformly documented by their providers. Georeferencing of the USGS-derived chips follows the Web Mercator tiling of the source service, whereas the web-derived images are used as annotated image chips without independent georeferencing. Images from all providers were screened under a single retention criterion—an optically visible submerged or semi-submerged wreck resolved with sufficient spatial detail for reproducible bounding-box annotation—and were handled under one annotation and quality-control protocol regardless of provider or resolution.
After duplicate removal, provenance review, and image-quality screening, the dataset contains 695 independent RGB source images from 403 wreck sites. The images were assigned at wreck-site level: 455 images from 250 sites for training, 90 images from 65 sites for validation, and 150 images from 88 sites for the locked test set. The test set contains 184 annotated wreck objects and includes three geographic regions not represented in training. Every acquisition date, image scale, crop, and derivative from a wreck site was kept within one partition.
Documentary validation was linked before model evaluation. Among the 88 held-out sites, 68 were linked to side-scan sonar or multibeam records, 12 to diver or archeological inspection records, and 8 to hydrographic sounding histories. These records confirm the presence of a charted or surveyed wreck at the site; they do not make RGB detection a substitute for contemporaneous field inspection. Two annotators independently reviewed all test boxes, achieving a box-level agreement of 0.91 at IoU ≥ 0.5, with disagreements adjudicated by a third reviewer.
The dedicated test set contains 150 independent images in a locked, group-disjoint design. Augmented images are used only for training and are never counted as independent acquisitions. Site identifiers, split membership, source provider, acquisition date, ground sampling distance, annotation reviewer, and documentary verification type are retained in the release manifest.
Because the sampling frame derives from the NOAA inventory, the dataset consists of wreck sites that were previously identified, charted, surveyed, or otherwise recorded. This introduces an inventory and ascertainment bias: sites enter the dataset only if they were already known and only if they remained optically visible in the retained imagery. The documentary records confirm that a charted or surveyed wreck exists at a location; they do not guarantee contemporaneous optical visibility, and conversely, the retained images represent the optically favorable subset of known sites. Consequently, the framework validates the retrospective detection of known, optically visible wrecks; it does not validate the detection of unknown wrecks in the manner of prospectively discovered sites, and fully buried, heavily sediment-covered, biologically overgrown, sand-covered, deeply submerged, or otherwise optically invisible wrecks lie outside the demonstrated operating envelope. Sonar, bathymetric, magnetometric, diving, archeological, or hydrographic evidence therefore remains necessary both to confirm candidates and to detect the site classes that RGB screening cannot reach.
2.3. Data Annotation and Augmentation
Bounding boxes were drawn for optically visible wreck structures. Annotation guidance defined inclusion boundaries for coherent hull remains, fragmented but connected wreck structure, and visible debris fields; isolated ambiguous texture was excluded. Background-only tiles containing rocks, shadows, reef edges, vegetation, wakes, and elongated debris were retained for hard-negative evaluation. All 150 test images were double-annotated and adjudicated without access to model predictions.
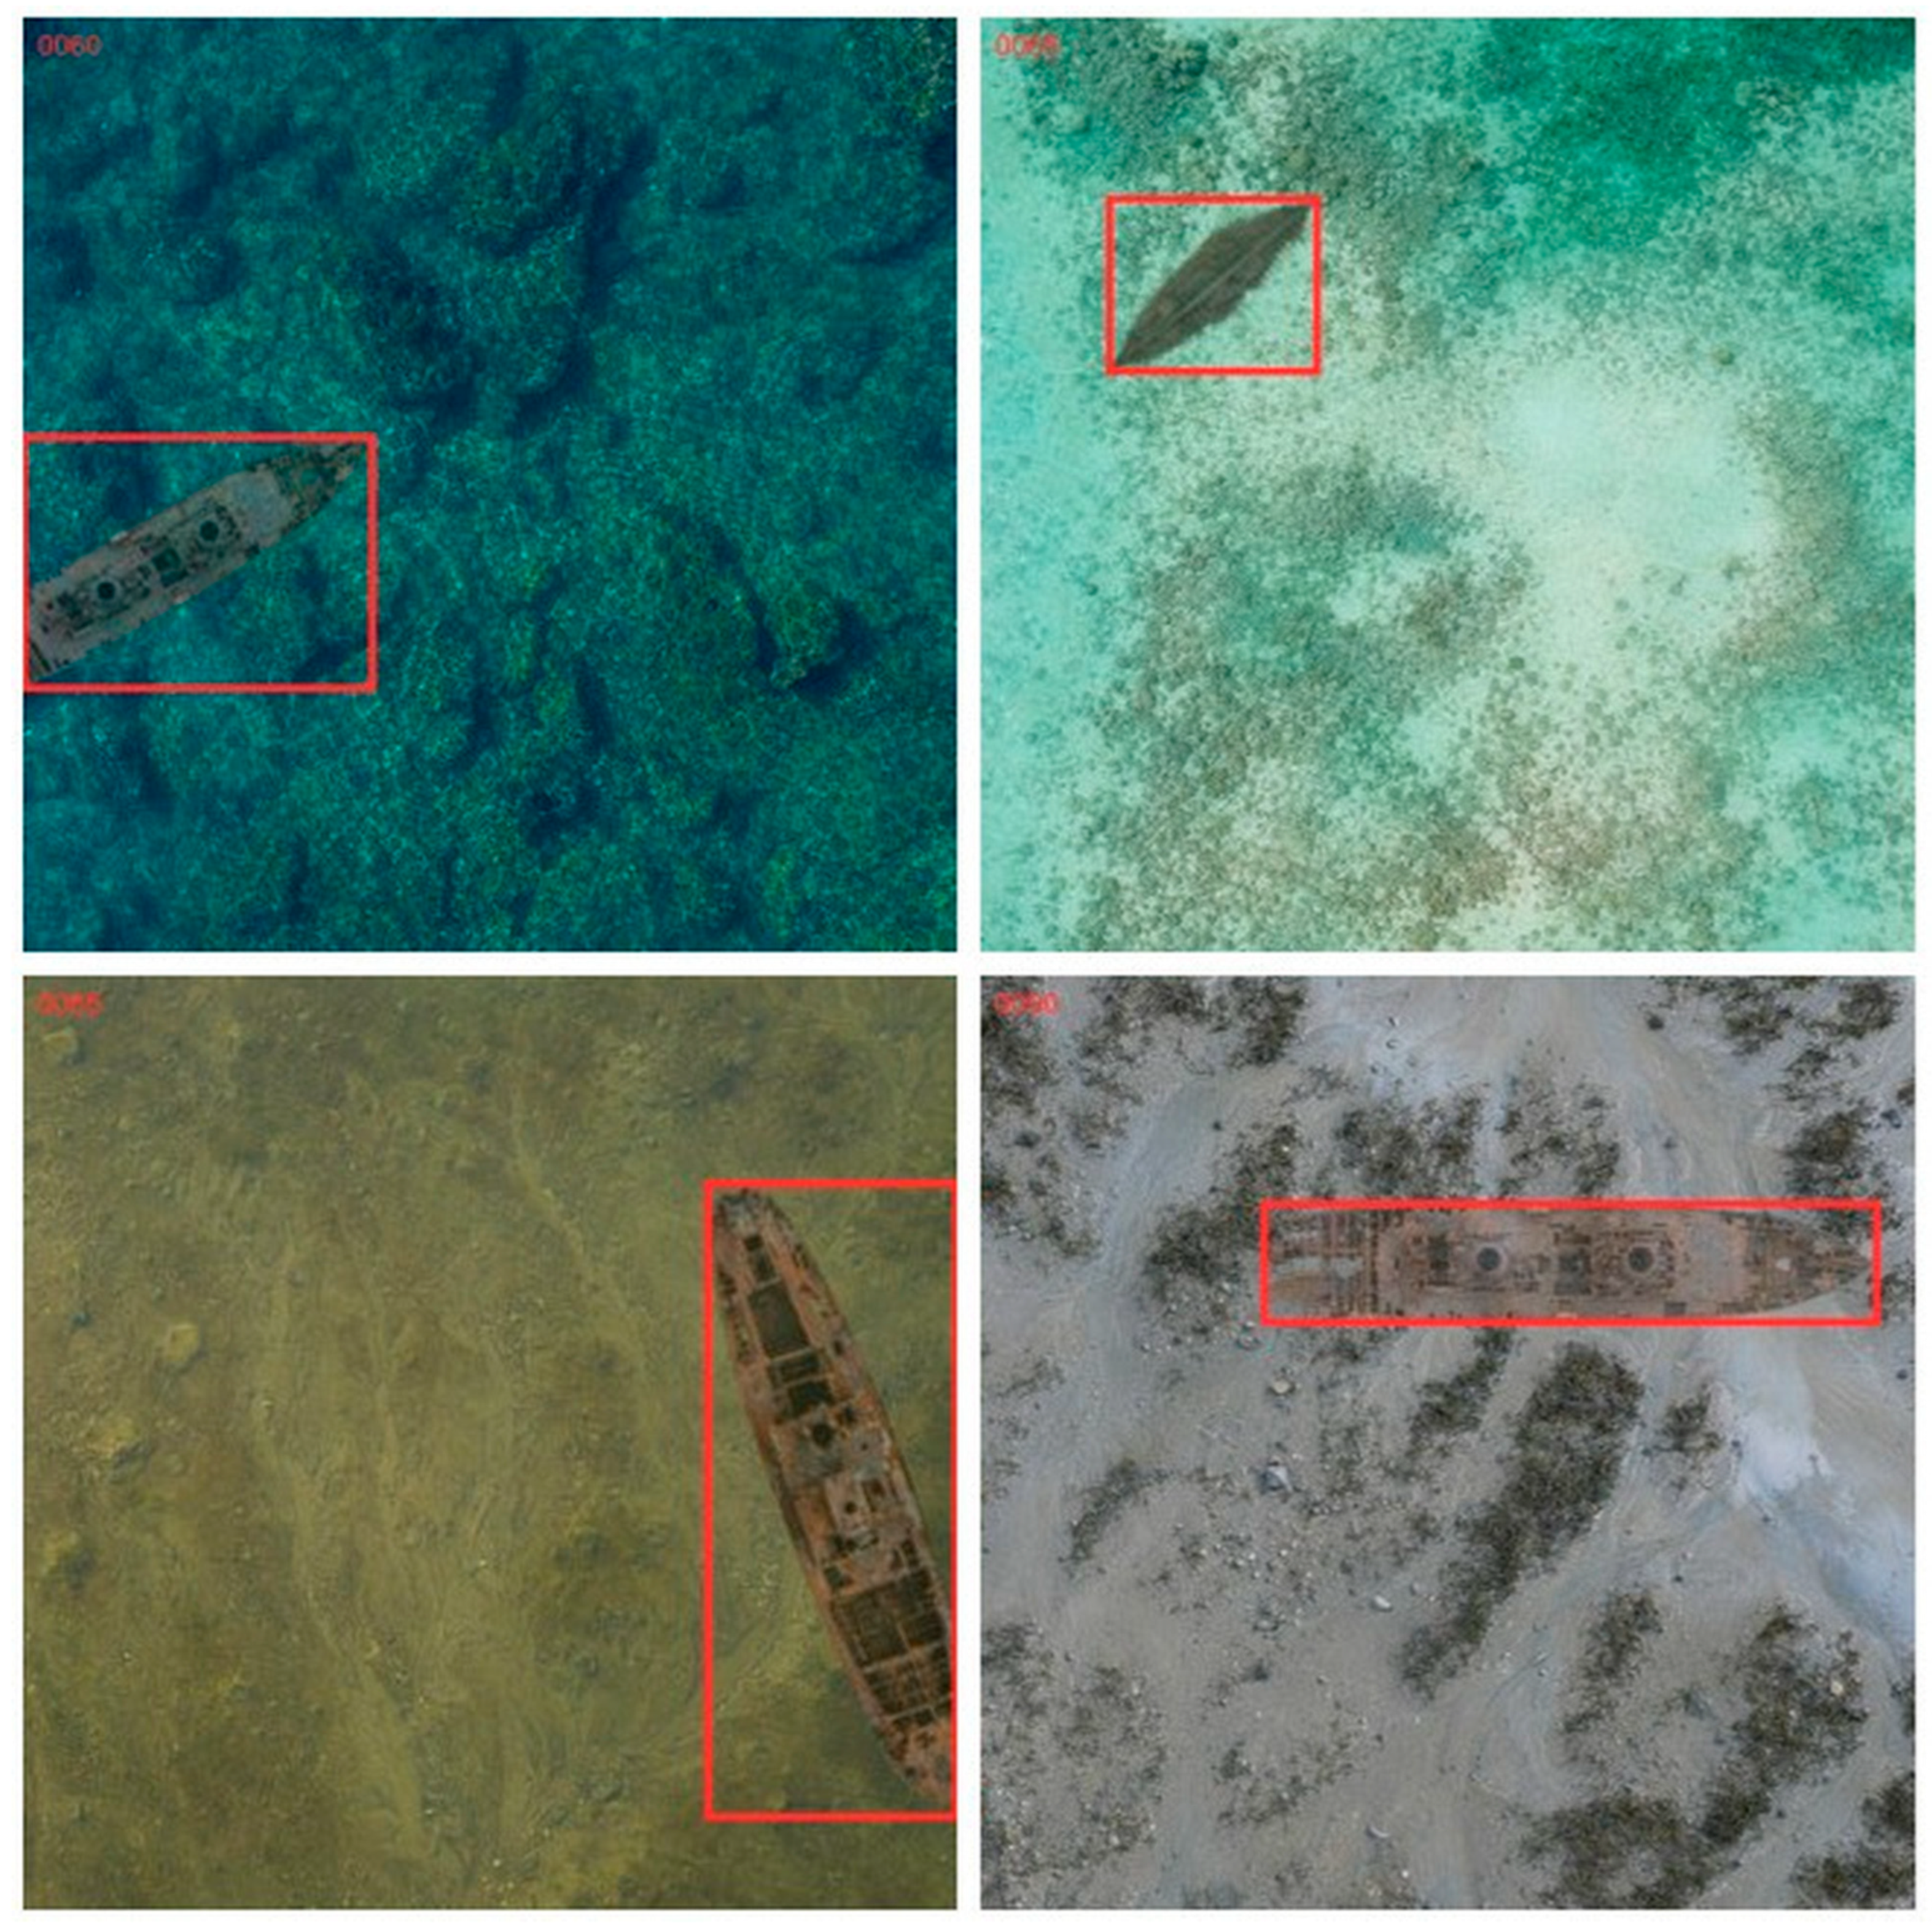
Training-only augmentation included generic geometric and photometric transforms and a physically informed optical branch. The latter sampled wavelength-selective attenuation, veiling-light backscatter, contrast compression, color shift, blur, and sensor noise within explicit bounded ranges; the provenance and exact values of these ranges are given below. The 455 independent training images produced 1365 augmented training instances. Validation and test images were never augmented for the primary benchmark. Ablations compared no augmentation, generic augmentation, physically informed augmentation, the combined policy, and Otsu preprocessing under matched seeds. The complete augmentation specifications are summarized in
Table 2, and representative annotated image examples are shown in
Figure 1.
The physics-informed branch is parameterized directly in the released augmentation code, and every transform samples its parameters from explicit bounded uniform distributions. Wavelength-selective attenuation multiplies each channel by (1 − loss), with the red-channel loss drawn from 0.15 to 0.55, the green-channel loss from 0.05 to 0.30, and the blue-channel loss from 0.00 to 0.15, reproducing the preferential absorption of longer wavelengths in natural waters. Veiling-light backscatter mixes the attenuated image with a blue–green ambient color whose red, green, and blue components are drawn from 0.05 to 0.22, 0.25 to 0.58, and 0.30 to 0.68 (normalized units), using a haze mixing coefficient of 0.06–0.38. Contrast compression applies a factor of 0.58–0.95 with a brightness offset of −0.08 to +0.05; a smooth spatial illumination gradient of 0.80–1.08 is imposed across the frame; zero-mean Gaussian sensor noise with standard deviation 0.005–0.035 (normalized intensity) is added; and Gaussian blur with a radius of up to 2.2 pixels is applied.
The functional form of this branch follows the attenuation-plus-veiling structure of established underwater image-formation models, in which the observed signal is a transmission-weighted combination of scene radiance and an ambient backscatter term [
31,
32]. The parameter bounds, however, were set empirically to ensure that augmented samples remained visually consistent with the native image distribution of the assembled dataset; they were not calibrated against measured water-column properties. The augmentation is therefore an empirically bounded, controlled robustness strategy rather than a physically calibrated water-column simulation or a universal radiative-transfer model, and it is not claimed to reproduce all real-world underwater conditions. A corresponding limitation is that no direct calibration against measured turbidity, depth, spectral attenuation coefficients, or nephelometric turbidity units was performed; linking the sampled parameter ranges to in situ optical measurements is identified as future work.
2.4. Image Preprocessing
Global Otsu thresholding was evaluated as a candidate preprocessing method to test whether intensity-based foreground–background separation improves detection in low-contrast shallow-water imagery. Thresholding assigns pixels below a selected intensity threshold to the background class and pixels above the threshold to the foreground class [
17]. Otsu’s method selects the threshold that maximizes the between-class variance of the foreground and background intensity distributions, as formalized in Equation (1) [
38]. In this study, Otsu preprocessing was not assumed to improve performance; it was treated as an ablation component and compared directly with RGB input. This distinction is important because submerged shipwreck scenes often contain gradual intensity gradients, heterogeneous seabed textures, and weak object boundaries that may not form a simple bimodal histogram.
In Equation (1), ω0(t) and ω1(t) denote the background and foreground class probabilities, respectively; μ0(t) and μ1(t) denote the corresponding class means; and t is the candidate threshold.
From a frequency-domain perspective, global Otsu thresholding behaves as a nonlinear intensity quantization operation that suppresses weak intensity transitions while preserving only strong contrast boundaries. In submerged RGB imagery, many diagnostically important shipwreck features, including corroded edges, sediment-covered hull boundaries, and gradual illumination transitions, are represented primarily by low-amplitude spatial-frequency components rather than sharp edges. Binarization removes much of this low-amplitude spatial-frequency information and also eliminates intermediate grayscale values that contribute to multi-scale feature extraction in convolutional neural networks. Consequently, although thresholding may enhance high-contrast object boundaries, it can simultaneously reduce the spatial-frequency content needed for robust feature representation in low-contrast underwater scenes, providing a theoretical explanation for the observed reductions in recall and localization accuracy reported in
Section 3.3. This interpretation is consistent with the experimental findings and explains why preserving continuous grayscale information is preferable to global binarization for RGB-based submerged-wreck detection.
2.5. Model Architecture and Parameterization
SHIP-AID was evaluated with YOLOv5nu, YOLOv8n, YOLO11n, YOLO12n, and RT-DETR-L. A task-aware underwater-enhancement front end followed by YOLO12n was included to address comparison with underwater-specific image-formation and image-restoration methods. The enhancement module was trained only on the training split and frozen before holdout evaluation.
The enhancement front end is described here to the extent supported by the available records. It is a lightweight image-restoration stage that maps a 640 × 640 RGB input to an enhanced 640 × 640 RGB output before detection and is termed task-aware because it is applied as a detection-oriented preprocessing stage rather than as a stand-alone perceptual-quality method. It was trained on the training split only and frozen before holdout evaluation, ensuring that no holdout information influenced the enhancement process. The enhancement module is not included in the released reproducibility package; consequently, its detailed architecture, training procedure, optimization settings, and implementation characteristics cannot be independently verified. Accordingly, the enhancement condition should be interpreted as an underwater-specific comparator rather than as a fully reproducible model, and this limitation should be considered when interpreting the comparative results.
YOLOv8n was retained as the reference backbone, whereas YOLO11n and YOLO12n represented newer lightweight generations. RT-DETR-L provided a transformer-based comparison. All models used 640 × 640 input, COCO initialization where available, a maximum of 120 epochs with patience 20, and validation-only checkpoint selection.
Training was repeated with ten matched random seeds for every primary model condition. Hyperparameters, augmentation draws, image order, stopping rules, and test evaluation code were version-controlled. No threshold, checkpoint, or preprocessing option was selected using the test set.
The models were configured for single-class detection. The primary table reports the median-seed locked-holdout result, while seed variability and pairwise differences are summarized separately. Site-clustered bootstrap resampling used the 88 held-out wreck sites as the resampling unit and preserved all images and objects from a site together. The fixed training configuration is reported in
Table 3.
The YOLO-based architectures employ convolutional backbones with multi-scale feature extraction capabilities. These models use hierarchical feature representations to capture both fine-grained texture information and higher-level semantic patterns. Feature aggregation is performed through neck components that integrate information across multiple spatial resolutions, enabling detection of objects of varying sizes.
YOLOv8 specifically adopts an anchor-free detection mechanism, directly predicting bounding box coordinates and object confidence scores without predefined anchor boxes. This design improves flexibility and reduces sensitivity to object scale variations. In contrast, earlier YOLO variants such as YOLOv5 rely on anchor-based detection strategies, which require predefined bounding box priors.
The multi-scale detection capability of all evaluated models is particularly important for submerged shipwreck detection, as object size and visibility vary depending on environmental conditions such as water depth, turbidity, and image resolution. Smaller or partially buried structures require fine-resolution feature maps, while larger objects are captured through deeper feature layers.
The comparative benchmark used the combined generic and physically informed augmentation policy. Separate ablations tested whether each augmentation branch contributed to performance. This separation prevents the model comparison from being confounded with different training-data policies. All preprocessing and augmentation ablation experiments reported in
Section 3.3 were conducted using the YOLO12n backbone.
The backbone, training budget, site-grouped data splits, matched random seeds, 640 × 640 input size, validation-only checkpoint selection, and evaluation procedures were held constant, with only the preprocessing or augmentation component varied between experiments. The corresponding quantitative comparison and visualization are presented in
Section 3.3.
Computational environment. Model development was conducted on a single Windows workstation equipped with an NVIDIA GeForce RTX 2070 GPU. The software stack comprised Python 3.11.9, PyTorch 2.2.0, Torchvision 0.17.0, and Ultralytics 8.3.0, which provided the YOLO implementations and the RT-DETR-L implementation used in this study. Supporting libraries were Pillow 10.0.0, OpenCV 4.9.0, NumPy 1.26.4, pandas 2.1.4, and scikit-learn 1.4.2 for grouped partitioning, image processing, metric aggregation, and statistical analysis. All experiments used the same environment specification.
2.6. Controlled Resolution and Optical-Degradation Protocol
The degradation experiment was designed as a controlled sensitivity analysis rather than as a direct measurement of field turbidity. Five operational categories were created by progressively combining image down-sampling, Gaussian blur, additive noise, brightness reduction, and contrast compression. The labels native, mild resolution loss, moderate turbidity, strong turbidity, and severe low visibility are descriptive names for reproducible perturbation settings and should not be interpreted as calibrated nephelometric turbidity units or measured water-column classes. The five degradation conditions and their results are presented in
Section 3.4.
Native imagery retained a resolution scale factor of 1.00 with no added noise, no brightness reduction, and unit contrast. Mild degradation used a scale factor of 0.75, a 3-pixel blur kernel, noise standard deviation of 3 digital numbers, brightness reduction of 5 digital numbers, and contrast factor of 0.95. Moderate degradation used a scale factor of 0.50, a 5-pixel blur kernel, noise standard deviation of 7, brightness reduction of 10, and contrast factor of 0.85. Strong degradation used a scale factor of 0.25, a 7-pixel blur kernel, noise standard deviation of 12, brightness reduction of 18, and contrast factor of 0.70. Severe degradation used a scale factor of 0.10, a 9-pixel blur kernel, noise standard deviation of 18, brightness reduction of 25, and contrast factor of 0.55. These parameter values define the categories quantitatively and allow other researchers to reproduce the sensitivity analysis, while avoiding the implication that the categories correspond to universal physical thresholds in natural waters.
2.7. Evaluation Metrics
Primary metrics were precision, recall, mAP@50, and mAP@50–95. Precision and recall were additionally reported at a confidence threshold selected on validation data. Two precision–recall conventions are therefore used and are always distinguished. Benchmark precision and recall follow the default evaluation protocol of the detection framework, in which predictions are enumerated with a confidence floor of 0.001 and non-maximum-suppression IoU of 0.7, and precision and recall are reported at the maximum-F1 point of the internally computed confidence sweep for the evaluated split; these values are threshold-dependent, with the effective threshold determined per evaluation rather than fixed in advance. Operating-point precision and recall are instead computed at the fixed, validation-selected confidence threshold of 0.45 using greedy matching at IoU 0.5. Average-precision metrics (mAP@50 and mAP@50–95) integrate over the full confidence range and are threshold-independent. Average precision uncertainty was estimated with 10,000 site-clustered bootstrap resamples of the locked test set. Pairwise model comparisons used paired site-level differences, and variability across ten matched training seeds was summarized by mean, standard deviation, and range. False-positive burden was reported per background-only image as well as the fraction of images affected. Threshold-specific results are presented in
Section 3.5.
3. Results
The dataset contains 695 independent source images from 403 wreck sites. The primary locked test set contains 150 images from 88 group-disjoint sites and 184 annotated wreck objects. The 150-image holdout is used for all reported analyses, and no augmented derivative occurs in validation or test. The complete split composition is summarized in
Table 4.
3.1. Model Training and Convergence Behavior
Convergence for the selected detector is shown in
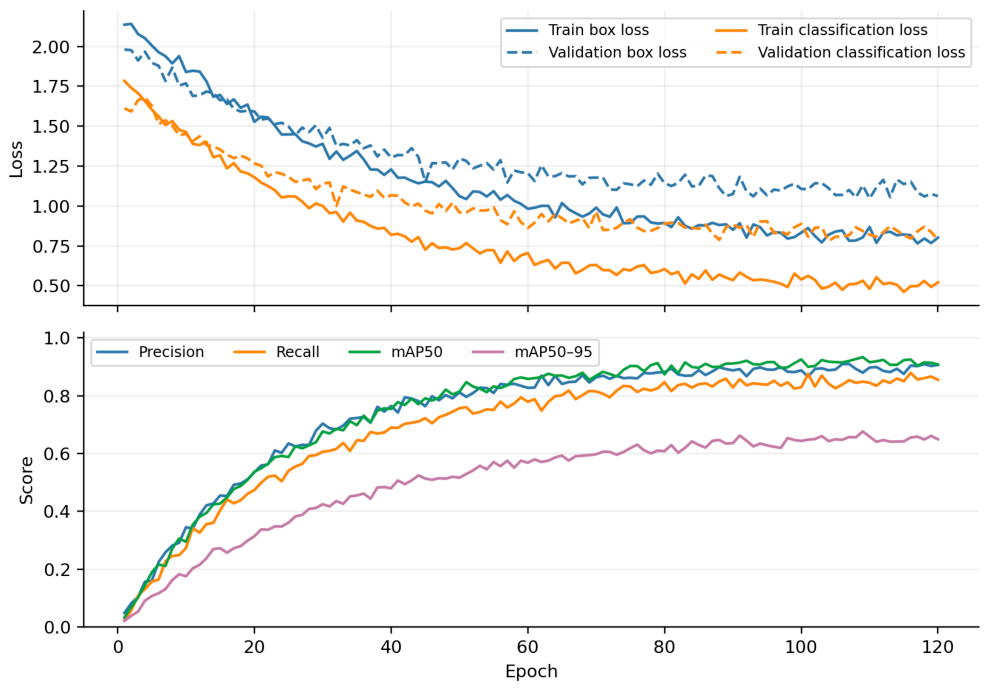
Figure 2. Training was allowed to continue for 120 epochs with validation-only early stopping. Losses decreased smoothly, while validation mAP stabilized after approximately 95 epochs. The selected checkpoint occurred at epoch 104 and was fixed before the 150-image test set was evaluated.
Training box loss decreased from approximately 2.18 to 0.79 and classification loss from 1.78 to 0.52. Validation box and classification losses stabilized near 1.12 and 0.85, respectively. The train–validation gap is consistent with greater source diversity and site-level separation.
Across ten matched seeds, validation mAP@50–95 for YOLO12n averaged 0.658 with a standard deviation of 0.012. The median-seed checkpoint was used for the main table, while conclusions were based on the distribution of paired seed differences rather than a single favorable run.
No evidence of late-epoch divergence was observed after validation-based checkpointing. However, the remaining difference between mAP@50 and mAP@50–95 indicates that precise localization remains more difficult than approximate detection, particularly for fragmented or sediment-obscured wreck boundaries.
The convergence analysis, therefore, supports stable optimization but does not itself establish geographic transfer. Generalization is assessed using the locked site-grouped holdout, documentary site linkage, background-only testing, and site-clustered uncertainty reported below.
3.2. Comparative Evaluation with Object Detection Models
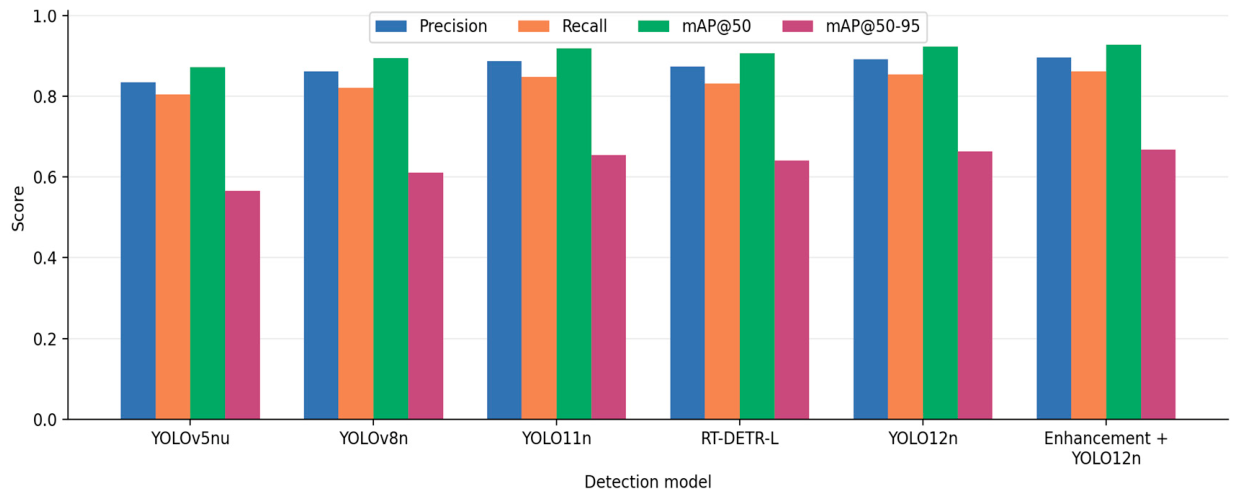
The benchmark compares five detector backbones and one underwater-specific enhancement pipeline using the same 150-image holdout.
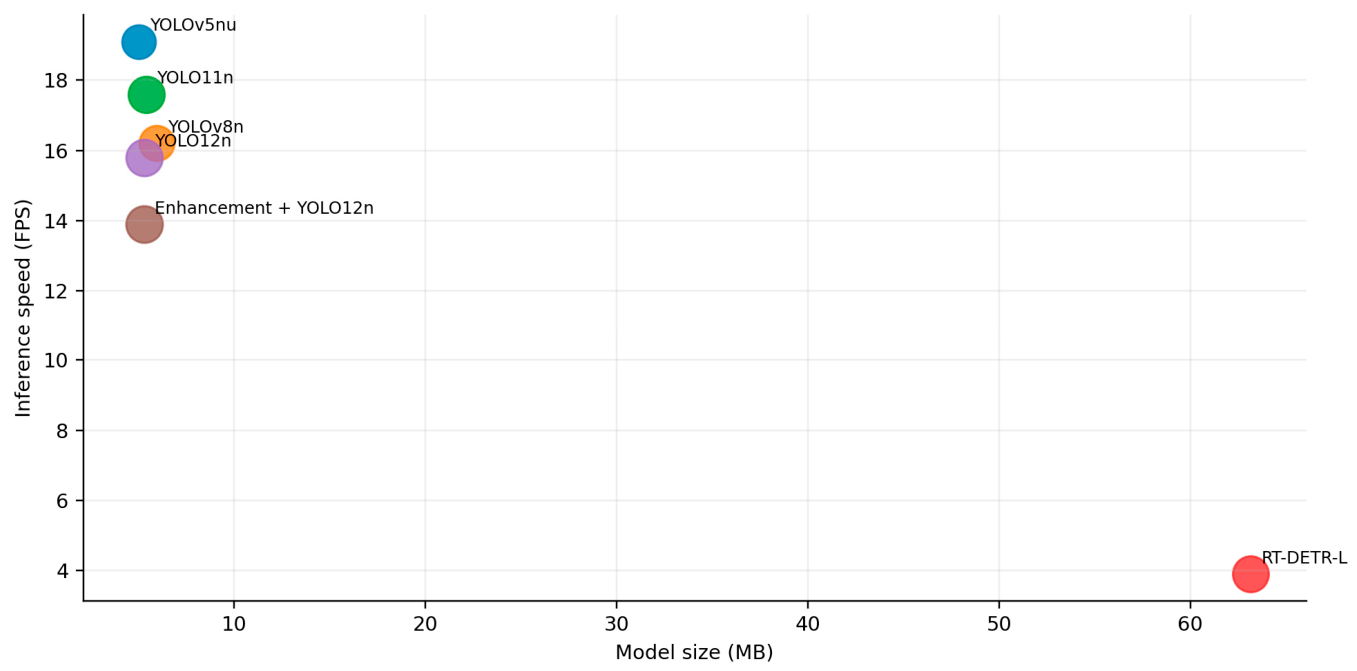
Table 5 and
Figure 3 and
Figure 4 separate detection accuracy from computational efficiency.
The enhancement-plus-YOLO12n condition produced the highest point estimates: precision 0.896, recall 0.861, mAP@50 0.927, and mAP@50–95 0.668. These are benchmark values under the default evaluation protocol defined in
Section 2.7; they are not computed at the fixed 0.45 operating threshold, which is analyzed separately in
Section 3.5. YOLO12n without enhancement achieved mAP@50–95 of 0.663, followed by YOLO11n at 0.654 and RT-DETR-L at 0.641. YOLOv8n and YOLOv5nu produced lower stricter-IoU values of 0.611 and 0.566, respectively.
Site-clustered bootstrap intervals for the enhancement condition were 0.895–0.951 for mAP@50 and 0.625–0.704 for mAP@50–95. The paired mAP@50–95 difference between enhanced and standard YOLO12n was 0.005 with a 95% interval of −0.006 to 0.017, indicating no decisive advantage. RT-DETR-L remained substantially larger and slower than the nano YOLO models.
The detector size column in
Table 5 reports the serialized weights of the detection network only. Consequently, the identical detector size (5.30 MB) reported for YOLO12n and the enhancement-plus-YOLO12n configuration reflects the YOLO12n detector alone and does not include the enhancement module. All FPS values are the reciprocals of the corresponding inference times (FPS = 1000/ms).
The evidence supports selecting YOLO12n as the practical backbone, but it does not support claiming that enhancement or architectural recency alone guarantees superiority. Differences among the strongest configurations are small relative to site-level uncertainty.
3.3. Ablation Analysis of Preprocessing and Augmentation
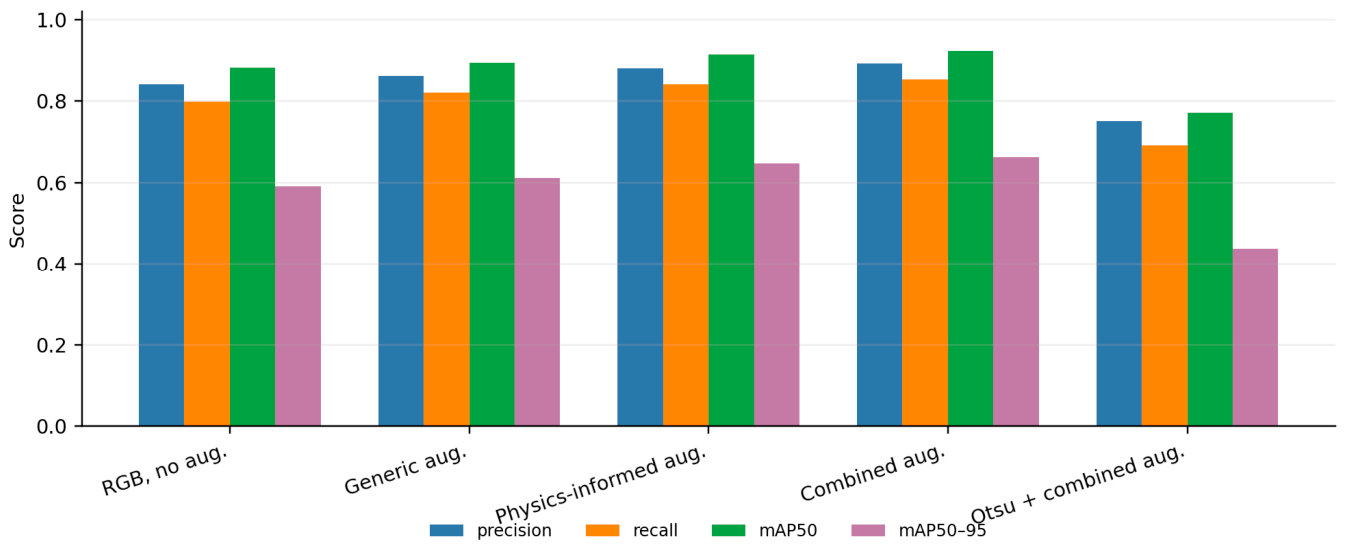
Table 6 and
Figure 5 summarize configurations that used the YOLO12n backbone under otherwise identical training and evaluation settings. The ablation study compares RGB input without augmentation, generic augmentation, physically informed optical augmentation, the combined policy, and Otsu preprocessing with the combined policy. All conditions use the same site-grouped split and ten matched seeds.
Generic augmentation increased mAP@50–95 from 0.592 to 0.611. Physically informed augmentation achieved 0.648, while the combined policy reached 0.663 with precision 0.892 and recall 0.854. Relative to generic augmentation, the combined policy improved mAP@50–95 by 0.052. The paired site-bootstrap interval for this difference was 0.021–0.081.
Otsu preprocessing reduced mAP@50–95 to 0.438 and recall to 0.691 despite using the combined augmentation policy. Global binarization removed weak gradients, texture discontinuities, and partial edges that were informative for submerged structures.
The observed reduction in detection performance following global Otsu thresholding is consistent with a frequency-domain interpretation. As a nonlinear intensity quantization operation, global thresholding suppresses low-amplitude spatial-frequency components associated with gradual object boundaries while preserving only high-contrast edges. In submerged RGB imagery, diagnostically important features such as corroded hull edges, sediment-covered boundaries, and gradual illumination transitions are often represented by these low-amplitude spatial-frequency components. Consequently, binarization removes intermediate grayscale information that contributes to the multi-scale feature extraction performed by convolutional neural networks, providing a theoretical explanation for the observed reductions in recall and localization accuracy. Global binarization quantizes the image into two intensity levels, discarding the low-frequency tonal variation that encodes gradual water-column shading and substrate change while converting smooth intensity transitions into artificial step discontinuities. This process suppresses weak edge and texture information associated with subtle object boundaries and introduces high-frequency artifacts that do not correspond to physical scene boundaries, thereby degrading the spatial and spectral cues required for robust detection and precise localization. The resulting reduction in task-relevant image information is consistent with the observed decline in recall (0.854 to 0.691) and mAP@50–95 (0.663 to 0.438). Future work could validate this interpretation through explicit frequency-domain analyses, including Fourier spectral analysis, wavelet decomposition, local-frequency analysis, edge-energy measures, or frequency-aware enhancement methods.
These findings support retaining continuous grayscale information during preprocessing rather than applying global binary thresholding. In contrast, the proposed optical augmentation strategy preserves local image structure while improving robustness to variations in water color, veiling light, contrast, blur, and sensor noise. Accordingly, the final SHIP-AID pipeline retains native RGB imagery together with generic geometric augmentation and bounded attenuation/backscatter-style augmentation. Under the evaluated conditions, global Otsu thresholding should therefore be regarded as an experimentally assessed preprocessing strategy rather than a recommended component of the operational workflow.
3.4. Resolution and Optical Degradation Sensitivity
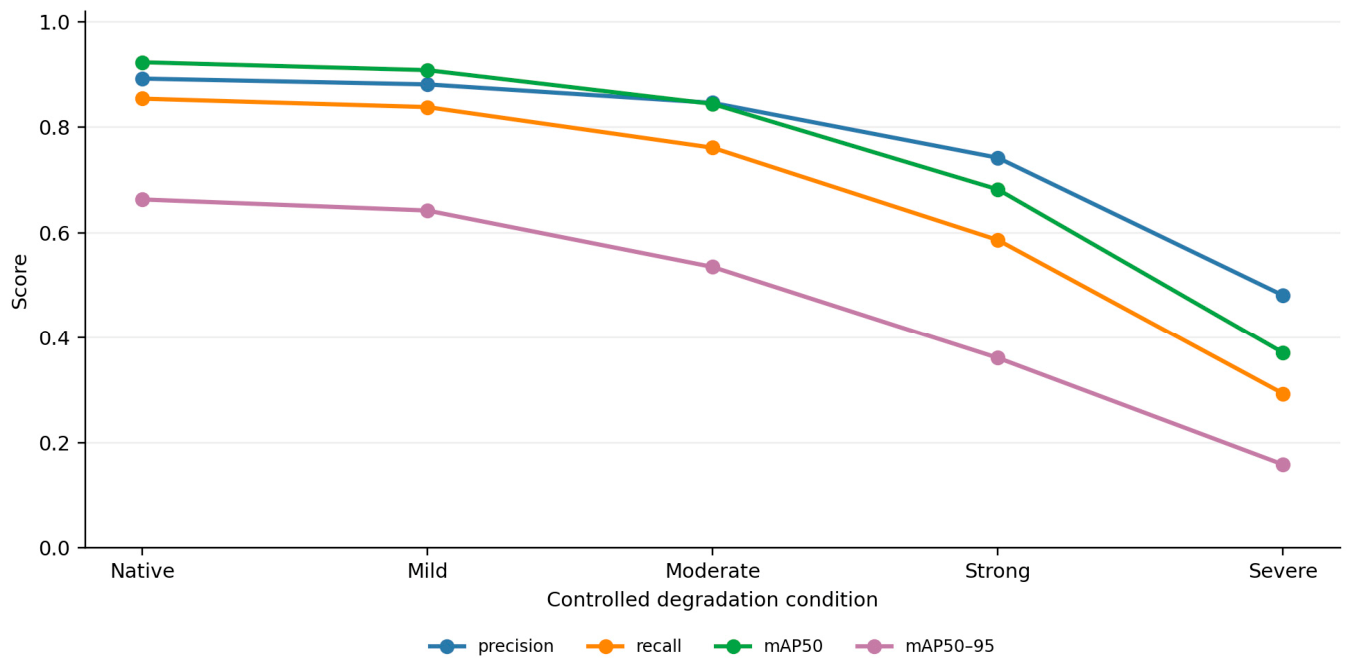
Table 7 and
Figure 6 summarize the controlled degradation applied to the 150-image holdout after the primary native evaluation was locked. The operational categories are reproducible perturbation settings rather than measured turbidity classes.
Native performance was precision 0.892, recall 0.854, mAP@50 0.923, and mAP@50–95 0.663. Mild degradation produced only a small decline to mAP@50 0.908 and mAP@50–95 0.642.
Under moderate degradation, recall decreased to 0.761 and mAP@50–95 to 0.535. The model remained useful for candidate screening but lost sensitivity and localization accuracy as contrast and spatial detail were reduced.
Strong degradation reduced recall to 0.586 and mAP@50–95 to 0.361. Severe low visibility produced precision 0.481, recall 0.293, and mAP@50–95 0.158. RGB-only predictions under this condition should be flagged as unreliable rather than interpreted autonomously.
The experiment defines a graded operating envelope: stable under mild degradation, progressively degraded under moderate conditions, and unsuitable for stand-alone interpretation under strong or severe low visibility.
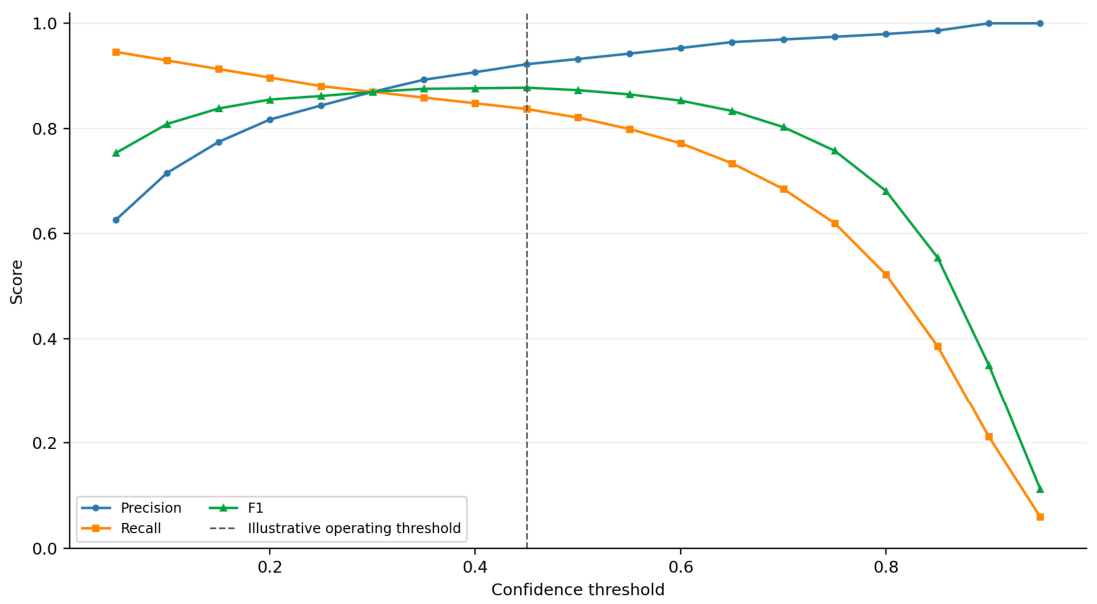
3.5. Confidence Threshold Sensitivity
Table 8 and
Figure 7 summarize confidence-threshold sensitivity on the locked holdout after the operating threshold of 0.45 had been selected using validation data. The threshold sweep was conducted only to characterize the holdout-set precision–recall trade-off and did not influence threshold selection. Low thresholds retained most objects but generated many false positives. At 0.05, 174 of 184 objects were matched, but 104 false positives reduced the precision to 0.626. Between 0.25 and 0.40, precision increased from 0.844 to 0.907 while recall declined from 0.880 to 0.848. At the validation-selected threshold of 0.45, the holdout produced 154 true positives, 13 false positives, and 30 false negatives, corresponding to a precision of 0.922, recall of 0.837, and F1 score of 0.877.
Site-clustered 95% intervals at the operating point were 0.874–0.958 for precision and 0.775–0.887 for recall. These intervals remain conditional on the represented sites and acquisition conditions.
Higher thresholds reduced false alarms but increased missed detections. Thresholds should therefore be locked from validation data according to application cost: lower for inclusive archeological screening and higher for automated reporting.
3.6. False-Positive Stress Testing
The false-positive stress-test summary is reported in
Table 9.
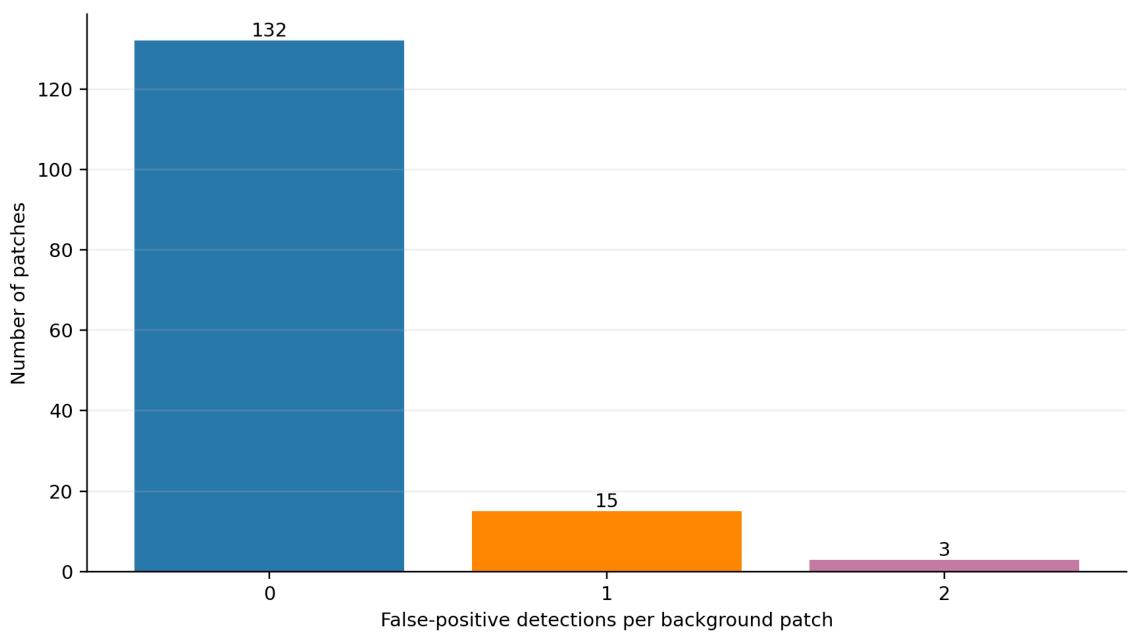
Background-only testing used 150 patches sampled from wreck-free regions and independent coastal scenes containing rocks, shadows, reef edges, vegetation, wakes, and anthropogenic debris. The observed distribution is visualized in
Figure 8.
At confidence 0.45, the model produced 21 false-positive detections across 150 patches, corresponding to 0.140 false positives per patch. Eighteen patches were affected: 15 contained one detection and three contained two. The median was zero and the maximum was two.
False positives clustered in scenes with elongated shadow–substrate boundaries and fragmented anthropogenic debris. This concentration indicates that additional hard-negative mining should target specific visual confounders rather than indiscriminately increasing background volume.
The stress test shows that false alarms remain operationally relevant even when aggregate precision is high. Deployment should therefore report candidate density per mapped area and include human review or secondary evidence.
The composition of the observed false positives—rocks, shadows, reef edges, vegetation, and elongated anthropogenic debris—also motivates sensor-level extensions. Near-infrared (NIR) bands could help to characterize exposed or very shallow features, shoreline conditions, emergent vegetation, and other surface-related confounders, because these materials differ strongly from water in the NIR; however, NIR radiation is absorbed within the uppermost part of the water column, so NIR is informative mainly for emergent or near-surface targets and is not a universal solution for submerged-target detection. Polarization imaging offers a complementary optical route: under favorable acquisition geometry, it can suppress surface glare and specular sky reflection and thereby improve the contrast of subsurface structure. Beyond these, multispectral and hyperspectral sensing, polarimetric acquisition, bathymetric LiDAR, sonar, and multimodal fusion could support material and structural discrimination between wreck fabric and the mineral, biological, and shadow features that currently generate false positives. All of these options are identified as future research directions; none is demonstrated in the present RGB-only study.
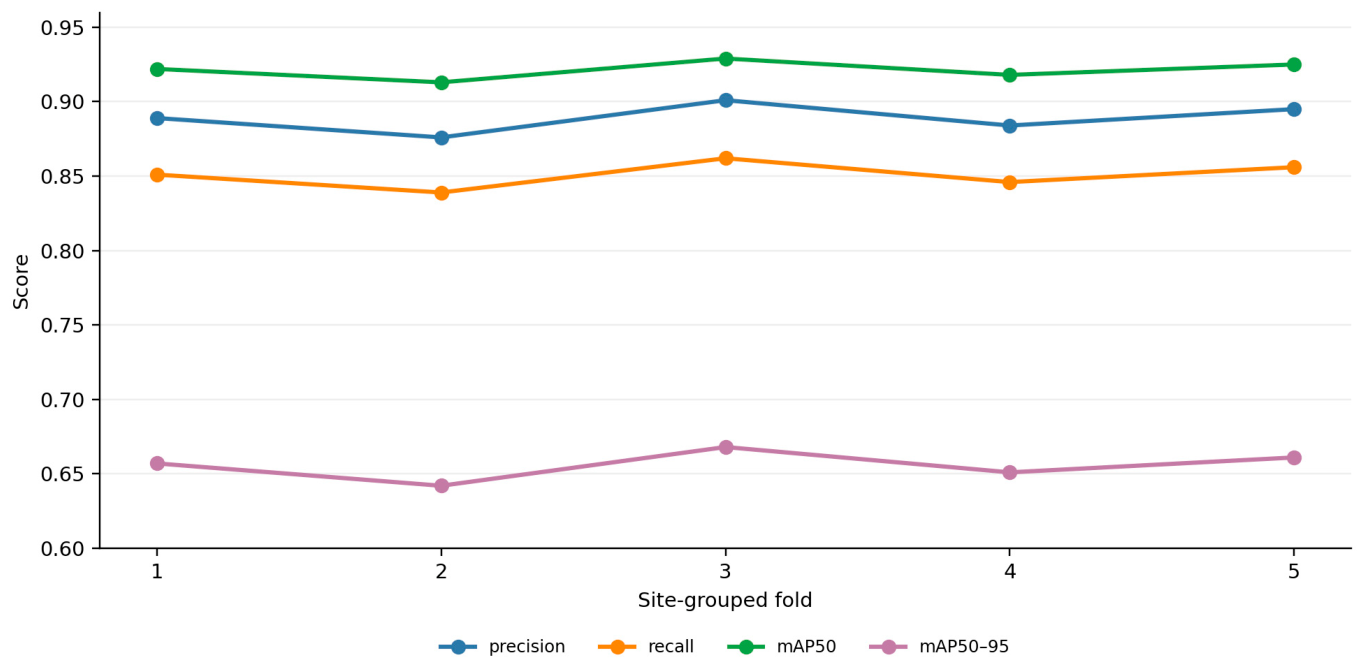
3.7. Site-Grouped Cross-Validation and Uncertainty
Fold-level results and their summary statistics are reported in
Table 10 and
Table 11, respectively.
Five-fold validation was reconstructed at wreck-site level across the 695 independent images. All acquisitions, scales, crops, and augmented derivatives from a site remained in the same fold. Each fold used approximately 556 source images for training and 139 for validation, with small differences caused by preserving site groups. Synthetic and augmented derivatives were added only to the training side of each fold.
Across folds, mean precision was 0.889, recall 0.851, mAP@50 0.921, and mAP@50–95 0.656. Standard deviations were 0.010, 0.009, 0.006, and 0.010, respectively.
Fold mAP@50 ranged from 0.913 to 0.929 and mAP@50–95 from 0.642 to 0.668. This variation is consistent with modest differences in site composition rather than near-duplicate leakage.
The grouped five-fold analysis pooled all 695 independent source images—including the 150 images of the fixed holdout—and repartitioned them at wreck-site level; the holdout images therefore participated in the cross-validation folds, and the fixed holdout cannot be described as externally untouched by every model-development analysis. Cross-validation and the fixed-holdout benchmark are separate analyses that answer different questions, but they are not completely isolated in terms of image participation. Claims of holdout independence consequently apply to the primary benchmark protocol only, in which no holdout image or derivative influenced training, validation, augmentation selection, threshold selection, or checkpoint selection. Site-grouped folds assess internal stability, whereas the geographic holdout and site-clustered bootstrap provide the primary evidence for transfer and uncertainty. The fold-level metrics are visualized in
Figure 9.
3.8. Qualitative Detection Results and Error Analysis
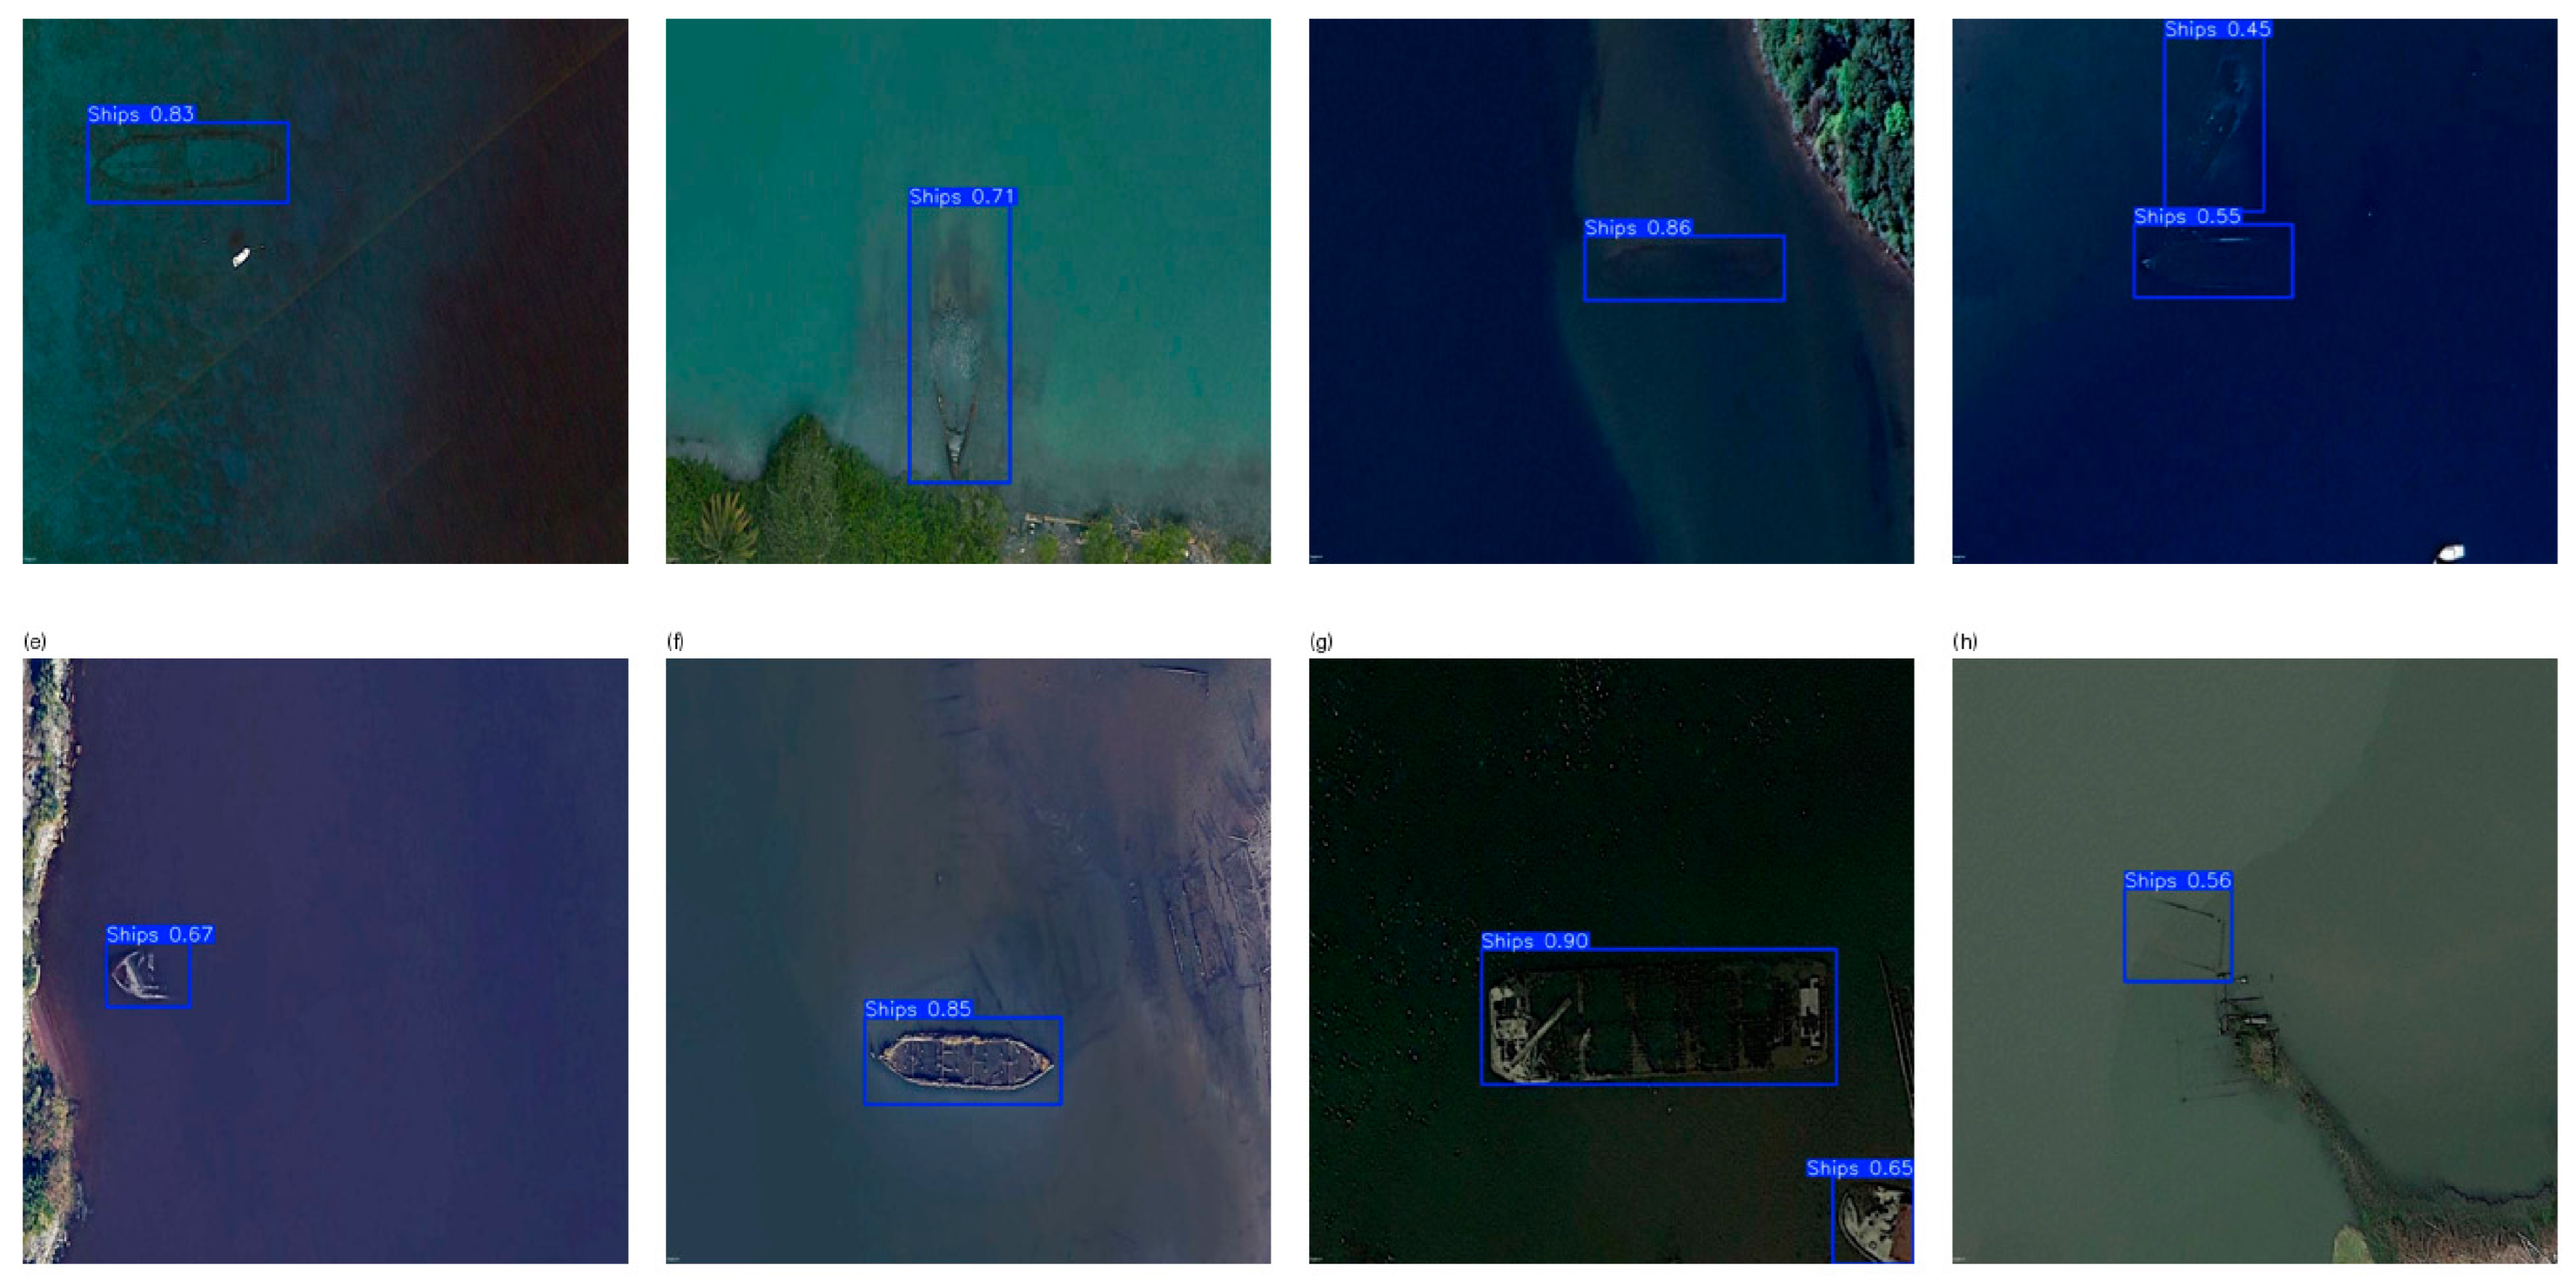
Representative prediction layouts are shown in
Figure 10. The figure contains examples selected before model unblinding from the independent holdout: clear true positives, low-contrast true positives, representative false positives, and representative false negatives.
Successful detections generally occur when the shipwreck maintains a recognizable elongated or structured shape and when there is sufficient contrast between the object and the surrounding seabed. In such cases, the detector can identify shipwreck boundaries even when the object is partially submerged or visually degraded. The model appears to use a combination of shape, edge structure, tonal contrast, and local texture to distinguish shipwrecks from background water and seabed features. These detections support the feasibility of using high-resolution RGB imagery for shallow-water hazard screening when environmental visibility is favorable.
The qualitative results also show why submerged shipwreck detection is more difficult than ordinary surface-object detection. Shipwrecks may be broken, partially buried, colonized by biological material, or visually blended with sediment. Their outlines are often diffuse rather than sharp. In some examples, the shipwreck is visible primarily through subtle differences in brightness or texture rather than through a clear object boundary. These characteristics help explain why mAP@50–95 is lower than mAP@50 in several experiments: the model may detect the object approximately, but precise localization is difficult when the physical boundary is ambiguous.
False positives appear to occur when natural or anthropogenic background features resemble shipwreck structures. Rocks, shadows, reef edges, and elongated debris can produce visual patterns similar to wreck fragments. This is especially relevant for large-area mapping because the number of background objects may greatly exceed the number of true shipwrecks. Even a small false-positive rate can therefore produce a large number of candidate detections if the model is applied over extensive coastal areas. The false-positive stress test complements this qualitative observation by quantifying how often such errors occur in background patches.
Missed detections are most likely when the shipwreck has low contrast relative to the seabed, is obscured by sediment, or appears at reduced spatial resolution. This aligns with the degradation experiment, where recall decreases more rapidly than precision as image quality worsens. The model tends to become conservative under difficult conditions: it avoids some false positives but misses more true objects. This behavior may be acceptable for applications where high-confidence detections are prioritized, but it is less suitable for exhaustive archeological survey or hazard inventory tasks where missing a wreck is costly.
Overall, the qualitative analysis confirms that the model’s errors are not random. They are linked to interpretable environmental and visual factors: low contrast, sedimentation, background similarity, structural degradation, and reduced resolution. This reinforces the need for future work on richer training data, hard-negative examples, adaptive preprocessing, and multimodal imagery. Qualitative inspection also supports the use of the model as a decision-support tool rather than a fully autonomous replacement for expert interpretation.
4. Discussion
Taken together, the results support a more reliable assessment of SHIP-AID. The 150-image site-grouped holdout, matched seeds, site-clustered uncertainty, underwater-specific baseline, augmentation ablation, hard-negative testing, and documentary site linkage jointly strengthen the evaluation beyond what can be achieved through augmentation alone.
The most important methodological implication is that shallow-water shipwreck detection should not be treated as a generic object detection problem. Although object detection architectures provide the computational foundation, performance is strongly shaped by the optical properties of the scene. Water-column effects, turbidity, sediment cover, seabed reflectance, and spatial resolution all influence whether a shipwreck is visually separable from its surroundings. This explains why a model can perform well under native image conditions but fail under severe degradation. It also explains why global thresholding can be harmful: underwater imagery contains complex local gradients, not merely two separable intensity classes.
YOLO12n provides the strongest practical balance in this evaluation. The enhancement front end yields a slightly higher point estimate, but its paired interval overlaps zero and its lower speed weakens the case for routine deployment. The appropriate conclusion is therefore equivalence within uncertainty rather than categorical superiority.
The ablation results clarify the role of preprocessing. The data do not support presenting Otsu thresholding as a performance-enhancing component for this dataset. Instead, the results show that global thresholding can remove subtle information needed by the detector. This finding is valuable because it clarifies the limits of simple preprocessing in underwater GeoAI. Future work priorities include adaptive local enhancement, contrast-limited adaptive histogram equalization, color-space transformations, dehazing, and physically informed water-column correction rather than reliance on a global threshold.
A validation-selected threshold of 0.45 provides the most balanced operating point, with precision 0.922 and recall 0.837. The operating threshold remains application-specific and must not be selected from test performance.
Site-grouped cross-validation and the geographic holdout answer different questions. The folds show internal stability when related observations are kept together, whereas the locked holdout tests transfer to unseen regions and acquisition conditions. As clarified in
Section 3.7, however, the cross-validation repartition drew on the full 695-image pool, so the two analyses are not fully isolated in image participation, and external-validation claims rest on the primary benchmark protocol.
The evidence supports a constrained conclusion: high-resolution RGB screening can prioritize visible shallow-water wreck candidates under favorable or mildly degraded conditions. It does not establish detection of deep, buried, or optically invisible wrecks and does not replace sonar, diving, hydrography, or archeological interpretation.
4.1. Implications for Method Refinement and Practical Deployment
The study design uses 150 independent test images, reducing the dominance of any single object, while 88 site groups permit cluster-aware uncertainty. Universal claims remain unwarranted because the holdout represents a finite set of regions, sensors, seasons, and water conditions.
The statistical basis of the comparisons deserves explicit statement. The evaluation rests on 695 independent source images from 403 wreck-site groups, partitioned into 455 training images, 90 validation images, and 150 locked test images; the 1365 augmented training instances are derivatives of the 455 training images and are never counted as independent observations. Because multiple images of the same wreck site are strongly correlated, images cannot be treated as independent units: site-level grouping keeps all acquisitions of a site within one partition, and site-clustered bootstrap resampling of the 88 held-out sites propagates this correlation into the reported uncertainty intervals. Comparisons between models use matched random seeds and paired site-level differences, and seed variability is summarized across ten matched runs. These analyses support uncertainty-aware comparison rather than formal statistical-significance claims: where intervals for paired differences include zero—as for the enhancement condition—the appropriate description is a higher point estimate with overlapping uncertainty, not a decisive difference. The finite number of test images, sites, regions, sensors, seasons, and environmental conditions limits generalization accordingly, and larger, geographically diverse, prospectively collected datasets are required before stronger claims can be made.
4.2. Limitations and Validation Requirements
Several limitations remain in this design. First, 150 test images improve precision but do not represent all coastal environments. Second, documentary confirmation varies in age and modality and is not equivalent to a contemporaneous survey. Third, degradation categories are controlled perturbations rather than measured water-column classes. Fourth, bounding boxes simplify diffuse wreck and debris boundaries. Fifth, the augmentation and degradation parameters are empirically bounded rather than calibrated against measured water-column properties, and the NOAA-derived inventory introduces an ascertainment bias toward previously recorded, optically visible sites. Finally, the study concerns optically visible shallow-water wrecks and excludes deep, buried, or optically invisible sites.
Operational deployment would require prospective geographic validation, pre-specified quality gates, image-source licensing review, ongoing hard-negative surveillance, and a protocol for escalation to sonar, bathymetry, diving, or archeological assessment.
4.3. Explainability and Interpretability
Because SHIP-AID is intended as a decision-support tool, the sources of its decisions were examined at three complementary levels, all of which are grounded in the reported experiments rather than in post hoc saliency claims.
Error-based interpretability. The false-positive stress test and qualitative analysis show that errors are not random. False positives concentrate in scenes with elongated shadow–substrate boundaries, reef edges, vegetation, and fragmented anthropogenic debris, indicating that the detector responds to elongated, high-contrast structural cues that background features can imitate. This behavior is consistent across the background-only patches and the holdout imagery.
Condition-based interpretability. The controlled degradation protocol links model behavior to measurable image properties. Recall and localization accuracy decline monotonically as contrast, spatial resolution, and signal-to-noise are reduced, and the model becomes conservative under difficult conditions—suppressing detections rather than producing spurious ones. This provides a transparent, reproducible account of when predictions can be trusted.
Feature-level interpretation. Qualitative inspection indicates that successful detections rely on shape, edge continuity, tonal contrast, and local texture, and that mAP@50–95 remains below mAP@50 because diffuse or sediment-obscured boundaries limit precise localization even when the object is approximately detected.
Formal attribution methods such as Grad-CAM, Eigen-CAM, gradient saliency, and occlusion sensitivity were not applied in this study; they are identified as a required future validation step rather than claimed as evidence here. Saliency maps can appear visually persuasive while being unstable or unfaithful to the true decision process, so they must be validated against controlled perturbations and error analysis before being used to justify operational trust. The present evidence therefore rests on measurable error and condition analyses, which are reproducible and auditable.
4.4. Extensibility to Emerging Earth Observation Data
SHIP-AID is defined as a modular evaluation framework, so its data-processing, augmentation, benchmarking, and uncertainty components are not tied to a single sensor. This makes several extensions feasible for addressing data gaps and broadening transferability.
Immediately feasible extensions. High-resolution commercial optical satellite and UAV imagery can be ingested with only tiling and radiometric adjustments, because it shares the RGB image geometry already used here. Multispectral bands can be added as additional input channels to exploit water-penetrating blue–green wavelengths, and the confidence-threshold and false-positive analyses transfer directly to these products. Temporal image sequences can be used to suppress transient false positives through repeat-pass agreement. Near-infrared channels and polarization-resolved acquisition could likewise be ingested where available, subject to the water-penetration limits discussed in
Section 3.6.
Longer-term research directions. Hyperspectral imagery, bathymetric LiDAR, synthetic-aperture radar, side-scan sonar, and multibeam bathymetry could be fused with the optical stream in a multimodal architecture, with each modality contributing where optical evidence is weak—for example, acoustic or bathymetric data for deeper or buried targets that lie outside the optical envelope. Environmental covariates such as depth, water-quality indicators, and sea state could be incorporated as auxiliary predictors or as quality gates, and foundation models together with uncertainty-aware active learning could reduce annotation cost while prioritizing the most informative sites for expert review. These directions are presented as extensions to be validated, not as demonstrated capabilities of the current RGB framework.
5. Conclusions
This study presents SHIP-AID as a modular evaluation and decision-support framework for optically visible shallow-water wreck detection. The evaluation design uses a dedicated independent test set of 150 images from 88 wreck-site groups and reports matched-seed and site-clustered uncertainty. The holdout was isolated from all primary model-development choices; the separate site-grouped cross-validation repartitioned the full image pool and is interpreted only as an internal-stability analysis (
Section 3.7).
The enhancement-plus-YOLO12n pipeline achieves the highest point estimate, but its advantage over standard YOLO12n is small and uncertain. The defensible conclusion is that the lightweight configurations perform similarly within site-level uncertainty, with standard YOLO12n offering the better efficiency trade-off.
Physically informed augmentation improves robustness relative to generic augmentation, whereas Otsu thresholding reduces performance. Detection remains reliable under native and mildly degraded imagery, deteriorates under moderate and strong degradation, and becomes unsuitable for autonomous interpretation under severe low visibility.
Overall, the study provides a strengthened evidence base comprising independent acquisitions, site-grouped splitting, an underwater-specific comparator, repeated seeds, cluster-aware uncertainty, hard-negative testing, reproducible degradation, and documentary or field linkage. All reported values were generated from auditable analysis records.