Article

Divergent Trends of Surface Solar Radiation Across China (1994–2022): Integrating Ground Observations with Satellite Products for Regional Attribution


1
Key Laboratory of Regional Climate and Environment for Temperate East Asia, Institute of Atmospheric Physics, Chinese Academy of Sciences, Beijing 100029, China
2
Key Laboratory of Liuzhou Yuanbaoshan Topography Heavy Rain, Liuzhou Meteorological Bureau, Liuzhou 545001, China
3
College of Geography and Tourism, Hunan University of Arts and Science, Changde 415000, China
4
The Earth System Science Numerical Simulator Facility, Beijing 100029, China
5
State Key Laboratory of Earth Surface Processes and Disaster Risk Reduction, Beijing Normal University, Beijing 100875, China
*
Author to whom correspondence should be addressed.
Remote Sens. 2026, 18(16), 2782; https://doi.org/10.3390/rs18162782
Submission received: 27 May 2026 / Revised: 31 July 2026 / Accepted: 11 August 2026 / Published: 17 August 2026
(This article belongs to the Section Atmospheric Remote Sensing)

Highlights

What are the main findings?
  • Nationwide brightening vs. Tibetan Plateau dimming: China experienced a significant annual brightening of +72 MJ m−2 per decade, whereas the Tibetan Plateau—uniquely among all subregions—showed a persistent and significant dimming of −86 MJ m−2 per decade across all seasons.
  • Distinct seasonal and spatial patterns: Spring dominated the national brightening trend, while summer SSR exhibited a remarkable meridional “+ − +” dipole structure that mirrored the dominant summer precipitation mode over eastern China.
What are the implications of the main findings?
  • Region-specific solar resource assessment required: The strong contrast between high-altitude dimming and lowland brightening demonstrates that national averages mask critical local trends, necessitating regionally tailored strategies for solar energy deployment and ecosystem risk assessment.
  • Hydrological feedback overrides aerosol effects on the Tibetan Plateau: In this sensitive high-altitude region, intensified hydrological cycles and increased atmospheric water vapor can overwhelm the radiative impact of declining anthropogenic aerosols, challenging simplistic aerosol-driven interpretations.

Abstract

Surface solar radiation (SSR) is a fundamental component of the Earth’s energy budget, driving climate dynamics, ecosystem stability, and solar energy potential. By integrating high-quality in situ observations from 87 ground stations with multi-source satellite products (CERES) and reanalysis data, this study systematically quantifies the spatiotemporal evolution and driving mechanisms of SSR across China from 1994 to 2022. Nationally, SSR exhibits a significant brightening trend of 72 MJ m−2 per decade, despite pronounced regional and seasonal divergence. Annual SSR increases significantly in North, Central, Southwest, and South China—with North China experiencing the fastest growth (160 MJ m−2 per decade). Strikingly, the Tibetan Plateau exhibits a persistent and significant “dimming” trend (−86 MJ m−2 per decade). Furthermore, spatial analysis reveals that summer SSR trends show a unique meridional “+ − +” dipole structure that closely resembles the dominant mode of summer precipitation over eastern China. Quantitative attribution analysis indicates that declining aerosol optical depth (AOD) is the primary driver of brightening across most of China, whereas the dimming on the Tibetan Plateau is specifically triggered by increased atmospheric water vapor, cloud cover, and precipitation. These findings underscore that in sensitive high-altitude regions, regional climate dynamics and hydrological feedback can override the radiative effects of anthropogenic aerosol reductions, highlighting the necessity for localized solar resource assessments.

1. Introduction

Surface solar radiation (SSR) serves as the primary energy driver for the Earth-atmosphere system, profoundly influencing global climate change, hydrological cycles, ecosystem stability, and photovoltaic energy potential [1,2,3,4]. Global observations have revealed significant decadal fluctuations, characterized by a sustained decline until the 1980s (“dimming”) followed by a subsequent recovery (“brightening”) [5,6,7]. Similar patterns have been documented across China [7,8,9,10]. Though previous studies have reached some consensus on SSR changes in China, three critical controversies still persist:
(1)
Inconsistency in Pre-1990s Dimming Magnitudes: While the early 1990s is widely recognized as a pivotal transition point from “dimming” to “brightening,” the quantified rate of SSR decline prior to 1990 remains highly uncertain. Reported rates fluctuate significantly between 2.5 and 12.0 W m−2 per decade, reflecting substantial discrepancies in early-period data interpretation [5,7,11].
(2)
Debate Over the Post-1990 Trend Direction: The trajectory of SSR following the 1990s remains a subject of active debate. While some studies [12] utilizing quality-controlled station observations report a robust recovery trend, others [11] employing sunshine duration proxies from 459 stations suggest a stabilization of radiative levels. Furthermore, certain analyses [13] even indicate an insignificant decreasing trend (e.g., −0.76 W m−2 per decade from 1990 to 2017), complicating the characterization of the recent “brightening” phase.
(3)
Divergent Seasonal and Monthly Variations: There is a lack of consensus regarding which seasons or months drive the long-term trends. Specifically, Shi et al. [14] identified winter as the season with the fastest SSR decrease, while Wang et al. [12] found the most significant decrease from March to August. Both Yang et al. [15] and Yang et al. [16] concluded that summer had the most significant decrease.
Differences in data sources, calculation methods, sample sizes, quality control procedures, and study periods contribute to these divergent results, with the source of SSR data being a particularly important factor [7,9,17]. In a similar study, Kambezidis [18] has emphasized that a standard procedure (in both the spatial and temporal averaging) must be established in order for results from similar studies to truly be comparable.
To elucidate the mechanisms driving SSR variability, numerous studies have examined the influence of atmospheric constituents, including cloud cover, aerosols, water vapor, and ozone. However, the relative contributions of these drivers exhibit significant spatiotemporal heterogeneity [10,19,20,21]. Clouds, due to their potent shortwave albedo effect, are widely regarded as a primary regulator of SSR [22,23,24]. Nevertheless, results differ regarding the role of different cloud types in SSR changes during different periods. Prior to the 1990s, the lack of a significant negative correlation between total cloud cover (TCC) and SSR trends in China suggested that clouds were not the decisive factor in the observed solar dimming [25]. Stanhill et al. [26] argued that cloud cover changes were the main cause of SSR variations, with anthropogenic aerosol emissions playing a subordinate role. The impact of aerosols on SSR is intrinsically complex, involving both direct scattering/absorption and indirect modification of cloud microphysics, with current focus primarily on the direct effect. Before 1990, both TCC and SSR decreased in China while aerosol optical depth (AOD) increased, leading to the conclusion that aerosols were the primary factor for the “dimming” phase in China [9,27,28]. Post-1990, the stabilization or subsequent “brightening” observed in southern China has been attributed to the mitigation of aerosol direct effects following stringent government air quality interventions [29]. Feng and Li [30] pointed out that the ratio of direct to diffuse solar radiation in eastern China has decreased since 1958, reflecting intensified air pollution and enhanced attenuation of SSR by aerosols.
Beyond aerosols and clouds, atmospheric water vapor also modulates SSR through absorption. Related studies indicate that a 10% increase in water vapor content reduces SSR by about 0.5% [6]. Over most of China, SSR is negatively correlated with water vapor content, especially in relatively dry, high-latitude regions [31]. The effect of water vapor on SSR depends on its background concentration, with a stronger attenuating effect in dry regions than in humid ones [9]. Although ozone absorbs most ultraviolet radiation, its impact on SSR changes is relatively small [32]. Collectively, while clouds and aerosols are identified as the two main factors influencing SSR changes in China, the debate over which factor exerts the dominant control still persists.
In recent years, substantial progress has been made in the estimation of surface solar radiation from multiple sources. Satellite-based retrievals, such as those from CERES and Himawari-8, have been extensively evaluated against ground-based observations [33], demonstrating good spatial and temporal continuity and generally higher accuracy than reanalysis datasets. For the Chinese region, a comprehensive validation of five hourly SSR datasets against 96 stations over 22 years showed that CERES exhibits the best overall performance [34]. Meanwhile, reanalysis products have also been systematically assessed for their climatic characteristics and meteorological sensitivity to cloud cover, aerosols, and water vapor over China [35]. Beyond these traditional approaches, machine learning methods have emerged as powerful tools for SSR estimation and prediction, offering new opportunities for improving the accuracy of solar radiation products [36]. Despite these advances, the quantitative attribution of long-term SSR trends to individual driving factors remains insufficiently explored.
Addressing the controversies surrounding the patterns and causes of SSR changes in China, this study utilizes ground-based meteorological station SSR data, along with satellite-derived cloud cover and AOD products, to characterize SSR variations across diverse seasons and regions in China. Unlike previous studies constrained by limited station density or truncated temporal scales, our research leverages a consistent dataset from 87 meteorological stations spanning nearly three decades (1994–2022), combined with satellite-derived cloud and aerosol products. It investigates the impacts of cloud cover, aerosols, water vapor content, and other factors on SSR changes, contributing to a deeper understanding of the patterns and causes of SSR variations in China.

2. Materials and Methods

2.1. Observational and Remote Sensing Datasets

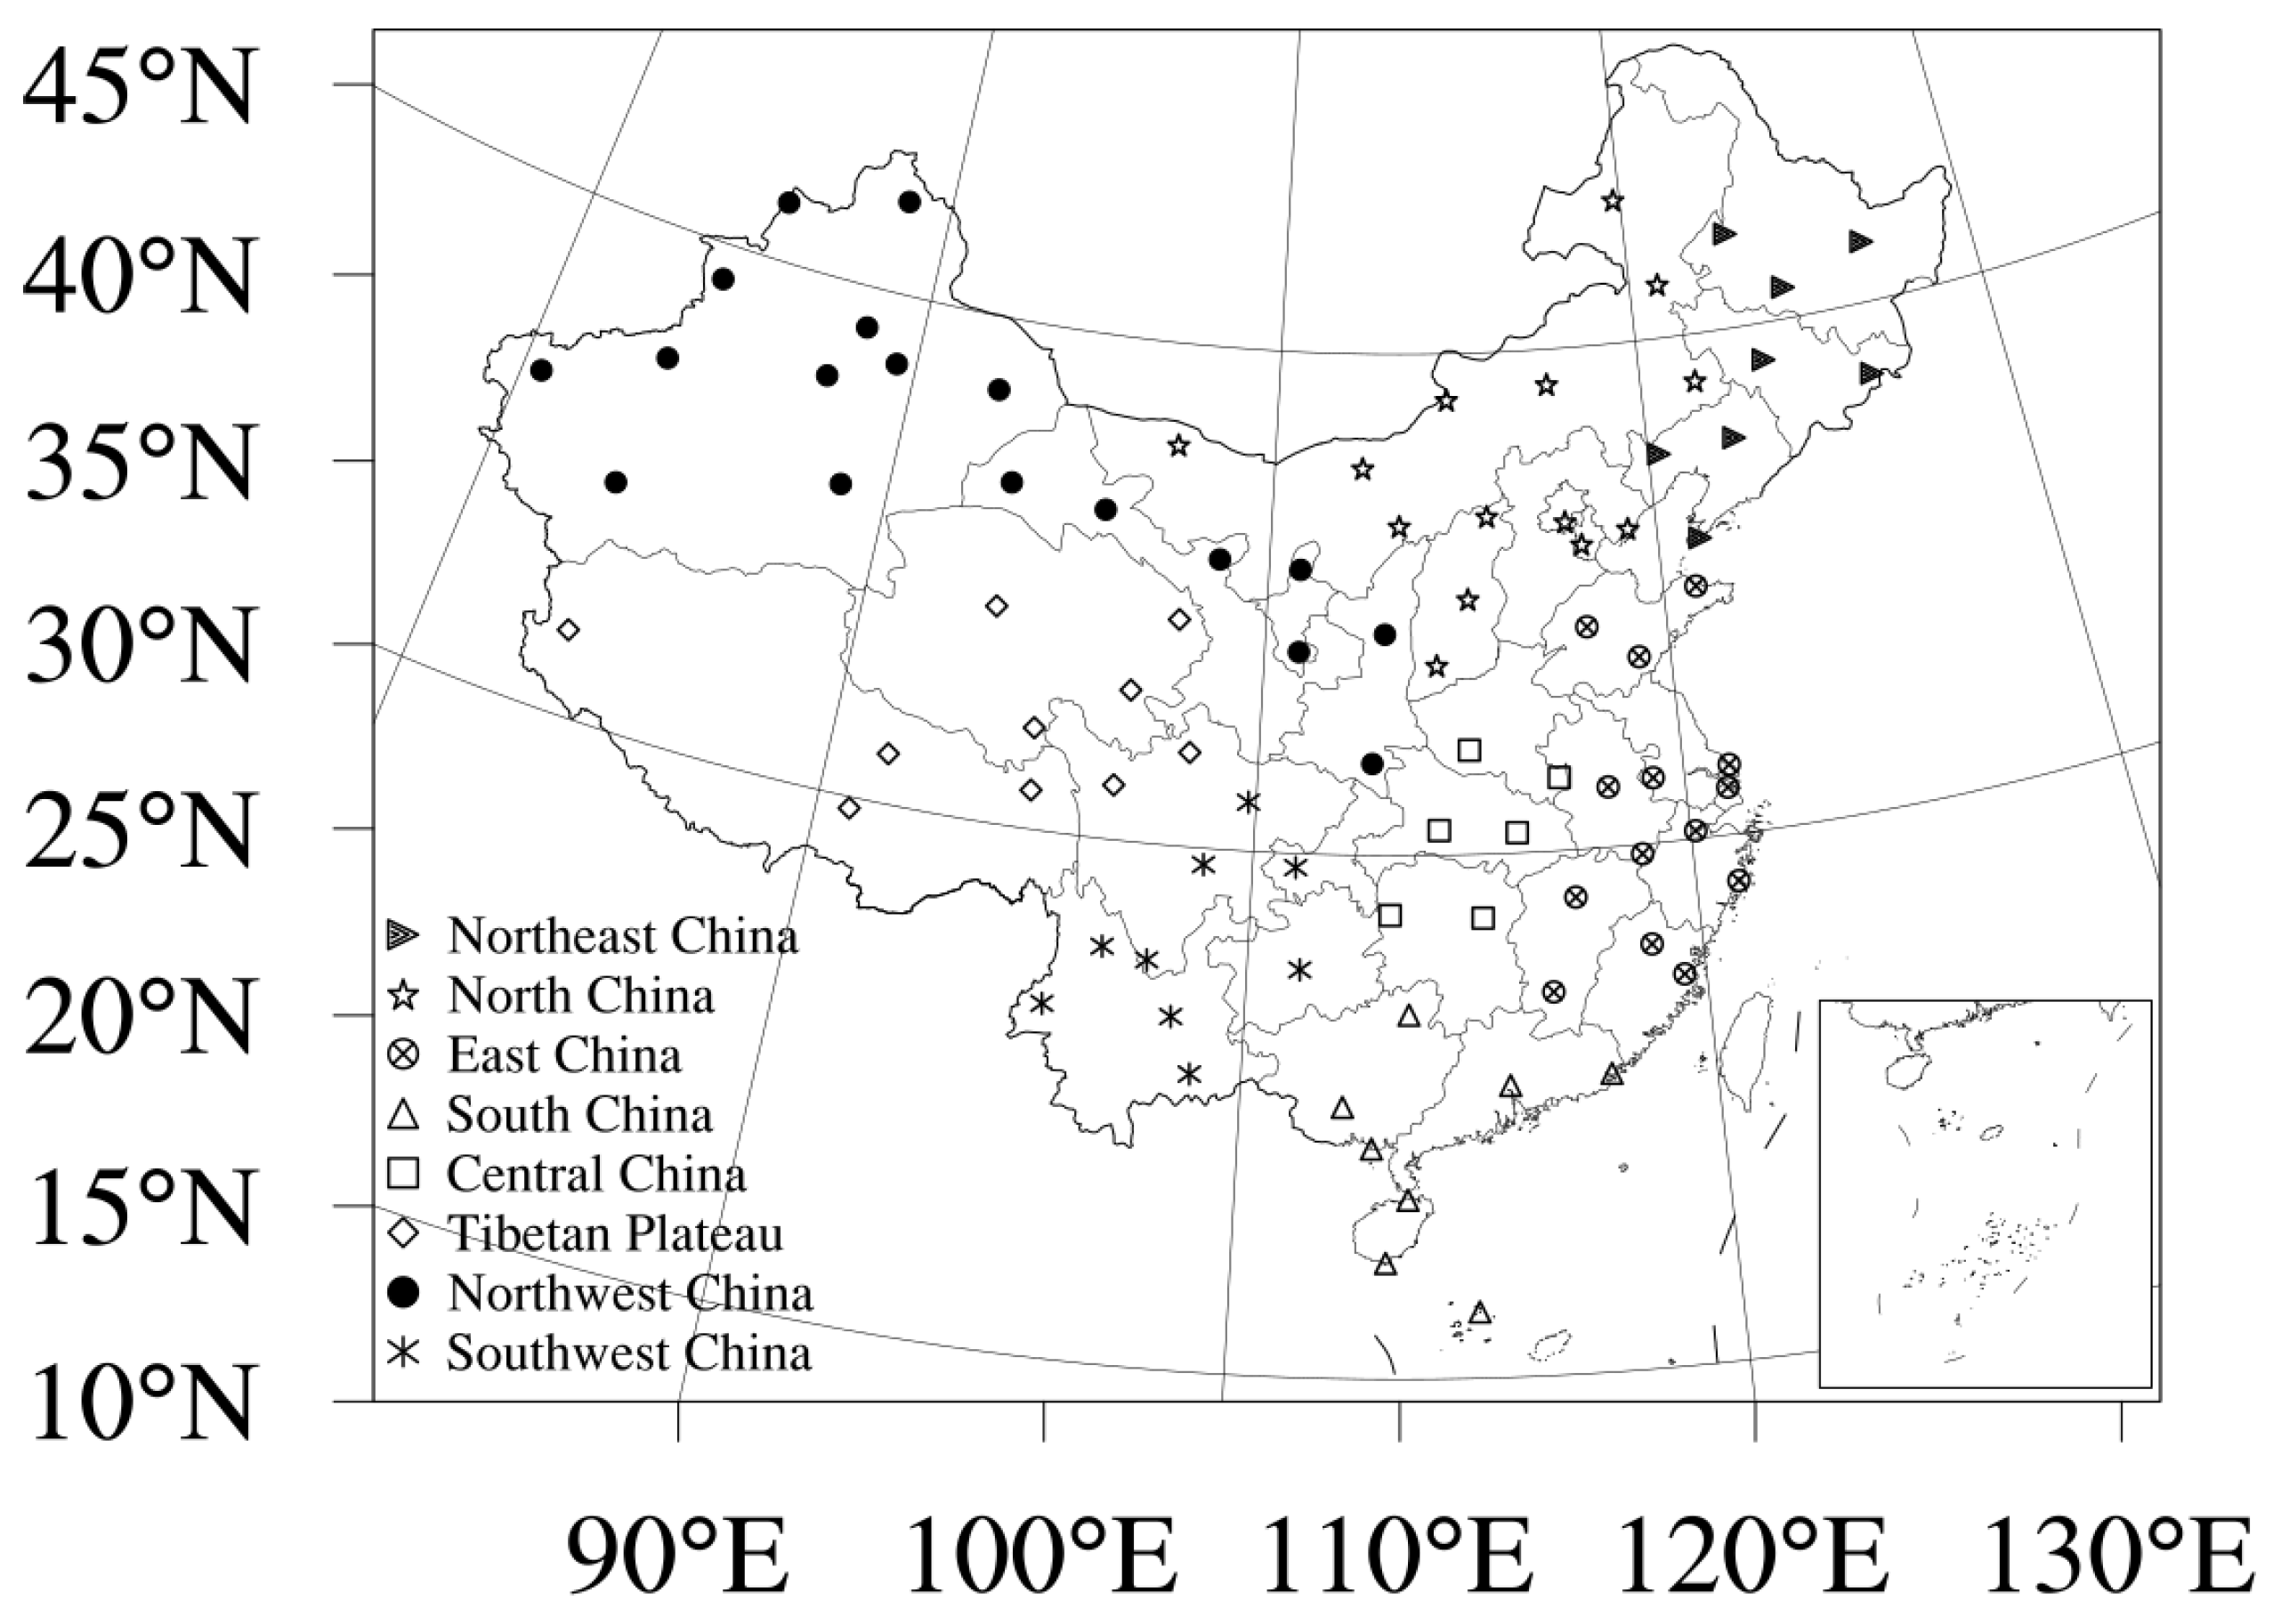
The meteorological observation data used in this study include station radiation data and precipitation data. The radiation data consist of monthly mean SSR observations from 87 meteorological stations across China, obtained from the China Meteorological Data Service Center. The distribution of these stations is shown in Figure 1. This dataset provides observations of surface incoming radiation across China from 1961 to 2022. Due to the replacement of radiation instruments in China between 1990 and 1993, an abrupt increase in SSR occurred after this period, and instrument sensitivity drift exaggerated the rate of SSR decrease before the change [13]. However, the gradually decreasing trend of SSR before the 1990s is widely accepted. Therefore, to ensure the reliability of our conclusions, this study focuses solely on continuous SSR observation data from 1994 to 2022. The precipitation data used are daily precipitation observations from the same 87 meteorological stations, used to analyze the influence of precipitation amount and precipitation days (defined as days with ≥0.1 mm/day) on SSR changes. All 87 stations provided continuous monthly SSR observations from 1994 to 2022, with no missing data during this period, ensuring the reliability of trend analysis. The SSR data are direct observations from ground-based pyranometers, with monthly totals reported in MJ m−2 (0.01 MJ m−2 in the original data), rather than outputs from radiative transfer model simulations.
Figure 1. Spatial distribution of 87 radiation observation stations in China. The eight subregions are denoted as: Northwest China-R1, North China-R2, Northeast China-R3, Tibetan Plateau-R4, Central China-R5, East China-R6, Southwest China-R7, and South China-R8. The detailed station counts for each region are provided in Table 1.
Remotesensing 18 02782 g001
Table 1. Number of radiation observation stations in each of the eight subregions of China.
No.Region NameRegion SymbolNumber of Stations
1Northwest ChinaR118
2North ChinaR214
3Northeast ChinaR38
4Tibetan PlateauR410
5Central ChinaR56
6East ChinaR614
7Southwest ChinaR79
8South ChinaR88
Cloud and aerosol data required for the study come from the CERES_SYN1deg_Ed4A dataset, providing TCC and AOD at 550 nm. The Clouds and the Earth’s Radiant Energy System (CERES) is a key component of the Earth Observing System. Its data incorporates significant improvements based on the International Satellite Cloud Climatology Project (ISCCP) and the Earth Radiation Budget Experiment (ERBE). CERES data are obtained from sensors on TRMM, Terra, and Aqua satellites, using high spectral and spatial resolution to process and determine cloud and surface properties, providing reliable atmospheric product information on clouds and aerosols [37]. This dataset classifies clouds based on cloud top pressure into low clouds (>700 hPa), mid-low clouds (500–700 hPa), mid-high clouds (300–500 hPa), and high clouds (<300 hPa). It provides cloud amounts for these four layers as well as TCC. This study primarily analyzes TCC, as for the Tibetan Plateau, cloud cover above 500 hPa was analyzed specifically to account for the region’s high elevation. The data have a monthly temporal resolution and a 1° × 1° spatial resolution, covering the period 2000–2022. Monthly mean of total column water vapor data from the ERA-Interim reanalysis dataset are used to analyze the impact of water vapor content on SSR changes. These data have a horizontal resolution of 0.5° × 0.5° [38].
Data for January–February 2000 are missing in the CERES_SYN1deg_Ed4A dataset. These two months were filled using the multi-year climatological mean for January and February, calculated from the available 2001–2022 record. This approach is justified because January and February are climatologically the most stable months in terms of cloud and aerosol conditions over China, with minimal interannual variability. Additionally, the missing period represents only two months out of the 23-year CERES record, and the use of climatological means is a standard practice for gap-filling in satellite-based studies.
A few limitations of the datasets should be noted. First, the CERES_SYN1deg product is only available from March 2000 onward, limiting our analysis of cloud and aerosol drivers to the post-2000 period. Second, the ERA-Interim total column water vapor has a relatively coarse horizontal resolution (0.5° × 0.5°) and may contain larger uncertainties over the Tibetan Plateau due to the complex terrain and sparse assimilation data. Third, the CERES AOD and cloud retrievals over high-altitude, snow-covered surfaces (e.g., the Tibetan Plateau) are subject to larger uncertainties, as the surface albedo complicates the retrieval algorithms. To mitigate these issues, we applied bilinear interpolation to station coordinates and cross-validated the satellite-derived products with ground-based precipitation data. These measures help ensure that the spatial and temporal signals captured in our analysis are robust.

2.2. Statistical Framework and Regionalization

The overall data processing workflow consists of four sequential steps:
(1)
Quality control: Ground-based SSR and precipitation data were quality-controlled by the China Meteorological Data Service Center. We further verified the homogeneity of the SSR records and confirmed that no abrupt discontinuities exist in the post-1994 period.
(2)
Spatial interpolation: To facilitate a station-based analysis, all satellite-derived and reanalysis products were spatially interpolated to the 87 station coordinates using a bilinear interpolation method, ensuring that the driver variables correspond to the exact locations of the SSR measurements. The SSR trends were then calculated directly from the station observations, while the driver variables were matched to each station for correlation and attribution analysis.
(3)
Temporal aggregation and regional averaging: Monthly data were aggregated into seasonal (MAM, JJA, SON, DJF) and annual means. For regional-scale analysis, the station data within each of the eight subregions were averaged to obtain regional time series mean for SSR and each driving factor, without area- or station-density weighting.
(4)
Statistical analysis: Linear trends were estimated using ordinary least-squares regression, and Pearson correlation coefficients were calculated to assess the relationships between SSR and the five potential drivers. Statistical significance was tested at the 95% confidence level.
(5)
Quantitative attribution analysis: To quantify the relative contribution of each driver to SSR trends, we applied standardized regression coefficients (Beta) derived from multiple linear regression. This method standardizes all variables to unit variance, making the coefficients directly comparable across drivers. The relative contribution (%) of each driver was calculated as the percentage of its absolute Beta value relative to the sum of the absolute Beta values of all five drivers. This approach has been widely used in climate attribution studies to quantify the relative importance of multiple driving factors [39].
We quantified linear SSR trends using ordinary least-squares regression, while the interannual relationships between SSR and its potential drivers—TCC, AOD, water vapor, precipitation amount, and precipitation days—were assessed using Pearson correlation coefficients [40]. The statistical significance of these results was determined at the 95% confidence level. Given the differences in SSR variation patterns and main influencing factors across regions [26], the analysis of the nationally averaged SSR characteristics is supplemented by an examination of trends in eight subregions. The spatial distribution and number of stations in each region are shown in Figure 1 and Table 1.

3. Results

3.1. Spatial Distribution Characteristics of SSR

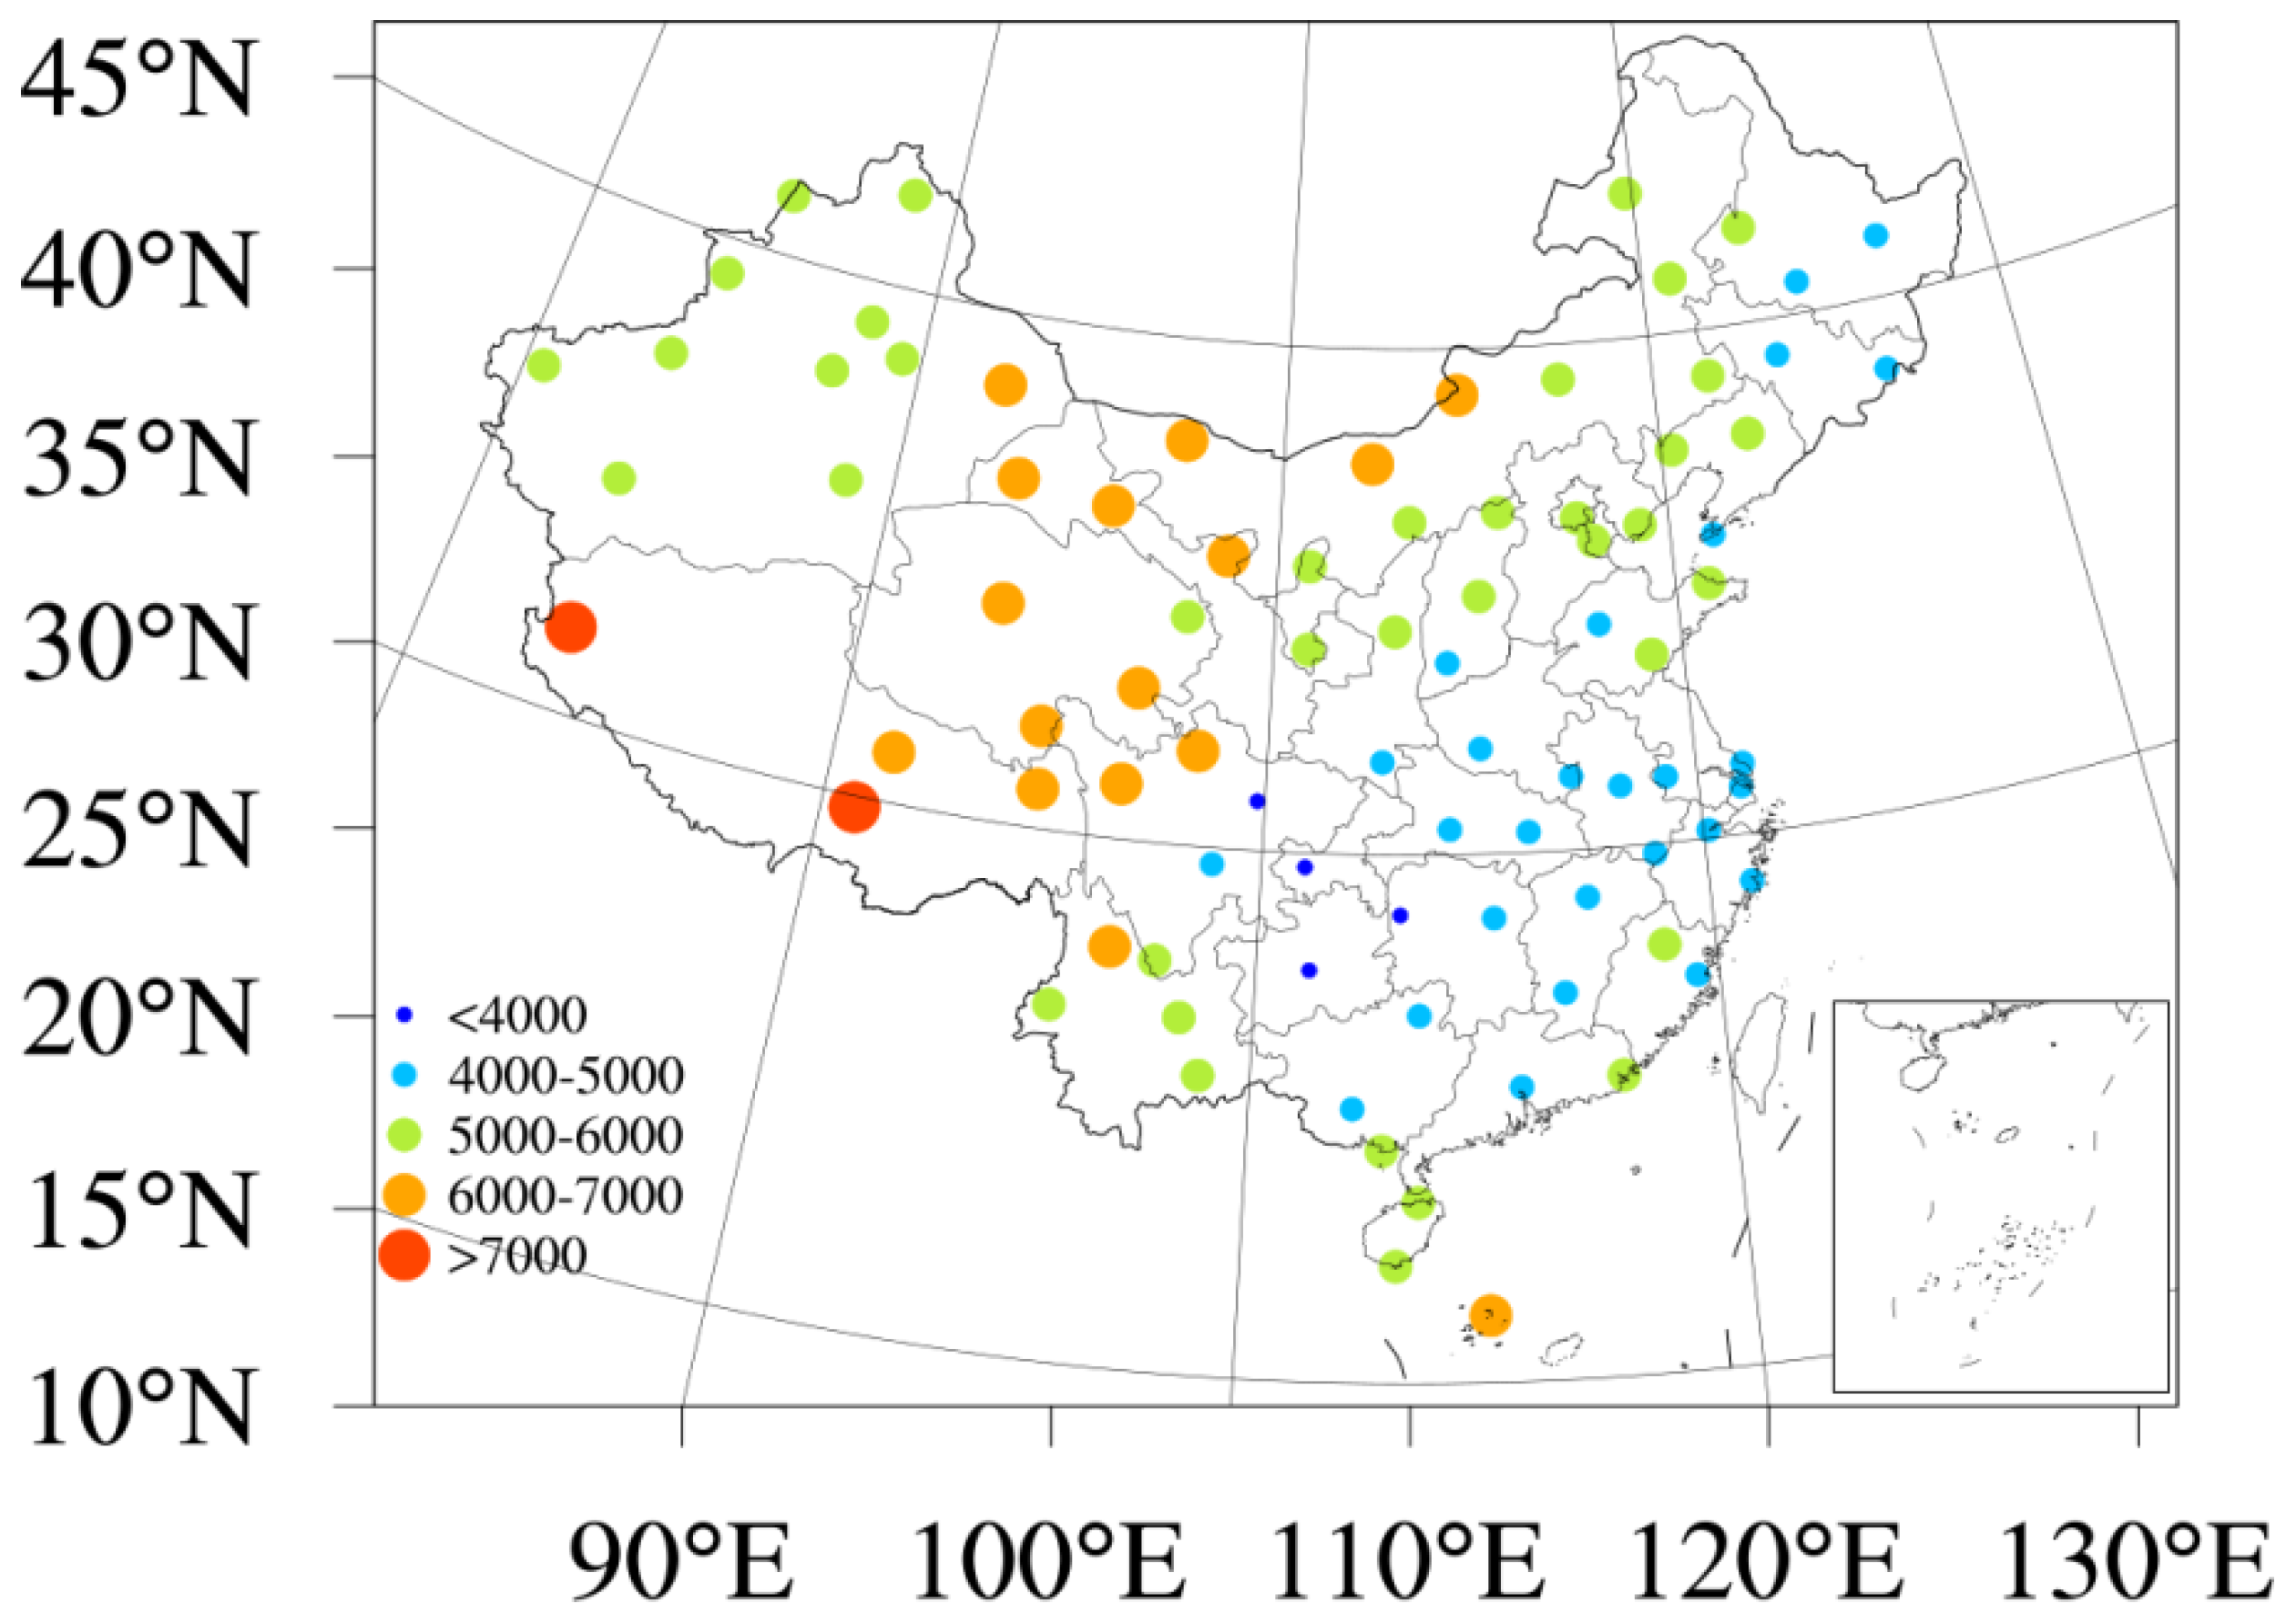
Figure 2 shows the spatial distribution of the multi-year average SSR across China (1994–2022). SSR varies considerably among stations, with a maximum value of 8151 MJ m−2 (at Gaer station, Tibetan Plateau) and a minimum value of 3352 MJ m−2 (at Shapingba station, Chongqing). Generally, SSR is lower in eastern China than in western China, and higher in arid and semi-arid regions than in humid and semi-humid regions. Higher values are concentrated on the high-altitude Tibetan Plateau, while lower values are found in the Sichuan Basin. In terms of regional averages, the mean SSR for China is 5323 MJ m−2. The average SSR for the eight subregions, from largest to smallest, are Tibetan Plateau (6635 MJ m−2), Northwest China (5655 MJ m−2), North China (5519 MJ m−2), South China (5219 MJ m−2), Southwest China (5031 MJ m−2), Northeast China (4944 MJ m−2), East China (4706 MJ m−2), and Central China (4199 MJ m−2). The spatial distribution of SSR in China is highly heterogeneous, with the highest values on the Tibetan Plateau and the lowest in Central China, consistent with previous studies [41]. This heterogeneity is influenced by multiple factors, with altitude and regional climate characteristics being the primary determinants.

3.2. Temporal Variation Characteristics of SSR in China

3.2.1. Annual SSR Trends

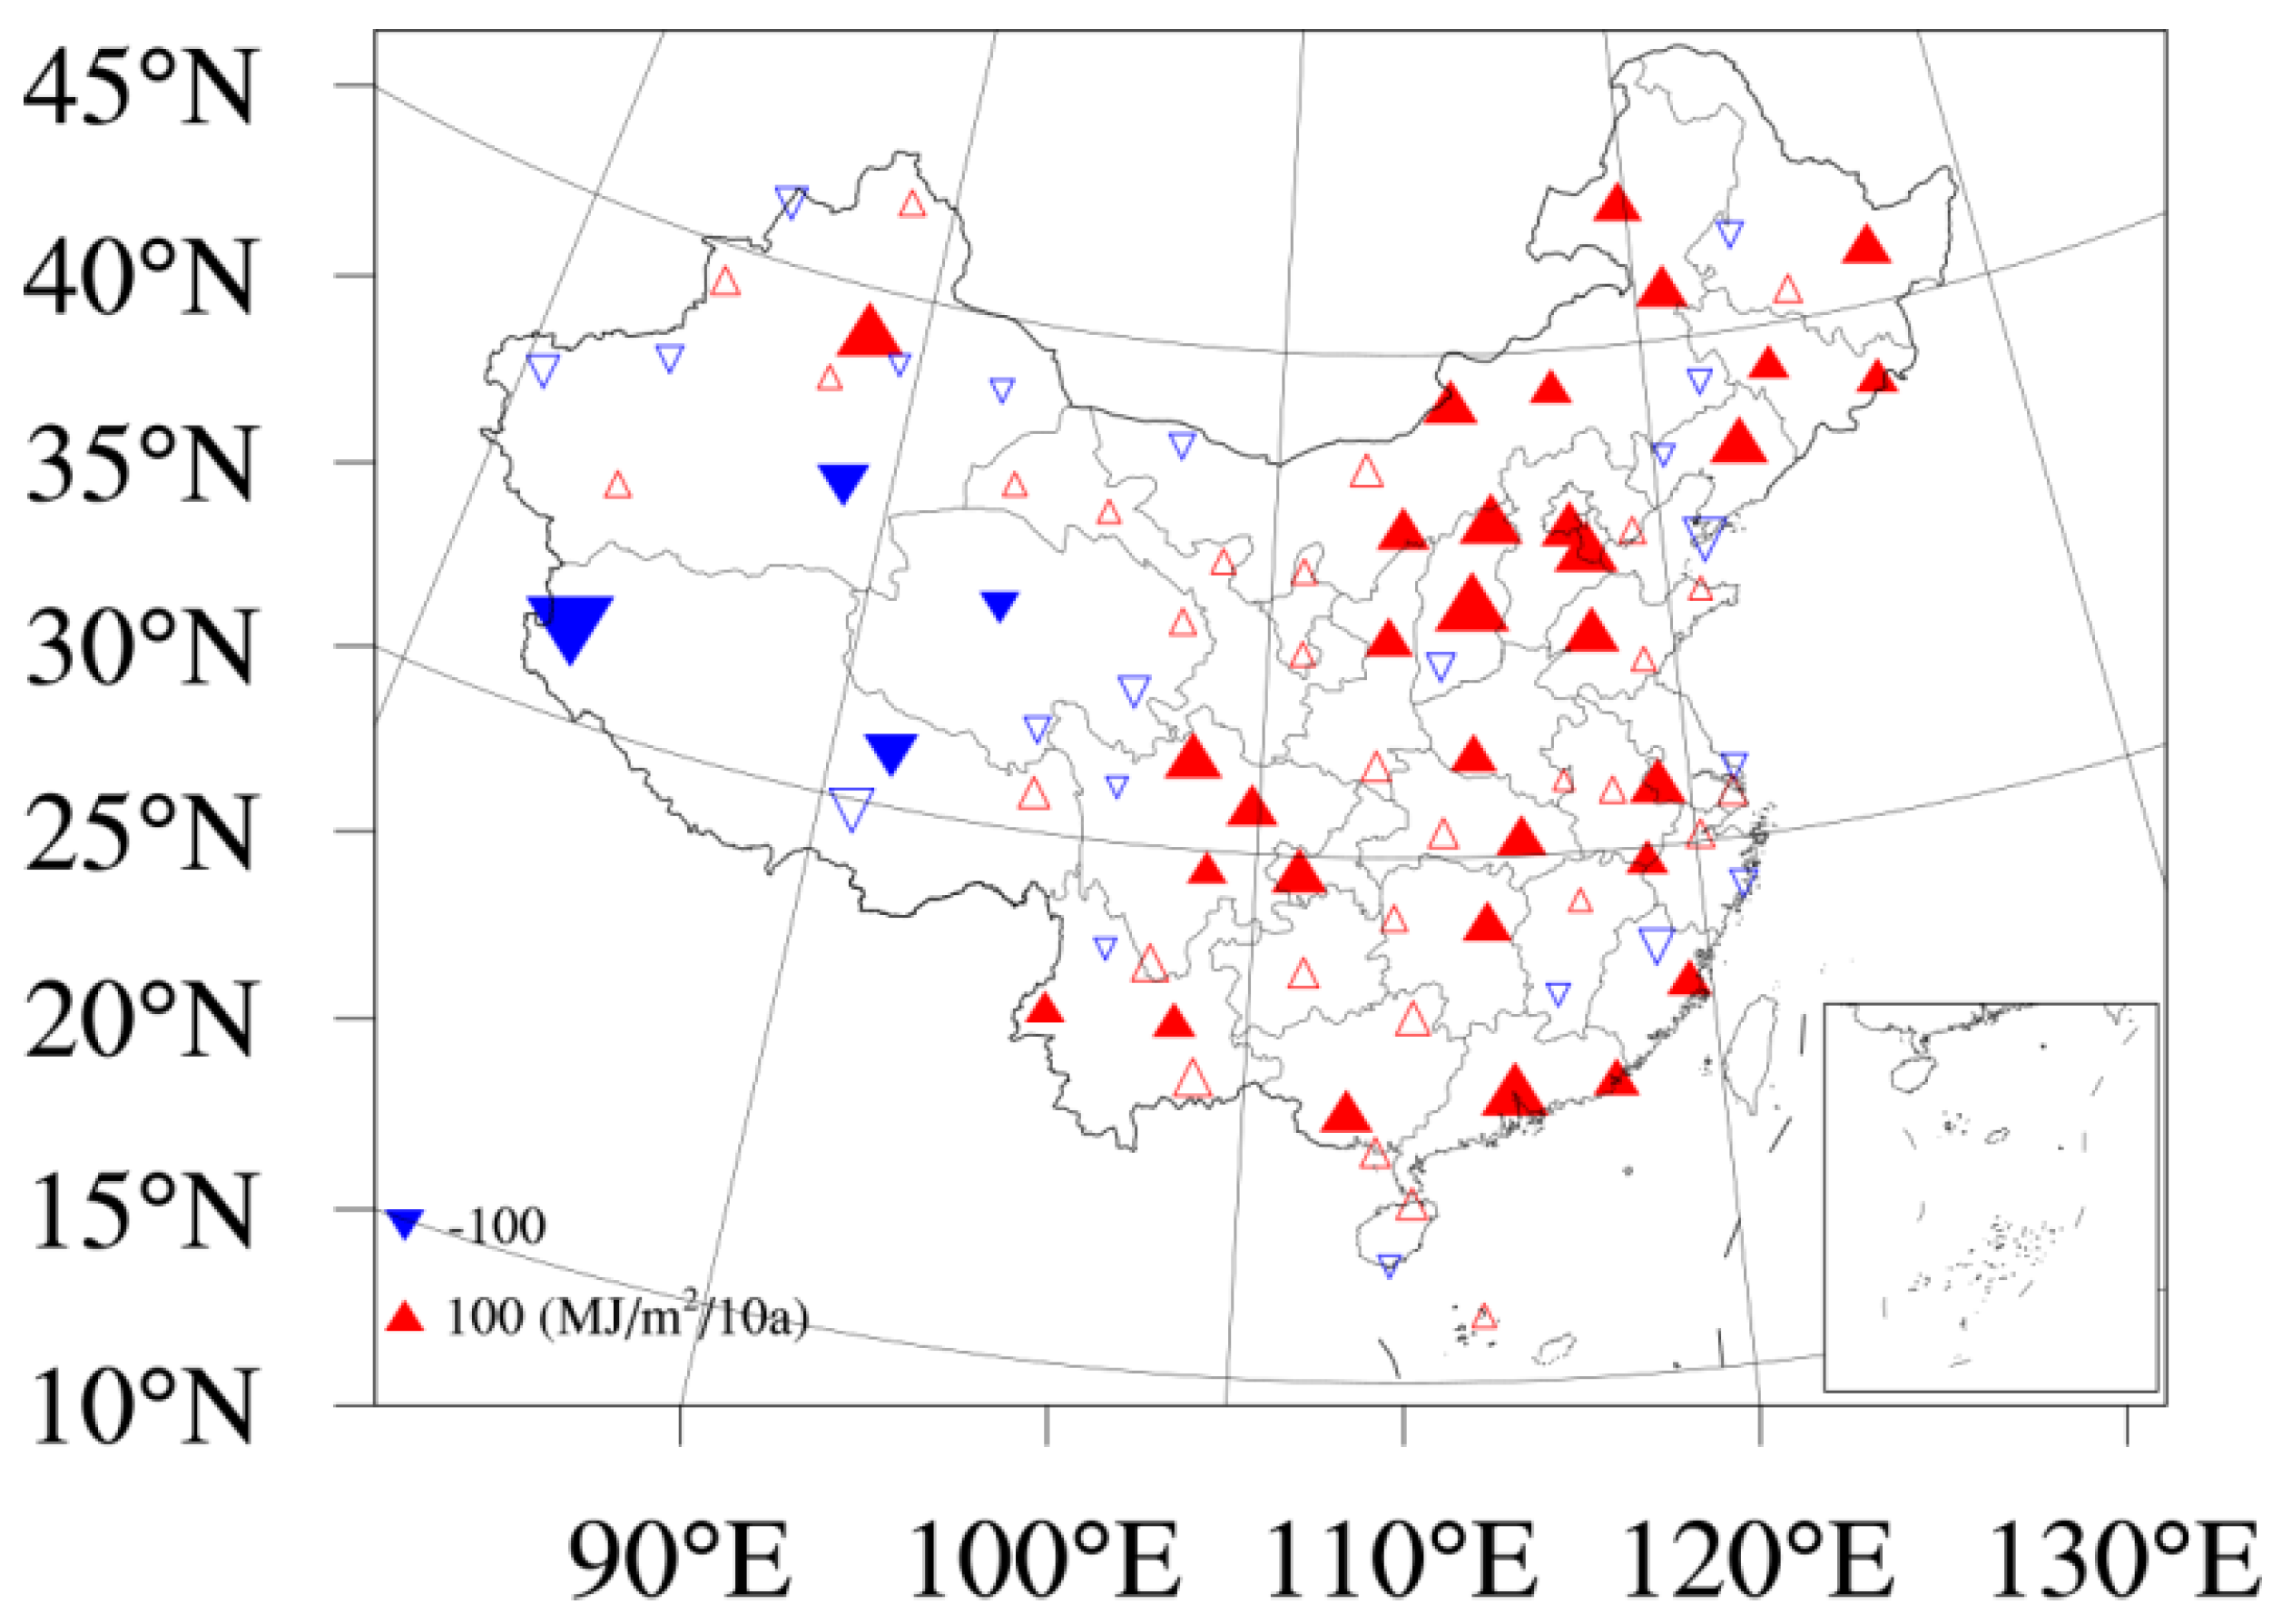
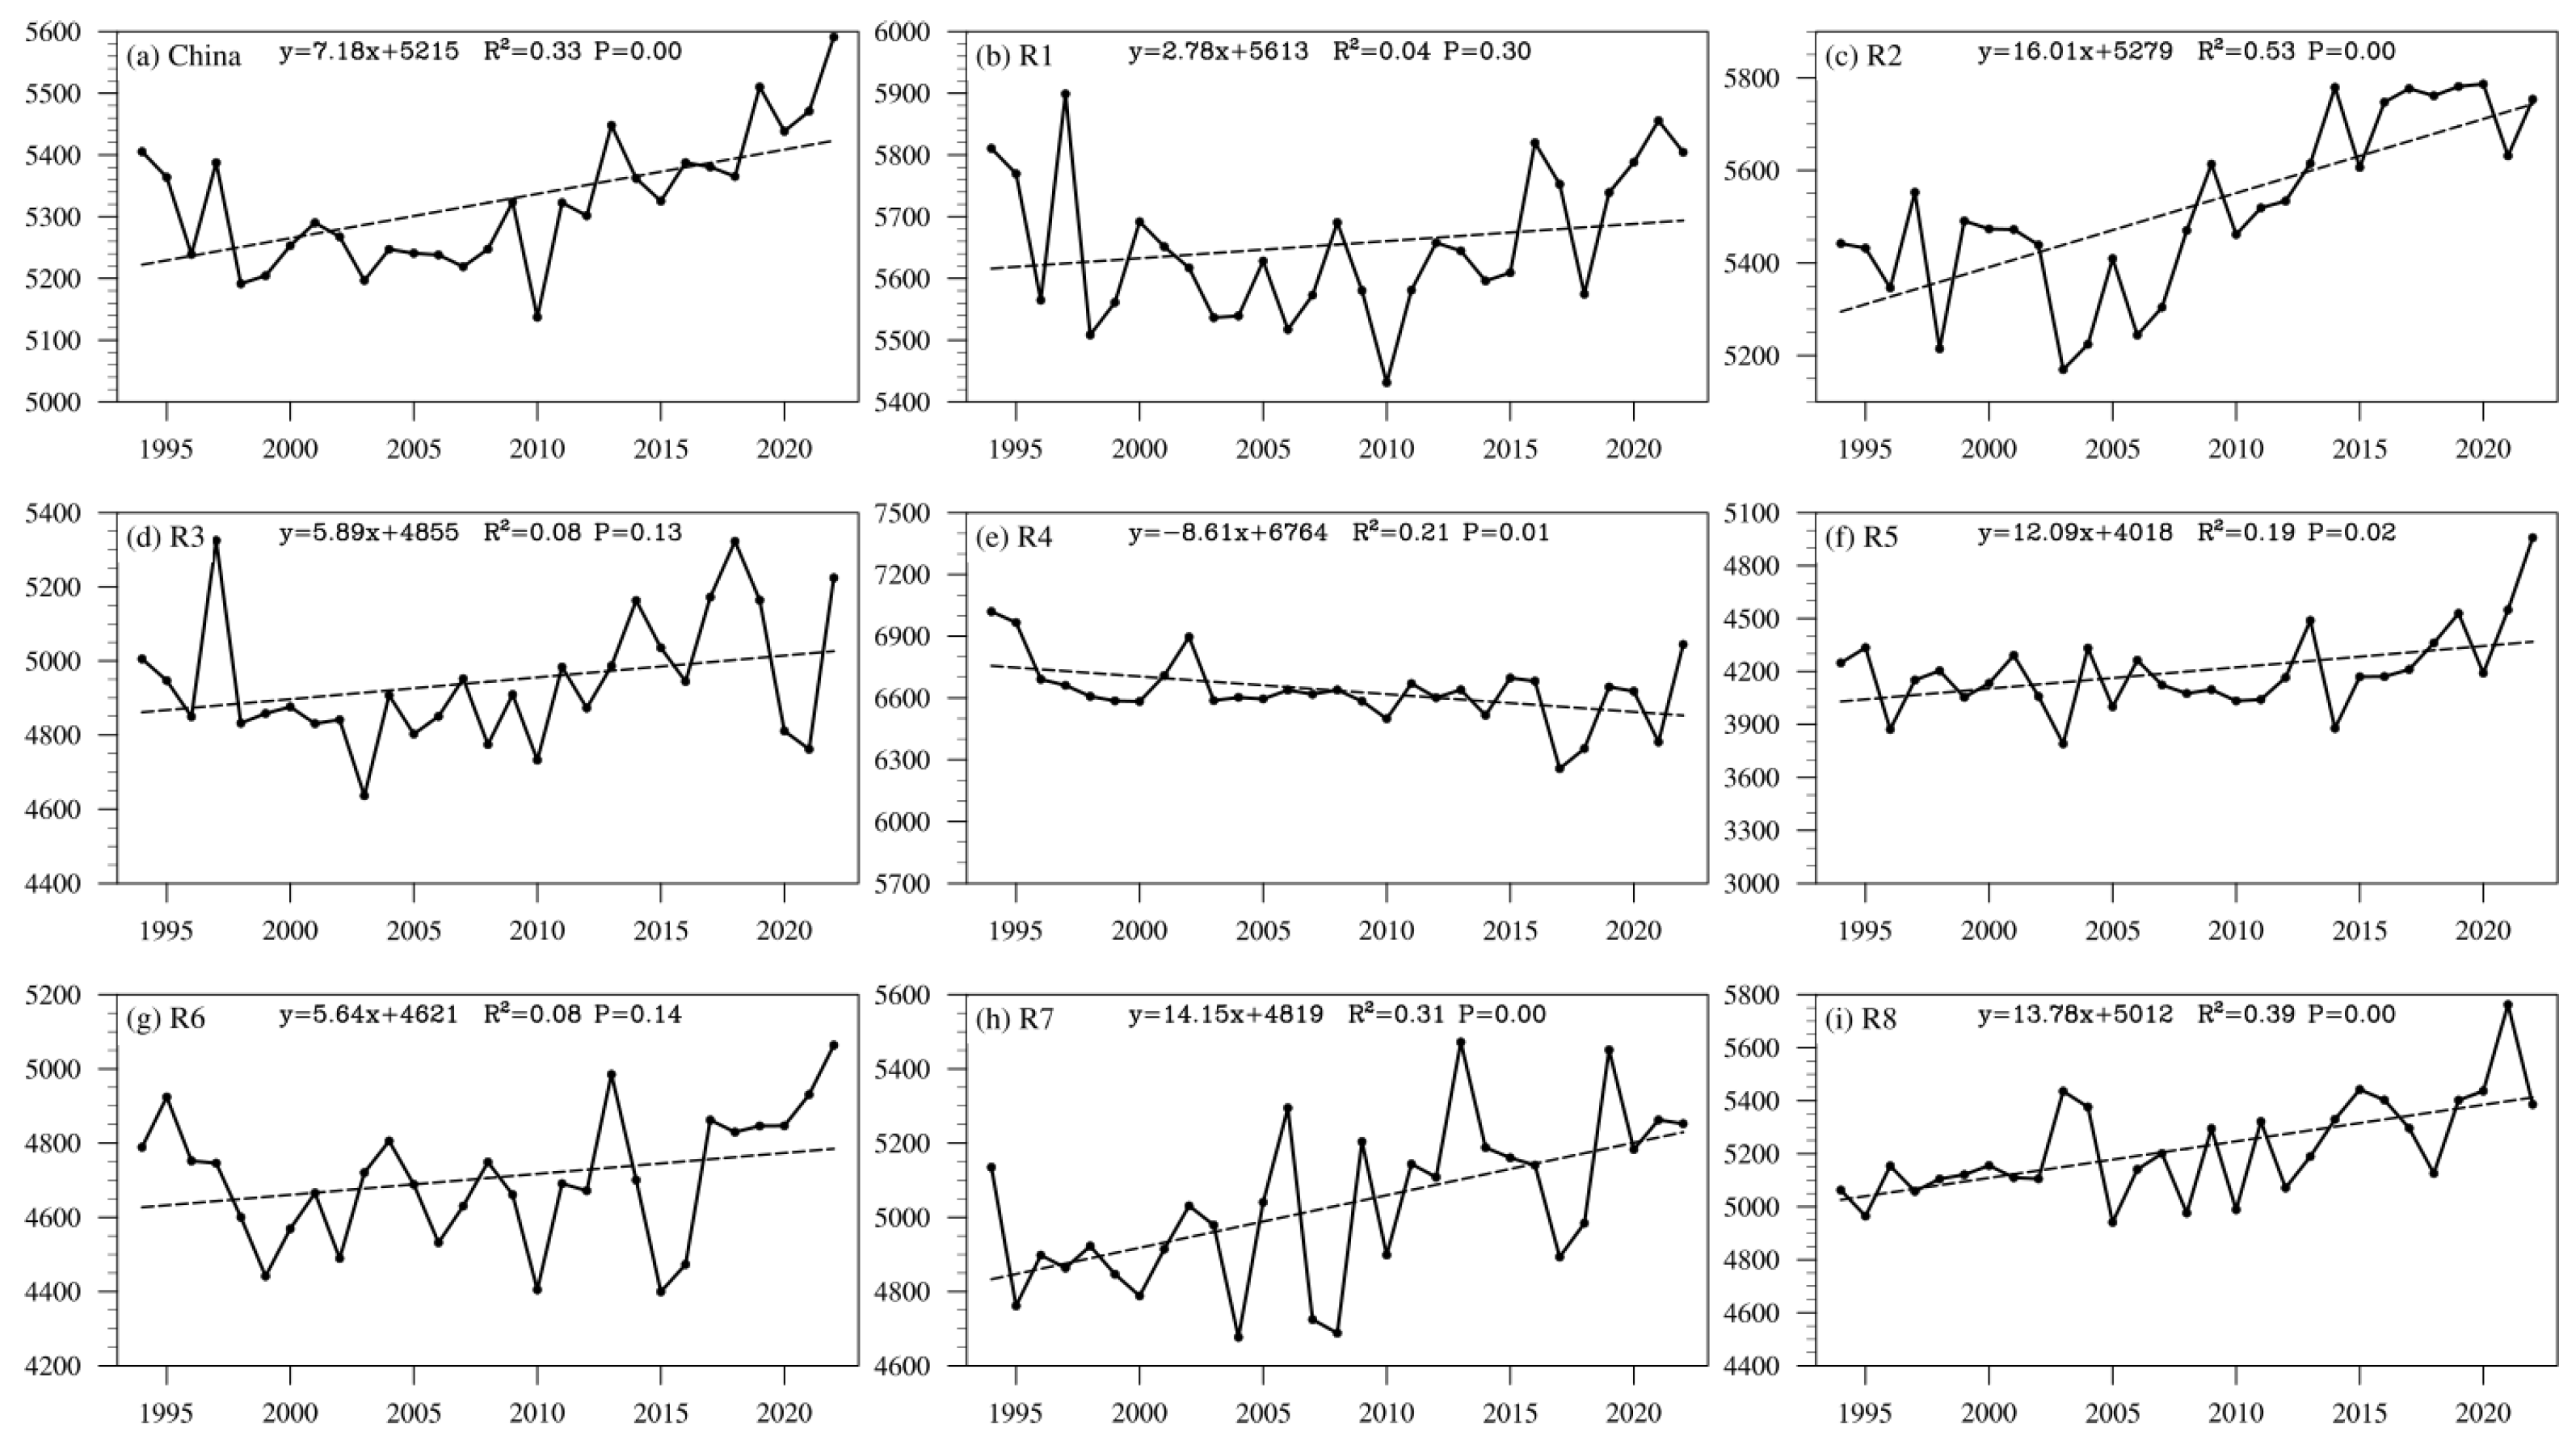
Figure 3 shows the spatial distribution of SSR trends in China. Regarding the annual SSR trend, stations across the entire Tibetan Plateau, and parts of Northwest, Northeast, and East China show decreasing trends. Increasing trends dominate in North China, Southwest China, and South China, with a slight, insignificant increase in Central China (Figure 3). In terms of regional average trends, the nationally averaged SSR show a significant increasing trend from 1994 to 2022, with a rate of 72 MJ m−2 per decade. Existing studies show increasing rates of SSR in China in recent decades ranging from 0.4 to 4 W m−2 per decade; for example, the trend for China from 1990 to 2013 was 2.1 W m−2 per decade [12]. SSR increased significantly in North China, Central China, Southwest China, and South China, with trends of 160, 121, 142, and 138 MJ m−2 per decade, respectively. North China experienced the fastest increase, particularly after 2005. SSR decreased significantly over the Tibetan Plateau (−86 MJ m−2 per decade), while Northwest, Northeast, and East China show insignificant increasing trends (Figure 4). While the linear trend provides a quantitative summary of the long-term average change, we note that in some regions (e.g., East China) the time series shows a relatively stable phase before ~2005 followed by a sharp increase afterward—a pattern temporally consistent with the rapid AOD decline, which will be discussed in the attribution analysis below.

3.2.2. Seasonal SSR Trends

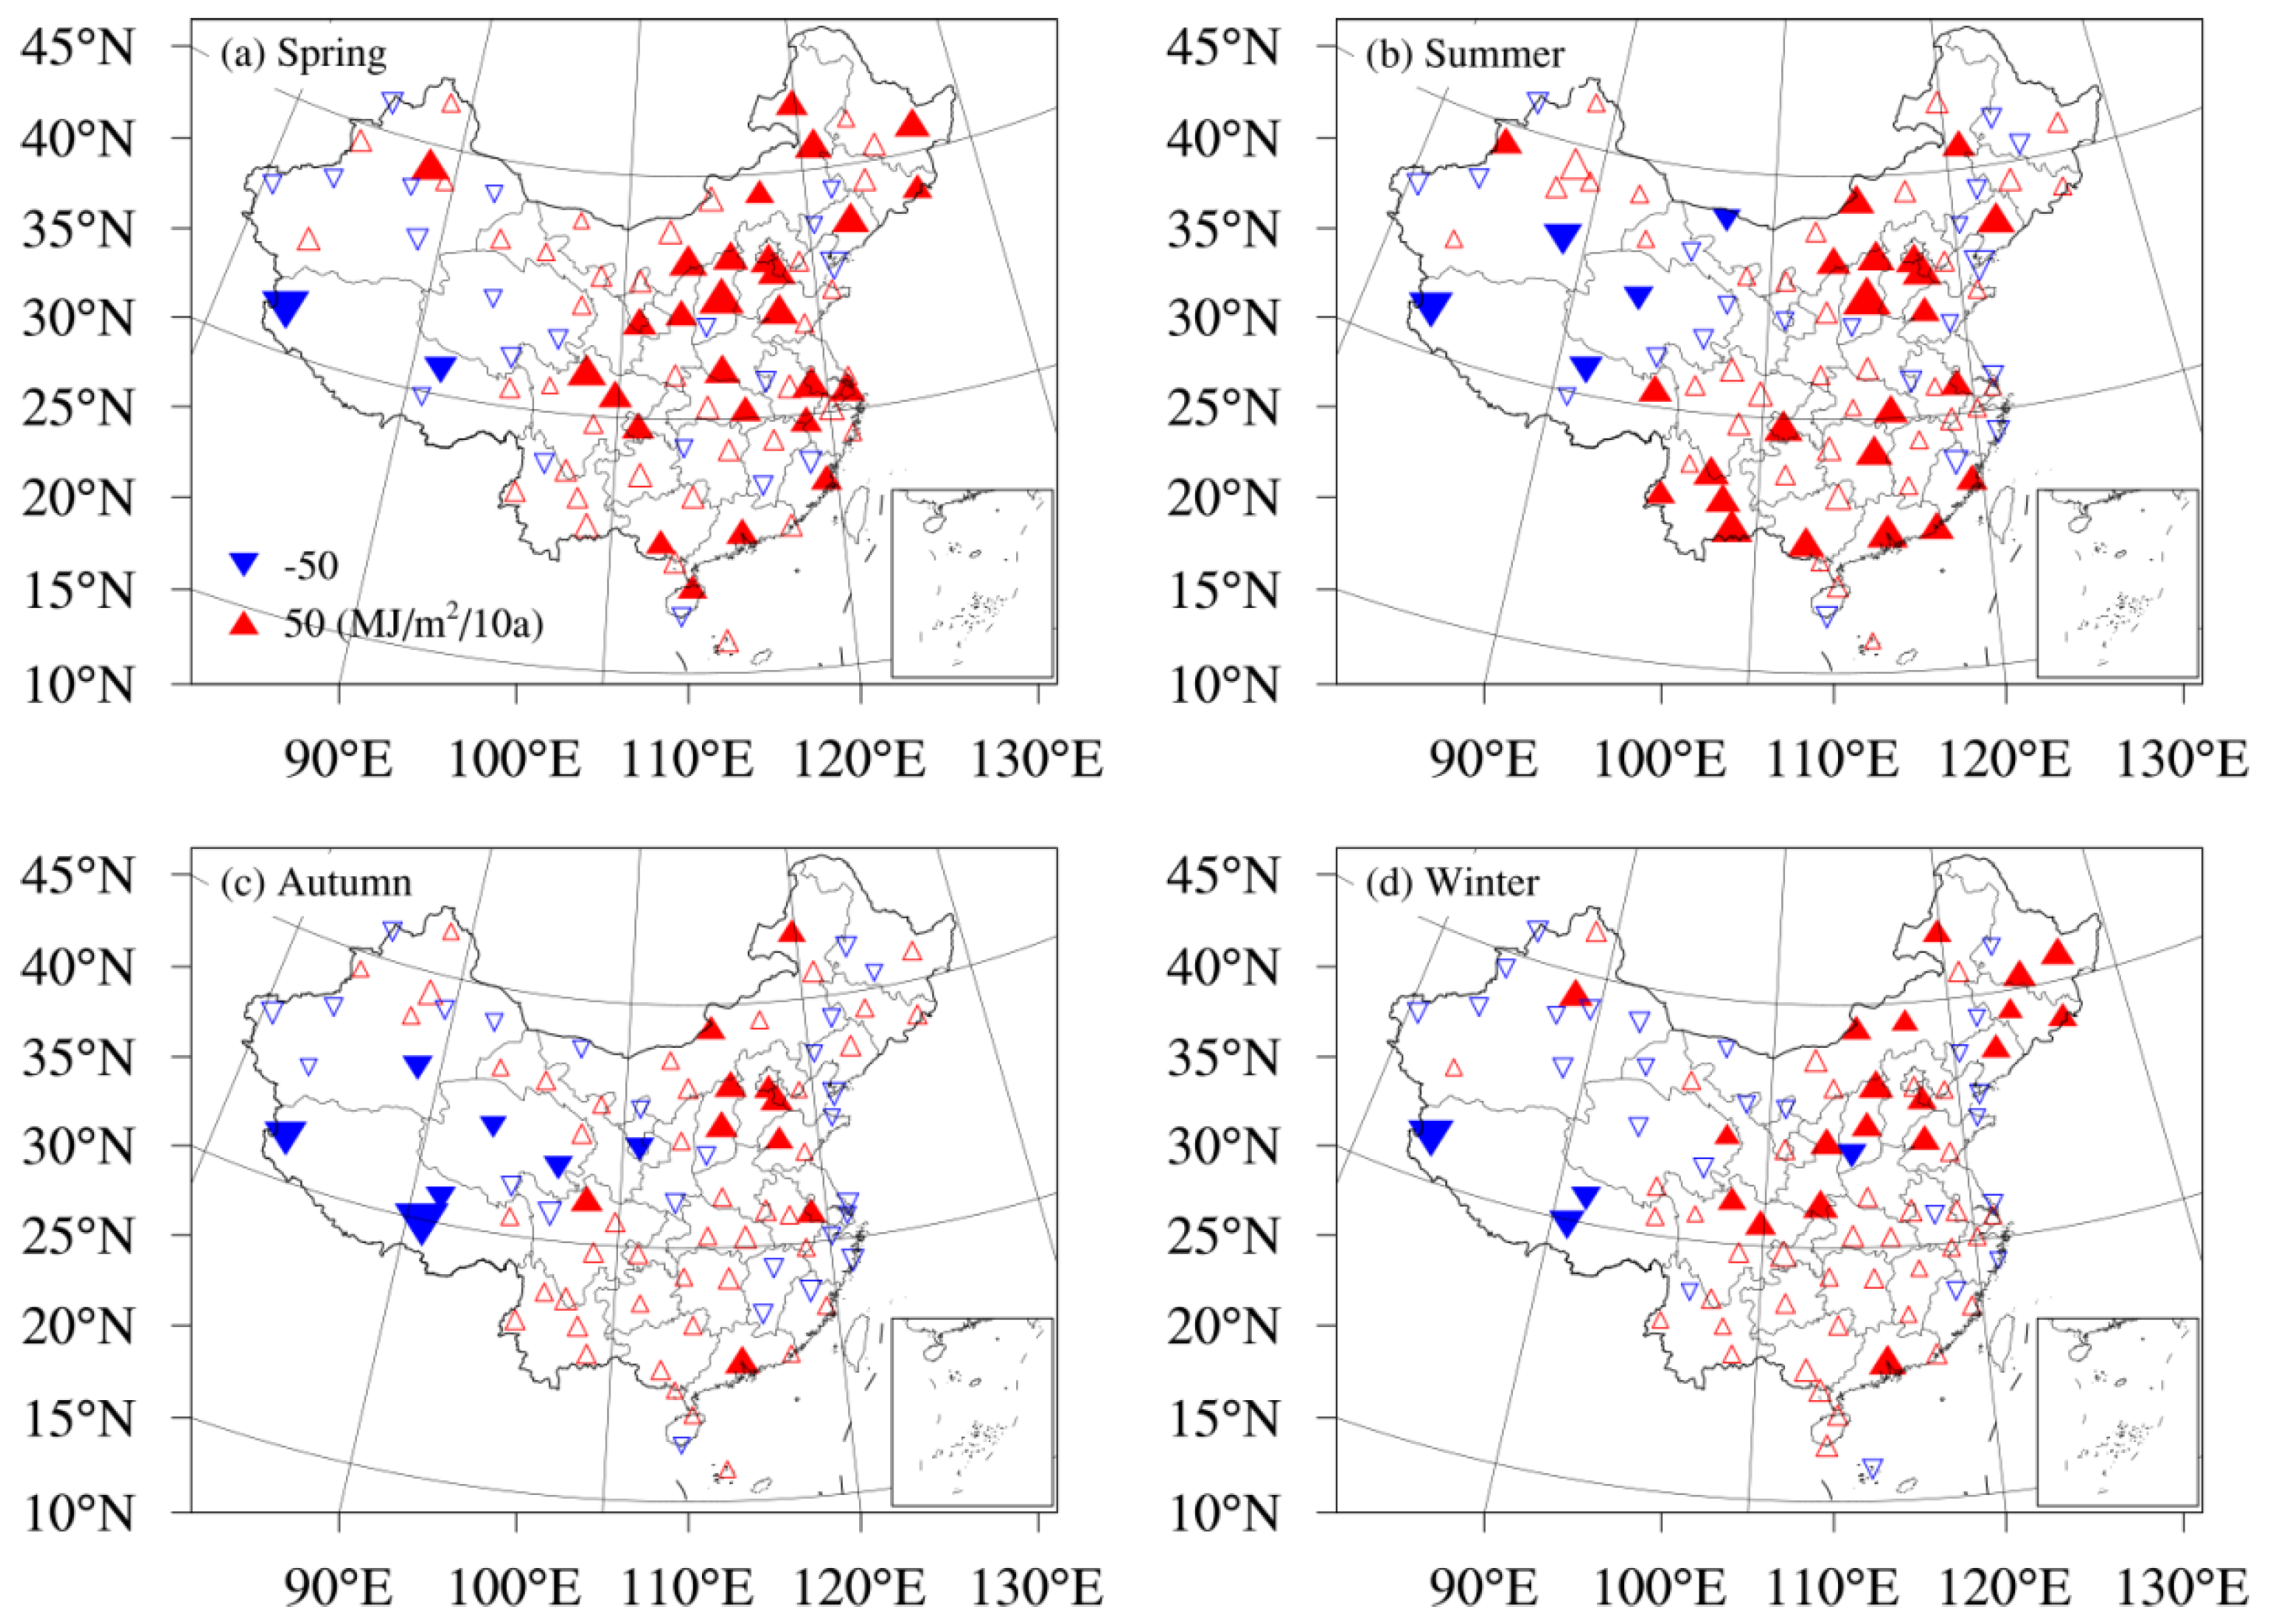
Spring exhibited a predominant increase in SSR, observed at 65 stations (27 of which were statistically significant), compared to a decrease at 22 stations (2 significant). Spatially, increasing trends were mainly concentrated in eastern China, while decreasing trends were primarily found in the west. Stations with significant increases were clustered in North, Central, East, South, and Southwest China (Figure 5a). In summer, 61 stations show increasing trends (23 significant) versus 26 stations with decreases (5 significant). Significant increases were most notable in North China, South China, and the southern part of Southwest China, whereas significant decreases were largely confined to the Tibetan Plateau (Figure 5b). This spatial pattern manifested a meridional “+ − +” dipole structure, resembling the dominant mode of summer precipitation in China [42,43]. Autumn also featured a predominance of increasing trends (54 stations increasing, 33 decreasing), with 10 stations showing significant increases, mainly located in North China (Figure 5c). During winter, increases were recorded at 58 stations and decreases at 29, with increasing trends dominating in eastern China and decreases more common in the west (Figure 5d).
Overall, SSR displayed increasing trends in all four seasons, with the most pronounced and widespread significant increases occurring in spring and summer. Notably, North China experienced significant increases in all seasons, while the Tibetan Plateau showed consistent significant decreases throughout the year. These findings differ somewhat from Wang et al. [12], who reported relatively homogeneous spatial patterns in seasonal SSR trends from 1989 to 2013, with the most marked increase in autumn. The discrepancies are likely attributable to differences in the datasets and study periods employed [18].
The nationally averaged SSR exhibited significant increasing trends in the annual mean, spring, and summer, with the most rapid increase occurring in spring (30 MJ m−2 per decade). This is generally consistent with the findings of Wang et al. [12], though their study indicated a more stable trend in autumn. At the regional scale, significant increases in annual mean SSR were observed in North, Central, Southwest, and South China. North China experienced significant increases across all four seasons, driving its pronounced annual trend. In Central China, the significant annual increase was predominantly contributed by substantial seasonal trends in spring and summer (31 and 37 MJ m−2 per decade, respectively), despite only the annual mean being statistically significant. Southwest China showed the fastest increases in spring and summer, followed by a moderate rise in autumn. South China recorded significant increases in all seasons except autumn. In contrast, the Tibetan Plateau underwent a significant decline in the annual mean, with the most rapid decrease in autumn, followed by winter. Although annual mean SSR also increased in Northwest, Northeast, and East China, these trends were not statistically significant; significant seasonal increases were confined to winter in Northeast China and spring in East China (see Table 2 for details).

3.3. Attribution of SSR Changes in China from 1994 to 2022

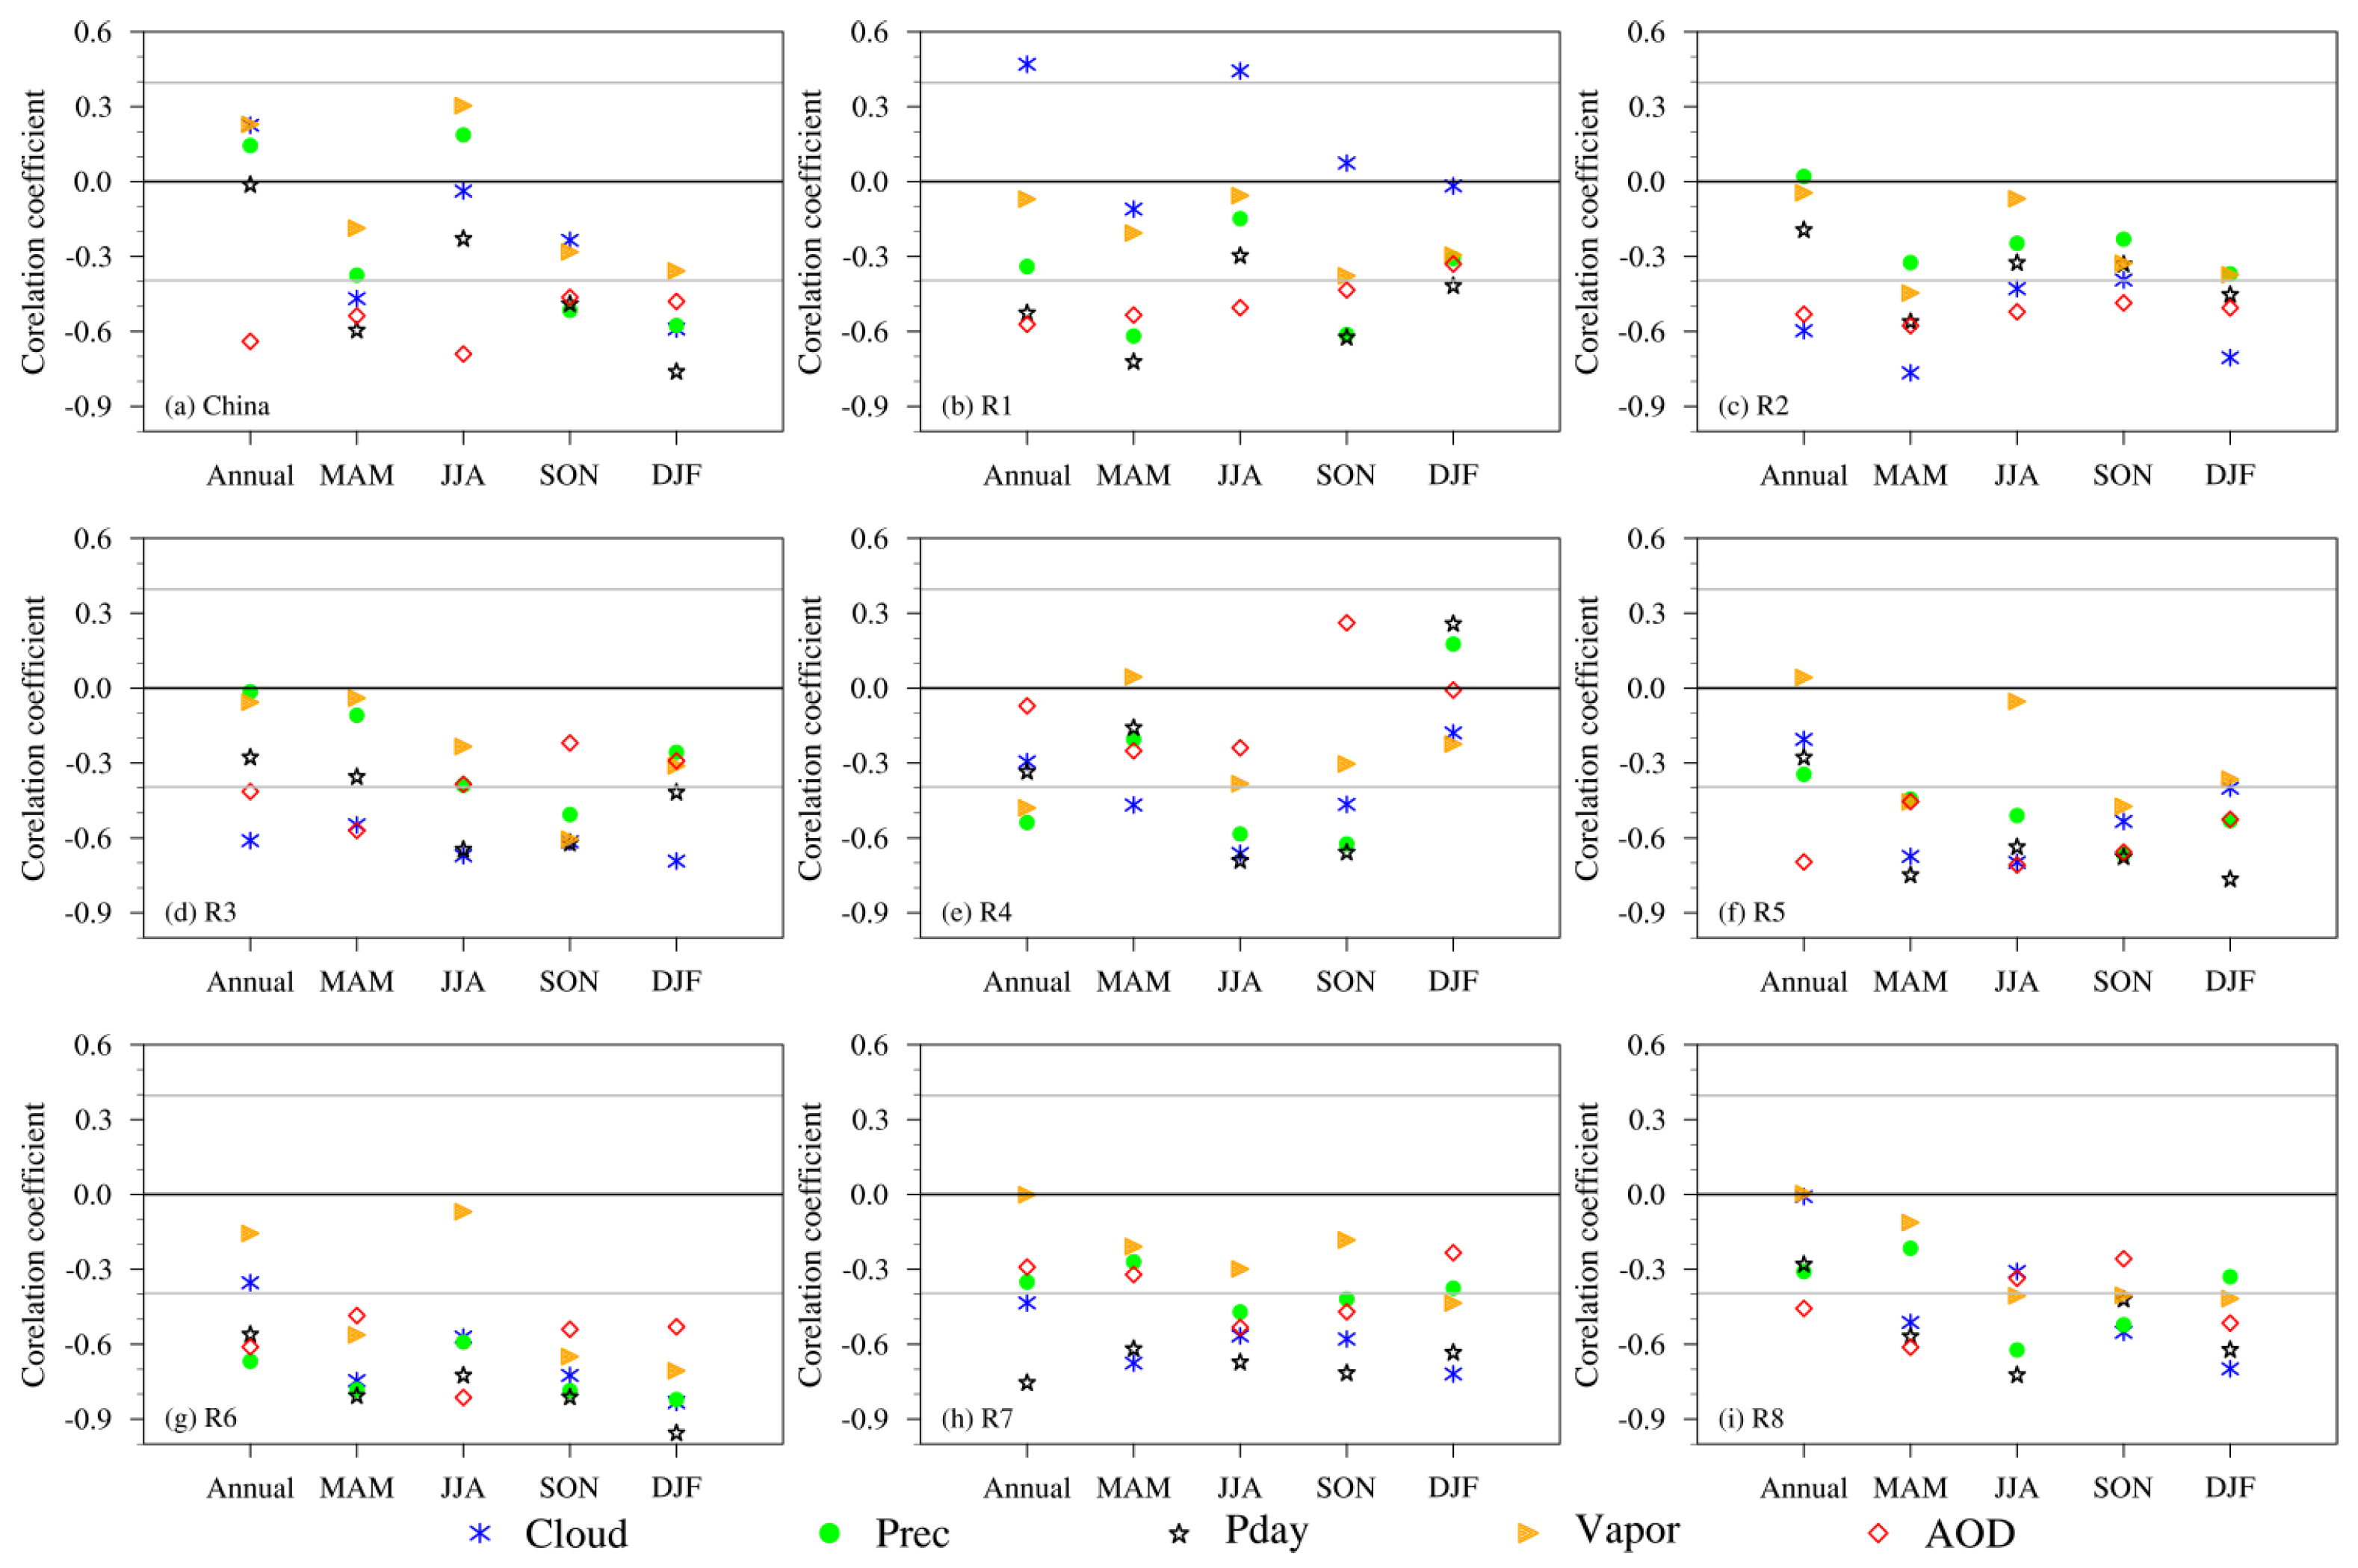
SSR is modulated by a combination of factors affecting atmospheric transparency, including cloud cover, water vapor content, aerosol loading, and precipitation-related weather conditions. This study examines the correlations and concurrent trends between SSR and five key variables—TCC, precipitation amount, precipitation days, water vapor content, and AOD—across different regions and seasons. As illustrated in Figure 6, these variables generally exhibit negative correlations with SSR, meaning that an increase in any of them tends to reduce atmospheric transparency, enhance the attenuation of solar radiation, and thus lower SSR, whereas a decrease favors higher SSR. However, the strength and significance of these correlations vary markedly by region and season, highlighting distinct regional and seasonal controls on SSR. National averages fail to capture these distinct spatiotemporal patterns and discrepancies, highlighting the importance of conducting attribution analysis on regional and seasonal levels.
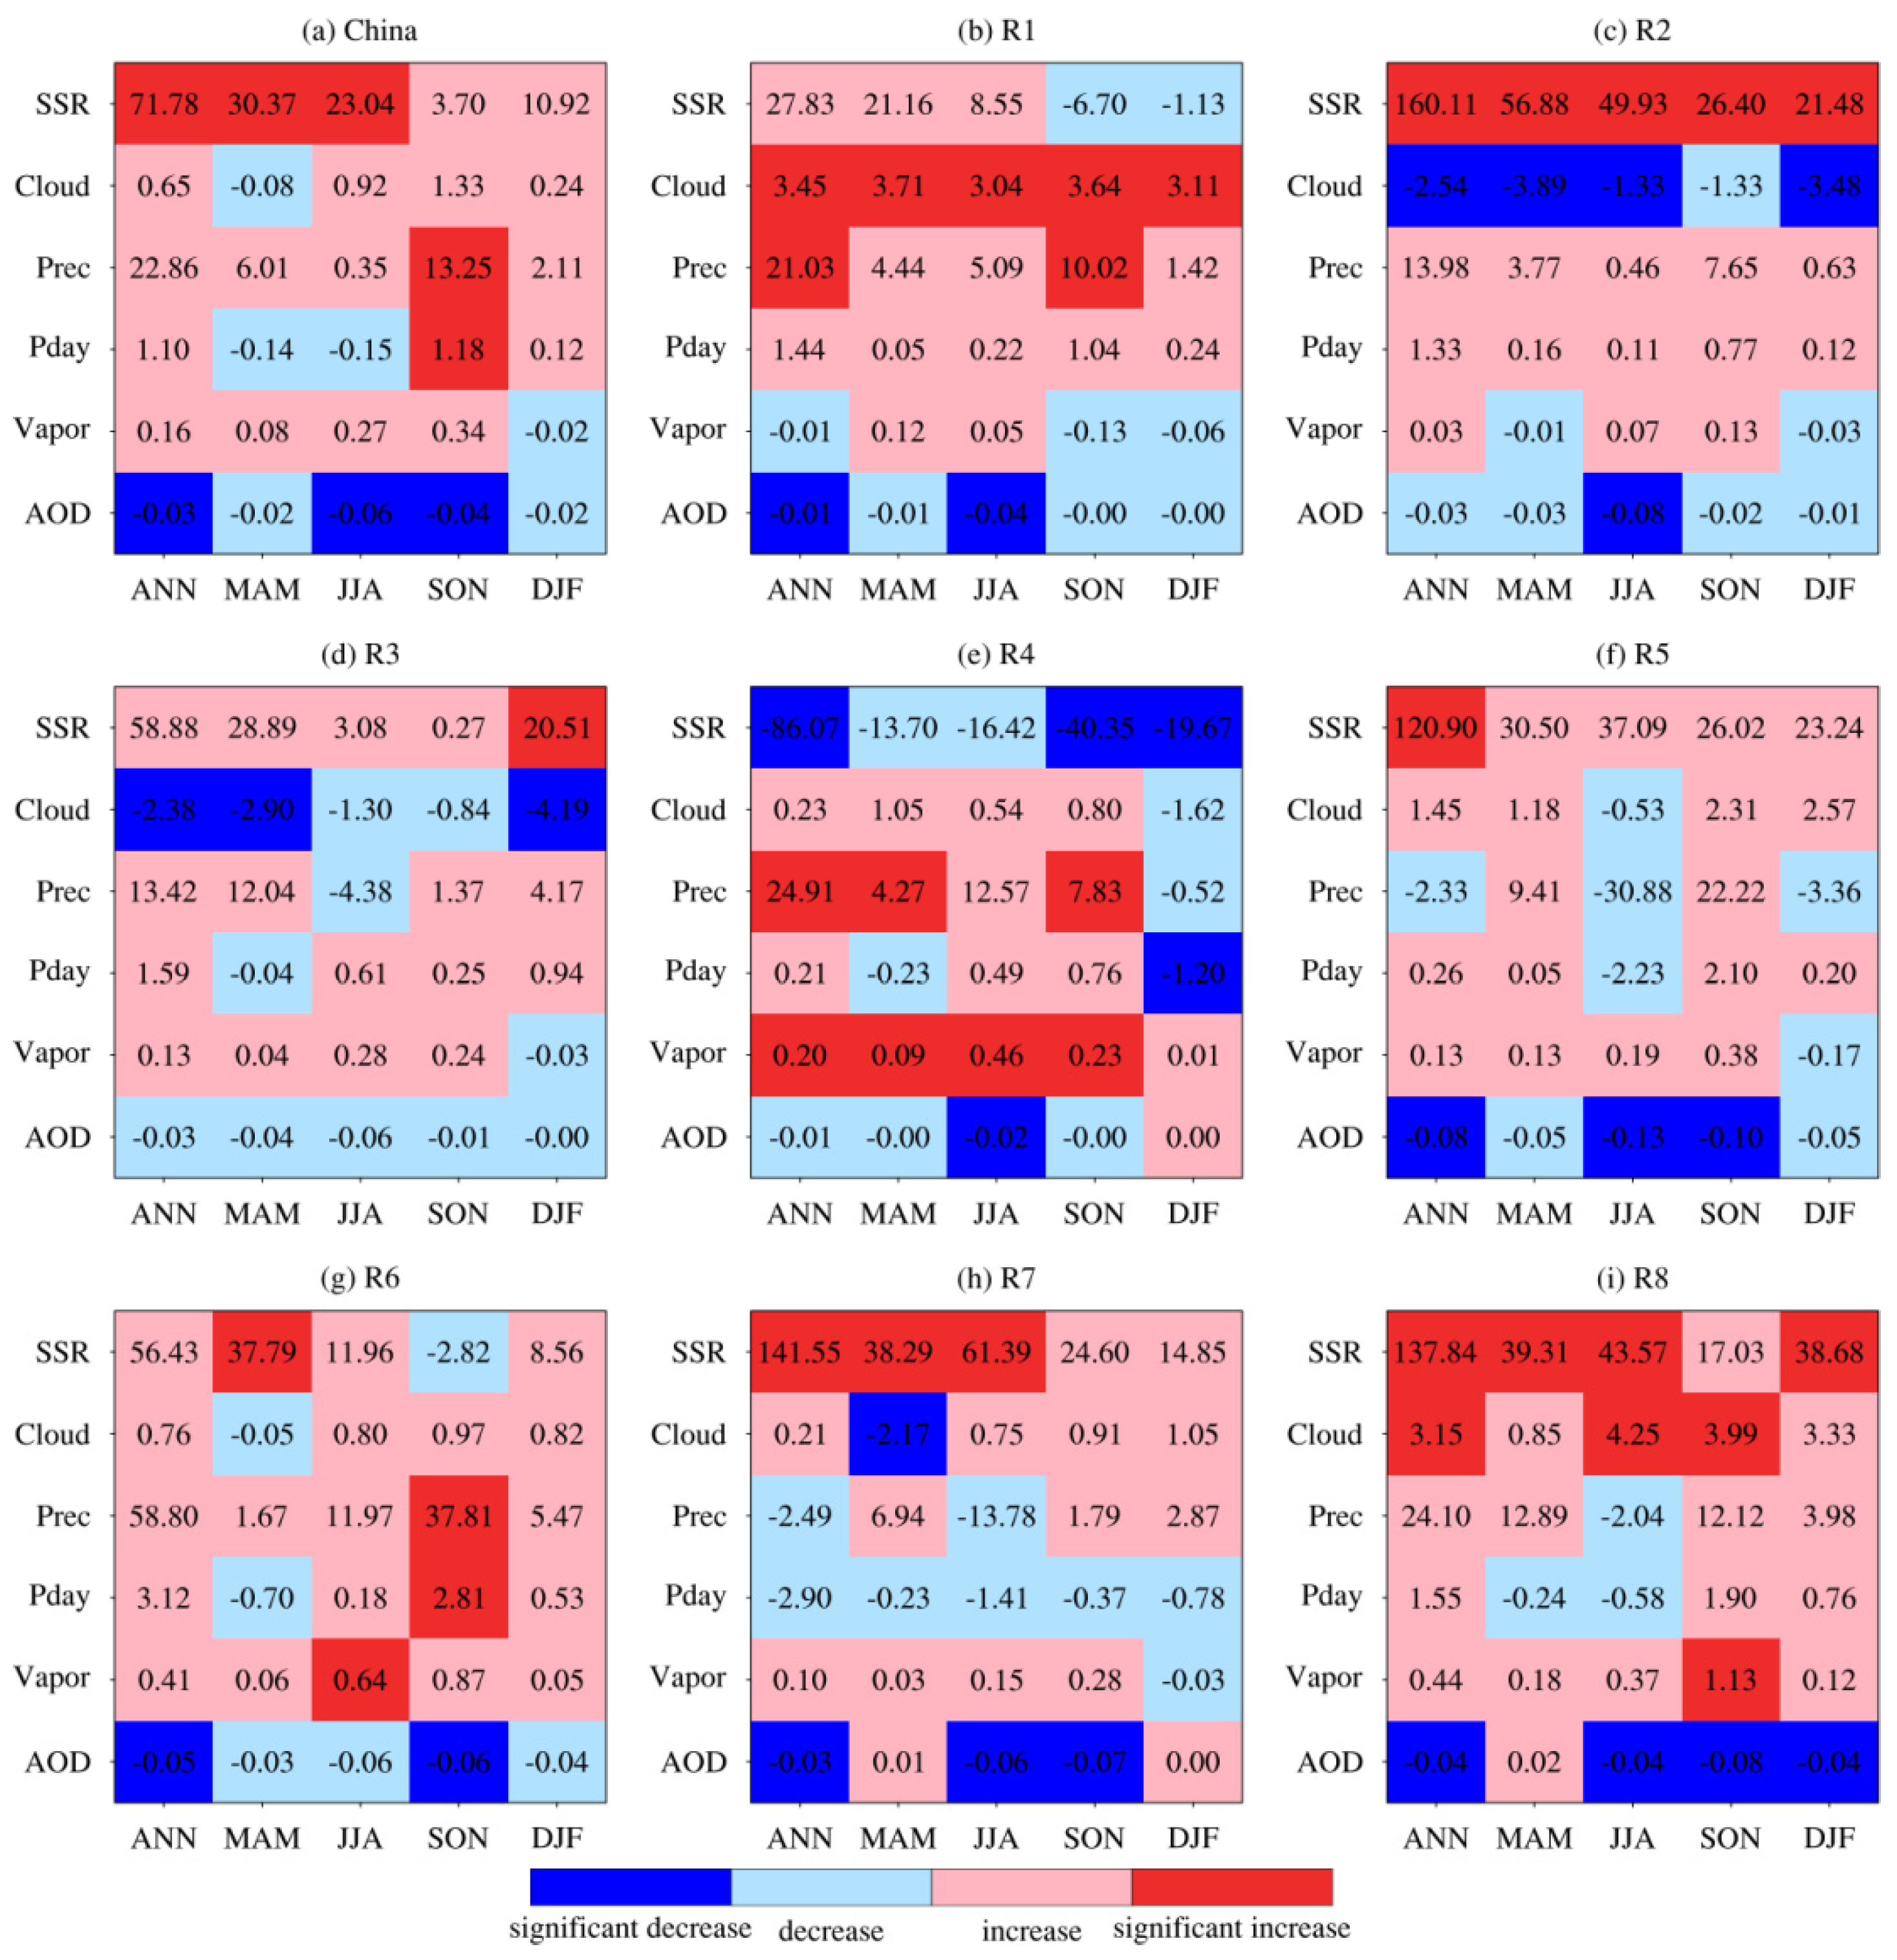
At national scale, the annual-mean SSR correlates most strongly with AOD (exceeding −0.6). In spring, SSR shows significant negative correlations with precipitation days, AOD, and TCC, indicating that the spring brightening is largely associated with declines in these factors. During summer, AOD exerts the dominant influence. Although autumn and winter also show considerable negative correlations between SSR and AOD, precipitation days, and precipitation amount, AOD remains the primary driver of their changes (Figure 6a and Figure 7a). Overall, the increase in average SSR is attributable mainly to reductions in AOD, precipitation days, and TCC, with the pronounced spring increase making a substantial contribution to the annual trend.
In Northwest China, the annual-mean SSR displays significant negative correlations with AOD and precipitation days. The observed increase in annual SSR in this region is driven primarily by a decline in AOD. Similarly, spring and summer SSR show upward trends, which correlate significantly with decreases in precipitation days, precipitation amount, and AOD, with AOD reduction again identified as the principal cause. The weakly decreasing trends in autumn and winter SSR may be related to concurrent increases in precipitation days and amount (Figure 6b and Figure 7b).
In North China, the annual-mean SSR is significantly correlated with both TCC and AOD. Spring SSR exhibits significant negative correlations with TCC, AOD, water vapor content, and precipitation days, while summer, autumn, and winter SSR show significant negative correlations primarily with TCC and AOD. Consistent with these relationships, SSR increased significantly in all four seasons, with the most rapid rise occurring in spring and summer. This widespread brightening is attributed mainly to concurrent decreases in TCC and AOD (Figure 6c and Figure 7c).
In Northeast China, the annual-mean SSR is significantly negatively correlated with TCC and AOD. Similar significant correlations are found for spring SSR (with TCC and AOD), summer SSR (with precipitation days and TCC), autumn SSR (with precipitation days, water vapor content, TCC, and precipitation amount), and winter SSR (with cloud cover and precipitation days). Trend analysis indicates increases in both annual and seasonal SSR, although only the winter trend is statistically significant. These increases are primarily associated with reductions in TCC and AOD (Figure 6d and Figure 7d).
On the Tibetan Plateau, the annual-mean SSR correlates significantly negatively with water vapor content and precipitation amount. Spring SSR is significantly correlated with TCC. Summer and autumn SSR show significant correlations with TCC, precipitation days, and precipitation amount. No significant correlations are found for winter SSR. Correspondingly, SSR decreased across all seasons, resulting in a significant annual decline that was most rapid in autumn and winter. This dimming is driven primarily by increases in water vapor content and precipitation, with additional contributions from rising TCC and precipitation days (Figure 6e and Figure 7e).
In Central China, the annual-mean SSR shows a strong negative correlation with AOD, and seasonal SSR is significantly negatively correlated with most of the five factors. While annual and seasonal SSR all increased, only the annual trend is significant, with spring and summer making the largest contributions. The significant annual brightening is largely explained by a marked decrease in AOD, aided by reductions in precipitation amount and days (Figure 6f and Figure 7f).
In East China, the annual-mean SSR is strongly negatively correlated with precipitation amount, AOD, and precipitation days. Seasonally, SSR shows significant negative correlations with all factors except summer water vapor content. The annual mean shows a non-significant increasing trend, which is mainly contributed by a significant spring increase. The increases in annual, spring, summer, and winter SSR are predominantly linked to decreases in AOD, precipitation days, and TCC (Figure 6g and Figure 7g).
In Southwest China, the annual-mean SSR is strongly negatively correlated with precipitation days and TCC. Spring SSR shows similar strong correlations with these two factors. For summer, autumn, and winter, strong negative correlations extend to AOD and precipitation amount as well. SSR increased markedly in spring and summer. The increase in spring is mainly due to decreases in TCC and precipitation days, while the summer increase is primarily driven by reductions in AOD, precipitation amount, and precipitation days. Increases in autumn and winter are also related to decreases in precipitation days and water vapor content. Overall, the SSR increase in this region is chiefly caused by declines in AOD, precipitation days, and precipitation amount (Figure 6h and Figure 7h).
In South China, the annual SSR correlates significantly negatively with AOD. Spring SSR is significantly correlated with AOD, precipitation days, and TCC. Summer SSR shows significant correlations with precipitation days, amount, and water vapor content, while autumn exhibits a similar pattern with the added influence of TCC. Winter SSR correlates significantly with TCC, precipitation days, AOD, and water vapor content. Trend analysis reveals increases in annual and seasonal SSR, with significant rises in spring, summer, and winter. The spring increase is mainly related to fewer precipitation days, and the summer increase is jointly caused by decreases in precipitation days and amount. The significant winter increase is primarily attributed to a sharp decrease in AOD. Despite increasing trends in TCC throughout the year, the substantial reductions in AOD, precipitation amount, and days exerted a stronger influence on SSR, particularly during the rainy spring and summer. Even during winter, the significant decrease in AOD overcame the cloud-cover increase to produce a net brightening (Figure 6i and Figure 7i).
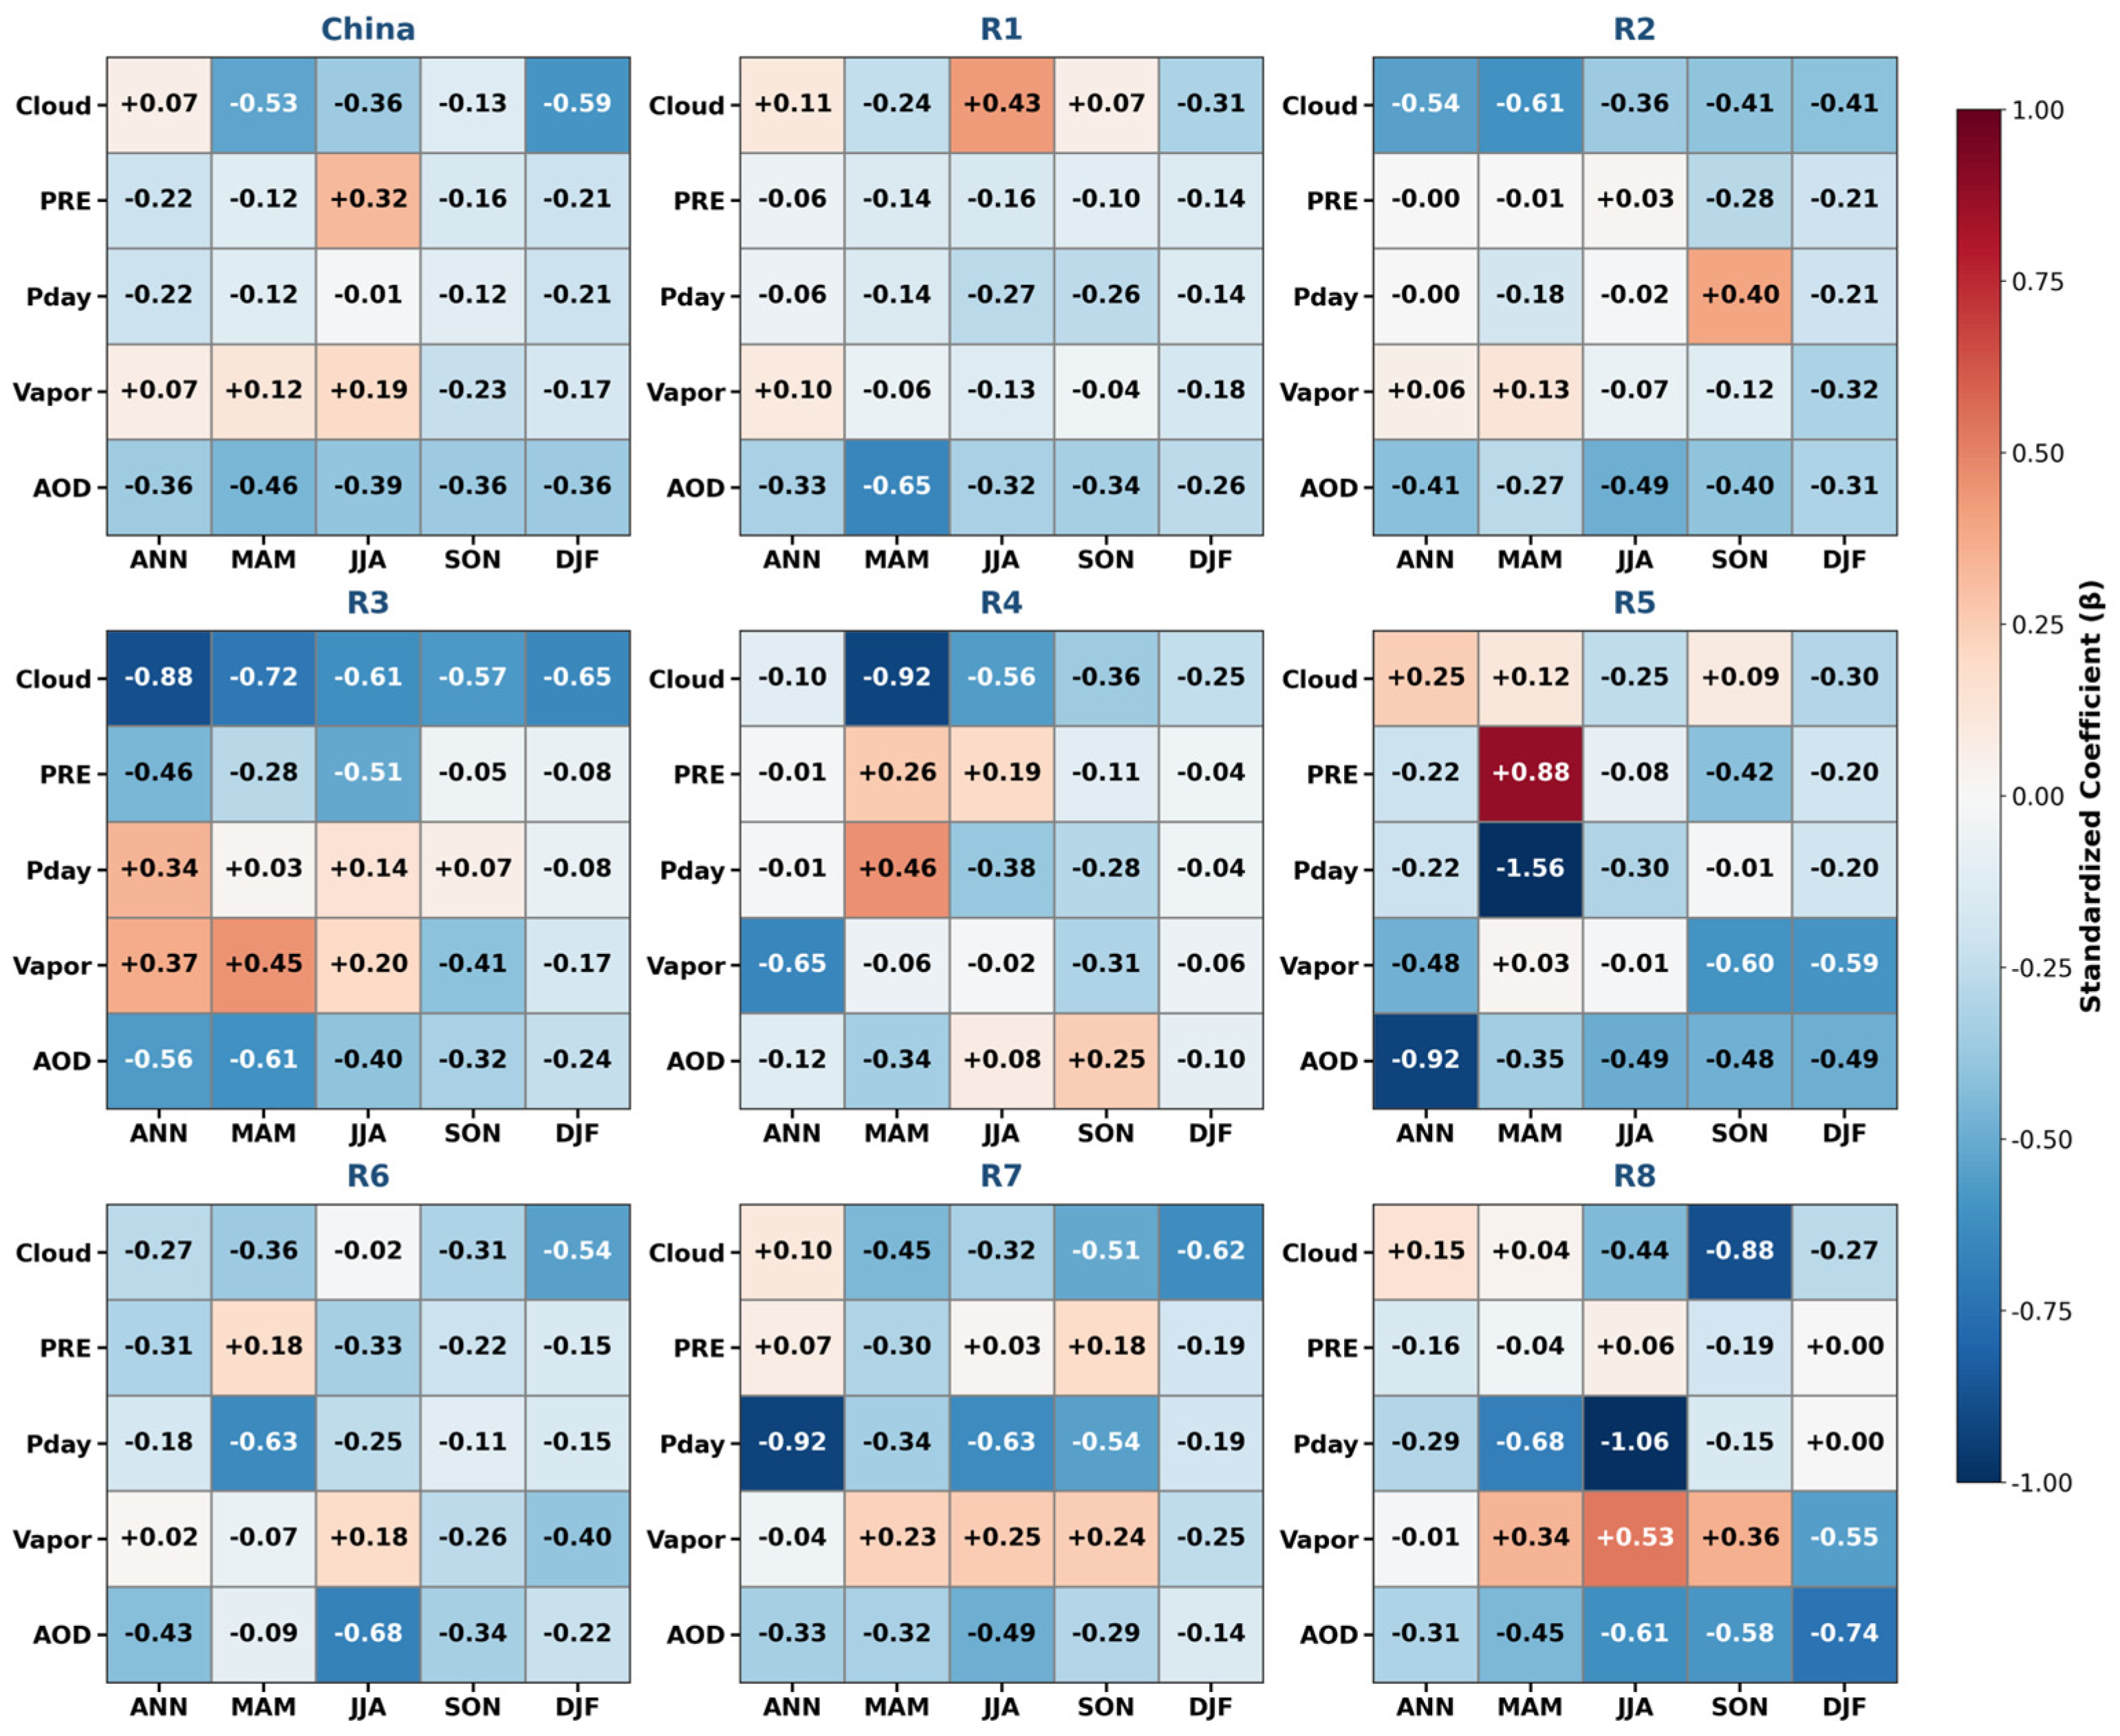
To quantify the contributions of each driver to SSR trends, we calculated standardized regression coefficients (Beta) for all regions and seasons (Figure 8). At the national scale, AOD exhibits the largest absolute coefficients across all seasons (ANN: −0.36; MAM: −0.46; JJA: −0.39; SON: −0.36; DJF: −0.36), confirming that aerosol reduction is the dominant driver of SSR brightening nationwide. Cloud cover also plays a substantial role in spring (−0.53) and winter (−0.59). Strikingly, on the Tibetan Plateau (R4), the absolute coefficients for AOD are consistently the smallest across all seasons (ANN: −0.12; JJA: 0.08; SON: 0.25; DJF: −0.10), while water vapor (ANN: −0.65) and cloud cover (MAM: −0.92; JJA: −0.56) exhibit the largest magnitudes. This quantitatively confirms that hydrological factors, not aerosols, are the primary drivers of SSR variability on the Tibetan Plateau. In North China (R2), cloud cover (ANN: −0.54) and AOD (ANN: −0.41) jointly dominate, consistent with the observed decreases in both variables (Figure 7c). In South China (R8), AOD shows its largest coefficient in winter (DJF: −0.74), explaining the significant winter brightening despite increasing cloud cover. In Southwest China (R7), the AOD coefficient increases substantially in summer (JJA: −0.49 compared to −0.32 in spring), supporting the seasonal shift in dominant drivers.
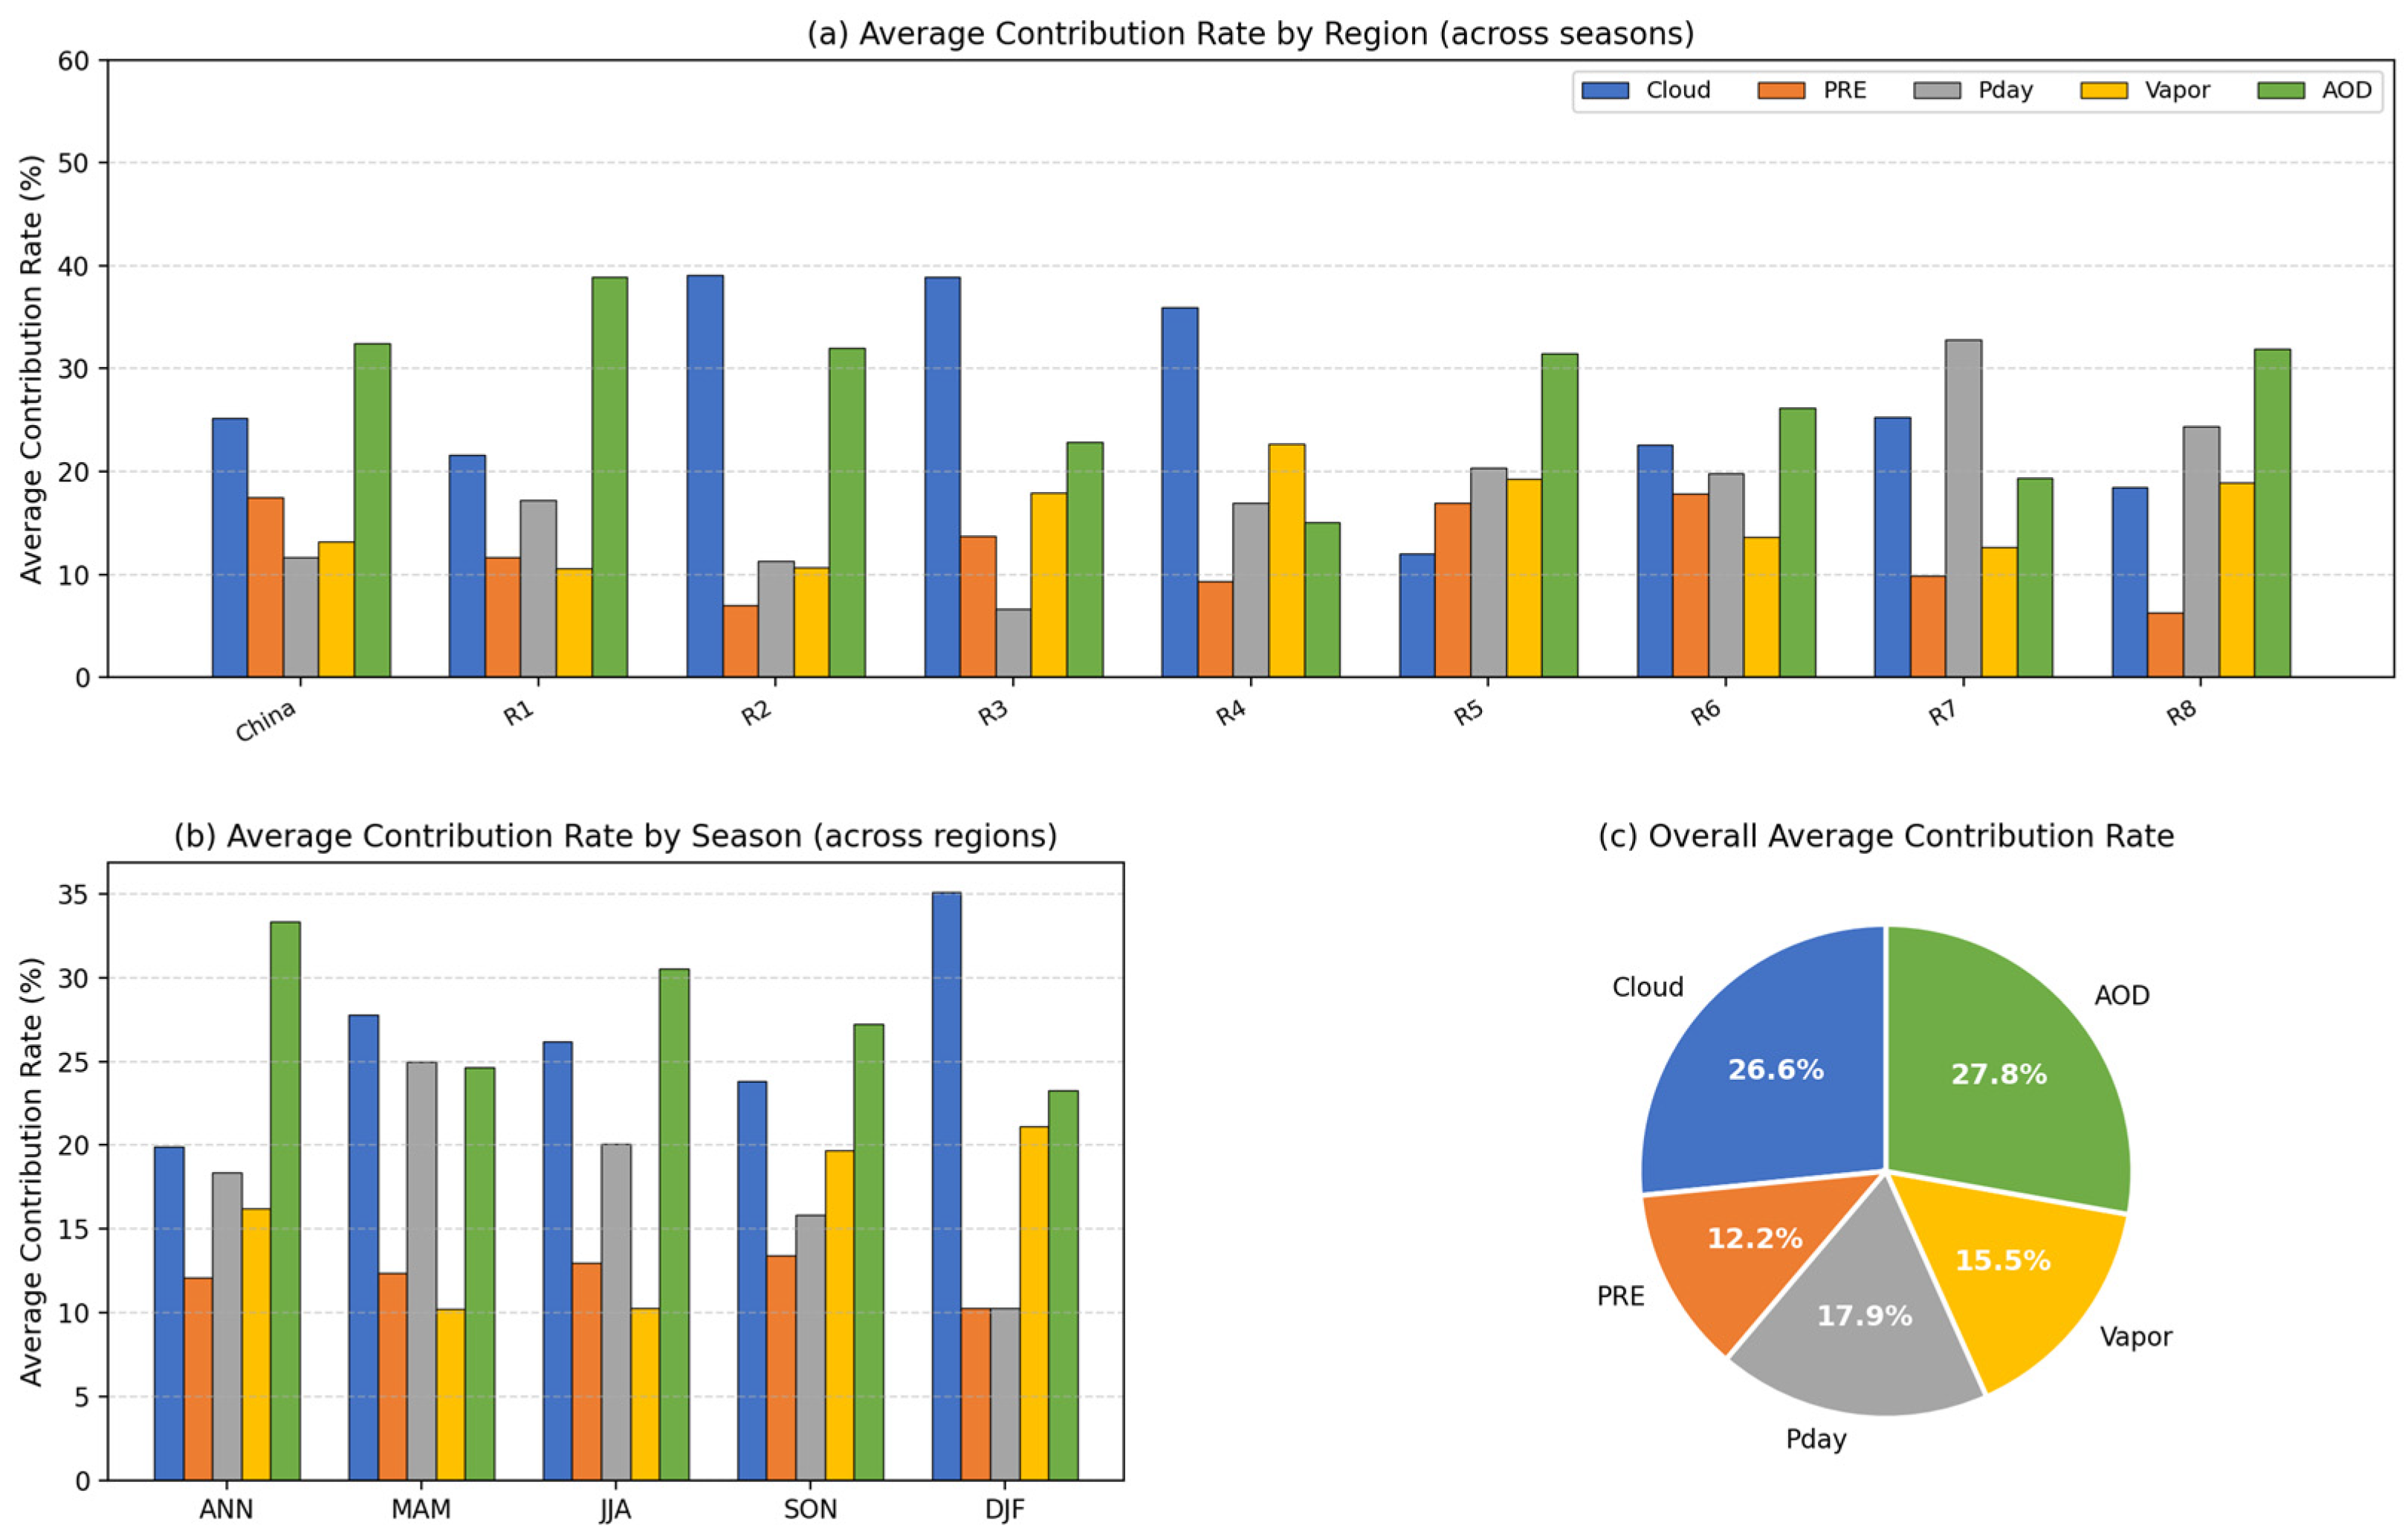
Figure 9 summarizes the relative contributions of each driver to SSR variability aggregated by region (Figure 9a), by season (Figure 9b), and overall (Figure 9c). Figure 9a shows that AOD is the dominant driver in most regions, with the highest contributions in R1 (38.9%), China (32.5%), R2 (31.9%), and R8 (31.9%). Notably, on the Tibetan Plateau (R4), AOD contributes only 15.2%—the lowest among all regions—while Cloud (36.1%), Vapor (22.7%), and Pday (16.8%) collectively dominate, accounting for over 75% of SSR variability. Figure 9b reveals seasonal variations: AOD contributes most strongly in ANN (33.3%) and JJA (30.5%), while Cloud peaks in DJF (35.2%). Figure 9c confirms that AOD (27.8%) and Cloud (26.6%) are the two dominant drivers overall, together accounting for over 54% of SSR variability.

4. Conclusions

This study systematically analyzed the spatiotemporal characteristics and driving mechanisms of SSR across China from 1994 to 2022 by integrating ground-based observations from 87 stations with multi-source satellite (CERES) and reanalysis datasets. The primary findings are as follows:
Significant Spatial Heterogeneity: SSR exhibited significant spatial heterogeneity, ranging from 3352 MJ m−2 (Central China) to 8151 MJ m−2 (Tibetan Plateau), with values generally higher in western China and lower in eastern China.
Nationwide brightening but with a critical exception: Nationally, SSR showed a significant upward trend from 1994 to 2022, with spring and summer being the dominant contributors to this annual increase. However, trends varied markedly by region. North, Central, Southwest, and South China experienced significant “brightening,” with North China showing the most rapid growth (160 MJ m−2 per decade). Conversely, the Tibetan Plateau exhibited a significant “dimming” trend (−86 MJ m−2 per decade), with declines observed across all seasons, particularly in autumn and winter. Regions such as Northwest, Northeast, and East China showed insignificant increasing trends.
Distinctive summer SSR dipole structure: Spring and summer were identified as the dominant contributors to the national annual increase. Notably, summer SSR trends manifest a unique meridional “+ − +” dipole structure, which closely resembles the dominant mode of summer precipitation in China.
Divergent drivers: aerosols vs. hydrology: Nationally, SSR brightening is primarily attributed to reductions in AOD, precipitation days and TCC. In most brightening regions, declining AOD is the consistent dominant factor. Critically, the persistent dimming on the Tibetan Plateau is not caused by aerosols but by increased atmospheric water vapor, cloud cover and precipitation. This demonstrates that in high-altitude, hydrologically active regions, intensified hydrological cycles can override the radiative effects of anthropogenic aerosol reductions.
Quantitative attribution confirms regional contrasts: Standardized regression coefficients (Figure 8 and Figure 9) further quantify the regionally divergent driving mechanisms. Nationally, AOD is the dominant driver of SSR variability (overall contribution: 27.8%; annual: 33.3%), followed by Cloud (26.6%), confirming that aerosol reduction is the primary factor driving the nationwide brightening. Regionally, AOD contributions are highest in Northwest China (R1: 38.9%), North China (R2: 31.9%), Central China (R5: 31.4%), and South China (R8: 31.9%). In North China (R2), Cloud (39.0%) and AOD (31.9%) jointly dominate, reflecting the combined effects of aerosol reductions and cloud cover decreases. Critically, on the Tibetan Plateau (R4), AOD contributes only 15.2%—the lowest among all regions—while Cloud (36.1%), Vapor (22.7%), and Pday (16.8%) collectively account for over 75% of SSR variability. This provides robust quantitative evidence that hydrological feedbacks, rather than aerosol changes, are the primary drivers of the persistent dimming on the Tibetan Plateau.

5. Discussion

Divergent conclusions across various studies regarding the direction and magnitude of SSR changes in China highlight ongoing controversies, largely stemming from differences in the number and distribution of station observations [17,44,45,46]. Given that available long-term SSR stations in China are relatively sparse and unevenly distributed, simple spatial averages may not fully capture the nation’s complex variation patterns [47]. To address this, the integration of high-quality satellite remote sensing products and SSR datasets derived from sunshine duration models—which offer superior spatial resolution—is essential to more accurately reflect the mean distribution and dynamic changes in SSR across China.

5.1. Comparison with Previous Studies

Earlier works based on station observations or sunshine duration proxies have reported varying trends, partly due to inhomogeneous data, instrument replacements (1991–1993), and different study periods [11,13,17]. Our use of a homogeneous post-1994 dataset from 87 stations, combined with satellite products (CERES) and reanalysis, minimizes these artifacts. The national brightening rate we found (2.3 W m−2 per decade) falls within the range of 0.4–4.0 W m−2 per decade reported for China [12], but our regional breakdown reveals that this national average conceals opposite trends. For instance, Wang and Wild [12] noted brightening in most regions but did not emphasize a persistent dimming on the Tibetan Plateau. By extending the study to 2022 and using consistent satellite-derived drivers (AOD, TCC, water vapor, precipitation), we robustly demonstrate that the plateau dimming is not an artifact but a real, seasonally uniform phenomenon.

5.2. Why Does the Tibetan Plateau Dim While Most of China Brightens?

Attribution analysis shows that the nationwide brightening is primarily driven by decreasing AOD, consistent with China’s successful air pollution control measures after ~2005 [29]. The quantitative standardized regression coefficients (Figure 8 and Figure 9) further confirm this: nationally, AOD is the dominant driver of SSR variability, with an overall contribution of 27.8% and an annual contribution of 33.3%, followed by Cloud (26.6%). Regionally, AOD contributions are highest in Northwest China (R1: 38.9%), North China (R2: 31.9%), Central China (R5: 31.4%), and South China (R8: 31.9%). In North China (R2), Cloud (39.0%) and AOD (31.9%) jointly dominate, reflecting the combined effects of aerosol reductions and cloud cover decreases in this region (Figure 7c and Figure 9a).
However, on the Tibetan Plateau, AOD is low and has not decreased as dramatically as in eastern China. Instead, we find that increased water vapor content, TCC, and precipitation are the dominant factors driving the SSR decline. This is quantitatively supported by the standardized regression coefficients (Figure 8): on the Tibetan Plateau (R4), AOD contributes only 15.2%—the lowest among all regions—while Cloud (36.1%), Vapor (22.7%), and Pday (16.8%) collectively account for over 75% of SSR variability (Figure 9a). This suggests that the intensifying hydrological cycle over the plateau [15,40]—manifested as rising atmospheric moisture and cloudiness—overwhelms the relatively weak aerosol radiative effect. Such a mechanism has been hypothesized but, to our knowledge, not quantitatively demonstrated with long-term, multi-source data across all seasons. Our findings thus provide critical evidence that in high-altitude, hydrologically sensitive regions, climate-driven hydrological feedbacks can override anthropogenic aerosol forcing—a key insight for future solar resource assessments and climate modeling.

5.3. The Meridional “+ − +” Dipole Structure in Summer SSR

Another novel finding is the summer SSR trend pattern, which follows a north–south “+ − +” dipole (increase in North China, decrease over the Tibetan Plateau, increase in South China). This pattern strikingly resembles the dominant tripole mode of summer precipitation over eastern China [42,43]. We hypothesize that large-scale circulation anomalies (e.g., East Asian summer monsoon intensity, Pacific decadal oscillation) simultaneously modulate cloud cover, water vapor transport, and precipitation, thereby imprinting on SSR. While correlation does not prove causation, the spatial congruence suggests that summer SSR trends are not merely a local aerosol effect but are tightly coupled to the dynamical redistribution of moisture and clouds.
To understand the physical mechanisms behind this dipole structure, we turn to recent advances in understanding summer SSR variability over China. Sang et al. [48] performed an Empirical Orthogonal Function (EOF) analysis of summer SSR anomalies from 1980 to 2023 and identified a meridional dipole mode as the second leading mode (explaining 14.9% of the variance), featuring out-of-phase SSR changes between northern/western and southern China. This mode is driven by a quasi-barotropic Rossby wave train originating from mid–high latitudes, which modulates cloud cover through moisture flux convergence/divergence and vertical motion. The spatial structure of this EOF-derived dipole mode is remarkably consistent with our observed ‘+ − +’ pattern, confirming that the dipole is a robust feature of summer SSR variability [48].
Furthermore, the association between large-scale circulation indices and SSR anomalies provides additional mechanistic evidence. The North Atlantic Oscillation exerts a significant influence on SSR over northern China, while the East Asian summer monsoon primarily modulates SSR over the Yangtze–Huaihe River basin [49]. The summer SSR dipole also spatially resembles the dominant tripole mode of summer precipitation over eastern China identified by Duan et al. [43], suggesting that both SSR and precipitation are regulated by common large-scale circulation anomalies that simultaneously modulate moisture transport and cloud distribution. Collectively, these lines of evidence indicate that the summer SSR meridional dipole is not merely a local aerosol effect but is tightly coupled to the dynamical redistribution of moisture and clouds under the influence of mid–high-latitude atmospheric circulation [48].

5.4. Implications for Remote Sensing and Solar Energy

Our reliance on CERES satellite products for cloud and aerosol data (2000–2022) is a strength, but also a limitation: the pre-2000 period lacks such consistent satellite retrievals. Nonetheless, the post-2000 consistency between ground-measured SSR trends and satellite-derived driver trends supports our attribution. We highlight that multi-source satellite products (CERES, ERA-Interim) can effectively bridge data gaps in sparse station networks, especially over complex terrain like the Tibetan Plateau. However, caution is needed: satellite retrievals of cloud cover and AOD over high-altitude, snow-covered surfaces have larger uncertainties, which we mitigated by bilinear interpolation to station coordinates and by cross-validating with ground precipitation data.
For solar energy planning, our results deliver a clear and region-specific message. National-average brightening is misleading, as individual regions exhibit divergent and even opposing trends. In North China, the rapid brightening (160 MJ m−2 per decade) across all seasons suggests increasingly favorable conditions for photovoltaic (PV) power generation, and infrastructure planning should account for this positive trend. In contrast, the Tibetan Plateau—despite its highest baseline SSR (6635 MJ m−2)—is experiencing significant year-round dimming (−86 MJ m−2 per decade), with the most rapid declines in autumn and winter. This persistent dimming could reduce solar energy yields in existing and planned PV installations and may also affect glacier melt dynamics through reduced energy input. We therefore recommend that solar resource assessments in this region incorporate both the high baseline values and the negative trend, and that monitoring networks be strengthened to track future changes. In other brightening regions (Central, Southwest, and South China), moderate improvements in solar energy potential can be expected, though their seasonal patterns differ—Southwest China shows the fastest increases in spring and summer, while South China exhibits brightening in all seasons except autumn. These seasonal characteristics should be considered in the design of solar energy systems to optimize seasonal energy matching. Regional-scale assessments, integrating ground-based measurements with satellite data, are not optional but mandatory for accurate solar resource evaluation.

5.5. Limitations and Future Directions

Several limitations remain. First, our correlation-based attribution identifies associations, not causality. Second, the study period (1994–2022) captures the post-instrument-replacement era, but we cannot comment on earlier dimming phases. Third, we did not separate cloud effects into cloud fraction, cloud optical thickness, and cloud phase, which may have different impacts on SSR. Fourth, the 1° × 1° resolution of the CERES aerosol data and the 0.5° × 0.5° resolution of the ERA-Interim water vapor data are relatively coarse, particularly over complex terrain such as the Tibetan Plateau, which may introduce uncertainties in the attribution analysis for this region. While we mitigated this through bilinear interpolation to station coordinates and cross-validation with concurrent precipitation and cloud cover trends, future work could further reduce these uncertainties by incorporating higher-resolution satellite aerosol products and improved reanalysis datasets. Fifth, we did not quantify individual station contributions or separate urban/rural sites. Given that aerosol reductions may differ between urban and rural areas, future research should: (1) apply physically based radiative transfer models (e.g., SBDART, RRTMG) to quantify the exact contribution of each driver [50]; (2) extend the analysis to direct and diffuse radiation components, which are more responsive to aerosol and cloud changes [51]; and (3) investigate the role of atmospheric circulation modes (e.g., PDO, ENSO) in driving decadal SSR variability [21,24]; and (4) conduct station-level trend analysis with urban–rural classification to further refine localized SSR responses. The data and code used in this study are publicly available to encourage further exploration.

Author Contributions

Conceptualization, K.L. and J.X.; methodology, K.L. and J.X.; software, J.X.; validation, K.L., H.Z. and L.D.; formal analysis, J.X.; investigation, H.Z.; resources, J.X. and H.Z.; data curation, J.X. and H.Z.; writing—original draft preparation, J.X. and K.L.; writing—review and editing, K.L., J.X., H.Z., L.D., Z.Z., F.Y., J.C., W.P., P.Z. and L.X.; visualization, J.X. and K.L.; supervision, H.Z. and L.D.; project administration, K.L., H.Z. and L.D.; funding acquisition, H.Z. and L.D. All authors have read and agreed to the published version of the manuscript.

Funding

This research was funded by the National Key Research and Development Program of China (Grant No. 2023YFF0805501), Key Laboratory of Liuzhou Yuanbaoshan Topography Heavy Rain (2025ybssysm1), the Natural Science Foundation of China (42375178), the Natural Science Foundation of China (42375176), the National Natural Science Foundation of China (42271229), Fundamental Research Funds of Institute of Atmospheric Physics, Chinese Academy of Sciences, the China Scholarship Council.

Data Availability Statement

Data are contained within the article and all datasets and post-processing codes applied in this study are also available in the Science Data Bank (https://doi.org/10.57760/sciencedb.35307).

Acknowledgments

We sincerely thank the editor for the help. We would like to thank the National Key Scientific and Technological Infrastructure project “Earth System Science Numerical Simulator Facility (EarthLab)” for its support of our study. We are also thankful to CERES and ECMWF for providing essential datasets.

Conflicts of Interest

The authors declare no conflicts of interest.

References

  1. Tang, W.; Yang, K.; Qin, J.; Min, M.; Niu, X. First Effort for Constructing a Direct Solar Radiation Data Set in China for Solar Energy Applications. J. Geophys. Res. Atmos. 2018, 123, 1724–1734. [Google Scholar] [CrossRef] [Scilit]
  2. Li, P.; Gao, X. The Impact of Photovoltaic Power Plants on Ecological Environment and Climate: A Literature Review. Plateau Meteorol. 2021, 40, 702–710. (In Chinese) [Google Scholar] [CrossRef]
  3. Song, F.; Mao, Y.; Liu, S.; Wu, L.; Dong, L.; Su, H.; Wang, Y.; Chtirkova, B.; Wu, P.; Wild, M. A long-term decline in downward surface solar radiation. Natl. Sci. Rev. 2025, 12, nwaf007. [Google Scholar] [CrossRef] [Scilit] [PubMed]
  4. Sweerts, B.; Pfenninger, S.; Yang, S.; Folini, D.; van der Zwaan, B.; Wild, M. Estimation of losses in solar energy production from air pollution in China since 1960 using surface radiation data. Nat. Energy 2019, 4, 657–663. [Google Scholar] [CrossRef] [Scilit]
  5. Wild, M. Enlightening Global Dimming and Brightening. Bull. Am. Meteorol. Soc. 2012, 93, 27–37. [Google Scholar] [CrossRef] [Scilit]
  6. Wild, M. Global dimming and brightening: A review. J. Geophys. Res. Atmos. 2009, 114, D00D16. [Google Scholar] [CrossRef] [Scilit]
  7. Wild, M.; Wang, Y.; Wang, K.; Yang, S. A Perspective on Global Dimming and Brightening Worldwide and in China. Adv. Atmos. Sci. 2026, 43, 281–294. [Google Scholar] [CrossRef] [Scilit]
  8. Ye, J.; Li, F.; Sun, G.; Guo, A. Solar dimming and its impact on estimating solar radiation from diurnal temperature range in China, 1961–2007. Theor. Appl. Clim. 2010, 101, 137–142. [Google Scholar] [CrossRef] [Scilit]
  9. Wang, Y.W.; Yang, Y.H. China’s dimming and brightening: Evidence, causes and hydrological implications. Ann. Geophys. 2014, 32, 41–55. [Google Scholar] [CrossRef] [Scilit]
  10. Lin, C.; Yang, K.; Huang, J.; Tang, W.; Qin, J.; Niu, X.; Chen, Y.; Chen, D.; Lu, N.; Fu, R. Impacts of wind stilling on solar radiation variability in China. Sci. Rep. 2015, 5, 15135. [Google Scholar] [CrossRef] [Scilit] [PubMed]
  11. Tang, W.J.; Yang, K.; Qin, J.; Cheng, C.C.K.; He, J. Solar radiation trend across China in recent decades: A revisit with quality-controlled data. Atmos. Chem. Phys. 2011, 11, 393–406. [Google Scholar] [CrossRef] [Scilit]
  12. Wang, Y.; Wild, M. A new look at solar dimming and brightening in China. Geophys. Res. Lett. 2016, 43, 777–785. [Google Scholar] [CrossRef] [Scilit]
  13. He, Y.; Wang, K. Variability in Direct and Diffuse Solar Radiation Across China From 1958 to 2017. Geophys. Res. Lett. 2020, 47, e2019GL084570. [Google Scholar] [CrossRef] [Scilit]
  14. Shi, G.-Y.; Hayasaka, T.; Ohmura, A.; Chen, Z.-H.; Wang, B.; Zhao, J.-Q.; Che, H.-Z.; Xu, L. Data Quality Assessment and the Long-Term Trend of Ground Solar Radiation in China. J. Appl. Meteorol. Climatol. 2008, 47, 1006–1016. [Google Scholar] [CrossRef] [Scilit]
  15. Yang, K.; Wu, H.; Qin, J.; Lin, C.; Tang, W.; Chen, Y. Recent climate changes over the Tibetan Plateau and their impacts on energy and water cycle: A review. Glob. Planet. Chang. 2014, 112, 79–91. [Google Scholar] [CrossRef] [Scilit]
  16. Yang, X.; Zeng, Y.; Qiu, X.; Jiang, A. The Climatic Change of Global Solar Radiation over The Yellow River Basin During 1960–2000. J. Appl. Meteorol. Sci. 2005, 16, 243–248. (In Chinese) [Google Scholar]
  17. Yang, S.; Wang, X.L.; Wild, M. Homogenization and Trend Analysis of the 1958–2016 In Situ Surface Solar Radiation Records in China. J. Clim. 2018, 31, 4529–4541. [Google Scholar] [CrossRef] [Scilit]
  18. Kambezidis, H.D. The solar radiation climate of Athens: Variations and tendencies in the period 1992–2017, the brightening era. Sol. Energy 2018, 173, 328–347. [Google Scholar] [CrossRef] [Scilit]
  19. Jin, L.; He, Q.; Li, Z.; Ma, M.M.M.; Miao, Q. Influence of Sand-Dust on Solar Radiation in the Hinterland of Taklimakan Desert. Plateau Meteorol. 2014, 33, 1403–1410. (In Chinese) [Google Scholar] [CrossRef]
  20. Liu, C.; Ren, L.; Li, X.; Jia, B.; Yu, T.; Zhang, C.; Xiao, J.; Zhao, C.; Zhu, M. Evaluation to the Solar Energy Resources in the Sandy Regions of Northern China from 1990 to 2019. Plateau Meteorol. 2021, 40, 1213–1223. (In Chinese) [Google Scholar] [CrossRef]
  21. Chtirkova, B.; Folini, D.; Ferreira Correa, L.; Wild, M. Shortwave Radiative Flux Variability Through the Lens of the Pacific Decadal Oscillation. J. Geophys. Res. Atmos. 2024, 129, e2023JD040520. [Google Scholar] [CrossRef] [Scilit]
  22. Dessler, A.E. A Determination of the Cloud Feedback from Climate Variations over the Past Decade. Science 2010, 330, 1523–1527. [Google Scholar] [CrossRef] [Scilit] [PubMed]
  23. Liu, B.; Ma, L.; Rong, X.; Su, J.; Yan, Y.; Hua, L.; Tang, Y. High-resolution model for seasonal prediction of surface shortwave radiation in China. J. Appl. Meteor. Sci. 2022, 33, 341–352. (In Chinese) [Google Scholar] [CrossRef]
  24. Correa, L.F.; Folini, D.; Chtirkova, B.; Wild, M. From Internal Variability to Aerosol Effects: Physical Mechanisms Behind Observed Decadal Trends in Surface Solar Radiation in the Western Pacific Ocean. J. Geophys. Res. Atmos. 2024, 129, e2024JD041014. [Google Scholar] [CrossRef] [Scilit]
  25. Wang, Y.; Yang, Y.; Han, S.; Wang, Q.; Zhang, J. Sunshine dimming and brightening in Chinese cities (1955-2011) was driven by air pollution rather than clouds. Clim. Res. 2013, 56, 11–20. [Google Scholar] [CrossRef] [Scilit]
  26. Stanhill, G.; Achiman, O.; Rosa, R.; Cohen, S. The cause of solar dimming and brightening at the Earth’s surface during the last half century: Evidence from measurements of sunshine duration. J. Geophys. Res. Atmos. 2014, 119, 10902–10911. [Google Scholar] [CrossRef] [Scilit]
  27. Guo, J.-P.; Zhang, X.-Y.; Wu, Y.-R.; Zhaxi, Y.; Che, H.-Z.; La, B.; Wang, W.; Li, X.-W. Spatio-temporal variation trends of satellite-based aerosol optical depth in China during 1980–2008. Atmos. Environ. 2011, 45, 6802–6811. [Google Scholar] [CrossRef] [Scilit]
  28. Wang, K.; Dickinson, R.E.; Ma, Q.; Augustine, J.A.; Wild, M. Measurement Methods Affect the Observed Global Dimming and Brightening. J. Clim. 2013, 26, 4112–4120. [Google Scholar] [CrossRef] [Scilit]
  29. Zheng, Y.; Guan, F.; Cai, Z.; Wu, R.; Liu, J. Variation of Surface Solar Radiation over the Central and East of Southern China. J. Appl. Meteorol. Sci. 2011, 22, 312–320. (In Chinese) [Google Scholar]
  30. Feng, Y.; Li, Y. Estimated spatiotemporal variability of total, direct and diffuse solar radiation across China during 1958–2016. Int. J. Climatol. 2018, 38, 4395–4404. [Google Scholar] [CrossRef] [Scilit]
  31. Wang, C.; Zhang, Z.; Tian, W. Factors affecting the surface radiation trends over China between 1960 and 2000. Atmos. Environ. 2011, 45, 2379–2385. [Google Scholar] [CrossRef] [Scilit]
  32. Lin, C.; Wu, H.; Ou, T.; Chen, D. A new perspective on solar dimming over the Tibetan Plateau. Int. J. Climatol. 2019, 39, 302–316. [Google Scholar] [CrossRef] [Scilit]
  33. Lu, L.; Li, Y.; Liang, L.; Ma, Q. Diurnal Variation in Surface Incident Solar Radiation Retrieved by CERES and Himawari-8. Remote Sens. 2024, 16, 2670. [Google Scholar] [CrossRef] [Scilit]
  34. Wang, H.; Wang, Y. Evaluation of the Accuracy and Trend Consistency of Hourly Surface Solar Radiation Datasets of ERA5, MERRA-2, SARAH-E, CERES, and Solcast over China. Remote Sens. 2025, 17, 1317. [Google Scholar] [CrossRef] [Scilit]
  35. Wen, Q.; Liu, K.; Li, Y.; Li, X.; Song, W. Climatic characteristics and meteorology-sensitivity of surface solar radiation in reanalysis products compared to observations and satellite data over China. Atmos. Environ. 2024, 334, 120713. [Google Scholar] [CrossRef] [Scilit]
  36. García Pedreros, J.G.; Lagüela López, S.; Rodríguez Martín, M. Spatial Models of Solar and Terrestrial Radiation Budgets and Machine Learning: A Review. Remote Sens. 2024, 16, 2883. [Google Scholar] [CrossRef] [Scilit]
  37. Smith, G.L.; Priestley, K.J.; Loeb, N.G.; Wielicki, B.A.; Charlock, T.P.; Minnis, P.; Doelling, D.R.; Rutan, D.A. Clouds and Earth Radiant Energy System (CERES), a review: Past, present and future. Adv. Space Res. 2011, 48, 254–263. [Google Scholar] [CrossRef] [Scilit]
  38. Dee, D.P.; Uppala, S.M.; Simmons, A.J.; Berrisford, P.; Poli, P.; Kobayashi, S.; Andrae, U.; Balmaseda, M.A.; Balsamo, G.; Bauer, P.; et al. The ERA-Interim reanalysis: Configuration and performance of the data assimilation system. Q. J. R. Meteor. Soc. 2011, 137, 553–597. [Google Scholar] [CrossRef] [Scilit]
  39. Wang, Z.; Zhang, M.; Li, H.; Wang, L.; Gong, W.; Ma, Y. Bias correction and variability attribution analysis of surface solar radiation from MERRA-2 reanalysis. Clim. Dyn. 2023, 61, 5613–5628. [Google Scholar] [CrossRef] [Scilit]
  40. Han, Y.; Ma, W.; Wang, B.; Ma, Y.; Tian, R. Climatic Characteristics of Rainfall Change over the Qinghai-Tibetan Plateau from 1980 to 2013. Plateau Meteorol. 2017, 36, 1477–1486. (In Chinese) [Google Scholar] [CrossRef]
  41. Song, Z.; Wang, B.; Zheng, H.; Jin, S.; Liu, X.; Hua, S. Gridded Assessment of Mainland China’s Solar Energy Resources Using the Typical Meteorological Year Method and China Meteorological Forcing Dataset. Atmosphere 2024, 15, 225. [Google Scholar] [CrossRef] [Scilit]
  42. Lv, J.; Zhu, C.; Ju, J.; Lin, X. Interdecadal Variability in Summer Precipitation over East China during the Past 100 Years and Its Possible Causes. Atmos. Sci. 2014, 38, 782–794. (In Chinese) [Google Scholar] [CrossRef]
  43. Duan, Y.; Yang, Q.; Ma, Z.; Wu, P.; Chen, X.; Duan, J. Disentangling the Driving Mechanisms of the Tripole Mode of Summer Rainfall over Eastern China. J. Clim. 2023, 36, 1175–1186. [Google Scholar] [CrossRef] [Scilit]
  44. Wang, K.; Ma, Q.; Li, Z.; Wang, J. Decadal variability of surface incident solar radiation over China: Observations, satellite retrievals, and reanalyses. J. Geophys. Res. Atmos. 2015, 120, 6500–6514. [Google Scholar] [CrossRef] [Scilit]
  45. Sanchez-Lorenzo, A.; Wild, M.; Brunetti, M.; Guijarro, J.A.; Hakuba, M.Z.; Calbó, J.; Mystakidis, S.; Bartok, B. Reassessment and update of long-term trends in downward surface shortwave radiation over Europe (1939–2012). J. Geophys. Res. Atmos. 2015, 120, 9555–9569. [Google Scholar] [CrossRef] [Scilit]
  46. Yang, K.; Zhang, J.Y. Evaluation of reanalysis datasets against observational soil temperature data over China. Clim. Dyn. 2018, 50, 317–337. [Google Scholar] [CrossRef] [Scilit]
  47. He, Y.; Wang, K.; Feng, F. Improvement of ERA5 over ERA-Interim in Simulating Surface Incident Solar Radiation throughout China. J. Clim. 2021, 34, 3853–3867. [Google Scholar] [CrossRef] [Scilit]
  48. Sang, X.; Tao, L.; Yang, X.-Q.; Chen, H. Interannual Variability of Summer Surface Solar Radiation over China: Role of Mid–High-Latitude Atmospheric Circulation Anomalies. J. Clim. 2025, 38, 5025–5042. [Google Scholar] [CrossRef] [Scilit]
  49. Li, S.; Xiao, Z.; Ding, H.; Li, C. Association Analysis on the Seasonal Surface Solar Radiation Anomaly in China and Major Atmospheric Circulation Indices. Clim. Environ. Res. 2022, 27, 447–457. (In Chinese) [Google Scholar] [CrossRef]
  50. Wang, Y.; Zhang, W.; Chen, Y.; Li, X. Improving Short-Range Irradiance Forecast With Assimilating FY-4B All-Sky Radiances Into a Numerical Solar Prediction Model. IEEE Trans. Geosci. Remote Sens. 2025, 63, 1–13. [Google Scholar] [CrossRef] [Scilit]
  51. Dai, Y.; Wang, Y.; Chen, Y.; Wu, J.; Chao, J. Combining meteorological and power information of station-measurement and model-prediction with the hybrid CNN-Transformer and CNN-BiLSTM for ultra-short-term photovoltaic power forecasting. Int. J. Electr. Power Energy Syst. 2025, 171, 111009. [Google Scholar] [CrossRef] [Scilit]
Figure 2. Spatial distributions of SSR averaged over 1994–2022 in China (unit: MJ/m2).
Remotesensing 18 02782 g002
Figure 3. Spatial distribution of SSR trends over 1994–2022 in China (unit: MJ/m2/decade; The upper triangles denote increasing trend, the lower triangles denote decreasing trend. The solid triangles indicate that SSR passes the 95% significance test).
Remotesensing 18 02782 g003
Figure 4. Interannual variations in SSR averaged over whole China and eight subregions in 1994–2022 (unit: MJ/m2). The solid lines represent linear trends, with relevant statistical parameters (fitting equation, R2, and p-value) shown for each region.
Remotesensing 18 02782 g004
Figure 5. Spatial distributions of SSR trends in four seasons over 1994–2022 in China (unit: MJ/m2/decade; the upper triangles denote increasing trend, the lower triangles denote decreasing trend, and the solid triangles indicate that SSR passes the 95% significance test).
Remotesensing 18 02782 g005
Figure 6. Correlation coefficients between SSR and five potential drivers across different regions: TCC or Cloud, precipitation amount (Prec), precipitation days (Pday), total column water vapor (Vapor), and AOD. The gray horizontal line indicates the critical correlation coefficient at the 95% confidence level (p < 0.05).
Remotesensing 18 02782 g006
Figure 7. Linear trends (per decade) of SSR (MJ m−2 per decade), TCC (% per decade), Prec (mm per decade), Pday (days per decade), Vapor (kg m−2 per decade), and AOD (per decade) across different regions.
Remotesensing 18 02782 g007
Figure 8. Standardized regression coefficients (Beta) between SSR and five potential drivers—TCC (Cloud), Prec, Pday, Vapor, and AOD—across China and its eight subregions (R1–R8; see Table 1) for annual (ANN) and seasonal (MAM, JJA, SON, DJF) scales. Coefficients are derived from multiple linear regression with all variables standardized to unit variance. Negative values indicate an inverse relationship; positive values indicate a direct relationship. The magnitude of each coefficient reflects the relative influence of that driver. Color shading indicates coefficient magnitude (blue for negative, red for positive; darker shades indicate larger absolute values).
Remotesensing 18 02782 g008
Figure 9. Summary of relative contributions (%) of each driver (Cloud, PRE, Pday, Vapor, AOD) to SSR variability: (a) average contribution by region across all seasons; (b) average contribution by season across all regions; (c) overall average contribution across all regions and seasons. Contributions are calculated from the standardized regression coefficients (Beta) derived from multiple linear regression (Figure 8), normalized to percentages by dividing each driver‘s absolute Beta value by the sum of the absolute Beta values of all five drivers for each region and season.
Remotesensing 18 02782 g009
Table 2. Trends of annual and seasonal SSR in China and eight subregions over 1994–2022 (unit: MJ/m2/decade).
SeasonChinaNorthwest ChinaNorth ChinaNortheast ChinaTibetan PlateauCentral ChinaEast ChinaSouthwest ChinaSouth China
Annual72 **28160 **59−86 *121 *58142 **138 **
Spring302157 **29−14313838 *39 **
Summer23950 **3−16371261 **44 *
Autumn4−726 **0−40 **26−325 +17
Winter14 +427 **27 *−21 **27824 +35
Note: ** indicates significance at the 99% confidence level (p < 0.01); * at the 95% confidence level (p < 0.05); and + at the 90% confidence level (p < 0.1). Bold numbers indicate all trends with p < 0.05. Unmarked trends have p ≥ 0.1.
Disclaimer/Publisher’s Note: The statements, opinions and data contained in all publications are solely those of the individual author(s) and contributor(s) and not of MDPI and/or the editor(s). MDPI and/or the editor(s) disclaim responsibility for any injury to people or property resulting from any ideas, methods, instructions or products referred to in the content.