Article

Red-Edge Vegetation Index Optimization Within Phenological Windows for Discriminating Rice from Artificial Grassland: A Case Study in Jurong, China


Nanjing Center of Geological Survey, China Geological Survey, Nanjing 210016, China
*
Author to whom correspondence should be addressed.
Remote Sens. 2026, 18(16), 2653; https://doi.org/10.3390/rs18162653
Submission received: 30 June 2026 / Revised: 3 August 2026 / Accepted: 4 August 2026 / Published: 7 August 2026

Highlights

What are the main findings?
  • Red-edge vegetation indices (NDRE, CIre) achieved substantially higher Fisher ratios than NDVI across phenological stages, optimized within the heading–flowering window, revealing a bimodal temporal pattern driven by tillering-stage canopy closure and heading-stage chlorophyll translocation.
  • UAV-derived VI–window classification thresholds transferred to Sentinel-2 retained 79.5% rice user accuracy with less than one pixel of boundary deviation.
What are the implications of the main findings?
  • The VI–window optimization framework links vegetation index selection directly to crop phenology, making classification decisions traceable to specific growth-stage physiology.
  • The approach uses only widely available multispectral bands (Sentinel-2, consumer UAV), showing potential for agricultural subsidy verification. It does not require hyperspectral sensors or extensive training data, though multi-year and multi-site testing remain necessary before operational use.

Abstract

Accurate discrimination between rice and artificial grassland remains challenging in regional agricultural monitoring because both herbaceous types share similar spectral signatures during vegetative growth, and existing land-cover products do not treat artificial grassland as a separate class. Using Jurong City, Jiangsu Province, as the study area, we propose a framework that optimizes red-edge vegetation index selection within crop-specific phenological windows to separate rice from grassland. Using Unmanned Aerial Vehicle (UAV) multispectral imagery and Sentinel-2 satellite data, we quantified spectral separability across eight phenological stages using Fisher ratios. We identified two optimal discrimination windows: early tillering (mid-June) and heading–flowering (early September). Within the heading–flowering window, a dual-index classification rule combining Normalized Difference Red-Edge Index (NDRE) and Green Normalized Difference Vegetation Index (GNDVI) was transferred from UAV to Sentinel-2 and used to produce a 10 m rice–grassland map for the entire city. Spatial agreement with two publicly available rice datasets reached 75.2% and 79.5% for rice pixels, reflecting differences in spatial resolution, reference year, and class definition rather than classification error. Independent field validation using 200 samples yielded an overall accuracy of 92.50% (F1-score = 0.93), confirming the effectiveness of the VI–window optimization strategy. The framework offers an interpretable, physiology-driven alternative for crop-type mapping that relies solely on widely available multispectral bands.

1. Introduction

Paddy rice (Oryza sativa L.) is a staple crop for more than 60% of China’s population, and accurate knowledge of its spatial distribution underpins both national food security and rural livelihoods [1]. Meanwhile, the area of artificial grasslands, such as turfgrass, has expanded continuously with ongoing urbanization [2]. In the Yangtze River Delta, turfgrass cultivation has evolved into a specialized industry supplying sod for urban landscaping, sports facilities, and ecological restoration [3]. Areas such as Houbai Town in Jurong have become nationally recognized turfgrass production bases, earning the region the title ‘Home of Turf’ [4]. Under cultivation practices such as paddy-to-turf conversion, rice paddies and turfgrass fields are distributed in a patchy, interlaced pattern, forming a typical rice–turfgrass mosaic agricultural landscape [5]. Precise identification of the spatial distribution of paddy rice and grasslands is of great significance for food security assessment, agricultural structure optimization, and the formulation of ecological compensation policies [6,7]. Owing to its capability for large-scale and periodic observations, satellite remote sensing has become an essential tool for land-use and land-cover classification and has demonstrated considerable effectiveness in generating agricultural land-cover datasets over extensive spatial regions [8,9,10]. Despite these advances, none of the widely used land cover products, such as GlobeLand30, FROM-GLC, and ESACCI-LC, currently treat artificial grassland as a separate class [11,12,13]. Rice and grassland pixels are either merged into a single “cropland” or “herbaceous vegetation” category, leaving the rice–grassland confusion unaddressed and unquantified in operational monitoring.
Both grasslands and paddy rice are herbaceous vegetation types and exhibit similar canopy spectral responses in the visible and near-infrared (VNIR) bands [14]. During the vegetative growth stage, rice exhibits a high leaf area index and strong near-infrared reflectance, leading to substantial spectral overlap with artificial grasslands maintained under frequent mowing and persistent vegetative growth conditions [15]. Consequently, the two land-cover types display highly similar spectral characteristics, particularly in terms of greenness and near-infrared reflectance, making them difficult to distinguish using traditional single-temporal remote sensing classification methods [16]. Nevertheless, spectral differences that emerge during key phenological stages of rice, such as peak tillering and heading–flowering, provide opportunities for discrimination using multi-temporal remote sensing data [17]. The optimal feature combinations and classification windows still need to be quantitatively determined through spectral separability analysis [18]. The Sentinel-2 satellite, with its 10 m spatial resolution, 5-day revisit cycle, and unique red-edge bands, has been widely applied in crop classification and phenological monitoring [19]. Existing studies have primarily relied on the empirical selection of commonly used vegetation indices, such as the Normalized Difference Vegetation Index (NDVI) and the Enhanced Vegetation Index (EVI), or on automatic feature selection through machine learning approaches [20,21]. Yet, insufficient attention has been paid to the temporal dynamics of feature separability across different phenological stages, thereby limiting classification performance during critical phenological stages [22,23].
Multi-temporal and phenology-based approaches have substantially improved rice mapping accuracy at regional to national scales over the past decade, with Sentinel-1/2 data enabling 10 m resolution rice maps across China [24]. However, these studies predominantly focus on separating rice from other crops (e.g., wheat, maize) or from natural vegetation, and the specific challenge of discriminating rice from intensively managed artificial grassland has not been explicitly addressed. Similarly, remote sensing of grassland has primarily targeted natural grassland degradation, biomass estimation, and grazing intensity, with minimal attention to cultivated turfgrass as a distinct land-cover class that requires separation from cropland [25].
Although Unmanned Aerial Vehicle (UAV) multispectral imagery is constrained by relatively limited spatial coverage, it provides very high spatial resolution and flexible data acquisition capabilities, making it particularly suitable for detailed analyses of spectral characteristics at fine spatial scales [26]. A representative area in Jurong City, characterized by a highly intermixed distribution of paddy rice and artificial grasslands, was selected as the study site. Specifically, this study aims to (i) identify the optimal vegetation index–phenological window combinations that maximize spectral separability between rice and artificial grassland using UAV multispectral imagery, and (ii) evaluate whether UAV-derived classification thresholds can be adapted to Sentinel-2 imagery for accurate regional-scale rice–grassland mapping. The framework was demonstrated in Jurong City, Jiangsu Province, and validated against independent field samples.

2. Materials and Methods

2.1. Overview of the Study Area

Jurong City (31°37′–32°12′N, 118°57′–119°22′E) is located in southwestern Jiangsu Province, on the southern bank of the lower reaches of the Yangtze River. It is under the administration of Zhenjiang City, bordered by the Dantu District of Zhenjiang to the east, the Jiangning and Lishui Districts of Nanjing to the west, the Yangtze River to the north, and Maoshan Mountain to the south [27]. The region lies at the junction of the Ningzhen Mountains and the Maoshan Hills, with low-lying topography in the northwest and undulating terrain in the southeast, resulting in an interspersed distribution of plains, ridges, and low mountains [28]. Mean annual temperature is approximately 15.2 °C, annual precipitation ranges from 1050 to 1100 mm, and the frost-free period lasts about 230 days. The coincidence of rainfall and high temperatures ensures favorable light, heat, and water conditions, providing an excellent natural foundation for the high-yield cultivation of thermophilic crops such as rice [29]. Irrigation water is abundant, and the dominant cropping system is double cropping (rice–wheat or rice–oilseed rotation), making Jurong one of Jiangsu Province’s key commercial grain production bases. An overview of the study area and the distribution of sample plots is shown in Figure 1.
In this study, ‘artificial grassland’ refers to cultivated turfgrass fields in Jurong City, which are dominated by warm-season species: Cynodon dactylon hybrids (Bermuda grass), Zoysia japonica (Japanese lawngrass), and Zoysia matrella (Manila grass) [4]. The total turfgrass cultivation area in Houbai Town exceeded 1470 ha as of 2020, and fields are maintained as either soil-based or sand-based sods under regular mowing and irrigation, although management intensity varies among growers [4]. Bare-soil fields and recently harvested turf plots were excluded from the training dataset.

2.2. Data Sources

2.2.1. UAV Data Acquisition and Sample Construction

Multispectral imagery was acquired using a DJI Mavic 3 Multispectral (DJI M3M; DJI, Shenzhen, China) unmanned aerial vehicle equipped with four spectral bands: Green (560 nm), Red (650 nm), Red-Edge (730 nm), and Near-Infrared (860 nm) [30]. During image acquisition, the exposure mode was set to AUTO, focus mode to AFS, AE lock was activated, and EV compensation was maintained at 0. The flight altitude was 100 m, with forward and side overlap ratios of 75% and 80%, respectively. All flights were conducted under clear, cloudless skies, and the same flight parameters were applied across different dates. To avoid the formation of alternating bright and dark stripes, the flight direction was kept perpendicular to the solar azimuth. Simultaneously, multispectral images of a calibration panel were acquired. The acquired imagery was imported into DJI Terra for mosaicking. Radiometric calibration was performed using three standard reflectance panels with nominal reflectance of 25%, 50%, and 75%, which were imaged under the same illumination conditions immediately before each flight. For each band, an empirical line was fitted between the digital number (DN) values of the panel pixels and their known reflectance values, and the resulting linear model was applied pixel-wise to convert all UAV imagery from DN to surface reflectance.
UAV multispectral imagery was acquired across eight dates spanning the full 2025 rice growing season, from early tillering (16 June) to post-harvest (6 December). Flight parameters and image quality metrics for each acquisition are summarized in Table 1.
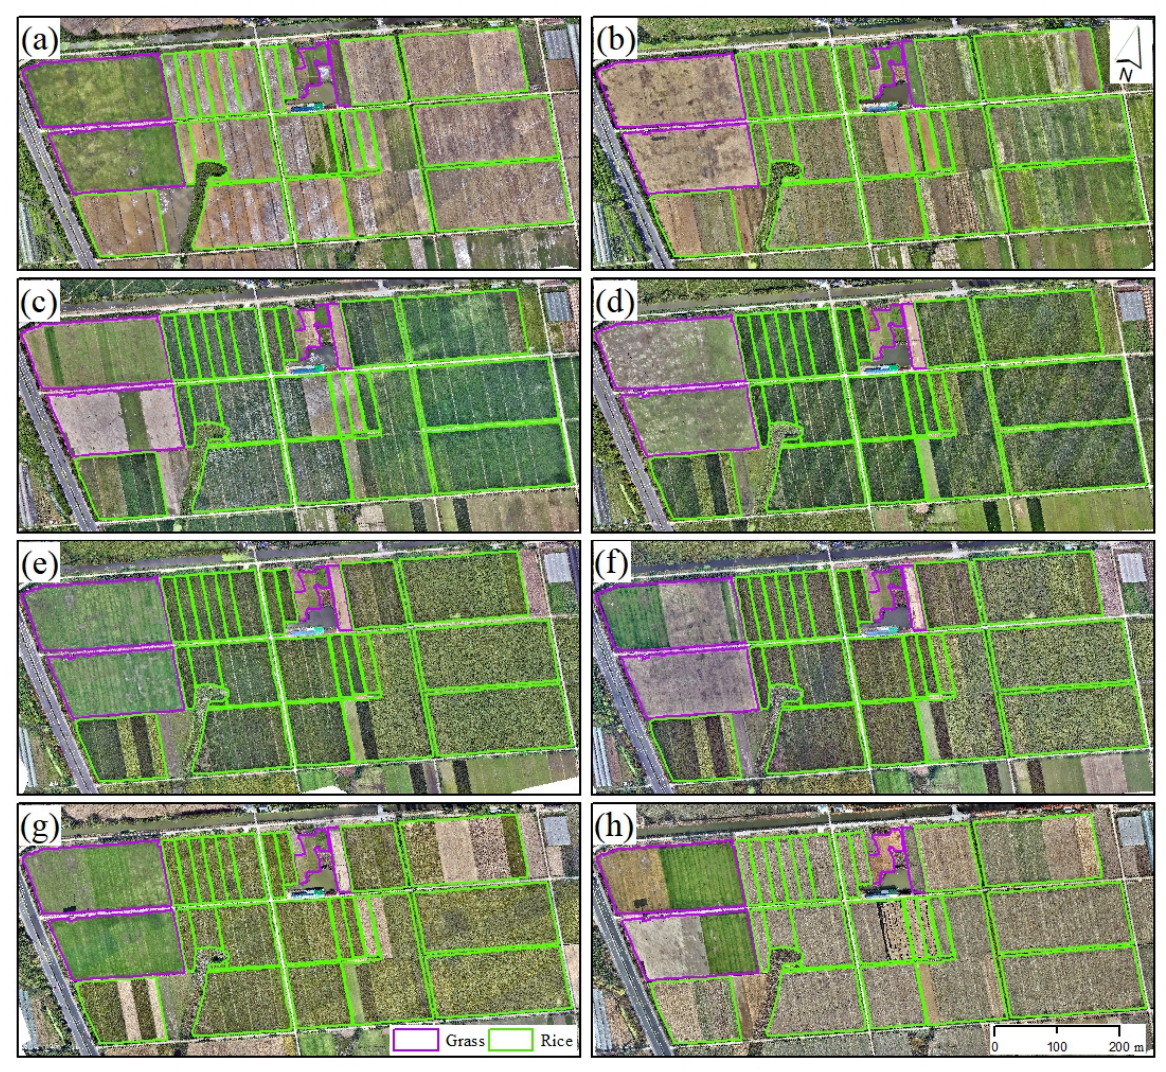
Figure 2 illustrates the time-series UAV multispectral imagery (RGB composite) of Zone I obtained during the 2025 rice growing season, overlaid with manually interpreted vector boundaries of rice and grassland derived from high-resolution imagery. On 16 June, before rice transplanting, the paddy fields were bare and appeared greyish-brown, while the cultivated grassland maintained complete green cover, resulting in a pronounced spectral contrast between the two land-cover types. On 5 July, following the removal of turfgrass, the grassland area became exposed and appeared greyish-yellow; rice had been planted and reached the early jointing stage, with fields displaying light green tones, allowing clear separation from the bare ground. By 28 July, rice entered the booting stage with a dense canopy, exhibiting a deep green color. The grassland area either had regrown vegetation or remained bare, creating a strong visual and spectral contrast with the rice paddies. On 4 September, during the heading–flowering stage, the rice canopy showed a mixture of yellow and green, while the grassland had fully regreened, re-establishing marked spectral differences between the two types. From 26 September to 7 October, rice progressed to the grain-filling and early maturity stages, with the canopy gradually yellowing and its spectral distinction from grassland diminishing. On 24 October, the rice was fully mature, appearing golden yellow, whereas the grassland remained green. By 6 December, after rice harvest, the paddies became bare or stubble-covered; the managed grassland, however, retained green cover through maintenance, maintaining distinct spectral characteristics from the rice paddies. The temporal comparison demonstrates that the optimal period for discriminating rice from grassland is concentrated from mid-July to mid-September (i.e., from the booting stage to the heading–flowering stage). This finding provides a direct phenological basis for selecting Sentinel-2 image time windows in subsequent analyses.

2.2.2. Satellite Data

The Sentinel-2 mission comprises two satellites, Sentinel-2A and Sentinel-2B, which were successfully launched on 22 June 2015 and 7 March 2017, respectively [31]. These satellites provide a maximum spatial resolution of 10 m and a short revisit cycle of approximately 5 days, enabling high-frequency Earth observation. Sentinel-2 Level-2A Harmonized surface reflectance products (collection ID: COPERNICUS/S2_SR_HARMONIZED) covering Jurong City during the 2025 rice growing season were accessed through the Google Earth Engine (GEE; Google LLC, Mountain View, CA, USA) platform. Images with less than 20% cloud cover were selected, and cloud and cirrus pixels were masked using the QA60 band. A median composite was then generated for each phenological window to minimize residual atmospheric and angular effects.
For the heading–flowering window (1 August to 20 September 2025), Normalized Difference Red-Edge Index (NDRE) was calculated as (B8 − B6)/(B8 + B6), where B8 is the NIR band (842 nm), and B6 is the red-edge 2 band (740 nm). Green Normalized Difference Vegetation Index (GNDVI) was calculated as (B8 − B3)/(B8 + B3), where B3 is the green band (560 nm). Sentinel-2 B6 has a native resolution of 20 m and was resampled to 10 m using nearest-neighbor interpolation within GEE to match the resolution of the 10 m bands. Rice pixels were identified using a dual-threshold rule: NDRE ≥ 0.2707 and GNDVI ≥ 0.6883. These thresholds were derived from UAV-based ROC–Youden analysis (Section 2.3.2) and transferred directly to Sentinel-2. Both NDRE and GNDVI are normalized ratio indices, which reduce sensitivity to systematic differences in illumination and sensor gain between platforms. The 10 nm offset between the DJI M3M red-edge band (730 nm) and Sentinel-2 B6 (740 nm) and its potential effect on NDRE values are discussed in Section 4.2.

2.2.3. Comparison with Existing Rice Datasets

To quantitatively assess the accuracy of the rice identification results in this study, the 10 m single-cropping rice distribution map by Shen et al. (2023) and the 30 m China Crop Dataset (CCD) by Fu et al. (2025) were selected as validation references [32,33]. The former combines Sentinel-1/2 data with temporal matching, whilst the latter is based on Landsat time series and machine learning classification; both achieve an overall accuracy of over 85% and reliably reflect the spatial distribution patterns of single-season rice in Jurong City.
When the grassland/rice binary classification results generated in this study were validated against two publicly available single-season rice datasets (CCD and Shen et al.), the latter only provide the spatial distribution of rice and do not include a grassland class. Therefore, all three datasets were uniformly converted into a “rice/non-rice” binary raster. In the resulting confusion matrix, the grassland and other non-rice land-cover types identified by this study were grouped into the “non-rice” category, with the primary focus on evaluating the accuracy of rice identification (producer accuracy, user accuracy) and the rate at which grassland is misclassified as rice (indirectly reflected by the “non-rice” user accuracy). Given that Jurong City is predominantly covered by rice paddies and cultivated grassland, while urban areas, water bodies, and forest land account for extremely low proportions, and considering that these non-vegetated land-cover types are mostly masked as no-data under the grassland spectral thresholds adopted in this study and thus excluded from the statistics, the “non-rice” pixels consist primarily of cultivated grassland. As a result, the accuracy of this class can largely characterize the degree of separation between grassland and rice.

2.2.4. Independent Field Validation

To directly evaluate classification accuracy, 200 independent validation points were established, comprising 100 grassland points and 100 rice points. Point locations were selected using stratified random sampling within the study area, restricted to townships outside the three UAV acquisition zones (Zones I–III), ensuring spatial independence from the data used for threshold development. Ground truth labels were assigned through visual interpretation of UAV orthophotos acquired during an independent field survey in October 2025, supplemented by high-resolution historical imagery from Google Earth (accessed on 15 October 2025). These validation orthophotos were acquired separately and did not overlap with the UAV imagery used for spectral feature extraction and threshold determination. Producer accuracy, user accuracy, overall accuracy, and the F1-score were calculated from the resulting confusion matrix.

2.2.5. Data Processing Environment

UAV image mosaicking and radiometric calibration were performed using DJI Terra (v5.1.1; DJI, Shenzhen, China). All subsequent spectral feature extraction and statistical analyses, including Fisher ratio calculation, linear discriminant analysis (LDA), and Receiver Operating Characteristic (ROC) analysis, were conducted in Python 3.13 using the scikit-learn (v1.7.1), NumPy (v2.2.6), and pandas (v2.3.1) libraries. Sentinel-2 data were accessed and processed using the Google Earth Engine (GEE) JavaScript API. All figures were generated using Matplotlib (v3.10.5) and ArcMap (v10.8; Esri, Redlands, CA, USA).

2.3. Methods

2.3.1. Feature Construction

In addition to the four original spectral bands (Green, Red, Red-Edge, NIR) provided by the DJI M3M multispectral drone, 23 spectral features were derived to comprehensively evaluate their capacity for distinguishing grassland from rice. These features encompass widely used vegetation indices and band ratios, primarily including the following:
Basic indices: NDVI, NDRE, GNDVI.
Ratio indices: Simple ratio of NIR to each band (SR_NIR/Red, SR_NIR/RE, SR_NIR/G), Red/Green ratio, and Red-Edge/Green ratio.
Advanced indices: Enhanced Vegetation Index 2 (EVI2), Soil-Adjusted Vegetation Index (SAVI), Near-Infrared Vegetation Index (NIRv), Modified Chlorophyll Absorption Ratio Index (MCARI), Transformed Chlorophyll Absorption Ratio Index (TCARI), Optimized Soil-Adjusted Vegetation Index (OSAVI), Chlorophyll Absorption Ratio Index (CCII), Chlorophyll Vegetation Index (CVI), Green Chlorophyll Vegetation Index (GCVI), and Red-Edge Chlorophyll Index (CIre).
A small constant (ε = 1 × 10⁻¹⁰) was added in all index calculations to prevent division by zero.

2.3.2. Feature Separability Analysis

To quantitatively assess the potential of each spectral feature to distinguish grassland from rice independently, this study introduced the Fisher ratio (FR) as a univariate discriminability criterion [34]. For any feature x, the Fisher ratio is defined as the ratio of the inter-class dispersion of the two sample classes to the total intra-class dispersion:
R = ( μ 0 μ 1 ) 2 σ 0 2 + σ 1 2
Here, μ and σ represent the class mean and within-class variance, respectively. A higher Fisher ratio indicates that the feature has a stronger discriminatory power between the two classes.
In addition to feature-by-feature evaluation, this study further employed Linear Discriminant Analysis (LDA) to examine the overall separability of the original multispectral band combinations [35]. Using the four raw bands of the UAV imagery (green, red, red edge, and near-infrared) to form the input vector, LDA seeks the optimal projection direction vector w by maximizing the generalized Rayleigh quotient of the inter-class and intra-class variances of the projected samples.
J ( w ) = w T S b w w T S w w
Here, S b is the inter-class dispersion matrix and S w is the total intra-class dispersion matrix. After determining the projection vector that maximizes J ( w ) , all samples are projected onto a one-dimensional score y = w T x , and the Fisher ratio of the projected score y is calculated for the two classes of grassland and rice paddies. This ratio comprehensively reflects the limit of separability following the optimal linear combination of the four spectral bands. It serves as a benchmark for comparing the performance of individual vegetation indices.
Bootstrap 95% confidence intervals (1000 stratified resamples by land-cover class) were computed for all Fisher ratios and accuracy metrics to quantify sampling uncertainty.

2.3.3. Temporal Dynamics Assessment

To analyze temporal variations in the spectral separability of grassland and rice as the growing season progresses and to identify the optimal remote sensing identification window, this study conducted a stratified analysis of all UAV multispectral grid samples by collection date. Based on field phenological records and image quality, the dates included in the assessment covered eight time points: 16 June 2025 (early tillering of rice), 5 July (early jointing), 28 July (booting stage), 4 September (heading–flowering stage), 26 September (grain filling stage), 7 October (ripening stage), 24 October (maturity and harvest stage), and 6 December (post-harvest winter fallow), fully covering the key stages of rice growth from vegetative to reproductive growth through to maturity and post-harvest. The Fisher ratios of all 23 spectral features constructed in Section 2.3.1 were calculated to form a ‘feature × date’ discriminability matrix; using the raw four-band data for each date as input, an LDA model was trained, and the Fisher ratios of the projected scores were calculated. By comparing fluctuations in the Fisher ratios (FR) of individual features and LDA combinations over time, the phenological stages corresponding to peaks of discriminability can be identified, thereby determining the optimal single-phase recognition window. Concurrently, analyzing the amplitude of FR changes for the same feature across different periods revealed its sensitivity to spectral changes during crop developmental stages, providing a basis for multi-phase joint classification strategies.

3. Results

3.1. Temporal Dynamics of Feature Separability

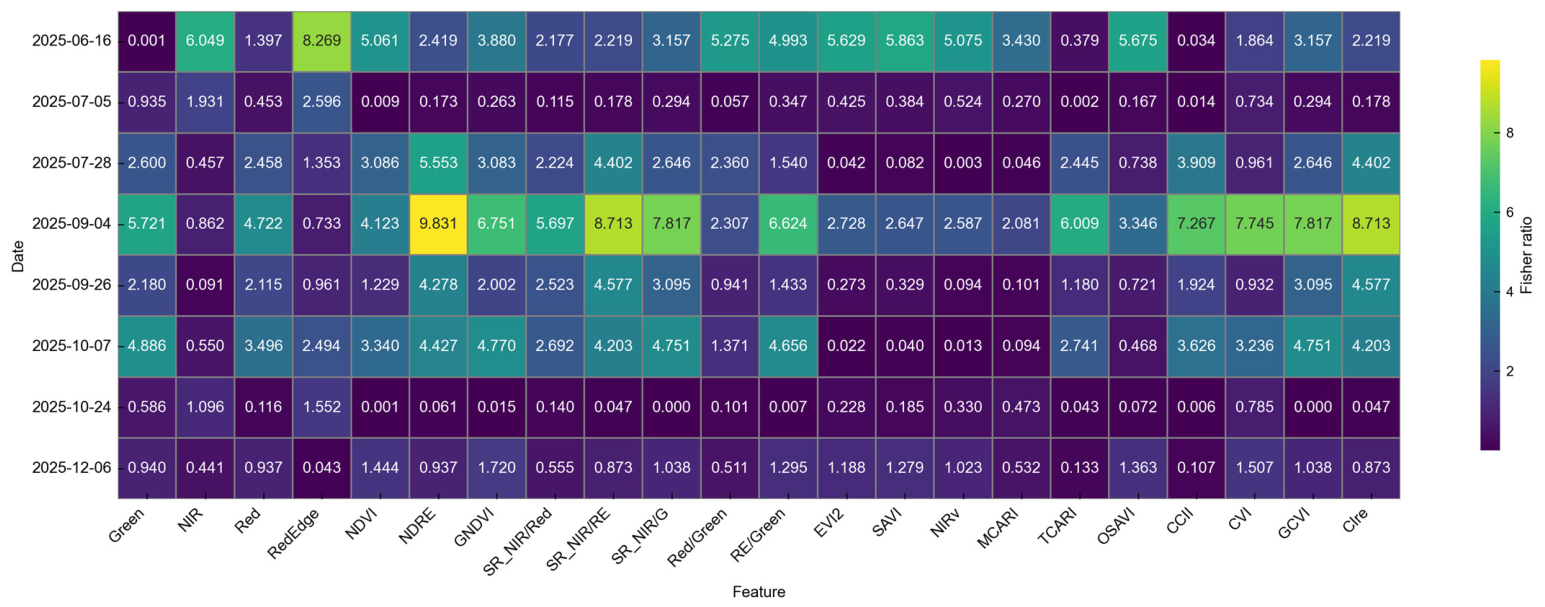
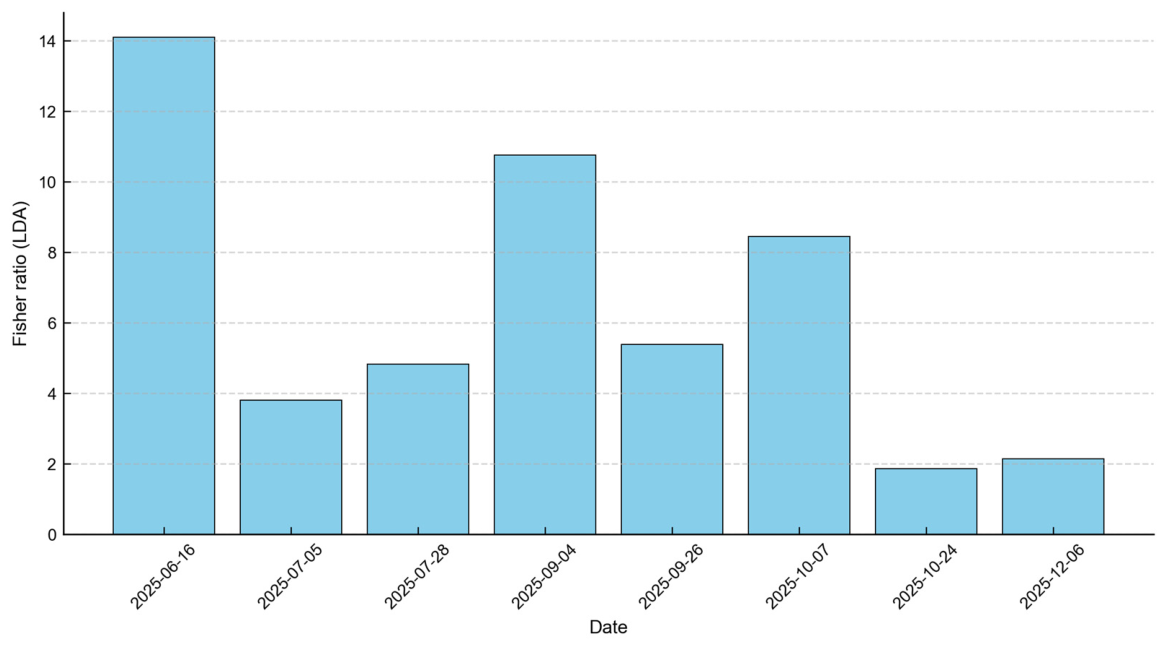
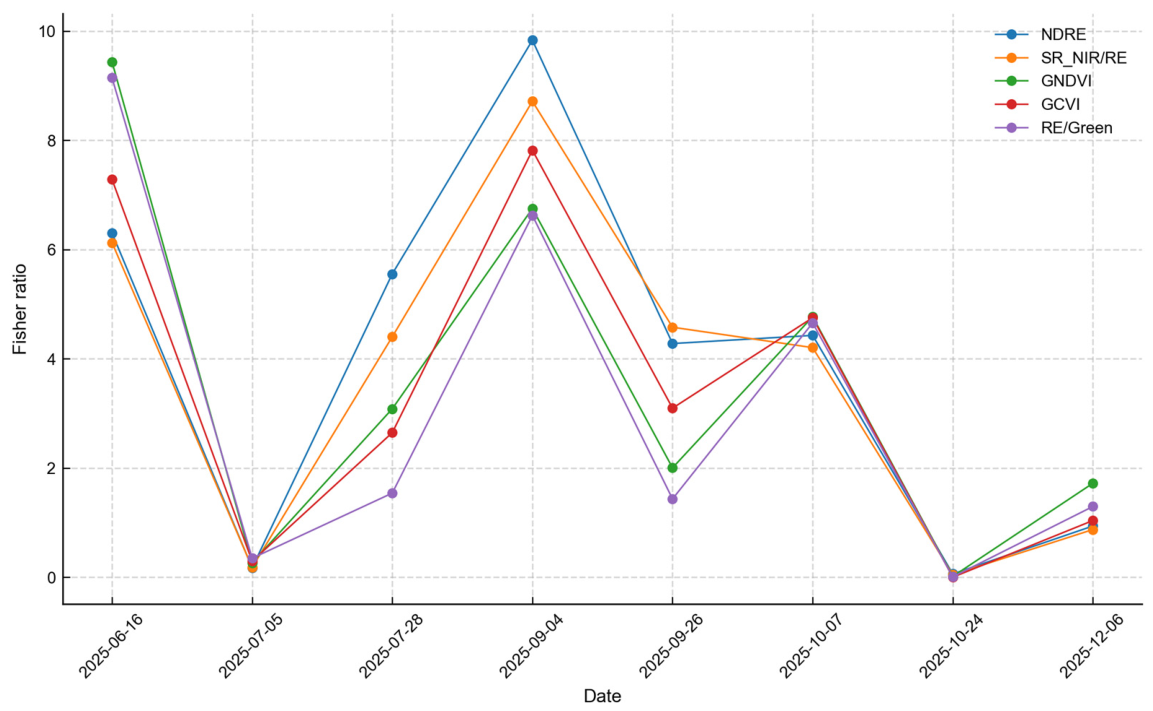
To investigate the patterns of spectral separability between grassland and rice across the growth stages, this study calculated the Fisher ratios for all features (raw bands and vegetation indices) on different dates and presented the heatmap of Fisher ratios for all spectral features across eight phenological stages (Figure 3) and a bar chart of the Fisher ratios for the LDA combination (Figure 4). The time series of the top five optimal features (Figure 5) further revealed the temporal trends in discriminatory power across the entire time period.

3.1.1. Temporal Variation in Optimal Features

Based on the temporal variations in the Fisher ratio across different growth stages (Figure 3), the spectral separability between grassland and rice exhibited pronounced seasonal fluctuations throughout the growing season. During the early tillering stage (16 June) and the heading–flowering stage (4 September), most vegetation indices demonstrated exceptionally strong discriminatory power, with the Fisher ratio of the Red-Edge band reaching 8.27 on 16 June and that of the red-edge-derived index NDRE reaching 9.83 (95% CI: 9.47–10.30) on 4 September, both far exceeding the values of other features during the same periods. In contrast, during the early jointing stage (5 July) and late maturity (24 October), the Fisher ratios of all features fell below 1.0, and that of NDVI approached zero, indicating severe spectral confusion between the two land-cover types during these periods and rendering them almost indistinguishable.
Regarding feature performance, red-edge-related indices (NDRE, CIre, SR_NIR/RE) consistently outperformed conventional visible–near-infrared indices such as NDVI and SAVI throughout the growing season. For instance, on 28 July, the Fisher ratio of NDRE (5.55) was 1.8 times that of NDVI (3.09); on 4 September, NDRE (9.83) was approximately 138% higher than NDVI (4.12). In addition, green-band vegetation indices (GCVI, GNDVI) also exhibited high discriminatory power in early September, with Fisher ratios of 7.82 (95% CI: 7.57–8.14) and 6.75 (95% CI: 6.59–6.94), respectively, thus complementing the red-edge indices.

3.1.2. Overall Separability of LDA Combination

The temporal dynamics of the LDA-derived Fisher ratio (Figure 4) revealed that the optimal linear combination of the four original bands (Green, NIR, Red, Red-Edge) constructed via linear discriminant analysis exhibited pronounced variation across the rice growing season, and its overall discriminatory power substantially exceeded that of any individual vegetation index. The LDA Fisher ratio peaked at 14.10 (95% CI: 12.73–15.70) during the early tillering stage (16 June), dropped sharply to 3.80 at the early jointing stage (5 July), rose again to 10.76 (95% CI: 10.28–11.29) at the heading–flowering stage (4 September)—thus displaying a distinct bimodal pattern—and fell to a minimum of 1.86 at the late maturity stage (24 October) before a slight recovery. These fluctuations clearly demonstrated that the separability between grassland and rice achieved by the LDA composite feature was highly dependent on rice phenology.
The lowest LDA Fisher ratio (1.86 on 24 October) remained higher than the Fisher ratios of virtually all single vegetation indices on that date (all < 1.0), demonstrating that multi-band linear combinations retained greater discriminatory power than any single index even during periods of spectral confusion.

3.1.3. Feature Specificity Revealed by Heatmap

The heatmap showed that certain indices (such as NDVI and Red/Green) generally exhibited low Fisher ratios (<2) throughout the growing season, whereas red-edge-related indices (NDRE, CIre, SR_NIR/RE) performed particularly well during key phenological stages (16 June and 4 September). Furthermore, on 28 July, some indices (such as CIre and SR_NIR/RE) showed a slight increase with a Fisher ratio of approximately 4.6.

3.2. Classification Threshold Determination

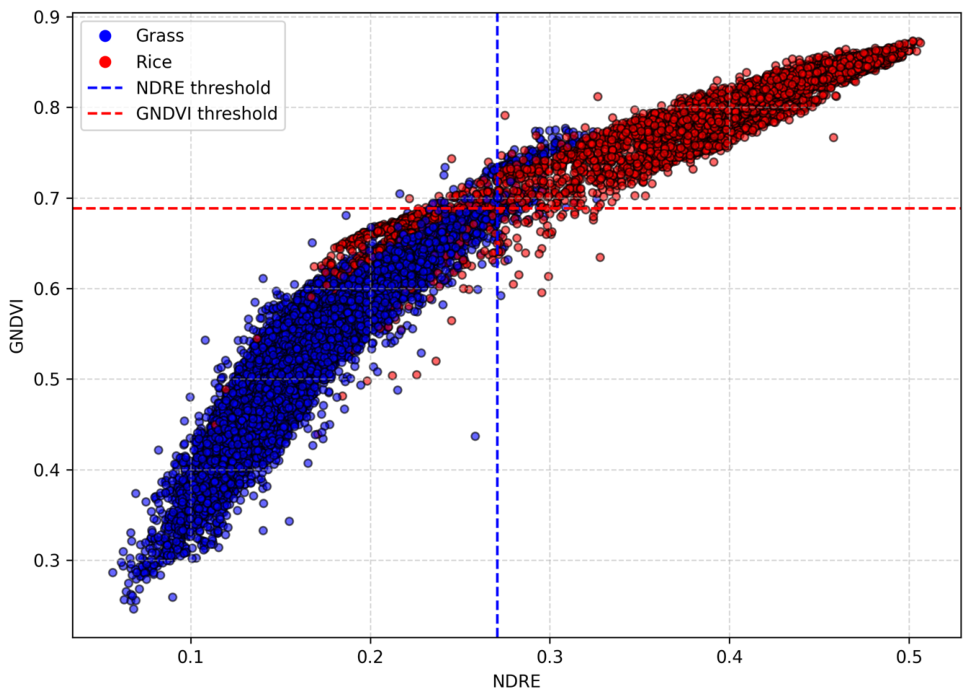
Among the 23 spectral features evaluated, NDRE and GNDVI achieved the highest Fisher ratios for discriminating rice from grassland, and the rice heading–flowering stage (early September) was identified as the optimal window. The ROC–Youden analysis (Figure 6) yielded an AUC of 0.989 for NDRE and 0.993 for GNDVI, with optimal thresholds of 0.2707 and 0.6883, respectively. A pixel was classified as rice if NDRE ≥ 0.2707 and GNDVI ≥ 0.6883, and as grassland otherwise. This dual-threshold rule achieved an overall accuracy of 97.2% on the validation samples.

3.3. Sentinel-2 Based Extraction

3.3.1. Spatial Distribution Pattern of Rice and Grassland

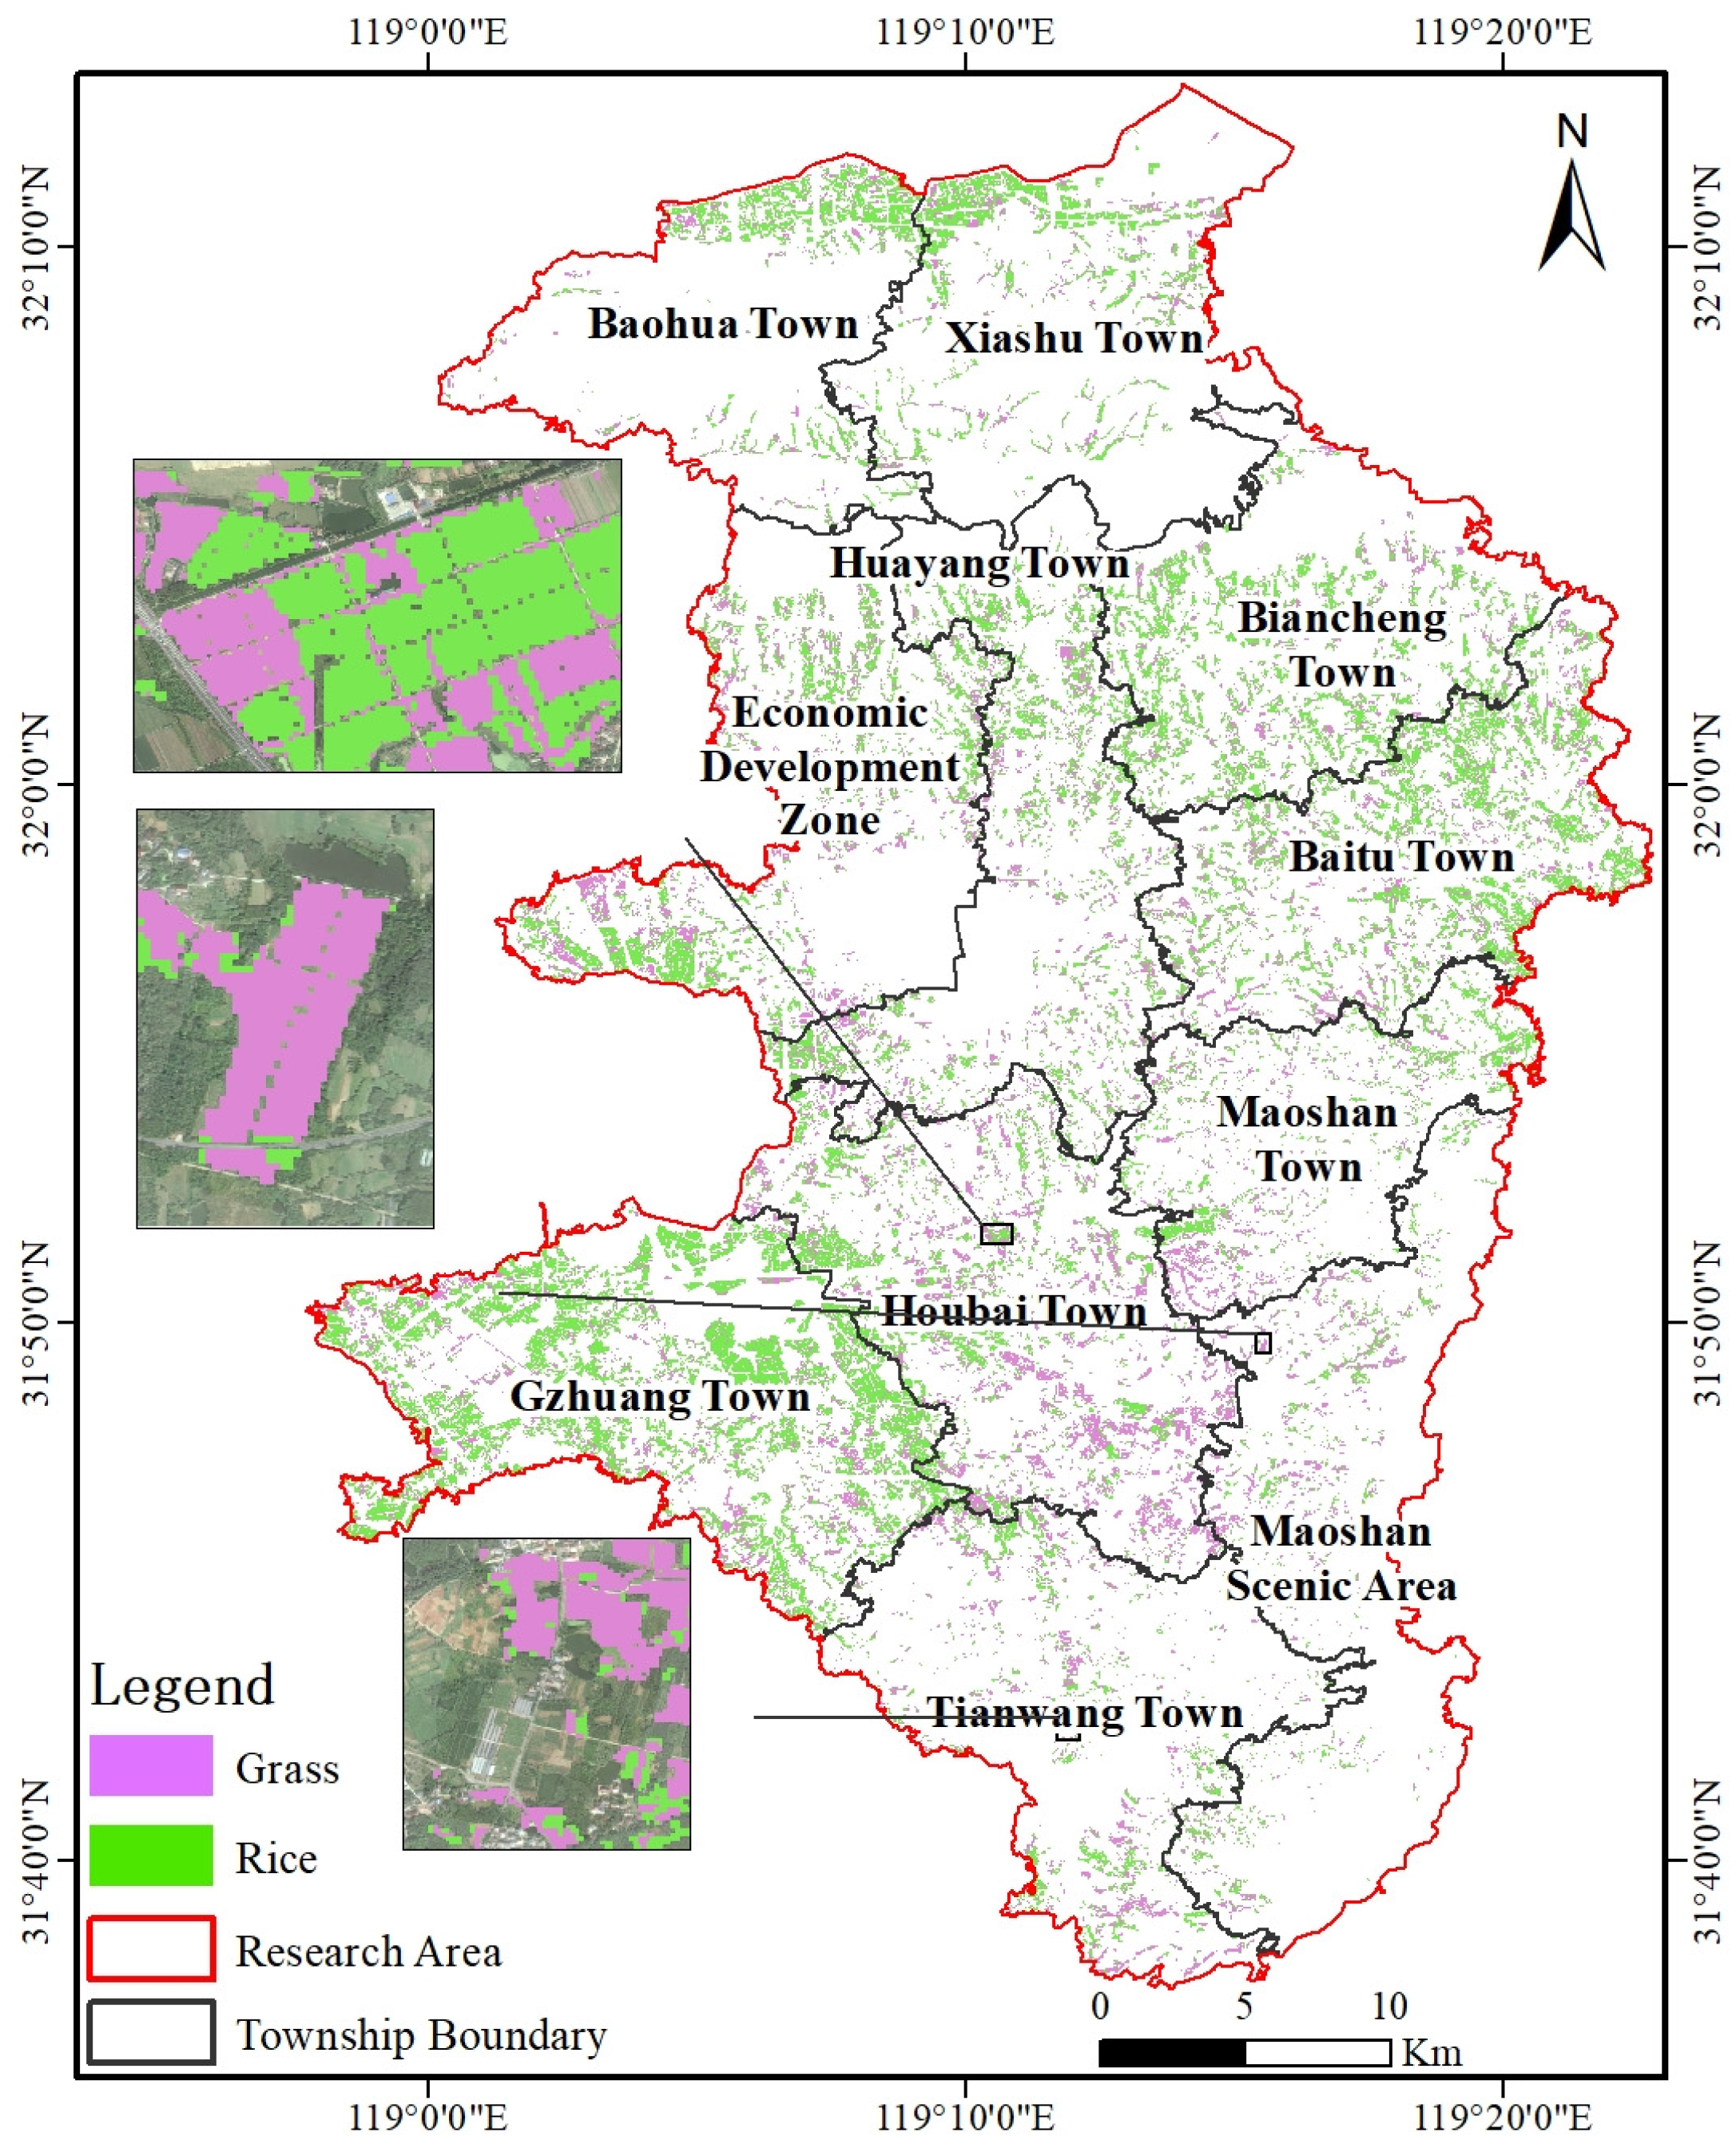
The dual-threshold classification rule was applied to Sentinel-2 imagery to produce a 10 m resolution rice distribution map for the entire Jurong City area (Figure 7).
The classification results indicated that rice cultivation in Jurong City exhibited a spatial distribution pattern characterized by ‘contiguous, concentrated areas on the north-western riverine plains and patchy, interspersed plots on the south-eastern hilly and upland terrain’. The riverine polders and the water network areas along the Jurong River and Qinhuai River constituted the core rice-growing zones, characterized by regular plots and high concentration, with clear boundaries formed by rivers, canals and settlements. In contrast, in the low-mountain and hilly areas of the south-east, due to terrain fragmentation, rice fields were mostly distributed in strip-like patterns along valleys and interspersed with artificial grassland. In the core areas of ‘grassland towns’ such as Houbai and Maoshan, the mosaic pattern of rice paddies and artificial grasslands was particularly characteristic, manifested as small rice paddies surrounded by large grassland patches, or as grasslands and rice paddies alternating randomly in proximity.

3.3.2. Accuracy Validation and Comparative Analysis

The following pixel-by-pixel comparison with CCD and Shen et al. datasets evaluates spatial agreement rather than classification accuracy. Differences arise from mismatches in spatial resolution, reference year, and class definition and should not be interpreted as direct classification error.
  • Validation against public datasets
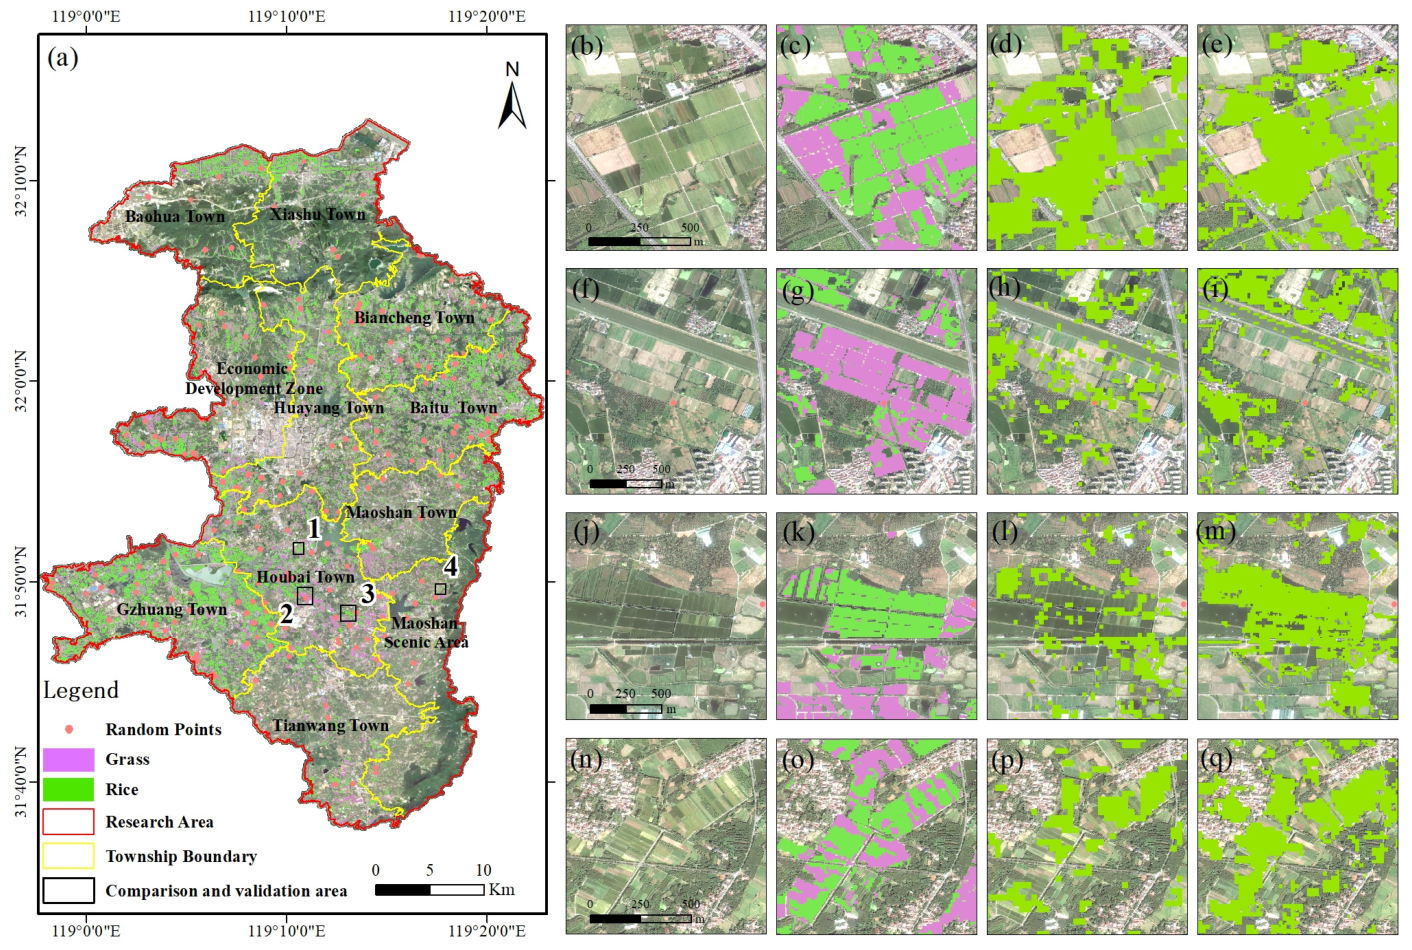
Figure 8 presents detailed validation results for four typical sub-areas (1–4) in this study (Figure 8b–q). These sub-areas were selected to represent four landscape types: contiguous rice-growing areas; pure grassland areas; areas with small, scattered paddy patches; and rice–grassland mosaic areas, thereby enabling a comprehensive assessment of classification performance under different landscape contexts.
In Figure 8b–e (Region 1), we compared satellite imagery, our Sentinel-2 classification results, the CCD (2024) product, and the Shen et al. (2025) [32] product. The results showed that our method achieved the best spatial continuity in contiguous rice areas, closely matching the paddy boundaries in high-resolution imagery. Due to its coarse 30 m resolution, the CCD product demonstrated significant mixed-pixel effects, which led to irregular rice field boundaries and the omission of smaller patches. Although the Shen et al. product also had a 10 m resolution, it showed considerable commission errors (grassland misclassified as rice) in the same region. Region 2 demonstrated the effective control of our method in non-rice areas, with very few pixels misclassified as rice. In contrast, both the CCD and Shen products exhibited some degree of misclassification in this region. In Region 3 (small-patch dispersed area), our method still identified most small rice fields. At the same time, the CCD product showed substantial omission errors and the Shen et al. product exhibited misclassifications along patch edges. Region 4 further validated the robustness of our dual-threshold rule: in most rice–grassland transition zones, our classification aligned well with the actual ground boundaries, whereas both the CCD and Shen et al. products showed varying degrees of misclassification in these transitional zones.
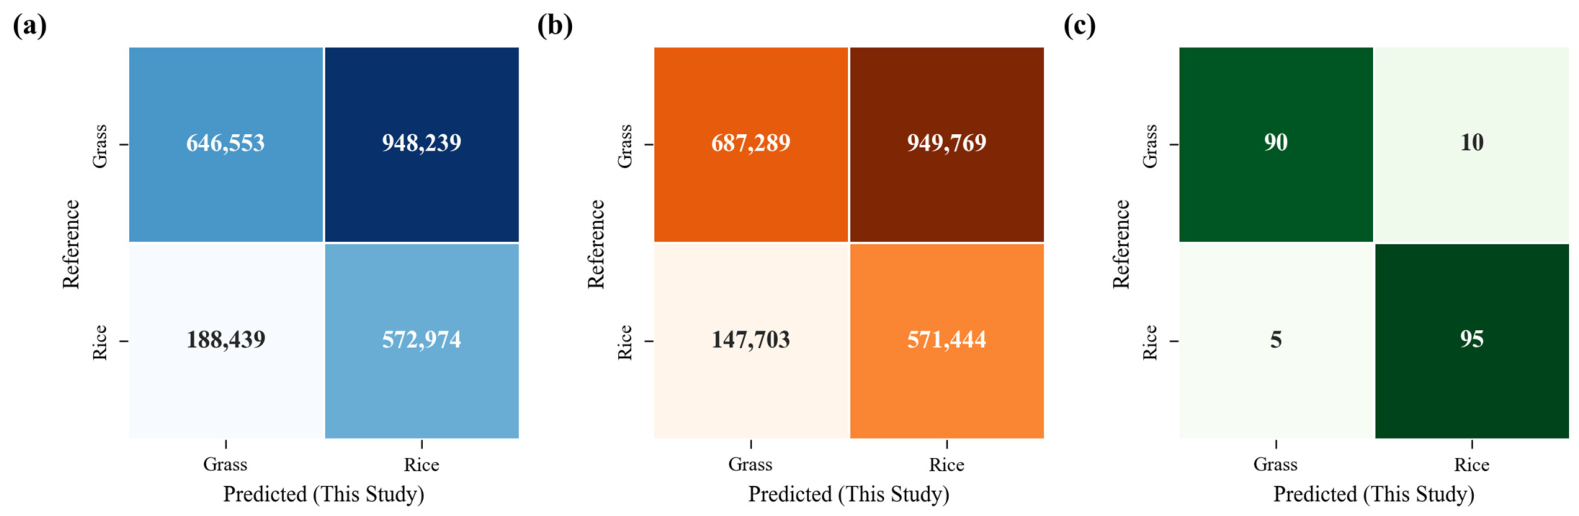
Using the single-season rice distribution products from CCD (2024) and Shen et al. (2025) [32] as references, the classification results from this study were resampled to a uniform grid for pixel-by-pixel accuracy assessment. The results indicated that the overall accuracy against CCD was 51.76%, and against Shen et al., 53.42%. In both comparisons, the user accuracy for rice reached 75.25% and 79.46%, respectively, indicating that more than three-quarters of the rice pixels extracted in this study were consistent with the reference data, with a low misclassification rate; however, the producer accuracy for rice was only 37.66% and 37.56%, meaning that more than 60% of the rice pixels in the reference data were not identified as rice by this study, highlighting a significant under-classification issue. For non-rice categories (primarily grassland), the producer accuracies were 77.44% and 82.33%, respectively, whilst the user accuracies were 40.56% and 42.01%, indicating that a large number of non-rice pixels in the reference data were misclassified as rice by this study.
  • Independent sample point validation
To further directly assess classification accuracy, 100 validation sample points were randomly selected from both grassland and rice-growing areas within the study area. Visual interpretation was conducted using UAV orthophotos and high-resolution historical imagery from Google Earth to obtain ground truth land cover labels. The validation results for the 200 independent sample points showed an overall accuracy of 92.50% (95% CI: 89.0–95.5%) and an F1-score of 0.925 (95% CI: 0.885–0.960) (Figure 9c). For grassland, the producer accuracy was 94.74%, and the user accuracy was 90.00%; for rice, the producer accuracy was 90.48%, and the user accuracy was 95.00%. All accuracy metrics exceeded 90%, indicating that the rice–grassland classification method based on dual-threshold rules of NDRE and GNDVI employed in this study possessed high reliability and practicality, and was capable of meeting the accuracy requirements for regional agricultural resource monitoring.

3.3.3. Multi-Scale Synergy Analysis of UAV-Satellite Methods

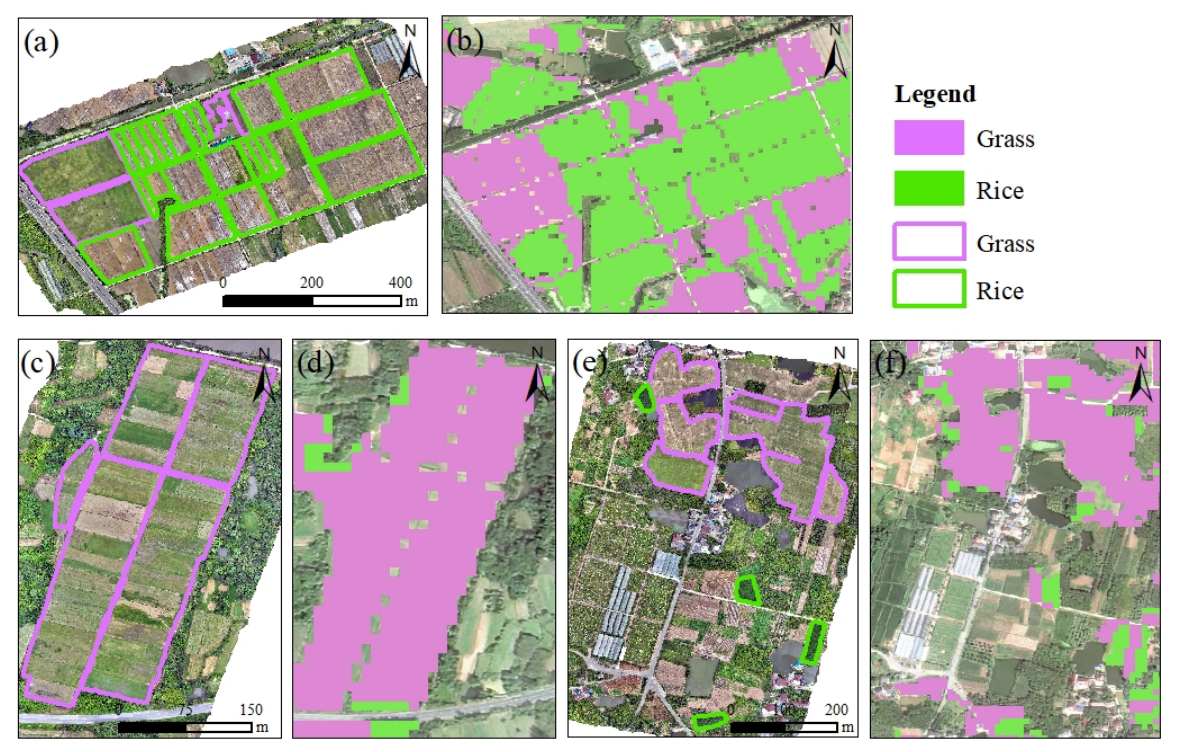
The Sentinel-2 classification map was compared against UAV-derived reference maps across the three acquisition zones to evaluate spatial consistency at the field scale. Overall, the two datasets showed strong agreement in major land cover patterns, although the degree of consistency varied by landscape type (Figure 10).
Classification accuracy was highest in Zone I, where large contiguous rice paddies allowed Sentinel-2 pixels to capture pure rice spectra, and misclassification was limited to occasional edge pixels affected by field ridges and ditches (Figure 10a,b). In Zone II, which is dominated by cultivated grassland, the method successfully identified most turf areas, but narrow grassland strips along plot boundaries were prone to misclassification as rice. The NDRE and GNDVI values of mixed pixels in these transition zones approach the dual-threshold boundary (Figure 10c,d). Zone III presents the most challenging landscape: small, scattered rice paddies embedded within large contiguous grassland patches. The method identified paddies larger than approximately 30 m across but produced edge misclassification for smaller or narrower fields (Figure 10e,f).

4. Discussion

4.1. Effectiveness of Phenological Windows and Feature Selection Strategies

One of the key findings of this study is that the spectral separability between grassland and rice exhibits a distinct bimodal temporal distribution [36,37]. The peaks in separability during the early tillering stage and the heading–flowering stage correspond to two critical physiological junctures: the rapid development of the rice canopy and the transition to reproductive growth, respectively. During the peak tillering stage, rice forms a dense canopy through extensive tillering, with its near-infrared reflectance reaching the highest level of the vegetative growth period [36]; conversely, artificial grassland maintains a low-growing structure due to frequent mowing, with canopy density and leaf area index significantly lower than those of rice, resulting in the highest Fisher ratios for greenness and red-edge indices such as GNDVI and NDRE during this period [38]. By the heading–flowering stage, the emergence of rice panicles alters the vertical structure of the canopy, whilst the translocation of chlorophyll to the grains leads to an increase in visible light reflectance and a decrease in near-infrared reflectance. In contrast, grassland remains in a state of continuous vegetative growth, causing the spectral differences between the two to widen once again. This phenological rhythm provides a clear biological basis for rice–grassland separation based on single- or multi-temporal imagery.
Notably, the red-edge derived indices (NDRE, CIre, SR_NIR/RE) selected in this study demonstrated superior discriminatory power compared to traditional vegetation indices (such as NDVI) within both key windows, confirming that the red-edge band is more sensitive to changes in the physiological state of herbaceous plants [39,40]. This finding is consistent with Xie et al.’s demonstration that hyperspectral parameters in the visible and near-infrared regions are sensitive to changes in rice physiological status across growth stages, further supporting the value of spectral analysis for discriminating crop condition [41].
Among the green-band indices, GNDVI was chosen over GCVI for the final dual-threshold rule, even though GCVI achieved a slightly higher Fisher ratio at the heading–flowering stage (7.82 versus 6.75). This decision was based on two considerations. First, GNDVI and NDRE capture complementary dimensions of spectral separability. NDRE, driven by the red-edge band, responds to chlorophyll content differences that peak at the heading stage when rice translocates nitrogen to developing grains. GNDVI, driven by the green band, responds to canopy structural differences that are most pronounced at the tillering stage, when rice forms a dense canopy while turfgrass remains short under frequent mowing. The two indices therefore each dominate a different optimal window (Figure 5), and their joint use provides stronger classification performance than either single-index rule. Second, the LDA results (Figure 4) showed that a linear combination of multiple bands substantially outperformed any individual vegetation index at both optimal windows, indicating that no single index fully captures the spectral contrast between rice and grassland. The dual-threshold approach using NDRE and GNDVI was adopted as a practical approximation of this multi-band separability.
It is useful to distinguish three related but separate concepts. Phenological separability refers to the temporal offset between the growth cycles of rice and turfgrass that creates observation windows where their biophysical states are maximally different. Spectral separability refers to the statistical distance between the two classes in feature space, quantified in this study by the Fisher ratio and LDA. Classification accuracy refers to the end-to-end mapping performance measured by independent validation. High phenological and spectral separability is necessary but not sufficient for high classification accuracy: scale-transfer effects, sensor resolution, and landscape fragmentation introduce additional uncertainty that can reduce realized accuracy below what feature-level statistics would predict.

4.2. Advantages and Limitations of UAV–Satellite Multi-Scale Synergy

The high spatial resolution (centimeter-scale) and controllable observation conditions of UAV data enable the assessment of spectral separability for pure grassland and rice pixels, thereby avoiding the interference from mixed pixels that is prevalent in satellite imagery [42,43]. When the UAV-derived classification thresholds were directly transferred to Sentinel-2, the user accuracy for rice remained as high as 79.5%. The average deviation between the satellite mapping results and the visual interpretation boundaries within the UAV sample area was less than one Sentinel-2 pixel, validating the stability of cross-scale threshold transfer [44]. Overall, the features and thresholds derived from UAV-based spectral separability analysis remained effective after cross-scale transfer to Sentinel-2 under the conditions of this study. Classification performance was generally higher in contiguous rice areas than in fragmented landscape patches, where boundary effects were more pronounced.
However, this strategy also has certain limitations. The spectral band configurations of UAVs and Sentinel-2 are not entirely consistent—the center wavelength of the DJI M3M red-edge band is 730 nm, whereas Sentinel-2’s corresponding Red-Edge 2 band (B6) is centered at 740 nm. These subtle differences in band centers may lead to a slight decline in classification accuracy following threshold transfer [45]. Furthermore, as UAV observations have limited coverage, it remains to be verified across a wider range of sites whether the spectral separability patterns extracted fully represent spectral variations at the regional scale.
Additionally, LDA-based separability declined sharply during the early jointing stage and late maturity, with Fisher ratios falling below 2.0 (Figure 4). During these periods, the canopy spectra of rice and grassland converge substantially—for example, the water background dominates shortly after transplanting, and rice paddies become senescent and yellow at maturity—indicating that even an optimally weighted multi-band linear combination yields only marginal separability. This reinforces the importance of restricting classification to the high-separability phenological windows (early tillering in June and heading–flowering in September) rather than attempting year-round discrimination.

4.3. Interpretation of Discrepancies in Validation Results

Pixel-by-pixel comparisons with publicly available rice datasets (CCD and Shen et al.) and independent sample-based visual validation yielded markedly divergent results in this study. Specifically, the overall accuracy relative to the CCD and Shen et al. products was only approximately 52–53%, whereas the independent validation achieved an overall accuracy of 92.5%. This discrepancy does not reflect an inherent flaw in the proposed method, but can be primarily attributed to the following three factors.
First, asymmetry of classification systems. Both the CCD and Shen et al. products are rice distribution maps, where the “non-rice” category encompasses highly heterogeneous land cover types, including urban areas, water bodies, woodlands, and dryland croplands. In contrast, the “non-rice” category in this study consists almost entirely of cultivated grassland. When the “non-rice” pixels from the two datasets do not spatially coincide, pixel-by-pixel comparison inevitably generates numerous “false mismatch” pixels. Therefore, the validation results in Jurong City—dominated by a rice–grassland landscape—primarily reflect differences in the delineation of rice boundaries between the two datasets rather than classification errors of the proposed method [43].
Second, differences in spatial resolution. The CCD has a native spatial resolution of 30 m. Resampling it to a 10 m grid inevitably introduces spatial registration errors and boundary blurring. This issue is particularly pronounced in areas such as Houbai Town, where rice paddies and grasslands are intricately interspersed; mixed land cover within a single 30 m pixel further amplifies classification inconsistencies [42].
Third, interannual changes in cropping patterns. The CCD represents the cropping pattern in 2024, the Shen et al. dataset corresponds to 2022, and this study targets 2025. Over this two- to three-year period, some fields underwent land-use conversion—such as expansion of turfgrass cultivation, conversion of rice to other cash crops, or fallowing—representing an objective source of spatial mismatches. The observed spatial overlap rate for rice (75–80%) is actually within a reasonable range, comparable to classification discrepancies induced by interannual variation in similar studies [44].
Independent sample validation eliminated the above confounding factors and directly evaluated the method’s capacity to discriminate between grassland and rice. Consequently, it achieved a far higher accuracy than the comparisons with publicly available datasets. This multi-reference collaborative validation strategy overcomes the limitation that a single rice distribution product cannot directly assess grassland identification accuracy, thereby rendering the validation conclusions more comprehensive and reliable.
The residual classification errors under independent validation were further examined by landscape type. In Zone I, where rice paddies form large contiguous blocks with regular field boundaries, Sentinel-2 classification results were highly consistent with UAV interpretation, and misclassification was limited to occasional edge pixels, mainly from mixed-pixel responses of field ridges and ditches. In Zone II, which is dominated by cultivated grassland, classification errors were concentrated along the boundaries of narrow, elongated grassland plots. For such linear features, the NDRE and GNDVI values of mixed pixels in the transition zones approach the dual-threshold boundary, making them prone to misclassification. In Zone III, characterized by contiguous artificial grassland interspersed with small, scattered rice paddies, the method successfully identified most of the relatively larger fields. However, misclassification occurred at the edges of some overly fragmented or narrow paddies. These patterns indicate that residual classification errors at the Sentinel-2 scale are primarily driven by mixed-pixel effects in transition zones and fragmented landscapes, consistent with the spatial resolution limitations discussed in Section 4.2.

4.4. Limitations and Future Directions

4.4.1. Factors Affecting Threshold Transferability

This study was conducted in one region (Jurong, Jiangsu) over a single growing season (2025). The NDRE and GNDVI thresholds reported here are therefore locally calibrated values and are not claimed to be universally applicable.
Rice cultivar differences can affect threshold transferability. Indica and japonica subspecies differ in canopy architecture, leaf chlorophyll content, and phenological timing, all of which influence vegetation index values during the heading stage [36]. Turfgrass management practices also matter: mowing frequency, irrigation, and fertilization directly affect canopy greenness and density. Intensively managed turf may produce GNDVI values closer to those of rice, shifting the optimal classification boundary [38].
Interannual weather variability presents another challenge. Temperature and precipitation anomalies can shift phenological timing by one to two weeks. In a year with delayed rice development, a fixed-date Sentinel-2 composite (early September) may partially capture pre-heading spectra, reducing separability [22,46]. The same principle applies across regions with different climatic regimes.
Despite these caveats, the VI–window optimization framework itself is expected to remain valid. The bimodal separability pattern reflects fundamental phenological differences between rice and frequently mowed turfgrass, and the red-edge band’s sensitivity to chlorophyll is a general biophysical property rather than a site-specific effect. For applications in new regions, we recommend repeating the local workflow—UAV data acquisition, Fisher ratio ranking, and ROC–Youden threshold determination—rather than directly adopting the numerical values from this study.

4.4.2. Future Research Directions

This study has two remaining limitations not addressed by the phenological window framework itself. First, the ROC–Youden method assumes that the training samples are representative of the population; any sampling bias in the UAV acquisition zones may affect the derived thresholds. Second, the 10 m Sentinel-2 resolution remains a source of mixed-pixel error along narrow field boundaries and in fragmented rice–grassland mosaics, as discussed in Section 4.2.
Future research can be advanced in the following directions. (1) Integrate multi-source satellite data (e.g., the Gaofen series and PlanetScope) and exploit higher-resolution imagery to improve classification accuracy in boundary zones [47,48]. (2) Introduce time-series deep learning models, such as Transformers or LSTMs, to fully leverage temporal spectral variations over the entire growing season, thereby replacing the current single-phase threshold-based approach [49]. (3) Combine phenological models with meteorological data to develop a dynamic thresholding system that adapts to interannual climate fluctuations, thus enhancing the method’s robustness in cross-year and cross-regional applications [49,50]. (4) Conduct multi-year validation across contrasting growing seasons to assess the stability of the NDRE and GNDVI thresholds under interannual weather variability.

5. Conclusions

This study addresses the challenge of spectral similarity between rice and artificial grassland, which hinders their accurate discrimination using traditional single-phase vegetation indices. We propose and validate a multi-scale identification framework based on phenological separability analysis of multispectral features. The main conclusions are as follows:
(1)
The spectral separability between grassland and rice exhibits a bimodal phenological pattern, with the optimal identification windows occurring during the early tillering stage (mid-June) and the heading–flowering stage (early September) of rice. The Fisher ratios of the LDA combination reached 14.1 and 10.8 during these two periods, respectively, providing quantitative criteria for selecting classification phases.
(2)
Within the key phenological windows, red-edge derived indices (NDRE, CIre, SR_NIR/RE) and the green-band vegetation index (GNDVI) demonstrated substantially greater capability in discriminating grassland from rice compared to traditional vegetation indices. This confirms the sensitivity of the red-edge and green bands to differences in the physiological status of herbaceous vegetation.
(3)
A dual-threshold classification rule, constructed based on the optimal phenological window and the selected features (NDRE and GNDVI), enabled high-precision rice–grassland mapping on Sentinel-2 imagery over Jurong City. Pixel-by-pixel comparisons with two publicly available rice datasets yielded spatial overlap rates for rice ranging from 75.2% to 79.5%. Validation using 200 independent sample points achieved an overall accuracy of 92.50% (F1-score = 0.93), with a user accuracy of 95.00% for rice and a producer accuracy of 94.74% for grassland.
(4)
The UAV–satellite multi-scale collaborative strategy effectively combines fine-scale spectral analysis with regional coverage capability. The classification thresholds derived from UAV data maintained strong performance after cross-scale transfer to Sentinel-2, offering a methodological paradigm for accurate crop mapping in regions with complex cropping structures.
The proposed framework offers a promising approach for discriminating between rice and artificial grassland. It provides a systematic workflow—UAV-based Fisher ratio screening, phenological window optimization, and ROC–Youden threshold determination—that may be adapted to other regions with similar rice–grassland mosaics, pending local recalibration. The resulting 10 m rice–grassland map at the city scale demonstrates the utility of combining UAV-scale spectral analysis with Sentinel-2 coverage for regional agricultural monitoring.

Author Contributions

Conceptualization, S.W.; methodology, S.W.; validation, S.X. and L.Z.; formal analysis, S.X., Y.S. and L.Z.; investigation, S.W.; resources, S.W.; data curation, S.X., Y.S., M.Z. and Y.L.; writing—review and editing, S.W. and X.N.; visualization, X.N.; supervision, S.W., Y.S. and X.N.; funding acquisition, Y.L. and M.Z. All authors have read and agreed to the published version of the manuscript.

Funding

This research was funded by the China Geological Survey (Grant Nos. DD20230103, DD20243500, and DD202607102602), Ministry-Province Collaborative Projects (Grant No. 2023ZRBSHZ008), and Anhui Public Welfare Geological Project (2025-g-21).

Data Availability Statement

The raw data supporting the conclusions of this article will be made available by the authors on request.

Conflicts of Interest

The authors declare no conflicts of interest.

References

  1. Song, J.; Wang, C.; Nunes, L.M.; Liang, Z.; Li, G. The Historical Distribution and Future Expansion of Paddy Rice Fields in Asian Highlands. npj Sustain. Agric. 2025, 3, 65. [Google Scholar] [CrossRef]
  2. Robbins, P.; Birkenholtz, T. Turfgrass Revolution: Measuring the Expansion of the American Lawn. Land Use Policy 2003, 20, 181–194. [Google Scholar] [CrossRef]
  3. Ke, X.; Min, Y.; Guo, H.; Wang, D.; Mougharbel, A. What Impact Does the New Urbanization in China’s Yangtze River Economic Belt Have on the Ecological Environment? Environ. Dev. Sustain. 2024, 26, 26679–26698. [Google Scholar]
  4. Cai, X.K. Investigation on the Current Situation of Turfgrass Production in Houbai Town. Master’s Thesis, Nanjing Agricultural University, Nanjing, China, 2020. [Google Scholar]
  5. Peng, L.; Liang, D.F.; Liang, M.H. Current Situation and Development Strategies of Rice Production in Jurong Hilly Region in Recent Ten Years. Agric. Equip. Technol. 2021, 47, 11–13. [Google Scholar]
  6. Wei, J.; Zhang, Z.; Liu, B.; Cui, Y.; Luo, Y.; She, Y. Spatiotemporal Dynamics and Environmental Drivers of Paddy Rice Cropping Patterns in China: Essential Indicators for Agricultural Sustainability. Ecol. Indic. 2025, 178, 114068. [Google Scholar] [CrossRef]
  7. Han, J.; Zhang, Z.; Luo, Y.; Cao, J.; Zhang, L.; Zhuang, H.; Cheng, F.; Zhang, J.; Tao, F. Annual Paddy Rice Planting Area and Cropping Intensity Datasets and Their Dynamics in the Asian Monsoon Region from 2000 to 2020. Agric. Syst. 2022, 200, 103437. [Google Scholar] [CrossRef]
  8. Qiu, B.; Wu, F.; Hu, X.; Yang, P.; Wu, W.; Chen, J.; Chen, X.; He, L.; Joe, B.; Tubiello, F.N.; et al. A Robust Framework for Mapping Complex Cropping Patterns: The First National-Scale 10 m Map with 10 Crops in China Using Sentinel 1/2 Images. ISPRS J. Photogramm. Remote Sens. 2025, 224, 361–381. [Google Scholar] [CrossRef]
  9. Wijesingha, J.; Dzene, I.; Wachendorf, M. Evaluating the Spatial–Temporal Transferability of Models for Agricultural Land Cover Mapping Using Landsat Archive. ISPRS J. Photogramm. Remote Sens. 2024, 213, 72–86. [Google Scholar] [CrossRef]
  10. Ban, D.; Wang, C.; Xuan, Y.F.; Liu, Z.H.; Jiang, Q.G.; Li, G.S. Active Faults and Neotectonic Framework in Northeast China—Evidence from Remote Sensing Image Interpretation. East China Geol. 2025, 46, 386–401. [Google Scholar]
  11. Chen, J.; Chen, J.; Liao, A.; Cao, X.; Chen, L.; Chen, X.; He, C.; Han, G.; Peng, S.; Lu, M.; et al. Global Land Cover Mapping at 30 m Resolution: A POK-Based Operational Approach. ISPRS J. Photogramm. Remote Sens. 2015, 103, 7–27. [Google Scholar] [CrossRef]
  12. Gong, P.; Wang, J.; Yu, L.; Zhao, Y.; Zhao, Y.; Liang, L.; Niu, Z.; Huang, X.; Fu, H.; Liu, S.; et al. Finer Resolution Observation and Monitoring of Global Land Cover: First Mapping Results with Landsat TM and ETM+ Data. Int. J. Remote Sens. 2013, 34, 2607–2654. [Google Scholar]
  13. Li, W.; MacBean, N.; Ciais, P.; Defourny, P.; Lamarche, C.; Bontemps, S.; Houghton, R.A.; Peng, S. Gross and Net Land Cover Changes in the Main Plant Functional Types Derived from the Annual ESA CCI Land Cover Maps (1992–2015). Earth Syst. Sci. Data 2018, 10, 219–234. [Google Scholar] [CrossRef]
  14. Li, B.; Ti, C.; Yan, X. Estimating Rice Paddy Areas in China Using Multi-Temporal Cloud-Free Normalized Difference Vegetation Index (NDVI) Imagery Based on Change Detection. Pedosphere 2020, 30, 734–746. [Google Scholar] [CrossRef]
  15. Wu, T.; Zhang, Z.; Wang, Q.; Jin, W.; Meng, K.; Wang, C.; Yin, G.; Xu, B.; Shi, Z. Estimating Rice Leaf Area Index at Multiple Growth Stages with Sentinel-2 Data: An Evaluation of Different Retrieval Algorithms. Eur. J. Agron. 2024, 161, 127362. [Google Scholar] [CrossRef]
  16. Li, H.; Huang, J.; Zhang, C.; Ning, X.; Zhang, S.; Atkinson, P.M. An Efficient and Generalisable Approach for Mapping Paddy Rice Fields Based on Their Unique Spectra during the Transplanting Period Leveraging the CIE Colour Space. Remote Sens. Environ. 2024, 313, 114381. [Google Scholar] [CrossRef]
  17. Sarker, M.M.; Mizuno, Y.; Ono, K.; Kobayashi, T.; Nasahara, K.N. Assessment of Spectral Indices for Detecting Rice Phenological Stages Using Long-Term In Situ Hyperspectral Observations and Sentinel-2 Data. AgriEngineering 2026, 8, 14. [Google Scholar] [CrossRef]
  18. Chen, Q.; Shen, C.; Du, H.; Tang, D. Comparing Supervised Classification Algorithm–Feature Combinations for Spartina alterniflora Extraction: A Case Study in Zhanjiang, China. Front. Remote Sens. 2025, 6, 1606549. [Google Scholar] [CrossRef]
  19. Claverie, M.; Ju, J.; Masek, J.G.; Dungan, J.L.; Vermote, E.F.; Roger, J.-C.; Skakun, S.V.; Justice, C. The Harmonized Landsat and Sentinel-2 Surface Reflectance Data Set. Remote Sens. Environ. 2018, 219, 145–161. [Google Scholar] [CrossRef]
  20. Lu, B.; He, Y. Evaluating Empirical Regression, Machine Learning, and Radiative Transfer Modelling for Estimating Vegetation Chlorophyll Content Using Bi-Seasonal Hyperspectral Images. Remote Sens. 2019, 11, 1979. [Google Scholar] [CrossRef]
  21. Yan, K.; Gao, S.; Yan, G.; Ma, X.; Chen, X.; Zhu, P.; Li, J.; Gao, S.; Gastellu-Etchegorry, J.-P.; Myneni, R.B.; et al. A Global Systematic Review of the Remote Sensing Vegetation Indices. Int. J. Appl. Earth Obs. Geoinf. 2025, 139, 104560. [Google Scholar] [CrossRef]
  22. Yu, L.; Liu, T.; Bu, K.; Yan, F.; Yang, J.; Chang, L.; Zhang, S. Monitoring the Long Term Vegetation Phenology Change in Northeast China from 1982 to 2015. Sci. Rep. 2017, 7, 14770. [Google Scholar] [CrossRef] [PubMed]
  23. Yang, H.; Wang, D.; Xin, J.; Qian, H.; Li, C.; Wang, Y.; Tan, Y.; Dai, J.; Zhao, H.; Li, Z. Integrating Multidimensional Feature Indices and Phenological Windows for Mapping Cropping Patterns in Complex Agricultural Landscape Regions. IEEE J. Sel. Top. Appl. Earth Obs. Remote Sens. 2024, 17, 7448–7459. [Google Scholar] [CrossRef]
  24. Dong, J.; Xiao, X. Evolution of Regional to Global Paddy Rice Mapping Methods: A Review. ISPRS J. Photogramm. Remote Sens. 2016, 119, 214–227. [Google Scholar] [CrossRef]
  25. Wang, Z.; Ma, Y.; Zhang, Y.; Shang, J. Review of Remote Sensing Applications in Grassland Monitoring. Remote Sens. 2022, 14, 2903. [Google Scholar] [CrossRef]
  26. Deng, L.; Mao, Z.; Li, X.; Hu, Z.; Duan, F.; Yan, Y. UAV-Based Multispectral Remote Sensing for Precision Agriculture: A Comparison between Different Cameras. ISPRS J. Photogramm. Remote Sens. 2018, 146, 124–136. [Google Scholar] [CrossRef]
  27. Jurong Municipal People’s Government. Jurong City Overview. May 2021. Available online: https://www.jurong.gov.cn/jurong/csgk/202105/dd2b757014c440fca07e56ac5abf980c.shtml (accessed on 1 September 2025).
  28. Fang, P.; Wang, Z.; Huang, Y.; Chen, Y.; Cao, X. Administrative Fragmentation and Functional Integration: Quantifying Urban Interstice Dynamics in Jurong Using Mobile Origin–Destination (OD) Flows. Appl. Sci. 2025, 15, 5675. [Google Scholar] [CrossRef]
  29. Liang, J.; Wang, R.Y. Analysis of Spatial-Temporal Changes of Land Use in Zhenjiang City, Jiangsu Province, from 2000 to 2020 Using GIS. Int. J. Environ. Agric. Biotechnol. 2024, 9, 1–14. [Google Scholar] [CrossRef]
  30. Liu, J.; Wang, W.; Li, J.; Mustafa, G.; Su, X.; Nian, Y.; Ma, Q.; Zhen, F.; Wang, W.; Li, X. UAV Remote Sensing Technology for Wheat Growth Monitoring in Precision Agriculture: Comparison of Data Quality and Growth Parameter Inversion. Agronomy 2025, 15, 159. [Google Scholar] [CrossRef]
  31. Li, J.; Roy, D.P. A Global Analysis of Sentinel-2A, Sentinel-2B and Landsat-8 Data Revisit Intervals and Implications for Terrestrial Monitoring. Remote Sens. 2017, 9, 902. [Google Scholar] [CrossRef]
  32. Shen, R.; Pan, B.; Peng, Q.; Dong, J.; Chen, X.; Zhang, X.; Ye, T.; Huang, J.; Yuan, W. High-Resolution Distribution Maps of Single-Season Rice in China from 2017 to 2022. Earth Syst. Sci. Data 2023, 15, 3203–3222. [Google Scholar] [CrossRef]
  33. Fu, Y.; Dong, J.; Shen, R.; Peng, Q.; Li, X.; Zheng, Y.; Pan, B.; Dong, J.; Qiu, B.; Huang, J.; et al. China Crop Dataset: A Long-Term and High-Resolution Crop Distribution Dataset in China. Science Data Bank, 28 November 2025; V1. Available online: https://cstr.cn/31253.11.sciencedb.32361 (accessed on 15 March 2026).
  34. Lv, C.; Lu, Y.; Lu, M.; Feng, X.; Fan, H.; Xu, C.; Xu, L. A Classification Feature Optimization Method for Remote Sensing Imagery Based on Fisher Score and mRMR. Appl. Sci. 2022, 12, 8845. [Google Scholar] [CrossRef]
  35. Suesse, T.; Brenning, A.; Grupp, V. Spatial Linear Discriminant Analysis Approaches for Remote-Sensing Classification. Spat. Stat. 2023, 57, 100775. [Google Scholar] [CrossRef]
  36. Din, M.; Zheng, W.; Rashid, M.; Wang, S.; Shi, Z. Evaluating Hyperspectral Vegetation Indices for Leaf Area Index Estimation of Oryza sativa L. at Diverse Phenological Stages. Front. Plant Sci. 2017, 8, 820. [Google Scholar] [CrossRef] [PubMed]
  37. Houborg, R.; Fisher, J.B.; Skidmore, A.K. Advances in Remote Sensing of Vegetation Function and Traits. Int. J. Appl. Earth Obs. Geoinf. 2015, 43, 1–6. [Google Scholar] [CrossRef]
  38. Peña-Barragán, J.M.; Ngugi, M.K.; Plant, R.E.; Six, J. Object-Based Crop Identification Using Multiple Vegetation Indices, Textural Features and Crop Phenology. Remote Sens. Environ. 2011, 115, 1301–1316. [Google Scholar] [CrossRef]
  39. Hank, T.B.; Berger, K.; Bach, H.; Clevers, J.G.P.W.; Gitelson, A.; Zarco-Tejada, P.; Mauser, W. Spaceborne Imaging Spectroscopy for Sustainable Agriculture: Contributions and Challenges. Surv. Geophys. 2018, 40, 515–551. [Google Scholar] [CrossRef]
  40. Mertens, S.; Verbraeken, L.; Sprenger, H.; Demuynck, K.; Maleux, K.; Cannoot, B.; De Block, J.; Maere, S.; Nelissen, H.; Bonaventure, G.; et al. Proximal Hyperspectral Imaging Detects Diurnal and Drought-Induced Changes in Maize Physiology. Front. Plant Sci. 2021, 12, 640151. [Google Scholar] [CrossRef] [PubMed]
  41. Xie, X.; Li, Y.X.; Li, R.; Zhang, Y.; Huo, Y.; Bao, Y.; Shen, S. Hyperspectral Characteristics and Growth Monitoring of Rice (Oryza sativa) under Asymmetric Warming. Int. J. Remote Sens. 2013, 34, 8449–8462. [Google Scholar] [CrossRef]
  42. Saini, R.; Ghosh, S.K. Crop Classification on Single Date Sentinel-2 Imagery Using Random Forest and Support Vector Machine. Int. Arch. Photogramm. Remote Sens. Spat. Inf. Sci. 2018, XLII-5, 683–688. [Google Scholar] [CrossRef]
  43. Grekousis, G.; Mountrakis, G.; Kavouras, M. Global Land Cover Mapping Using Earth Observation Satellite Data: Recent Progresses and Challenges. ISPRS J. Photogramm. Remote Sens. 2015, 103, 1–6. [Google Scholar] [CrossRef]
  44. Maimaitijiang, M.; Ghulam, A.; Sidike, P.; Hartling, S.; Maimaitiyiming, M.; Peterson, K.; Shavers, E.; Fishman, J.; Peterson, J.; Kadam, S.; et al. Unmanned Aerial System (UAS)-Based Phenotyping of Soybean Using Multi-Sensor Data Fusion and Extreme Learning Machine. ISPRS J. Photogramm. Remote Sens. 2017, 134, 43–58. [Google Scholar] [CrossRef]
  45. D’Odorico, P.; Gonsamo, A.; Damm, A.; Schaepman, M.E. Experimental Evaluation of Sentinel-2 Spectral Response Functions for NDVI Time-Series Continuity. IEEE Trans. Geosci. Remote Sens. 2013, 51, 1336–1348. [Google Scholar] [CrossRef]
  46. Tian, F.; Cai, Z.; Jin, H.; Hufkens, K.; Scheifinger, H.; Tagesson, T.; Smets, B.; Van Hoolst, R.; Bonte, K.; Ivits, E.; et al. Calibrating Vegetation Phenology from Sentinel-2 Using Eddy Covariance, PhenoCam, and PEP725 Networks. Remote Sens. Environ. 2021, 260, 112456. [Google Scholar] [CrossRef]
  47. Ahmad, U.; Nasirahmadi, A.; Hensel, O.; Marino, S. Technology and Data Fusion Methods to Enhance Site-Specific Crop Monitoring. Agronomy 2022, 12, 555. [Google Scholar] [CrossRef]
  48. Wang, J.; Lee, C.K.; Zhu, X.; Cao, R.; Gu, Y.; Wu, S.; Wu, J. A New Object-Class Based Gap-Filling Method for PlanetScope Satellite Image Time Series. Remote Sens. Environ. 2022, 280, 113185. [Google Scholar] [CrossRef]
  49. Rußwurm, M.; Courty, N.; Emonet, R.; Lefèvre, S.; Tuia, D.; Tavenard, R. End-to-End Learned Early Classification of Time Series for In-Season Crop Type Mapping. ISPRS J. Photogramm. Remote Sens. 2023, 196, 445–456. [Google Scholar] [CrossRef]
  50. Liu, X.; Li, X.; Gao, L.; Zhang, J.; Qin, D.; Wang, K.; Li, Z. Early-Season and Refined Mapping of Winter Wheat Based on Phenology Algorithms—A Case of Shandong, China. Front. Plant Sci. 2023, 14, 1016890. [Google Scholar] [CrossRef] [PubMed]
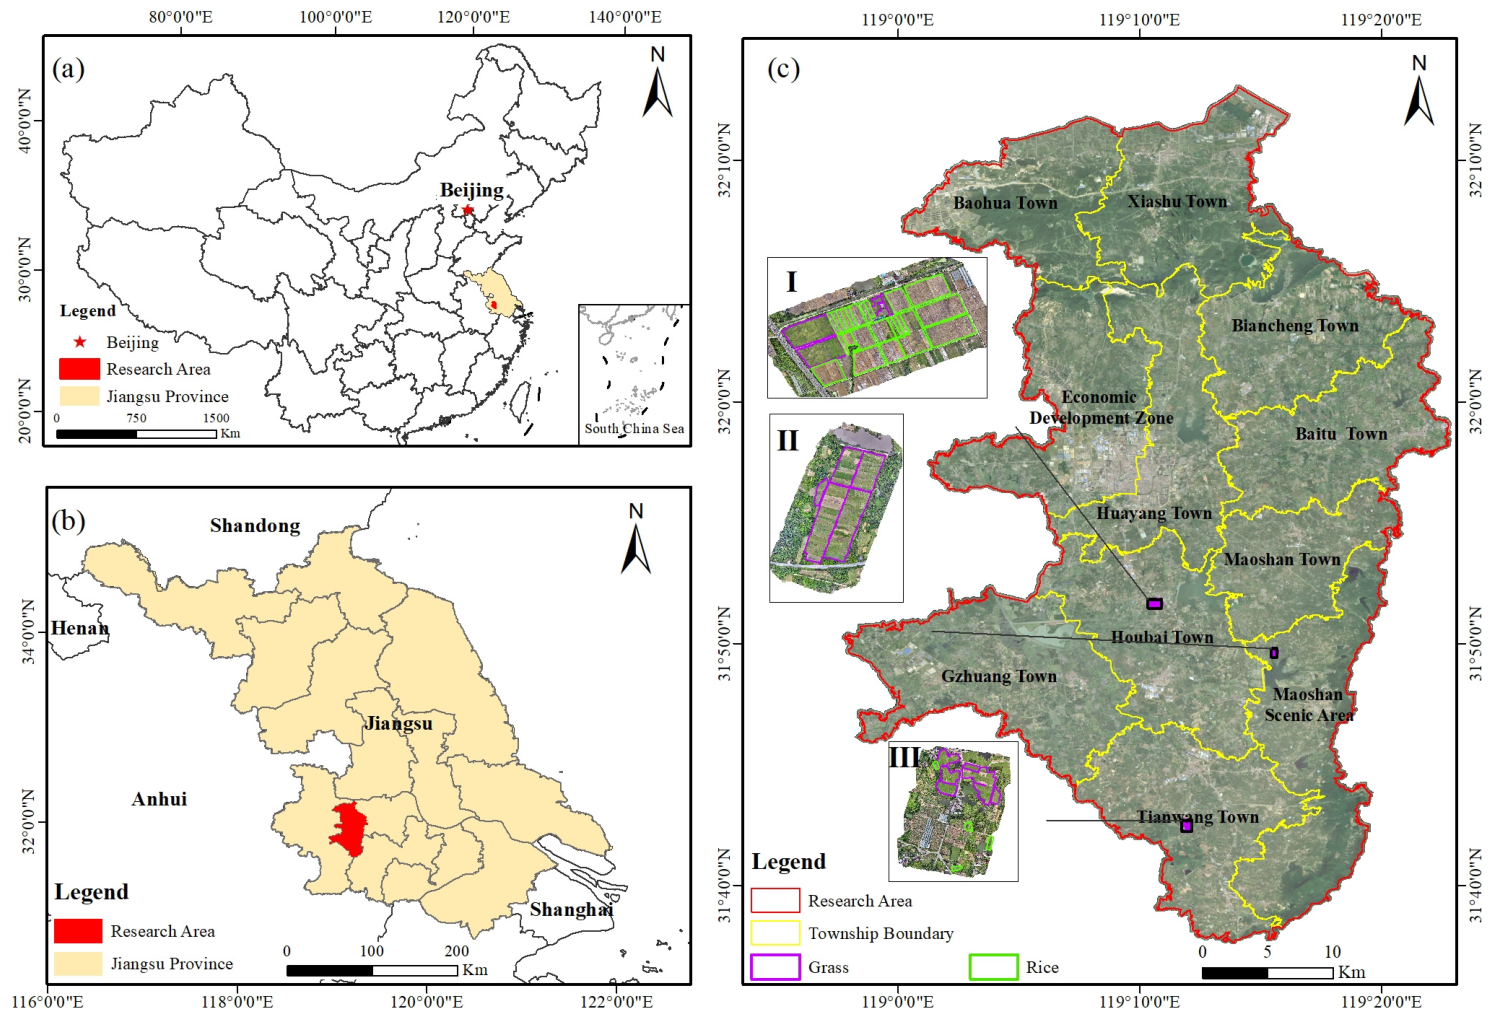
Figure 1. Location of the study area. (a) Map of China with Jiangsu Province highlighted in yellow and the study area indicated in red; (b) Jiangsu Province (yellow) with the geographic position of the study area (red); (c) detailed view of the study area showing the study area boundary (red), township administrative boundaries (yellow), and three UAV data acquisition zones (I–III, green polygons: rice; purple polygons: artificial grassland).
Remotesensing 18 02653 g001
Figure 2. Time-series UAV multispectral imagery (RGB composite) of Zone I from June to December 2025, overlaid with manually interpreted field boundaries (green polygons: rice; purple polygons: artificial grassland). Subfigures (ah) correspond to eight acquisition dates: (a) 16 June, (b) 5 July, (c) 28 July, (d) 4 September, (e) 26 September, (f) 7 October, (g) 24 October, and (h) 6 December.
Remotesensing 18 02653 g002
Figure 3. Heatmap of Fisher ratios for 23 spectral features across eight phenological stages. Rows represent spectral features (raw bands and vegetation indices), and columns represent acquisition dates (phenological stages). Cell color indicates the Fisher ratio, with warmer colors (red) representing higher separability and cooler colors (blue) representing near-zero discriminability. Numerical Fisher ratio values are displayed within each cell.
Remotesensing 18 02653 g003
Figure 4. Fisher ratio of the linear discriminant analysis (LDA) composite feature (optimal linear combination of Green, Red, Red-Edge, and NIR bands) across eight phenological stages. Higher values indicate greater overall spectral separability between rice and artificial grassland.
Remotesensing 18 02653 g004
Figure 5. Temporal trends of the Fisher ratios of the top five spectral features across eight phenological stages.
Remotesensing 18 02653 g005
Figure 6. Receiver operating characteristic (ROC) curves and optimal thresholds for NDRE and GNDVI at the heading–flowering stage (4 September 2025). The red dot indicates the optimal threshold determined by maximizing the Youden index.
Remotesensing 18 02653 g006
Figure 7. Spatial distribution of rice and grassland in Jurong City derived from Sentinel-2.
Remotesensing 18 02653 g007
Figure 8. Spatial validation and sub-regional comparison of rice maps. (a) Rice distribution map overlaid with 200 validation points and four typical regions (1–4). (bq) For each typical region (1 to 4): satellite image, Sentinel-2 derived rice map, CCD product, and Shen product ((be): region 1; (fi): region 2; (jm): region 3; (nq): region 4).
Remotesensing 18 02653 g008
Figure 9. Confusion matrices of rice mapping comparisons and independent validation in Jurong City. (a) Comparison with CCD (2024); (b) comparison with Shen et al. (2025) [32]; (c) independent validation using 200 stratified random samples. Color intensity indicates the number of pixels within each confusion matrix cell, with distinct colormaps used to visually separate the three panels.
Remotesensing 18 02653 g009
Figure 10. Comparison of UAV-derived reference maps (a,c,e) and Sentinel-2 classification results (b,d,f) for the three acquisition zones. (a,b) Zone I: contiguous rice paddies with regular boundaries. (c,d) Zone II: cultivated grassland with narrow turf strips. (e,f) Zone III: small scattered rice paddies within grassland. Green: rice; Purple: grassland.
Remotesensing 18 02653 g010
Table 1. Summary of UAV acquisition parameters.
DatePhenological StageTotal ImagesGSD Range (cm)Total Coverage (km2)Mean RMSE (m)
16 June 2025Early tillering13002.90.890.041
5 July 2025Early jointing13842.90.940.032
28 July 2025Booting13602.8–2.90.930.029
4 September 2025Heading–flowering13812.8–2.90.950.026
26 September 2025Grain filling14062.8–2.90.940.027
7 October 2025Ripening13722.90.940.039
24 October 2025Maturity13862.8–2.90.950.028
6 December 2025Post-harvest13792.8–2.90.940.034
Disclaimer/Publisher’s Note: The statements, opinions and data contained in all publications are solely those of the individual author(s) and contributor(s) and not of MDPI and/or the editor(s). MDPI and/or the editor(s) disclaim responsibility for any injury to people or property resulting from any ideas, methods, instructions or products referred to in the content.