Article

Fine-Scale Maturity Recognition of Eucalyptus Plantations Based on Deep Learning and Multimodal Feature Fusion

1
School of Electrical Engineering, Liaoning University of Technology, Jinzhou 121001, China
2
Institute of Forest Resource Information Techniques, Chinese Academy of Forestry, Beijing 100091, China
3
Key Laboratory of National Forestry and Grassland Administration on Remote Sensing for Forestry and Grassland Monitoring and Evaluation, Chinese Academy of Forestry, Beijing 100091, China
4
School of Geomatics, Liaoning Technical University, Fuxin 123000, China
*
Author to whom correspondence should be addressed.
These authors contributed equally to this work.
Remote Sens. 2026, 18(15), 2632; https://doi.org/10.3390/rs18152632
Submission received: 31 May 2026 / Revised: 29 July 2026 / Accepted: 4 August 2026 / Published: 6 August 2026

Highlights

What are the main findings?
  • Four deep learning architectures differ obviously in eucalyptus maturity recognition, with the following performance ranking: Mamba-UNet (state-space model) > Swin-UNet (pure Transformer) > U-Net (CNN baseline) > Trans-UNet (CNN–Transformer hybrid). The optimal Mamba-UNet achieves a validation mIoU of 79.10%.
  • The combination of Sentinel-2 (S2) and spectral indices (SIs) yields the highest mIoU of 79.10%, exceeding Sentinel-2+Sentinel-1 (S2+S1, 78.38%), S2+S1+SI (78.55%) and standalone S2 (77.72%).
What is the implication of the main finding?
  • It is unnecessary to pursue overcomplicated network architectures for eucalyptus maturity identification, given no positive correlation between model complexity and identification accuracy.
  • A strong correlation exists between spectral indices and eucalyptus physiological characteristics. The incorporation of C-band SAR causes feature redundancy and deteriorates accuracy.

Abstract

Accurate identification of eucalyptus plantation maturity, which is hierarchically defined as young forests, middle-aged forests, and mature forests, corresponding to different growth and physiological development stages of eucalyptus stands, is critical for forestry management and sustainable development. Currently, research on fine-grained semantic segmentation of different eucalyptus growth stages remains insufficient, and there is a lack of systematic evaluation of classical deep learning architectures and multimodal data for eucalyptus plantation maturity identification. This limits the application of remote sensing technology in forestry management, and constrains the understanding of growth dynamics in subtropical planted forests. Taking Gaofeng Forest Farm in Nanning, Guangxi, as the study area, this study analyzes the adaptability of four generations of deep learning segmentation architectures—U-Net (convolutional baseline), Trans-UNet (CNN-Transformer hybrid), Swin-UNet (pure Transformer), and Mamba-UNet (state-space model)—in the fine identification of eucalyptus plantation maturity based on spectral indices (SIs), C-band SAR data (S1), and multispectral data (S2). The results show the following: (1) There is no positive correlation between model complexity and recognition performance. Among all architectures, Mamba-UNet achieves the best performance, with a validation set mIoU of 79.10% and an F1-score of 88.26%. The performance ranking of the different architectures evaluated is Mamba-UNet > Swin-UNet > U-Net > Trans-UNet. (2) The S2+SI combination achieves the highest accuracy (mIoU 79.10%), outperforming S2+S1+SI (78.55%), S2+S1 (78.38%), and single S2 (77.72%), which indicates the strong correlation between spectral indices and eucalyptus physiological characteristics. The backscattering features of S1 are limited by canopy penetration in the subtropical rainforest, introducing redundancy and triggering negative fusion effects. (3) Independent verification with field survey points verifies the strong generalization ability of the proposed approach, with OA of 94.08%, mIoU of 85.62%, Precision of 93.00%, Recall of 91.37% and F1-score of 92.15%, which indicates that the methodological framework can realize the identification of eucalyptus maturity with high precision. (4) Eucalyptus accounts for 60.15% of the total area of Gaofeng Forest Farm. Within the eucalyptus stand age structure, young, middle-aged, and mature forests account for 20.67%, 13.62%, and 25.86%, respectively. The overall distribution exhibits a polarized pattern with high proportions of young and mature forests. The findings offer theoretical support and insights for dynamic monitoring of fast-growing plantations and refined management of stand development stages.

1. Introduction

Eucalyptus (Eucalyptus spp.), one of the world’s most important fast-growing broadleaf species, is characterized by its rapid growth, short rotation period, and strong adaptability [1]. It is widely used in papermaking, bioenergy, and environmental protection [2]. China has the world’s largest eucalyptus plantations, covering a total area of 6.08 million hectares. As China’s core eucalyptus production region, the Guangxi Zhuang Autonomous Region accounts for approximately 50.7% of the country’s total eucalyptus plantation area, thereby forming a vital eucalyptus economic belt [3]. As a benchmark for intensive and large-scale eucalyptus plantation management in Guangxi, Gaofeng Forest Farm serves as a pivotal hub for the forestry industry, providing support for local sustainable development. Through optimized cultivation methods, the farm has not only increased its timber supply but also improved the regional ecology and, to a certain extent, enhanced its carbon sequestration capacity.
In the management of eucalyptus plantations, the accurate identification and differentiation of young forests (<2 years), middle-aged forests (2–4 years), and mature forests (>4 years) is the foundation for achieving scientific management and sustainable development [4]. Unlike only mapping the spatial distribution of eucalyptus, maturity identification further subdivides eucalyptus stands into different age-gradient groups based on growth rhythm, physiological state and rotation management requirements. This work provides direct support for differentiated forest management decision-making: tending and water-fertilizer regulation for young stands to accelerate early growth, growth monitoring plus density adjustment for middle-aged stands to optimize stand structure, and harvesting and regeneration planning for mature stands to realize sustainable resource circulation. At the same time, understanding the age structure and spatiotemporal distribution of forests is also a key basis for assessing the dynamics of forest resources and ensuring the sustainable supply of timber, and also provides core parameters for quantifying the ecological functions of forest stands such as carbon sequestration capacity and soil and water conservation.
Traditional forest inventory methods are time-consuming, labor-intensive, and inherently hazardous. With technological advancements, remote sensing has been widely applied to eucalypt resource surveys. Tupinambá-Simões et al. (2022) [5] utilized unmanned aerial vehicle (UAV) imagery to assess the impacts of drought on survival rates and growth dynamics in commercial eucalypt forestry in Brazil. Xu et al. (2024) [6] employed HJ-1/2 satellite imagery with a spatial resolution of 30 m to map typical eucalypt plantation distributions in Yongning County, Nanning City, China. Qiu et al. (2026) [7] inverted remote sensing signals to characterize differences in the long-term post-fire recovery processes of eucalypt forests based on multi-source remote sensing data. Current eucalypt remote sensing research predominantly focuses on tropical primary production regions (e.g., China, Brazil, Australia, and East Africa), relying primarily on optical data such as Landsat for distribution mapping [8]. Although recent studies have integrated multi-source data (e.g., Sentinel-2 combined with LiDAR and UAV imagery) [9,10], research remains concentrated on eucalypt distribution delineation [11], biomass estimation [12], health condition monitoring [13], and tree species identification [10]. The existing optical or SAR remote sensing workflows only judge whether a pixel belongs to eucalyptus vegetation, lacking the capacity to distinguish growth age differences within pure eucalyptus plots. Fine-scale identification of maturity stages within single eucalypt species remains relatively scarce, particularly regarding the performance of multi-source remote sensing data fusion for eucalypt maturity recognition, which remains unknown and lacks systematic solutions.
In recent years, deep learning models have undergone an evolution from Convolutional Neural Networks (CNNs) to Transformers, and subsequently to state-space models (SSMs). This evolutionary trajectory is represented by four generations of architectures: the first-generation U-Net (a pure CNN architecture) [14], the second-generation Trans-UNet (a hybrid CNN-Transformer architecture) [15], the third-generation Swin-UNet (a pure Transformer architecture) [16], and the fourth-generation Mamba-UNet (SSM) [17]. The performance of deep learning models varies depending on the specific recognition task. In the field of forest parameter inversion, Zhao et al. [18] employed U-Net with Sentinel-1 data to achieve monthly forest disturbance mapping in typical American regions, attaining an overall accuracy of 78%. Zhou et al. [19] conducted a comparative study using U-Net, Attention U-Net, ResU-Net, U2-Net, Swin-UNet, and Trans-UNet for farmland shelterbelt extraction in the Alar Reclamation Area of Xinjiang based on GF-6 remote sensing imagery, with results indicating that U-Net outperformed the other five models. Ma et al. [20] applied Trans-UNet with Sentinel-2 imagery for farmland shelterbelt identification in China’s Three-North Region, achieving an overall accuracy of 79.39%; Liu et al. [21] conducted a semantic segmentation experiment on forest remote sensing imagery based on an improved Swin-UNet. To date, few studies have used Mamba-UNet for forest parameter extraction, let alone for identifying eucalyptus maturity. The application of these four representative deep learning architectures for regional-scale eucalyptus maturity recognition in southern China remains limited, and their performance is still unknown. This gap not only constrains the application potential of remote sensing technology in precision forestry management but also impedes in-depth understanding of growth dynamics in subtropical/tropical plantations.
Therefore, the Gaofeng Forest Farm in Nanning, Guangxi, is selected as the study area, and we conduct a fine-scale recognition study of eucalyptus maturity based on deep learning and multimodal remote sensing data, where fine-scale refers to a finer division of maturity stages. The specific research objectives are as follows: (1) To construct a multimodal dataset for eucalyptus maturity identification by fusing Sentinel-2 multispectral data with C-band Sentinel-1 SAR data, and by incorporating six spectral indices—NDVI, GNDVI, EVI, MSAVI, NDBI, and NDWI—to enhance the multi-dimensional representational capacity for distinguishing differences in eucalyptus maturity. (2) To employ four deep learning architectures—U-Net, Trans-UNet, Swin-UNet, and Mamba-UNet—for eucalyptus maturity identification, and to analyze the performance differences among CNN architectures, hybrid CNN–Transformer architectures, pure Transformer architectures, and Mamba architectures systematically in this specific task. (3) To determine the optimal combination scheme of multi-source and multi-feature data, and to analyze the spatial distribution of eucalyptus stands of different maturity stages based on the optimal identification results. Ultimately, this study establishes a reproducible, high-precision technical workflow for the remote sensing-based identification of eucalyptus maturity, thereby providing technical support and a scientific basis for the intelligent management and sustainable operation of eucalyptus plantations.

2. Study Area and Materials

2.1. Study Area

Gaofeng Forest Farm was selected as the study area, which is located in Nanning City, Guangxi, China. Its geographical coordinates range from 107°45′ to 108°40′E and 22°33′ to 23°06′N (Figure 1). Gaofeng Forest Farm is a large-scale state-owned forest farm directly administered by the Forestry Bureau of Guangxi Zhuang Autonomous Region. The study area has a subtropical monsoon climate with an average annual temperature of about 21.6 °C and an average annual precipitation of about 1300 mm. The terrain is mainly low mountains and hills, with an altitude ranging from 100 to 500 m. The soil type is mainly red soil, which is suitable for the intensive management of fast-growing and high-yield eucalyptus forests. The eucalyptus plantations in Gaofeng Forest Farm have a long history, which is characterized by highly intensive management and a complete age structure (young, middle-aged and mature forests coexist). Moreover, the eucalyptus plantations are relatively concentrated and contiguous in spatial distribution, making this an ideal area for studying the sustainable management of plantations in southern China.

2.2. Remote Sensing Images, Preprocessing and Dataset Construction

Sentinel-1 and Sentinel-2 remote sensing images were employed in this study, both collected from the Google Earth Engine platform. The Sentinel-2 data covering the study area was acquired from the COPERNICUS S2_SR_HARMONIZED dataset. Four images were obtained by selecting those with cloud cover of less than 10% from 1 January to 1 February 2023. Ten bands were selected, ranging from visible light to shortwave infrared, including Band 2, Band 3, Band 4, Band 5, Band 6, Band 7, Band 8, Band 8A, Band 11, and Band 12. By performing a median composite on the four acquired images, an optical image covering the study area was ultimately generated. The Sentinel-1 data covering the study area was acquired from the COPERNICUS/S1_GRD dataset. Similarly, data from 1 January to 1 February 2023 was selected, including both VV and VH bands, resulting in six images. The spatial resolution of both the Sentinel-1 and Sentinel-2 images is 10 m. The specific parameter information of the remote sensing images is shown in Table 1.
To enhance the separability of eucalyptus maturity, six spectral indices were calculated based on the characteristics of the land-cover types in the study area and the acquired Sentinel-2 imagery, including the Normalized Difference Vegetation Index (NDVI), Green Normalized Difference Vegetation Index (GNDVI), Enhanced Vegetation Index (EVI), Modified Soil Adjusted Vegetation Index (MSAVI), Normalized Difference Water Index (NDWI), and Normalized Difference Built-up Index (NDBI). Their formulas and original references are presented in Table 2. All spectral index computations were implemented in GEE. Land-cover separation indices (NDWI and NDBI) served to distinguish eucalyptus vegetation from interfering features such as water bodies, bare soil, and built-up areas, while vegetation spectral indices (NDVI, GNDVI, EVI, and MSAVI) captured variations in growth gradients within the eucalyptus stands. These two categories of indices play complementary roles, effectively reducing the likelihood of misclassification and enhancing the accuracy of eucalyptus maturity identification.
Four datasets were constructed via band combination based on Sentinel-1, Sentinel-2, and the six spectral indices aforementioned: the 10-band dataset derived solely from Sentinel-2 (S2); the 12-band dataset integrating Sentinel-2 optical imagery and Sentinel-1 radar data (S2+S1); the 16-band dataset integrating Sentinel-2 optical imagery and six spectral indices (S2+SI), and the 18-band dataset combining Sentinel-2, Sentinel-1, and the aforementioned spectral indices (S2+S1+SI). The construction of these multi-source composite datasets establishes a solid data foundation for evaluating the performance of different input features in the eucalyptus maturity identification task.

2.3. Training and Validation Samples

2.3.1. Point Samples Collection

From 1 January to 1 February 2023, two field surveys were carried out at Gaofeng Forest Farm. The land-cover types within the farm were categorized into nine classes, namely young eucalyptus forests, middle-aged eucalyptus forests, mature eucalyptus forests, Masson pine (Pinus massoniana), Star anise (Illicium verum), other broadleaf forests, Chinese fir (Cunninghamia lanceolata), water bodies, and bare land. Point sample collection was performed using the Galaxy 6 RTK manufactured by South Surveying & Mapping Instrument Co., Ltd. located in Guangzhou, China boasting a positioning accuracy of ±8 mm, and a total of 802 sample points covering all nine land-cover types were acquired during the field survey.
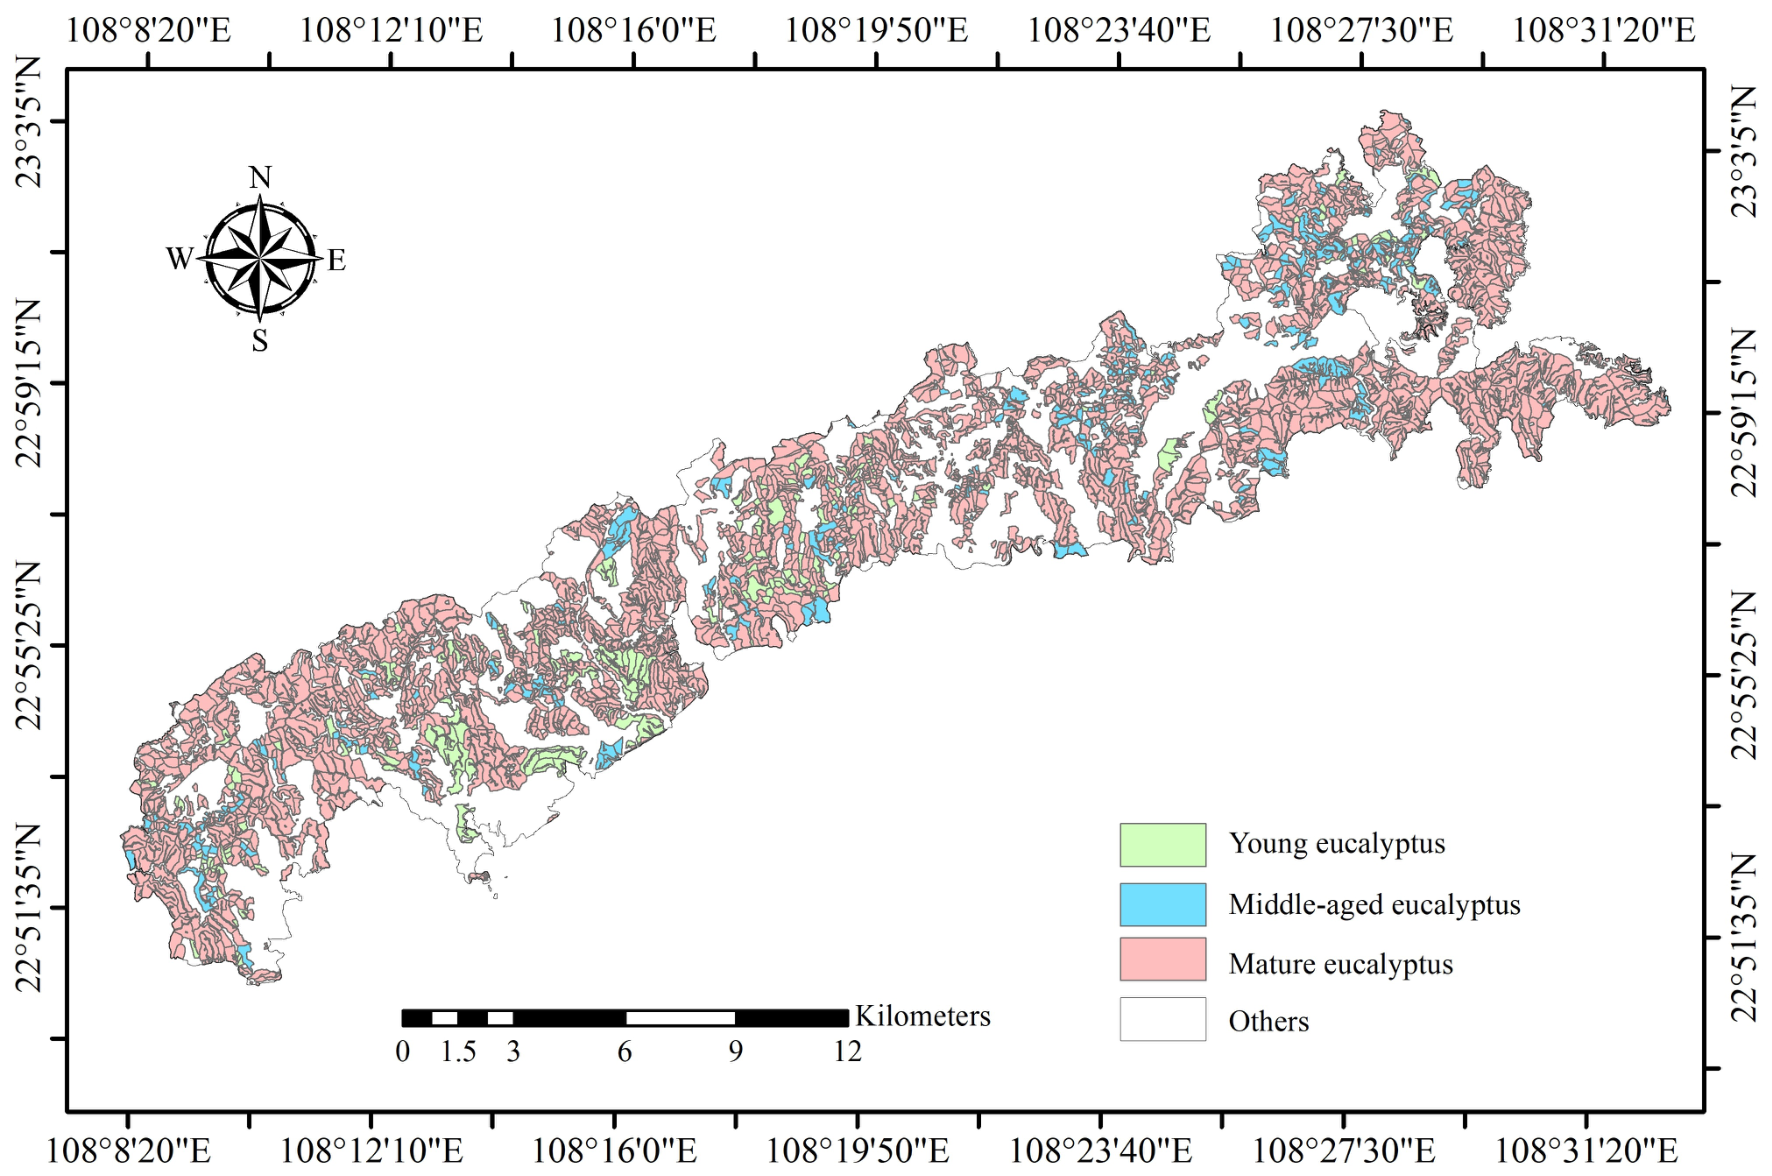
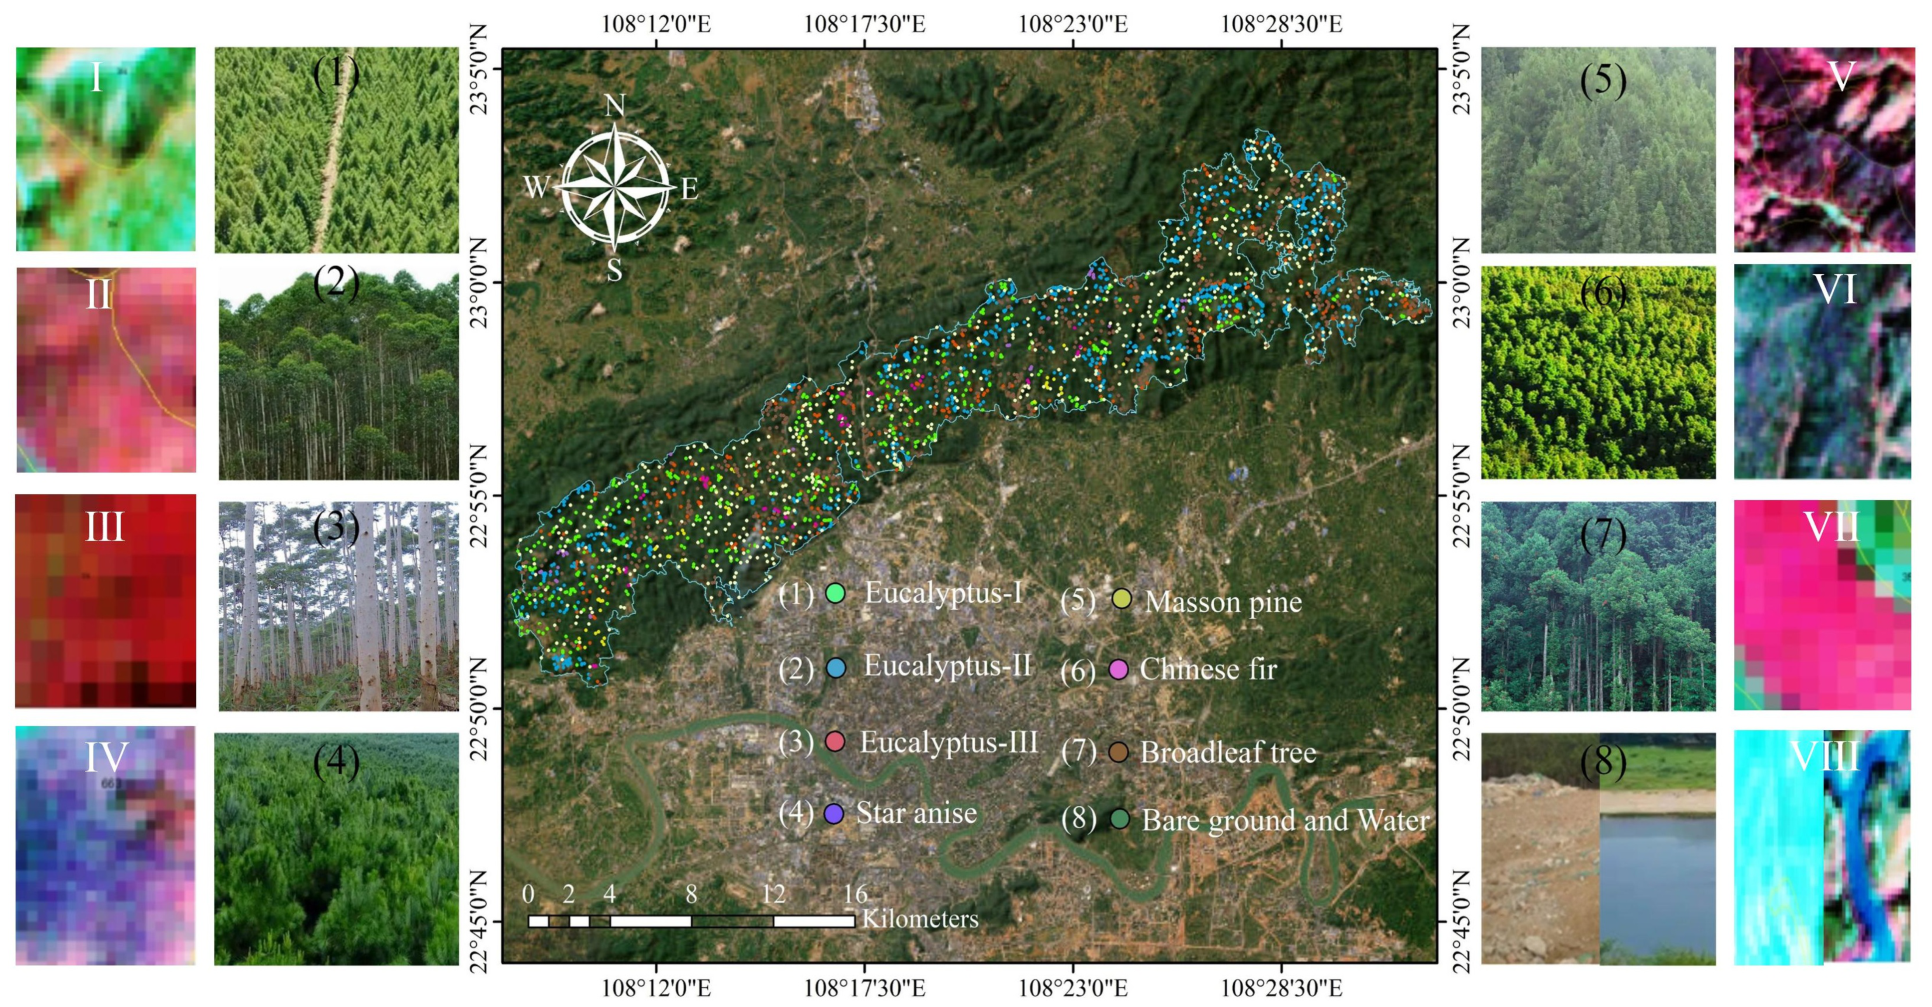
Due to accessibility constraints and the heavy workload associated with field surveys, the number of field-collected sample points required densification through visual interpretation. To ensure a uniform distribution of these additional sample points, 293 rectangular zones were first generated within the study area. Subsequently, Sentinel-2 imagery underwent standard false-color compositing (R: B7, G: B3, B: B2) and histogram equalization, which enhanced the visual distinctiveness of the land-cover types effectively. By correlating the 2020 forest stand map (Figure 2) and Sentinel-2 imagery with prior knowledge gained from field surveys, the relationships between eucalyptus maturity and the spectral characteristics in the Sentinel-2 imagery were established. Figure 3 I–VIII shows the spectral characteristics of young eucalyptus, middle-aged eucalyptus, mature eucalyptus, star anise (Illicium verum), Masson pine (Pinus massoniana), Chinese fir, broadleaf forest, water, and bare ground, respectively. Ultimately, a total of 9908 sample points were obtained through a combination of field surveys and visual interpretation, of which 802 were derived from field surveys, while 9106 were obtained via visual interpretation. Detailed information regarding these sample points is presented in Table 3. The spatial distribution of the sample points is shown in Figure 3. To verify the accuracy of the visual interpretation, 568 points were randomly selected from the 9106 points. Field verification demonstrates an extremely high accuracy of point selection by visual interpretation.

2.3.2. Block Sample Construction for Deep Learning Models

Currently, there is no readily available set of eucalyptus maturity block samples that can be used directly. Compared to other typical land features (such as man-made structures, water bodies, and farmland), high-precision sample annotation for eucalyptus is time-consuming and labor-intensive. This is mainly attributed to the small spectral differences within eucalyptus plantations, the blurred boundaries between different tree species within the forest, and the tendency for pixel mixing.
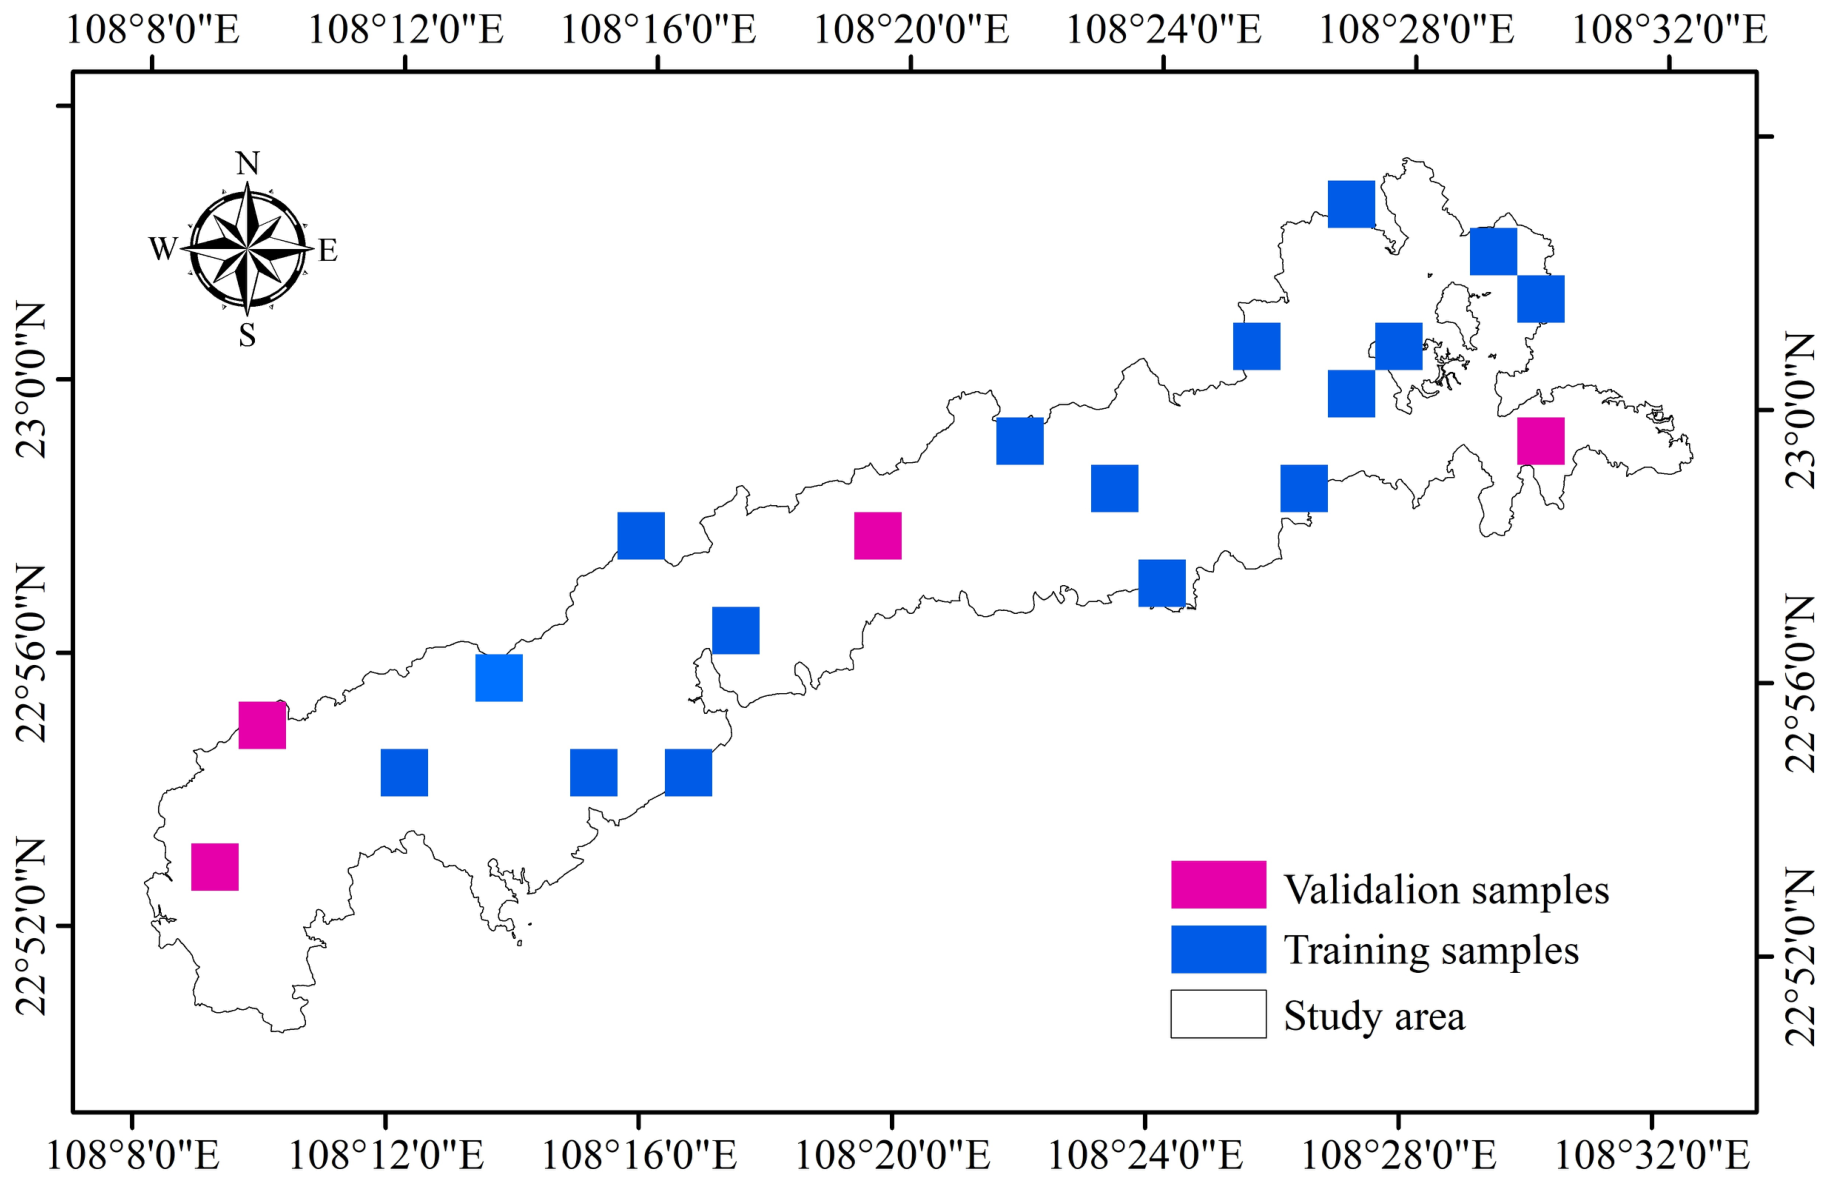
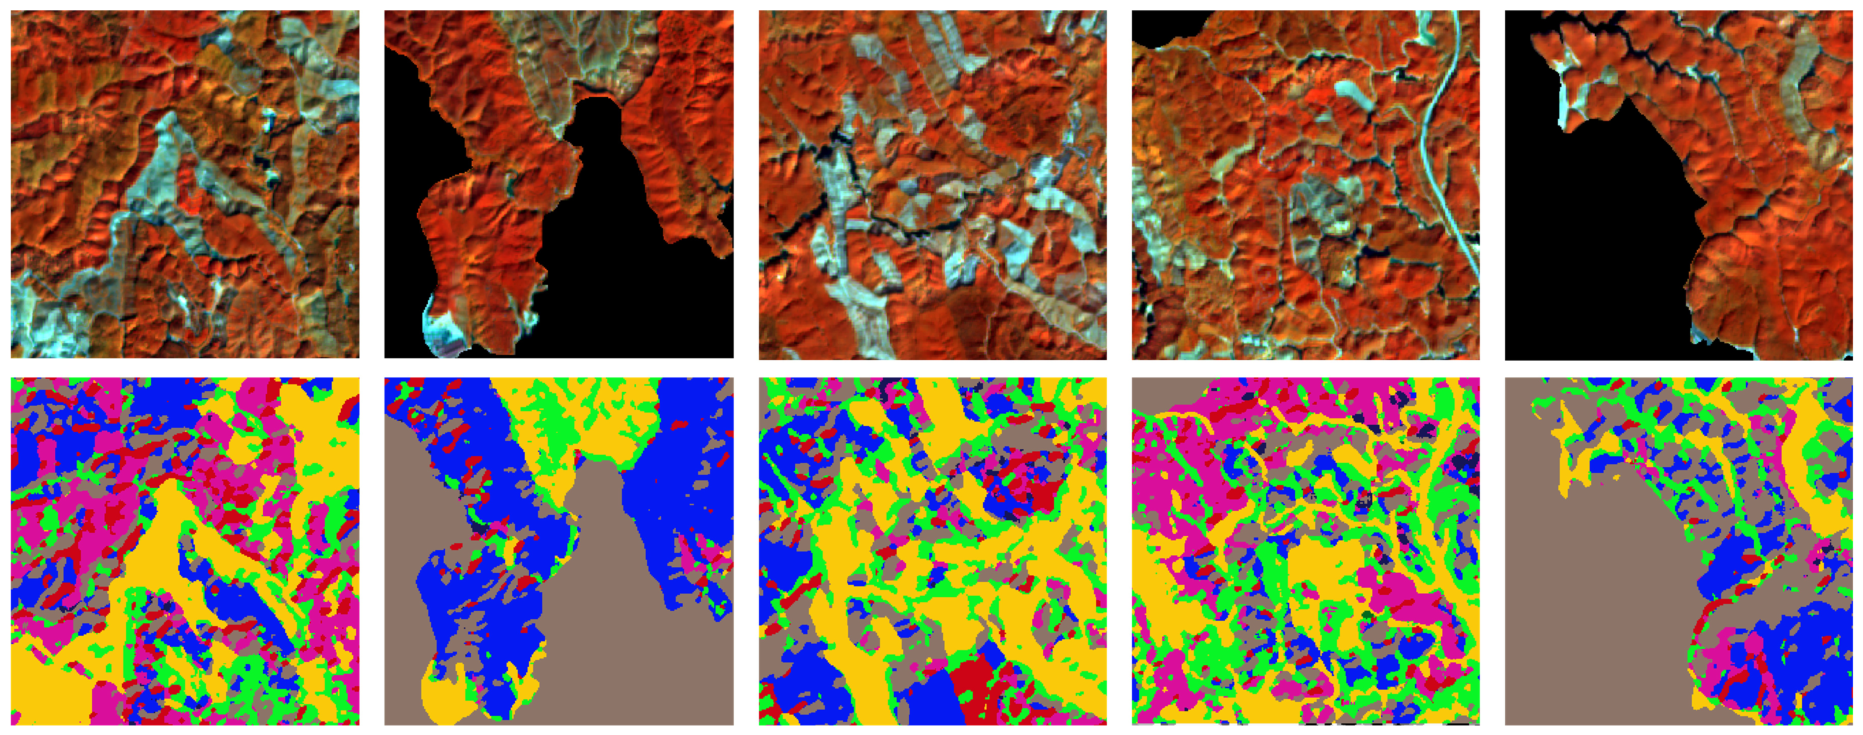
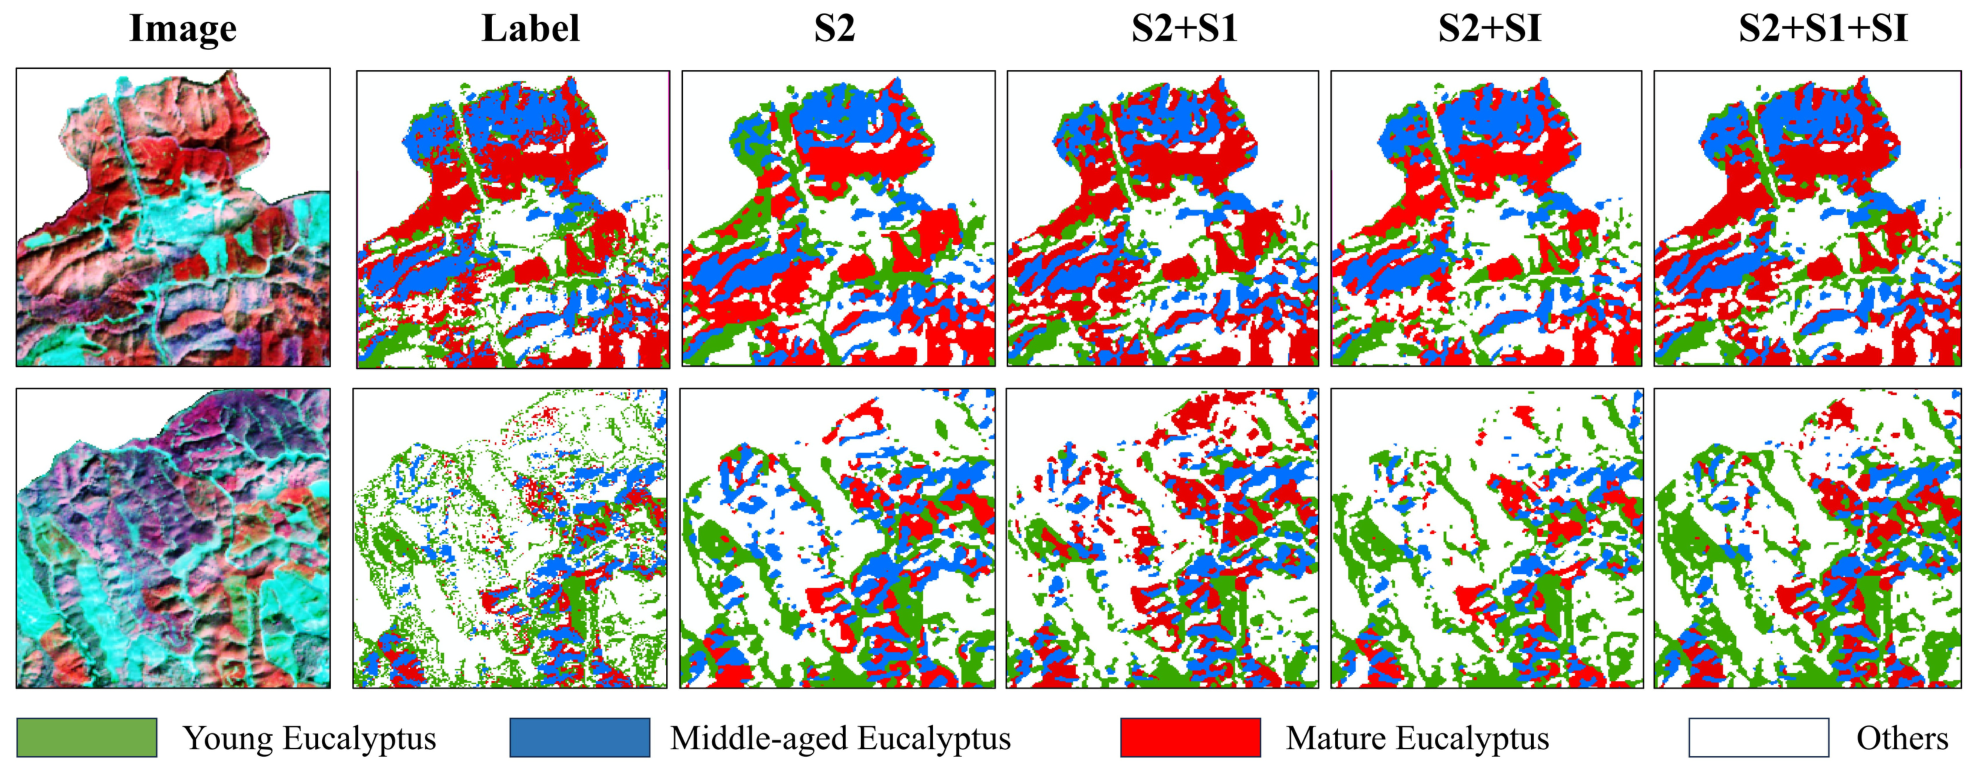
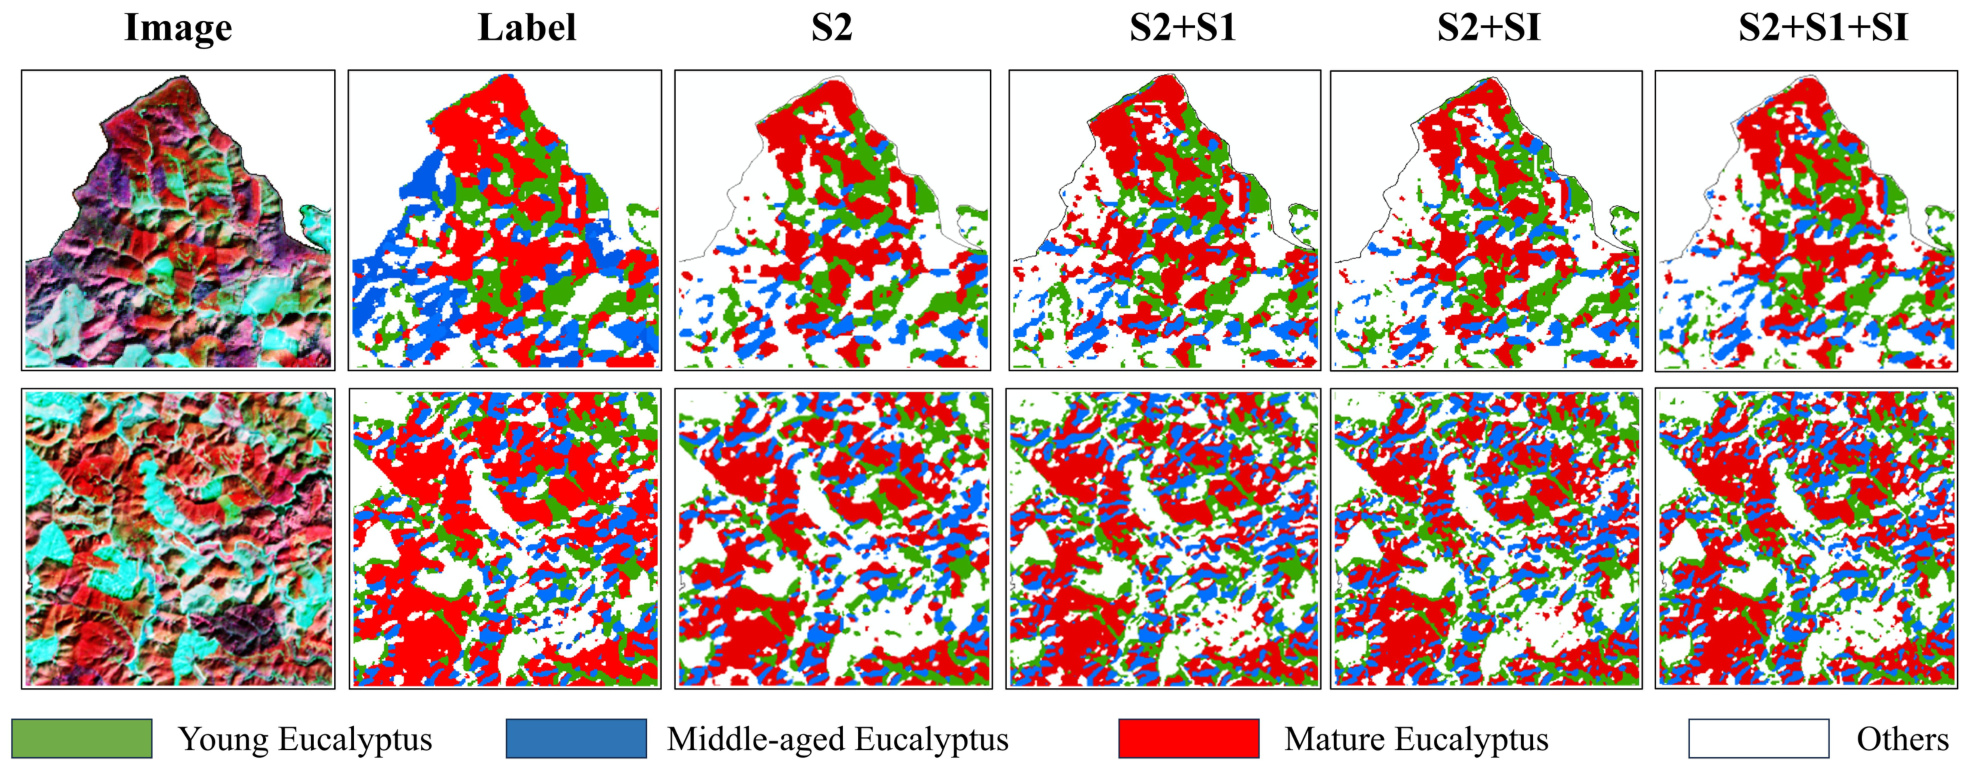
As is shown in Figure 4, this study selected 20 sub-regions within the study area, each measuring 800 × 800 pixels, and evenly distributed within the study area. To efficiently acquire a sufficient number of labeled samples, Gaofen-2 multispectral imagery with a spatial resolution of 1 m was obtained from the China Resources Satellite Application Center (https://data.cresda.cn/#/home, accessed on 12 December 2025), and the Random Forest classifier and the collected point samples were employed to classify the land-cover types for each of the 20 sub-regions. The categories are detailed in Table 3. Postprocessing was then conducted on the classification maps to remove salt-and-pepper noise and correct the misclassification results using ArcGIS 10.8 and ENVI 5.3. Subsequently, six land-cover types—Chinese fir, bare land, water bodies, Masson pine, star anise (Illicium verum), and broadleaf forest—were merged into a single “others” category. Among the 20 sub-regions, 16 were used for model training and the remaining 4 for validation. A total of 254 masks of 256 × 256 pixels were generated from the 20 sub-regions through sliding-window cropping and data augmentation, including translation, flip, and brightness adjustment. These masks were then resampled to a spatial resolution of 10 m. By acquiring the corresponding remote sensing images (i.e., S2, S2+S1, S2+SI, and S2+S1+SI) for these regions, block samples for deep learning were constructed. Figure 5 presents some of the block samples.

3. Method

3.1. The Methodological Framework

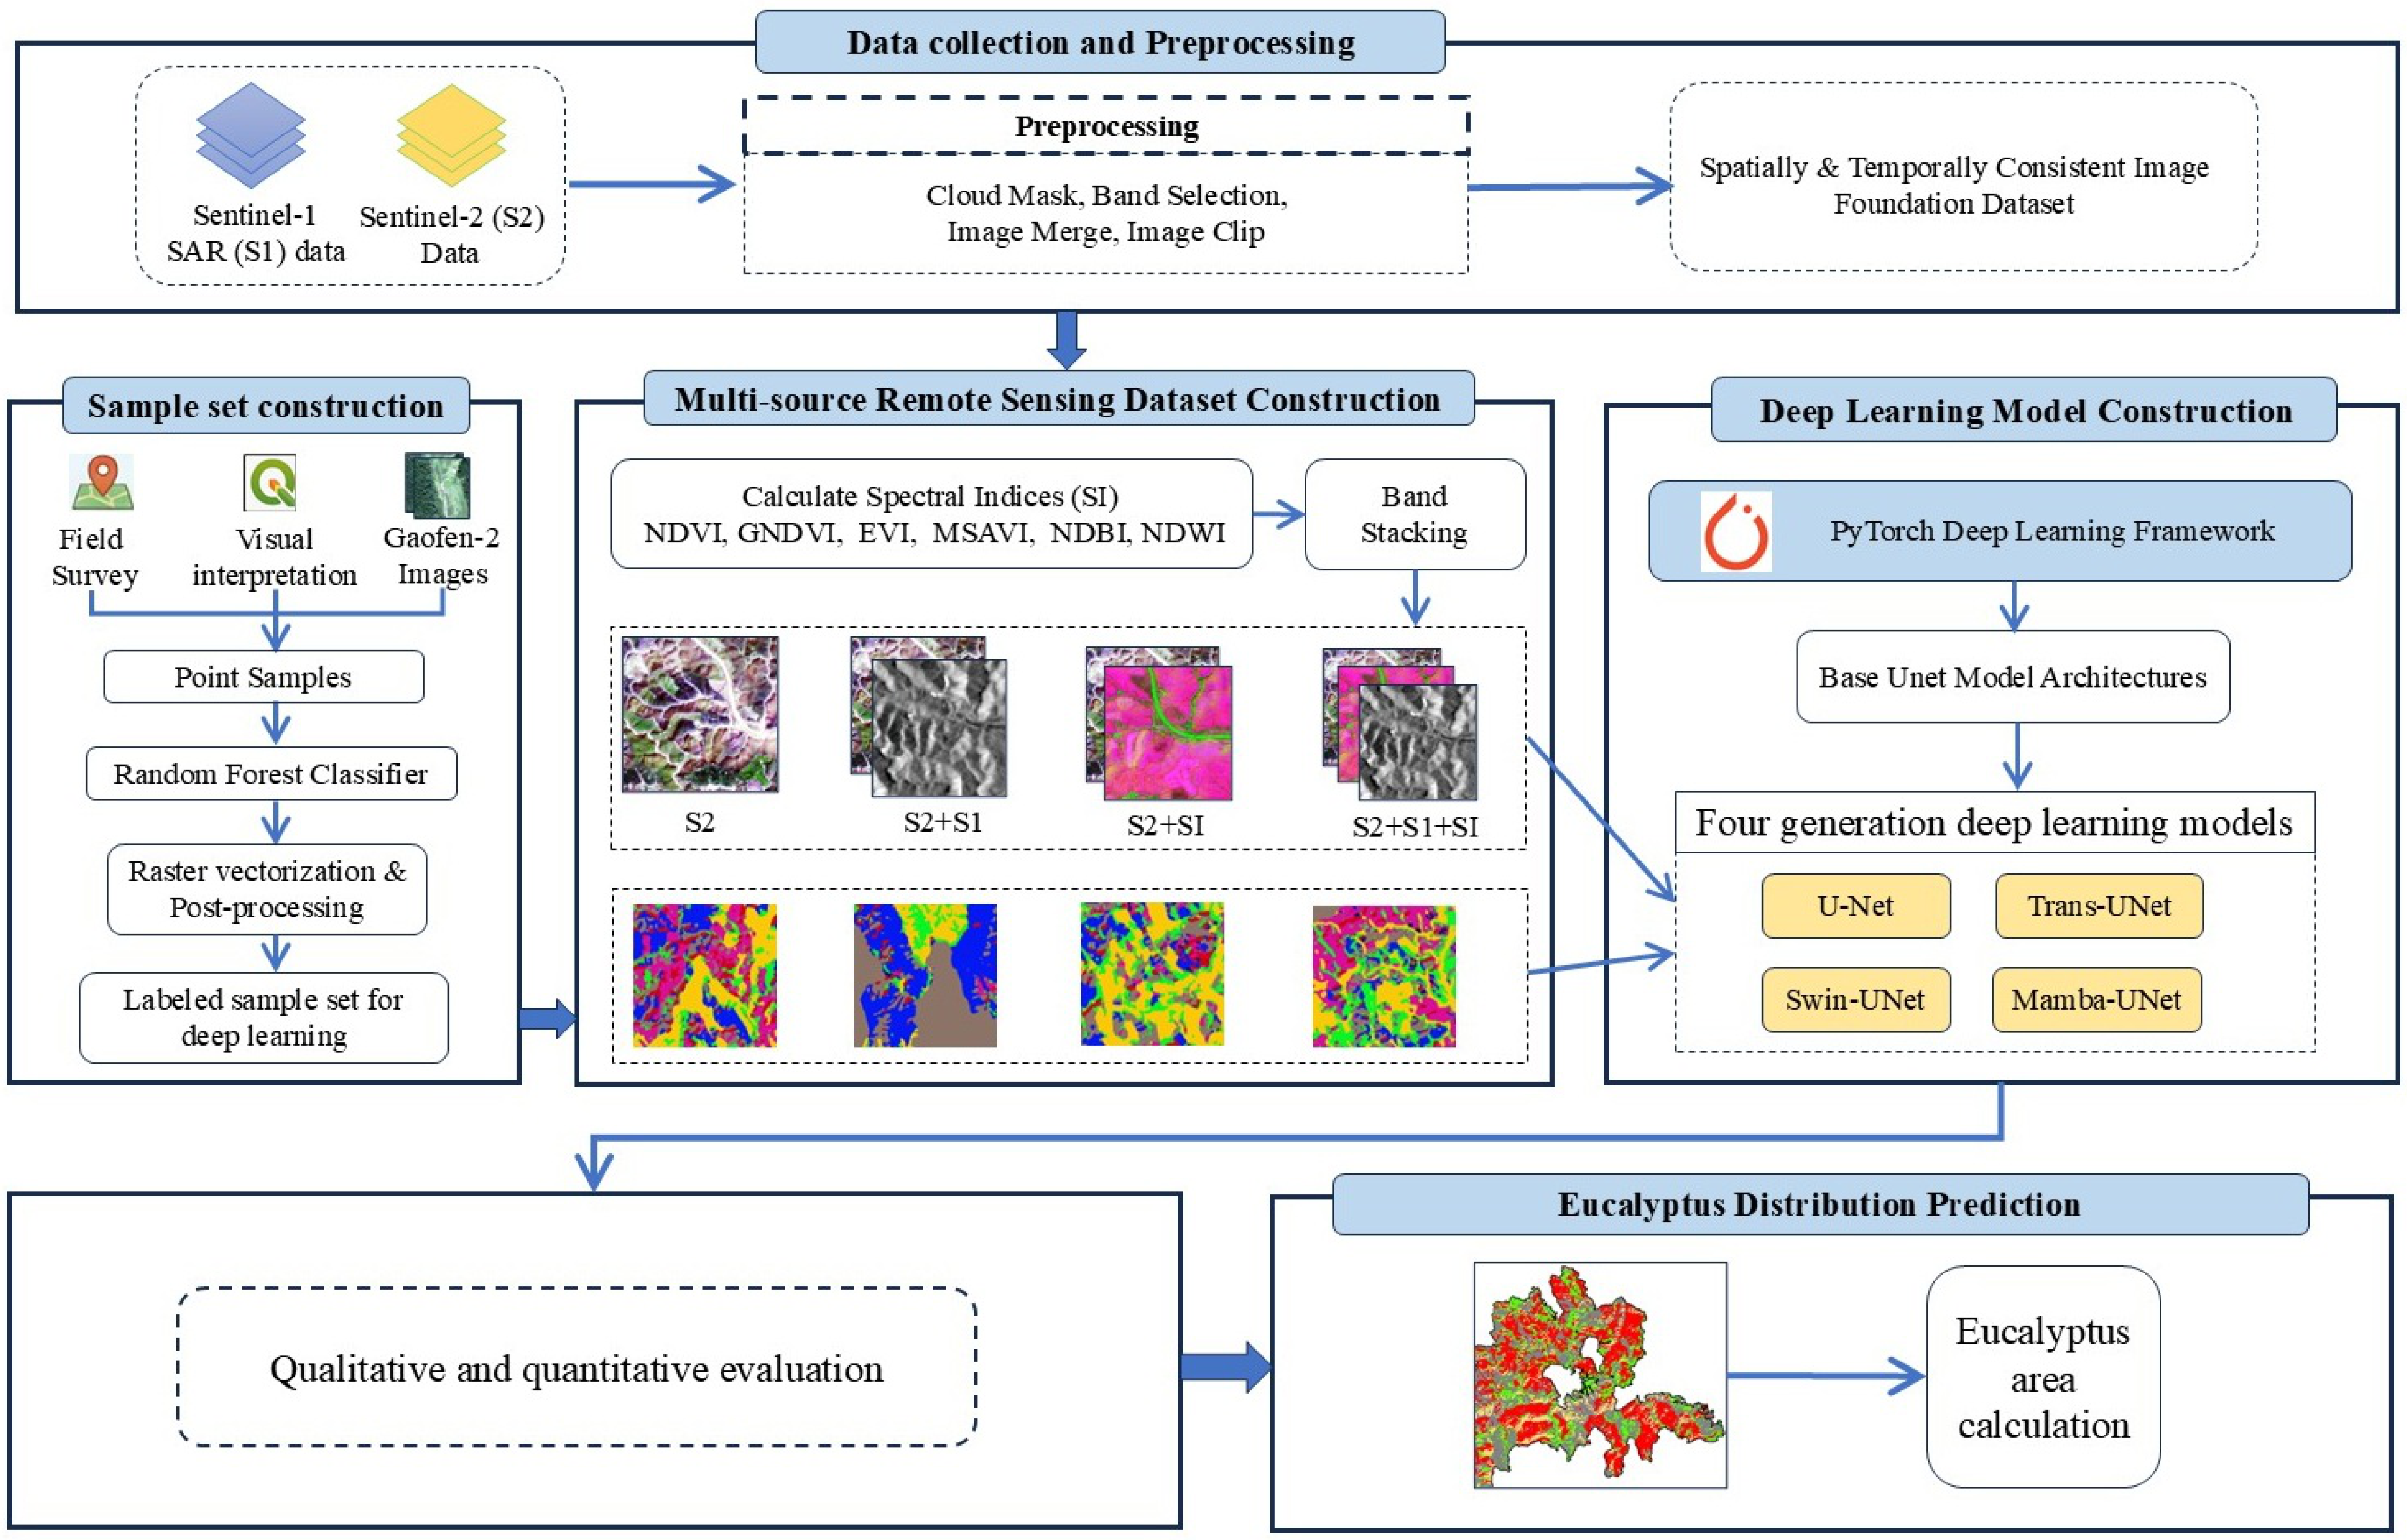
Figure 6 illustrates the technical workflow developed in this study for identifying eucalyptus stands based on multimodal data and deep learning models. First, multimodal data—including Sentinel-1 C-band SAR imagery and Sentinel-2 multispectral imagery—was collected. Detailed information regarding this data is presented in Table 1. The remote sensing imagery underwent preliminary processing steps, including cloud removal, band selection, image fusion, and cropping. Second, spectral indices were calculated based on the Sentinel-2 data, thereby enabling the construction of a comprehensive multimodal remote sensing dataset. Building upon the ground truth data obtained during field surveys, a sufficient number of sample points were generated through intensive visual interpretation to serve as training samples. These block samples were subsequently generated by employing traditional machine learning algorithms and postprocessing techniques. Utilizing the multimodal remote sensing data and the generated labeled block samples, a dataset was constructed to train four distinct deep learning models. The results underwent rigorous validation—including both cross-validation and independent accuracy verification. Finally, the distribution of eucalyptus stands across various maturity levels within the Gaofeng Forest Farm was quantified, thereby revealing the spatial distribution characteristics of eucalyptus resources in Gaofeng Forest Farm, Nanning, Guangxi.

3.2. Deep Learning Models Employed in This Study

In recent years, deep learning technology has advanced rapidly, with model architectures undergoing continuous iteration. Over the decade spanning 2015 to 2024, models such as U-Net [28,29,30,31,32,33], Trans-UNet [34,35,36], Swin-UNet [37,38,39,40], and Mamba-UNet [41,42,43] have been successively proposed and have been widely applied across fields including medicine, agriculture, forestry, and disaster monitoring. These four models encompass four major technical paradigms—convolutional, hybrid convolutional–Transformer, pure Transformer, and state-space sequence models—thereby aligning with the iterative evolutionary trajectory of deep learning algorithms for image segmentation. Currently, there has been no systematic analysis regarding the performance of these four models in industrial applications; in particular, their efficacy in identifying the maturity of eucalyptus plantations remains unexplored. Consequently, there is an urgent need to conduct relevant research to analyze, from multiple perspectives, the adaptability, applicable scenarios, and performance limitations of these distinct network architectures within the context of multimodal data segmentation tasks for eucalyptus maturity assessment. Table 4 presents the details regarding these four deep learning models.
A computer equipped with an Intel Xeon CPU and an NVIDIA GeForce RTX 3090 GPU is used in this study. The deep learning framework adopts PyTorch 2.7.0, and CUDA 12.6 and cuDNN 9.10.2.21 are employed for GPU acceleration to improve the efficiency of model training. The size of the block samples is 256 × 256 pixels. The batch size is set to 8, which fully utilizes the GPU memory resources while ensuring the stability of model training. The sliding step of image cropping is set to 128 to realize the full coverage prediction of large-scale remote sensing images and avoid the loss of regional features. All models are trained for 200 epochs to ensure full convergence and fully learn the feature representation of eucalyptus maturity. The Adam optimizer was selected with an initial learning rate of 0.0001. To dynamically optimize the learning rate during training, the ReduceLROnPlateau learning rate scheduler is used, with the mode set to min, patience set to 5, and attenuation factor set to 0.5. For the loss function, Cross-Entropy (CE) combined with Dice Loss was used. This loss function not only optimizes the pixel-level classification error but also effectively alleviates the problem of sample imbalance in forest remote sensing image segmentation, as well as significantly improving the identification accuracy of eucalyptus maturity regions. The detailed training parameters are shown in Table 5.

3.3. Accuracy Assessment

To comprehensively evaluate the learning ability, generalization performance, and final mapping accuracy of deep learning models, this study adopts a two-layer accuracy evaluation system that combines internal model validation with independent field sample validation. (1) During the model training phase, the labeled samples were divided into a training set and a validation set according to their proportion. The accuracy indicators of the training set and the validation set were recorded and analyzed for model comparison and optimization. (2) In order to objectively reflect the reliability of the deep learning model in predicting the maturity of eucalyptus trees, this study used field survey point samples that were completely independent of the model’s training set to independently verify the accuracy of the prediction results. Both phases used five evaluation metrics: Overall Accuracy (OA), Mean Intersection over Union (MIoU), Precision, Recall, and F1-score. All these metrics were calculated based on the confusion matrix, and the equations are shown in Equations (1)–(5). For each class i (e.g., different eucalyptus maturity stages and backgrounds), four fundamental elements were defined: true positives ( T P i ), which represent the number of pixels correctly classified as class i; false positives ( F P i ), representing pixels incorrectly classified as class i; false negatives ( F N i ), representing pixels belonging to class i but classified as another class; and true negatives ( T N i ), representing pixels correctly classified as not belonging to class i.
OA = i = 1 N T P i i = 1 N ( T P i + F N i )
MIoU = 1 N i = 1 N T P i T P i + F P i + F N i
Precision = 1 N i = 1 N T P i T P i + F P i
Recall = 1 N i = 1 N T P i T P i + F N i
F 1 - Score = 1 N i = 1 N 2 × Precision i × Recall i Precision i + Recall i

4. Results and Analysis

4.1. Separability Verification of Eucalyptus Maturity Based on Remote Sensing Data

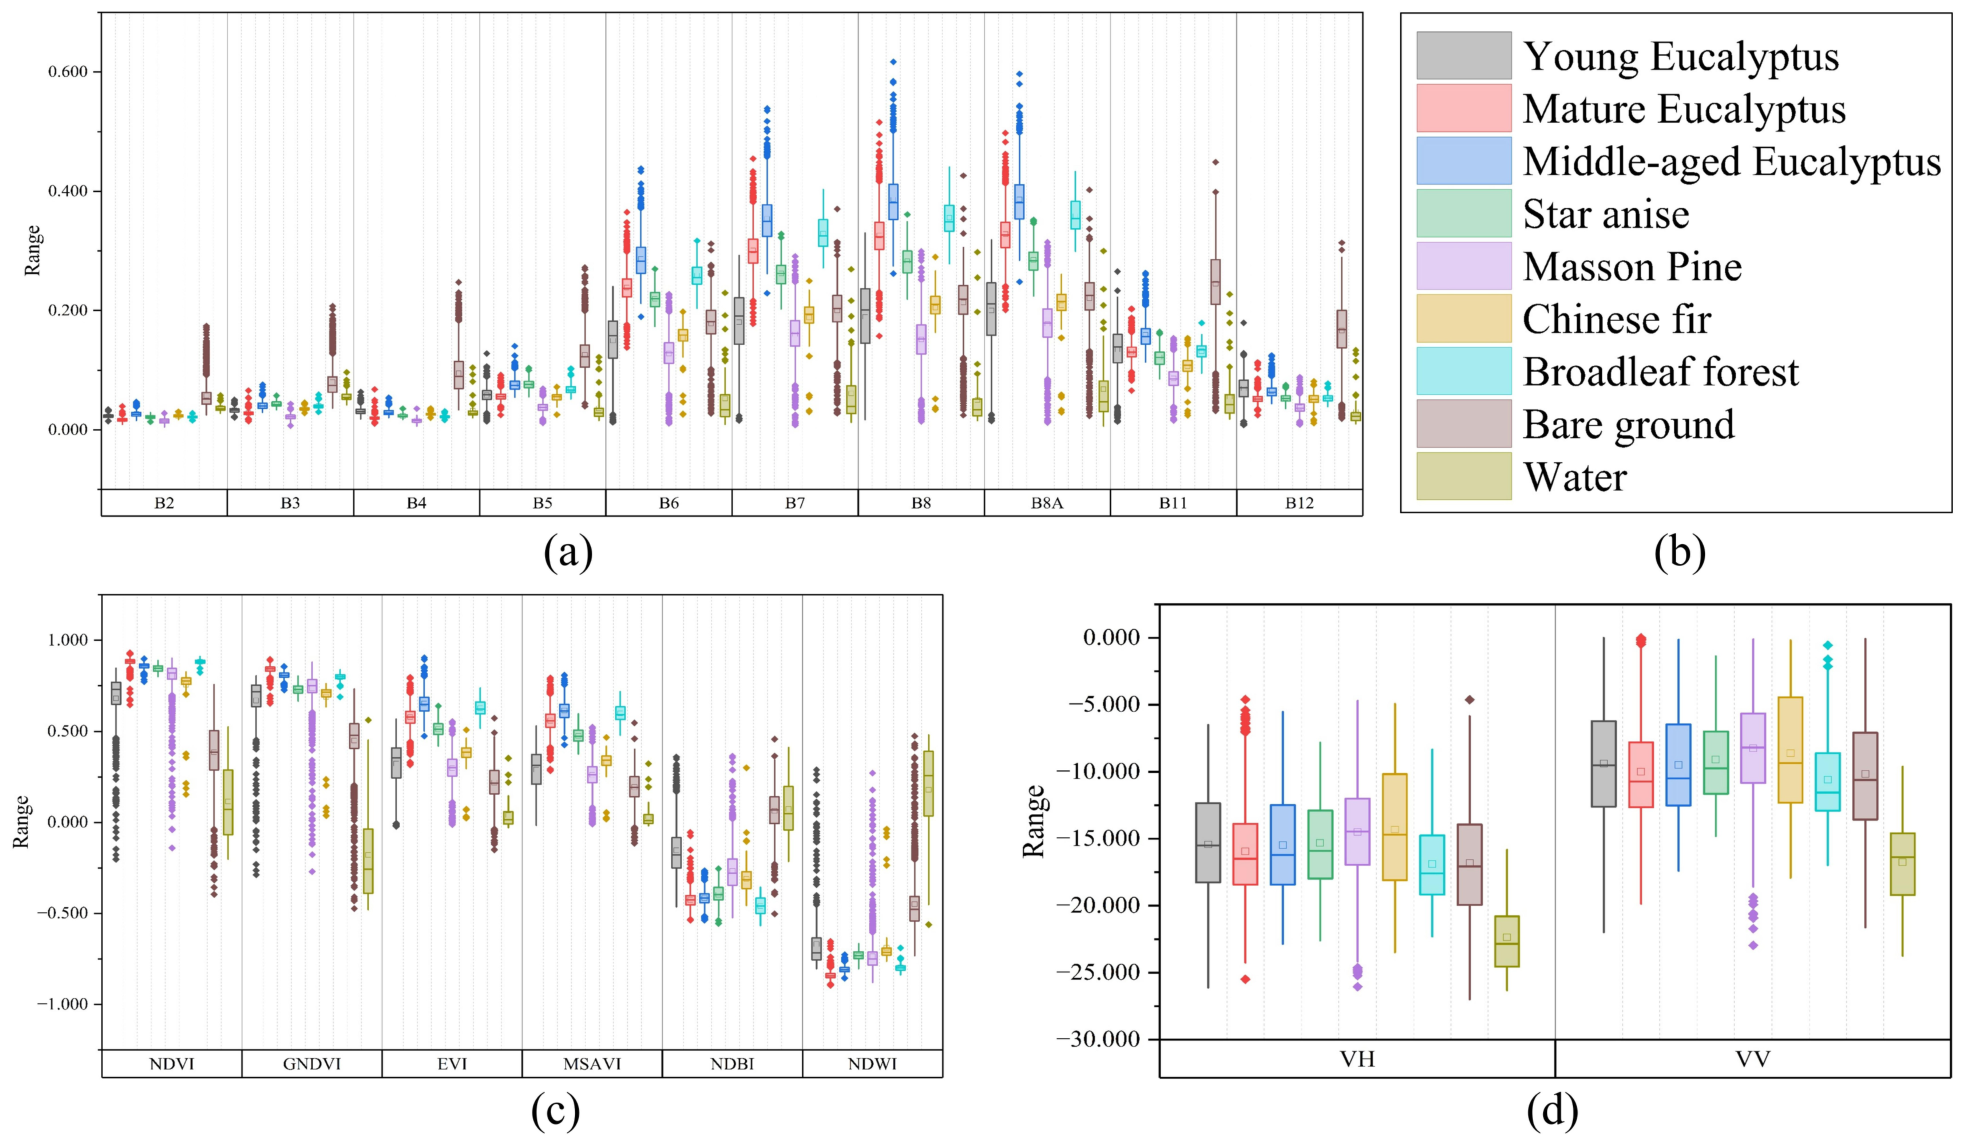
This study analyzes the eucalyptus maturity separability of the multi-source remote sensing data in the study area by statistically examining the pixel values of the 9908 sample points (Figure 3). (1) Spectral Reflectance Characteristics: Figure 7a shows the nine land covers’ spectral reflectance in Sentinel-2’s ten bands. In visible bands (B2–B4), vegetation reflectance is low (0–0.2), with small differences between eucalyptus maturity stages. In red-edge/near-infrared bands (B5–B8A), vegetation reflectance rises sharply; the B6–B8 bands show distinct gradients for mature > middle-aged > young eucalyptus, linked to canopy structure, LAI, and chlorophyll differences. In shortwave infrared bands (B11–B12), reflectance decreases but eucalyptus maturity remains distinguishable. (2) Vegetation Indices for Enhanced Differentiation: Six spectral indices (NDVI, GNDVI, EVI, MSAVI, NDBI, NDWI) (Figure 7c) amplify vegetation differences. Vitality-related indices show a clear gradient (mature > middle-aged > young eucalyptus), reflecting canopy and photosynthetic differences. NDWI and NDBI separate eucalyptus from bare land/water while preserving maturity differences, compensating for original spectral limitations. (3) Sentinel-1 Radar Backscattering Coefficient: Figure 7d shows Sentinel-1 dual-polarization (VH, VV) backscattering. VH polarization (−15 to −10 dB) shows eucalyptus has higher backscattering than bare land/water, with mature > middle-aged > young gradients (linked to biomass/canopy complexity). VV polarization has smaller but still distinguishable differences, supplementing optical data especially under cloud cover. (4) Multi-Source Data Fusion Verification: Combined Sentinel-2 bands, spectral indices, and Sentinel-1 data show the following: optical bands distinguish vegetation/non-vegetation but not eucalyptus maturity; spectral indices amplify physiological differences; and radar bands complement with canopy/biomass info, enhancing maturity separability.

4.2. Prediction Results

4.2.1. The Performance of U-Net in Eucalyptus Maturity Identification

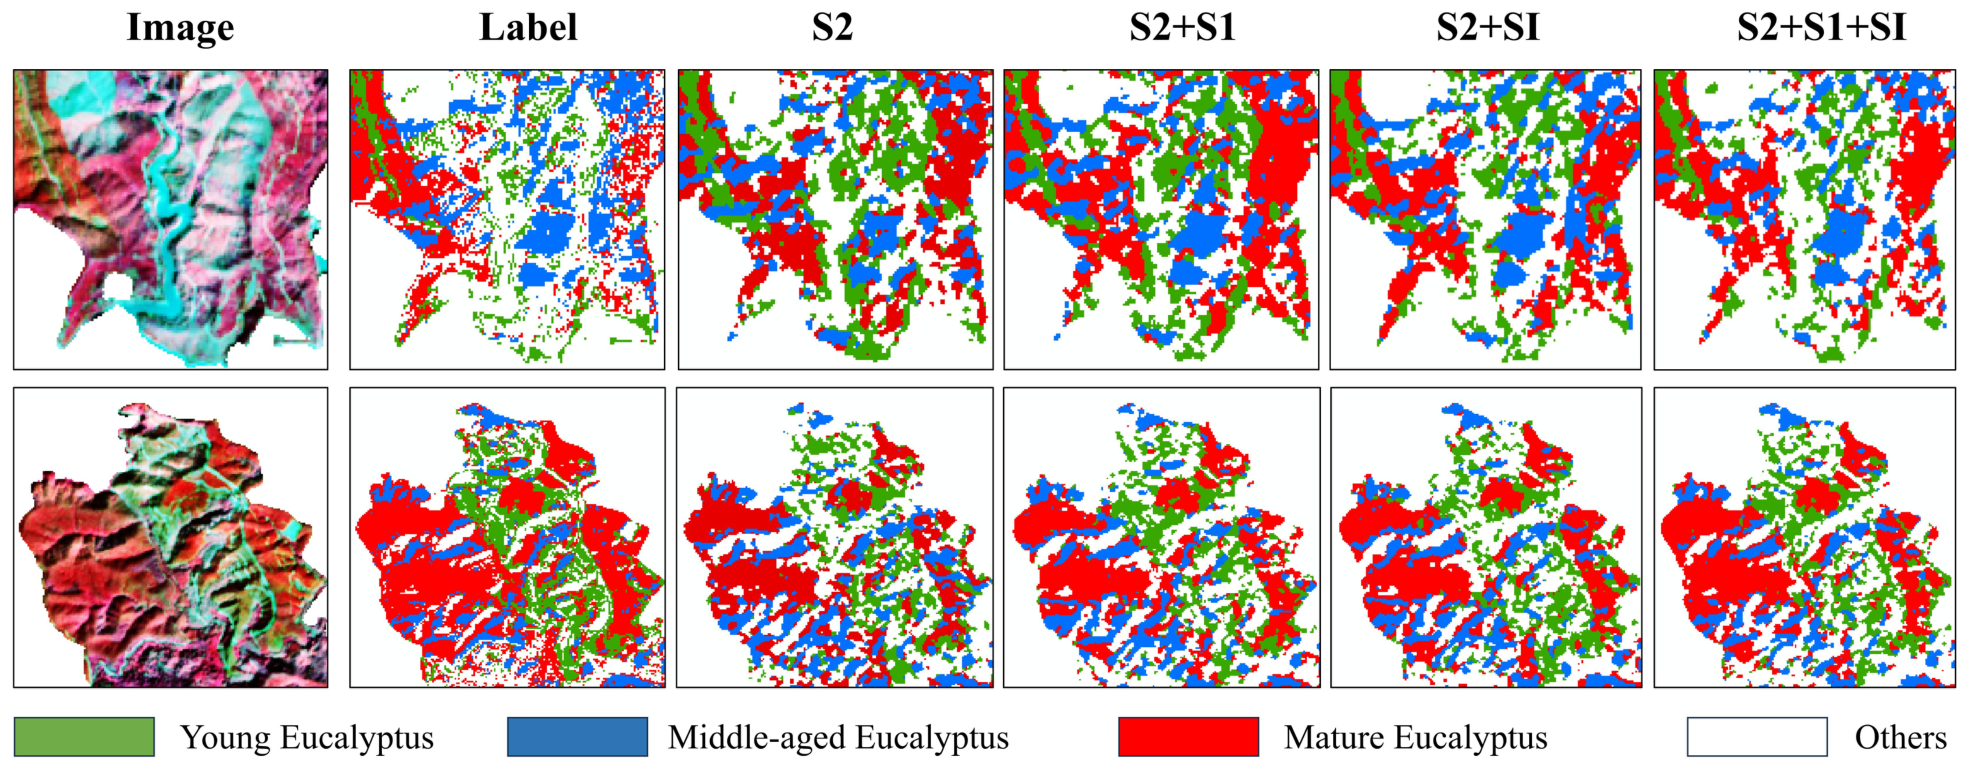
Figure 8 presents the results of eucalyptus maturity recognition using the U-Net model in the Gaofeng Forest Farm. It can be observed that the classification results obtained using the S2 dataset alone exhibit severe fragmentation of patches and significant “salt-and-pepper” noise, with blurred boundaries between middle-aged and mature eucalyptus stands. Upon the inclusion of S1 data (S2+S1), patch connectivity improved, as the SAR information effectively suppressed misclassifications caused by spectral heterogeneity. The S2+SI combination yielded the optimal results, characterized by natural class transitions and high patch integrity within the mature forest stands. The full feature fusion approach (S2+S1+SI) suffered from feature redundancy and achieved inferior classification performance.
The quantitative evaluation results are presented in Table 6. Across both the training and validation sets, the S2+SI dataset consistently outperformed all other datasets across all five accuracy metrics. Specifically, within the S2+SI validation set, the Overall Accuracy (OA), Mean Intersection over Union (MIOU), Precision, Recall, and F1-Score reached 91.08%, 76.41%, 86.40%, 86.73%, and 86.16%, respectively—all of which exceeded the corresponding values for the other datasets. The MIOU for the S2-only dataset stood at 75.18%; the addition of spectral index information resulted in a 1.23% increase in MIOU. However, the inclusion of S1 radar data—compared to using S2 alone—led to a 1.81% decrease in the validation set’s MIOU, bringing it down to 73.37%. Furthermore, in the S2+S1+SI validation set, the MIOU declined even further relative to the S2+S1 combination, dropping by 1.23% to 72.14%. The remaining accuracy metrics—including OA, Precision, Recall, and F1-Score—exhibited this same pattern. In summary, when employing the U-Net model for eucalyptus maturity classification, the accuracy performance of the various datasets follows the following ranking: S2+SI > S2 > S2+S1 > S2+S1+SI.

4.2.2. The Performance of Trans-UNet in Eucalyptus Maturity Identification

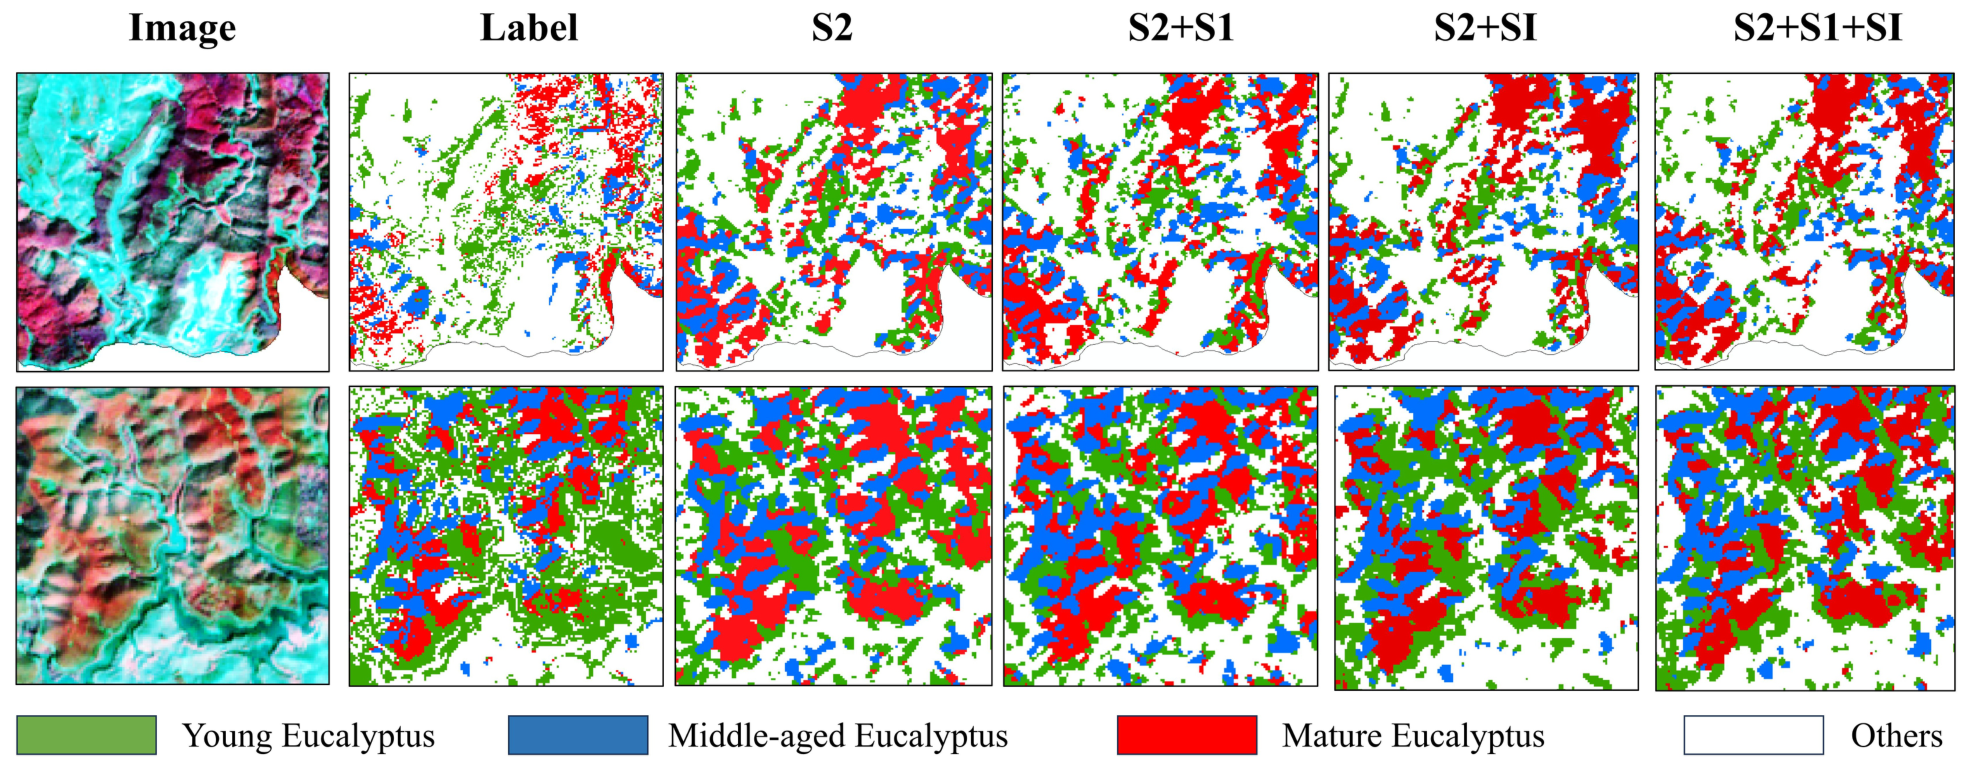
The results of the eucalyptus maturity recognition in the Gaofeng Forest Farm using Trans-UNet are presented in Figure 9 and Table 7. Compared to U-Net, all five accuracy metrics for Trans-UNet showed a decline to varying degrees. However, S2+SI remained the optimal configuration, yielding a validation set mIoU of 71.05%—a decrease of 5.36% compared to U-Net (76.41%). This phenomenon suggests that in the context of eucalyptus maturity recognition, Trans-UNet’s global self-attention mechanism failed to effectively capture long-range dependency features, and its architecture demonstrated insufficient capability in extracting local details from multi-source remote sensing imagery.
Notably—and in contrast to the U-Net model—when utilizing Trans-UNet for eucalyptus maturity recognition, the S2+S1 configuration yielded improvements across all five accuracy metrics compared to using S2 data alone; specifically, the mIoU reached 67.94%, representing an increase of 5.00%. Furthermore, the addition of spectral data (SI) to the S2+S1 dataset resulted in a further 1.09% improvement in the validation set mIoU, bringing it to 69.03%. However, it is worth noting that the accuracy of the full-feature data fusion (S2+S1+SI) on the validation set remained lower than that of the S2+SI dataset, although it was significantly higher than the S2 and S2+S1 datasets; this indicates the presence of a “negative fusion effect.” The performance ranking across the four datasets is as follows: S2+SI > S2+S1+SI > S2+S1 > S2. This specifically demonstrates that while Trans-UNet possesses a certain capacity for cross-modal feature decoupling, it is unable to effectively perform feature mining within higher-dimensional data spaces.

4.2.3. The Performance of Swin-UNet in Eucalyptus Maturity Identification

Figure 10 illustrates the eucalyptus maturity recognition results obtained using the Swin-UNet model under various data configurations in the Gaofeng Forest Farm. Compared to U-Net and Trans-UNet, the recognition results from Swin-UNet exhibit clearer and smoother category boundaries, with significantly reduced salt-and-pepper noise and fragmented misclassified patches. Upon closer inspection, Swin-UNet provides a more accurate portrayal of the category heterogeneity within the eucalyptus forest, particularly in the transition zone between mature and middle-aged forests, where the segmentation contours are continuous and edges are smooth, effectively restoring the fine-scale distribution of tree crowns. Among different data configurations, the prediction results from the S2+SI and pure S2 configurations are overall the smoothest, with the least misclassification; although the S2+S1 and full-feature fusion configurations introduce a small amount of noise, their overall visual effects are still significantly better than those of U-Net and Trans-UNet under the same data conditions.
As can be seen from Table 8, Swin-UNet achieves accuracy rates exceeding 92.00% for OA on both the training and validation sets, surpassing U-Net and Trans-UNet. However, regarding the mIoU metric on the validation set, S2+SI achieves the highest value of 77.00%, followed by S2 at 75.80%—a decrease of 1.20%. S2+S1+SI attains an mIoU of 75.30%, representing a decrease of 1.70% compared to the use of the S2+SI dataset. S2+S1 performs the worst among the four datasets with an mIoU of 74.90%. The other four accuracy metrics exhibit the same trend. The accuracy performance across different datasets is ranked as follows: S2+SI > S2 > S2+S1+SI > S2+S1. This experiment demonstrates that the Transformer architecture can effectively extract multi-scale features and outperforms CNN and hybrid architecture models under various data configurations. Nevertheless, feature redundancy systematically degrades its accuracy. For eucalyptus maturity recognition tasks, Swin-UNet demonstrates a higher demand for high-quality optical features than for the fusion of multi-source heterogeneous features.

4.2.4. The Performance of Mamba-Unet in Eucalyptus Maturity Identification

Mamba-UNet demonstrated superior performance among all the models (Figure 11, Table 9) for eucalyptus maturity recognition in the Gaofeng Forest Farm. On the S2+SI validation set, its mIoU reached 79.10%—representing improvements of 2.69%, 8.05%, and 2.10% over the best-performing results achieved by U-Net, Trans-UNet, and Swin-UNet, respectively. Although the mIoU for Mamba-UNet’s S2+S1+SI configuration (78.55%) was slightly lower than that of the S2+SI configuration, the performance drop of 0.55% is markedly smaller than those observed in U-Net (4.27%), Trans-UNet (2.02%), and Swin-UNet (1.70%). This indicates that state-space models possess greater robustness against feature redundancy. The performance ranking across the four datasets is as follows: S2+SI > S2+S1+SI > S2+S1 > S2.
The core advantage of Mamba-UNet lies in its global modeling capability with linear computational complexity. Unlike Swin-UNet’s local window attention mechanism, the Mamba mechanism achieves true global contextual awareness through selective state-space modeling, thereby demonstrating superior discriminative power in addressing the prevalent issues of intra-class spectral variability and inter-class spectral similarity encountered in eucalyptus maturity classification. The F1-score for each configuration exceeded 87.18% (S2), with the S2+SI configuration reaching 88.26%.

4.2.5. Comprehensive Comparison of Eucalyptus Maturity Recognition

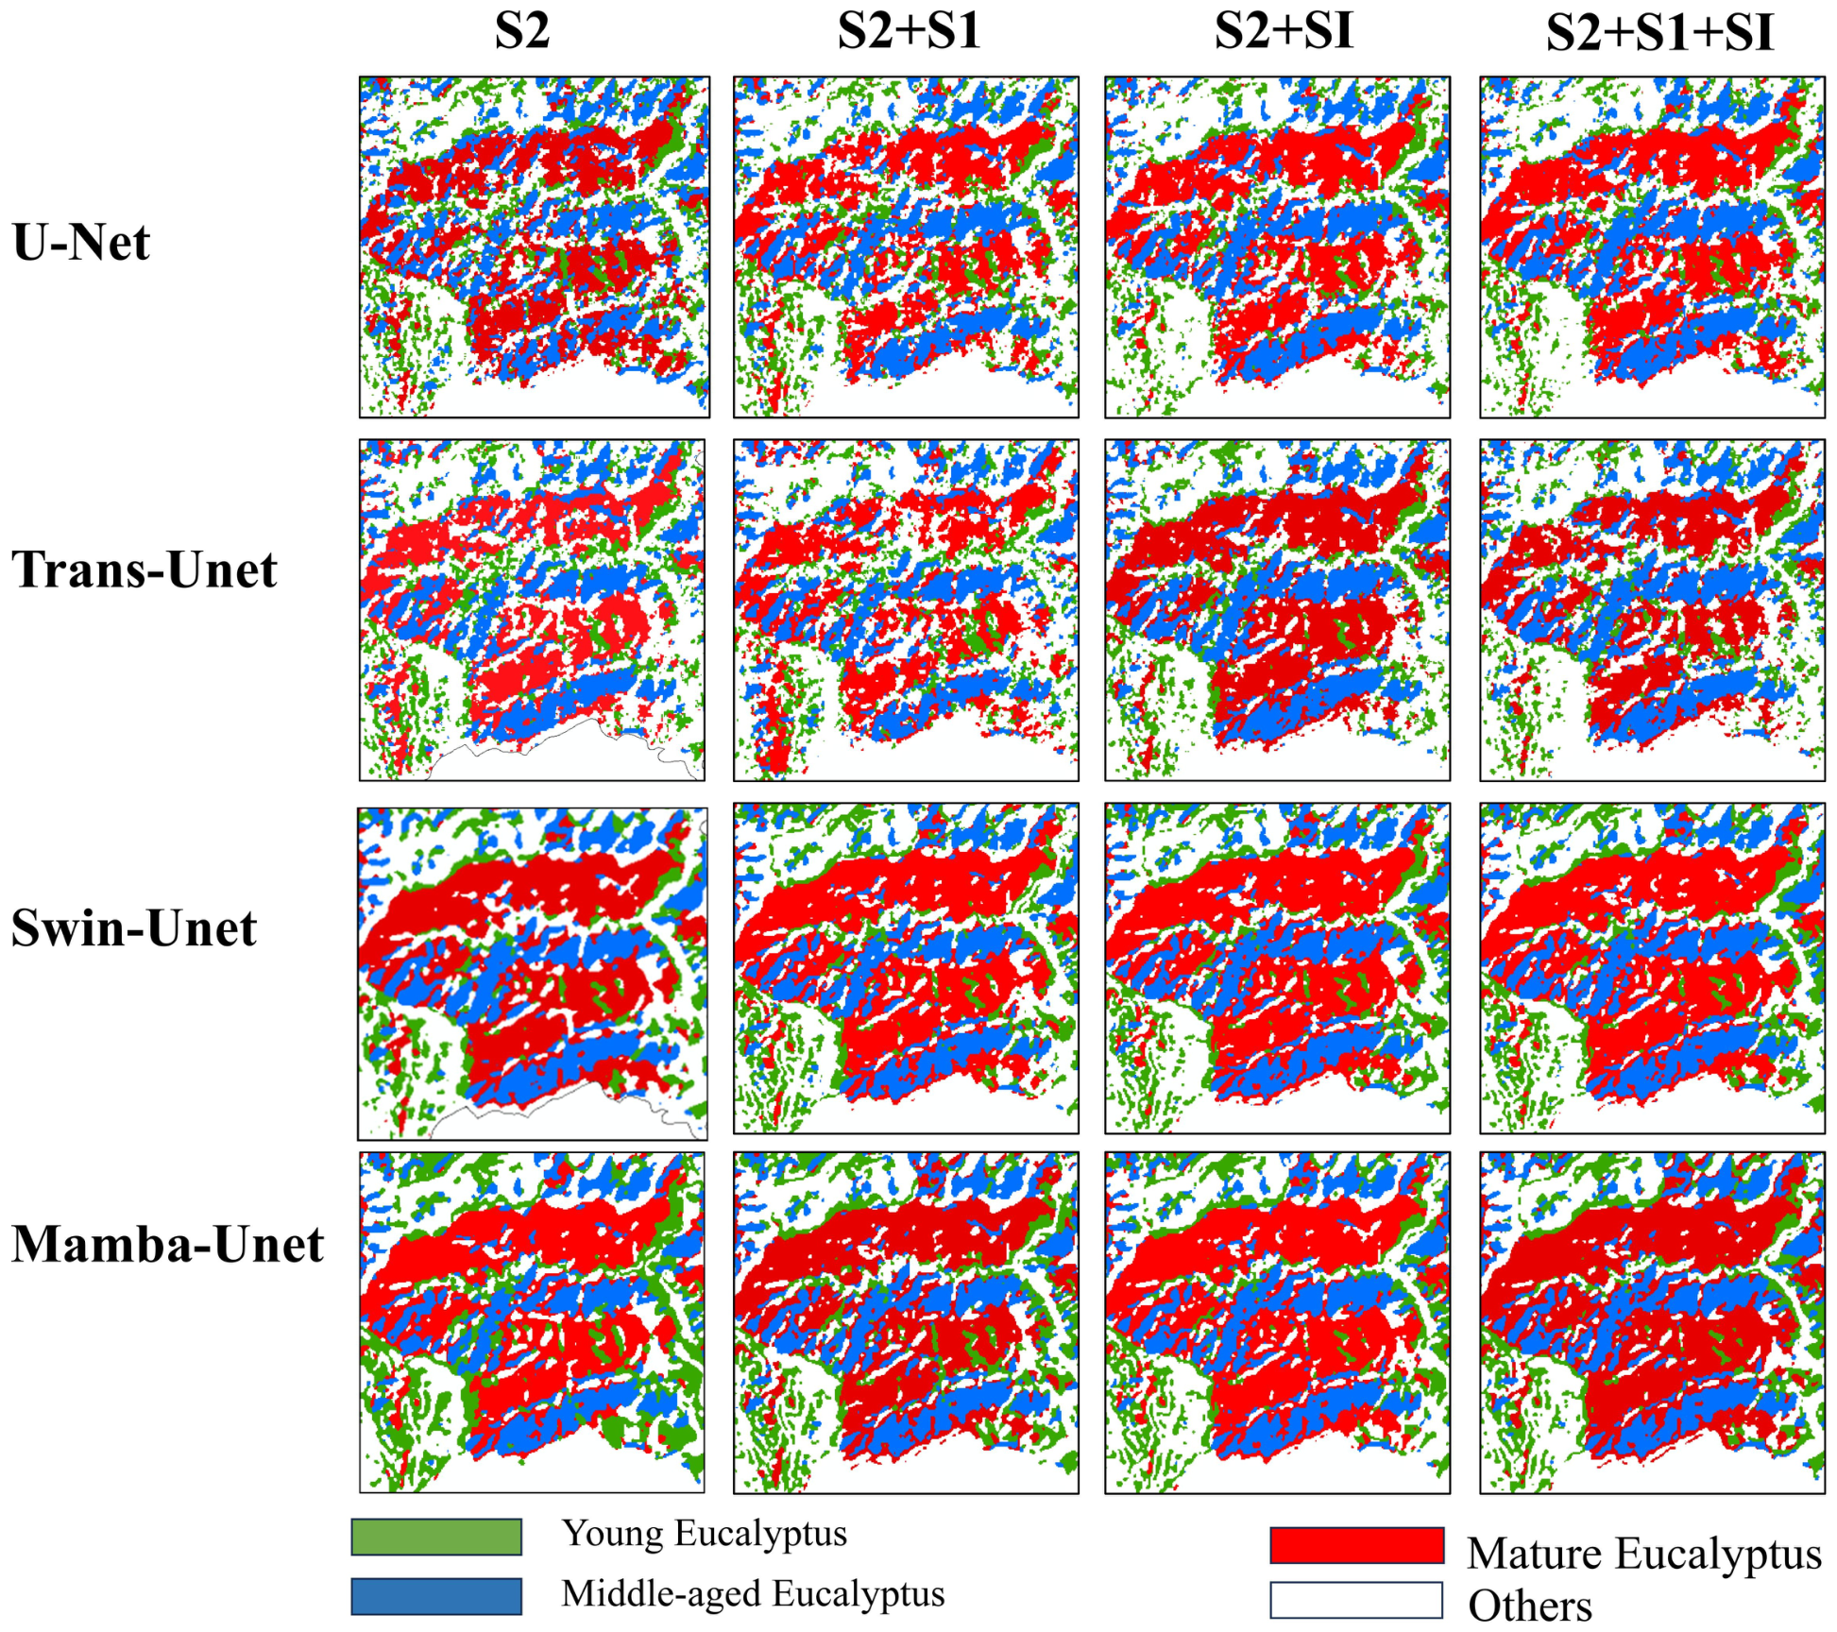
Figure 12 presents the classification results of eucalyptus stand maturity in the study area, obtained using four representative deep learning architectures—U-Net, Trans-UNet, Swin-UNet, and Mamba-UNet—in conjunction with four multimodal data configurations (S2, S2+S1, S2+SI, and S2+S1+SI).
Visually, U-Net exhibits severe salt-and-pepper noise and patch fragmentation, with blurred boundaries between middle-aged and mature stands. Although the S2+SI configuration yields relatively favorable outcomes, significant negative fusion effects are observed during full feature integration. Trans-UNet demonstrates the poorest performance; its global self-attention mechanism fails to effectively capture long-range dependencies, resulting in higher levels of noise and fragmentation than U-Net across all configurations, thereby confirming its deficiency in local detail extraction.
In contrast, Swin-UNet achieves marked improvement through shifted window attention, producing clear and smooth class boundaries with continuous contours in the young-to-mature transition zones and effectively restoring fine-scale canopy distribution. The S2 and S2+SI configurations yield the smoothest results; however, accuracy is still systematically compromised due to feature redundancy.
Mamba-UNet demonstrates the highest visual quality, achieving the best patch integrity, smoothest edges, and least noise across all configurations, with S2+SI delivering optimal performance. Notably, the S2+S1+SI configuration trails the best result by merely 0.55%, significantly outperforming the other models. This indicates that the selective state-space model achieves genuine global contextual awareness with linear computational complexity, exhibiting the strongest suppression capability and robustness against redundant information in heterogeneous multi-source features.
Overall, the model performance ranking is Mamba-UNet > Swin-UNet > U-Net > Trans-UNet, with the optimal dataset configuration being S2+SI. As model architectures evolve from CNNs to state-space models, resistance to feature redundancy improves substantially, while the adverse effects of multimodal data fusion gradually diminish.

4.2.6. Independent Accuracy Verification and Area Calculation

To objectively quantify the performance of deep learning models integrated with multimodal data for eucalyptus stand maturity recognition in the study area, an independent accuracy validation was conducted based on the collected points. A random subset of 30% of the 9908 sample points (Figure 3) was selected for independent accuracy verification. These sample points are disjoint in space from the 16 sub-regions (Figure 4) used in generating the training block samples. They cover all field-surveyed sample points located outside the aforementioned 16 sub-regions, and the remaining samples were obtained via visual interpretation. This ensures an unbiased assessment of model generalization capability on unseen data and guarantees the authenticity and reliability of the accuracy evaluation. To ensure standardized evaluation criteria and enhance the comparability and comprehensiveness of the results, five core metrics—Overall Accuracy (OA), mean Intersection over Union (mIoU), Precision, Recall, and F1-score—were employed to comprehensively evaluate the recognition performance from multiple perspectives.
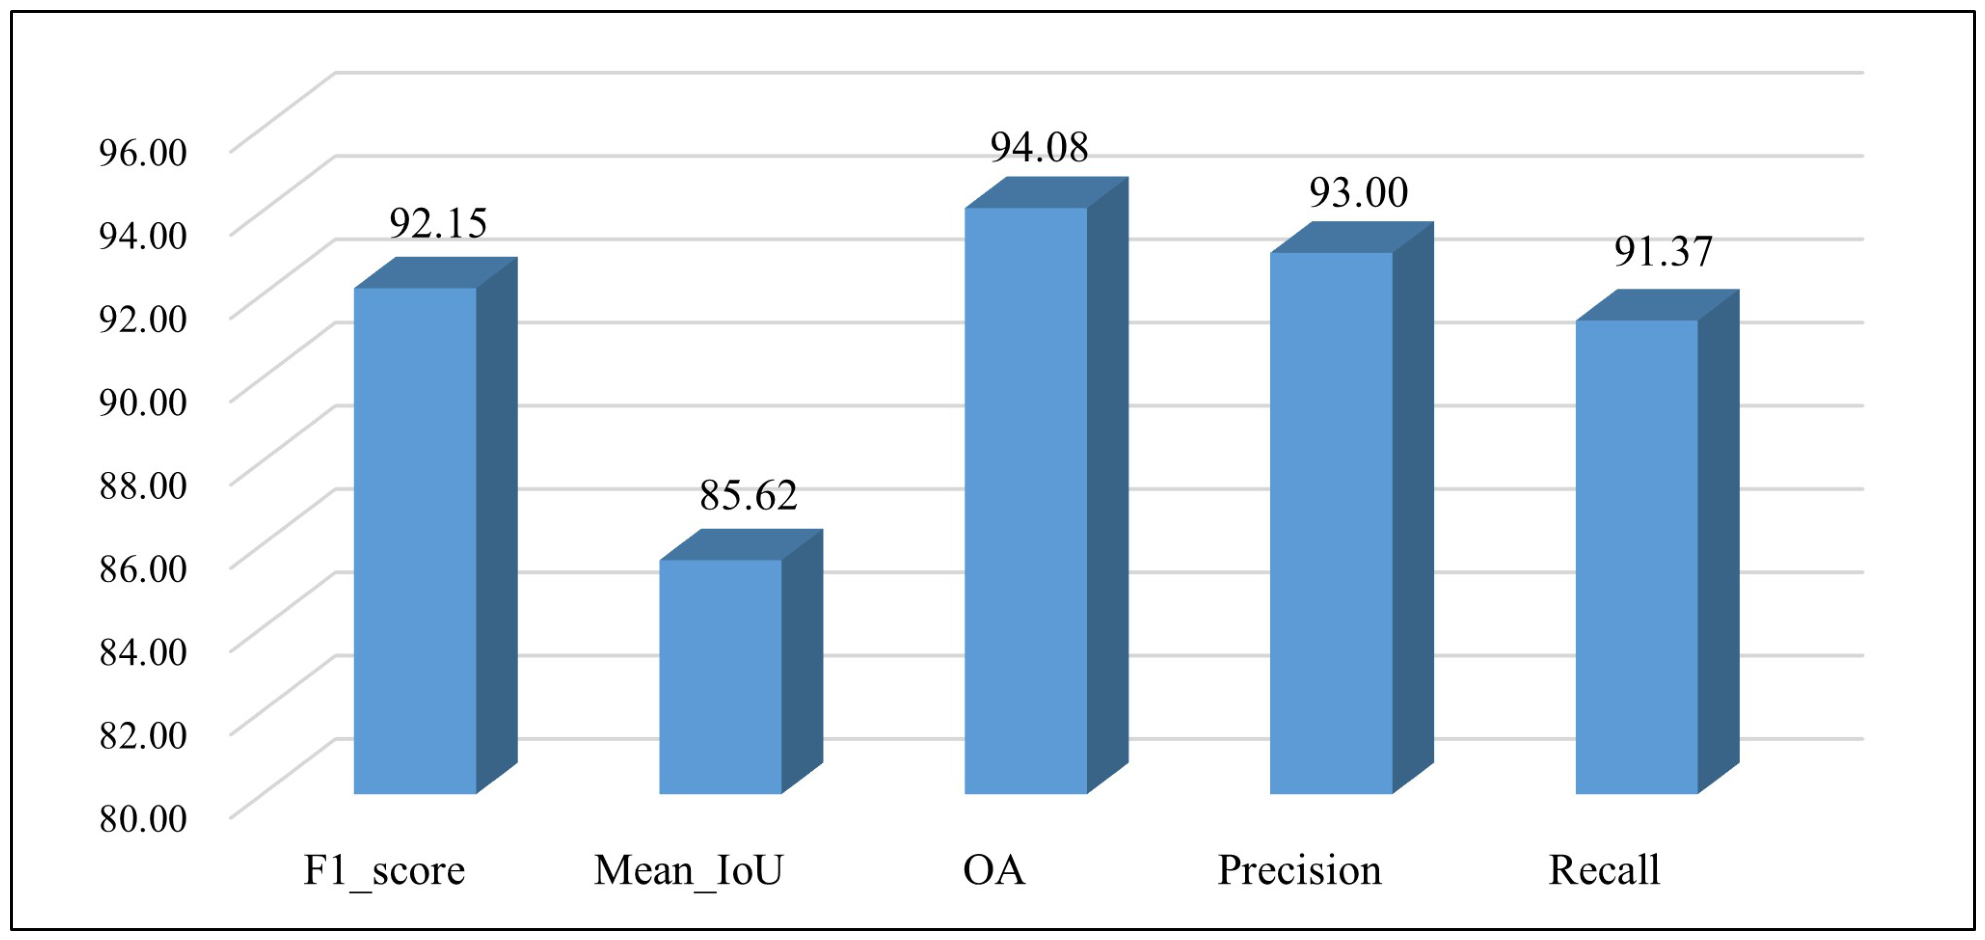
The independent validation results are presented in Figure 13. The model achieved an F1-score of 92.15%, an mIoU of 85.62%, an OA of 94.08%, a Precision of 93.00%, and a Recall of 91.37%. The OA of 94.08% indicates that the model correctly classified the vast majority of pixels, reflecting its robust overall classification capability. The Precision of 93.00% demonstrates that the model effectively minimized false positives, reducing the probability of misclassifying background or non-target land-cover types as eucalyptus stands of specific maturity stages, thereby ensuring high reliability of the recognition results. The Recall of 91.37% reveals that the model successfully captured the majority of true eucalyptus pixels with limited omission errors, guaranteeing comprehensive coverage of target stands across the study area. The F1-score of 92.15%, as the harmonic mean of Precision and Recall, reflects a well-balanced trade-off between accuracy and completeness, indicating stable and reliable comprehensive recognition performance without significant bias toward either false positives or false negatives. Most notably, the mIoU of 85.62% demonstrates high spatial congruence between predicted and reference segmentation boundaries, confirming that the proposed approach effectively mitigates the category confusion problem caused by the contiguous distribution and spectrally similar characteristics of eucalyptus plantations. This high boundary fidelity enables precise delineation of spatial distribution boundaries among different maturity stages, substantially reducing misclassification and mixing effects between adjacent stands, which aligns well with the practical requirements of operational forestry management.
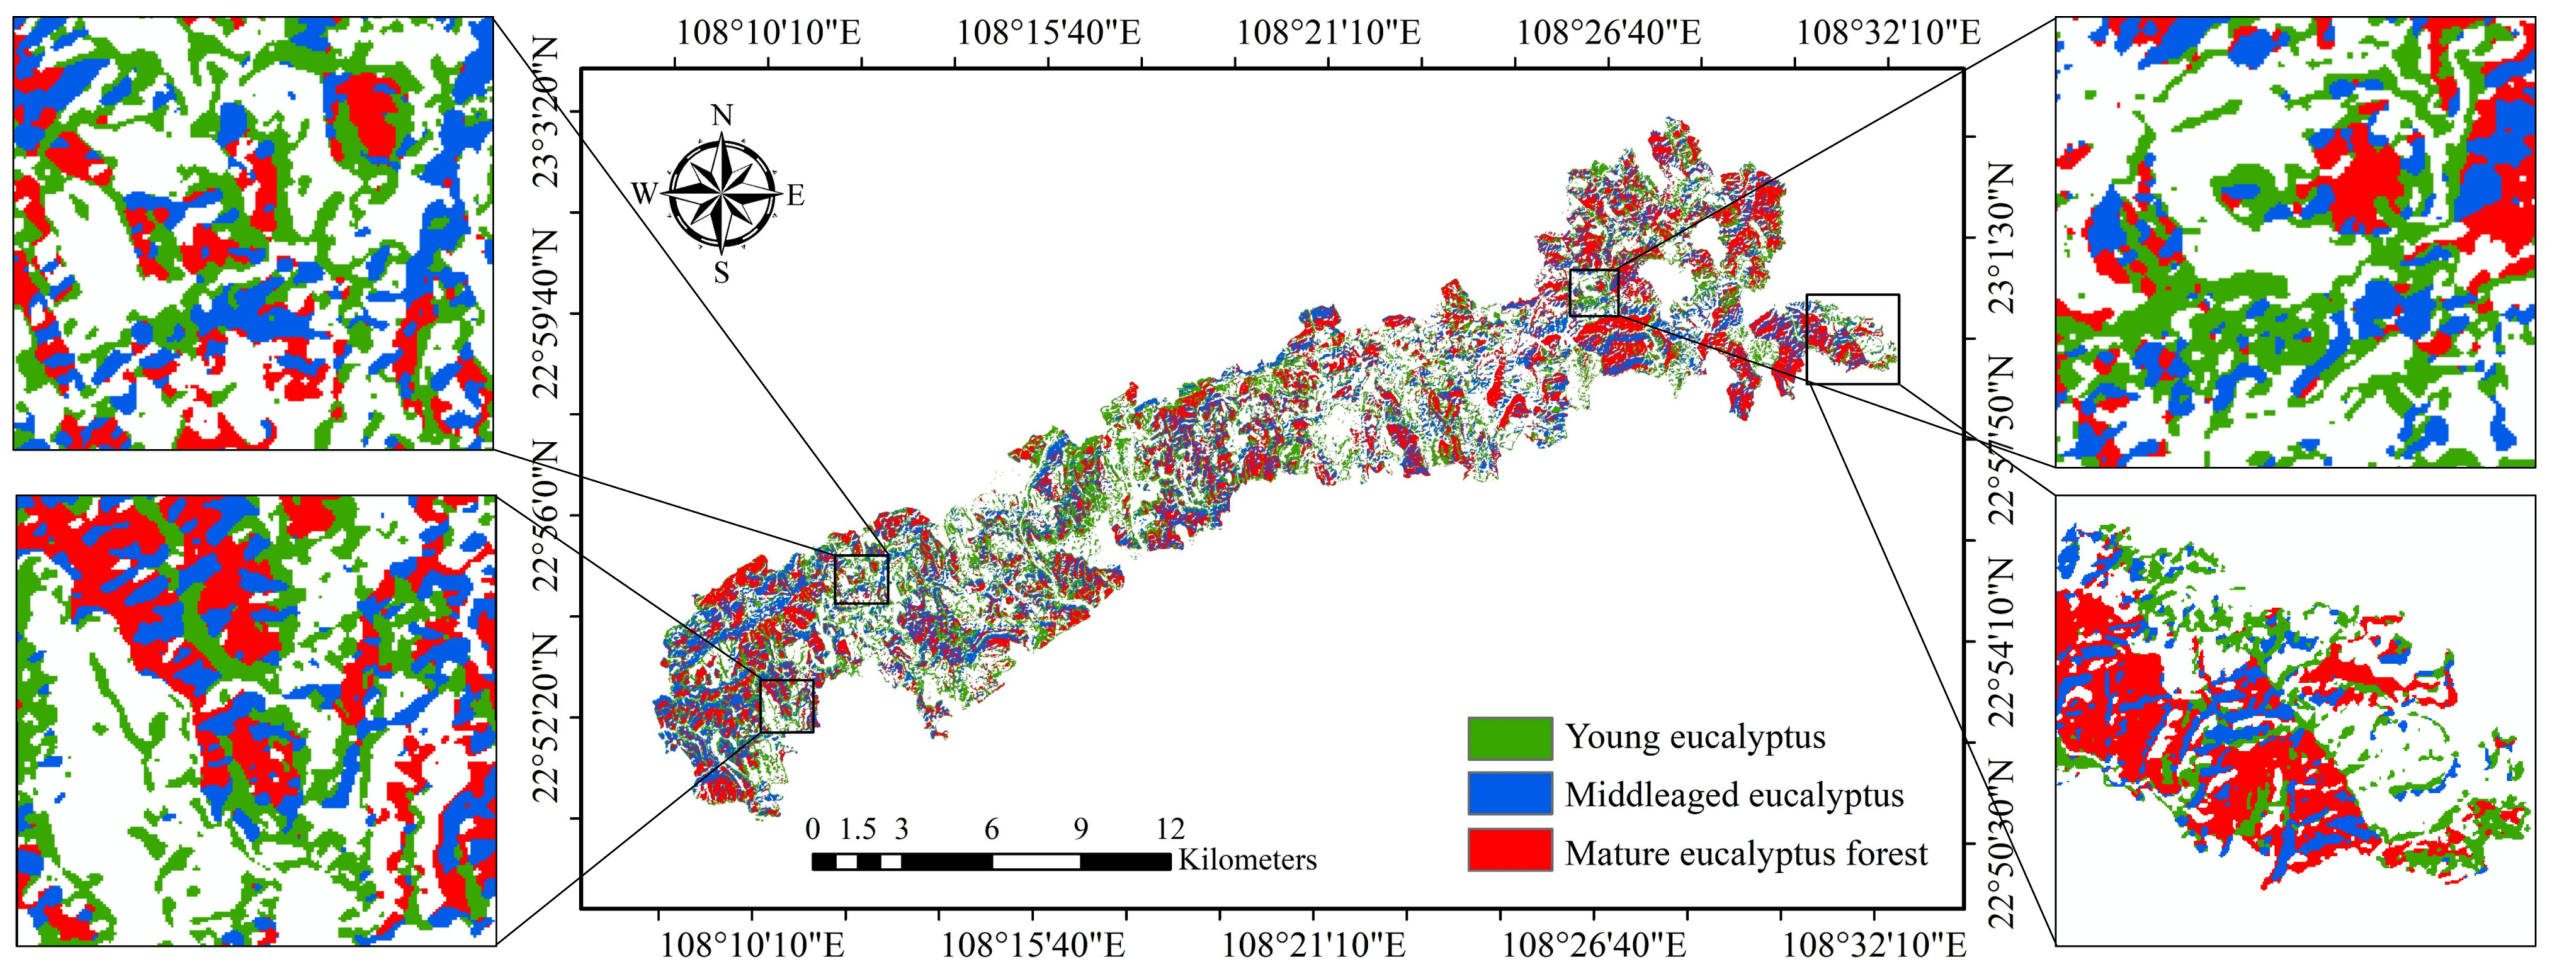
Figure 14 presents the extraction results of Mamba-UNet using the S2+SI configuration, which represents the optimal combination for eucalyptus recognition. The areas of different land-cover types in Gaofeng Forest Farm were calculated accordingly, as summarized in Table 10.
The results indicate that the area of the other land types (Others), including bare ground, water bodies, Chinese fir, star anise (Illicium verum), Masson pine (Pinus massoniana) and broadleaf forest, is 92.14 km2, accounting for 39.85% of the total forest area. Among the eucalyptus stands, mature eucalyptus forests are the most widely distributed, with an area of approximately 59.79 km2, representing 25.86% of the total study area. Young eucalyptus forests rank second, with an area of approximately 47.79 km2, accounting for 20.67% of the total study area. In contrast, middle-aged eucalyptus forests occupy the smallest area among the three age classes, comprising only 13.62% (approximately 31.50 km2) of the study area. Overall, the distribution area of the eucalyptus stands follows the following order: mature eucalyptus forests > young eucalyptus forests > middle-aged eucalyptus forests.

5. Discussion

5.1. The Impact of Different Deep Learning Models on Eucalyptus Maturity Identification

Based on the results of the recent fine-scale maturity identification experiment on eucalyptus trees at the Nanning Gaofeng Forest Farm, four semantic segmentation models exhibited distinct performance gradients. Their overall performance ranked as follows: Mamba-UNet > Swin-UNet > U-Net > Trans-UNet. This result clearly demonstrates that there is no positive correlation between the models’ structural complexity and their recognition accuracy.
U-Net has an excellent local feature extraction ability based on convolution operations, which can stably obtain texture and surface morphological information of eucalyptus forest land with low training difficulty and high operational efficiency. However, its limited receptive field cannot construct long-distance spatial dependencies in large-scale forest areas, and it can only extract shallow features, making it difficult to distinguish subtle spectral and physiological differences in eucalyptus at different forest ages, and achieving poor fine classification performance. Trans-UNet integrates the local advantages of convolution and the global modeling capability of Transformers, yet it cannot well adapt to complex eucalyptus plantation scenarios. Environmental noise generated by dense canopies easily causes mutual interference between local and global features, leading to redundancy and conflicts in feature fusion and failing to make full use of valid multi-source remote sensing information. As a pure Transformer architecture, Swin-UNet abandons convolution structures and realizes global context modeling through hierarchical sliding-window self-attention, which is suitable for large-scale forest scenarios and outperforms convolutional and hybrid models in identifying eucalyptus growth stages. Nevertheless, it suffers from the high computational complexity of self-attention and discontinuous boundary features, resulting in local segmentation defects in irregularly distributed eucalyptus forests, with great room for performance improvement. Constructed based on state-space models, Mamba-UNet achieves the optimal overall performance in this experiment. It possesses a superior global continuous spatial perception capability, efficient noise suppression, and a core feature screening ability, which can accurately grasp the spatial distribution pattern and age evolution rule of eucalyptus, select spectral features closely related to eucalyptus maturity, eliminate various pieces of external interference information, fully explore the growth gradient differences of eucalyptus, and ultimately obtain higher segmentation accuracy and more stable classification results.
In theory, the advantages of Mamba-UNet originate from its state-space model. Based on the discrete state equation h k = A ¯ h k 1 + B ¯ x k , it implements linear O ( n ) global recursive modeling. The state transition matrix A ¯ = e Δ A provides a learnable global receptive field, overcoming the local limitation of fixed convolutions in vanilla U-Net and the information loss from windowed self-attention’s O ( n 2 ) complexity in Trans-UNet and Swin-UNet. Its core input-adaptive gating mechanism dynamically generates Δ and B ¯ from inputs, transforming the system from LTI to LTV. It adaptively enhances Sentinel-2 red-edge, near-infrared and vegetation index features correlated with eucalyptus physiology, while suppressing redundant C-band SAR backscattering constrained by canopy penetration. Layer-wise pixel-level cross-modal feature selection thus eliminates negative fusion from multi-source feature stacking. In addition, continuous state recursion is mathematically isomorphic to stand growth dynamics, retaining the spatial continuity of large forest patches without positional encoding. This fits the gradual maturity gradient of forests, which vanilla U-Net cannot achieve due to translation invariance breaking position-sensitive information, and which Trans-UNet/Swin-UNet cannot achieve due to discrete tokenization splitting spatial integrity.
The reasons for such performance differences lie in two aspects. Firstly, the eucalyptus forests in the Gaofeng Forest Farm show a polarized age distribution with blurred age gradient boundaries, which puts forward high demands on the fine feature perception and continuous spatial modeling capacity of models, while traditional convolutional models and poorly adapted hybrid models fail to meet such requirements. On the other hand, it verifies that feature validity matters far more than the quantity of data sources in forest remote sensing identification. Excessive introduction of low-penetration SAR data tends to cause negative effects in multi-source data fusion. In contrast, lightweight and efficient novel sequence modeling architectures are more suitable for fine remote sensing monitoring of subtropical plantations than complex networks with redundant modules. This further proves that selecting high-quality features matching vegetation physiological mechanisms combined with lightweight advanced models is an efficient and feasible way to achieve accurate identification of eucalyptus maturity.

5.2. The Effectiveness of Modal Data Fusion in Eucalyptus Maturity Recognition

The experimental results consistently demonstrate that S2+SI is the optimal data configuration, with its accuracy significantly higher than that of the other configurations. The core reason lies in the strong correlation between spectral indices (SIs) and the physiological characteristics of eucalyptus. SIs can effectively amplify subtle differences in canopy structure and chlorophyll content. When combined with Sentinel-2 multispectral data, the spectral-physiological coupling characteristics of eucalyptus at different maturity stages can be accurately captured, providing critical discriminative information for the identification task.
In comparison, the incorporation of Sentinel-1 SAR data (S1) generally results in reduced classification accuracy. This phenomenon can be attributed to the low sensitivity of C-band SAR data to the physical and chemical properties of eucalyptus stands. The VH-polarized backscattering signal is more responsive to the vertical canopy structure and leaf-and-branch biomass of eucalyptus stands, whereas the VV-polarized signal primarily reflects the surface roughness of the upper canopy as well as double-bounce scattering between tree trunks and the ground. C-band SAR signals fail to penetrate dense eucalyptus canopies. Both polarizations can only capture information from the upper canopy layer of high-density subtropical eucalyptus plantations. They are unable to retrieve effective structural differences in understory vegetation and tree trunks—features closely related to stand age. These signals merely characterize canopy surface roughness and water content, parameters that exhibit strong correlation with Sentinel-2 optical data and deliver limited additional information—they are thus treated as redundant features and induce adverse fusion effects.
Different models show distinct disparities in suppressing the negative fusion effect for eucalyptus maturity identification, with the suppression capability gradually improving as architectures evolve from CNN to Transformer and state-space models. U-Net produces the most prominent negative fusion effect: relative to its optimal S2+SI configuration (76.41% mIoU), full feature fusion (S2+S1+SI) reduces mIoU by 4.27%, revealing the weak cross-modal feature screening ability of pure CNN structures. As a hybrid CNN–Transformer model, Trans-UNet alleviates this issue to some extent, with only a 2.02% mIoU drop under full fusion compared with its optimal S2+SI scheme (71.05% mIoU), though residual feature redundancy still causes obvious performance degradation. Swin-UNet further enhances redundant feature suppression, limiting the mIoU decline to 1.70% (from 77.00% to 75.30%). By contrast, Mamba-UNet achieves the strongest robustness against feature redundancy, with merely a 0.55% mIoU decrease under full fusion based on its optimal 79.10% mIoU. These results demonstrate that advanced network architectures can effectively mitigate interference from redundant multi-source features via superior feature selection capabilities. However, the persistent negative fusion effect across all models indicates that inherent data defects from multi-source modal mismatch and feature redundancy cannot be completely eliminated by only architectural optimization.

5.3. The Implications of Eucalyptus Maturity Identification in Gaofeng Forest Farm

We analyzed the distribution information of eucalyptus in Gaofeng Forest Farm (Figure 14 and Table 10) and found that compared with young and middle-aged eucalyptus forests, mature eucalyptus forests were the most widely distributed, followed by young eucalyptus forests, and middle-aged eucalyptus forests were the least distributed.
This forest age structure reflects the typical short-rotation management regime of subtropical eucalyptus industrial plantations. As a fast-growing species, eucalyptus is typically managed on 5–7 year rotation cycles, resulting in an age structure concentrated at the young and mature extremes, with middle-aged stands—as a transitional stage—occupying a relatively small proportion. From a forestry management perspective, this structure carries dual implications. On the positive side, the high proportion of mature forests provides a stable resource base for wood supply chains, while adequate young stand reserves ensure rotation continuity, conducive to maintaining long-term operational stability. However, the relative scarcity of middle-aged forests may create temporary harvestable resource gaps in specific years, compromising the annual revenue equilibrium. Furthermore, the polarized age structure reduces stand ecological stability, increasing vulnerability to pest outbreaks and extreme climate events.
The spatially explicit forest age distribution and land-cover statistics provided in this study offer clear spatial guidance, enabling accurate decision support for the formulation of scientifically sound phased harvesting plans, optimization of rotation sequences, and strategic shelterbelt configuration. These outputs facilitate the transition toward the refined and sustainable management of eucalyptus plantations.

5.4. Comparison with the Existing Literature

Existing studies on eucalyptus age-related mapping differ from the present work primarily in their research scale, data source, and task granularity rather than in their accuracy metrics alone; therefore, direct numerical comparisons are not always meaningful. Ding et al. (2025) [44] achieved individual eucalyptus tree crown delineation and age estimation by integrating an improved Mask R-CNN with UAV stereo image pairs, reporting an mAP of approximately 80.7% at IoU = 0.5. However, their approach is inherently constrained by the limited spatial coverage of UAV surveys, and is thus suitable only for plot-scale applications. Tesfaye et al. (2025) [45] generated stand age maps for the Yeraba Plantation Forest using high-resolution multispectral imagery and reference spectral signatures across surveys conducted in 2016, 2020, and 2024. Nevertheless, their target was a mixed-plantation ecosystem rather than a single fast-growing eucalyptus species managed under a narrow 4–7 year rotation, for which inter-class spectral separability is considerably lower. To date, studies that perform pixel-level fine-grained maturity classification of eucalyptus plantations using publicly available medium-resolution multispectral satellite imagery in conjunction with four generations of deep learning architectures remain scarce.
Most existing eucalyptus mapping research relies on optical time-series data and underscores the importance of red-edge bands. Zhang et al. (2023) [46] demonstrated that Sentinel-2 red-edge bands provide the strongest discriminative signal for eucalyptus identification. The present study corroborates this finding: the combination of Sentinel-2 and physiologically informative spectral indices (S2+SI) yielded the highest accuracy, with a validation mIoU of 79.10%. In contrast, the inclusion of C-band Sentinel-1 SAR data introduced feature redundancy and consistently reduced mIoU across all tested architectures. Because short-wavelength C-band backscatter is dominated by upper-canopy scattering and saturates at relatively low biomass levels in dense subtropical canopies, it conveys limited information on trunk and understory structure that distinguishes maturity stages. Longer-wavelength L-band SAR (e.g., PALSAR-2), by comparison, retains greater sensitivity to these structural elements [47,48]. Consequently, the benefits of optical–SAR fusion reported for L-band data do not necessarily transfer to C-band data in this land-cover context. More broadly, these results indicate that feature relevance to the underlying physiological processes outweighs the mere stacking of additional data modalities in fine-grained maturity recognition tasks.
At Gaofeng Forest Farm, eucalyptus occupies 60.15% of the total forest area, with young, middle-aged, and mature stands accounting for 20.67%, 13.62%, and 25.86%, respectively. This distribution exhibits a clear bimodal pattern dominated by the young and mature classes. The observed age structure aligns closely with the 4–7 year short-rotation harvest and regeneration cycle typical of industrial eucalyptus plantations in southern China and supports the disturbance–growth cycle documented in previous time-series studies [49,50]. Notably, the maturity classes retrieved from a single-date Sentinel-2 classification recover the same rotation signature previously resolved only through multi-decadal time-series analysis. This agreement provides independent landscape-scale validation of our maturity extraction approach and demonstrates the practical utility of the lightweight model combined with spectral indices for operational plantation monitoring.

5.5. Limitations and Future Work

Despite the progress achieved in this study, certain limitations remain. (1) The Gaofeng Forest Farm in Nanning, Guangxi, serves as a representative site for eucalyptus research in southern China, but its spatial extent remains relatively limited. (2) The Sentinel-1 C-band SAR data performed poorly in this study, demonstrating insensitivity to the physicochemical characteristics associated with eucalyptus maturity. Consequently, it failed to effectively complement the structural features derived from optical imagery, resulting in a negative fusion effect. This outcome aligns with the known issue in multimodal fusion where insufficient incremental information from heterogeneous modalities leads to fusion failure. (3) All Sentinel-1 and Sentinel-2 remote sensing data used in this study were acquired during the same period (January–February 2023), and model training and analysis were based entirely on static, single-date spectral and backscatter characteristics. (4) The selection of spectral indices was based on generic vegetation indices rather than indices specifically designed for the unique physiological parameters of eucalyptus; as such, there remains room for optimization to enhance the specificity and relevance of the feature extraction process. (5) To support fine-grained semantic segmentation, this study constructed a large-scale labeled dataset by combining field RTK survey points and visual interpretation samples based on Sentinel-2 false-color composites and historical forest stand maps. Although strict quality control strategies—including field calibration, random field verification, and uniform spatial sampling—were implemented to reduce errors, visual annotation inevitably involves subjective empirical judgment.
Future research will proceed along the following lines: (1) Future studies will therefore scale up to encompass the broader southern China region. (2) We will also explore the use of L-band SAR or long-wavelength SAR data, and integrate other remote sensing data, such as LiDAR, leveraging their superior canopy penetration capabilities for acquiring structural information regarding tree trunks and understory vegetation, thereby addressing the limitations inherent in C-band SAR. (3) We will break temporal constraints, introduce multi-year continuous Sentinel time-series datasets to mine phenological and growth trend differences among different mature eucalyptus stands. (4) We will design eucalyptus-specific spectral indices to enhance the targeted relevance of feature extraction. (5) To reduce annotation uncertainty, we will fuse ultrahigh-resolution UAV imagery with semi-supervised annotation strategies to refine forest age transition boundaries, mitigate manual labeling errors, and construct higher-quality standardized segmentation datasets.

6. Conclusions

This study systematically evaluated the adaptability of four generations of deep learning architectures for fine-scale identification of eucalyptus maturity using multimodal remote sensing data in the State-owned Gaofeng Forest Farm, Nanning, Guangxi. The results demonstrate that efficient global context modeling, rather than architectural complexity, is the critical factor in improving eucalyptus maturity recognition performance. The state-space model achieved an optimal balance between computational efficiency and long-range dependency capture, outperforming both pure convolutional and Transformer-based architectures. Regarding multimodal data fusion, feature effectiveness supersedes data redundancy. Spectral indices, which are strongly correlated with the physiological characteristics of eucalyptus, provide the most valuable complementary information to optical imagery; conversely, C-band SAR backscatter introduces feature redundancy due to limited canopy penetration in subtropical rainforest environments, resulting in diminished or even negative fusion effects. The proposed approach exhibits strong performance when independently validated against field survey data, confirming its practical applicability for operational forest resource monitoring. Furthermore, quantitative analysis of stand age structure reveals a polarized distribution dominated by young and mature stands with a notable deficit in middle-aged forests, a pattern that carries significant management implications for sustainable yield planning and harvest scheduling in commercial eucalyptus plantations.

Author Contributions

L.L.: Conceptualization, methodology, software, and writing—original draft. Y.G., Q.L. and J.Z.: Data curation, visualization, investigation, methodology, and software. J.H., X.T., E.C. and Z.L.: Supervision, funding acquisition, project administration, and writing—review and editing. All authors have read and agreed to the published version of the manuscript.

Funding

This research was funded by the National Key Research and Development Program of China under Grant Number 2023YFD220170301 and the Heilongjiang Post-doctoral Foundation under Grant Number LBH-Z25064.

Data Availability Statement

The Sentinel-1/2 data are available via the Google Earth Engine. Field survey data are available from the corresponding author upon reasonable request.

Acknowledgments

We gratefully acknowledge Google for providing remote sensing data support. We also thank Conghei Tao from Siwei High-View Satellite Remote Sensing Co., Ltd., for providing technical support. The authors are grateful to the editors and referees for their constructive criticism on this paper.

Conflicts of Interest

The authors declare no conflicts of interest.

References

  1. Laclau, J.P.; De Moraes Gonçalves, J.L.; Stape, J.L. Perspectives for the management of eucalypt plantations under biotic and abiotic stresses. For. Ecol. Manag. 2013, 301, 1–5. [Google Scholar] [CrossRef]
  2. Pirralho, M.; Flores, D.; Sousa, V.B.; Quilhó, T.; Carrilho, E.; Pascoal Neto, C.; Knapic, S.; Pereira, H. Evaluation on paper making potential of nine Eucalyptus species based on wood anatomical features. Ind. Crops Prod. 2014, 54, 327–334. [Google Scholar] [CrossRef]
  3. Zhu, Q.; Jiang, J.; Guo, S.; Huang, Y. Current Development Status of China’s Eucalyptus Industry and Its Impact Analysis on Carbon Peak and Carbon Neutrality. J. Life Sci. Agric. 2025, 2, 31–35. [Google Scholar] [CrossRef]
  4. Qiu, Q.; Yun, G.; Zuo, S.; Yan, J.; Hua, L.; Ren, Y.; Chen, Q. Variations in the biomass of Eucalyptus plantations at a regional scale in Southern China. J. For. Res. 2018, 29, 1263–1276. [Google Scholar] [CrossRef]
  5. Tupinambá-Simões, F.; Bravo, F.; Guerra-Hernández, J.; Pascual, A. Assessment of drought effects on survival and growth dynamics in eucalypt commercial forestry using remote sensing photogrammetry: A showcase in Mato Grosso, Brazil. For. Ecol. Manag. 2022, 505, 119930. [Google Scholar] [CrossRef]
  6. Xu, N.; Cai, D.; Zhao, X. Constructing a eucalyptus identification model based on NDVI time-series remote sensing images. Catena 2024, 238, 107846. [Google Scholar] [CrossRef]
  7. Qiu, F.; Zang, J.; Zhang, Y. Divergent remote sensing signals in long-term post-fire Eucalyptus recovery: Structural vs. functional traits. Remote Sens. Environ. 2026, 333, 115121. [Google Scholar] [CrossRef]
  8. Santos, J.S.; de Mendonça, A.R.; Gonçalves, F.G.; da Silva, G.F.; de Almeida, A.Q.; e Carvalho, S.d.P.C.; Aguiar, M.O. Predicting eucalyptus plantation growth and yield using Landsat imagery in Minas Gerais, Brazil. Ecol. Inform. 2023, 75, 102120. [Google Scholar] [CrossRef]
  9. Duan, L.; Liang, B.; Li, Z.; Luo, T.; Huang, C.; Huang, G. UAVs optical image-based Eucalyptus canopy detection using active learning with spatial overlap indicator. J. Cent. South Univ. For. Technol. 2025, 45, 10–19. [Google Scholar] [CrossRef]
  10. Alonso, L.; Rodríguez-Dorna, A.; Picos, J.; Costas, F.; Armesto, J. Automatic differentiation of Eucalyptus species through Sentinel-2 images, Worldview-3 images and LiDAR data. ISPRS J. Photogramm. Remote Sens. 2024, 207, 264–281. [Google Scholar] [CrossRef]
  11. Tang, C.; Li, G.; Lu, D. Extraction of eucalyptus age and estimation of its aboveground biomass in China with the integration of empirical model and machine learning algorithm. For. Ecosyst. 2026, 13, 100440. [Google Scholar] [CrossRef]
  12. Manase, A.; Manyevere, A.; Abd Elbasit, M.A.M.; Mashamaite, C. The use of UAV-based systems in monitoring forest health: Potentials and challenges. Sci. Afr. 2025, 28, e02724. [Google Scholar] [CrossRef]
  13. Teodoro, L.P.R.; Estevão, R.; Santana, D.C.; Oliveira, I.C.d.; Lopes, M.T.G.; Azevedo, G.B.d.; Baio, F.H.R.; da Silva Junior, C.A.; Teodoro, P.E. Eucalyptus species discrimination using hyperspectral sensor data and machine learning. Forests 2023, 15, 39. [Google Scholar] [CrossRef]
  14. Ronneberger, O.; Fischer, P.; Brox, T. U-Net: Convolutional Networks for Biomedical Image Segmentation. In Proceedings of the International Conference on Medical Image Computing and Computer-Assisted Intervention; Springer International Publishing: Cham, Switzerland, 2015; pp. 234–241. [Google Scholar] [CrossRef]
  15. Chen, J.; Lu, Y.; Yu, Q.; Luo, X.; Adeli, E.; Wang, Y.; Lu, L.; Yuille, A.L.; Zhou, Y. TransUNet: Transformers Make Strong Encoders for Medical Image Segmentation. arXiv 2021, arXiv:2102.04306. [Google Scholar] [CrossRef]
  16. Cao, H.; Wang, Y.; Chen, J.; Duan, J.; Zhang, K.; Sang, Y.; Tian, M.; Chen, X.; Shi, J.; Xu, Z.; et al. Swin-UNet: UNet-Like Pure Transformer for Medical Image Segmentation. In Proceedings of the European Conference on Computer Vision; Springer International Publishing: Cham, Switzerland, 2022; pp. 205–218. [Google Scholar] [CrossRef]
  17. Wang, Z.; Zheng, J.; Zhang, L.; Li, Y.; Wang, B.; Zhang, Y.; Shui, Z. Mamba-UNet: UNet-Like Pure Visual Mamba for Medical Image Segmentation. arXiv 2024, arXiv:2402.05079. [Google Scholar] [CrossRef]
  18. Zhao, F.; Sun, R.; Zhong, L.; Meng, R.; Huang, C.; Zeng, X.; Wang, M.; Li, Y.; Wang, Z. Monthly mapping of forest harvesting using dense time series Sentinel-1 SAR imagery and deep learning. Remote Sens. Environ. 2022, 269, 112822. [Google Scholar] [CrossRef]
  19. Zhou, W.; Liu, L.; Liu, R.; Chen, F.; Yang, L.; Qin, L.; Lyu, R. Precise Mapping of Linear Shelterbelt Forests in Agricultural Landscapes: A Deep Learning Benchmarking Study. Forests 2026, 17, 91. [Google Scholar] [CrossRef]
  20. Ma, H.; Wu, B.; Tian, F.; Zhao, H.; Li, Y.; Li, M.; Zhang, M.; Wu, H.; Zeng, H.; Zhu, L. A deep learning-based framework for extracting spatial patterns of farmland shelterbelts in the three-north region of China using Sentinel-2 data. Remote Sens. Environ. 2026, 332, 115095. [Google Scholar] [CrossRef]
  21. Liu, P.; Zhang, G.; Li, J. GCN-Embedding Swin–UNet for Forest Remote Sensing Image Semantic Segmentation. Remote Sens. 2026, 18, 242. [Google Scholar] [CrossRef]
  22. Rouse, J., Jr.; Haas, R.; Schell, J.; Deering, D. Monitoring the Vernal Advancement and Retrogradation (Green Wave Effect) of Natural Vegetation; NASA-CR-132982; NASA: Washington, DC, USA, 1973.
  23. Gitelson, A.; Merzlyak, M. Signature analysis of leaf reflectance spectra: Algorithm development for remote sensing of chlorophyll. J. Plant Physiol. 1996, 148, 494–500. [Google Scholar] [CrossRef]
  24. Huete, A.; Liu, H.; Batchily, K.; Van Leeuwen, W. A comparison of vegetation indices over a global set of TM images for EOS-MODIS. Remote Sens. Environ. 1997, 59, 440–451. [Google Scholar] [CrossRef]
  25. Qi, J.; Chehbouni, A.; Huete, A.; Kerr, Y.; Sorooshian, S. A modified soil adjusted vegetation index. Remote Sens. Environ. 1994, 48, 119–126. [Google Scholar] [CrossRef]
  26. McFeeters, S. The use of the Normalized Difference Water Index (NDWI) in the delineation of open water features. Int. J. Remote Sens. 1996, 17, 1425–1432. [Google Scholar] [CrossRef]
  27. Zha, Y.; Gao, J.; Ni, S. Use of Normalized Difference Built-up Index in Automatically Mapping Urban Areas from TM Imagery. Int. J. Remote Sens. 2003, 24, 583–594. [Google Scholar] [CrossRef]
  28. Azad, R.; Aghdam, E.K.; Rauland, E.; Jia, Y.; Avval, A.H.; Bozorgpour, A.; Karimijafarbigloo, S.; Cohen, J.P.; Adeli, E.; Merhof, D.; et al. Medical image segmentation review: The success of u-net. IEEE Trans. Pattern Anal. Mach. Intell. 2024, 46, 10076–10095. [Google Scholar] [CrossRef] [PubMed]
  29. Wei, S.; Zhang, H.; Wang, C.; Wang, Y.; Xu, L. Multi-temporal SAR data large-scale crop mapping based on U-Net model. Remote Sens. 2019, 11, 68. [Google Scholar] [CrossRef]
  30. Wagner, F.H.; Sanchez, A.; Tarabalka, Y.; Lotte, R.G.; Ferreira, M.P.; Aidar, M.P.; Gloor, E.; Phillips, O.L.; Aragao, L.E. Using the U-net convolutional network to map forest types and disturbance in the Atlantic rainforest with very high resolution images. Remote Sens. Ecol. Conserv. 2019, 5, 360–375. [Google Scholar] [CrossRef]
  31. Liu, L.; Zhang, Q.; Guo, Y.; Chen, E.; Li, Z.; Li, Y.; Wang, B.; Ri, A. Mapping the distribution and dynamics of coniferous forests in large areas from 1985 to 2020 combining deep learning and Google Earth Engine. Remote Sens. 2023, 15, 1235. [Google Scholar] [CrossRef]
  32. Wagner, F.H.; Dalagnol, R.; Tarabalka, Y.; Segantine, T.; Thomé, R.; Herold, M. Sub-meter tree height mapping of California using aerial images and LiDAR-informed U-Net model. Remote Sens. Environ. 2024, 305, 114099. [Google Scholar] [CrossRef]
  33. Huang, C.; Wang, M.; Zhu, Z.; Li, Y. High-Resolution Remote Sensing Imagery Water Body Extraction Using a U-Net with Cross-Layer Multi-Scale Attention Fusion. Sensors 2025, 25, 5655. [Google Scholar] [CrossRef] [PubMed]
  34. Ren, T.; Gong, W.; Chen, J.; Gao, L.; Wu, J.; Xiang, X. Coseismic landslide mapping based on trans-UNet and transfer learning. IEEE J. Sel. Top. Appl. Earth Obs. Remote Sens. 2025, 18, 13074–13086. [Google Scholar] [CrossRef]
  35. Zhou, S.; Liao, B.; Zhu, F.; Li, Y.; Li, J.; Guo, J.; Sun, H. Trans-UNet Network for Predicting Bathymetry in South China Sea from Gravity and Geological Data. IEEE J. Sel. Top. Appl. Earth Obs. Remote Sens. 2025, 18, 16123–16133. [Google Scholar] [CrossRef]
  36. Li, S.; Fu, W.; Lin, M.; Ma, X. Trans-UNet for fast and accurate photoresist modeling with variable development time. Appl. Opt. 2026, 65, 4394–4402. [Google Scholar] [CrossRef]
  37. Tang, Y.; Cao, Z.; Guo, N.; Jiang, M. A Siamese Swin-Unet for image change detection. Sci. Rep. 2024, 14, 4577. [Google Scholar] [CrossRef] [PubMed]
  38. Gomes, R.; Pham, T.; He, N.; Kamrowski, C.; Wildenberg, J. Analysis of Swin-UNet vision transformer for Inferior Vena Cava filter segmentation from CT scans. Artif. Intell. Life Sci. 2023, 4, 100084. [Google Scholar] [CrossRef]
  39. Liu, B.; Wang, W.; Wu, Y.; Gao, X. Attention swin transformer UNet for landslide segmentation in remotely sensed images. Remote Sens. 2024, 16, 4464. [Google Scholar] [CrossRef]
  40. Zhu, X.; Huang, X.; Cao, W.; Yang, X.; Zhou, Y.; Wang, S. Road extraction from remote sensing imagery with spatial attention based on swin transformer. Remote Sens. 2024, 16, 1183. [Google Scholar] [CrossRef]
  41. Wu, R.; Liu, Y.; Liang, P.; Chang, Q. H-VMUNet: High-order Vision Mamba UNet for Medical Image Segmentation. Neurocomputing 2025, 624, 129447. [Google Scholar] [CrossRef]
  42. Zheng, J.; Fu, Y.; Chen, X.; Zhao, R.; Lu, J.; Zhao, H.; Chen, Q. EGCM-UNet: Edge Guided Hybrid CNN-Mamba UNet for Farmland Remote Sensing Image Semantic Segmentation. Geocarto Int. 2025, 40, 2440407. [Google Scholar] [CrossRef]
  43. Zhao, K.; Zhang, Q.; Wan, C.; Pan, Q.; Qin, Y. Visual Mamba UNet Fusion Multi-scale Attention and Detail Infusion for Unsound Corn Kernels Segmentation. Sci. Rep. 2025, 15, 10933. [Google Scholar] [CrossRef] [PubMed]
  44. Ding, J.; You, L.; Liang, Y.; Huang, J.; Wu, Z.; Huang, R.; Chen, J.; You, H. Research on eucalyptus individual tree segmentation and age estimation utilizing improved Mask R-CNN algorithm based on UAV stereo images. Ind. Crops Prod. 2025, 230, 121073. [Google Scholar] [CrossRef]
  45. Tesfaye, F.T.; Mengistu, D.A.; Gela, A.G. Mapping forest age and species dynamics in yeraba plantation forest of northwest Ethiopia using hyperspectral signatures and spectral angle mapper. Environ. Syst. Res. 2025, 14, 20. [Google Scholar] [CrossRef]
  46. Zhang, C.; Xiao, X.; Zhao, L.; Qin, Y.; Doughty, R.; Wang, X.; Dong, J.; Yang, X. Mapping Eucalyptus plantation in Guangxi, China by using knowledge-based algorithms and PALSAR-2, Sentinel-2, and Landsat images in 2020. Int. J. Appl. Earth Obs. Geoinf. 2023, 120, 103348. [Google Scholar] [CrossRef]
  47. Zhang, L.; Zhang, X.; Shao, Z.; Jiang, W.; Gao, H. Integrating Sentinel-1 and 2 with LiDAR data to estimate aboveground biomass of subtropical forests in northeast Guangdong, China. Int. J. Digit. Earth 2023, 16, 158–182. [Google Scholar] [CrossRef]
  48. Wu, Y.; Chen, Y.; Tian, C.; Yun, T.; Li, M. Estimation of subtropical forest aboveground biomass using active and passive Sentinel data with canopy height. Remote Sens. 2025, 17, 2509. [Google Scholar] [CrossRef]
  49. Li, D.; Lu, D.; Wu, Y.; Luo, K. Retrieval of eucalyptus planting history and stand age using random localization segmentation and continuous land-cover classification based on Landsat time-series data. Gisci. Remote Sens. 2022, 59, 1426–1445. [Google Scholar] [CrossRef]
  50. Li, Y.; Liu, X.; Liu, M.; Wu, L.; Zhu, L.; Huang, Z.; Xue, X.; Tian, L. Historical dynamic mapping of eucalyptus plantations in Guangxi during 1990–2019 based on sliding-time-window change detection using dense Landsat time-series data. Remote Sens. 2024, 16, 744. [Google Scholar] [CrossRef]
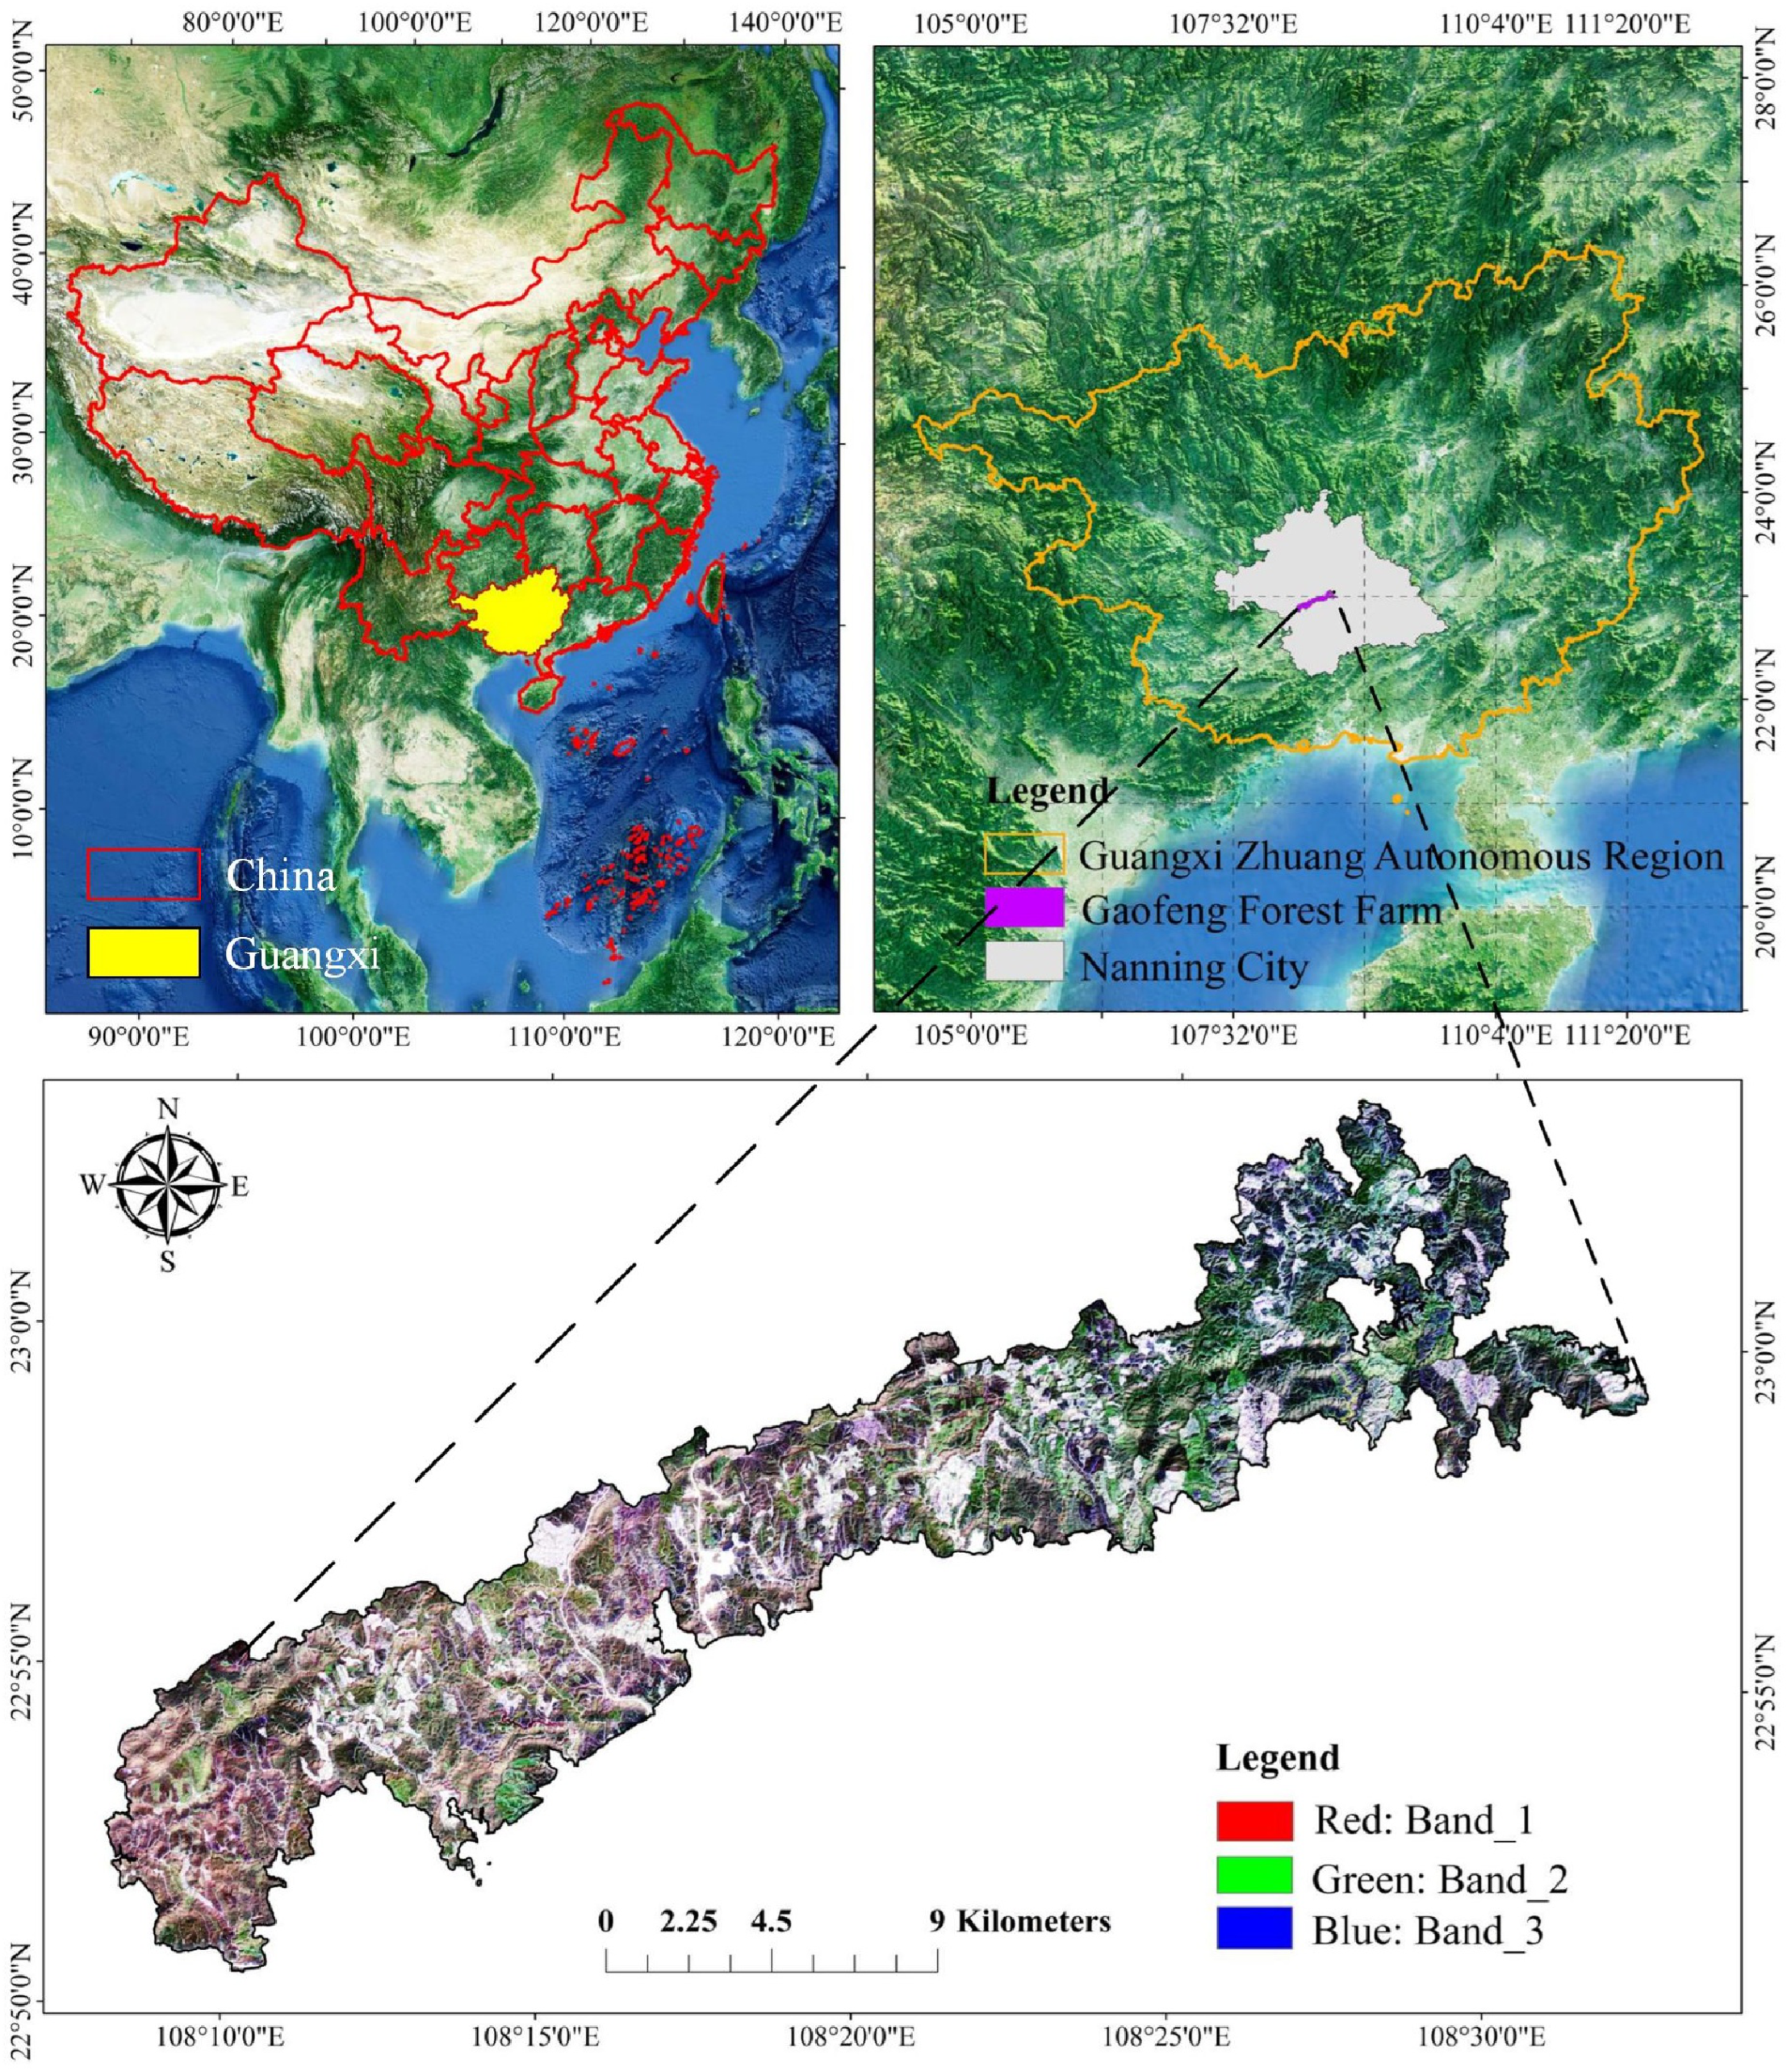
Figure 1. The location of the study area.
Remotesensing 18 02632 g001
Figure 2. The forest stand map of the study area in 2020.
Remotesensing 18 02632 g002
Figure 3. Distribution of collected sample points. (I)–(VIII) The spectral characteristics of the nine landcover types in Sentinel-2.
Remotesensing 18 02632 g003
Figure 4. The distribution of block samples used for deep learning models.
Remotesensing 18 02632 g004
Figure 5. Example of training and validation sample blocks.
Remotesensing 18 02632 g005
Figure 6. The methodological framework of this study.
Remotesensing 18 02632 g006
Figure 7. The spectral reflectance of different land-cover types. (a) The spectral reflectance of different land-cover types on Sentinel-2 data; (b) legend for 9 land-cover types; (c) the spectral reflectance of different land-cover types on data of six spectral indices; (d) the spectral reflectance of different land-cover types on Sentinel-1 data.
Remotesensing 18 02632 g007
Figure 8. Results of eucalyptus maturity identification by U-Net.
Remotesensing 18 02632 g008
Figure 9. Results of eucalyptus maturity identification by Trans-UNet.
Remotesensing 18 02632 g009
Figure 10. Results of eucalyptus maturity identification by Swin-UNet.
Remotesensing 18 02632 g010
Figure 11. Results of eucalyptus maturity identification by Mamba-UNet.
Remotesensing 18 02632 g011
Figure 12. Identification results based on deep learning models and multimodal data.
Remotesensing 18 02632 g012
Figure 13. The independent accuracy verification results.
Remotesensing 18 02632 g013
Figure 14. The final results of eucalyptus maturity identification.
Remotesensing 18 02632 g014
Table 1. The information of the remote sensing images used in this study.
SatellitesBand Wavelength
(nm)
Spatial Resolution
(m)
Band Wavelength
(nm)
Spatial Resolution
(m)
Revisit Time
(day)
Sentinel-2 A/BBand2
(Blue)
496.6/
492.1
10Band7
(RedEdge3)
782.5/
779.7
204
Band3
(Green)
560/
559
10Band8
(NIR)
835.1/
833
10
Band4
(Red)
664.5/
665
10Band8A
(RedEdge4)
864.8/
864
20
Band5
(RedEdge1)
703.9/
703.8
20Band11
(SWIR1)
1613.7/
1610.4
20
Band6
(RedEdge2)
740.2/
739.1
20Band12
(SWIR2)
2202.4/
2185.7
20
Sentinel-1VV/10 5
VH/10
Table 2. Spectral indices and calculation formulas used in this study.
Spectral IndexesCalculation FormulaAuthor
NDVI(NIR-Red)/(NIR+Red)Rouse et al. (1973) [22]
GNDVI(NIR-GREEN)/(NIR+GREEN)Gitelson et al. (1996) [23]
EVI 2.5 × ( NIR Red ) / ( NIR + 6 × Red 7.5 × Blue + 1 ) Huete et al. (1997) [24]
MSAVI 2 × NIR + 1 ( 2 × NIR + 1 ) 2 8 × ( NIR Red ) / 2 Qi et al. (1994) [25]
NDWI(GREEN-NIR)/(GREEN+NIR)McFeeters et al. (1996) [26]
NDBI(SWIR-NIR)/(SWIR+NIR)Zha et al. (2003) [27]
Table 3. Detailed information of the collected sample points.
IDClassesField SurveyVisual InterpretationNumber of Sample Points
1Young eucalyptus95880975
2Middle-aged eucalyptus12613351461
3Mature eucalyptus forest14124642605
4Star anise (Illicium verum)4182123
5Masson Pine (Pinus massoniana)15221512303
6Chinese fir4889137
7Broadleaf forest39118157
8Bare ground13219562088
9Water283159
Total80291069908
Table 4. Information on the four deep learning models employed in this study.
Deep Learning ModelArchitecture TypeYearAuthor
U-NetCNN2015Ronneberger et al. [14]
Trans-UNetCNN+Transformer2021Chen et al. [15]
Swin-UNetTransformer2022Cao et al. [16]
Mamba-UNetState-Space Models2024Wang et al. [17]
Table 5. Training parameters of deep learning models.
ParameterValue
Input Size256 × 256
Batch Size8
Sliding Step128
Epochs200
OptimizerAdam (lr = 0.0001)
SchedulerReduceLROnPlateau(mode = “min”, patience = 5, factor = 0.5)
Loss FunctionCross-Entropy (CE) + Dice Loss
Table 6. Accuracy metrics of eucalyptus maturity identification by U-Net on different datasets.
MethodOA (%)MIOU (%)Precision (%)Recall (%)F1-Score (%)
Train Validation Train Validation Train Validation Train Validation Train Validation
S292.5491.0278.5175.1886.8285.7788.1886.3687.4385.89
S2+S192.4390.8678.2073.3788.1183.8788.6484.7688.3284.03
S2+SI92.9091.0879.3276.4188.8186.4089.3286.7389.0186.16
S2+S1+SI92.2490.4578.4472.1487.9683.2188.7084.3688.2883.18
Table 7. Accuracy metrics of eucalyptus maturity identification by Trans-UNet on different datasets.
MethodOA (%)MIOU (%)Precision (%)Recall (%)F1-Score (%)
Train Validation Train Validation Train Validation Train Validation Train Validation
S289.8286.3366.1762.9475.9173.6481.4179.6278.2175.50
S2+S190.3586.4674.1067.9484.2379.9985.3481.5784.5880.22
S2+SI90.5690.1374.3771.0584.0682.2185.8084.1784.8182.46
S2+S1+SI89.0688.2771.2369.0381.6679.5985.1883.4183.1280.96
Table 8. Accuracy metrics of eucalyptus maturity identification by Swin-UNet on different datasets.
MethodOA (%)MIOU (%)Precision (%)Recall (%)F1-Score (%)
Train Validation Train Validation Train Validation Train Validation Train Validation
S293.5292.6478.9075.8093.4587.5093.4487.6093.4587.55
S2+S193.3391.2479.5474.9093.1287.2093.1187.0093.1287.10
S2+SI93.7492.9580.6277.0093.6588.0093.6588.1093.6488.05
S2+S1+SI93.4192.3679.4675.3093.2287.3093.2287.7093.2287.50
Table 9. Accuracy metrics of eucalyptus maturity identification by Mamba-UNet on different datasets.
MethodOA (%)MIOU (%)Precision (%)Recall (%)F1-Score (%)
Train Validation Train Validation Train Validation Train Validation Train Validation
S294.6293.0781.3577.7294.6087.1494.6087.2394.6087.18
S2+S194.6493.5181.4878.3894.6387.4694.6387.2594.6387.35
S2+SI94.6694.0281.5879.1094.6588.2294.6588.3194.6588.26
S2+S1+SI94.6793.7881.5078.5594.6687.9494.6687.7394.6687.83
Table 10. Area statistics of land-cover types in the study area.
IDSurface Feature TypeArea (km2)Number of PixelsPercentage of the Study Area (%)
0Others92.14921,38439.85
1Middle-Aged Eucalyptus Forests31.50314,95413.62
2Mature Eucalyptus Forests59.79597,88925.86
3Young Eucalyptus Forests47.79477,93120.67
Total231.222,312,158.00100.00
Disclaimer/Publisher’s Note: The statements, opinions and data contained in all publications are solely those of the individual author(s) and contributor(s) and not of MDPI and/or the editor(s). MDPI and/or the editor(s) disclaim responsibility for any injury to people or property resulting from any ideas, methods, instructions or products referred to in the content.