Article

Spatial Heterogeneity and Driving Mechanisms of Carbon Storage on the Chinese Loess Plateau

1
Linze Inland River Basin Research Station, State Key Laboratory of Ecological Safety and Sustainable Development in Arid Lands, China and Iran Joint Laboratory on Agriculture and Ecology in Arid Regions, Northwest Institute of Eco-Environment and Resources, Chinese Academy of Sciences, Lanzhou 730000, China
2
Institute of Biology, National Academy of Sciences of the Kyrgyz Republic, Bishkek 720071, Kyrgyzstan
3
Jalal-Abad Scientific Center, National Academy of Science of the Kyrgyz Republic, Jalal-Abad 715600, Kyrgyzstan
4
Chair of Water Resources Management and Modeling of Hydrosystems, Technische Universitat Berlin, 13355 Berlin, Germany
*
Author to whom correspondence should be addressed.
Remote Sens. 2026, 18(15), 2630; https://doi.org/10.3390/rs18152630
Submission received: 31 March 2026 / Revised: 5 July 2026 / Accepted: 6 July 2026 / Published: 6 August 2026

Highlights

What are the main findings?
  • Carbon storage (CS) increased from 1980 to 2020, mainly due to afforestation, but the gains were spatially uneven.
  • Topography exerted the strongest influence on CS, followed by vegetation, climate, and socioeconomic factors.
What are the implications of the main findings?
  • Spatially differentiated carbon management strategies are needed for the Loess Plateau.
  • Water availability and topographic constraints should be considered when designing ecological restoration policies in semi-arid regions.

Abstract

The Chinese Loess Plateau is a vast semi-arid landscape that has experienced substantial vegetation recovery through afforestation since the late twentieth century, altering the regional carbon cycle and contributing to China’s carbon neutrality efforts. However, large-scale quantification of carbon storage (CS) remains challenging in this heterogeneous and erosion-prone landscape. In this study, the PLUS land-use simulation model was coupled with an InVEST-based carbon storage accounting framework, and multi-source remote sensing and field survey data were integrated to quantify historical carbon storage from 1980 to 2020 and predict carbon storage in 2040 under three future land-use scenarios: natural development (ND), cultivated land protection (CLP), and ecological protection (EP). The results showed that NDVI exhibited a distinct southeast-to-northwest gradient, with peak values (>0.8) in the southeastern tablelands, where CS reached 10.27 ± 4.20 kg C m−2. Carbon storage increased from 1980 to 2020, primarily due to afforestation, with higher CS in the humid southeastern plateau and lower CS in the arid northwest. Scenario simulation showed that CS maintained a baseline level of 7.07 ± 3.81 kg C m−2 under the ND scenario, increased slightly to 7.08 ± 3.77 kg C m−2 under the CLP scenario, and reached the highest value of 7.10 ± 3.80 kg C m−2 under the EP scenario. SEM-based mechanism analysis indicated that topography exerted the strongest direct influence on CS, followed by vegetation, climate, and socioeconomic factors. These findings suggest that water availability and topographic constraints strongly regulate CS in semi-arid regions, while land-use policy can still modify CS through scenario-dependent land-use change.

1. Introduction

The Chinese Loess Plateau is a vast semi-arid landscape that plays a crucial role in water conservation, soil erosion control, and carbon sequestration [1,2,3]. However, it is also one of the most ecologically fragile yet environmentally significant regions globally, characterized by severe soil erosion and ecosystem degradation caused by long-term intensive human activities and climate change [1,2,3,4,5,6]. In arid and semi-arid regions, water availability is often a key constraint on vegetation productivity and ecosystem carbon accumulation. Topographic factors, such as elevation and terrain slope, can further regulate carbon storage by influencing soil erosion, soil moisture redistribution, vegetation establishment, and land-use suitability [2,5,7].
Since the late twentieth century, the plateau has experienced transformative vegetation recovery through afforestation, contributing substantially to China’s greening and primary productivity [8,9,10,11,12,13]. This dramatic land cover transformation has significantly altered the regional carbon cycle, making the Chinese Loess Plateau a critical terrestrial carbon sink and a key component of China’s efforts to achieve carbon neutrality, which has been historically underestimated in global carbon budgets. Consequently, developing quantitative approaches to investigate the spatial patterns of carbon storage and mechanisms that influence these patterns remains an urgent priority to support policy decisions on ecological carbon sequestration, climate change mitigation, and sustainable Land-use on the plateau [14,15,16,17].
Generally, grasslands represent the dominant carbon pool in the Loess Plateau ecosystem, followed by forests and farmland [18,19,20]. Aboveground biomass constitutes the largest share, followed by the surface soil, which together comprise the majority of the total carbon pool among ecosystem components [18,19,21,22,23]. However, the plateau’s spatial distribution of carbon storage exhibits a pronounced south-to-north trend of decreasing carbon density that has been shaped by the interplay of climate gradients, topography, and land-use patterns [18,19,24]. Simultaneously, human interventions through land-use changes, such as conversion of grassland to agriculture and site restoration, have become important drivers of carbon stock variations, including afforestation programs, agricultural intensification, and urban expansion [25,26,27,28], destabilizing carbon sequestration services and undermining long-term carbon neutrality goals.
Furthermore, future carbon storage may face increasing pressure under predicted global warming scenarios, particularly in the plateau’s northwestern region, where ecosystem adaptability is already low due to the harsh environment [29,30,31]. Consequently, reconciling multi-objective land-use demands with optimization of carbon sequestration services has emerged as a critical challenge for sustainable governance of the Chinese Loess Plateau and analogous regions globally [17,32,33]. However, existing studies have often focused on individual carbon components or short-term restoration effects, while integrated assessments of total ecosystem carbon storage and its climatic, topographic, vegetation, socioeconomic, and land-use drivers remain limited [34,35].
Recent studies in arid and semi-arid regions, including oasis urban agglomerations, have shown that land-use change, water availability, urban expansion, and ecological restoration can substantially alter regional carbon storage and ecosystem services. These studies provide useful references for carbon management in water-limited landscapes. However, the Loess Plateau differs from typical oasis systems because it is characterized by deep loess deposits, severe soil erosion, strong topographic gradients, and large-scale ecological restoration [36,37].
Previous studies on the Loess Plateau have provided valuable insights into soil organic carbon accumulation, vegetation biomass recovery, and productivity changes following ecological restoration. However, many studies have focused on individual carbon pools or short-term restoration effects, rather than evaluating total ecosystem carbon storage across long-term land-use transitions. In addition, the interactions among climate gradients, topographic constraints, vegetation recovery, socioeconomic development, and land-use policy have rarely been examined within a unified analytical framework. This limits the ability to distinguish the relative contributions of natural environmental controls and human-driven land-use change to regional carbon storage patterns. Methodological differences between remote sensing estimates and field-based measurements also introduce uncertainty into regional carbon storage assessments, further highlighting the need for an integrated framework that combines field observations, spatial analysis, land-use simulation, and mechanism analysis [38,39].
Multiple interacting mechanisms govern carbon storage dynamics, and these mechanisms operate across different spatial and temporal scales. At the landscape level, the pattern–process–function framework reveals that land-use patterns fundamentally determine the spatial distribution and aggregation of carbon sequestration functions, while evolutionary processes create distinct carbon zones [18,19,33]. The conversion of unused land to forest or grassland through ecological restoration programs has been identified as the primary driver of increased carbon storage in some regions. The strategic adaptation of land-use patterns is recognized as an effective and cost-efficient approach for enhancing carbon sequestration, and sustaining China’s “dual-carbon” (peak C emission by 2030 and net zero by 2050) policy framework [40,41,42].
The Chinese Loess Plateau has undergone substantial ecological transformation through large-scale restoration programs such as the Grain for Green Program. However, the mechanisms governing carbon storage (CS) dynamics in this heterogeneous and erosion-prone landscape remain insufficiently quantified, particularly regarding how topographic, climatic, vegetation, land-use, and socioeconomic factors interact across space.
This study combines remote sensing data, field survey data, land-use simulation, and multivariate statistical analysis to quantify and explain carbon storage dynamics across the Chinese Loess Plateau. Land-use data from 1980 to 2020 were integrated with environmental and socioeconomic datasets to estimate historical carbon storage. The PLUS–InVEST framework was then used to project carbon storage in 2040 under three scenarios: natural development, cultivated land protection, and ecological protection. Spatial analysis, redundancy analysis, linear mixed-effects modeling, and structural equation modeling were applied to identify spatial patterns, dominant drivers, and direct or indirect pathways influencing carbon storage.
The specific objectives of this study were to: (1) simulate the temporal and spatial variation in Land-use and carbon storage under different management scenarios from 1980 to 2040; (2) determine the dominant controls on regional carbon storage dynamics; (3) assess the spatial distributions of key environmental and socioeconomic drivers and their associations with carbon storage; and (4) uncover the underlying mechanisms governing carbon storage changes through an integrated analysis of biophysical and anthropogenic influences. These findings are expected to provide scientific support for spatially differentiated carbon management on the Loess Plateau and for comparable semi-arid and erosion-prone regions.

2. Materials and Methods

2.1. Study Area

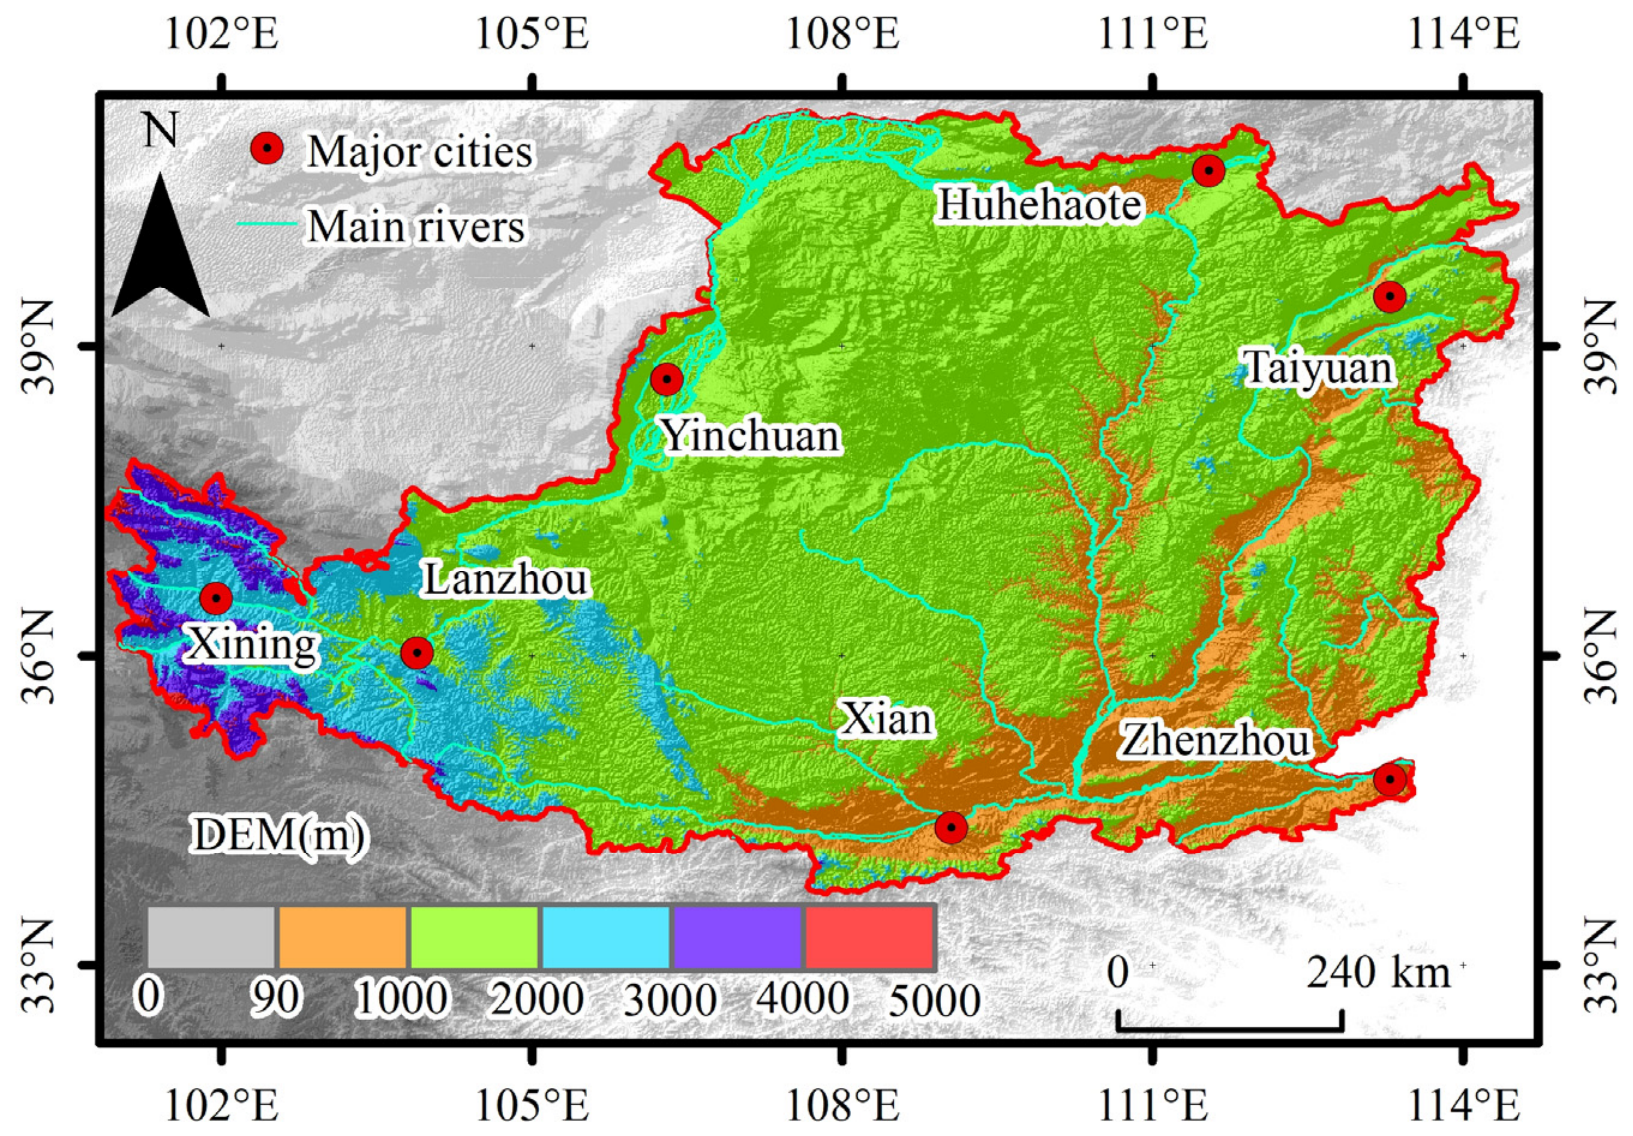
The Loess Plateau (34°N to 40°N, 103°E to 114°E) encompasses approximately 640,000 km2 and spans seven provinces in central China. It represents the world’s largest loess deposit and is a critical ecological transition zone between semi-arid and sub-humid climate zones (Figure 1). This region is dominated by a semi-arid continental monsoon climate. The annual mean temperature is approximately 9.5 °C, with monthly averages ranging from −7.8 °C in January to 26.3 °C in July. The frost-free period averages 165 days per year. Annual precipitation averages 450 mm, with about 70% of rainfall concentrated between June and September, typically occurring as moderate–intense events. Winter precipitation accounts for less than 5% of the annual total. Potential evapotranspiration is estimated at 1200 mm annually, which greatly exceeds precipitation and contributes to frequent water deficits. The soils are primarily deep loess deposits, characterized by high silt content (40–60%) and susceptibility to erosion. Land-use in the region is dominated by a mosaic of farmland, grassland, and forest, with extensive terracing and soil conservation measures implemented to mitigate degradation caused by erosion. The complex topography, combined with variable land-use patterns, creates heterogeneous spatial distributions of carbon sequestration services, which are critical for optimizing land management under land-use change scenarios. Because the Loess Plateau spans multiple provinces and administrative units, translating carbon storage assessments into national carbon neutrality decision-making is administratively complex. Carbon management in this region requires coordination across different administrative levels, sectors, and local land-use priorities, rather than implementation by a single decision-making body. Therefore, spatially differentiated and cross-regional governance is needed to apply carbon storage findings to land management and ecological restoration planning.

2.2. Data Sources and Processing

Data on environmental and socioeconomic dynamics in the Loess Plateau region were obtained from multiple sources (Table 1). Land-use data (30 × 30 m resolution) and vegetation indices, including net primary productivity (NPP) and the normalized-difference vegetation index (NDVI), were obtained from the Resource and Environment Science and Data Center (RAESDC; http://www.resdc.cn, accessed on 8 September 2025). Socioeconomic data, which comprised gross domestic product (GDP) and population density (POP), were obtained from the RAESDC. Data for four climate variables were extracted (annual precipitation, PCP; temperature, Temp; potential evaporation, EVP; and actual evapotranspiration, ET) from the RAESDC. An aridity index (AI) was derived as the ratio of EVP to PCP to quantify regional dryness. Topographic data, including a digital elevation model (DEM) at 30 m resolution, were acquired from China’s Geospatial Data Cloud (http://www.gscloud.cn, accessed on 8 September 2025). Slope, longitude (Long), and latitude (Lat) were computed using the spatial analyst tools in version 10.6 of ArcGIS (http://www.esri.com, accessed on 8 September 2025). Although historical carbon storage was estimated for 1980, 2000, and 2020 based on land-use data and carbon density coefficients, the driving factor analysis mainly focused on the recent period, especially the spatial pattern of carbon storage and driving relationships across 2000–2020. Therefore, the climatic, vegetation, topographic, and socioeconomic variables listed in Table 1 were used to explain recent spatial heterogeneity rather than to fully reconstruct the temporal driving mechanisms of carbon storage change across the entire 1980–2020 period.

2.3. Methodology

To clarify the relationship between the research objectives and the analytical methods, this study followed a stepwise methodological framework. First, multi-source land-use, vegetation, climatic, topographic, and socioeconomic datasets were collected and processed to provide the spatial database for carbon storage assessment and driver analysis. Second, an InVEST-based carbon storage accounting framework, parameterized using field survey data and literature-based carbon density coefficients, was used to estimate carbon storage in 1980, 2000, and 2020. This step addressed the objective of quantifying historical spatiotemporal changes in land-use and carbon storage. Third, the PLUS model was used to simulate land use patterns in 2040 under three scenarios: natural development, cultivated land protection, and ecological protection. The simulated land-use maps were then coupled with the carbon storage accounting framework to project future carbon storage under different management scenarios. Fourth, spatial analysis was used to characterize the geographic patterns of carbon storage and its environmental and socioeconomic drivers across the Loess Plateau. Fifth, Pearson correlation analysis and redundancy analysis (RDA) were used to identify bivariate relationships and quantify the relative contributions of different driver groups. Sixth, linear mixed-effects models were applied to test the main effects and interaction effects of climatic, vegetation, topographic, and socioeconomic factors while accounting for land-use-related differences in baseline carbon storage. Finally, structural equation modeling (SEM) was used to examine the direct and indirect pathways through which multiple drivers influenced carbon storage. Together, these methods were designed to address the four objectives stated in the Introduction: simulating land-use and carbon storage changes, identifying dominant controls, assessing spatial driver patterns, and uncovering the mechanisms governing carbon storage dynamics.

2.3.1. Carbon Storage Assessment

Carbon storage was estimated using a land-use-based carbon density accounting framework. Following the InVEST carbon storage approach, total carbon storage was calculated according to [19]:
Ct = Σi=1n Ai,t × Di,
where Ct represents the total carbon storage in year t, Ai,t represents the area of land-use type i in year t, and Di represents the total ecosystem carbon density assigned to land-use type i. Six land-use classes were included in this study: farmland, woodland, grassland, water area, construction land, and unused land.
For each land-use type, total ecosystem carbon density was calculated as the sum of four carbon pools:
Di = Ci,above + Ci,below + Ci,soil + Ci,dead,
where Ci,above, Ci,below, Ci,soil, and Ci,dead represent aboveground biomass carbon density, belowground biomass carbon density, soil organic carbon density, and dead organic matter carbon density for land-use type i, respectively.
To derive land-use-specific carbon density coefficients, field surveys and laboratory analyses were conducted across representative sites in the Loess Plateau covering farmland, woodland, grassland, water bodies, construction land, and unused land. A representative stratified sampling strategy was used based on the 2020 land-use map, vegetation coverage, topographic heterogeneity, and field accessibility. For woodland, sampling plots were selected to represent high-, medium-, and low-coverage woodland. For grassland, sampling plots were selected to represent high-, medium-, and low-coverage grassland. Farmland, unused land, construction land, and water-body margins were also sampled from representative areas within each land-use class. Although this sampling design was intended to capture the main within-class variability in vegetation structure and carbon density among the major land-use types, the large spatial extent and strong climatic and geomorphic heterogeneity of the Loess Plateau cannot be fully represented by the current sampling network. For each land-use type, 40 sampling plots were established, resulting in a total of 240 plots. Within each plot, five replicate measurements or subplots were collected for vegetation biomass, litter, and soil sampling. Geographic coordinates, elevation, slope, aspect, vegetation characteristics, and land-use information were recorded for each plot using a handheld GPS and standardized field forms. Plot size varied by land-use type and vegetation structure. In woodland, tree biomass was measured within 20 m × 20 m plots, with five 5 m × 5 m shrub subplots and five 1 m × 1 m herb/litter subplots nested within each plot. In farmland, grassland, and unused land, five 1 m × 1 m quadrats were established within each plot for biomass, litter, and root sampling. In construction land and along water-body margins, where vegetation was generally sparse, five 1 m × 1 m quadrats were placed in vegetated microsites where available, while soil samples were collected from all plots.
For aboveground biomass estimation in woodland, all trees within each plot were identified to species, and two tree structural variables were measured: diameter at breast height (DBH, measured at 1.3 m above the ground) and total tree height. These two variables were then used in species-specific or generalized allometric equations to estimate tree aboveground biomass [43,44]. Tree aboveground biomass was estimated using species-specific or generalized allometric equations of the form:
B t r e e = a ( D B H ) b ( H ) c ,
where B tree is tree aboveground biomass, D B H is diameter at breast height, H is tree height, and a , b , and c are empirical coefficients. In herbaceous vegetation, including farmland, grassland, unused land, and the herb layer of woodland, all aboveground biomass within each 1 m × 1 m quadrat was clipped at ground level during the peak biomass period, oven-dried at 65–75 °C to constant mass, and weighed. Belowground biomass was measured from the same quadrats used for aboveground harvest. Soil monoliths or cores were collected to a depth of 0–30 cm, and roots were separated by washing, oven-dried, and weighed. When direct excavation of coarse roots was not feasible, belowground biomass was estimated using root-to-shoot ratios. Dead organic matter, including litter, small woody debris, standing dead herbaceous material, and retained crop residues, was collected from five 1 m × 1 m replicate subplots in each plot where present, oven-dried to constant mass, and weighed. Soil samples were collected from every plot to estimate soil organic carbon density. In each plot, five replicate soil cores were taken and composited by depth interval for carbon concentration analysis, while separate undisturbed cores were used for bulk density measurement. Sampling depths were 0–20 cm, 20–40 cm, 40–60 cm, 60–80 cm, and 80–100 cm, allowing estimation of soil carbon density in the 0–100 cm profile. Soil samples were air-dried, sieved through a 2 mm mesh, and analyzed for soil organic carbon using either the potassium dichromate oxidation method or an elemental analyzer, depending on instrument availability and soil properties. For each land-use type, plot-level carbon density values were first averaged across the five replicates, and then aggregated across the 40 plots to obtain class-level mean coefficients:
D ¯ i k = 1 n i p = 1 n i   D i , p k   ,
where D ¯ i k is the mean carbon density of component k for land-use type i , D i , p k is the carbon density measured in plot p , and n i = 40 is the number of plots for land-use type i .
In this study, carbon storage in 1980, 2000, and 2020 was estimated using land-use maps and a consistent set of land-use-specific carbon density coefficients derived mainly from field measurements and literature-based parameterization (Table 2). This approach was adopted to ensure comparability among different years and to isolate the effect of land-use change on regional carbon storage. However, carbon density is not temporally constant in reality. Vegetation biomass carbon and soil organic carbon can change with forest age, restoration duration, community succession, and soil carbon accumulation, especially in areas affected by the Grain for Green Program. Therefore, the historical carbon storage estimates should be interpreted as land-use-based estimates under a consistent coefficient framework, rather than as a complete reconstruction of time-varying carbon density dynamics.

2.3.2. PLUS Model

(1) Model Overview
The PLUS model was used to simulate future land-use patterns under different scenarios. Because the theoretical structure and implementation of the PLUS model have been described in previous land-use simulation studies, only the key procedures relevant to this study are summarized here. The model estimates land-use transition potential based on spatial driving factors and allocates future land-use demand through a cellular automata mechanism with neighborhood competition. In this study, the PLUS model was used to project land-use patterns in 2040 under three scenarios: natural development, cultivated land protection, and ecological protection [44,45].
(2) Scenario Parameterization
Natural Development Scenario (2040-ND). This scenario assumes the continuation of land-use change trends observed from 2000 to 2020. Land-use transitions among different land-use classes were allowed according to the Markov transition probability matrix and PLUS allocation rules, but no additional policy constraints were imposed. With an interval of 20 years, we used the Markov-Chain function of the PLUS model to predict the land-use demand in 2040 under this scenario, in which the land expansion capacity, land-use transfer matrix, domain factor weights, and habitat quality index were kept consistent with those from 2000 to 2020.
Protection of Cultivated Land Scenario (2040-CLP). The security of cultivated land is the foundation for a country’s food security. Cultivated land can be protected by controlling the probability of converting farmland to other land-use types and preventing the expansion of construction land. Under the cultivated land protection scenario, the conversion probability of cultivated land to other land-use types was reduced to 60% of that under the natural development scenario, thereby restricting farmland loss and strengthening cultivated land protection.
Ecological Protection Scenario (2040-EP). This scenario was designed to strengthen ecological conservation and restoration. The conversion probability of ecological land, including woodland, grassland, and water area, to unused land or construction land was reduced by 50% relative to the natural development scenario. In contrast, the conversion probability of unused land to ecological land, including woodland, grassland, and water area, was increased to promote ecological restoration. Water area was assumed to remain stable and was restricted from conversion to other land-use types.
(3) Model Validation
Model validation was conducted using the receiver operating characteristic (ROC) curve. ROC validation is commonly used in land-use simulation studies to evaluate the ability of a model to distinguish between changed and unchanged cells or between suitable and unsuitable transition areas. In this study, ROC values greater than 0.85 for all land-use categories indicated that the PLUS model had acceptable predictive performance for scenario simulation.
R O C = 1 2 1 + A A + B C C + D ,
where A and B represent correct and incorrect change predictions, respectively, whereas C and D denote correct and incorrect persistence predictions, respectively. The framework achieved ROC values > 0.85 across all land-use categories, confirming that the model had acceptable predictive performance.

2.3.3. Linear Mixed-Effects Model

To clarify the structure of the linear mixed-effects model, climatic factors, vegetation factors, topographic factors, and socioeconomic factors were treated as fixed effects, whereas land-use type was included as a random intercept to account for differences in baseline carbon storage among land-use categories. This random-effect structure was adopted because farmland, woodland, grassland, water bodies, construction land, and unused land have distinct carbon density characteristics and management backgrounds. The model was expressed as:
CSij = β0 + βXij + uj + εij,
where CSij represents carbon storage of observation i within land-use type j, Xij denotes the vector of fixed-effect predictors, β represents the corresponding fixed-effect coefficients, uj is the random intercept for land-use type j, and εij is the residual error term.

2.3.4. Multivariate Driver Analysis

To clarify the relationships between carbon storage and its potential drivers, several complementary statistical methods were used. These methods were selected to identify individual correlations, dominant controls, interaction effects, and direct or indirect pathways.
Pearson correlation analysis was first used to examine the direction and strength of bivariate relationships between carbon storage and climatic, vegetation, topographic, and socioeconomic variables. This step provided a preliminary screening of potential drivers.
Redundancy analysis (RDA) was then used to quantify the relative contributions of different drivers to the spatial variation of carbon storage and land-use change. This method helped identify the main environmental and socioeconomic gradients associated with carbon storage heterogeneity.
Linear mixed-effects models (LMMs) were used to test the main effects and interaction effects of multiple driver groups on carbon storage. Climatic, vegetation, topographic, and socioeconomic factors were treated as fixed effects, while land-use type was included as a random intercept to account for differences in baseline carbon density among land-use classes.
Structural equation modeling (SEM) was further used to examine the direct and indirect pathways through which multiple drivers affected carbon storage. The initial SEM structure was developed based on ecological theory, previous studies, and the results of Pearson correlation analysis, RDA, and LMMs. This method was used to clarify the causal structure of the driving mechanisms of carbon storage.

2.3.5. Spatial Analysis

Spatial analysis was used to characterize the geographic patterns of carbon storage and its potential drivers across the Loess Plateau. All raster datasets, including Land-use, carbon storage, climatic variables, vegetation indices, topographic factors, and socioeconomic variables, were projected to a common coordinate system and resampled to a consistent spatial resolution. Spatial overlay analysis and raster-based extraction were used to compare carbon storage with environmental and socioeconomic variables at the pixel scale. Zonal statistics were used to summarize carbon storage across different land-use types, climatic zones, topographic gradients, and future land-use scenarios. Spatial autocorrelation analysis, including Moran’s I, was used to evaluate whether each variable showed clustered, dispersed, or random spatial patterns. This spatial analysis was necessary to identify regional gradients, hotspots, and spatial mismatches between carbon storage and its drivers, and it provided the basis for interpreting the spatial heterogeneity of carbon storage before applying multivariate statistical models.

3. Results

3.1. Spatial Pattern of Environmental and Socioeconomic Factors and Their Relationships with Carbon Storage

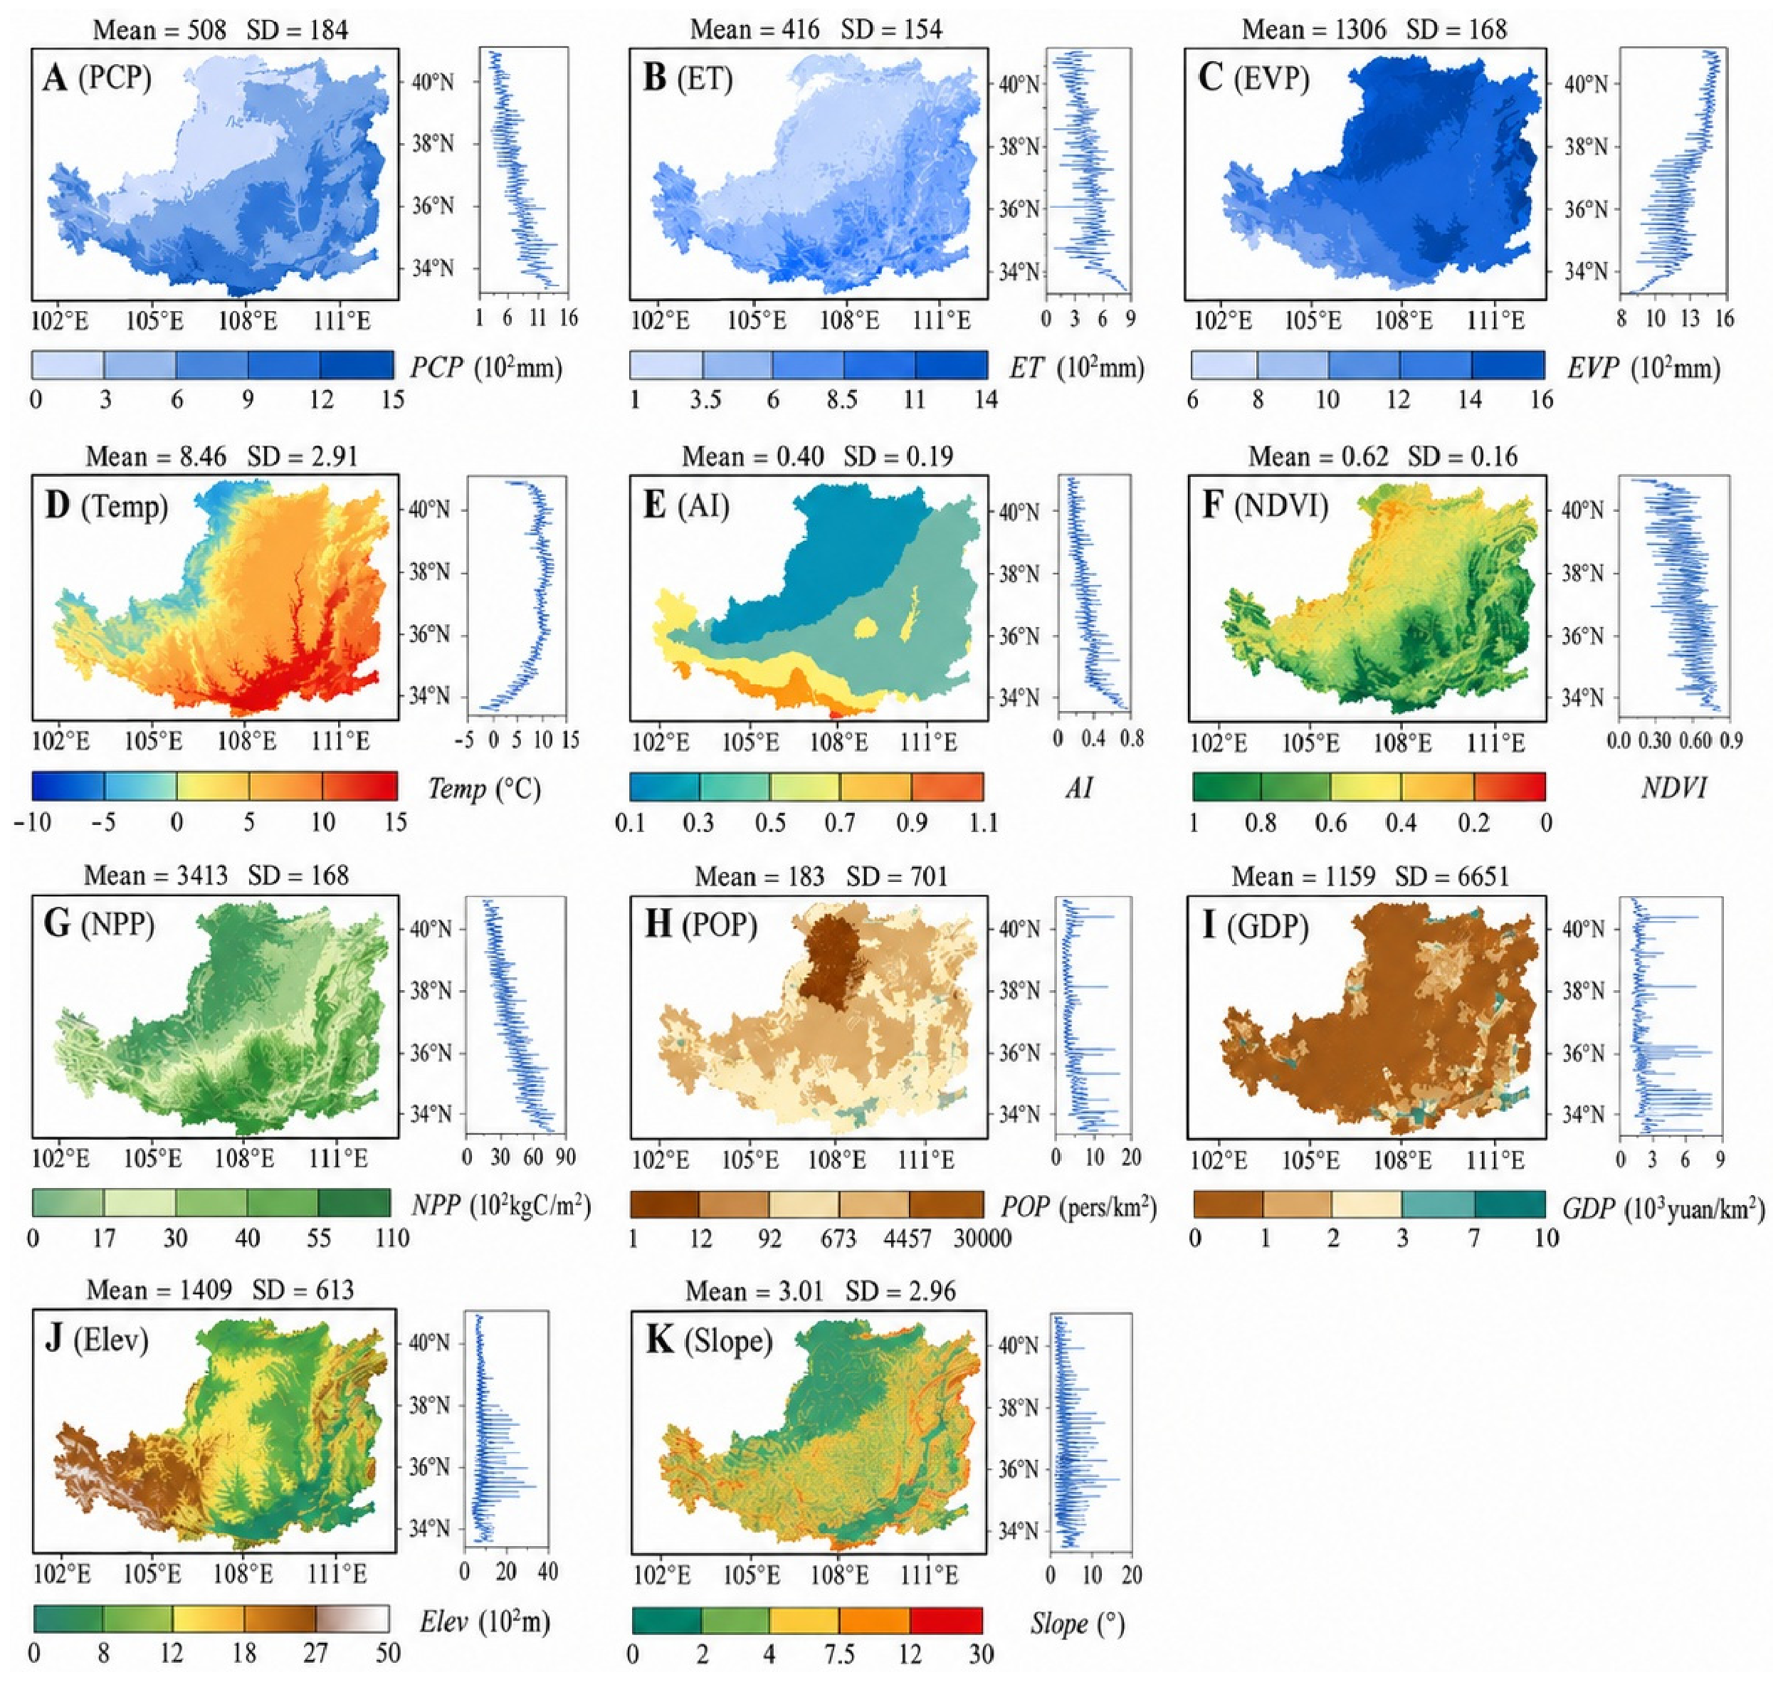
Spatial analysis revealed the geographic patterns of the environmental and socioeconomic factors across the plateau (Figure 2 and Figure 3). The spatial distribution of influencing factors exhibited marked heterogeneity, with clear regional gradients for most variables: precipitation (Figure 2A, mean = PCP, 508 ± 184 mm, Moran’s I = 0.45) decreases from southeast to northwest, with high-PCP regions (>700 mm) concentrated along the monsoon-receiving margins of the study area (35 to 40°N, 105 to 112°E) and low-PCP regions (<300 mm) in the arid northwest (37 to 40°N, 103 to 108°E). The spatial coupling with CS mirrors the regional monsoon pattern, with high-CS clusters concentrated in southeastern areas that receive >700 mm annual precipitation (CS = 8.95 ± 4.41 kg C m−2) and low-CS clusters in the arid northwest (<300 mm precipitation; CS = 4.95 ± 2.68 kg C m−2). Actual evapotranspiration showed a similar spatial pattern (mean ET = 416 ± 154 mm), with southeastern high-ET (>600 mm) co-located with CS hotspots (9.57 ± 4.23 kg C m−2) (Figure 2B). Potential evaporation (mean EVP = 1306 ± 168 mm, Moran’s I = −0.14) showed a different spatial pattern, peaking in the northwest (37 to 40°N, 106 to 111°E) and exhibiting negative spatial autocorrelation with CS. High-EVP regions (from 1362 to 1438 mm) were consistently adjacent to areas with reduced CS (5.13 ± 3.07. kg C m−2 vs. 7.95 ± 3.83 kg C m−2 in low-EVP zones) (Figure 2C). Temperature (mean = 8.46 ± 2.91 °C; Moran’s I = −0.12) showed weak but meaningful spatial trends, with the maximum CS at 10 to 12 °C (5.29 ± 3.37 kg C m−2) (Figure 2D). The aridity index (mean AI = 0.4 ± 0.19, Moran’s I = −0.12) reveals a pronounced northwest to southeast gradient, with the most arid areas in the northwest. The negative spatial autocorrelation reflects the transitional nature of moisture regimes, with hyper-arid zones (AI < 0.3; mean = 5.55 ± 2.76 kg C m−2) typically adjacent to semi-arid areas (AI = 0.3 to 0.4; mean = 6.27 ± 3.45 kg C m−2) rather than forming continuous arid regions (Figure 2E). Of the vegetation factors, NDVI (mean = 0.62 ± 0.16) exhibits a distinct southeast to northwest gradient, with peak values (>0.8) clustering in the southeastern tablelands, where CS reaches 10.27 ± 4.20 kg C m−2.
In contrast, sparse vegetation (NDVI < 0.4) dominates the arid northwest, and coincides with low carbon stocks (5.12 ± 2.71 kg C m−2) (Figure 2F). NPP (mean = 3413 ± 168 g C m−2 yr−1; Moran’s I = −0.43) showed strong spatial coupling with CS, with high-productivity zones (7.47 ± 4.14 kg C m−2) in the southeast (>3600 g C m−2 yr−1). These comprised 27.97% greater carbon accumulation than in the low-productivity (5.38 ± 2.86 kg C m−2) northwestern regions (<3200 g C m−2 yr−1). This pattern reflects both climatic constraints and human management, since terraced farmland increased carbon sequestration in transitional areas (Figure 2G).
Of the socioeconomic factors, population density (POP, mean = 183 ± 701 persons/km2) had a weakly negative spatial autocorrelation, indicating a relatively dispersed settlement pattern (Figure 2H). Gross domestic product (GDP, mean = 1159 ± 6651 yuan/km2) showed a weak negative spatial autocorrelation, with economic activity concentrated along transportation corridors and in prefectural capitals. While the highest economic productivity zones (>5000 yuan/km2) occupied merely 2.80% of the study area, they contributed disproportionately to regional output (47.15% of total GDP) yet maintained negligible CS representation (0.2% of total CS) (Figure 2I).
Of the topographic factors, elevation (Elev; 1409 ± 613 m) showed weak spatial clustering, with higher values (>2000 m) concentrated in the southwestern highlands where steep slopes limit carbon accumulation (7.36 ± 3.59 kg C m−2). In contrast, lower elevations (<800 m) in eastern valleys supported higher CS (4.43 ± 3.02 kg C m−2) due t the gentler terrain and increased vegetation productivity (Figure 2J). Slope (mean = 3.01 ± 2.96) showed a clear spatial dichotomy in carbon storage, with gentle slopes (0–2°) exhibiting significantly lower values (5.01 ± 3.02 kg C m−2) compared to steeper slopes (>8°: 9.36 ± 4.12 kg C m−2). This pattern likely reflects reduced erosion and enhanced water retention on steeper terrain, where slope stability promotes vegetation growth and organic matter accumulation (Figure 2K). These findings revealed that the Loess Plateau’s CS was primarily driven by moisture-controlled productivity in the southeast, while in the northwest, carbon stocks were limited by aridity and mediated by topographic and socioeconomic factors.
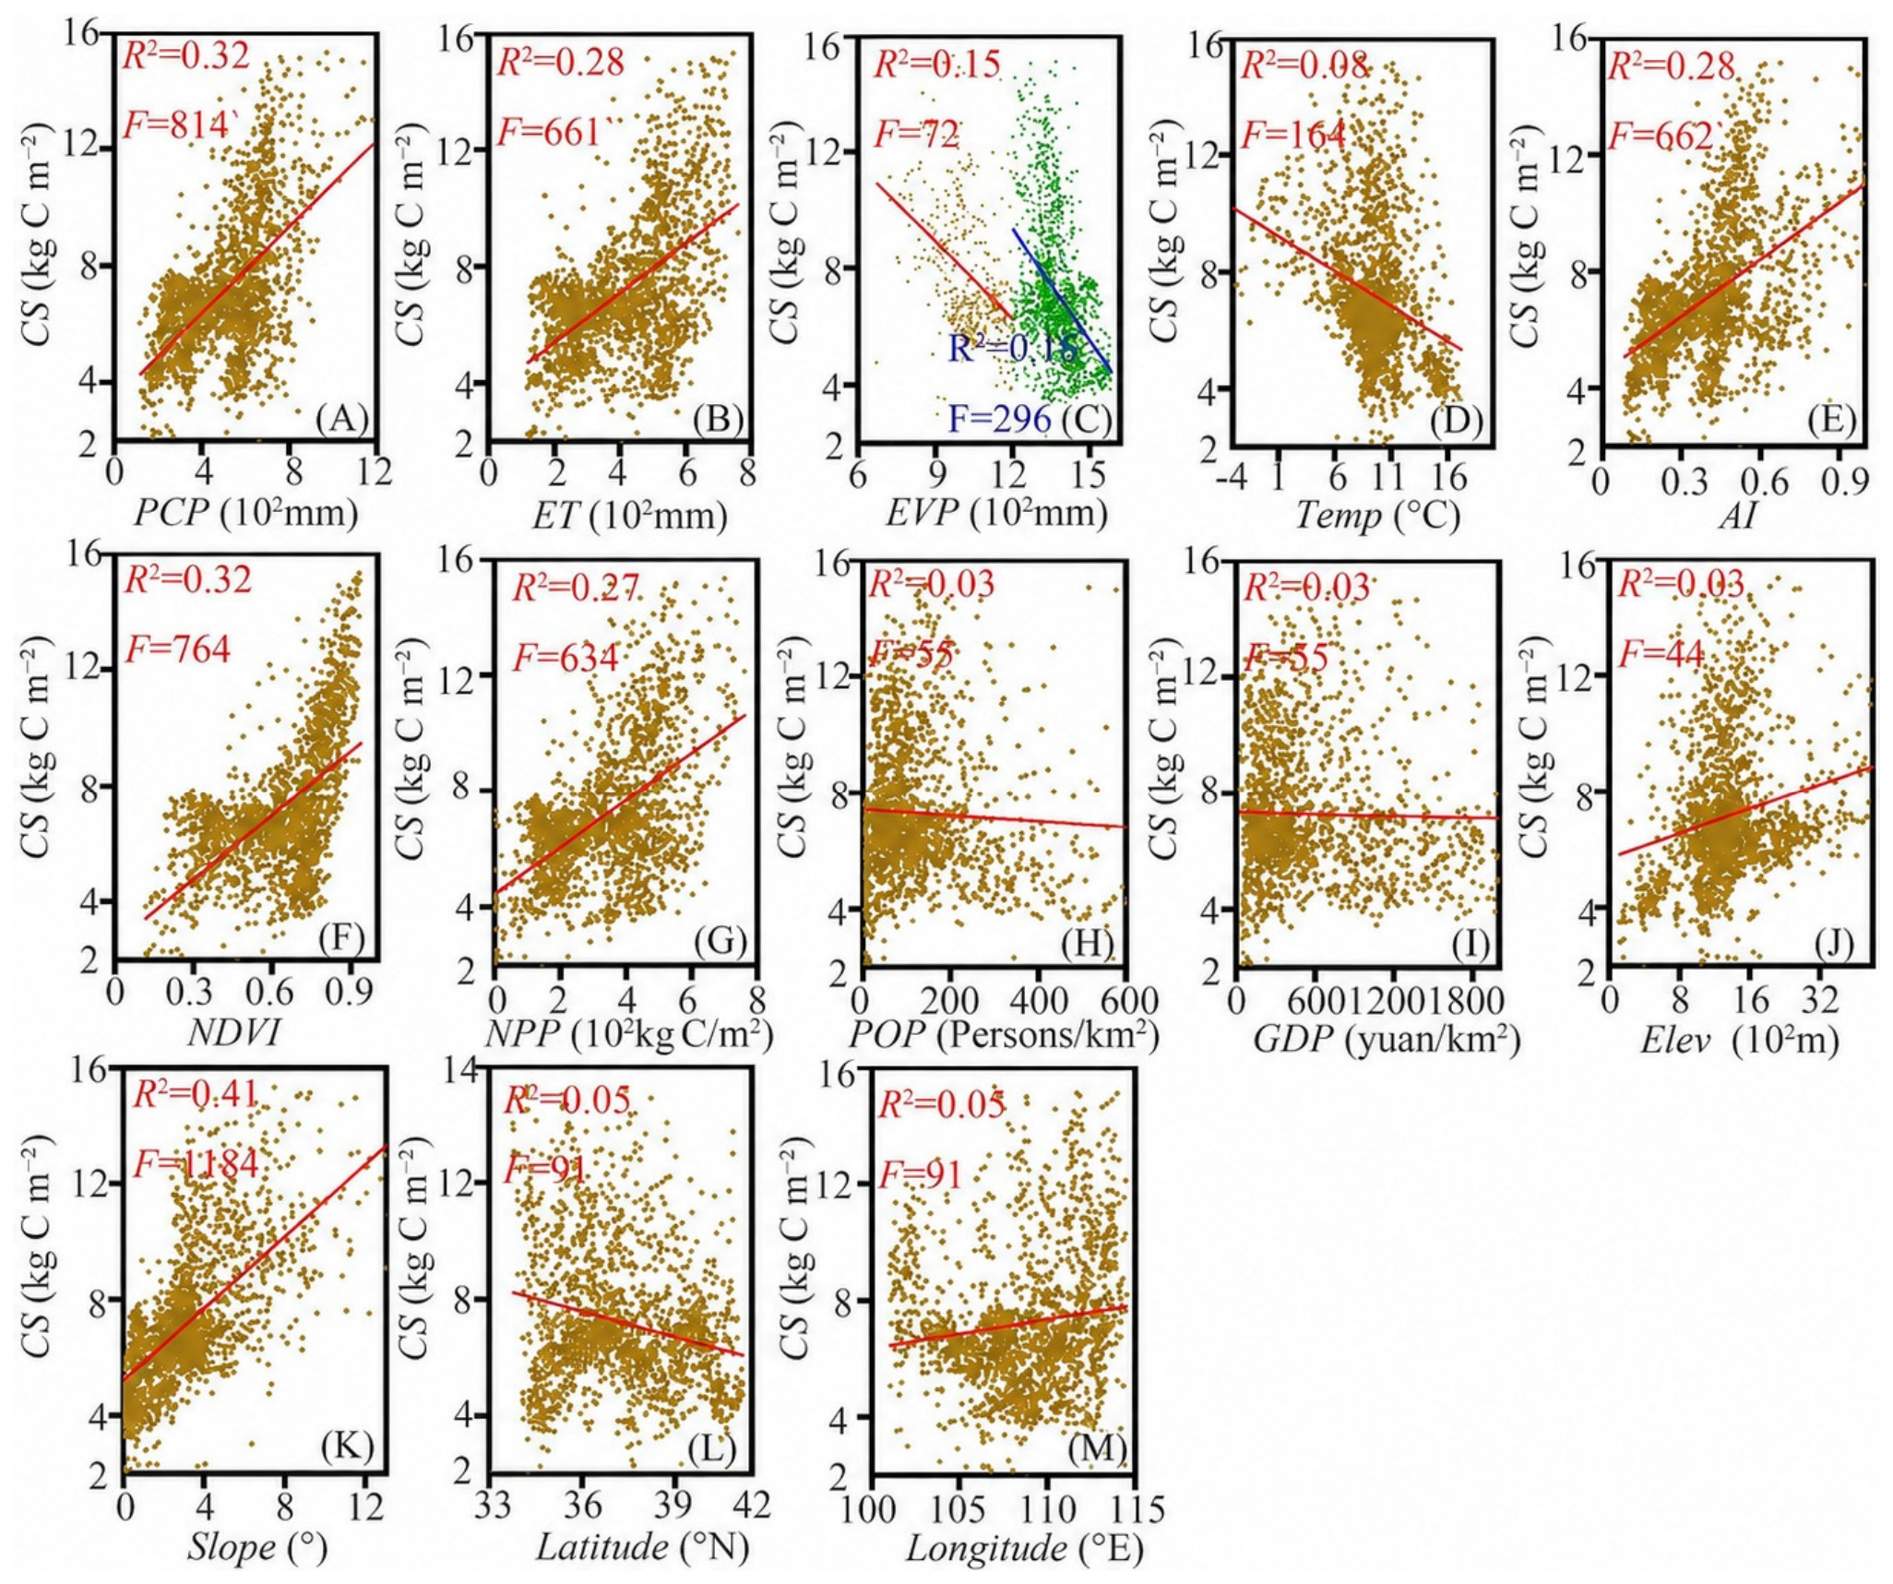
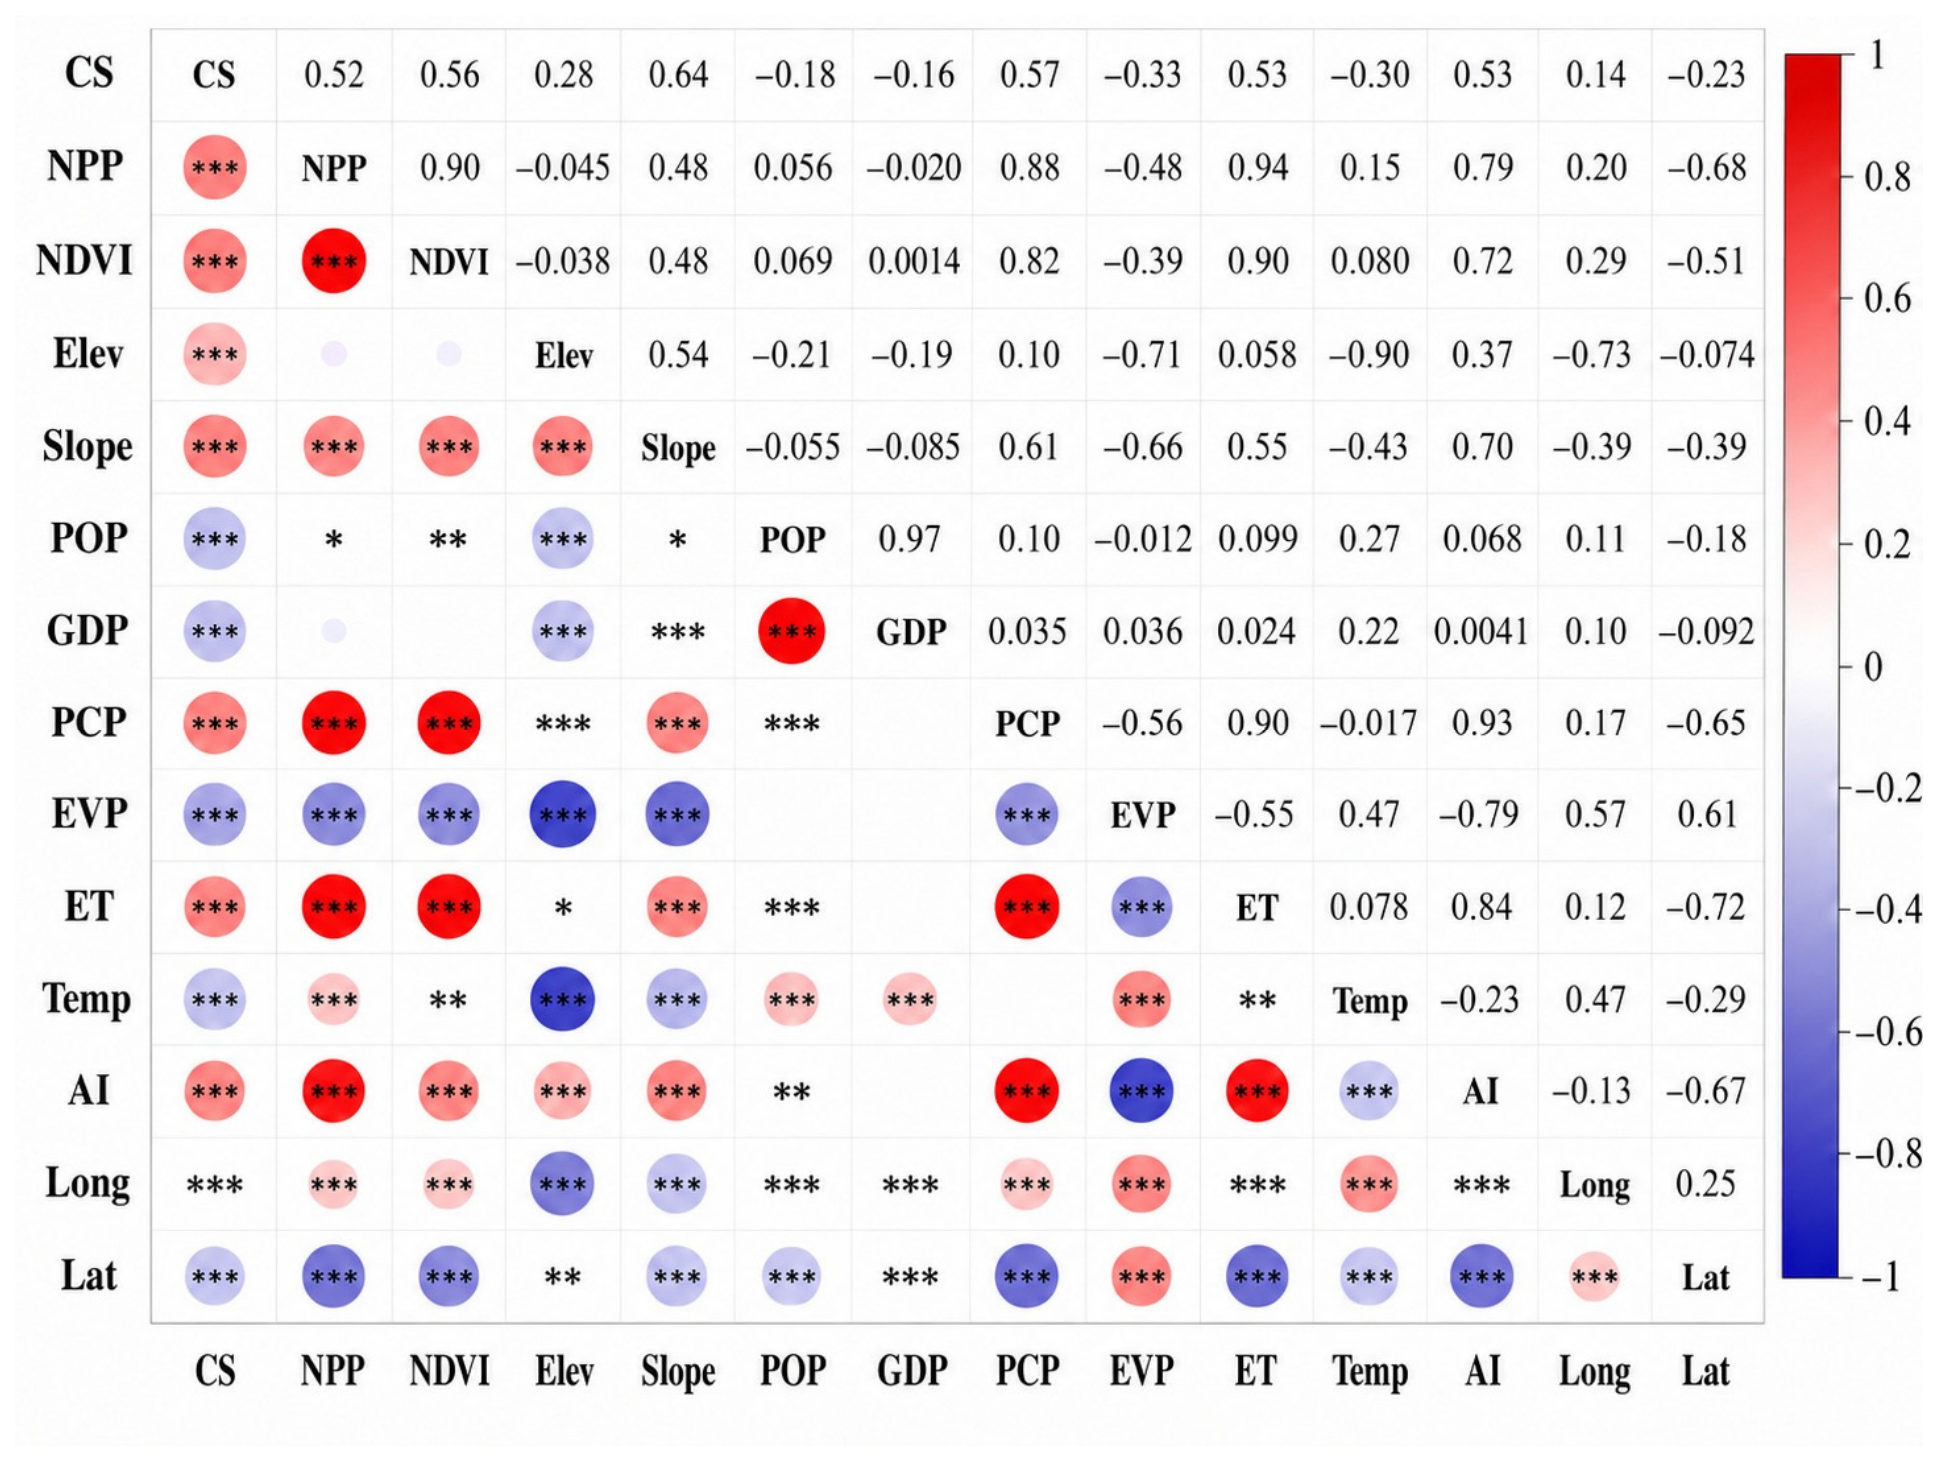
Linear regression revealed statistically significant relationships between CS and the environmental and socioeconomic factors (all p < 0.05). Slope exhibited the strongest positive correlation (r = 0.64, F = 1184), followed by NDVI (r = 0.55) and PCP (r = 0.57). Temperature (r = −0.29), latitude (r = −0.22), and anthropogenic factors (population density, r = −0.17; GDP, r = −0.16) displayed weak negative associations. AI (r = 0.53) and elevation (r = 0.27) showed moderate-to-weak positive relationships (r = 0.51 to 0.53), though elevation’s explanatory power was very low (R2 = 0.07). These bivariate regression results provide a preliminary description of the relationships between individual drivers and CS. However, because the effects of topography, climate, vegetation, and socioeconomic factors may interact and may not be purely linear, these relationships were further examined using linear mixed-effects models, RDA, and SEM in the following section.

3.2. Land-Use Change Between 1980 and 2040

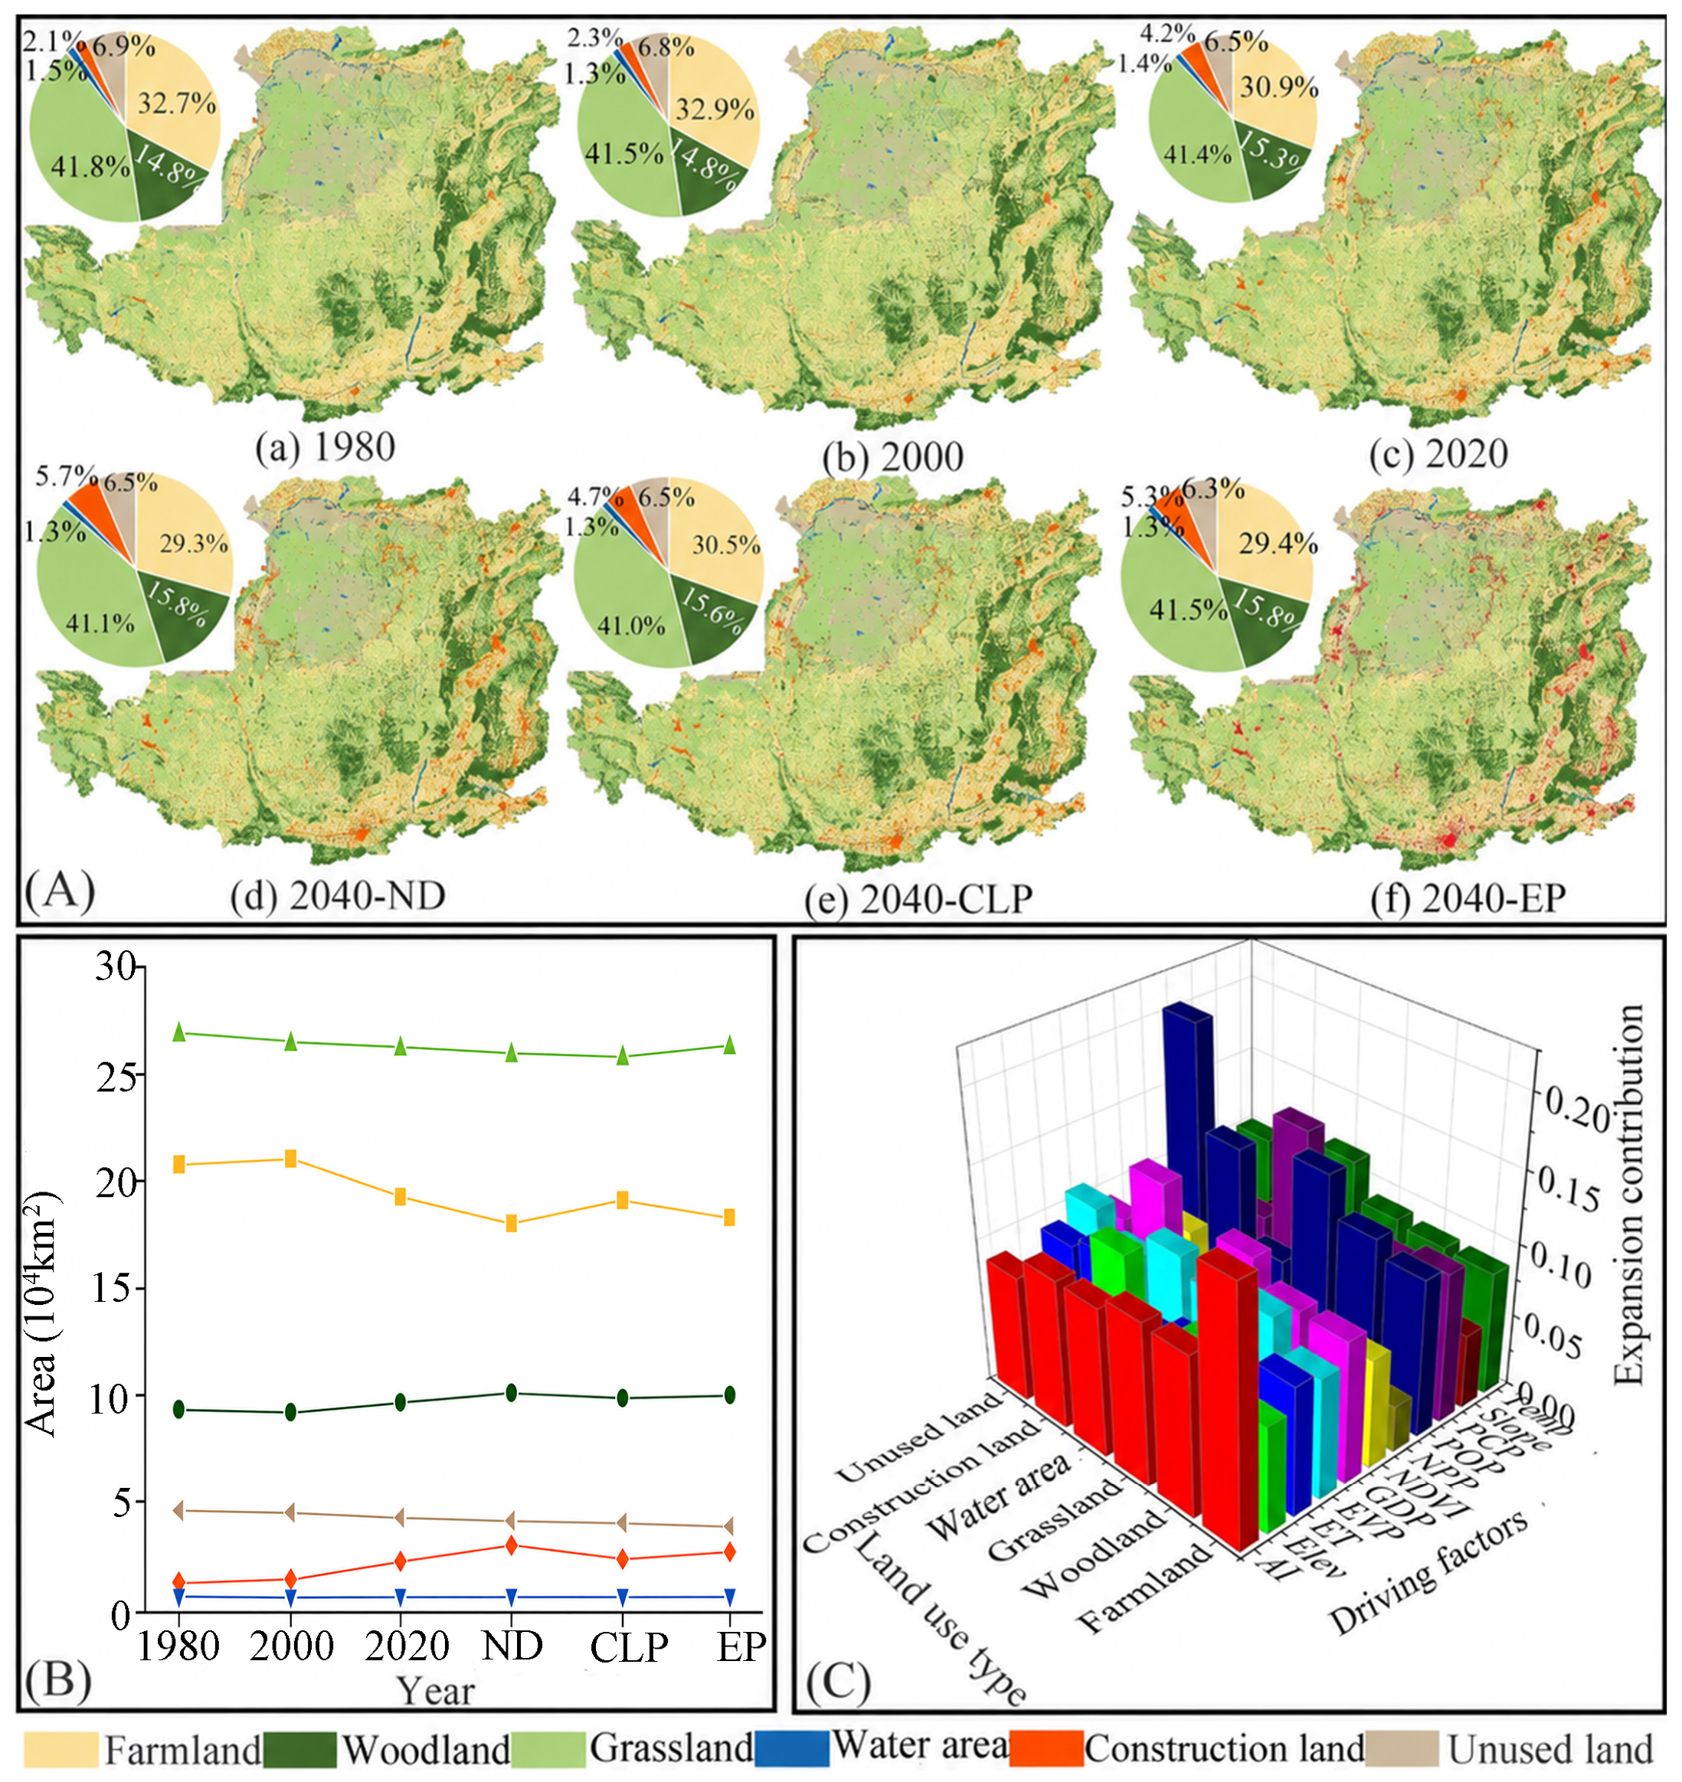
The Chinese Loess Plateau has undergone significant land-use transitions from 1980 to 2040, with distinct patterns under the three future scenarios (2040-ND for natural development; 2040-CLP for cropland protection; 2040-EP for ecological protection; Table 3, Figure 4). Farmland area first increased and then decreased, expanding by 1668.4 km2 (0.8%) from 1980 to 2020, then decreasing sharply, by 12,833.9 km2 (6.2%) from 2000 to 2020. Scenario projections indicated that the farmland area would decrease most under the 2040-ND scenario (3.9% below the value in ND). The primary conversion of farmland was into grassland and unused land, primarily driven by aridity index. The woodland area increased after 2000, rising by 3455 km2 (+3.7%) between 1980 and 2020, with the 2040-EP scenario projecting further expansion beyond 99,125 km2 in 2040, demonstrating the potential success of afforestation efforts. Although grassland experienced an overall decline of 2523.9 km2 (1980 to 2020), the 2040-EP scenario suggests a recovery trend, with the area increasing by 896.8 km2, highlighting the effectiveness of policy-driven ecological conservation. The area of watershed decreased by 624 km2 between 1980 and 2020. Scenario projections showed a further reduction under 2040-CLP (to 8386.8 km2) but better preservation under 2040-EP (8639.2 km2) in 2040, highlighting the land-use trade-offs related to this fragile ecosystem. Woodland was converted into grassland, primarily in response to population density, grassland was converted into farmland, mainly driven by the slope gradient, whereas watershed were converted into woodland, primarily in response to precipitation. Construction land approximately doubled in area from 1980 to 2020 (+12,993.7 km2, +96.7%). Scenario projections showed that construction land expanded most under the 2040-ND scenario, reaching 35,950.2 km2, followed by the 2040-EP scenario with 33,809.1 km2 and the 2040-CLP scenario with 30,030.8 km2. This indicates that cultivated land protection and ecological protection scenarios can partly constrain construction land expansion compared with the natural development scenario. Unused land decreased by 2161.3 km2 (−4.9%) from 1980 to 2020, with the 2040-EP scenario showing the greatest reduction in 2040, suggesting improved land management. Construction land was primarily converted to farmland under the influence of GDP. Unused land was primarily converted to grassland under the influence of population density. These findings underscore the trade-offs between agricultural production, ecological restoration, and urbanization in this fragile region.

3.3. Carbon Storage Between 1980 and 2040

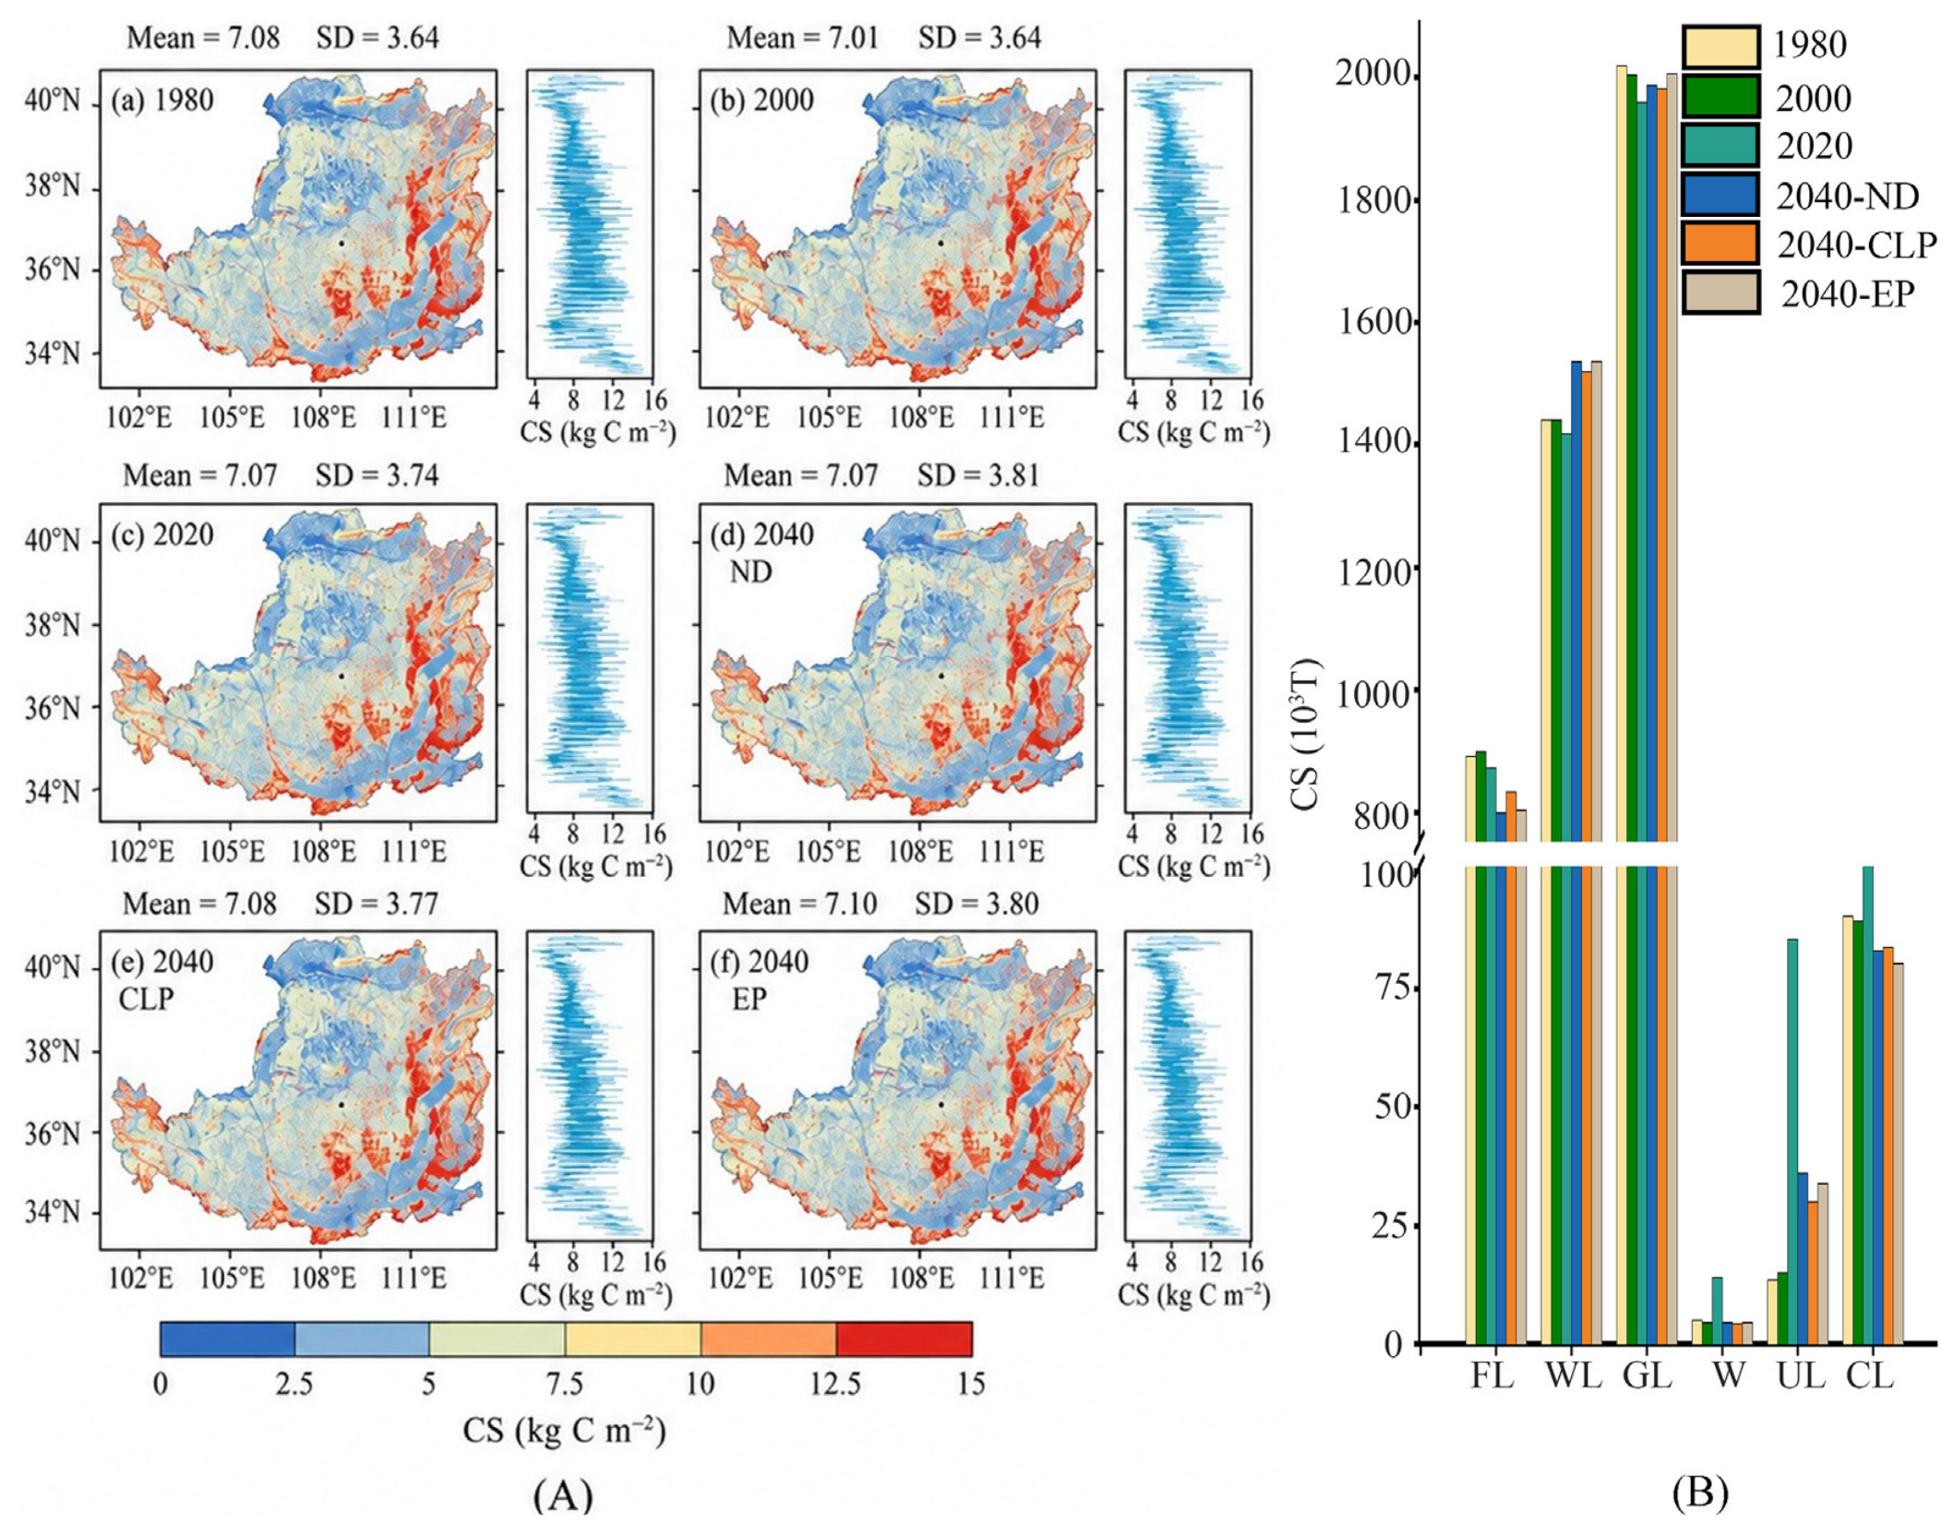
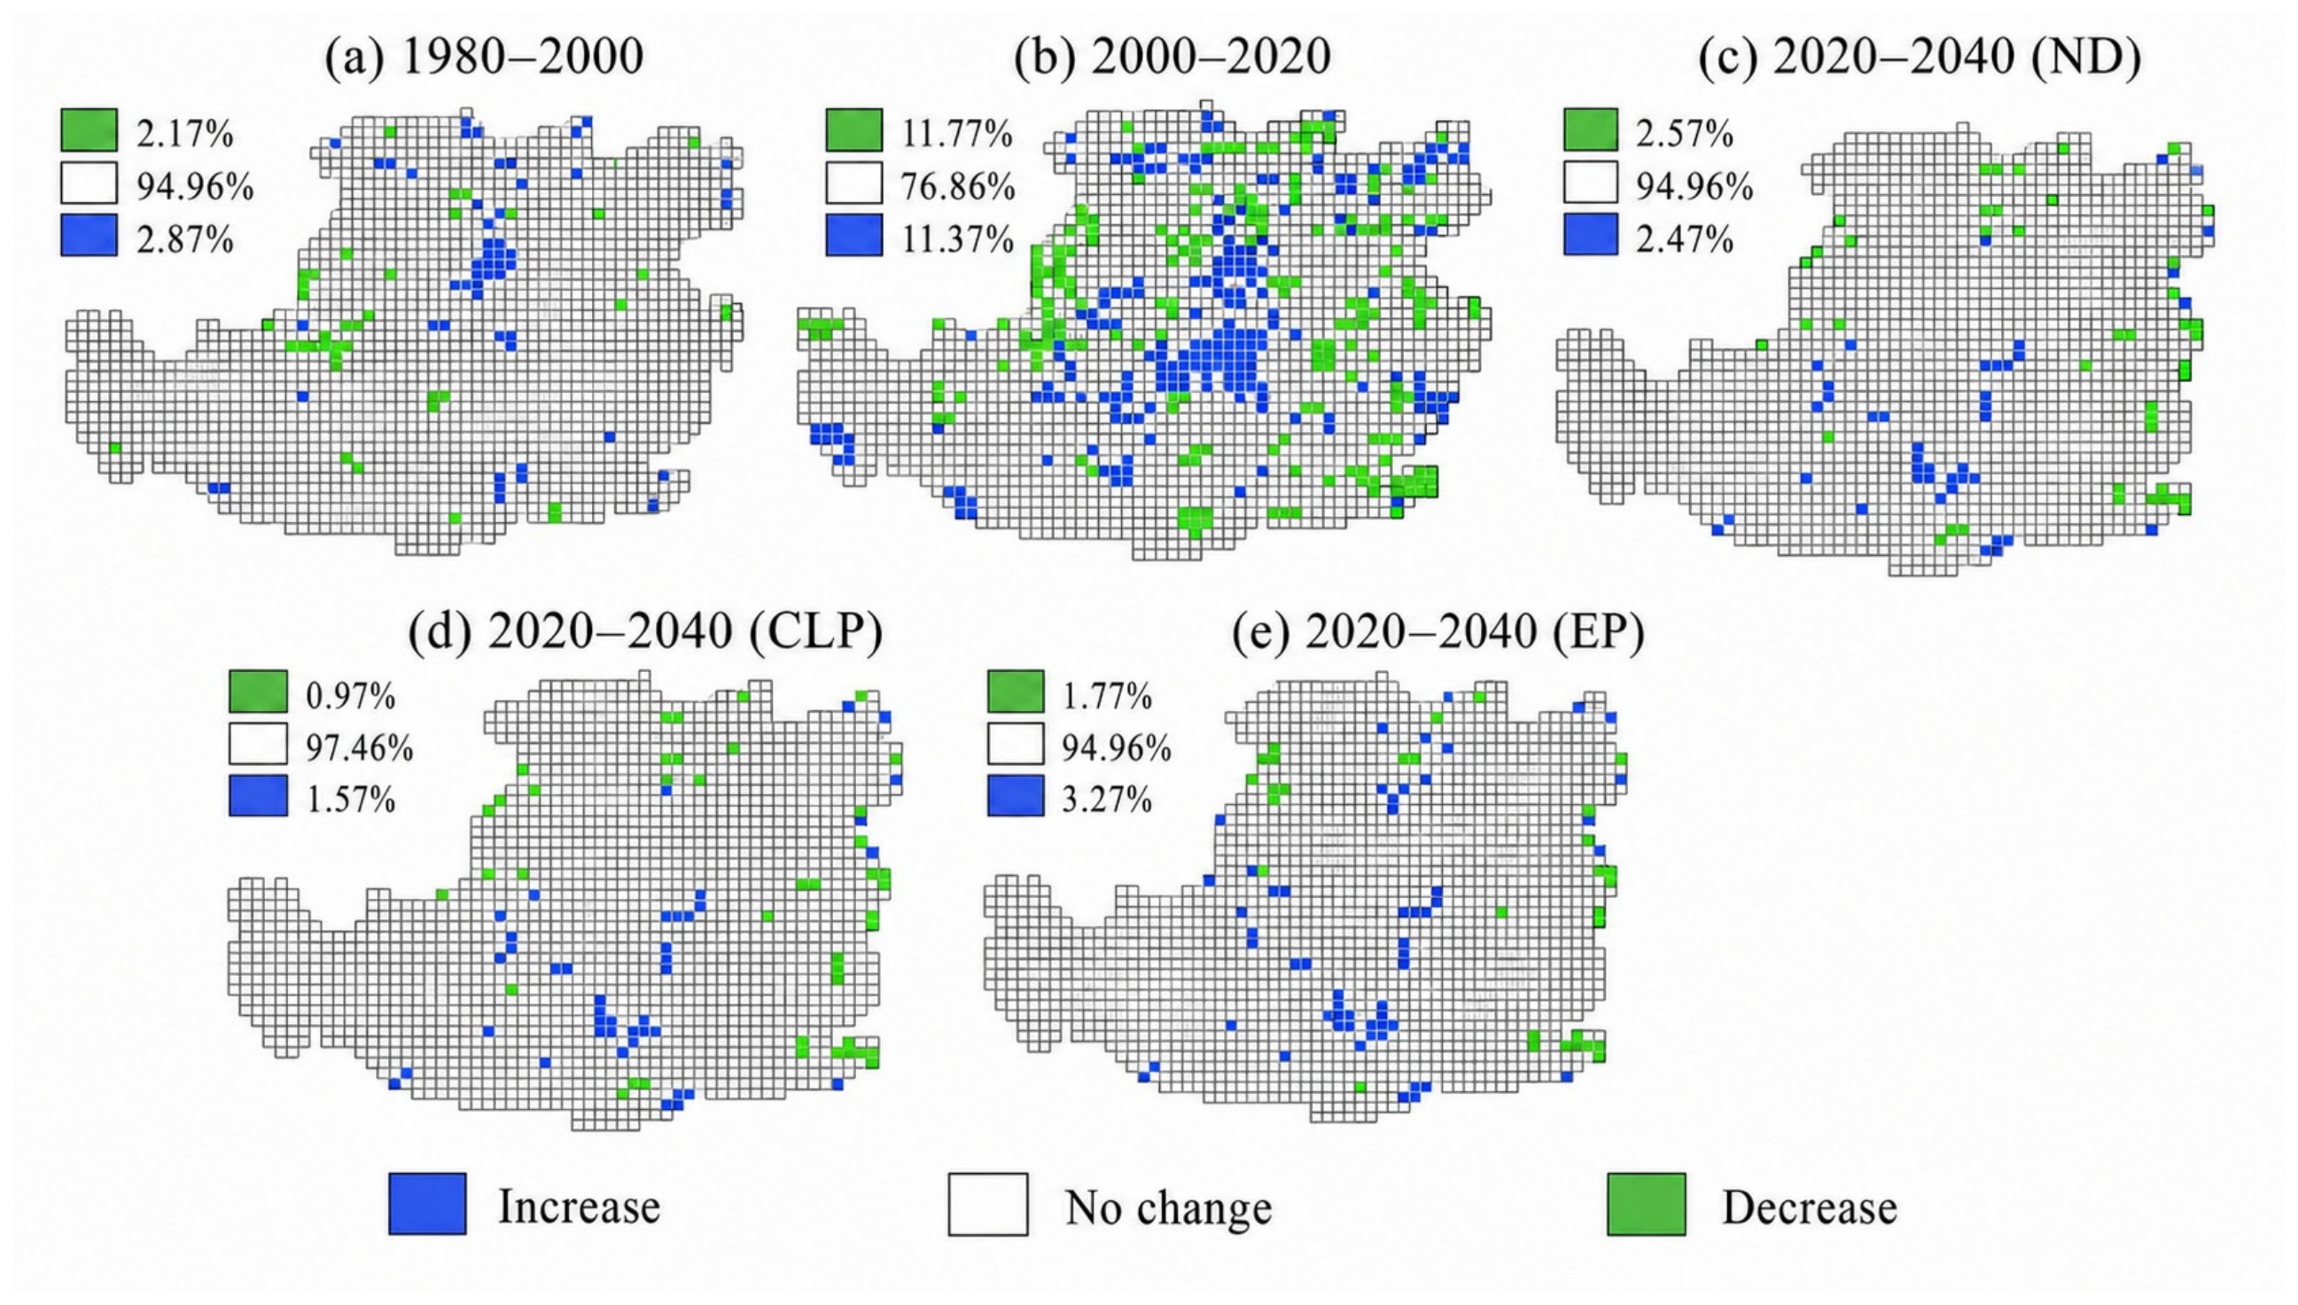
CS exhibited a dynamic equilibrium across temporal scales and management scenarios for the Chinese Loess Plateau (Figure 5 and Figure 6), with mean density maintaining stability from 1980 to 2020 (mean values of 7.01 to 7.08 kg C m−2) despite land-use transformations. CS exhibited distinct responses across scenarios, with the natural development scenario maintaining baseline levels (7.07 ± 3.81 kg C m−2) while increasing spatial variability (ΔSD = +0.07), indicative of landscape-scale carbon distribution divergence. Protection of cultivated land yielded a marginal 0.2% CS increase (7.08 ± 3.77 kg C m−2) coupled with reduced spatial heterogeneity (ΔSD = +0.03), suggesting agricultural management promotes more uniform carbon retention. Maximum CS (7.10 ± 3.80 kg C m−2) occurred under ecological protection, demonstrating natural ecosystems’ superior sequestration capacity, though with moderately higher variability than cultivated systems, reflecting intrinsic ecological patchiness. These differential patterns underscore how land-use strategies mediate both carbon storage magnitude and spatial organization, with cultivated protection favoring homogeneity while ecological conservation maximizes sequestration potential. Land-use analysis showed compensatory dynamics in which a 5.4% decrease in farmland CS (1980 to 2020) was counterbalanced by a 3.8% woodland CS increase, with the 2040-EP scenario being the most effective as it achieved both the highest mean carbon density (7.10 kg C m−2) and optimal land-use configuration (1.536 × 10⁶ t C for woodland and 2.005 × 10⁶ t C for grassland). Temporal patterns revealed distinct phases: 1980–2000 stability (94.9% unchanged) shifted to active redistribution during 2000–2020 (11.7% gain vs. 11.3% loss), with scenario projections revealing fundamental trade-offs—ND maintained equilibrium (2.5% gain vs. 2.4% loss), whereas CLP maximized stability (97.4% unchanged). Although the EP scenario produced the highest mean CS, the proportion of areas with decreased CS (3.2%) was higher than that of areas with increased CS (1.7%). This pattern indicates that regional mean CS and local change proportions describe different aspects of carbon dynamics. The higher mean CS under the EP scenario mainly resulted from the expansion and protection of high-carbon land-use types, especially woodland and grassland, in areas with favorable ecological conditions. In contrast, local decreases were mainly associated with spatial redistribution of Land-use in water-limited or transitional zones. Therefore, a higher regional mean CS can coexist with a larger proportion of locally declining areas when carbon gains occur in high-carbon-density areas and losses occur mainly in low-carbon-density or marginal areas. These findings highlight the complex interplay between land-use change and carbon dynamics in semi-arid ecosystems, where ecological protection policies can maintain carbon stocks despite changing environmental pressures.

3.4. Mechanisms That Influenced the Impacts of Environmental and Socioeconomic Factors on Carbon Storage

To further account for potential coupled and non-additive effects among multiple drivers, we applied correlation analysis, linear mixed-effects models, RDA, and SEM to evaluate the combined effects and interaction pathways of climatic, vegetation, topographic, and socioeconomic factors on CS. Correlation analysis (Figure 7) revealed distinct patterns for the relationships among the climate, vegetation, socioeconomic, and topographic variables that influenced CS. Notably, CS was strongly positively correlated with slope (r = 0.64, p < 0.001) and moderately strongly positively correlated with PCP (r = 0.57) and AI (r = 0.53). This suggests that topographical and hydrological factors significantly influenced carbon sequestration. Conversely, CS showed weak negative correlations with Temp (r = −0.30) and EVP (r = −0.33), indicating that warmer, drier conditions reduce CS. NPP and NDVI were strongly positively correlated (r = 0.90, p < 0.001), and both were significantly positively correlated with PCP (r = 0.88 and 0.82, respectively; p < 0.001) and ET (r = 0.94 and 0.90, respectively; p < 0.001). These findings underscore the role of water availability in sustaining vegetation productivity. Interestingly, NPP and NDVI decreased with increasing latitude (r = −0.68 and −0.52, respectively), which is consistent with known biogeographical gradients in ecosystem productivity. Elev displayed a negative correlation with Temp (r = −0.90, p < 0.001). POP and GDP were tightly coupled (r = 0.966, p < 0.001) but exhibited few associations with the ecological variables, which suggests a limited direct impact on natural carbon dynamics.
The linear mixed-effects models revealed significant effects of multiple environmental and socioeconomic factors and their combinations on CS (Table 4). Among the main effects, topographic variables exhibited the strongest influence (MS = 68.30 p < 0.001), followed by vegetation (MS = 55.94, p < 0.001), climate (MS = 27.93, p < 0.001), and socioeconomic factors (MS = 26.94, p < 0.001). Notably, we observed significant two-way interactions between climate and vegetation (MS = 70.01, p < 0.001) and between vegetation and topography (F = 56.13, p < 0.001). The climate–topography interaction highlighted the importance of considering local topographic conditions when assessing climate impacts (MS = 37.85, p < 0.01). Three-way interactions were generally weaker, but the climate–vegetation–topography interaction (MS = 62.50, p < 0.001) and vegetation–socioeconomic–topography interaction (MS = 10.37, p < 0.05) remained significant, indicating that the combined effects on CS are non-additive.
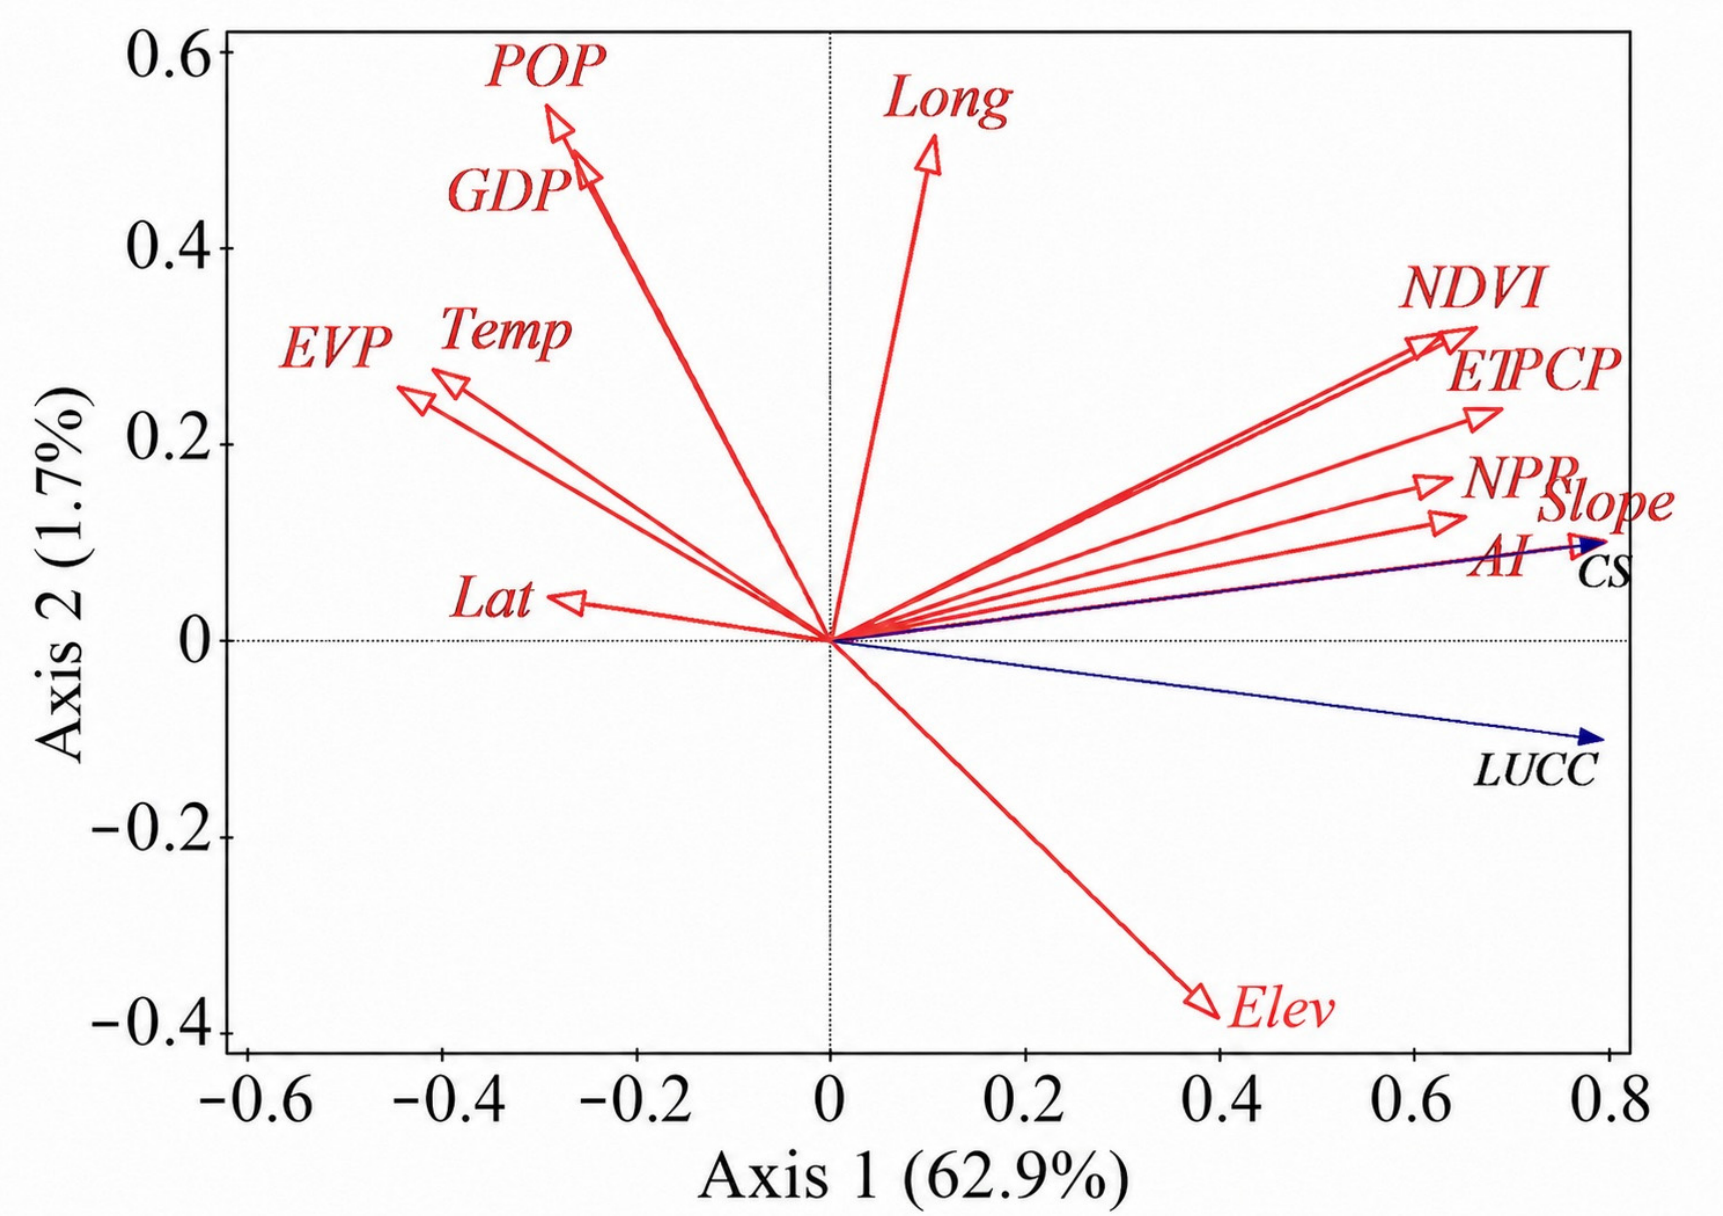
Redundancy analysis (RDA) revealed pronounced environmental controls on carbon storage and land-use cover change (LUCC), with the first two axes explaining 63.5% of cumulative variation (Axis 1: 62.9%, pseudo-canonical correlation = 0.80; Axis 2: 0.6%). Slope dominated the explanatory power (39.9% variance explained, 62.3% contribution; pseudo-F = 1118, p = 0.002), exhibiting strong alignment with Axis 1. Vegetation productivity metrics—NDVI (6.5%, pseudo-F = 205) and NPP (5.4%, pseudo-F = 189)—and PCP (4.0%, pseudo-F = 152) further influenced Axis 1 (all p = 0.002), indicating synergistic effects on carbon sequestration. Axis 2 primarily reflected Elev (0.8%, pseudo-F = 35.0, p = 0.02) and latitude (0.1%, pseudo-F = 6.4, p = 0.014), though their contributions were marginal. Socioeconomic factors (POP, GDP) and geographic coordinates showed negligible effects (all contributions < 0.3%, p > 0.05). The analysis highlights geomorphological (slope) and ecological (NDVI/NPP) drivers as pivotal in mediating LUCC–carbon dynamics, while climatic (PCP) and topographic (Elev) variables provided secondary modulation (Figure 8, Table 5 and Table 6).
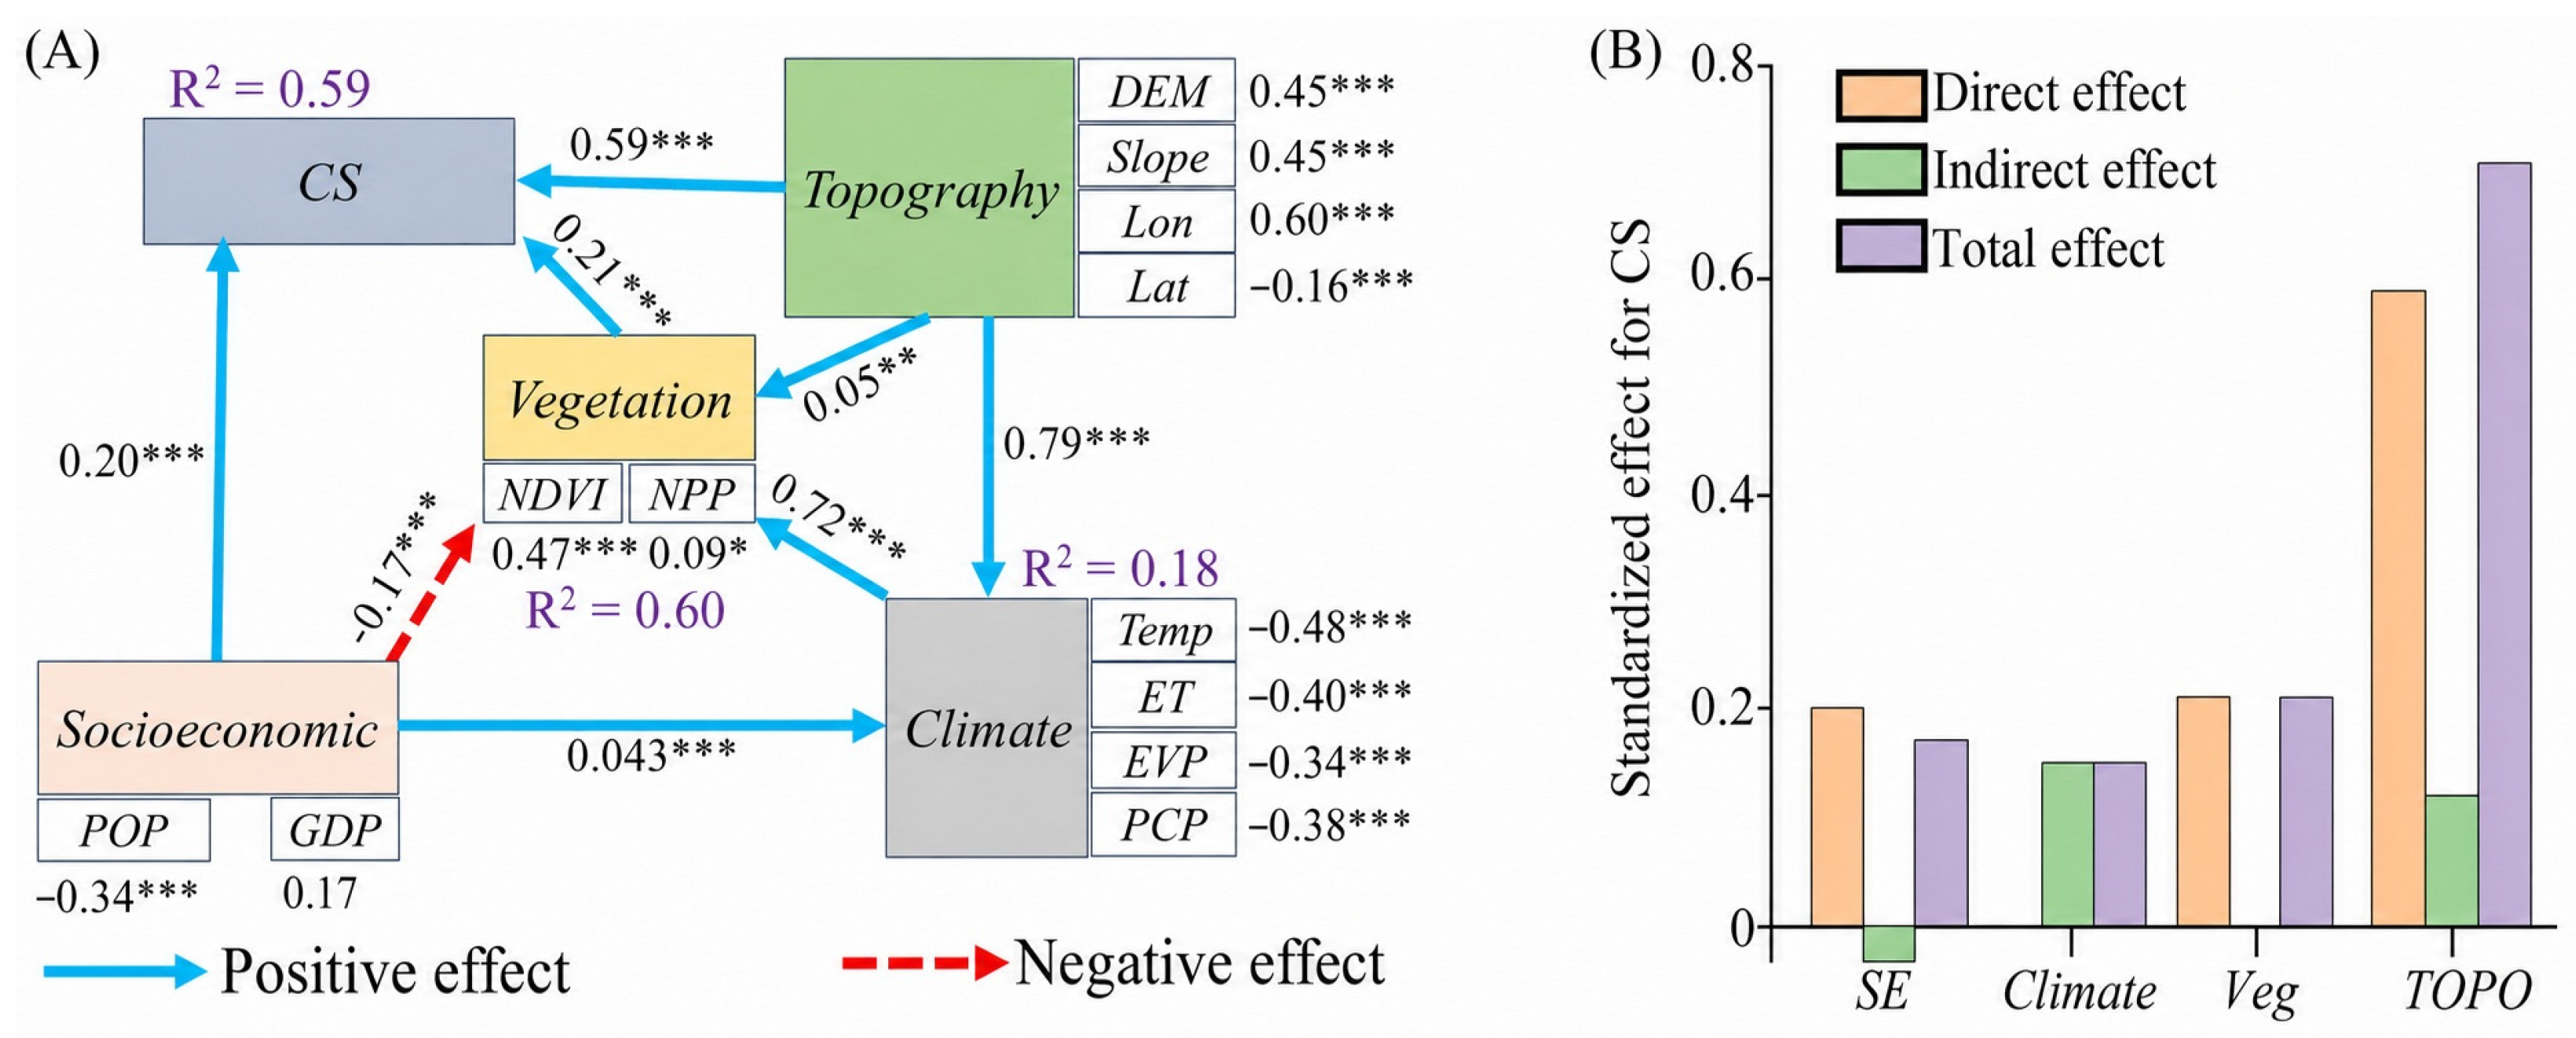
The SEM revealed distinct pathways through which climatic, topographic, socioeconomic, and vegetation factors influenced CS (Figure 9). Topographic variables exhibited the strongest direct effect on CS (path coefficient (PC) = 0.59, p < 0.001), followed by vegetation (PC = 0.21, p < 0.001) and socioeconomic factors (PC = 0.20, p < 0.001). Together, they explained 59% of the variance in CS (R2 = 0.59), with vegetation and climate accounting for 60% (R2 = 0.60) and 63% (R2 = 0.63) of their respective variances. Climate indirectly shaped CS primarily by regulating vegetation (PC = 0.72, p < 0.001), and topography strongly influenced climate (PC = 0.79, p < 0.001). Socioeconomic drivers had a modest direct positive effect on CS (PC = 0.20, p < 0.001) but a weak indirect negative effect (PC = −0.03) via suppressed vegetation (PC = −0.17, p < 0.001). Topography further amplified CS indirectly (PC = 0.12) through its dual roles in modulating climate and vegetation (Figure 9B). The high correlation between POP and GDP indicates that these two socioeconomic variables are not fully independent at the regional scale. This pattern is reasonable because areas with higher population density are usually associated with stronger economic activity, more intensive urban development, and greater infrastructure concentration. Therefore, POP and GDP should be interpreted as closely related indicators of socioeconomic intensity rather than as completely independent drivers. Their high collinearity may limit the ability of the model to distinguish their individual effects on CS, and the socioeconomic effects should therefore be interpreted with caution. Nevertheless, including both variables is useful for representing the overall socioeconomic pressure associated with human activities on carbon storage patterns.

4. Discussion

4.1. Land-Use Change Characteristics in the Loess Plateau

The Chinese Loess Plateau has undergone dramatic land-use transformations since 1980, with farmland first expanding by 1668.4 km2 (+0.8%) from 1980 to 2000, and then sharply decreasing by 12,833 km2 (−6.2%) from 2000 to 2020, primarily driven by China’s Grain for Green Program [46,47,48]. Although afforestation increased the woodland area by 3.7%, the 2040-EP scenario projects further expansion to 99,125.0 km2 by 2040. However, water limitations in the northwest constrain any gains in the region’s forest, unlike in humid regions in the southeast, where afforestation consistently increased CS. Notably, construction land expanded most under the natural development scenario, whereas the ecological protection and cultivated land protection scenarios partly reduced construction land expansion. Compared with 2020, construction land increased by 9526.9 km2 under ND, 7385.8 km2 under EP, and 3607.5 km2 under CLP. This suggests that policy constraints under ecological protection and cultivated land protection can reduce, but not completely prevent, construction land expansion driven by socioeconomic development [49,50,51,52,53]. Similar land-use transitions in India’s afforestation programs showed that policy-driven land-use changes often yielded spatially heterogeneous carbon benefits, contingent on local hydroclimatic conditions [54,55,56].
The Chinese Loess Plateau’s unique loess soils amplify erosion risks during land-use transitions, and this distinguishes the region from more stable tropical or temperate ecosystems. The plateau’s land-use dynamics mirror global dryland patterns, but exhibit greater spatial heterogeneity due to the plateau’s steep topographic gradients [24,57,58]. This contrasts with the environmental protection (EP) scenario’s focus on woodland expansion, which maximized mean CS (7.10 ± 3.80 kg C m−2) but failed to overcome fundamental aridity constraints in the northwest. Such trade-offs highlight the need for spatially differentiated policies that account for the unique characteristics of the Chinese Loess Plateau’s bioclimatic gradients. The plateau’s experience offers critical insights for global dryland management: although large-scale afforestation can enhance carbon sinks in humid regions, water-limited areas require alternative strategies such as soil conservation and restoration of drought-resistant vegetation. These findings challenge uniform policy approaches by emphasizing that optimization of sustainable land use must reconcile ecological goals with local biophysical realities.

4.2. Characteristics of Carbon Storage and Its Influencing Factors on the Loess Plateau

The Loess Plateau exhibited distinct carbon storage (CS) trajectories across eras: early stability (1980–2000, 94.9% unchanged) gave way to active redistribution during China’s Grain for Green Program (2000–2020, 11.7% gain vs. 11.3% loss). Projections reveal scenario-dependent trade-offs—CLP maximizes stability (97.4% unchanged) but minimizes gains (0.9%), while EP shows the highest CS decline (3.2%) despite moderate increase areas (1.7%), suggesting intensive restoration may trigger localized carbon losses in arid zones. Notably, ND maintains equilibrium (94.9% unchanged), indicating current policies have achieved baseline sustainability. These findings collectively demonstrate how the Loess Plateau’s carbon dynamics are governed by complex interactions between its distinctive monsoon–arid transition climate and unique loess topography. Evolving land management practices can offer critical insights for carbon management in fragile ecosystems worldwide, particularly through the demonstrated effectiveness of terrace-based ecological protection measures in maintaining carbon stocks despite increasing climatic pressures [4,59,60,61].

4.3. Mechanisms Governing Carbon Storage

The integrated analysis of topographical, climatic, vegetation, and socioeconomic drivers revealed a hierarchical framework that governs CS in the Loess Plateau. Slope was the dominant predictor, which reinforces its critical role in reducing erosional carbon loss while enhancing microclimatic conditions for organic matter stabilization. This demonstrates that topography can increase carbon retention through reduced erosion and improved organic matter stabilization, while simultaneously shaping microclimates that support vegetation productivity [62,63,64]. Vegetation acts as the primary conduit for climatic regulation of CS, with NDVI and NPP exhibiting strong coupling to precipitation (r > 0.82) and mediating nearly all indirect climate effects. This supports the paradigm that in semi-arid ecosystems, water availability constrains photosynthetic capacity, thereby modulating carbon sink strength [65,66,67]. The latitudinal decrease in NDVI and NPP further mirrors biogeographical productivity gradients, and suggests that global warming may disproportionately weaken carbon sequestration in northern moisture-limited regions. Socioeconomic influences exhibited both direct and indirect effects on CS: although GDP and POP collectively explained 11.1% of CS variation (redundancy analysis), their direct positive association (PC = 0.20) contrasts with their suppressive effect on vegetation (PC = −0.17). This contradiction implies that human activities may enhance CS through land management while simultaneously degrading natural carbon sinks via vegetation loss; this trade-off requires spatially explicit governance. Crucially, the three-way interaction among climate, vegetation, and topography (F = 4.12, p < 0.001) underscores the existence of non-additive synergies: slopes amplify precipitation’s benefits to vegetation, whereas elevation-driven thermal gradients (r = −0.897 for temperature) create localized niches for carbon accumulation [68]. Such context dependence necessitates regionally tailored strategies, such as prioritizing erosion control in the arid west versus afforestation in the humid east, where precipitation–vegetation feedbacks are strongest. Collectively, these findings advance a mechanistic hierarchy for CS regulation in dryland ecosystems: topography defines the physical context, climate drives vegetation productivity within that context, and socioeconomic pressures modulate outcomes through both direct (land-use change) and indirect (vegetation suppression) pathways. Future interventions must integrate these cross-scale interactions to optimize carbon management under escalating climatic and socioeconomic pressures.
The analyses revealed that the 2040-EP scenario maximizes mean CS (7.10 ± 3.80 kg C m−2). Since slope explained 39.9% of the variation in CS, the results indicate that carbon management strategies should explicitly consider topographic constraints. In arid northwestern areas with limited precipitation, priority should be given to maintaining soil stability, reducing erosion risk, and promoting drought-adapted vegetation rather than implementing uniform large-scale afforestation. In humid southeastern areas, where precipitation and vegetation productivity are higher, ecological restoration and afforestation may provide greater carbon sequestration benefits. Engineering measures such as terraces and check dams may contribute to erosion control and soil-water conservation according to previous studies, but their direct effects on carbon storage were not separately quantified in this study. The southeast’s monsoon-fed regions (precipitation >700 mm) can sustain ambitious afforestation (CS = 8.95 ± 4.41 kg C m−2), but northwestern interventions must shift towards drought-adapted vegetation such as grasslands that can promote soil carbon sequestration, thereby avoiding vegetation that is poorly adapted to a region’s moisture availability. The vegetation–climate coupling derived from the SEM underscores that precipitation, not policy alone, dictates an area’s sequestration potential. Critically, the three-way climate (precipitation)–vegetation (NDVI, NPP)–topography (slope) interaction (F = 4.12, p < 0.001) warns against the setting of uniform targets. Combining slope-specific engineering techniques with local hydrological and climatic thresholds can enhance the plateau’s carbon sequestration capacity while protecting its fragile soil. These insights can be extended to arid ecosystems worldwide, where terrain-mediated water scarcity dominates carbon–climate feedback mechanisms.

4.4. Limitations and Future Perspectives

Although the carbon storage assessment provides a consistent framework for comparing land-use-driven carbon dynamics across different periods and scenarios, the use of static carbon density coefficients represents an important source of uncertainty. Because field surveys were not conducted in 1980 or 2000, carbon density coefficients derived mainly from 2020 field observations were applied to estimate carbon storage for historical periods. This assumption may introduce systematic bias, because ecosystem carbon density changes dynamically during vegetation restoration, stand development, litter accumulation, and soil organic carbon formation.
In particular, woodland and grassland restored during the Grain for Green Program may have had lower biomass carbon density and soil organic carbon density in earlier periods than in 2020. Therefore, applying 2020-based carbon density coefficients to 1980 and 2000 may overestimate historical carbon storage in restored ecosystems and underestimate the magnitude of carbon storage gains during 1980–2020. However, because the same carbon density coefficient system was applied consistently across all historical periods and future scenarios, the relative spatial patterns, land-use contrasts, and scenario-based comparisons remain useful and comparable. The carbon storage estimates should therefore be interpreted as model-based approximations of regional carbon storage rather than direct reconstructions of temporally changing carbon density. Future studies should incorporate vegetation age structure, succession-dependent biomass functions, time-varying soil carbon parameters, and long-term field monitoring data to reduce this uncertainty and improve the temporal realism of carbon storage simulations.
Another limitation is that the driving factor analysis and PLUS-based land-use projection mainly relied on recent environmental and socioeconomic datasets and the 2000–2020 land-use transition interval. Therefore, the results should be interpreted as explaining recent spatial heterogeneity and land-use transition mechanisms, rather than fully revealing the long-term temporal drivers of carbon storage change throughout 1980–2020. Future studies should incorporate temporally continuous climate, vegetation, socioeconomic, and land management datasets to better quantify long-term causal mechanisms. In addition, although this study identified slope, precipitation, and vegetation productivity as key factors influencing carbon storage, it did not directly quantify the independent effects of specific soil and water conservation projects, such as terraces, check dams, or slope engineering measures. Future studies should integrate spatial datasets of conservation engineering projects with carbon storage models to evaluate their direct contributions to carbon sequestration.

5. Conclusions

This study quantified the spatiotemporal dynamics of carbon storage in the Chinese Loess Plateau from 1980 to 2020 and projected future carbon storage under three land-use scenarios for 2040 using an integrated PLUS–InVEST framework. The results show that carbon storage generally increased over the past four decades, mainly associated with vegetation restoration and woodland expansion, but the gains were spatially uneven. Higher carbon storage was concentrated in the humid southeastern plateau, whereas carbon accumulation in the northwestern region was constrained by limited water availability.
The combined results of correlation analysis, RDA, linear mixed-effects models, and SEM indicate that carbon storage is regulated by a hierarchical mechanism in which topography provides the physical background, climate controls water availability and vegetation productivity, and socioeconomic factors modify carbon storage through land-use change and human disturbance. Among the 2040 scenarios, ecological protection produced the highest mean carbon storage, although the differences among scenarios were relatively small and local decreases remained in some water-limited or transitional areas. This indicates that ecological restoration does not generate uniform carbon benefits across the plateau.
These findings suggest that carbon management strategies in the Loess Plateau should be spatially differentiated. Afforestation and ecological restoration are more suitable in humid and vegetation-favorable regions, whereas drought-adapted vegetation restoration and erosion-risk reduction should be prioritized in arid and topographically fragile areas. However, this study still has limitations related to the use of static carbon density coefficients, the reliance on recent driver datasets, and the lack of explicit quantification of specific soil and water conservation projects. Future studies should incorporate time-varying carbon density parameters, long-term field observations, continuous environmental and socioeconomic datasets, and spatial information on conservation engineering projects to improve the temporal realism and management relevance of carbon storage assessments.

Author Contributions

Conceptualization, B.L. and R.H.; methodology, X.W., B.L. and A.M.; software, X.W., W.L. and P.D.R.; validation, B.W., C.Y. and W.S.; formal analysis, X.W., A.M. and W.L.; investigation, X.W., B.L., B.D. and D.M.; resources, B.L. and R.H.; data curation, X.W., W.L. and B.W.; writing—original draft preparation, X.W. and B.L.; writing—review and editing, B.L., R.H., A.M., P.D.R., B.D. and D.M.; visualization, X.W., C.Y. and W.S.; supervision, B.L. and R.H.; project administration, B.L.; funding acquisition, B.L. and R.H. All authors have read and agreed to the published version of the manuscript.

Funding

This work was supported by the National Natural Science Foundation of China (42071048), Key Research and Development Program of Gansu Province—International Cooperation Project (26YFWA002), National Foreign Experts Individual Projects of the Ministry of Human Resources and Social Security of the People’s Republic of China (H20240314), and Gansu Provincial Natural Science Foundation—Excellent Doctoral Program (26JRRA166).

Data Availability Statement

The datasets used and/or analyzed during the current study can be made available from the corresponding author upon reasonable request.

Acknowledgments

We are grateful to the Resource and Environment Science and Data Center (RAESDC), the Geospatial Data Cloud (GDC), and the National Catalog Service for Geographic Information for providing the remote sensing, climate, topographic, and socioeconomic datasets used in this study. We also thank the field survey teams from the Northwest Institute of Eco-Environment and Resources, Chinese Academy of Sciences, for their assistance with biomass measurements and soil sampling. We sincerely appreciate the journal editors and anonymous reviewers for their constructive comments, which greatly improved the quality of this manuscript. No individual names are included in this section.

Conflicts of Interest

The authors declare no conflicts of interest.

References

  1. Gao, P.; Geissen, V.; Temme, A.J.A.M.; Ritsema, C.J.; Mu, X.; Wang, F. A wavelet analysis of the relationship between Loess Plateau erosion and sunspots. Geoderma 2014, 213, 453–459. [Google Scholar] [CrossRef]
  2. Li, C.; Yang, X.; Liu, H.; Zhu, H.; Wei, H.; Na, J.; Cui, X. Spatial distribution characteristics of discontinuous hillslope gullies on the Loess Plateau of China: A special focus on spoon gullies. Catena 2022, 215, 106327. [Google Scholar] [CrossRef]
  3. Li, P.; Mu, X.; Holden, J.; Wu, Y.; Irvine, B.; Wang, F.; Gao, P.; Zhao, G.; Sun, W. Comparison of soil erosion models used to study the Chinese Loess Plateau. Earth-Sci. Rev. 2017, 170, 17–30. [Google Scholar] [CrossRef]
  4. Tian, P.; Tian, X.; Geng, R.; Zhao, G.; Yang, L.; Mu, X.; Gao, P.; Sun, W.; Liu, Y. Response of soil erosion to vegetation restoration and terracing on the Loess Plateau. Catena 2023, 227, 107103. [Google Scholar] [CrossRef]
  5. Sun, W.; Shao, Q.; Liu, J.; Zhai, J. Assessing the effects of Land-use and topography on soil erosion on the Loess Plateau in China. Catena 2014, 121, 151–163. [Google Scholar] [CrossRef]
  6. Wang, F.; Kong, W.; Ji, M.; Zhao, K.; Chen, H.; Yue, L.; Dong, X. Grazing greatly reduces the temporal stability of soil cellulolytic fungal community in a steppe on the Tibetan Plateau. J. Environ. Sci. 2022, 121, 48–57. [Google Scholar] [CrossRef] [PubMed]
  7. Fu, B.J.; Chen, L.D.; Ma, K.M.; Zhou, H.F.; Wang, J. The relationships between Land-use and soil conditions in the hilly area of the Loess Plateau in northern Shaanxi, China. Catena 2000, 39, 69–78. [Google Scholar] [CrossRef]
  8. Gao, Y.; Dang, P.; Zhao, Z. Effects of afforestation on soil carbon and its fractions: A case study from the Loess Plateau, China. J. For. Res. 2018, 29, 1291–1297. [Google Scholar]
  9. Hao, H.; Liang, Y.; Pian, D.; Zhang, Y.; Chen, Y.; Lai, H.; Yu, Z.; Sailike, A.; Wang, R.; Cao, L.; et al. Macroaggregate is crucial in soil carbon and nitrogen accumulation under different vegetation types in the Loess Plateau, China. For. Ecol. Manag. 2024, 569, 122161. [Google Scholar] [CrossRef]
  10. Teng, Y.; Zhan, J.; Su, M.; Wu, Y.; Zhang, Y.; Yu, C.; Xu, C. Identifying prioritized afforestation types in ecologically vulnerable zones of Northern China considering reducing water consumption and increasing carbon sequestration. Ecol. Indic. 2022, 145, 109734. [Google Scholar] [CrossRef]
  11. Wu, M.; Zhao, Y.; Li, H.; Wang, X.; Chen, J. Assessment of Soil Organic and Inorganic Carbon Under Afforestation and Natural Vegetation Restoration Using Stable Carbon Isotope (δ13C) Measurements. Agriculture 2025, 15, 80. [Google Scholar] [CrossRef]
  12. Zhang, Q.; Jia, X.; Wei, X.; Shao, M.; Li, T.; Yu, Q. Total soil organic carbon increases but becomes more labile after afforestation in China’s Loess Plateau. For. Ecol. Manag. 2020, 461, 117911. [Google Scholar] [CrossRef]
  13. Huang, W.; Wang, P.; He, L.; Liu, B. Improvement of water yield and net primary productivity ecosystem services in the Loess Plateau of China since the “Grain for Green” project. Ecol. Indic. 2023, 154, 110707. [Google Scholar] [CrossRef]
  14. Liu, L.; Li, Z.W.; Chang, X.F.; Nie, X.D.; Liu, C.; Xiao, H.B.; Wang, D.Y. Relationships of the hydraulic flow characteristics with the transport of soil organic carbon and sediment loss in the Loess Plateau. Soil Tillage Res. 2018, 175, 291–301. [Google Scholar] [CrossRef]
  15. Wittberg, E.; Tavares, A.F.; Szmigiel-Rawska, K. Local politics and land take: Using remote sensing data to analyse land-use changes in Sweden. J. Environ. Manag. 2025, 384, 125387. [Google Scholar] [CrossRef] [PubMed]
  16. Wang, H.; Yue, C.; Mao, Q.; Zhao, J.; Ciais, P.; Li, W.; Yu, Q.; Mu, X. Vegetation and species impacts on soil organic carbon sequestration following ecological restoration over the Loess Plateau, China. Geoderma 2020, 371, 114389. [Google Scholar] [CrossRef]
  17. Zhu, Y.; Jia, X.; Qiao, J.; Shao, M. What is the mass of loess in the Loess Plateau of China? Sci. Bull. 2019, 64, 534–539. [Google Scholar] [CrossRef] [PubMed]
  18. Chen, X.; Yu, L.; Hou, S.; Liu, T.; Li, X.; Li, Y.; Du, Z.; Li, C.; Wu, H.; Gao, G.; et al. Unraveling carbon stock dynamics and their determinants in China’s Loess Plateau over the past 40 years. Ecol. Indic. 2024, 159, 111760. [Google Scholar] [CrossRef]
  19. Li, K.; Cao, J.; Adamowski, J.F.; Biswas, A.; Zhou, J.; Liu, Y.; Zhang, Y.; Liu, C.; Dong, X.; Qin, Y. Assessing the effects of ecological engineering on spatiotemporal dynamics of carbon storage from 2000 to 2016 in the Loess Plateau area using the InVEST model: A case study in Huining County, China. Environ. Dev. 2021, 39, 100641. [Google Scholar] [CrossRef]
  20. Shi, Y.; Wei, W. Terracing drives Chinese Loess Plateau toward carbon neutrality: Spatiotemporal interaction between Land-use transitions and SOC storage. J. Environ. Manag. 2025, 385, 125760. [Google Scholar] [CrossRef] [PubMed]
  21. Chen, L.F.; He, Z.B.; Zhu, X.; Du, J.; Yang, J.J.; Li, J. Impacts of afforestation on plant diversity, soil properties, and soil organic carbon storage in a semi-arid grassland of northwestern China. Catena 2016, 147, 300–307. [Google Scholar] [CrossRef]
  22. Wang, Y.; Deng, L.; Wu, G.; Wang, K.; Shangguan, Z. Estimates of carbon storage in grassland ecosystems on the Loess Plateau. Catena 2018, 164, 23–31. [Google Scholar] [CrossRef]
  23. Yuan, Z.Q.; Song, X.; Feng, Z.; Wang, J.; Wang, R.; Agathokleous, E.; Fang, C.; Sardans, J.; Peñuelas, J. Soil organic carbon and nitrogen sequestration following grazing exclusion on the Loess Plateau, China. Catena 2023, 232, 107412. [Google Scholar] [CrossRef]
  24. Wu, X.; Wang, S.; Fu, B.; Feng, X.; Chen, Y. Socio-ecological changes on the Loess Plateau of China after Grain to Green Program. Sci. Total Environ. 2019, 678, 565–573. [Google Scholar] [CrossRef] [PubMed]
  25. Feng, T.; Wei, W.; Chen, L.; Cerdà, A.; Yang, L.; Yu, Y. Combining land preparation and vegetation restoration for optimal soil eco-hydrological services in the Loess Plateau, China. Sci. Total Environ. 2019, 657, 535–547. [Google Scholar] [CrossRef] [PubMed]
  26. Gebrehiwot, G.; Teka, K.; Welday, Y. Can landscape restoration improve soil carbon stock? A study from Sero Watershed, Northern Ethiopia. Glob. Ecol. Conserv. 2022, 39, e02274. [Google Scholar] [CrossRef]
  27. Xu, H.; Qu, Q.; Lu, B.; Zhang, Y.; Liu, G.; Xue, S. Variation in soil organic carbon stability and driving factors after vegetation restoration in different vegetation zones on the Loess Plateau, China. Soil Tillage Res. 2020, 204, 104727. [Google Scholar] [CrossRef]
  28. Yu, X.; Zhou, W.; Chen, Y.; Wang, Y.; Cheng, P.; Hou, Y.; Wang, Y.; Xiong, X.; Yang, L. Spatial variation of soil properties and carbon under different land use types on the Chinese Loess Plateau. Sci. Total Environ. 2020, 703, 134946. [Google Scholar] [CrossRef] [PubMed]
  29. Liang, Y.; Chai, D.; Zhou, X.; Ning, Y. Potential conflict diagnosis, simulation optimization and coordination of production-living-ecological space in gully areas of the Loess Plateau, China. Environ. Dev. 2024, 52, 101099. [Google Scholar] [CrossRef]
  30. Schwärzel, K.; Zhang, L.; Montanarella, L.; Wang, Y.; Sun, G. How afforestation affects the water cycle in drylands: A process-based comparative analysis. Glob. Chang. Biol. 2020, 26, 944–959. [Google Scholar] [PubMed]
  31. Zhao, Y.; Jiang, C.; Dong, X.; Yang, Z.; Wen, M.; Yang, J. Understanding the complex environmental management through a lens of food-water-ecosystem nexus: Insights from an ecosystem restoration hotspot in dryland. Sci. Total Environ. 2021, 783, 147029. [Google Scholar] [CrossRef] [PubMed]
  32. Feng, Q.; Zhao, W.W.; Hu, X.P.; Liu, Y.; Daryanto, S.; Cherubini, F. Trading-off ecosystem services for better ecological restoration: A case study in the Loess Plateau of China. J. Clean. Prod. 2020, 257, 120469. [Google Scholar] [CrossRef]
  33. Wei, F.; Wang, S.; Brandt, M.; Fu, B.; Meadows, M.E.; Wang, L.; Wang, L.; Tong, X.; Fensholt, R. Responses and feedbacks of African dryland ecosystems to environmental changes. Curr. Opin. Environ. Sustain. 2021, 48, 29–35. [Google Scholar] [CrossRef]
  34. Deng, L.; Liu, G.B.; Shangguan, Z.P. Land-use conversion and changing soil carbon stocks in China’s “Grain-for-Green” Program: A synthesis. Glob. Change Biol. 2014, 20, 3544–3556. [Google Scholar] [CrossRef] [PubMed]
  35. Chang, R.; Fu, B.; Liu, G.; Liu, S. Soil carbon sequestration potential for “Grain for Green” project in Loess Plateau, China. Environ. Manag. 2011, 48, 1158–1172. [Google Scholar] [CrossRef] [PubMed]
  36. Liang, X.; Guan, Q.; Clarke, K.C.; Liu, S.; Wang, B.; Yao, Y. Understanding the drivers of sustainable land expansion using a patch-generating Land-use simulation (PLUS) model: A case study in Wuhan, China. Comput. Environ. Urban Syst. 2021, 85, 101569. [Google Scholar] [CrossRef]
  37. Verburg, P.H.; Soepboer, W.; Veldkamp, A.; Limpiada, R.; Espaldon, V.; Mastura, S.S.A. Modeling the spatial dynamics of regional Land-use: The CLUE-S model. Environ. Manag. 2002, 30, 391–405. [Google Scholar] [CrossRef] [PubMed]
  38. Feng, X.M.; Fu, B.J.; Lu, N.; Zeng, Y.; Wu, B.F. How ecological restoration alters ecosystem services: An analysis of carbon sequestration in China’s Loess Plateau. Sci. Rep. 2013, 3, 2846. [Google Scholar] [CrossRef] [PubMed]
  39. Lan, Z.; Zhao, Y.; Zhang, J.; Jiao, R.; Khan, M.N.; Sial, T.A.; Si, B. Long-term vegetation restoration increases deep soil carbon storage in the Northern Loess Plateau. Sci. Rep. 2021, 11, 13758. [Google Scholar] [CrossRef] [PubMed]
  40. Sierra, C.A.; Ceballos-Núñez, V.; Metzler, H.; Müller, M. Representing and Understanding the Carbon Cycle Using the Theory of Compartmental Dynamical Systems. J. Adv. Model. Earth Syst. 2018, 10, 1729–1734. [Google Scholar] [CrossRef]
  41. Zhang, H.; Li, X.; Luo, Y.; Chen, L.; Wang, M. Spatial heterogeneity and driving mechanisms of carbon storage in the urban agglomeration within complex terrain: Multi-scale analyses under localized SSP-RCP narratives. Sustain. Cities Soc. 2024, 109, 105520. [Google Scholar] [CrossRef]
  42. Han, X.; Gao, G.; Chang, R.; Li, Z.; Ma, Y.; Wang, S.; Wang, C.; Lü, Y.; Fu, B. Changes in soil organic and inorganic carbon stocks in deep profiles following cropland abandonment along a precipitation gradient across the Loess Plateau of China. Agric. Ecosyst. Environ. 2018, 258, 1–13. [Google Scholar] [CrossRef]
  43. Picard, N.; Saint-André, L.; Henry, M. Manual for Building Tree Volume and Biomass Allometric Equations: From Field Measurement to Prediction; Food and Agriculture Organization of the United Nations: Rome, Italy; Centre de Coopération Internationale en Recherche Agronomique pour le Développement: Montpellier, France, 2012. [Google Scholar]
  44. Chave, J.; Réjou-Méchain, M.; Búrquez, A.; Chidumayo, E.; Colgan, M.S.; Delitti, W.B.C.; Duque, A.; Eid, T.; Fearnside, P.M.; Goodman, R.C.; et al. Improved allometric models to estimate the aboveground biomass of tropical trees. Glob. Change Biol. 2014, 20, 3177–3190. [Google Scholar] [CrossRef] [PubMed]
  45. Liu, K.; Zhang, C.; Zhang, H.; Xu, H.; Xia, W. Spatiotemporal Variation and Dynamic Simulation of Ecosystem Carbon Storage in the Loess Plateau Based on PLUS and InVEST Models. Land 2023, 12, 1065. [Google Scholar] [CrossRef]
  46. Lü, Y.; Fu, B.; Feng, X.; Zeng, Y.; Liu, Y.; Chang, R.; Sun, G.; Wu, B. A Policy-Driven Large Scale Ecological Restoration: Quantifying Ecosystem Services Changes in the Loess Plateau of China. PLoS ONE 2012, 7, e31782. [Google Scholar] [CrossRef] [PubMed]
  47. Zhao, W.; Hu, Z.; Li, S.; Guo, Q.; Yang, H.; Zhang, T. Impact of Land-use conversion on soil organic carbon stocks in an agro-pastoral ecotone of Inner Mongolia. J. Geogr. Sci. 2017, 27, 999–1010. [Google Scholar] [CrossRef]
  48. Fang, L.; Wang, L.; Chen, W.; Sun, J.; Cao, Q.; Wang, S.; Wang, L. Identifying the impacts of natural and human factors on ecosystem service in the Yangtze and Yellow River Basins. J. Clean. Prod. 2021, 314, 127995. [Google Scholar] [CrossRef]
  49. Li, J.; Peng, S.; Li, Z. Detecting and attributing vegetation changes on China’s Loess Plateau. Agric. For. Meteorol. 2017, 247, 260–270. [Google Scholar] [CrossRef]
  50. Ye, L.; Zhang, R.; Lin, X.; Ji, K.; Zuo, J.; Zheng, Y.; Huang, C.; Zhang, L.; Tan, W. Digital mapping of soil inorganic carbon content and density in soil profiles after ‘Grain for Green’ program. Int. Soil Water Conserv. Res. 2025, 13, 656–674. [Google Scholar] [CrossRef]
  51. Gou, M.; Li, L.; Ouyang, S.; Wang, N.; La, L.; Liu, C.; Xiao, W. Identifying and analyzing ecosystem service bundles and their socioecological drivers in the Three Gorges Reservoir Area. J. Clean. Prod. 2021, 307, 127208. [Google Scholar] [CrossRef]
  52. Wang, C.; Liu, S.; Zhou, S.; Zhou, J.; Jiang, S.; Zhang, Y.; Feng, T.; Zhang, H.; Zhao, Y.; Lai, Z.; et al. Spatial-temporal patterns of urban expansion by land use/land cover transfer in China. Ecol. Indic. 2023, 155, 111009. [Google Scholar] [CrossRef]
  53. Wang, Y.; Hong, S.; Wang, J.; Lin, J.; Mu, H.; Wei, L.; Wang, Z.; Bryan, B.A. Complex regional telecoupling between people and nature revealed via quantification of trans-boundary ecosystem service flows. People Nat. 2022, 4, 274–292. [Google Scholar] [CrossRef]
  54. Mishra, G.; Sarkar, A. Studying the relationship between total organic carbon and soil carbon pools under different land management systems of Garo hills, Meghalaya. J. Environ. Manag. 2020, 257, 110006. [Google Scholar] [CrossRef] [PubMed]
  55. Meena, V.S.; Mondal, T.; Pandey, B.M.; Mukherjee, A.; Yadav, R.P.; Choudhary, M.; Singh, S.; Bisht, J.K.; Pattanayak, A. Land-use changes: Strategies to improve soil carbon and nitrogen storage pattern in the mid-Himalaya ecosystem, India. Geoderma 2018, 321, 69–78. [Google Scholar] [CrossRef]
  56. Fan, K.; Liu, Y.; Zhang, X.; Chen, X.; Li, Y.; Zhou, Y.; Shen, W.; Tao, H.; Gong, C.; Lei, S. Assessing the relative contribution of climate change and human activity factors to spatiotemporal distributions of sand fixation service in the Loess Plateau. GISci. Remote Sens. 2025, 62, 2444630. [Google Scholar] [CrossRef]
  57. Babu, S.; Mohapatra, K.P.; Yadav, G.S.; Lal, R.; Singh, R.; Avasthe, R.K.; Kumar, A. Soil carbon dynamics in diverse organic land-use systems in North Eastern Himalayan ecosystem of India. Catena 2020, 194, 104785. [Google Scholar] [CrossRef]
  58. Peng, D.; Xu, Q.; Liu, F.; He, Y.; Zhang, S.; Qi, X.; Zhao, K.; Zhang, X. Distribution and failure modes of the landslides in Heitai terrace, China. Eng. Geol. 2018, 236, 97–110. [Google Scholar] [CrossRef]
  59. Ran, Q.; Chen, X.; Hong, Y.; Ye, S.; Gao, J. Impacts of terracing on hydrological processes: A case study from the Loess Plateau of China. J. Hydrol. 2020, 588, 125045. [Google Scholar] [CrossRef]
  60. Xu, Y.; Zhu, G.; Wan, Q.; Yong, L.; Ma, H.; Sun, Z.; Zhang, Z.; Qiu, D. Effect of terrace construction on soil moisture in rain-fed farming area of Loess Plateau. J. Hydrol. Reg. Stud. 2021, 37, 100889. [Google Scholar] [CrossRef]
  61. Helman, D.; Osem, Y.; Yakir, D.; Lensky, I.M. Relationships between climate, topography, water use and productivity in two key Mediterranean forest types with different water-use strategies. Agric. For. Meteorol. 2017, 232, 319–330. [Google Scholar] [CrossRef]
  62. Kuehl, S.A.; Alexander, C.R.; Blair, N.E.; Harris, C.K.; Marsaglia, K.M.; Ogston, A.S.; Orpin, A.R.; Roering, J.J.; Bever, A.J.; Bilderback, E.L.; et al. A source-to-sink perspective of the Waipaoa River margin. Earth-Sci. Rev. 2016, 153, 301–334. [Google Scholar] [CrossRef]
  63. Chen, S.; Stark, S.C.; Nobre, A.D.; Cuartas, L.A.; de Jesus Amore, D.; Restrepo-Coupe, N.; Smith, M.N.; Chitra-Tarak, R.; Ko, H.; Nelson, B.W.; et al. Amazon forest biogeography predicts resilience and vulnerability to drought. Nature 2024, 631, 111–117. [Google Scholar] [CrossRef] [PubMed]
  64. Pinkard, E.A.; Eyles, A.; O’Grady, A.P. Are gas exchange responses to resource limitation and defoliation linked to source:sink relationships? Plant Cell Environ. 2011, 34, 1652–1665. [Google Scholar] [CrossRef] [PubMed]
  65. Renau-Morata, B.; Nebauer, S.G.; Sánchez, M.; Molina, R.V. Effect of corm size, water stress and cultivation conditions on photosynthesis and biomass partitioning during the vegetative growth of saffron (Crocus sativus L.). Ind. Crops Prod. 2012, 39, 40–46. [Google Scholar] [CrossRef]
  66. Ai, X.; Zheng, X.; Zhang, Y.; Liu, Y.; Ou, X.; Xia, C.; Liu, L. Climate and land use changes impact the trajectories of ecosystem service bundles in an urban agglomeration: Intricate interaction trends and driver identification under SSP-RCP scenarios. Sci. Total Environ. 2024, 944, 173828. [Google Scholar] [CrossRef] [PubMed]
  67. Hou, Y.; Zhang, M.; Wei, X.; Liu, S.; Li, Q.; Cai, T.; Liu, W.; Zhao, R.; Liu, X. Quantification of ecohydrological sensitivities and their influencing factors at the seasonal scale. Hydrol. Earth Syst. Sci. 2021, 25, 1447–1466. [Google Scholar] [CrossRef]
  68. Wang, X.; Long, R.; Sun, Q.; Chen, H.; Jiang, S.; Wang, Y.; Li, Q.; Yang, S. Spatial spillover effects and driving mechanisms of carbon emission reduction in new energy demonstration cities. Appl. Energy 2024, 357, 122457. [Google Scholar] [CrossRef]
Figure 1. The geographical location and topography of the Chinese Loess Plateau.
Remotesensing 18 02630 g001
Figure 2. The spatial distribution of environmental and socioeconomic factors, and the change with dimensions on the Chinese Loess Plateau: (A) precipitation (PCP); (B) actual evapotranspiration (ET); (C) potential evaporation (EVP); (D) temperature (Temp); (E) aridity index (AI); (F) normalized-difference vegetation index (NDVI); (G) net primary productivity (NPP); (H) population density (POP); (I) gross domestic product (GDP); (J) elevation; (K) slope.
Remotesensing 18 02630 g002
Figure 3. Relationships between carbon storage (CS) and socioeconomic variables on the Chinese Loess Plateau: (A) precipitation (PCP); (B) actual evapotranspiration (ET); (C) potential evaporation (EVP), the brown points indicate samples in the low-EVP range, whereas the green points indicate samples in the high-EVP range. The red and blue lines represent the fitted regression lines for the low- and high-EVP ranges, respectively; (D) temperature (Temp); (E) aridity index (AI); (F) normalized-difference vegetation index (NDVI); (G) net primary productivity (NPP); (H) population density (POP); (I) gross domestic product (GDP); (J) elevation (Elev); (K) slope; (L) latitude; (M) longitude.
Remotesensing 18 02630 g003
Figure 4. Land change characteristics of the Chinese Loess Plateau from 1980 to 2020, and predicted changes from 2020 to 2040 under three scenarios: natural development (2040-ND), protection of cultivated land (2040-CLP), and ecological protection (2040-EP). (A) Spatial distributions of Land-use. (B) Area of Land-use in different periods (1980, 2000, 2020, 2040-ND, 2040-CLP, 2040-EP). (C) Contribution of drivers to Land-use expansion: precipitation (PCP), actual evapotranspiration (ET), potential evaporation (EVP), temperature (Temp), aridity index (AI), normalized-difference vegetation index (NDVI), net primary productivity (NPP), population density (POP), gross domestic product (GDP), and elevation (Elev).
Remotesensing 18 02630 g004
Figure 5. Characteristics of carbon storage (CS) in the Chinese Loess Plateau from 1980 to 2040. (A) The spatial distribution of CS and the change with dimensions. (B) CS for each type of Land-use: farmland (FL), woodland (WL), water area (W), unused land (UL), and construction land (CL). Scenarios: natural development (2040-ND), protection of cultivated land (2040-CLP), and ecological protection (2040-EP).
Remotesensing 18 02630 g005
Figure 6. Spatial trend of carbon storage (CS) in the Chinese Loess Plateau from 1980 to 2040. Scenarios: natural development (2040-ND), protection of cultivated land (2040-CLP), and ecological protection (2040-EP). Percentage represents the proportion of the area of each trend (increase, no change, and decrease) to the total area (%).
Remotesensing 18 02630 g006
Figure 7. Correlations among the climatic, vegetation, socioeconomic, and topographic variables and carbon storage (CS) in the Chinese Loess Plateau. Variables: precipitation (PCP), actual evapotranspiration (ET), potential evaporation (EVP), temperature (Temp), aridity index (AI), normalized-difference vegetation index (NDVI), net primary productivity (NPP), population density (POP), gross domestic product (GDP), elevation (Elev), longitude (Long), and latitude (Lat). Significance: * p < 0.05; ** p < 0.01; *** p < 0.001.
Remotesensing 18 02630 g007
Figure 8. Redundancy analysis (RDA axes) for the drivers of carbon storage (CS) and land-use cover change (LUCC). Variables: actual evapotranspiration (ET), aridity index (AI), elevation (Elev), gross domestic product (GDP), latitude (Lat), longitude (Long), net primary productivity (NPP), normalized-difference vegetation index (NDVI), population density (POP), potential evaporation (EVP), precipitation (PCP), and temperature (Temp).
Remotesensing 18 02630 g008
Figure 9. The (A) structural equation model and (B) standardized effects of the climate, socioeconomic (SE), topographic (TOPO), and vegetation (Veg) factors on carbon storage (CS). Vegetation characteristics are the normalized-difference vegetation index (NDVI) and net primary productivity (NPP); topographic features are elevation (Elev), slope, longitude (Long), and latitude (Lat); socioeconomic factors are population density (POP) and gross domestic product (GDP); climate variables are temperature (Temp), actual evapotranspiration (ET), potential evaporation (EVP), precipitation (PCP), and the aridity index (AI). χ2 = 68.38, p < 0.001, Chi/DF = 2.36, GFI = 0.915, RMSEA < 0.001. Significance levels: *** p < 0.001; ** p < 0.01; * p < 0.05.
Remotesensing 18 02630 g009
Table 1. Data sources and specifications for the Chinese Loess Plateau study.
Data TypeSecondary Data TypeDescriptionResolution and UnitsSources
Land-useFarmland
Woodland
Grassland
Water area
Construction land
Unused land
Land cover classification30 × 30 mRAESDC
SocioeconomicGDPGross domestic productYuan/km2 (2020)RAESDC
POPPopulation densityPersons/km2 (2020)RAESDC
ClimatePCPAnnual precipitationmm (2020)RAESDC
TempAnnual temperature°C (2020)RAESDC
EVPPotential annual evaporationmm (2020)RAESDC
ETActual evapotranspirationmm (2020)MODIS
AIAridity indexEVP/PCP ratioCalculated
TopographicElevElevationm (2020)GDC
SlopeTerrain slopeDegreesDerived (ArcGIS 10.6)
Long/LatLongitude/latitudeDecimal degreesDerived (ArcGIS 10.6)
VegetationNPPNet primary productivityg C/m2/year (2020)RAESDC
NDVINormalized-difference vegetation indexUnitless (−1 to 1)RAESDC
Note: RAESDC represents China’s Resource and Environment Science and Data Center (http://www.resdc.cn). GDC represents the Geospatial Data Cloud (http://www.gscloud.cn/). NCSFGI represents the National Catalog Service for Geographic Information (https://www.webmap.cn/main.do?method=index, accessed on 8 September 2025).
Table 2. Estimated ecosystem carbon density coefficients for major land-use classes in the Loess Plateau (kg C m−2).
Land-Use Type D a b o v e D b e l o w D s o i l D d e a d Total D i
Farmland0.260.133.910.054.35
Woodland5.31.78.10.415.5
Grassland1.050.525.580.557.7
Water area000.5100.51
Construction land0.050.030.9501.0
Unused land0.060.021.980.032.08
Table 3. Land-use changes and dynamics in the Chinese Loess Plateau from 1980 to 2020, and predicted changes between 2020 and 2040 under three scenarios: 2040-ND, natural development (no change to present trends), 2040-CLP, protection of cultivated land, and 2040-EP, environmental protection.
Land-Use TypesArea (km2)
1980200020202040-ND2040-CLP2040-EP
Farmland204,860.2206,528.7193,694.7183,689.6191,385.7184,507.5
Woodland92,935.092,903.596,390.499,059.397,943.999,125.0
Grassland262,047.5260,210.4259,523.5257,918.5257,175.6260,420.0
Watershed9582.58689.88958.88597.08386.88639.2
Construction land13,429.5514,976.326,423.335,950.230,030.833,809.1
Unused land43,372.742,912.441,211.341,023.141,314.739,723.8
Table 4. Results of the linear mixed-effects models that tested the effects of climatic, vegetation, socioeconomic, and topographic variables, and of their interactions, on carbon storage. MS, mean square. Significance: ns, p > 0.05; * p < 0.05; ** p < 0.01; *** p < 0.001.
CategoryMSdfFSignificance
Climate27.9345.53***
Vegetation55.94144.32***
Socioeconomic26.94121.35***
Topography68.30518.04***
Climate × Vegetation70.01413.87***
Climate × Socioeconomic26.0045.15***
Climate × Topography37.25122.45**
Vegetation × Socioeconomic1.4211.13ns
Vegetation × Topography56.15314.83***
Socioeconomic × Topography28.7037.58***
Climate × Vegetation × Socioeconomic5.5541.10ns
Climate × Vegetation × Topography62.50124.12***
Climate × Socioeconomic × Topography19.41121.28ns
Vegetation × Socioeconomic × Topography10.3732.73*
Table 5. Summary of redundancy analysis results showing eigenvalues, the cumulative explained variation, and pseudo-canonical correlations for each axis.
StatisticAxis 1Axis 2Axis 3Axis 4
Eigenvalues0.630.00170.350.013
Explained variation (cumulative)62.963.4998.63100
Pseudo-canonical correlation0.800.6400
Explained fitted variation (cumulative)98.43100
Table 6. Results of the redundancy analysis, which revealed the percentage of variance explained (Explains %), relative contribution (Contribution %), pseudo-F values, and significance (p value) for each variable: slope, normalized-difference vegetation index (NDVI), population density (POP), gross domestic product (GDP), longitude (Long), elevation (Elev), net primary productivity (NPP), potential evaporation (EVP), latitude (Lat), actual evapotranspiration (ET), temperature (Temp), and precipitation (PCP).
NameExplains %Contribution %Pseudo-Fp
Slope39.962.311180.002
NDVI6.510.22050.002
NPP5.48.51890.002
PCP4.06.31520.002
AI1.42.254.50.002
EVP2.03.182.90.002
Temp1.32.055.00.002
ET1.72.675.10.002
Long0.61.029.10.002
Elev0.81.235.00.02
Lat0.10.26.40.014
POP0.20.39.00.06
GDP<0.1<0.11.60.204
Disclaimer/Publisher’s Note: The statements, opinions and data contained in all publications are solely those of the individual author(s) and contributor(s) and not of MDPI and/or the editor(s). MDPI and/or the editor(s) disclaim responsibility for any injury to people or property resulting from any ideas, methods, instructions or products referred to in the content.