Article

A Cross-System Remote Sensing Framework for Diagnosing Event-Scale Soil Wetting, Vertical Propagation, and Pre-Cipitation Thresholds Across China’s Croplands

1
China Institute of Water Resources and Hydropower Research, Beijing 100038, China
2
Innovation Center on Flood & Drought Disaster Prevention and Reduction of the Ministry of Water Resources, Beijing 100038, China
3
School of Water Resources and Environment, China University of Geosciences (Beijing), Beijing 100083, China
4
School of Civil and Hydraulic Engineering, Huazhong University of Science and Technology, Wuhan 430074, China
5
College of Water Conservancy & Architectural Engineering, Shihezi University, Shihezi 832000, China
6
Hubei Key Laboratory of Digital River Basin Science and Technology, Huazhong University of Science and Technology, Wuhan 430074, China
7
Institute of Water Resources and Hydropower, Huazhong University of Science and Technology, Wuhan 430074, China
*
Author to whom correspondence should be addressed.
Remote Sens. 2026, 18(15), 2614; https://doi.org/10.3390/rs18152614
Submission received: 19 May 2026 / Revised: 27 June 2026 / Accepted: 21 July 2026 / Published: 6 August 2026

Highlights

What are the main findings?
  • ERA5-Land provided the strongest reanalysis-constrained internal-consistency benchmark for event-scale precipitation–soil moisture coupling across China’s croplands.
  • Soil wetting showed depth-dependent lags, driver shifts, and U-shaped precipitation thresholds linked to antecedent wetness.
What are the implications of the main findings?
  • Soil moisture remote sensing should move beyond static-state monitoring toward lag-aware, event-scale wetting diagnosis.
  • Antecedent-state-dependent rainfall thresholds can inform effective rainfall assessment, drought recovery monitoring, and irrigation management.

Abstract

Soil moisture (SM) remote sensing is widely used for agricultural drought monitoring, yet most applications still emphasize static moisture states rather than event-scale wetting responses. We developed an interpretable Earth observation (EO) framework to evaluate precipitation–SM product consistency and diagnose wetting processes across China’s croplands. Multi-source precipitation and SM products, including ERA5-Land, Soil Moisture Active Passive (SMAP), Soil Moisture of China by in situ data (SMCI), Climate Hazards Group InfraRed Precipitation with Station data (CHIRPS), and Grid-based Precipitation dataset for Mainland China (CHM_PRE), were assessed using lagged consistency between rainfall forcing and relative soil moisture increments. The selected pairing was then used to model daily wetting increments at three depths with eXtreme Gradient Boosting (XGBoost), Shapley additive explanations (SHAPs), generalized additive models (GAMs), and quantile regression (QR). ERA5-Land precipitation paired with ERA5-Land SM showed the strongest reanalysis-constrained event-scale consistency (peak mean r = 0.43 at a 1-day lag), providing an internal-consistency baseline for comparison with independent satellite-derived combinations rather than an absolute accuracy ranking. EO-derived wetting signals showed depth-dependent lags, with a 1-day surface response and an approximately 2-day delayed profile signal at 28–100 cm; this pattern should not be interpreted as direct evidence of rapid physical infiltration to 100 cm. Precipitation transition thresholds followed a U-shaped dependence on antecedent wetness, with higher rainfall requirements under extremely dry and near-saturated states. These findings indicate that event-scale EO diagnostics can characterize product consistency, lagged wetting responses, and state-dependent precipitation thresholds, while same-system and deep-layer interpretations remain constrained by reanalysis coupling and model-assisted root-zone products.

1. Introduction

Remote sensing soil moisture (SM) products have become essential for monitoring agricultural drought, land–atmosphere interactions, and regional water availability [1,2]. By providing spatially continuous observations or estimates over large areas, satellite and reanalysis products have improved the capacity to characterize SM variability beyond the limited coverage of ground-based networks [3,4,5]. In agricultural ecosystems, such information is particularly important because SM regulates the partitioning of precipitation into infiltration, runoff, evaporation, and plant-available water, thereby influencing crop water stress, irrigation demand, and yield stability [6,7,8]. However, most remote sensing applications still focus on static SM states, long-term anomalies, or drought indices. The ability of multi-source Earth observation (EO) products to capture short-term wetting responses after precipitation therefore remains insufficiently understood [9,10,11].
The transition of soil toward wetter states following external water inputs is defined as the soil wetting process (SWP) [12]. This process is highly dynamic and is governed by interactions among precipitation characteristics, antecedent soil moisture, vegetation cover, soil texture, topography, and atmospheric demand [13,14,15]. For remote sensing applications, SWP provides a critical event-scale diagnostic target because it reflects how effectively precipitation is converted into soil water storage. Compared with static SM monitoring, event-scale wetting diagnosis requires EO products to capture the magnitude of SM change, its temporal lag, vertical propagation, and state-dependent threshold behavior [16,17]. These requirements are particularly challenging across agricultural landscapes, where soil hydraulic properties, crop cover, and management practices can alter wetting efficiency over short distances [18,19].
Although a wide range of satellite and reanalysis products are now available for precipitation and SM monitoring, their suitability for diagnosing precipitation-driven wetting events remains uncertain. Precipitation products such as CHIRPS and CHM_PRE provide spatially continuous rainfall estimates, while reanalysis datasets such as ERA5-Land offer internally consistent meteorological and land-surface variables. Similarly, SM products such as SMAP, SMCI, and ERA5-Land provide complementary information on surface and root-zone soil water conditions [20]. Numerous studies have evaluated the absolute accuracy or spatial consistency of these products using ground-based observations or inter-product comparisons [21,22]. However, fewer studies have systematically examined whether different precipitation–SM product combinations can reproduce daily-scale wetting responses, especially when lagged responses and depth-dependent propagation are considered. This knowledge gap limits the use of EO products for diagnosing agricultural drought recovery, effective rainfall, and irrigation timing.
A further challenge is that soil wetting responses are intrinsically non-linear. The same precipitation input can generate different wetting or runoff responses depending on antecedent soil moisture, depth and landscape position [23,24]. Under very dry conditions, wetting can be limited by thin adsorbed water films and high matric forces at low water contents, while soil water repellency and crust formation can further reduce infiltration [25,26,27]. Under intermediate wetness conditions, rainfall can be more efficiently converted into soil water storage. Conversely, when soil moisture approaches or exceeds field capacity, additional rainfall may be rapidly lost through drainage or runoff, reducing wetting efficiency [28]. These state-dependent behaviors imply that EO-based wetting diagnosis must move beyond simple precipitation–SM correlations and identify thresholds that regulate whether precipitation produces meaningful soil water replenishment.
Traditional hydrological monitoring provides valuable point-scale observations but has limited capacity to resolve continental-scale agricultural heterogeneity [29,30,31]. Station measurements are usually accurate and temporally continuous, but their sparse spatial distribution makes it difficult to generalize SWP mechanisms across diverse soil textures, topographic settings, and crop-growing regions. Physically based models such as HYDRUS-1D and the Community Land Model can represent infiltration, redistribution, and soil–plant–atmosphere interactions, but their large-scale application is often constrained by intensive parameterization requirements and uncertainties in distributed soil hydraulic properties [32]. Previous studies on distributed soil moisture patterns, physically based root-zone estimation from surface observations, and exponential-filter root-zone inference have further shown that surface-to-root-zone transfer is controlled by spatial heterogeneity, antecedent profile storage, vertical-transfer assumptions, and model structure [33,34,35]. These studies provide the hydrological context for the present lag-based EO diagnostic framework.
Explainable artificial intelligence (XAI) offers a way to connect EO-derived signals with physically interpretable hydrological processes. Machine learning models such as eXtreme Gradient Boosting (XGBoost) can capture non-linear interactions among precipitation, antecedent SM, vegetation, soil properties, and meteorological variable [36,37,38]. However, black-box prediction alone is insufficient for hydrological inference. By integrating Shapley additive explanations (SHAPs), the contribution and response direction of each predictor can be quantified, allowing dominant wetting controls and their depth-dependent transitions to be identified. Quantile regression can then retrieve precipitation thresholds under different antecedent wetness states, converting EO-derived wetting signals into interpretable indicators of drought recovery and effective rainfall.
Current evaluations of soil moisture remote sensing remain dominated by state-based accuracy assessment, whereas event-scale consistency between precipitation forcing and soil moisture increments is still underexplored. To address this gap, we developed an interpretable multi-source EO framework for diagnosing daily soil wetting processes across China’s croplands from 2017 to 2022. The framework evaluates EO products as coupled precipitation–SM combinations rather than as isolated datasets, allowing rapid wetting responses, vertical propagation, and antecedent-state-dependent threshold behavior to be examined together. The contribution of this study is not the selection of a single optimal soil moisture product. Instead, it provides a lag-aware, cross-system diagnostic protocol for testing whether multi-source precipitation and soil moisture products jointly capture event-scale wetting responses. Specifically, we aimed to: (1) evaluate event-scale precipitation–SM consistency among ERA5-Land, SMAP, SMCI, CHIRPS, and CHM_PRE product pairings across lag times and soil depths; (2) diagnose lagged vertical wetting propagation using the selected reanalysis-constrained benchmark and XGBoost-SHAP attribution across homogeneous agricultural zones; and (3) retrieve antecedent-state-dependent precipitation thresholds with explainable machine learning and quantile regression to quantify rainfall requirements for soil moisture gradient shifts. By shifting remote sensing applications from state-based SM monitoring to event-scale wetting diagnosis, this framework supports EO product evaluation, agricultural drought recovery assessment, effective rainfall estimation, and irrigation decision support.

2. Materials and Methods

2.1. Study Area

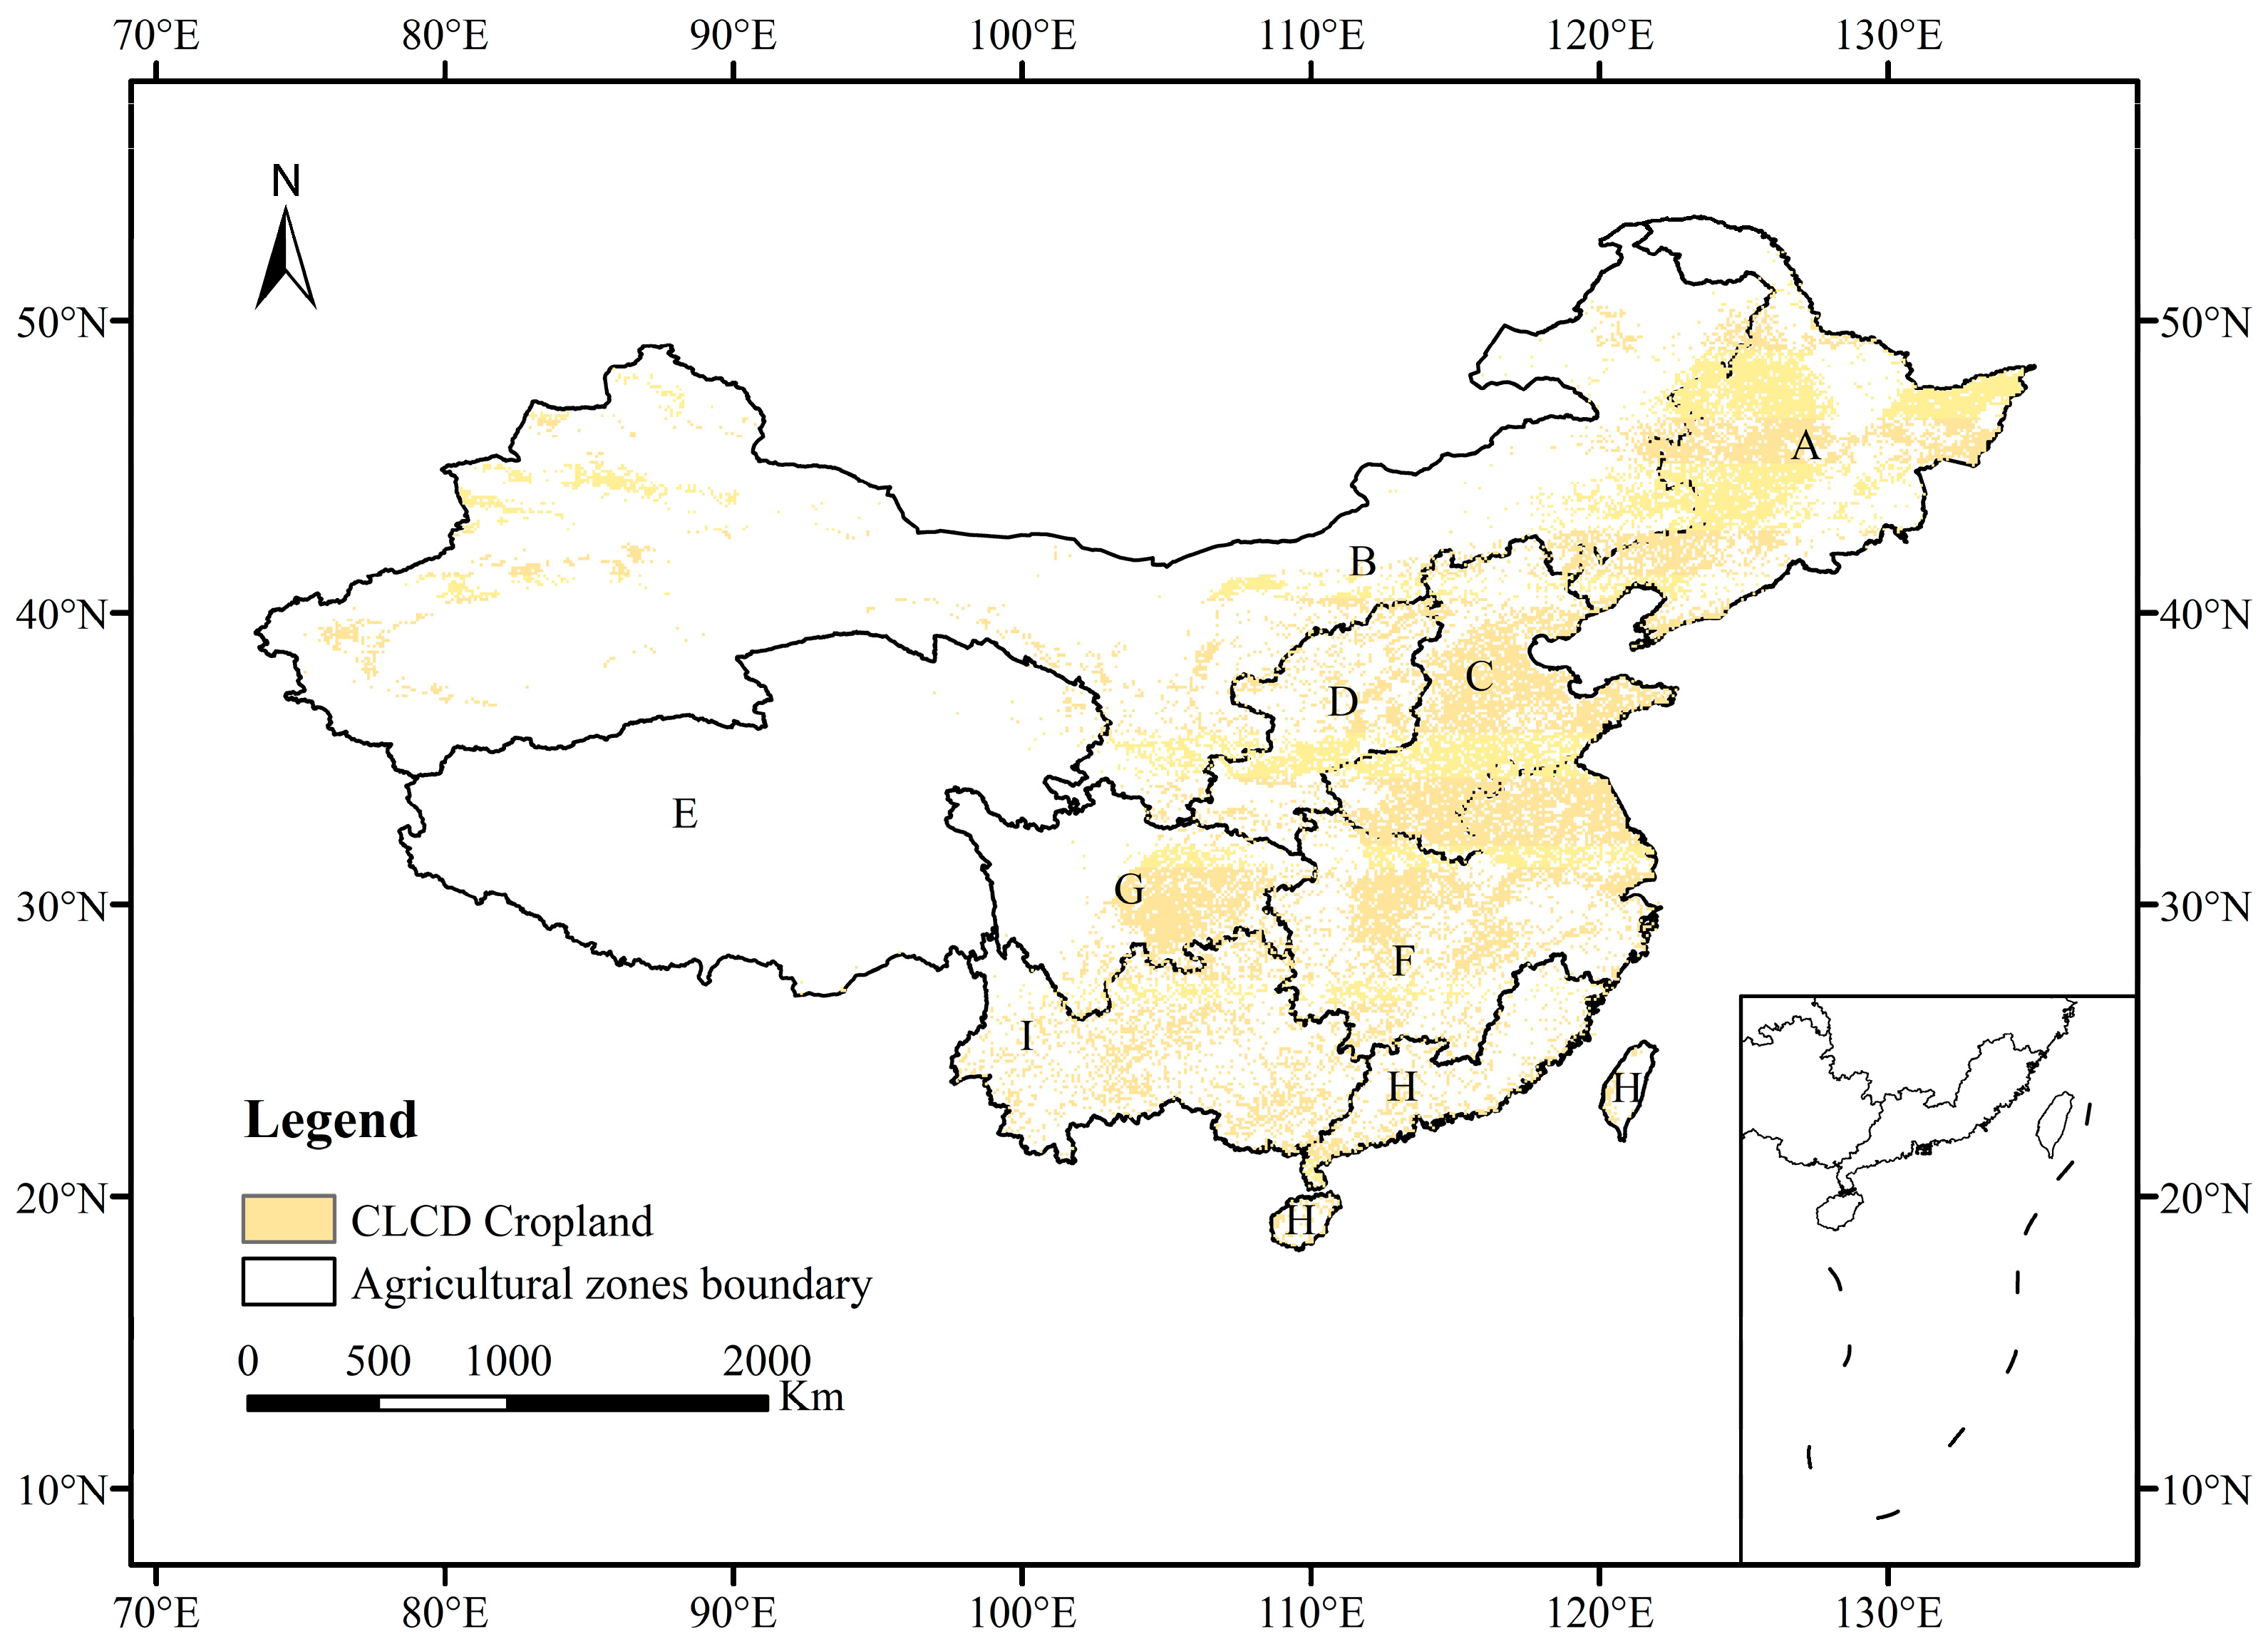
This study examined cropland ecosystems across China using data from the National Cryosphere Desert Data Center (http://www.ncdc.ac.cn; accessed on 15 June 2026). To represent macro-scale hydro-climatic and geographical diversity, the study area was initially divided into nine agricultural sub-regions following the latest standards from the Resources and Environmental Science Data Platform (https://www.resdc.cn/; accessed on 15 June 2026) (Figure 1). Zone E was retained in the product-level lag-correlation screening where gridded cropland pixels were available, but it was excluded from the homogeneous-zone XGBoost attribution and threshold-retrieval analyses because cropland area was limited and spatially fragmented.
Because soil wetting dynamics are sensitive to local physical properties, continental-scale assessment requires environmental heterogeneity to be reduced where possible. Croplands in the remaining eight regions were therefore classified into homogeneous zones by intersecting 1 km USDA soil-texture raster (12 classes) with topographic constraints (1000 m elevation strata and 2° slope intervals). For example, Loam_1 denotes loam soils below 1000 m elevation and below 2° slope. Spatial overlay analysis identified 40, 43, and 49 homogeneous zones across the three soil depths (Section 3.1). To improve modeling robustness and reduce noise from spatial fragmentation, three dominant homogeneous zones (Loam_1, Sandy Loam_1, and Clay Loam_1) were selected for comparative analysis. These zones accounted for 73.79%, 71.33%, and 68.03% of the total cropland area at their respective depths. Further details are provided in the Supplementary Materials.

2.2. Datasets

To characterize soil wetting processes, we used widely applied remote sensing and reanalysis products for precipitation and soil moisture. The study period extended from 1 January 2017 to 31 December 2022 at a daily resolution. Nine precipitation–SM product combinations (Table 1) were constructed to evaluate the regional applicability of multi-source products across the study area. Within the interpretable wetting framework, soil texture, soil properties, elevation, and vegetation characteristics were used as model inputs for estimating soil wetting dynamics. Additional information on the selected datasets is provided in Table 2.
The 2017–2022 study period was selected primarily to match the availability of high-quality SMAP soil moisture observations. Although this six-year window is relatively short for climatological analysis, it includes diverse hydro-climatic conditions and is therefore suitable for identifying recent wetting-event responses. The study area experienced substantial interannual variability during this period, including notable drought events in Northern China [39,40] and intensified precipitation patterns in Southern regions [41,42]. This combination of dry and wet years supports the identification of wetting thresholds across varying antecedent moisture states. Nevertheless, the period may not capture long-term decadal climate oscillations, such as ENSO cycles. The identified thresholds should therefore be interpreted as dominant responses under recent climate conditions.
Table 2. Datasets used in this study.
CategoryProduct or Source and VariablesTemporal ResolutionSpatial ResolutionReference
PrecipitationCHIRPS v2.0 precipitationDaily0.05°[43]
PrecipitationCHM_PRE v1.0 precipitationDaily0.1°[44]
Soil moistureSMAP Level 4 soil moisture (Version Vv4030); surface (0–5 cm) and root-zone (0–100 cm) products3 h (09:00 record selected as daily representative)0.1°[45]
Soil moistureSMCI v1.0 soil moisture at 10 depth intervals (0–10, 10–20, 20–30, 30–40, 40–50, 50–60, 60–70, 70–80, 80–90, and 90–100 cm)Daily1 km[46]
ReanalysisERA5-Land reanalysis: precipitation, SM, ST at 0–7, 7–28, and 28–100 cm; SP, T2M, WU10M, WV10M, TE, and LAI;
SP, T2m, WU10m, WV10m TE, TP, and LAI
1 h (09:00 record selected as daily representative)0.1°[47]
VegetationMODIS MOD13A2 v006: NDVI and EVI16 days1 km[48]
TerrainDEM and slopeStatic1 km[49]
Soil propertiesSand, silt, clay, and porosity at six standard depth intervals (0–5, 5–15, 15–30, 30–60, and 60–100 cm)Static1 km[50]
Bulk density and field capacity at seven depth intervals (0–4.5, 4.5–9.1, 9.1–16.6, 16.6–28.9, 28.9–49.3, 49.3–82.9, and 82.9–138.3 cm)Static1 km[51]
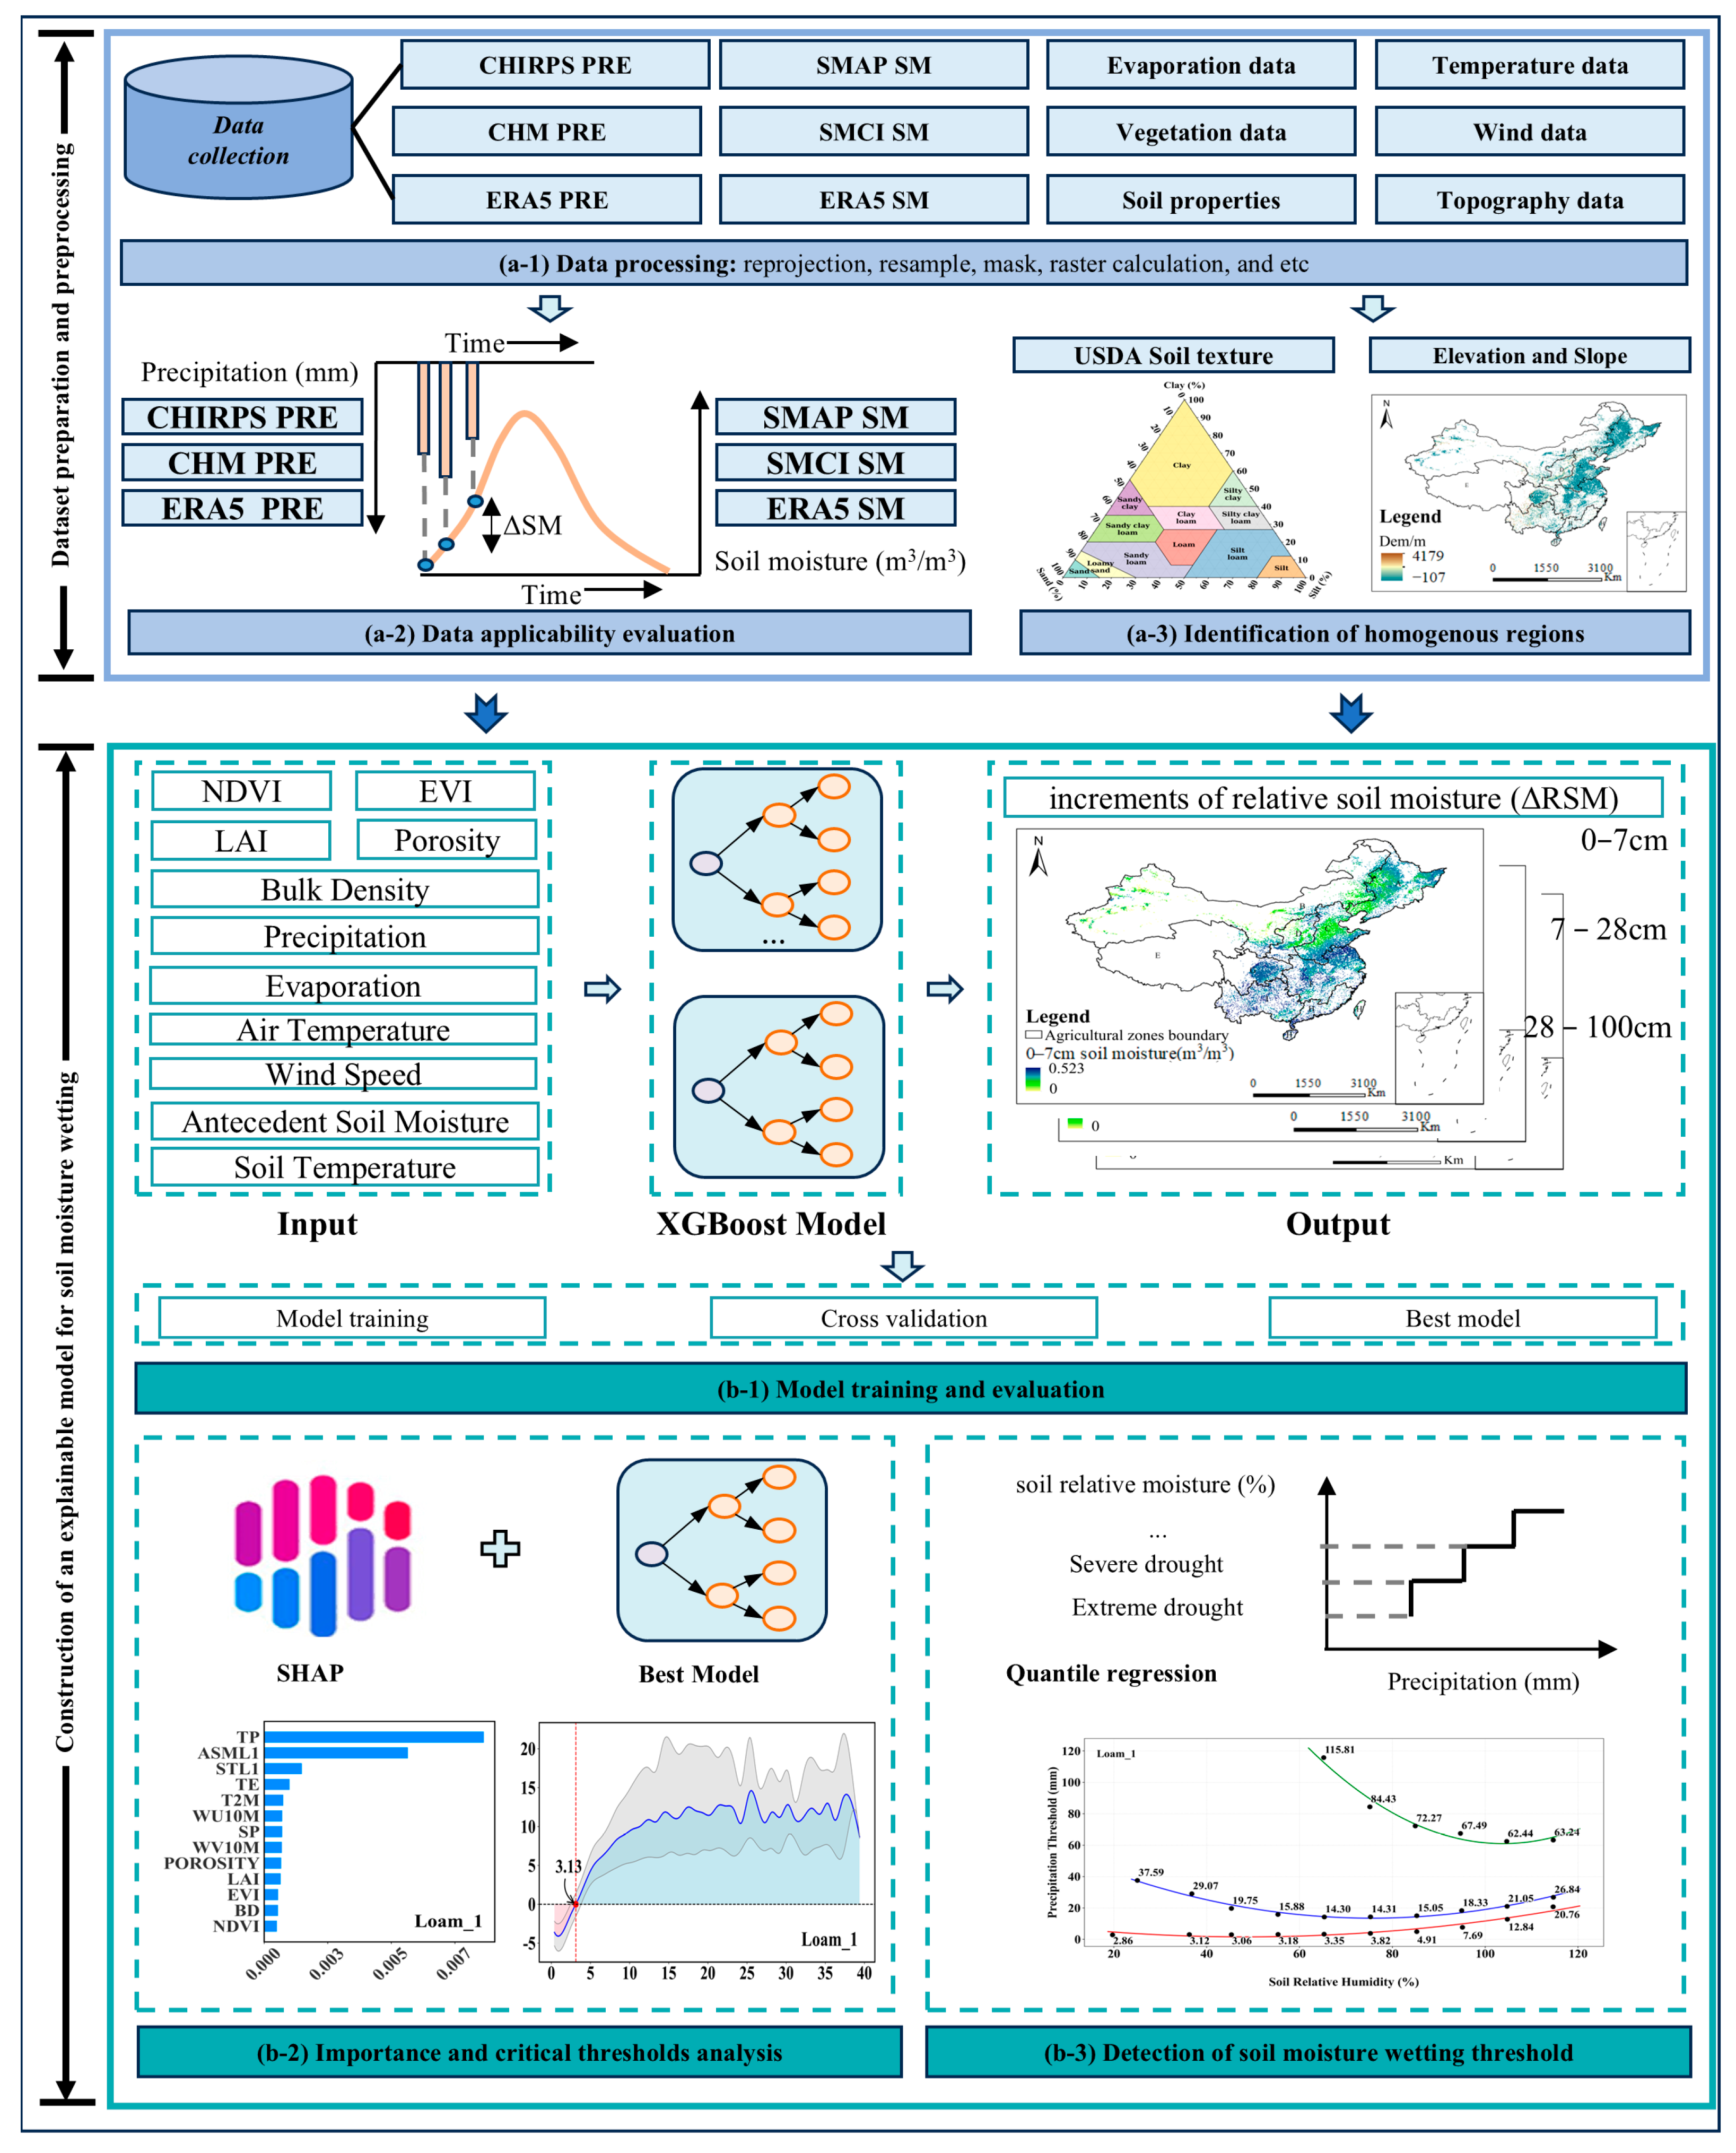
We developed an integrated EO-driven analytical framework to evaluate whether multi-source products can diagnose precipitation-driven soil wetting processes (Figure 2). Lagged correlation screened precipitation–SM product combinations, XGBoost-SHAP identified dominant wetting controls, SHAP-GAM curves located marginal response tipping points, and QR estimated precipitation transition thresholds between antecedent wetness states. The framework shifts the focus from static SM monitoring to event-scale wetting-process diagnosis across China’s croplands.

2.3. Multi-Source Remote Sensing Data Harmonization

All multi-source datasets, including precipitation, SM, vegetation, soil, and terrain data, were standardized to a unified spatial–temporal framework using ERA5-Land as the baseline. Spatially, datasets were reprojected to the WGS-1984 coordinate system and aggregated to a 9 km × 9 km grid using grid-cell averaging for continuous variables and dominant-class assignment for categorical variables. Although aggregation of high-resolution terrain, soil, and vegetation data inevitably smooths field-scale heterogeneity, this harmonization is needed for pixel-level consistency among multi-source EO products and is widely used in regional-scale hydro-climatic modeling [52]. Temporally, variables were converted to a daily scale before cross-product comparison. For MODIS 16-day indices (NDVI and EVI), the Savitzky–Golay filter [53] was applied to reduce cloud contamination, followed by daily interpolation. For both ERA5-Land and SMAP L4, the soil moisture record at 09:00 each day was selected as the representative daily value. Specifically, ERA5-Land and SMAP L4 were sampled at the same daily time point to maintain temporal consistency between the two datasets, rather than using daily averages calculated from all available sub-daily records. Furthermore, soil and SM datasets were vertically harmonized to match the target ERA5-Land layers (0–7 cm, 7–28 cm, and 28–100 cm) via layer-wise weighted averaging based on overlap thickness. ERA5-Land 28–100 cm SM were treated as model-assisted profile moisture estimates constrained by land-surface modeling and data assimilation. Accordingly, the 28–100 cm response was interpreted as an EO/reanalysis-derived delayed profile moisture signal rather than direct observational evidence of rainfall infiltration to 100 cm.

2.4. Soil Wetting Event Extraction and Suitability Assessment

Relative soil moisture (RSM) was used to normalize soil moisture states across different soil textures. Soil wetting events were defined using a dual-threshold criterion requiring both measurable daily precipitation (p > 0.1 mm) and a positive daily moisture increment (ΔRSM > 1%). The precipitation threshold filters trace rainfall, while the ΔRSM threshold reduces the influence of small non-precipitation perturbations such as retrieval noise and diurnal fluctuations [54]. Because these thresholds affect event selection, the resulting correlations are interpreted as event-scale precipitation–SM consistency under the adopted wetting-event definition rather than as an absolute measure of product accuracy. We therefore evaluated threshold sensitivity using ΔRSM thresholds of 0.5%, 1.0%, and 2.0%, precipitation event cutoffs of 0.1, 1.0, and 5.0 mm, lag selections of 1–3 days where lag-specific paired records supported comparison, and alternative antecedent-moisture class schemes. This operational event-extraction protocol was designed to balance trace-rainfall exclusion, retrieval-noise control, and retention of weak but measurable wetting responses; it should therefore be interpreted as a reproducible screening criterion rather than a universal hydrological wetting boundary across soil textures, climate regimes, and depths.
R S M = ω f × 100 %
ω = θ ρ
Δ R S M = R S M t + i R S M t
where R S M , ω , f , θ , ρ   R S M ( t + i ) , R S M ( t ) represent relative soil moisture (%), weight moisture content (g), field capacity, volumetric water content (cm3/cm3), and bulk density (g/cm3), the RSM at time t + i and t , respectively. This formulation allows soil wetting dynamics to be evaluated consistently across soil layers and regions. Subsequently, the sensitivity of soil wetting to precipitation was assessed by calculating Pearson correlation coefficients (r) between ΔRSM and precipitation across different agricultural zones, months, and lag periods.
To establish a reproducible event-scale product-consistency protocol for multi-source EO products, nine precipitation–SM pairings (Table 1) were evaluated in a unified diagnostic framework: ERA5-Land precipitation, CHIRPS v2.0, and CHM_PRE v1.0 crossed with ERA5-Land SM, SMAP L4, and SMCI v1.0. Same-system reanalysis pairings, such as ERA5-ERA5, were treated as internally consistent benchmarks because precipitation forcing and SM response are constrained within a shared land-surface and assimilation framework. Cross-system pairings, such as CHIRPS–SMAP and CHM_PRE-SMCI, were treated as more independent references because precipitation forcing and SM response originate from different observing or modeling systems. The systematic difference between same-system and cross-system pairings was interpreted as a diagnostic signature of cross-product consistency, not as a definitive ranking of absolute product accuracy. Product consistency was quantified using lagged Pearson correlation coefficients (1- to 3-day lags) between precipitation and ΔRSM across soil depths and agricultural zones; this screening metric does not independently validate absolute SM accuracy. For the headline ERA5-ERA5 surface-layer lag 1-day result, we also used Spearman rank correlation on the same paired daily records to test whether the association was robust to skewed and zero-inflated daily increments.

2.5. EO-Driven Prediction and Explainable Attribution

After identifying the precipitation–SM pairing with the strongest event-scale consistency, we developed an EO-driven XGBoost model as a non-linear diagnostic interpolation framework for daily relative soil moisture increments (ΔRSM) across China’s croplands. The model was not used as a transferable forecasting tool for unseen years or regions. Prediction skill was therefore treated as a prerequisite for interpreting EO-derived wetting relationships within the sampled environmental domain, whereas the primary objective was to diagnose wetting controls and support explainable attribution and threshold retrieval.
Predictors represented meteorological forcing, vegetation conditions, antecedent soil water states, and static environmental attributes. Meteorological variables included total daily precipitation (TP), total evaporation (TE), 2 m air temperature (T2M), surface pressure (SP), and 10 m wind components (WU10M and WV10M). Vegetation variables included MODIS NDVI, MODIS EVI, and ERA5-Land LAI, which were used as EO-derived indicators of vegetation condition, canopy development, and crop growth status. These indices represent vegetation effects on precipitation partitioning, canopy interception, transpiration demand, and soil water redistribution. Soil water and thermal variables included antecedent relative soil moisture (ASML) and soil temperature (STL) at the corresponding depth. Static soil and terrain variables included bulk density (BD), porosity, soil texture, elevation, and slope. These predictors were selected to represent major EO-observable and reanalysis-derived controls on precipitation partitioning, infiltration, evaporation, and redistribution.
For each homogeneous agricultural zone and soil depth, an independent XGBoost model was trained using the following general form:
D S M L i = f T P , T E , N D V I , E V I , L A I , T 2 M , S P , W U 10 M , W V 10 M , A S M L i , S T L i , B D i , P o r o s i t y i
where f denotes the depth-specific XGBoost model; DSMLi, ASMLi, STLi, BDi, and Porosityi denote daily relative soil moisture increment, antecedent relative soil moisture, soil temperature, bulk density, and porosity for the corresponding soil layer (0–7, 7–28, or 28–100 cm), respectively.
Hyperparameters, including learning rate, maximum tree depth, subsample ratio, column sampling ratio, and the number of estimators, were optimized using the Optuna framework [55] with 50 trials by minimizing the mean squared error. A random ten-fold cross-validation strategy was first used to evaluate within-framework diagnostic consistency for each homogeneous zone and depth. Because daily SM records exhibit temporal autocorrelation and zones share internally similar environmental conditions, two complementary block-validation strategies were applied as more conservative tests of generalizability: (i) leave-one-year-out cross-validation (LOYO; year block), to evaluate temporal transferability across 2017–2022; and (ii) leave-one-zone-out cross-validation (LOZO; spatial block), to evaluate spatial transferability across homogeneous agricultural zones.
SHAP was applied to quantify feature contributions following the original model-agnostic Shapley additive explanation framework [56]. SHAP values represent the marginal effect of each predictor on ΔRSM relative to the baseline prediction. GAMs were subsequently fitted to SHAP values to identify non-linear response curves and SHAP-derived tipping points, defined here as points where the marginal contribution of a driver changes sign around the zero-SHAP baseline. These tipping points describe single-variable marginal effects and are conceptually distinct from the QR-derived transition thresholds used below to estimate rainfall requirements for movement between antecedent RSM classes. They should therefore be interpreted as marginal-contribution thresholds within the fitted XGBoost-SHAP attribution framework, not as field-observed hydraulic thresholds or intrinsic soil-hydraulic properties. Uncertainty in the surface-layer SHAP-derived precipitation tipping point was quantified using bootstrap resampling and 95% confidence intervals. The SHAP value for feature i is defined as:
ϕ i = S M \ x i S ! M S 1 ! M ! η S x i η S
where M denotes the full feature set; S is a subset of M excluding feature i; |M| and |S| are the numbers of features in M and S, respectively; |S|! is the factorial term; f(S) is the model prediction using features in S; and f(S ∪ {i}) is the prediction after feature i is added. The resulting SHAP value φi quantifies the marginal contribution of feature i to ΔRSM.

2.6. Remote Sensing-Based Precipitation Threshold Retrieval Across Antecedent Wetness States

Quantile regression has been used to capture non-linear relationships associated with infiltration, percolation, and soil moisture redistribution in hydrogeological and soil hydrological studies [57,58]. Here, QR was used to estimate precipitation transition thresholds under varying antecedent moisture states. Linear, exponential, logarithmic, and polynomial functions were evaluated as candidate models, and the best-fitting function was selected to characterize how precipitation requirements change across RSM classes. Unlike the SHAP-GAM tipping point, which indicates where a predictor’s marginal contribution shifts from suppressing to promoting ΔRSM, the QR-derived transition threshold represents the rainfall amount associated with a shift from one antecedent RSM class to the next. We modeled the conditional median (τ = 0.5) of precipitation across stratified RSM classes (Table 3) to capture this state-dependent wetting response [59]. RSM values above 100% can occur because RSM is normalized by field capacity; values between 100% and 110% therefore indicate near-saturated or temporarily above-field-capacity conditions rather than an impossible moisture state.
Throughout the manuscript, SHAP-derived tipping points, marginal-contribution thresholds, QR-derived transition thresholds, wetting initiation, and effective rainfall are used as method-specific diagnostic terms. SHAP-derived tipping points refer to sign changes in the marginal SHAP contribution within the fitted XGBoost-SHAP framework, whereas QR-derived transition thresholds refer to rainfall amounts associated with transitions between antecedent RSM classes. Wetting initiation denotes the onset of precipitation-driven soil wetting, and effective rainfall denotes the portion of precipitation that contributes to event-scale RSM increases. These terms are therefore not used interchangeably as physical hydrological thresholds.

2.7. Validation and Performance Assessment

We assessed the diagnostic performance of the XGBoost-based wetting-increment models with the coefficient of determination (R2), root mean squared error (RMSE), and mean absolute error (MAE) (Equations (6)–(8)).
R 2 = 1 i = 1 n y ^ i y i 2 i = 1 n y ¯ i y i 2
R M S E = i = 1 n y i y ^ i 2 n
M A E = i = 1 n y i y ^ i n
The variables denote observed and predicted ΔRSM values, their mean values, and the number of observations. Lower MAE and RMSE indicate smaller prediction errors, whereas higher R2 indicates stronger agreement between observed and modeled wetting increments.

3. Results

3.1. Performance of Multi-Source EO Combinations in Capturing Wetting Events

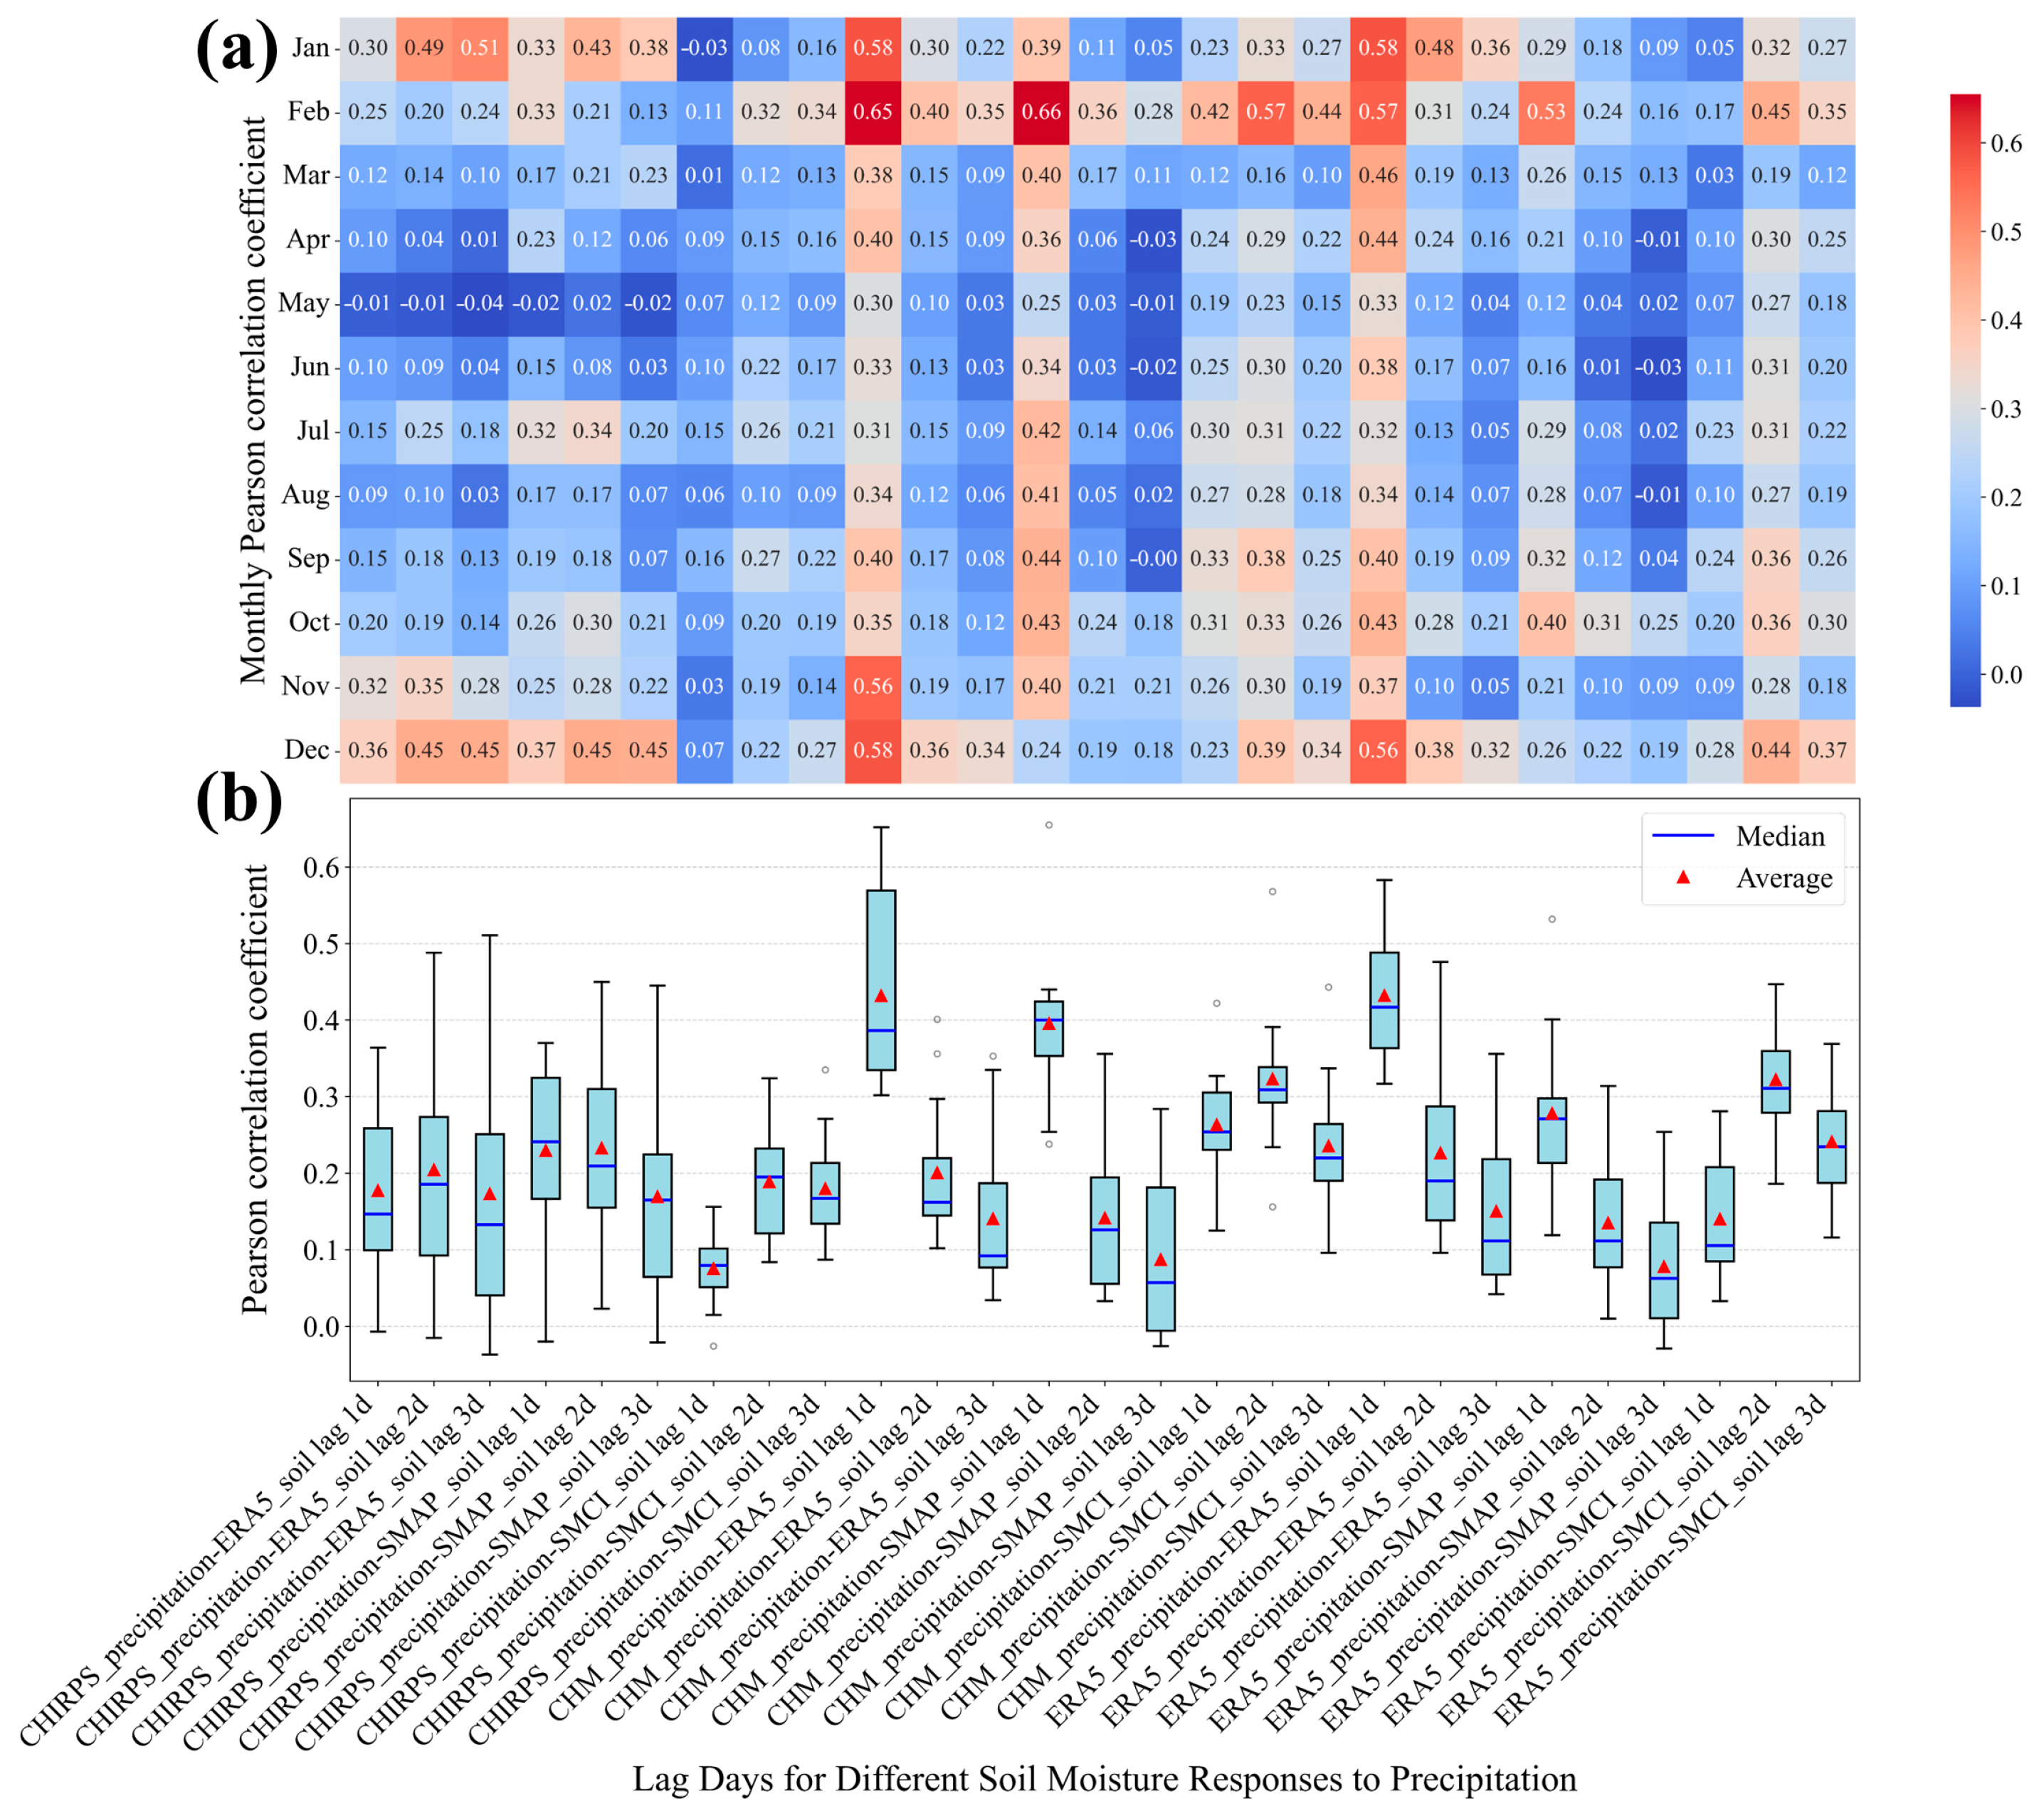
Pearson correlation analysis showed that the ERA5-Land precipitation–ERA5-Land SM pairing (Combination 7) had the strongest same-system event-scale consistency at a 1-day lag (Figure 3). Although CHM_PRE precipitation paired with ERA5-Land SM (Combination 4) performed better during winter, ERA5-Land precipitation paired with ERA5-Land SM showed stronger coupling during the main crop growing season (March-October; r = 0.39). This result identifies ERA5–ERA5 as an internally consistent reanalysis baseline for subsequent wetting diagnosis. It does not imply that ERA5-Land has the highest absolute SM accuracy, because stronger coupling may partly reflect shared forcing data, land-surface physics, model structure, and assimilation assumptions.
To test whether product-pair differences were statistically detectable, paired Wilcoxon signed-rank tests were performed on the zone–month correlation matrix (nine agricultural zones × 12 months; n = 108 matched observations). ERA5-Land precipitation-ERA5-Land SM (ERA5–ERA5) had a higher mean event-scale correlation (0.463; bootstrap 95% CI: 0.436–0.490) than CHM–SMAP (0.416; 0.391–0.441) and CHM–ERA5 (0.384; 0.352–0.416). Paired differences were significant for ERA5-ERA5 versus CHM–ERA5 (mean difference = 0.079, 95% CI: 0.061–0.098, W = 560.0, p < 0.001), ERA5-ERA5 versus CHM–SMAP (mean difference = 0.048, 95% CI: 0.026–0.069, W = 1654.0, p < 0.001), and CHM–SMAP versus CHM–ERA5 (mean difference = 0.031, 95% CI: 0.009–0.053, W = 2075.5, p = 0.0078). These tests indicate statistically detectable differences in relative event-scale consistency among product combinations, not independent proof of absolute wetting accuracy. Across the nine agricultural zones, zone-mean ERA5-ERA5 lag 1-day correlations ranged from 0.349 to 0.546, with an across-zone standard deviation of 0.066. This dispersion indicates that the headline mean correlation reflects the strongest event-scale consistency among tested pairings, but not spatially uniform coupling across all agricultural zones.
As a rank-based robustness check, the ERA5-ERA5 surface-layer 1-day-lag association produced Spearman ρ = 0.555 (p < 0.001), whereas the corresponding Pearson correlation for the same records was r = 0.442. The headline lagged association was therefore not solely a Pearson linear-correlation artefact caused by skewed or zero-inflated daily increments. It remains, however, a reanalysis-constrained product-consistency signal rather than independent validation of absolute soil moisture accuracy.
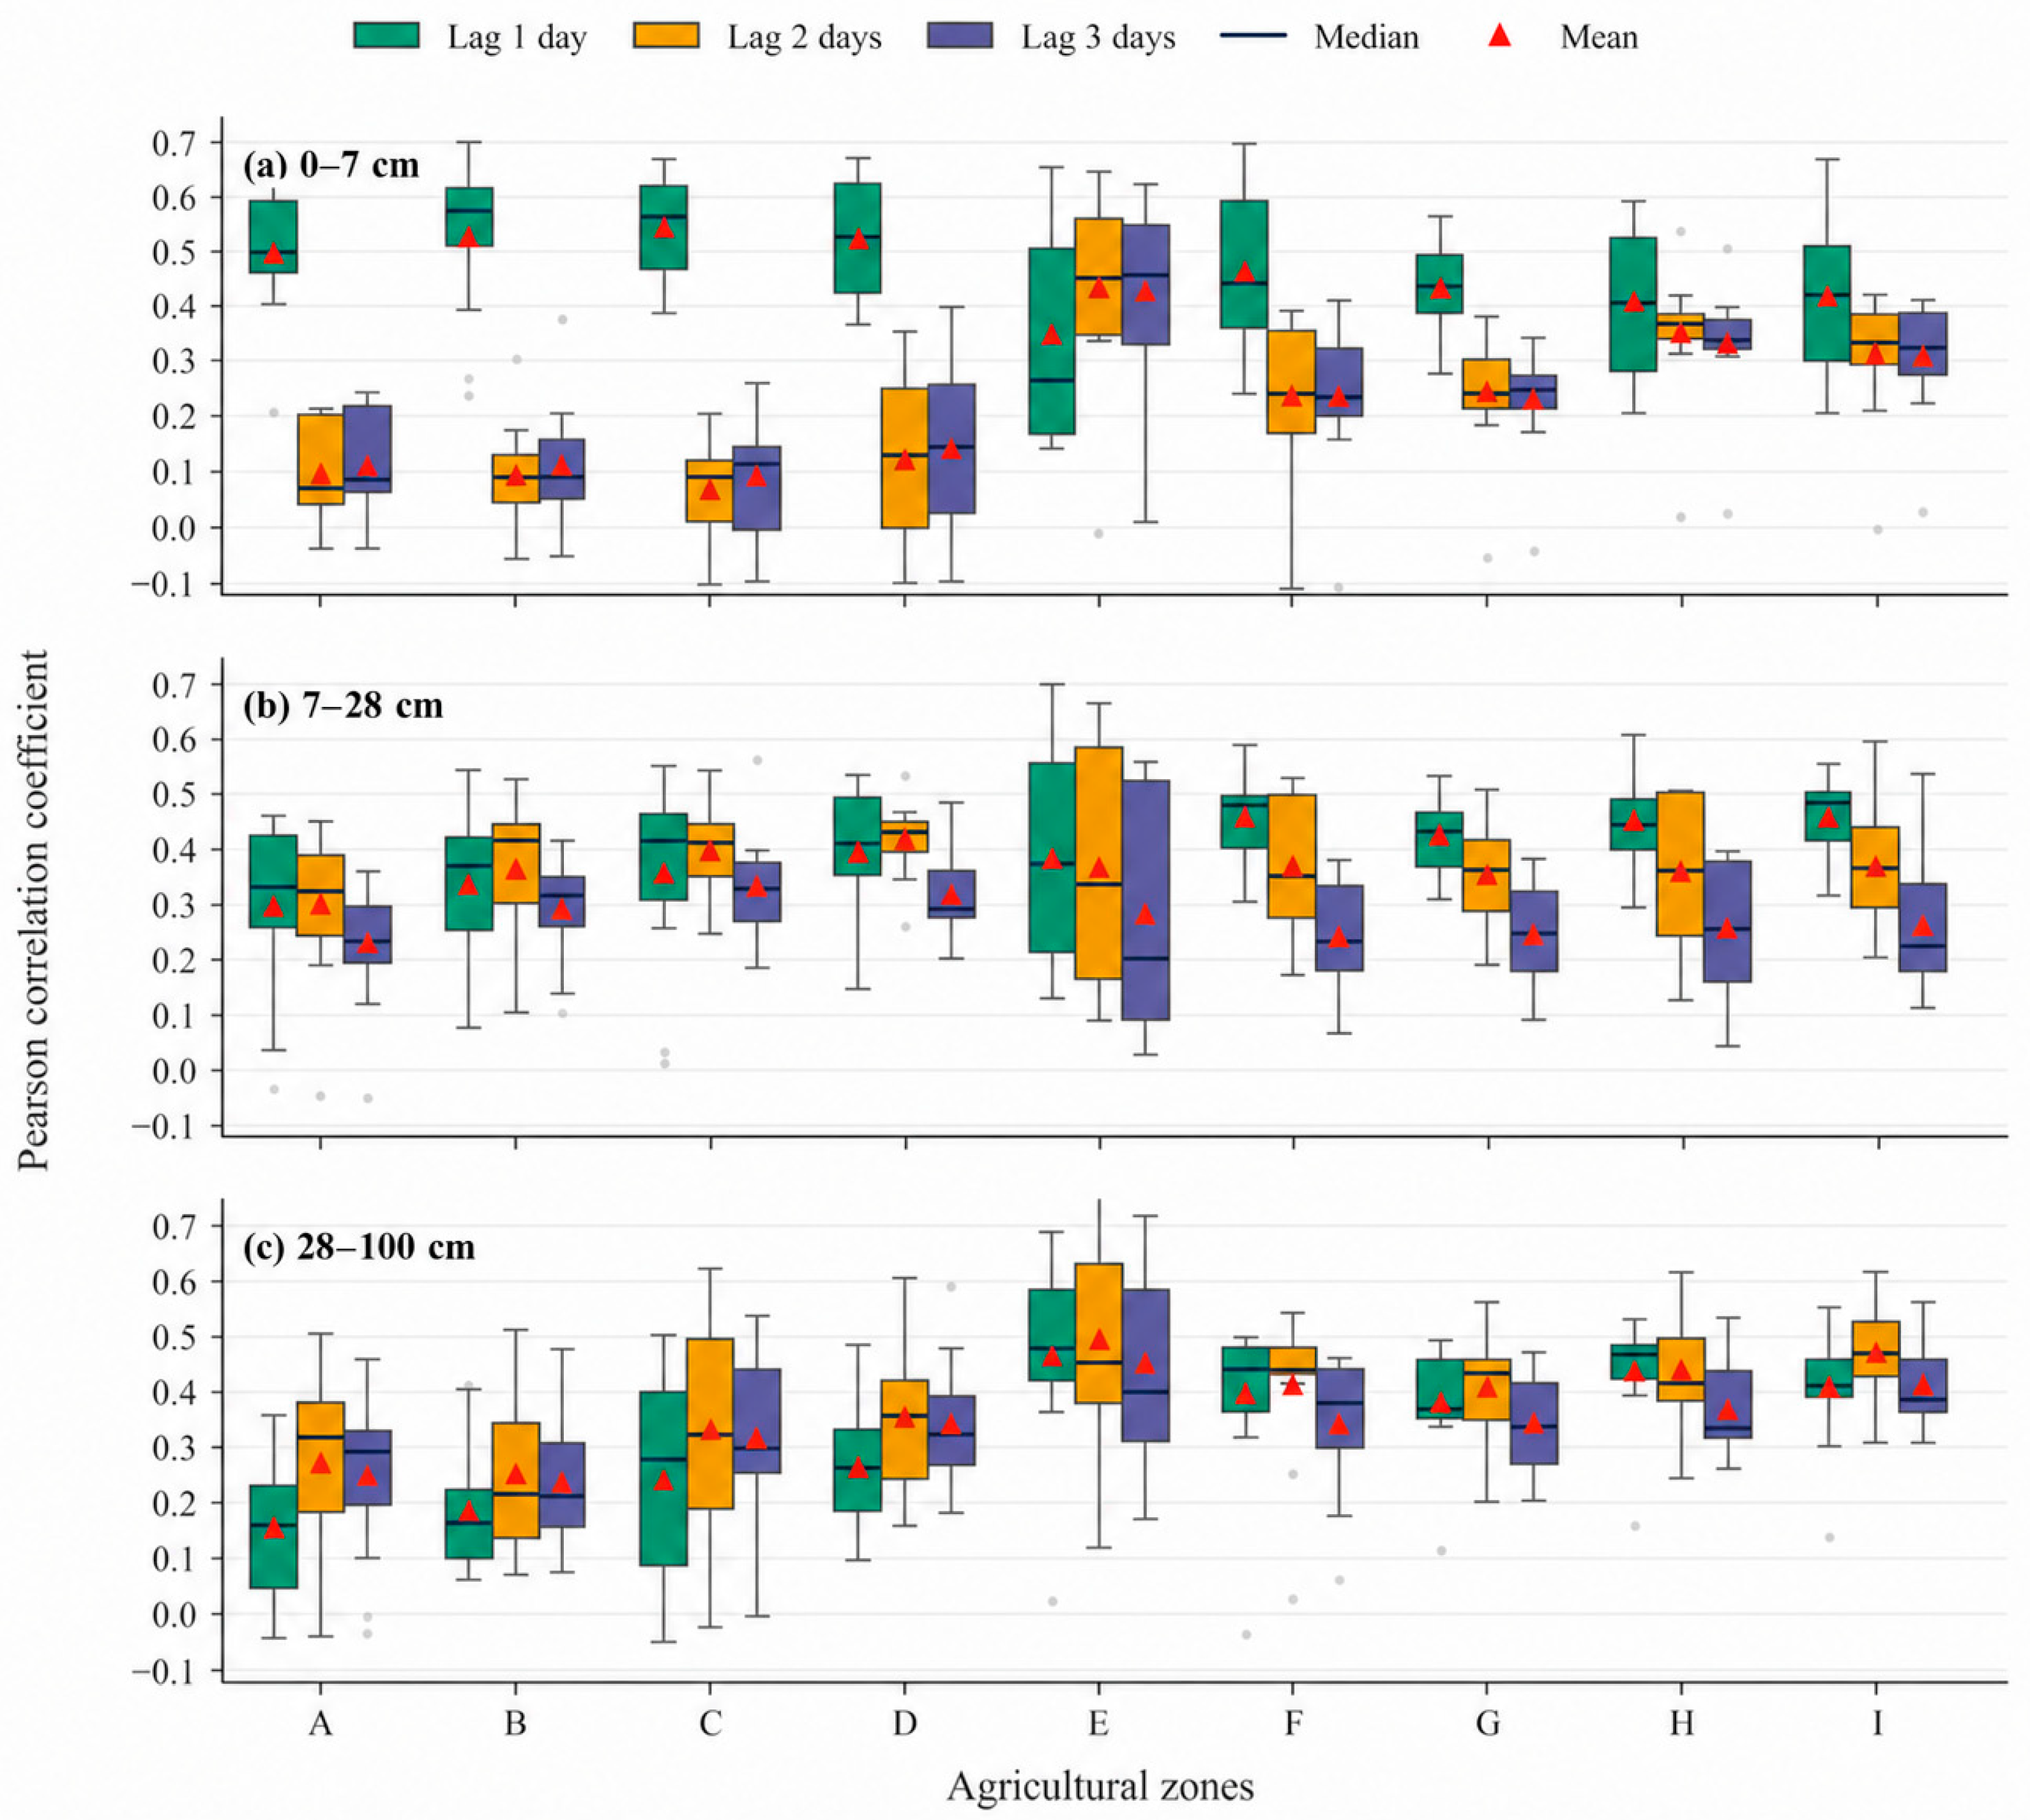
The lagged moisture response to precipitation varied across depths and agricultural sub-zones (Figure 4). Surface moisture (0–7 cm) mainly showed a 1-day lag, with strong correlations in Zones A–D (r > 0.50) and moderate correlations in Zones F–I (r > 0.40), except for a 2-day lag in Zone E. In the 7–28 cm layer, a spatial divergence emerged: northern zones (A–D) shifted to a 2-day lag, whereas southern zones (E–I) maintained a 1-day lag with a 3.9% average correlation increase. Deep soil layers (28–100 cm) showed a consistent approximately 2-day delayed EO/reanalysis profile moisture response across agricultural sub-zones. This lag is consistent with delayed redistribution or profile-storage adjustment, but it should not be interpreted as direct proof of rapid physical infiltration to 100 cm.

3.2. EO-Driven Prediction of Daily Soil Wetting Increments

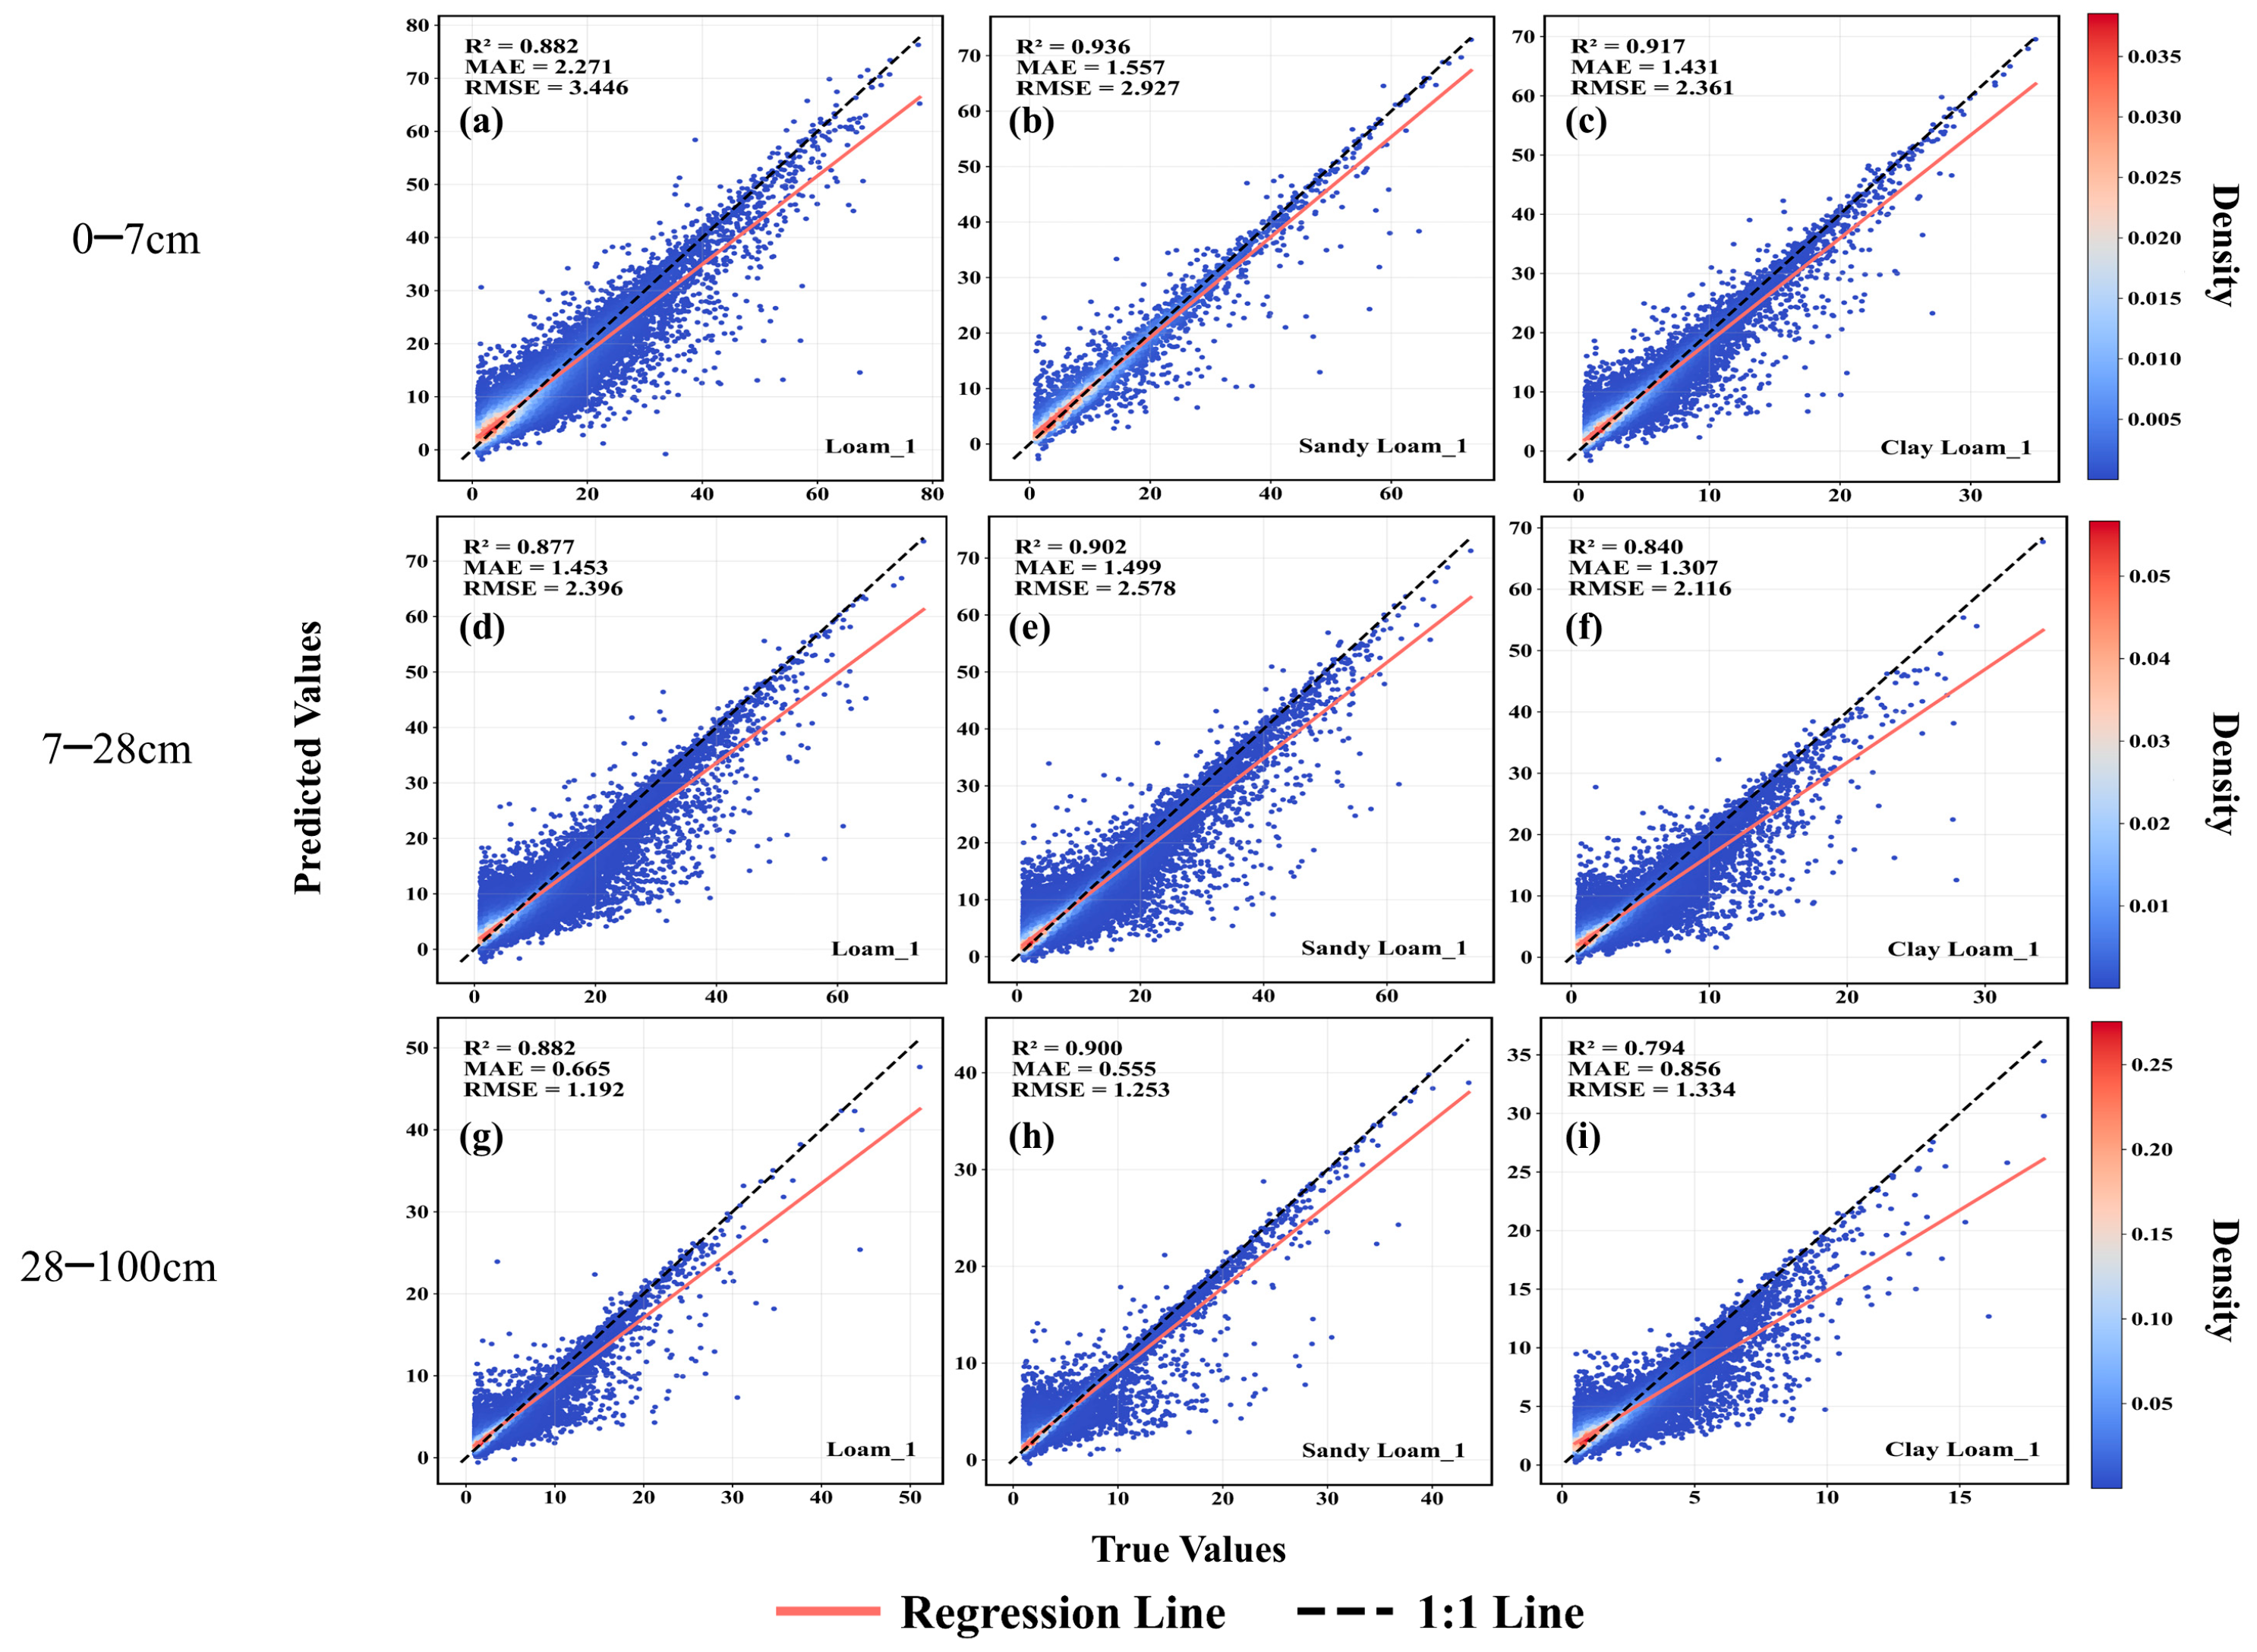
After target ΔRSM values were aligned with their optimal depth-specific response lags, the XGBoost model captured substantial within-framework variation in daily wetting increments under random ten-fold cross-validation (Figure 5). Mean random-CV R2 values were 0.912, 0.873, and 0.859 for the 0–7 cm, 7–28 cm, and 28–100 cm layers across the three representative homogeneous zones (Loam_1, Sandy Loam_1, and Clay Loam_1). Corresponding mean RMSE values were 2.911, 2.363, and 1.260, and mean MAE values were 1.753, 1.420, and 0.692, respectively. These values represent diagnostic interpolation skill within the sampled environmental domain rather than stand-alone evidence of temporal or spatial transferability. Under block validation, R2 values were systematically lower: averaged across the three textures, surface-layer (0–7 cm) skill declined from 0.912 under random CV to 0.555 under LOYO and 0.078 under LOZO, whereas deep-layer (28–100 cm) skill declined from 0.859 to 0.020 under LOYO and −0.196 under LOZO. Weaker LOYO and LOZO performance in the 28–100 cm layer indicates that deep-layer wetting relationships are less transferable and more dependent on local conditions and model-assisted soil moisture constraints than surface-layer responses (Table 4).
Fold-level bootstrap resampling of validation metrics using 10,000 resamples confirmed that random-CV performance was more stable than the block-validation estimates. Random-CV R2 was 0.721 [0.717, 0.725], 0.596 [0.575, 0.617], and 0.489 [0.464, 0.512] for the 0–7, 7–28, and 28–100 cm layers, respectively. The corresponding LOYO R2 declined to 0.555 [0.545, 0.567], 0.267 [0.242, 0.290], and 0.020 [−0.035, 0.071], while LOZO R2 declined further to 0.051 [−0.706, 0.457], 0.011 [−0.318, 0.205], and −0.204 [−0.583, 0.037]. Lag-1 temporal autocorrelation increased with depth, from median values of 0.189–0.293 in the 0–7 cm layer to 0.552–0.602 in the 28–100 cm layer, and inverse-distance Moran’s I medians were negative across depth-texture groups (−0.127 to −0.223). These diagnostics indicate that temporal persistence, structured spatial heterogeneity, within-zone similarity, and stronger depth-dependent model constraints explain much of the LOYO and LOZO performance deterioration.
The difference between the univariate precipitation–ΔRSM correlation (r = 0.43) and multivariate XGBoost performance reflects the non-linear and state-dependent nature of wetting responses. Precipitation alone contributed 13.21–31.54% to ΔRSM across depths (Section 3.3.1), indicating that antecedent SM, soil thermal conditions, evaporation-related variables, vegetation, and static soil properties jointly shape daily wetting increments. The XGBoost results should therefore be interpreted as evidence that EO-derived wetting signals depend on multiple interacting controls, not as a simple increase in the explanatory power of precipitation alone.

3.3. Feature Importance and Critical Values Analysis

3.3.1. Feature Importance of Key Driving Factors

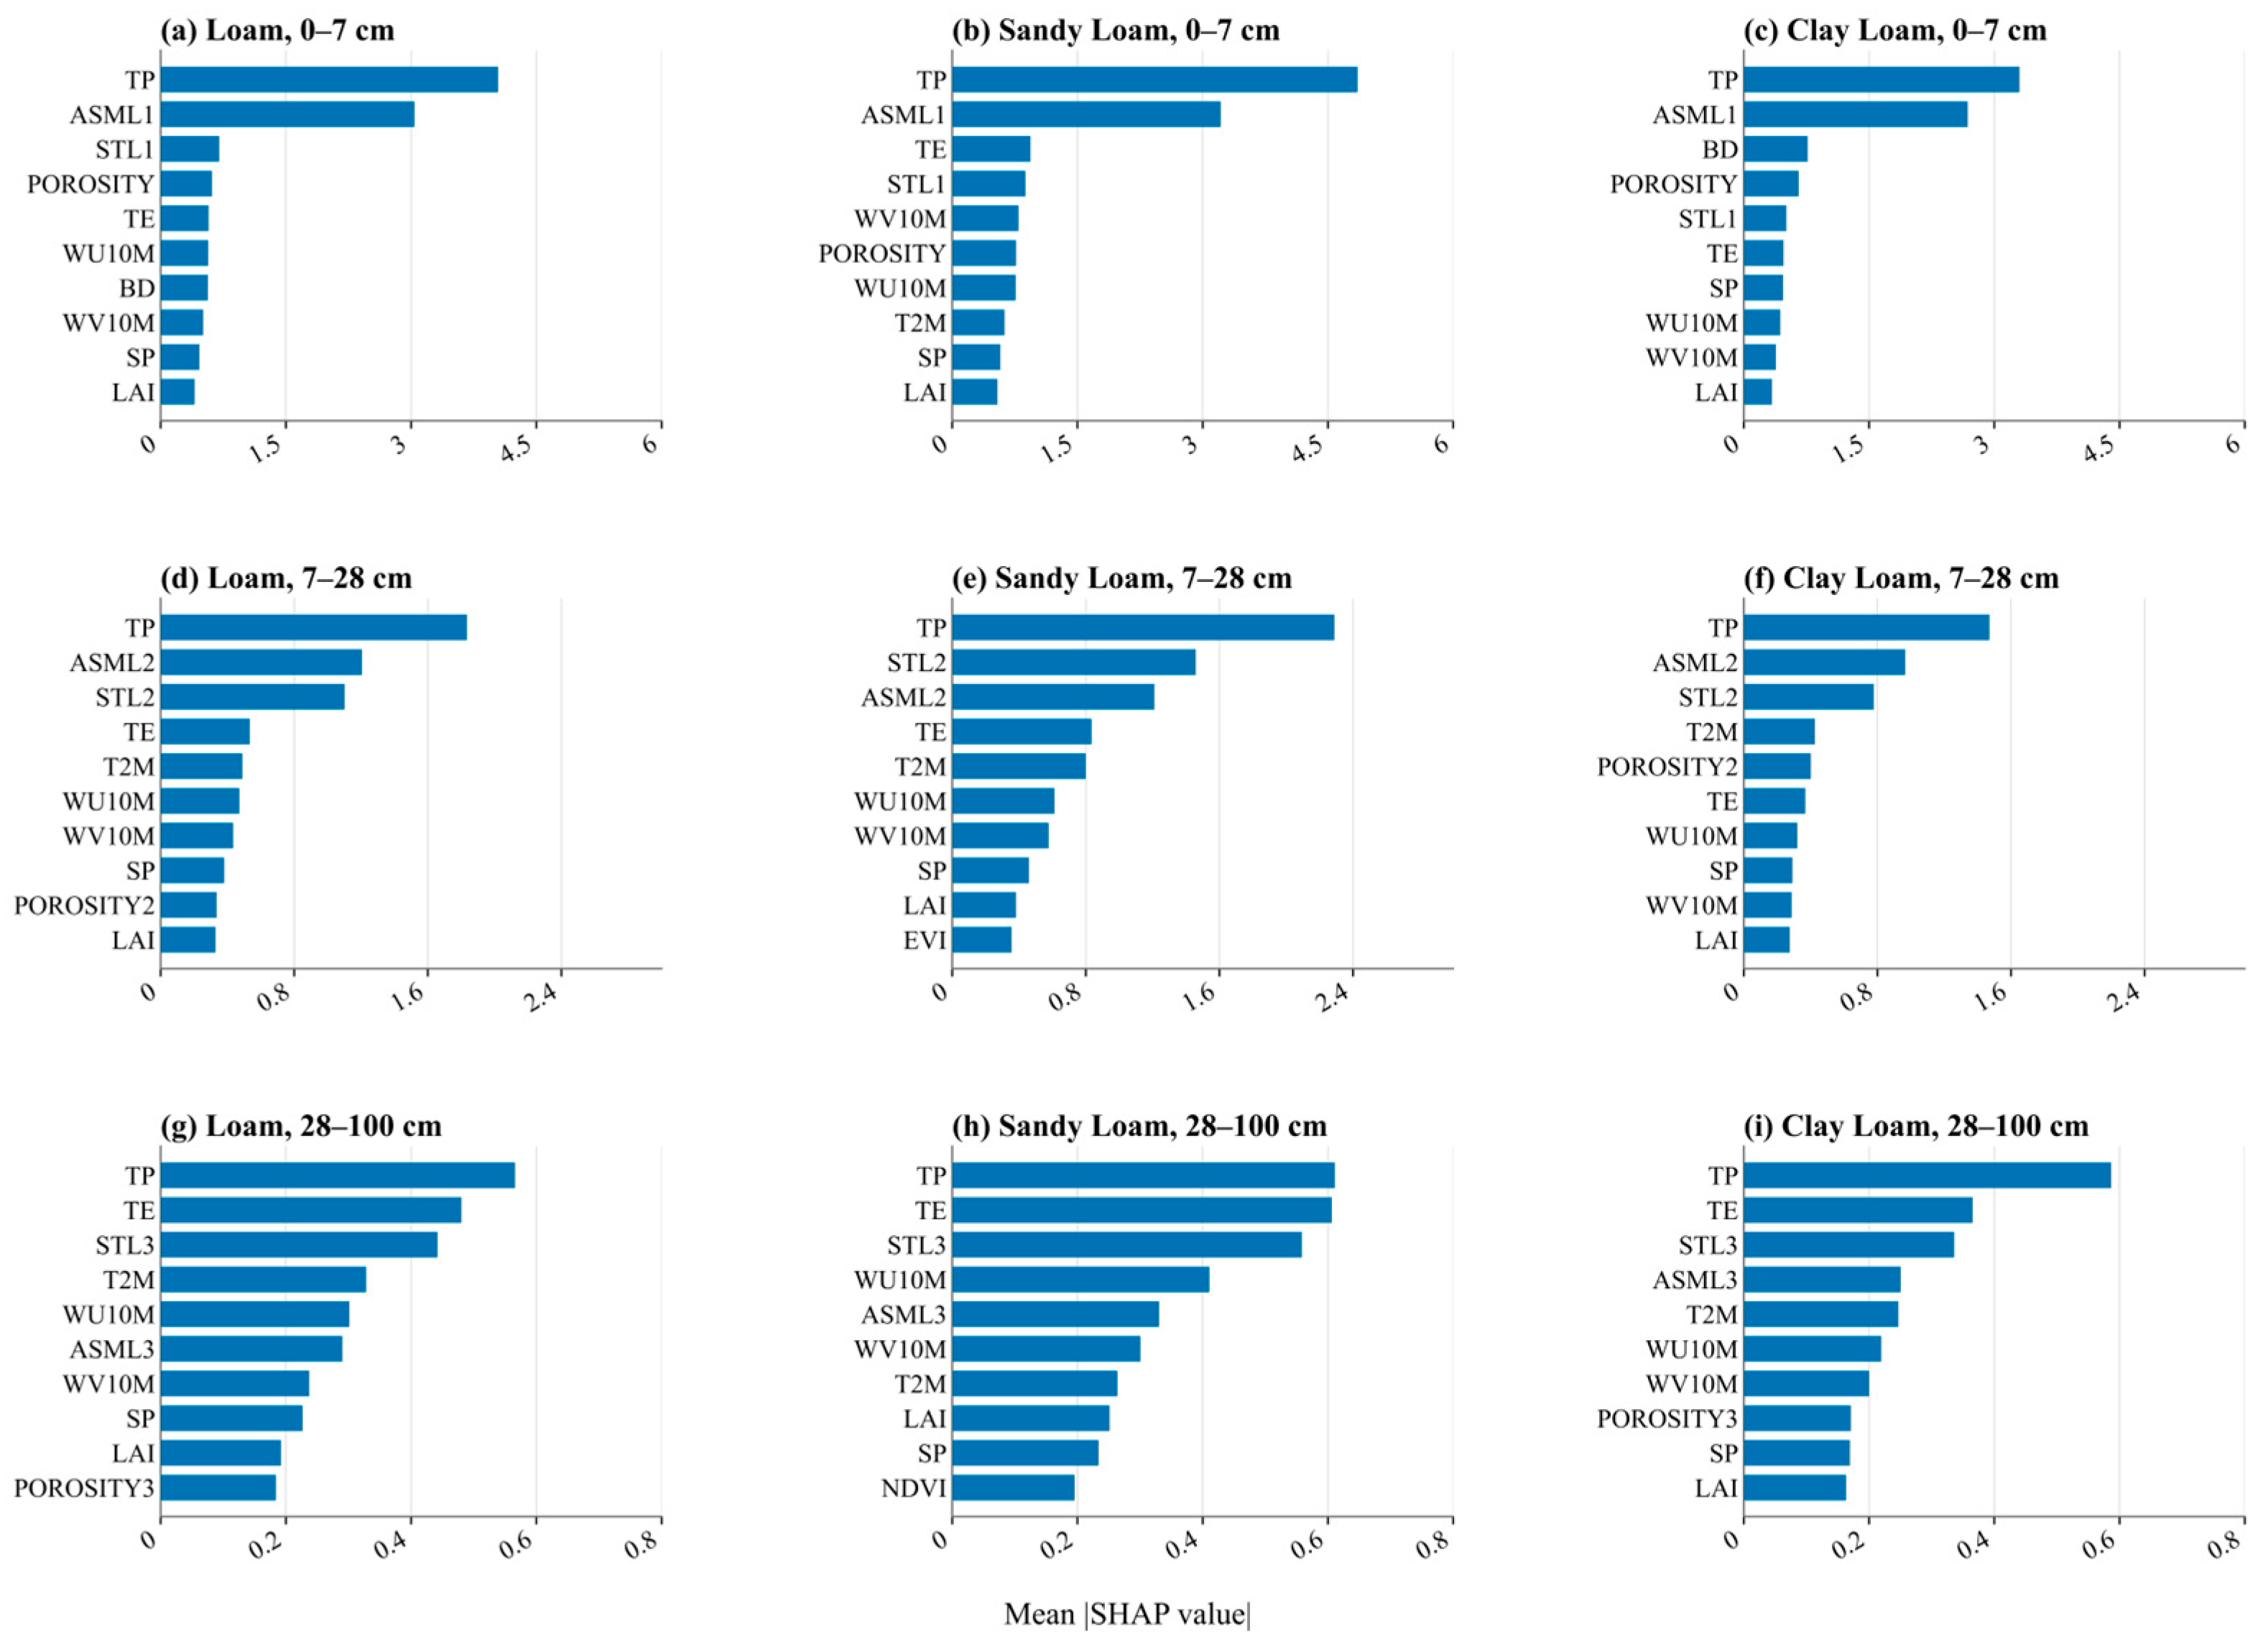
SHAP value analysis (Figure 6) revealed that precipitation is the dominant driver of soil wetting across all zones, though its relative influence systematically diminishes with depth as surface-derived atmospheric variables lose predictive power. Specifically, precipitation and ASM co-dominated the shallow layers, contributing 31.54% and 23.09% at 0–7 cm, and 23.42% and 14.14% at 7–28 cm, respectively. In the deep layer (28–100 cm), the dominant mechanism shifted to precipitation (16.05%) and evaporation (13.21%), reflecting the attenuated but persisting influence of atmospheric demand.
Spatial heterogeneity was further examined within the dominant Loam_1 zone (Figure S3). At 0–7 cm, precipitation contributed more in northern sub-regions (Zones A–D) than in southern sub-regions (33.25% vs. 29.95%), whereas ASM was more influential in the south (24.20% vs. 17.36%). At 7–28 cm, soil temperature emerged as a secondary northern driver (16.11%), distinguishing it from the ASM-driven southern response (16.23%). In the 28–100 cm layer, evaporation exceeded precipitation in Zones A and B. Overall, the northern deep layer relied more strongly on evaporation (13.38% vs. 9.04%) and less strongly on precipitation (14.29% vs. 17.90%) than the southern deep layer.

3.3.2. Critical Values of Key Driving Factors

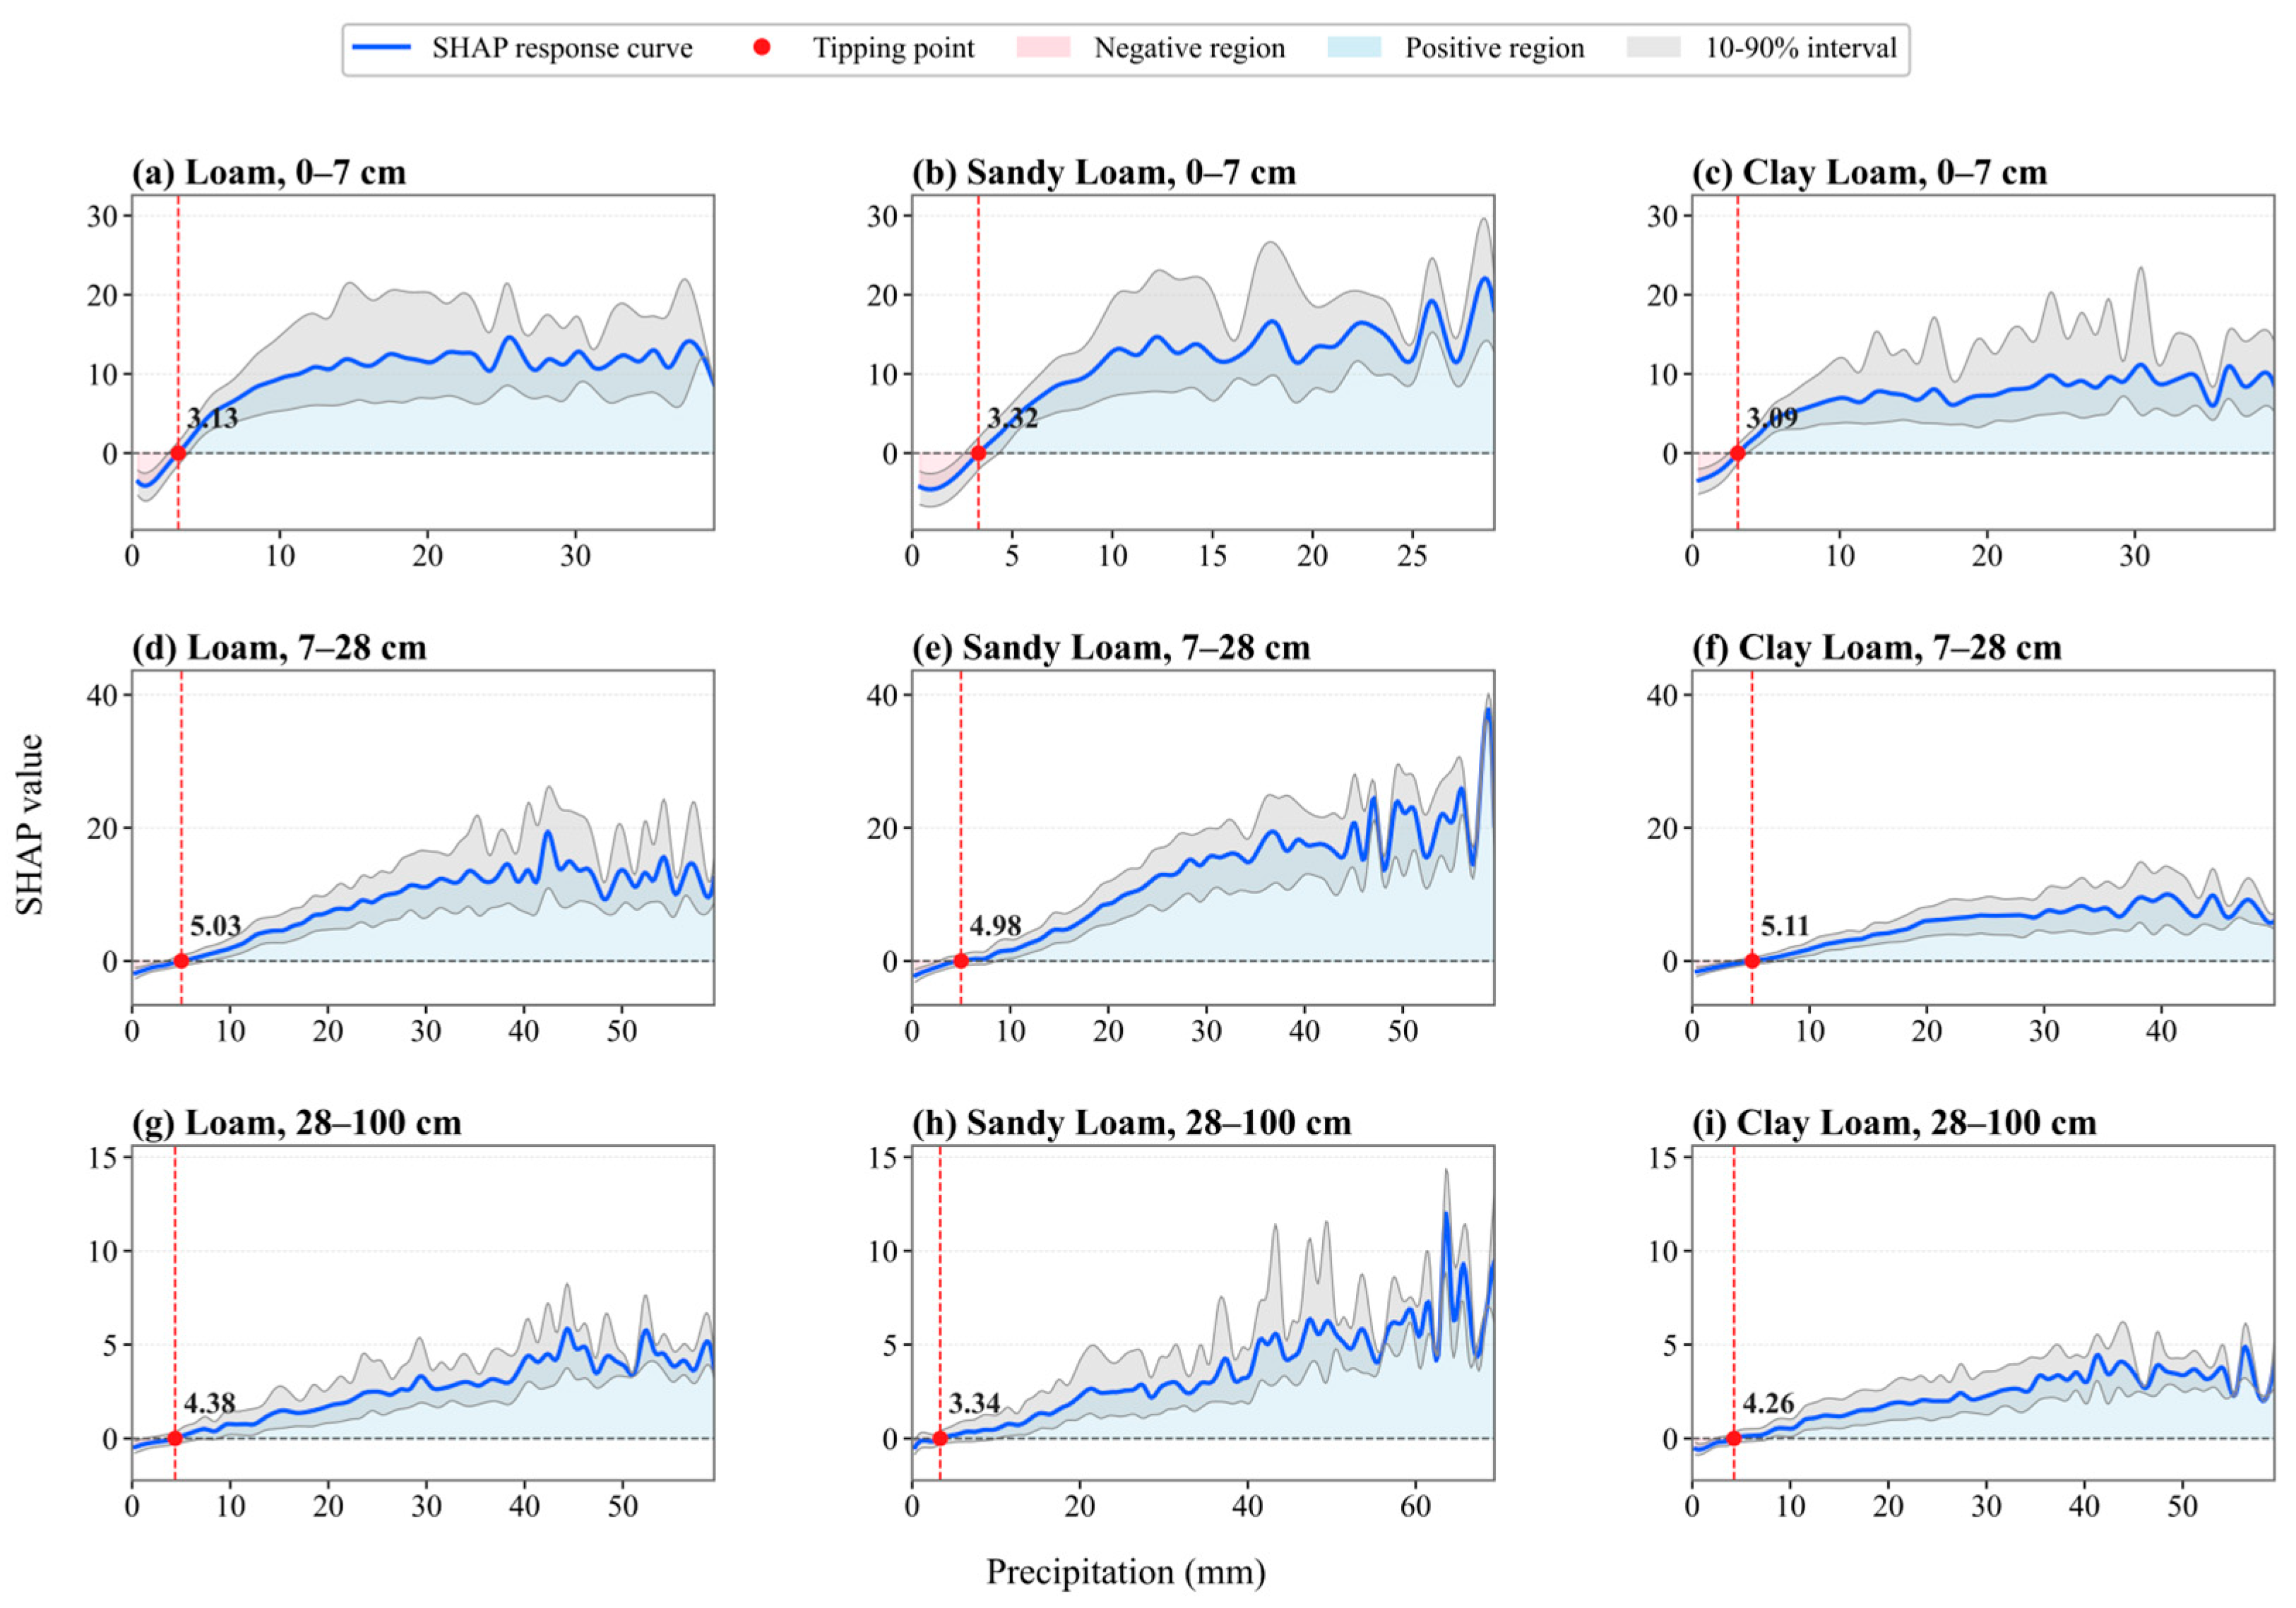
Threshold effects of precipitation, quantified with GAM-fitted SHAP values (Figure 7), showed non-monotonic depth dependence for wetting initiation. These values are referred to as SHAP-derived tipping points because they indicate where the marginal SHAP contribution of precipitation crosses the zero baseline. Across textures, precipitation tipping points initially increased from the surface (0–7 cm: 3.09–3.23 mm) to the intermediate layer (7–28 cm: 4.98–5.11 mm), then decreased in the deep layer (28–100 cm: 3.34–4.38 mm). By contrast, stabilization points increased progressively with depth across all textures. These SHAP-derived values describe changes in marginal contribution and should not be conflated with the QR-derived transition thresholds reported in Section 3.4. The GAM-derived 95% confidence band for the surface-layer precipitation tipping point was 3.09–3.23 mm, reflecting uncertainty in the fitted GAM coefficients and functional form. A bootstrap analysis of the available 0–7 cm raw SHAP subset yielded a tipping point of 2.75 mm with a 95% CI of 2.71–2.80 mm. These uncertainty estimates are not directly comparable because the GAM CI reflects statistical model uncertainty, whereas the bootstrap CI reflects sampling variability of the tipping-point estimator; together, they constrain the surface-layer threshold to approximately 2.7–3.2 mm.
Within Loam_1, spatial analysis revealed pronounced regional disparities (Figure S4). Northern agricultural sub-regions generally required higher precipitation inputs than southern sub-regions. On average, northern tipping points (TPs) and stabilization thresholds (STs) exceeded southern values across all depths, including surface TPs of 3.2 vs. 2.8 mm and surface STs of 14.0 vs. 8.3 mm. This spatial divergence suggests greater hydro-climatic resistance to wetting in northern China, likely associated with higher antecedent moisture deficits and distinct regional soil hydraulic conditions.

3.4. Retrieval of Precipitation Thresholds from EO-Based Wetting Signals

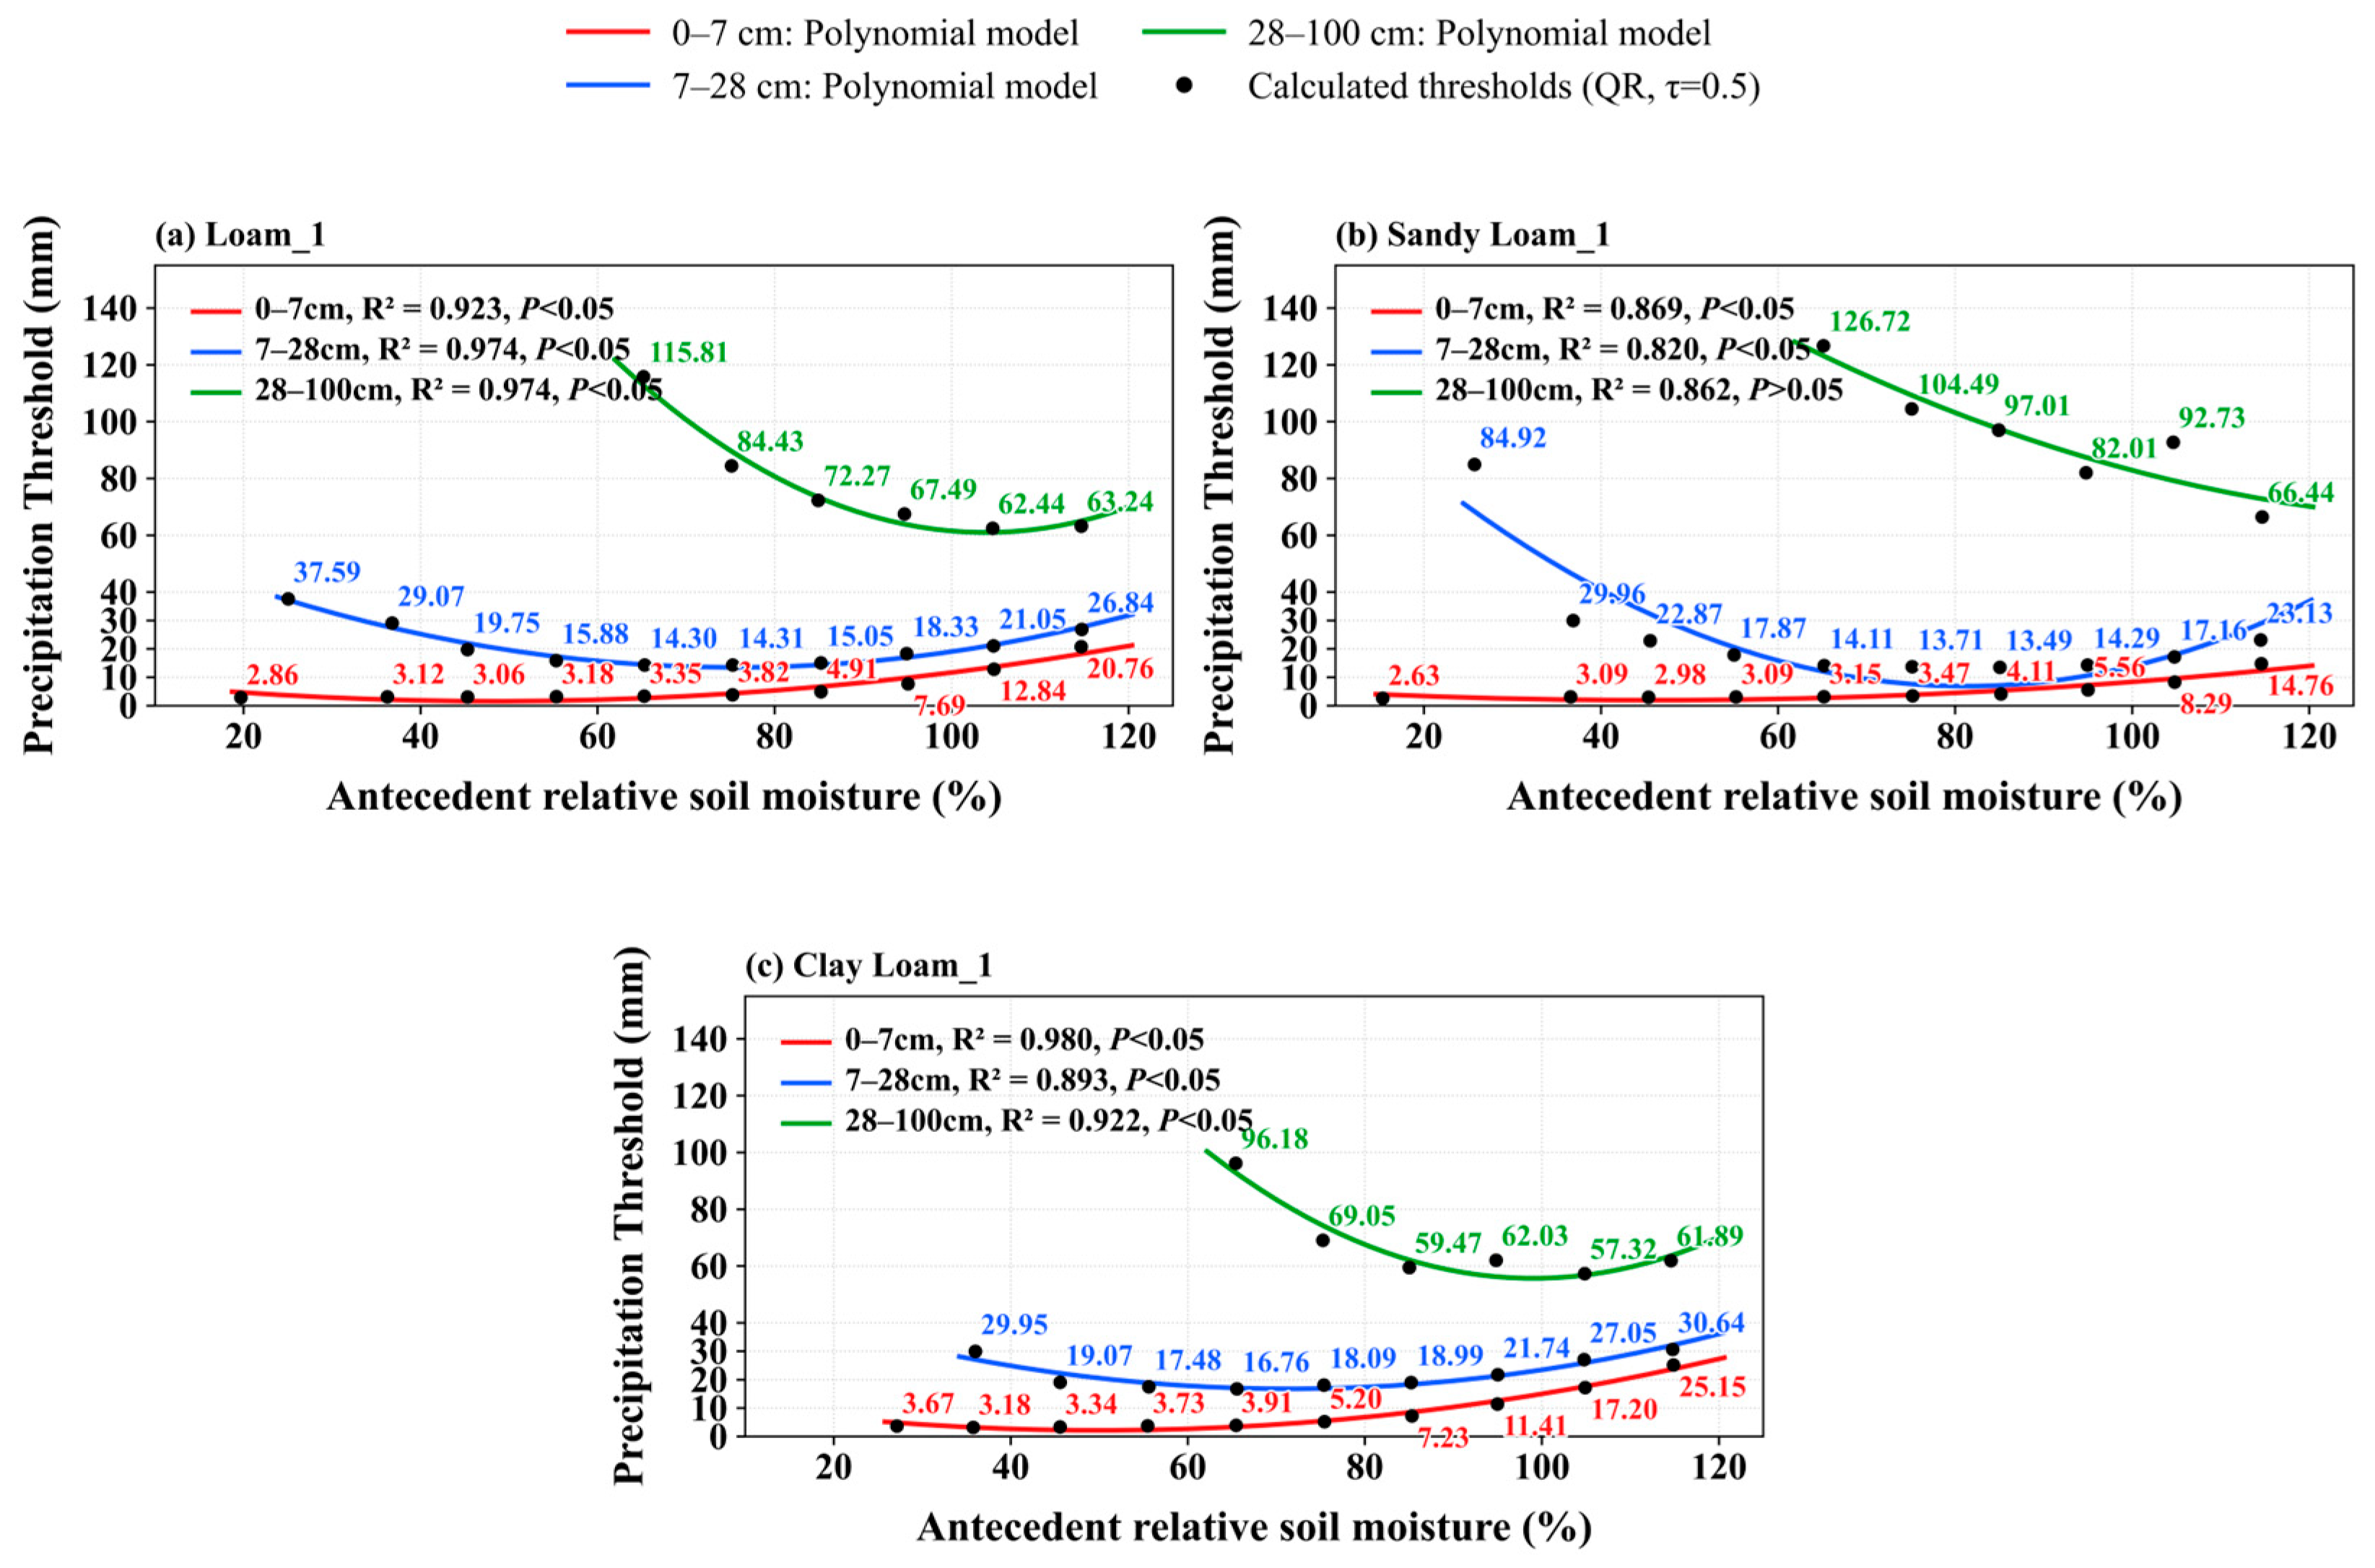
Across all homogeneous zones, the precipitation required to elevate the soil moisture gradient increased systematically with depth (Figure 8). A polynomial function (R2 > 0.8, p < 0.05) captured the pronounced U-shaped relationship between QR-derived transition thresholds and antecedent moisture gradients. Intermediate moisture states, such as 40–60% in Loam_1, required substantially less precipitation for transition than extremely dry or wet states. This non-linearity intensified with depth, as shown by the 37.59 mm input associated with the transition out of extreme drought at 7–28 cm. Although the U-shaped pattern persisted across textures, the lowest-threshold wetness interval shifted systematically, occurring at 30–40% for Sandy Loam_1 and 40–50% for Clay Loam_1 in the surface layer. As a robustness check, the baseline ERA5–ERA5 lag-1 empirical wetting thresholds under ΔRSM > 1% and p > 0.1 mm were 2.89 mm for 0–7 cm (95% CI 2.85–2.94), 4.00 mm for 7–28 cm (95% CI 3.90–4.12), and 5.97 mm for 28–100 cm (95% CI 5.73–6.21). Sensitivity tests showed that threshold magnitudes changed with ΔRSM definition, lag selection, antecedent-moisture classification, and precipitation event cutoff, so the QR-derived thresholds are interpreted as model-derived/statistical transition thresholds within the adopted EO framework. Event-definition sensitivity further showed that increasing the ΔRSM threshold from 0.5% to 2.0% raised the lag-1 empirical wetting threshold from 2.45 to 3.63 mm in the 0–7 cm layer, from 3.17 to 5.30 mm in the 7–28 cm layer, and from 4.33 to 9.10 mm in the 28–100 cm layer. Under p > 0.1 mm and the available surface-layer, lag-1 product-pair comparison, ERA5–ERA5 remained the highest Pearson-ranked pairing across ΔRSM > 0.5%, 1.0%, and 2.0%, followed by CHM–SMAP and CHM–ERA5. The corresponding Pearson correlations were 0.409, 0.366, and 0.339 under ΔRSM > 0.5%; 0.390, 0.345, and 0.324 under ΔRSM > 1.0%; and 0.361, 0.322, and 0.301 under ΔRSM > 2.0% for ERA5–ERA5, CHM–SMAP, and CHM–ERA5, respectively. Thus, the selected 1% ΔRSM criterion did not solely determine the relative surface-layer product-pair conclusion, whereas absolute wetting-threshold magnitudes remained sensitive to event-definition choices.
A cross-system sensitivity test evaluated whether the U-shaped threshold pattern reflected antecedent-moisture-dependent wetting behavior rather than a model-internal artefact of the ERA5-Land pairing. Using CHM_PRE–ERA5-Land SM as an independent forcing reference, the QR threshold-retrieval procedure was repeated with the same antecedent moisture classification and threshold-estimation framework used for ERA5-Land. The CHM_PRE–ERA5-Land thresholds reproduced the U-shaped morphology observed in the ERA5-Land results, with precipitation requirements highest under extremely dry and extremely wet antecedent conditions and lowest under intermediate moisture states. This cross-system consistency supports a physically plausible antecedent-moisture-dependent wetting efficiency pattern. However, exact threshold values differed between pairings, confirming that quantitative magnitudes remain product-pair dependent and should not be interpreted as field-validated hydraulic constants. Sensitivity analyses across ΔRSM definitions, precipitation cutoffs, lag selections, antecedent-moisture class schemes, and tested cross-system pairings were therefore used to evaluate the qualitative robustness of the threshold interpretation, not to claim universal threshold values.
Spatially, sub-zone analysis within Loam_1 (Figure S5) revealed complex regional disparities. While the aforementioned U-shaped response dominated most regions (except for an inverted pattern in the deep layer of Zones A and B), a non-uniform north-south divergence was highly evident. Northern sub-zones demanded 4.8% more precipitation than the south within the 40–70% moisture interval, but exhibited 35.5% lower precipitation requirements across the remaining intervals.

4. Discussion

4.1. Remote Sensing Product Consistency and Same-System Bias

Multi-source EO products can support event-scale soil wetting diagnosis, but the interpretation depends on consistency between precipitation forcing and SM response signals [9,60]. Unlike state-based SM monitoring, this task requires products to capture rapid post-rainfall ΔRSM, lagged response timing, and vertical wetting propagation [21,22,54]. Because these responses are also affected by antecedent SM, soil texture, atmospheric demand, vegetation cover, and product-specific uncertainty [17], product suitability is interpreted here as coupled event-scale consistency rather than isolated product accuracy.
Among the evaluated precipitation–SM product combinations, the ERA5-Land precipitation and ERA5-Land SM pairing showed the strongest internal consistency in capturing daily-scale wetting events. Paired Wilcoxon tests on matched zone–month correlations confirmed that this same-system pairing exceeded both CHM–ERA5 and CHM–SMAP cross-product pairings (p < 0.001 for both comparisons), with bootstrap confidence intervals for the paired differences excluding zero. This result is useful for EO-based wetting diagnosis because precipitation, land-surface water balance, energy fluxes, and soil moisture dynamics are constrained within the same modeling and assimilation framework [47]. At the same time, the same shared framework can introduce favorable consistency bias: stronger coupling may partly reflect common forcing data, land-surface physics, model structure, and assimilation assumptions rather than independent hydrological realism. The ERA5-ERA5 result should therefore be interpreted as the strongest reanalysis-constrained consistency signal among the tested combinations, not as evidence of superior absolute product accuracy.
By contrast, cross-system pairings, including CHIRPS–SMAP and CHM_PRE–SMCI, yielded systematically weaker mean event-scale correlations but provided more independent references outside a shared reanalysis chain. The quantitative gap between same-system and cross-system pairings, rather than the absolute correlation of the strongest pairing alone, is the principal methodological finding of the product-coupling analysis. Accordingly, the proposed framework should be interpreted as a cross-system diagnostic protocol for multi-source EO product evaluation, not as a single-product selection exercise. Independent in situ soil moisture networks, flux-tower observations, or other field benchmarks are required to evaluate absolute wetting accuracy.
The depth-dependent lag pattern further supports the value of EO products for monitoring wetting propagation beyond surface moisture status. The 0–7 cm layer generally responded within 1 day after precipitation, indicating that daily surface wetting can be captured at daily temporal resolution. In contrast, the 28–100 cm layer showed an approximately 2-day delayed profile response. This pattern is consistent with delayed redistribution, antecedent profile storage, and model-assisted surface-to-root-zone coupling, and is conceptually related to root-zone estimation and exponential-filter approaches that infer deeper moisture from surface dynamics. However, the lag observed here is used as a diagnostic consistency signal; it does not by itself prove rapid physical infiltration to 100 cm. Event-scale EO monitoring should therefore incorporate lagged precipitation–SM increment relationships while treating deeper-layer signals as diagnostic, model-constrained profile responses.
However, the capability of EO products to diagnose soil wetting varies across soil depths and agricultural regions [17,61]. Surface-layer wetting is more directly linked to precipitation inputs and is therefore easier to identify from EO-derived precipitation–SM coupling. By contrast, deeper-layer wetting may reflect modeled redistribution, antecedent profile storage, evapotranspiration, and land-surface model constraints as well as possible infiltration, making its EO-based detection more uncertain. This is especially relevant for products such as SMAP L4 root-zone SM and ERA5-Land deep-layer SM, which are model-assisted estimates constrained by land-surface physics and data assimilation rather than direct satellite observations of the full profile. Therefore, while EO products can provide spatially continuous information on root-zone wetting, their interpretation should consider stronger model dependence and uncertainty in deeper soil layers.
Spatial heterogeneity also affects the reliability of event-scale wetting monitoring. Across China’s croplands, differences in soil texture, terrain, vegetation cover, and hydro-climatic conditions alter how precipitation is converted into measurable SM increments. For example, the same rainfall amount may generate rapid surface wetting in regions with moderate antecedent moisture but produce weaker responses in extremely dry, highly evaporative, or near-saturated conditions. This heterogeneity explains why product evaluation should not rely solely on national-scale average performance. Instead, region-specific and depth-specific assessments are needed to identify where EO products can robustly capture wetting responses and where uncertainty remains high. In croplands, irrigation can further complicate this interpretation because irrigation events represent unobserved water inputs that violate a strictly precipitation-driven wetting assumption and may partly explain weak cross-system correlations in intensively managed regions.
Together, these results support a process-oriented use of EO products for effective-rainfall and drought-recovery diagnosis [62,63,64]. The framework links precipitation, depth-specific SM increments, and response lags, but its operational use should be accompanied by in situ SM observations, higher-resolution satellite products, and uncertainty-aware data-fusion approaches to improve threshold detection and root-zone wetting assessment across heterogeneous agricultural landscapes [65,66].

4.2. Event-Scale Wetting Diagnosis Beyond Static SM Monitoring

The XAI results indicate a depth-dependent shift in the controls of EO-derived wetting increments. Shallow-layer wetting is closely linked to immediate precipitation and antecedent SM, whereas deeper-layer wetting represents a delayed EO/reanalysis profile signal influenced by redistribution, evapotranspiration, antecedent storage, and model-assisted root-zone constraints [67,68]. This interpretation is consistent with the vertical propagation lags identified in the product-consistency analysis and with prior surface-to-root-zone transfer concepts, but it remains constrained by the spatial resolution and model dependence of the input EO and reanalysis products.
The U-shaped QR-derived transition thresholds suggest that rainfall efficiency depends strongly on antecedent wetness. Seasonal vegetation development can further modulate this antecedent-wetness dependence because changes in canopy cover, rooting activity, and crop water demand alter vegetation–climate–soil–moisture coupling [69,70]. Canopy cover and LAI can affect throughfall and canopy interception loss [71,72,73], whereas transpiration and adaptive root water uptake can drive drydown and shift antecedent storage before rainfall events [74]. Accordingly, NDVI-, EVI-, and LAI-related SHAP contributions should be interpreted as diagnostic indicators of vegetation-mediated wetting efficiency and crop-phenology effects, rather than direct measurements of physiological processes. This interpretation is also consistent with surface-to-root-zone transfer approaches, which require assumptions about vertical transfer, storage, and land-surface processes when inferring deeper soil moisture from surface observations [75]. Under very dry conditions (RSM < 30%), weak hydraulic connectivity, high matric suction, discontinuous water films, initial pore filling, or temporary water repellency may reduce the conversion of rainfall into measurable RSM increments [76]. Under intermediate wetness states, these constraints are reduced, producing a lower-threshold response zone. Under very wet or near-saturated conditions, additional rainfall may translate less efficiently into storage increases because drainage, runoff, or percolation become more important. These mechanisms provide a physically plausible explanation for the observed threshold morphology, although independent field measurements would be needed to verify the process interpretation directly. The XAI- and QR-derived thresholds should therefore be interpreted as model-derived statistical transition points rather than independently confirmed field hydraulic thresholds. The uncertainty and sensitivity results further indicate that the exact threshold magnitude is conditional on the event-extraction and classification protocol, even when the qualitative state-dependent response is retained.
For remote sensing applications, the main implication is that wetting diagnostics should account for antecedent state, depth, and product pairing rather than applying a single rainfall threshold across regions. The proposed framework is sensor-agnostic in the sense that other precipitation and SM products can be substituted into the same product-consistency, attribution, and threshold-retrieval workflow. This transferability is particularly relevant for future high-resolution missions and data-fusion products, but their use should be accompanied by uncertainty assessment and, where possible, independent in situ validation. Surface-layer cross-system sensitivity using available CHM_PRE pairings produced empirical thresholds of 5.68 mm for CHM_PRE–ERA5-Land SM (95% CI 5.57–5.77) and 5.21 mm for CHM_PRE–SMAP SM (95% CI 5.09–5.31), confirming that threshold magnitudes are product-pair dependent. These results support the qualitative robustness of the U-shaped threshold morphology while cautioning that numerical threshold values should be re-estimated for new product combinations and validation settings.

4.3. Uncertainty, Validation, and Transferability

This study identifies dominant controls and precipitation thresholds for EO-derived wetting processes, but the results should be interpreted within the sampled product and environmental domain. Random ten-fold cross-validation mainly measures within-framework diagnostic consistency and can overestimate transferability for temporally autocorrelated and spatially clustered SM records. The lower LOYO and LOZO performance indicates that the fitted XGBoost relationships and model-derived thresholds are conditional on the sampled years, agricultural zones, soil depths, and product combinations. ERA5-Land thresholds and 28–100 cm wetting signals should also be treated as reanalysis-constrained diagnostic responses rather than direct satellite observations or proof of rapid infiltration to 100 cm. Groundwater dynamics, capillary rise, and lateral redistribution were not explicitly represented. Independent in situ SM networks or flux-tower observations are therefore needed to evaluate absolute wetting accuracy; the present framework evaluates relative consistency among precipitation–SM pairings.
Robustness analyses support the main surface-layer product-pair ranking and qualitative threshold interpretation but also define their limits. The tests considered ΔRSM thresholds of 0.5%, 1.0%, and 2.0%, precipitation cutoffs of 0.1, 1.0, and 5.0 mm, lag selections of 1–3 days, alternative antecedent-moisture classes, cross-system surface-layer pairings, and the headline Spearman check. ERA5–ERA5 remained the highest Pearson-ranked pair across tested ΔRSM definitions, but absolute threshold magnitudes varied with event definition, lag selection, antecedent-moisture grouping, and product pairing. The sensitivity evidence therefore supports comparative event-scale diagnosis within the tested settings, while cautioning against treating any single threshold as a universal hydrological constant or as a complete all-depth, all-product, all-lag validation. Irrigation represents an additional management-related uncertainty in croplands because irrigation events can increase soil moisture independently of recorded precipitation. In intensively managed regions, unobserved irrigation timing and magnitude may weaken precipitation–SM coupling and partly explain lower cross-system consistency. Future applications should incorporate irrigation-aware datasets, irrigation records, or independent field observations where available to distinguish rainfall-driven wetting from management-driven soil moisture increases.

5. Conclusions

This study developed an interpretable EO-driven framework (2017–2022) to evaluate precipitation–SM product consistency and diagnose daily soil wetting dynamics across China’s croplands. The framework shows how multi-source EO products can support a shift from static SM monitoring toward event-scale wetting diagnosis, vertical propagation assessment, and antecedent-state-dependent threshold retrieval. The main conclusions are as follows:
  • Cross-system diagnostic protocol: We established a reproducible event-scale evaluation protocol for multi-source EO precipitation–SM products. Same-system reanalysis pairings (ERA5-Land precipitation-ERA5-Land SM, peak mean r = 0.43 at a 1-day lag) showed statistically stronger event-scale consistency than cross-system pairings (paired Wilcoxon tests, n = 108, p < 0.001 against CHM–ERA5 and CHM–SMAP). This result defines a reanalysis-constrained baseline and an independent satellite reference, with their quantitative gap providing the principal diagnostic signal. Because higher same-system coupling does not independently prove superior hydrological realism, the protocol is intended for cautious product-consistency diagnosis and future product evaluation rather than absolute product-accuracy ranking.
  • Vertical propagation lags: Wetting showed distinct depth-dependent lags. Surface layers (0–7 cm) responded within 1 day after precipitation, whereas deeper layers (28–100 cm) showed an approximately 2-day EO/reanalysis-derived delayed profile moisture signal. This finding highlights the need for lagged root-zone evaluation while avoiding interpretation of the deep-layer response as direct evidence of rapid infiltration to 100 cm.
  • Depth-dependent drivers: Explainable machine learning indicated a transition in wetting controls. Surface layers were dominated by precipitation and antecedent moisture (54.6% contribution), whereas deeper layers were governed mainly by evaporation and redistribution (29.3% primary driver contribution).
  • Non-linear wetting thresholds: Precipitation thresholds display a U-shaped response to antecedent wetness, requiring higher rainfall inputs for effective wetting in both extremely dry and excessively wet conditions. Bootstrap confidence intervals, cross-system sensitivity tests, event-definition sensitivity analyses, and the headline Spearman check indicate that the exact model-derived threshold values vary with ΔRSM definition, lag selection, moisture classification, precipitation event cutoff, and product pairing; these thresholds should therefore be interpreted as statistical transition thresholds within the evaluated EO framework rather than universal hydrological constants.
Overall, the cross-system EO diagnostic framework combines product-coupling cross-validation, vertical propagation lag analysis, and explainable machine learning to provide a transferable event-scale protocol for evaluating multi-source precipitation–soil moisture products and diagnosing effective rainfall across heterogeneous agricultural landscapes. Transferability refers to the diagnostic protocol itself, whereas fitted model relationships and retrieved thresholds should be re-evaluated for unsampled years, regions, or product combinations. Subject to the availability of independent validation data, the framework is sensor-agnostic and could be applied to future high-resolution precipitation and soil moisture products to support event-scale consistency diagnosis beyond conventional state-based accuracy assessment.

Supplementary Materials

The following supporting information can be downloaded at: https://www.mdpi.com/article/10.3390/rs18152614/s1, Figure S1: USDA soil texture classification and the distribution of soil texture classes across three soil-depth intervals. (a) USDA Soil Texture Triangle, illustrating soil-texture classification based on the relative proportions of sand, silt, and clay; (b–d) distributions of soil texture classes for the 0–7, 7–28, and 28–100 cm depth intervals, respectively; Figure S2: Spatial delineation of environmentally homogeneous zones across three soil depths (a) 0–7 cm, (b) 7–28 cm, and (c) 28–100 cm layers. The polar plot (bottom-left) summarizes the relative composition of homogeneous classes across the different agricultural sub-zones; Figure S3: Ranking chart of characteristic importance for the homogeneous zone Loam_1 across eight agricultural zones at varying depths, where figures a–h represent 0–7 cm, i-p represent 7–28 cm, and q-x represent 28–100 cm; Figure S4: Tipping points corresponding to precipitation for the homogeneous zone Loam_1 across eight agricultural zones at varying depths, where figures a–h represent 0–7 cm, i-p represent 7–28 cm, and q-x represent 28–100 cm; Figure S5: Precipitation required for increasing soil moisture gradients for the homogeneous zone Loam_1 across eight agricultural zones at varying depths; Table S1: Percentage distribution of soil texture classes within the 0–7 cm, 7–28 cm, and 28–100 cm depth intervals; Table S2: Percentage distribution of topography classes; Table S3: Evaluation Indicator Results for Homogeneous Zone Loam_1 at Different Depths Across Eight Agricultural Zones.

Author Contributions

Conceptualization, P.F. and X.Y.; methodology, P.F., X.Y. and H.S. (Huaiwei Sun); software, P.F. and Y.L.; validation, P.F., D.S. and J.L.; formal analysis, P.F., Y.Q. and Y.Y.; investigation, P.F., H.D. and H.Z.; resources, X.Y. and H.S. (Huaiwei Sun); data curation, P.F., Y.L. and H.Z.; writing—original draft preparation, P.F.; writing—review and editing, X.Y., D.S., J.L., Y.Q., Y.Y., H.D., H.S. (Huaiwei Sun), Y.L., H.Z. and H.S. (Hao Sun); visualization, P.F. and Y.L.; supervision, X.Y. and H.S. (Huaiwei Sun); project administration, X.Y.; funding acquisition, X.Y. All authors have read and agreed to the published version of the manuscript.

Funding

This research was funded by the National Key Research and Development Program of China (2023YFC3006603), National Key Research and Development Program of China (2023YFC3206001), and Jiangxi Provincial Key Research and Development Program (20232BBG70029).

Data Availability Statement

The original contributions presented in the study are included in the article; further inquiries can be directed to the corresponding author.

Conflicts of Interest

The authors declare no conflicts of interest.

References

  1. Babaeian, E.; Sadeghi, M.; Jones, S.B.; Montzka, C.; Vereecken, H.; Tuller, M. Ground, Proximal, and Satellite Remote Sensing of Soil Moisture. Rev. Geophys. 2019, 57, 530–616. [Google Scholar] [CrossRef]
  2. Martínez-Fernández, J.; González-Zamora, A.; Sánchez, N.; Gumuzzio, A.; Herrero-Jiménez, C.M. Satellite Soil Moisture for Agricultural Drought Monitoring: Assessment of the SMOS Derived Soil Water Deficit Index. Remote Sens. Environ. 2016, 177, 277–286. [Google Scholar] [CrossRef]
  3. Dorigo, W.; Wagner, W.; Albergel, C.; Albrecht, F.; Balsamo, G.; Brocca, L.; Chung, D.; Ertl, M.; Forkel, M.; Gruber, A.; et al. ESA CCI Soil Moisture for Improved Earth System Understanding: State-of-the Art and Future Directions. Remote Sens. Environ. 2017, 203, 185–215. [Google Scholar] [CrossRef]
  4. Entekhabi, D.; Njoku, E.G.; O’Neill, P.E.; Kellogg, K.H.; Crow, W.T.; Edelstein, W.N.; Entin, J.K.; Goodman, S.D.; Jackson, T.J.; Johnson, J. The Soil Moisture Active Passive (SMAP) Mission. Proc. IEEE 2010, 98, 704–716. [Google Scholar] [CrossRef]
  5. Kang, J.; Jin, R.; Li, X.; Zhang, Y. Mapping High Spatiotemporal-Resolution Soil Moisture by Upscaling Sparse Ground-Based Observations Using a Bayesian Linear Regression Method for Comparison with Microwave Remotely Sensed Soil Moisture Products. Remote Sens. 2021, 13, 228. [Google Scholar] [CrossRef]
  6. Bodner, G.; Nakhforoosh, A.; Kaul, H. Management of Crop Water under Drought: A Review. Agron. Sustain. Dev. 2015, 35, 401–442. [Google Scholar] [CrossRef]
  7. Fontanet, M.; Fernàndez-Garcia, D.; Ferrer, F. The Value of Satellite Remote Sensing Soil Moisture Data and the DISPATCH Algorithm in Irrigation Fields. Hydrol. Earth Syst. Sci. 2018, 22, 5889–5900. [Google Scholar] [CrossRef]
  8. Tao, L.; Ryu, D.; Western, A.; Boyd, D. A New Drought Index for Soil Moisture Monitoring Based on MPDI-NDVI Trapezoid Space Using MODIS Data. Remote Sens. 2021, 13, 122. [Google Scholar] [CrossRef]
  9. Meng, X.; Deng, M.; Talib, J.; Taylor, C.M.; Wu, P.; Lyu, S.; Chen, H.; Li, Z.; Zhao, L. Diagnosing Product Variability in the Soil Moisture Response to Precipitation on the Tibetan Plateau. J. Hydrometeorol. 2023, 24, 625–639. [Google Scholar] [CrossRef]
  10. Nicolai-Shaw, N.; Zscheischler, J.; Hirschi, M.; Gudmundsson, L.; Seneviratne, S.I. A Drought Event Composite Analysis Using Satellite Remote-Sensing Based Soil Moisture. Remote Sens. Environ. 2017, 203, 216–225. [Google Scholar] [CrossRef]
  11. Wang, Y.; Yang, J.; Chen, Y.; Wang, A.; De Maeyer, P. The Spatiotemporal Response of Soil Moisture to Precipitation and Temperature Changes in an Arid Region, China. Remote Sens. 2018, 10, 468. [Google Scholar] [CrossRef]
  12. Fu, Z.; Ciais, P.; Wigneron, J.-P.; Gentine, P.; Feldman, A.F.; Makowski, D.; Viovy, N.; Kemanian, A.R.; Goll, D.S.; Stoy, P.C.; et al. Global Critical Soil Moisture Thresholds of Plant Water Stress. Nat. Commun. 2024, 15, 4826. [Google Scholar] [CrossRef] [PubMed]
  13. Domeisen, D.I.V.; Eltahir, E.A.B.; Fischer, E.M.; Knutti, R.; Perkins-Kirkpatrick, S.E.; Schär, C.; Seneviratne, S.I.; Weisheimer, A.; Wernli, H. Prediction and Projection of Heatwaves. Nat. Rev. Earth Environ. 2023, 4, 36–50. [Google Scholar] [CrossRef]
  14. Furtak, K.; Wolińska, A. The Impact of Extreme Weather Events as a Consequence of Climate Change on the Soil Moisture and on the Quality of the Soil Environment and Agriculture—A Review. Catena 2023, 231, 107378. [Google Scholar] [CrossRef]
  15. Zhao, W.; Yu, X.B.; Xu, C.D.; Li, S.G.; Wu, G.N.; Yuan, W.P. Dynamic Traceability Effects of Soil Moisture on the Precipitation–Vegetation Association in Drylands. J. Hydrol. 2022, 615, 128645. [Google Scholar] [CrossRef]
  16. Zhang, J.; Duan, L.; Liu, T.; Chen, Z.; Wang, Y.; Li, M.; Zhou, Y. Experimental Analysis of Soil Moisture Response to Rainfall in a Typical Grassland Hillslope under Different Vegetation Treatments. Environ. Res. 2022, 213, 113608. [Google Scholar] [CrossRef] [PubMed]
  17. Zhu, P.Z.; Zhang, G.H.; Wang, H.X.; Zhang, B.J.; Liu, Y.N. Soil Moisture Variations in Response to Precipitation Properties and Plant Communities on Steep Gully Slope on the Loess Plateau. Agric. Water Manag. 2021, 256, 107086. [Google Scholar] [CrossRef]
  18. Scholz, H.; Lischeid, G.; Ribbe, L.; Hernandez Ochoa, I.; Grahmann, K. Differentiating between Crop and Soil Effects on Soil Moisture Dynamics. Hydrol. Earth Syst. Sci. 2024, 28, 2401–2419. [Google Scholar] [CrossRef]
  19. Yetbarek, E.; Kumar, S.; Ojha, R. Effects of Soil Heterogeneity on Subsurface Water Movement in Agricultural Fields: A Numerical Study. J. Hydrol. 2020, 590, 125420. [Google Scholar] [CrossRef]
  20. Gaur, N.; Mohanty, B.P. Land-Surface Controls on near-Surface Soil Moisture Dynamics: Traversing Remote Sensing Footprints. Water Resour. Res. 2016, 52, 6365–6385. [Google Scholar] [CrossRef]
  21. Gruber, A.; De Lannoy, G.; Albergel, C.; Al-Yaari, A.; Brocca, L.; Calvet, J.; Colliander, A.; Cosh, M.; Crow, W.; Dorigo, W.; et al. Validation Practices for Satellite Soil Moisture Retrievals: What Are (the) Errors? Remote Sens. Environ. 2020, 244, 111806. [Google Scholar] [CrossRef]
  22. Ma, H.; Zeng, J.; Chen, N.; Zhang, X.; Cosh, M.H.; Wang, W. Satellite Surface Soil Moisture from SMAP, SMOS, AMSR2 and ESA CCI: A Comprehensive Assessment Using Global Ground-Based Observations. Remote Sens. Environ. 2019, 231, 111215. [Google Scholar] [CrossRef]
  23. Penna, D.; Tromp-van Meerveld, H.J.; Gobbi, A.; Borga, M.; Dalla Fontana, G. The Influence of Soil Moisture on Threshold Runoff Generation Processes in an Alpine Headwater Catchment. Hydrol. Earth Syst. Sci. 2011, 15, 689–702. [Google Scholar] [CrossRef]
  24. Song, S.; Wang, W. Impacts of Antecedent Soil Moisture on the Rainfall-Runoff Transformation Process Based on High-Resolution Observations in Soil Tank Experiments. Water 2019, 11, 296. [Google Scholar] [CrossRef]
  25. Tuller, M.; Or, D. Water Films and Scaling of Soil Characteristic Curves at Low Water Contents. Water Resour. Res. 2005, 41, W09403. [Google Scholar] [CrossRef]
  26. Doerr, S.H.; Shakesby, R.A.; Walsh, R.P.D. Soil Water Repellency: Its Causes, Characteristics and Hydro-Geomorphological Significance. Earth Sci. Rev. 2000, 51, 33–65. [Google Scholar] [CrossRef]
  27. Hardie, M.; Almajmaie, A. Measuring and Estimating the Hydrological Properties of a Soil Crust. J. Hydrol. 2019, 574, 12–22. [Google Scholar] [CrossRef]
  28. Farrick, K.K.; Branfireun, B.A. Soil Water Storage, Rainfall and Runoff Relationships in a Tropical Dry Forest Catchment. Water Resour. Res. 2014, 50, 9236–9250. [Google Scholar] [CrossRef]
  29. Dai, L.; Fu, R.; Guo, X.; Du, Y.; Zhang, F.; Cao, G. Soil Moisture Variations in Response to Precipitation across Different Vegetation Types on the Northeastern Qinghai-Tibet Plateau. Front. Plant Sci. 2022, 13, 854152. [Google Scholar] [CrossRef] [PubMed]
  30. Wu, X.Z.; Wang, X.; Teng, Y.; Chen, D.; Wang, X.D.; Ma, B. Response of Soil Moisture to Rainfall Following Deep Soil Drying in China’s Hilly Loess Lands. Sci. Total Environ. 2024, 950, 175145. [Google Scholar] [CrossRef] [PubMed]
  31. Yang, Q.; Fan, J.; Luo, Z.B. Response of Soil Moisture and Vegetation Growth to Precipitation under Different Land Uses in the Northern Loess Plateau, China. Catena 2024, 236, 107728. [Google Scholar] [CrossRef]
  32. Tafteh, A.; Sepaskhah, A.R. Application of HYDRUS-1D Model for Simulating Water and Nitrate Leaching from Continuous and Alternate Furrow Irrigated Rapeseed and Maize Fields. Agric. Water Manag. 2012, 113, 19–29. [Google Scholar] [CrossRef]
  33. Manfreda, S.; McCabe, M.F.; Fiorentino, M.; Rodriguez-Iturbe, I.; Wood, E.F. Scaling Characteristics of Spatial Patterns of Soil Moisture from Distributed Modelling. Adv. Water Resour. 2007, 30, 2145–2150. [Google Scholar] [CrossRef]
  34. Manfreda, S.; Brocca, L.; Moramarco, T.; Melone, F.; Sheffield, J. A Physically Based Approach for the Estimation of Root-Zone Soil Moisture from Surface Measurements. Hydrol. Earth Syst. Sci. 2014, 18, 1199–1212. [Google Scholar] [CrossRef]
  35. Wagner, W.; Lemoine, G.; Rott, H. A Method for Estimating Soil Moisture from ERS Scatterometer and Soil Data. Remote Sens. Environ. 1999, 70, 191–207. [Google Scholar] [CrossRef]
  36. Friedman, J.H. Greedy Function Approximation: A Gradient Boosting Machine. Ann. Stat. 2001, 29, 1189–1232. [Google Scholar] [CrossRef]
  37. Elith, J.; Leathwick, J.R.; Hastie, T. A Working Guide to Boosted Regression Trees. J. Anim. Ecol. 2008, 77, 802–813. [Google Scholar] [CrossRef] [PubMed]
  38. Chen, T.; Guestrin, C. XGBoost: A Scalable Tree Boosting System. In Proceedings of the 22nd ACM SIGKDD International Conference on Knowledge Discovery and Data Mining; Association for Computing Machinery: New York, NY, USA, 2016; pp. 785–794. [Google Scholar]
  39. Ling, M.; Guo, X.; Shi, X.; Han, H. Temporal and Spatial Evolution of Drought in Haihe River Basin from 1960 to 2020. Ecol. Indic. 2022, 138, 108809. [Google Scholar] [CrossRef]
  40. Xue, Z.; Chen, Y.; Yin, Y.; Chen, W.; Jiao, Y.; Deng, P.; Dai, S. Spatio-Temporal Characteristics and Driving Factors of Flash Drought in Northern China from 1978 to 2020. Glob. Planet. Change 2024, 232, 104326. [Google Scholar] [CrossRef]
  41. Fang, C.; Liu, Y.; Cai, Q.; Song, H. Why Does Extreme Rainfall Occur in Central China during the Summer of 2020 after a Weak El Niño? Adv. Atmos. Sci. 2021, 38, 2067–2081. [Google Scholar] [CrossRef]
  42. Tan, G.; Wang, X.; Wang, Y.; Yu, M. Possible Causes of the Excessive Precipitation over South China in 2021/22 Winter. Atmos. Res. 2022, 280, 106432. [Google Scholar] [CrossRef]
  43. Funk, C.; Peterson, P.; Landsfeld, M.; Pedreros, D.; Verdin, J.; Shukla, S.; Husak, G.; Rowland, J.; Harrison, L.; Hoell, A.; et al. The Climate Hazards Infrared Precipitation with Stations—A New Environmental Record for Monitoring Extremes. Sci. Data 2015, 2, 150066. [Google Scholar] [CrossRef] [PubMed]
  44. Han, J.; Miao, C.; Gou, J.; Zheng, H.; Zhang, Q.; Guo, X. A New Daily Gridded Precipitation Dataset for the Chinese Mainland Based on Gauge Observations. Earth Syst. Sci. Data 2023, 15, 3147–3161. [Google Scholar] [CrossRef]
  45. Reichle, R.H.; Lannoy, G.J.M.D.; Liu, Q.; Ardizzone, J.V.; Colliander, A.; Conaty, A.; Crow, W.; Jackson, T.J.; Jones, L.A.; Kimball, J.S.; et al. Assessment of the SMAP Level-4 Surface and Root-Zone Soil Moisture Product Using in Situ Measurements. J. Hydrometeorol. 2017, 18, 2621–2645. [Google Scholar] [CrossRef]
  46. Li, Q.; Shi, G.; Shangguan, W.; Nourani, V.; Li, J.; Li, L.; Huang, F.; Zhang, Y.; Wang, C.; Wang, D.; et al. A 1km Daily Soil Moisture Dataset over China Using in Situ Measurement and Machine Learning. Earth Syst. Sci. Data 2022, 14, 5267–5286. [Google Scholar] [CrossRef]
  47. Muñoz-Sabater, J.; Dutra, E.; Agustí-Panareda, A.; Albergel, C.; Arduini, G.; Balsamo, G.; Boussetta, S.; Choulga, M.; Harrigan, S.; Hersbach, H.; et al. ERA5-Land: A State-of-the-Art Global Reanalysis Dataset for Land Applications. Earth Syst. Sci. Data 2021, 13, 4349–4383. [Google Scholar] [CrossRef]
  48. Didan, K. MOD13A2 MODIS/Terra Vegetation Indices 16-Day L3 Global 1km SIN Grid V006; NASA Land Processes Distributed Active Archive Center: Sioux Falls, SD, USA, 2015. [Google Scholar]
  49. Robinson, N.; Regetz, J.; Guralnick, R.P. EarthEnv-DEM90: A Nearly-Global, Void-Free, Multi-Scale Smoothed, 90m Digital Elevation Model from Fused ASTER and SRTM Data. ISPRS J. Photogramm. Remote Sens. 2014, 87, 57–67. [Google Scholar] [CrossRef]
  50. Shi, G.; Sun, W.; Shangguan, W.; Wei, Z.; Yuan, H.; Li, L.; Sun, X.; Zhang, Y.; Liang, H.; Li, D.; et al. A China Dataset of Soil Properties for Land Surface Modelling (Version 2, CSDLv2). Earth Syst. Sci. Data 2025, 17, 517–543. [Google Scholar] [CrossRef]
  51. Dai, Y.; Shangguan, W.; Duan, Q.; Liu, B.; Fu, S.; Niu, G. Development of a China Dataset of Soil Hydraulic Parameters Using Pedotransfer Functions for Land Surface Modeling. J. Hydrometeorol. 2013, 14, 869–887. [Google Scholar] [CrossRef]
  52. Peng, J.; Loew, A.; Merlin, O.; Verhoest, N.E.C. A Review of Spatial Downscaling of Satellite Remotely Sensed Soil Moisture. Rev. Geophys. 2017, 55, 341–366. [Google Scholar] [CrossRef]
  53. Chen, J.; Jönsson, P.; Tamura, M.; Gu, Z.; Matsushita, B.; Eklundh, L. A Simple Method for Reconstructing a High-Quality NDVI Time-Series Data Set Based on the Savitzky–Golay Filter. Remote Sens. Environ. 2004, 91, 332–344. Available online: https://linkinghub.elsevier.com/retrieve/pii/S003442570400080X (accessed on 20 July 2026). [CrossRef]
  54. Singh, N.K.; Emanuel, R.E.; McGlynn, B.L.; Miniat, C.F. Soil Moisture Responses to Rainfall: Implications for Runoff Generation. Water Resour. Res. 2021, 57, e2020WR028827. [Google Scholar] [CrossRef]
  55. Akiba, T.; Sano, S.; Yanase, T.; Ohta, T.; Koyama, M. Optuna: A next-Generation Hyperparameter Optimization Framework. In Proceedings of the 25th ACM SIGKDD International Conference on Knowledge Discovery & Data Mining; Association for Computing Machinery: New York, NY, USA, 2019; pp. 2623–2631. [Google Scholar]
  56. Lundberg, S.M.; Lee, S.-I. A Unified Approach to Interpreting Model Predictions. In Proceedings of the 31st International Conference on Neural Information Processing Systems; Curran Associates Inc.: Red Hook, NY, USA, 2017; pp. 4768–4777. [Google Scholar]
  57. Chen, X.; Tang, N.; Zhou, Y. Quantile Regression of Longitudinal Data with Informative Observation Times. J. Multivar. Anal. 2016, 144, 176–188. [Google Scholar] [CrossRef]
  58. Geraci, M. Modelling and Estimation of Nonlinear Quantile Regression with Clustered Data. Comput. Stat. Data Anal. 2019, 136, 30–46. [Google Scholar] [CrossRef] [PubMed]
  59. Karthikeyan, L.; Mishra, A.K. Multi-Layer High-Resolution Soil Moisture Estimation Using Machine Learning over the United States. Remote Sens. Environ. 2021, 266, 112706. [Google Scholar] [CrossRef]
  60. Ford, T.W.; Quiring, S.M.; Thakur, B.; Jogineedi, R.; Houston, A.; Yuan, S.; Kalra, A.; Lock, N. Evaluating Soil Moisture–Precipitation Interactions Using Remote Sensing: A Sensitivity Analysis. J. Hydrometeorol. 2018, 19, 1237–1253. [Google Scholar] [CrossRef]
  61. Yetbarek, E.; Ojha, R. Spatio-Temporal Variability of Soil Moisture in a Cropped Agricultural Plot within the Ganga Basin, India. Agric. Water Manag. 2020, 234, 106108. [Google Scholar] [CrossRef]
  62. West, H.; Quinn, N.; Horswell, M. Remote Sensing for Drought Monitoring & Impact Assessment: Progress, Past Challenges and Future Opportunities. Remote Sens. Environ. 2019, 232, 111291. [Google Scholar] [CrossRef]
  63. Zaussinger, F.; Dorigo, W.; Gruber, A.; Tarpanelli, A.; Filippucci, P.; Brocca, L. Estimating Irrigation Water Use over the Contiguous United States by Combining Satellite and Reanalysis Soil Moisture Data. Hydrol. Earth Syst. Sci. 2019, 23, 897–923. [Google Scholar] [CrossRef]
  64. Abbaszadeh, P.; Moradkhani, H.; Gavahi, K.; Kumar, S.; Hain, C.; Zhan, X.; Duan, Q.; Peters-Lidard, C.; Karimiziarani, S. High-Resolution SMAP Satellite Soil Moisture Product: Exploring the Opportunities. Bull. Am. Meteorol. Soc. 2021, 102, 309–315. [Google Scholar] [CrossRef]
  65. Huang, S.; Zhang, X.; Chen, N.; Ma, H.; Fu, P.; Dong, J.; Gu, X.; Nam, W.-H.; Xu, L.; Rab, G.; et al. A Novel Fusion Method for Generating Surface Soil Moisture Data With High Accuracy, High Spatial Resolution, and High Spatio-Temporal Continuity. Water Resour. Res. 2022, 58, e2021WR030827. [Google Scholar] [CrossRef]
  66. Crow, W.; Berg, A.; Cosh, M.; Loew, A.; Mohanty, B.; Panciera, R.; de Rosnay, P.; Ryu, D.; Walker, J. Upscaling Sparse Ground-Based Soil Moisture Observations for the Validation of Coarse-Resolution Satellite Soil Moisture Products. Rev. Geophys. 2012, 50, RG2002. [Google Scholar] [CrossRef]
  67. Morbidelli, R.; Corradini, C.; Saltalippi, C.; Flammini, A.; Rossi, E. Infiltration-Soil Moisture Redistribution under Natural Conditions: Experimental Evidence as a Guideline for Realizing Simulation Models. Hydrol. Earth Syst. Sci. 2011, 15, 2937–2945. [Google Scholar] [CrossRef]
  68. Teuling, A.J.; Uijlenhoet, R.; Hupet, F.; Troch, P.A. Impact of Plant Water Uptake Strategy on Soil Moisture and Evapotranspiration Dynamics during Drydown. Geophys. Res. Lett. 2006, 33. [Google Scholar] [CrossRef]
  69. Rodriguez-Iturbe, I.; D’Odorico, P.; Porporato, A.; Ridolfi, L. On the Spatial and Temporal Links between Vegetation, Climate, and Soil Moisture. Water Resour. Res. 1999, 35, 3709–3722. [Google Scholar] [CrossRef]
  70. Rodriguez-Iturbe, I.; Isham, V.; Cox, D.R.; Manfreda, S.; Porporato, A. Space-Time Modeling of Soil Moisture: Stochastic Rainfall Forcing with Heterogeneous Vegetation. Water Resour. Res. 2006, 42, W06D05. [Google Scholar] [CrossRef]
  71. McJannet, D.; Wallace, J.; Reddell, P. Precipitation Interception in Australian Tropical Rainforests: II. Altitudinal Gradients of Cloud Interception, Stemflow, Throughfall and Interception. Hydrol. Process. 2007, 21, 1703–1718. [Google Scholar] [CrossRef]
  72. Dyer, D.W.; Patrignani, A.; Bremer, D. Measuring Turfgrass Canopy Interception and Throughfall Using Co-Located Pluviometers. PLoS ONE 2022, 17, e0271236. [Google Scholar] [CrossRef] [PubMed]
  73. Exler, J.L.; Moore, R.D. Quantifying Throughfall, Stemflow and Interception Loss in Five Vegetation Communities in a Maritime Raised Bog. Agric. For. Meteorol. 2022, 327, 109202. [Google Scholar] [CrossRef]
  74. Seneviratne, S.I.; Corti, T.; Davin, E.L.; Hirschi, M.; Jaeger, E.B.; Lehner, I.; Orlowsky, B.; Teuling, A.J. Investigating Soil Moisture-Climate Interactions in a Changing Climate: A Review. Earth-Sci. Rev. 2010, 99, 125–161. Available online: https://linkinghub.elsevier.com/retrieve/pii/S0012825210000139 (accessed on 20 July 2026). [CrossRef]
  75. Wigneron, J.-P.; Olioso, A.; Calvet, J.-C.; Bertuzzi, P. Estimating Root Zone Soil Moisture from Surface Soil Moisture Data and Soil-Vegetation-Atmosphere Transfer Modeling. Water Resour. Res. 1999, 35, 3735–3745. [Google Scholar] [CrossRef]
  76. Kool, J.B.; Parker, J.C. Development and Evaluation of Closed-Form Expressions for Hysteretic Soil Hydraulic Properties. Water Resour. Res. 1987, 23, 105–114. [Google Scholar] [CrossRef]
Figure 1. Geographical distribution of the nine agricultural sub-regions in China: (A) Northeast China Plain, (B) Northern Arid and Semiarid Region, (C) Huang-Huai-Hai Plain, (D) Loess Plateau, (E) Qinghai-Tibet Plateau, (F) Middle-Lower Yangtze Plain, (G) Sichuan Basin and Surrounding Regions, (H) Southern China, and (I) Yunnan-Guizhou Plateau.
Remotesensing 18 02614 g001
Figure 2. Multi-source EO-driven framework for diagnosing soil moisture wetting process.
Remotesensing 18 02614 g002
Figure 3. Product-suitability assessment based on Pearson correlation coefficients between daily precipitation and relative soil moisture increments (ΔRSM). Gray circles indicate boxplot outliers, red triangles indicate means, and blue horizontal lines indicate medians.
Remotesensing 18 02614 g003
Figure 4. Spatiotemporal sensitivity analysis for product-level lag-correlation screening. Pearson correlations between daily precipitation and ΔRSM are shown across agricultural sub-zones, soil depths, and lag times with a shared legend and clearer depth-specific panels. Gray circles indicate boxplot outliers, horizontal lines within the boxes indicate medians, and red triangles indicate means.
Remotesensing 18 02614 g004
Figure 5. Performance of the XGBoost diagnostic model, comparing predicted and observed soil moisture increments (ΔRSM).
Remotesensing 18 02614 g005
Figure 6. SHAP-based identification of dominant drivers of EO-derived wetting increments.
Remotesensing 18 02614 g006
Figure 7. SHAP-derived precipitation tipping points interpreted as marginal-contribution thresholds.
Remotesensing 18 02614 g007
Figure 8. QR-derived precipitation transition thresholds across antecedent relative soil moisture states, soil depths, and textures.
Remotesensing 18 02614 g008
Table 1. Precipitation–soil moisture product combinations evaluated in the lag-correlation screening.
CombinationPrecipitation ProductSoil Moisture ProductShort Label Used in Text
Combination 1CHIRPS v2.0ERA5-Land SMCHIRPS-ERA5
Combination 2CHIRPS v2.0SMAP L4 SMCHIRPS-SMAP
Combination 3CHIRPS v2.0SMCI v1.0CHIRPS-SMCI
Combination 4CHM_PRE v1.0ERA5-Land SMCHM-ERA5
Combination 5CHM_PRE v1.0SMAP L4 SMCHM-SMAP
Combination 6CHM_PRE v1.0SMCI v1.0CHM-SMCI
Combination 7ERA5-Land precipitationERA5-Land SMERA5-ERA5
Combination 8ERA5-Land precipitationSMAP L4 SMERA5-SMAP
Combination 9ERA5-Land precipitationSMCI v1.0ERA5-SMCI
Table 3. Classification of drought intensity based on RSM values.
RSM ValueCategory
0–30%Extreme drought
30–40%Severe drought
40–50%Moderate drought
50–60%Mild drought
60–70%Normal conditions
70–80%Mild wet
80–90%Moderate wet
90–100%Severe wet
100–110%Extreme wet
Table 4. Performance of the XGBoost diagnostic model for daily ΔRSM across three soil depths and three representative soil-texture/topography classes under three validation strategies: random 10-fold cross-validation (CV), leave-one-year-out (LOYO; year-block), and leave-one-zone-out (LOZO; spatial-block).
DepthTextureValidationR2RMSEMAE
0–7 cmLoam_1CV0.8823.4462.271
LOYO0.5456.7114.540
LOZO−0.6057.9325.924
Sandy Loam_1CV0.9362.9271.557
LOYO0.5467.7355.316
LOZO0.4337.6065.423
Clay Loam_1CV0.9172.3611.431
LOYO0.5755.3533.627
LOZO0.4076.8264.936
7–28 cmLoam_1CV0.8772.3961.453
LOYO0.2635.8703.890
LOZO0.1886.0284.192
Sandy Loam_1CV0.9022.5781.499
LOYO0.2467.2024.875
LOZO0.1246.5474.671
Clay Loam_1CV0.8402.1161.307
LOYO0.2944.4913.054
LOZO−0.2805.6134.019
28–100 cmLoam_1CV0.8821.1920.665
LOYO−0.0023.4552.262
LOZO0.0073.3752.341
Sandy Loam_1CV0.9001.2530.555
LOYO−0.0303.9642.622
LOZO−0.1953.8822.770
Clay Loam_1CV0.7941.3340.856
LOYO0.0932.7941.942
LOZO−0.4002.9852.169
Disclaimer/Publisher’s Note: The statements, opinions and data contained in all publications are solely those of the individual author(s) and contributor(s) and not of MDPI and/or the editor(s). MDPI and/or the editor(s) disclaim responsibility for any injury to people or property resulting from any ideas, methods, instructions or products referred to in the content.