Review

Vegetation Optical Depth at Enhanced Spatial Resolution: Progress, Challenges, and Perspectives

by
Mohamed El-Khayati-Ramouz
1,*,
Gerard Portal
2,
Carlos López-Martínez
1,2,
Mercè Vall-llossera
1,2,
David Chaparro
3,
Alberto Alonso-González
1 and
Adriano Camps
1,2,4
1
CommSensLab-UPC, Department of Signal Theory and Communications, Universitat Politècnica de Catalunya, Carrer de Jordi Girona 31, 08034 Barcelona, Spain
2
Institut d’Estudis Espacials de Catalunya IEEC, Parc Mediterrani de la Tecnologia (PMT), Campus del Baix Llobregat, UPC, 08860 Barcelona, Spain
3
Center for Ecological Research and Forestry Applications, 08193 Cerdanyola del Vallès, Spain
4
College of Engineering, United Arab Emirates University, Al Ain P.O. Box 15551, United Arab Emirates
*
Author to whom correspondence should be addressed.
Remote Sens. 2026, 18(15), 2530; https://doi.org/10.3390/rs18152530
Submission received: 11 June 2026 / Revised: 13 July 2026 / Accepted: 21 July 2026 / Published: 3 August 2026

Abstract

Microwave satellite vegetation parameters are widely used to monitor ecosystem spatiotemporal dynamics. Among these, vegetation optical depth (VOD) stands out as a critical microwave vegetation indicator, widely used for applications such as monitoring crop yield, estimating carbon stocks, and assessing risks threatening forests and their resilience to them. However, current VOD products are available at a coarse resolution, often around tens of kilometers, limiting their usefulness to only large-scale applications or those that do not need high spatial precision. Nevertheless, although extensive research has been conducted to improve the spatial resolution of several geophysical indicators, such as soil moisture, advances have been scarce for VOD. Here, we review the advances conducted to estimate VOD at medium-high spatial resolutions, overviewing the state of the art of different methods and their potentials and limitations. Basedon the available literature, we propose a taxonomy that classifies existing VOD downscaling approaches into proxy-based methods, which exploit the relationship between VOD and auxiliary variables, and data-fusion strategies that combine complementary microwave observations across sensors and frequencies. Also, we synthesize the suitability of different proxy variables according to the VOD frequency band, showing that while optical vegetation indices perform well for high-frequency VOD, the downscaling of low-frequency VOD benefits from the integration of complementary radar-derived proxies. Additionally, we examine the effectiveness and affordability of current validation methods and review the potential of emerging ones, such as GNSS technology and land surface models, to guarantee the reliable quality of future VOD downscaled products. Finally, we highlight the capabilities of future missions, particularly the upcoming CIMR multiresolution capability across frequency bands, which could considerably aid in obtaining VOD at better spatial scales.

1. Introduction

Vegetation is essential to regulate the water and carbon cycles, maintain the energy balance, preserve biodiversity, and mitigate the impacts of climate change. Plants are also critical in the provisioning of food and timber needed for human well-being. However, the increasing number and severity of droughts in many regions of the world, the longer and more severe fire seasons and their occurrences, as well as the increased frequency and intensity of heat waves, threaten vegetation worldwide. This poses a high risk of forest burn, drought-induced forest mortality, vegetation changes, and increased food insecurity due to reduced crop yields [1,2]. Hence, vegetation monitoring at multiple spatiotemporal scales is essential to understand the dynamics and trends of Earth’s ecosystems and identify critical shifts driven by multiscale phenomena.
In this regard, Earth Observation satellites have become a key technology capable of offering vegetation data from local to global scales, and over extended periods. Multiple Vegetation Indices (VIs) have been developed over the years, which, depending on the sensor’s characteristics (e.g., type, frequency, polarization), provide distinctive information on vegetation properties. Traditionally, optical indices based on reflectance ratios and derived from multispectral images have provided valuable information about the top canopy layers at medium resolutions (e.g., 30 m from Landsat and 10 m from Sentinel-2). The Normalized Difference Vegetation Index (NDVI) and, to a lesser extent, the Enhanced Vegetation Index (EVI) have been among the most frequently used optical indices in a vast majority of applications. These indices are frequently used in agriculture to assess crop development [3,4], quantify biomass health [5], and study photosynthetic activity [6]. However, these reflectance-derived indices are more prone to saturate rapidly in dense canopies [7,8], and are significantly affected by atmospheric effects (e.g., clouds and aerosol scattering) and by reduced solar illumination, which weakens their robustness. In addition, they are limited in monitoring the top of the canopy, and are insensitive to woody vegetation components [9,10].
Microwave observations overcome part of the limitations of optical indices as they are less sensitive to clouds, and at the L- and C-band, they are sensitive to a great part of the vertical distribution of canopy layers through different forest densities and types [11,12]. In addition, microwaves are less prone to saturation effects than optical indices. Hence, multiple vegetation indicators are retrieved from microwave observations by applying different vegetation retrieval algorithms and models. Among these, vegetation optical depth (VOD) is a dimensionless parameter that rates the attenuation of electromagnetic waves as they pass through the vegetation canopy. The VOD depends on the biomass, the water content, and the structure of the vegetation, as well as on observation parameters (e.g., wavelength, viewing angle, and polarization) [9,13]. As VOD is derived from microwave radiative and parametric models, numerous studies have analyzed its correlation with other remote sensing metrics and vegetation characteristics to better understand its sensitivity [14,15,16]. Based on these linkages, VOD has been used as a metric for crop yield assessment [17], as an indicator to monitor phenology [15,18] as well as to study deforestation and vegetation drought-induced mortality [19], loss of rainforest resilience [20], carbon balance of land ecosystems [9,21], and biomass changes [22,23], and for modelling wildfires [24].
VOD products can be retrieved from passive and active microwave instruments onboard satellite platforms at different frequency bands (see Table 1 in [7] for satellite missions relevant to VOD retrieval). While passive systems measure brightness temperatures (TBs), which quantify the natural radiation emitted by the soil and vegetation, active systems measure the energy reflected after transmitting a pulse of microwave energy. Radiometers (passive instruments) and scatterometers (active instruments) provide low spatial resolution (e.g., >25 km at L-band) as they measure large-scale phenomena across extensive areas, using a wide field of view to detect low-energy emissions and backscatter, respectively. Consequently, a given VOD pixel can encompass several land covers. This landscape heterogeneity combines different phenological signals, as well as different biomass systems within the same pixel, preventing the determination of linkages between specific vegetation patterns and the VOD signal. Moreover, this heterogeneity strongly limits potential VOD validation strategies by making the point-to-pixel scale gap (between the validation point and the satellite footprint) highly challenging. Consequently, VOD has limited applicability in small-scale applications such as field-level agricultural monitoring, localized vegetation stress detection, forest degradation and edge-effect assessment, and local-scale ecohydrological analyses.
Within this context, VOD products with better spatial resolution could significantly aid in several local (small-scale) applications (e.g., agriculture, forest mortality detection, assessment of forest water status, and vulnerability to drought). In addition, highly resolved VOD could also complement the information provided by optical indices, and even improve soil moisture (SM) retrieval robustness through a more accurate representation of the vegetation component in the retrieval and radiative transfer models. Hence, several approaches have been proposed to estimate the VOD at an enhanced spatial resolution. However, in contrast to SM, for which numerous disaggregation and retrieval models (e.g., physically based, semiempirical, and data-based models) have been developed to produce SM products at enhanced spatial resolutions (e.g., 1 km, 300 m, 60 m, etc. [25,26,27]), most VOD downscaling methodologies remain in a nascent phase, with fewer than ten studies published to date. These methodologies mainly focus on evaluating the VOD correlation with other potential proxies available at relevant spatial resolutions.
In this regard, this manuscript investigates the advances proposed in the literature to enhance VOD spatial resolution and, to the authors’ knowledge, constitutes the first comprehensive review of VOD downscaling methodologies. A comprehensive review of the literature was conducted to ensure coverage of the main developments in VOD downscaling. Relevant studies were identified through major scientific databases using keyword combinations associated with vegetation optical depth, downscaling and disaggregation approaches, data fusion methods, and complemented by cross-referencing of key publications and related review articles (see Supplementary Material). Given the relatively limited number of studies specifically focused on VOD downscaling, all available peer-reviewed contributions at the time of writing were considered to provide a complete overview of the current state of the field. The resulting taxonomy and classification of the different downscaling approaches were derived directly from the methods and studies identified in the literature. This review describes the methods used, explores potential validation approaches, and highlights how the enhanced capabilities of future satellite missions can be leveraged to advance VOD downscaling. Through this, the review seeks to connect established knowledge with emerging opportunities, thereby offering a forward-looking perspective.
The paper is organized as follows. Section 2 discusses the vegetation models and retrieval algorithms used to estimate VOD from microwave remote sensing techniques, in particular, from radiometry, radar, Global Navigation Satellite Systems Reflectometry (GNSS-R), and Transmissometry (GNSS-T) observations. Moreover, the limitations and capabilities of each microwave remote sensing technique for VOD retrieval are discussed. Although this review focuses on high-resolution VOD, Section 2 provides a concise overview of coarse-resolution retrievals, offering essential context for the review. It presents VOD estimation across multiple microwave techniques rather than from a single-method perspective. As these products often serve as benchmarks for high-resolution approaches, summarizing their models, assumptions, and constraints clarifies each technique’s capabilities and limitations and frames the subsequent analysis. In addition to reviewing coarse-resolution VOD retrievals, this section highlights emerging microwave techniques capable of retrieving VOD directly at medium to high spatial resolutions. Although these approaches are not downscaling methods themselves, they represent a promising complementary pathway toward enhanced VOD spatial resolution. Section 3 details the methodologies and analytical approaches employed in the literature to downscale VOD. Section 4 gives insights into potential validation solutions, highlighting the scarcity of validation sites and their detrimental impact on progress toward disaggregated VOD products with remarkable quality. Finally, Section 5 presents the main conclusions and outlines potential directions for future research. Figure 1 presents a comprehensive overview of the manuscript, outlining the flow and the organizational framework of the review.

2. VOD Retrievals

2.1. VOD from Radiometric Systems

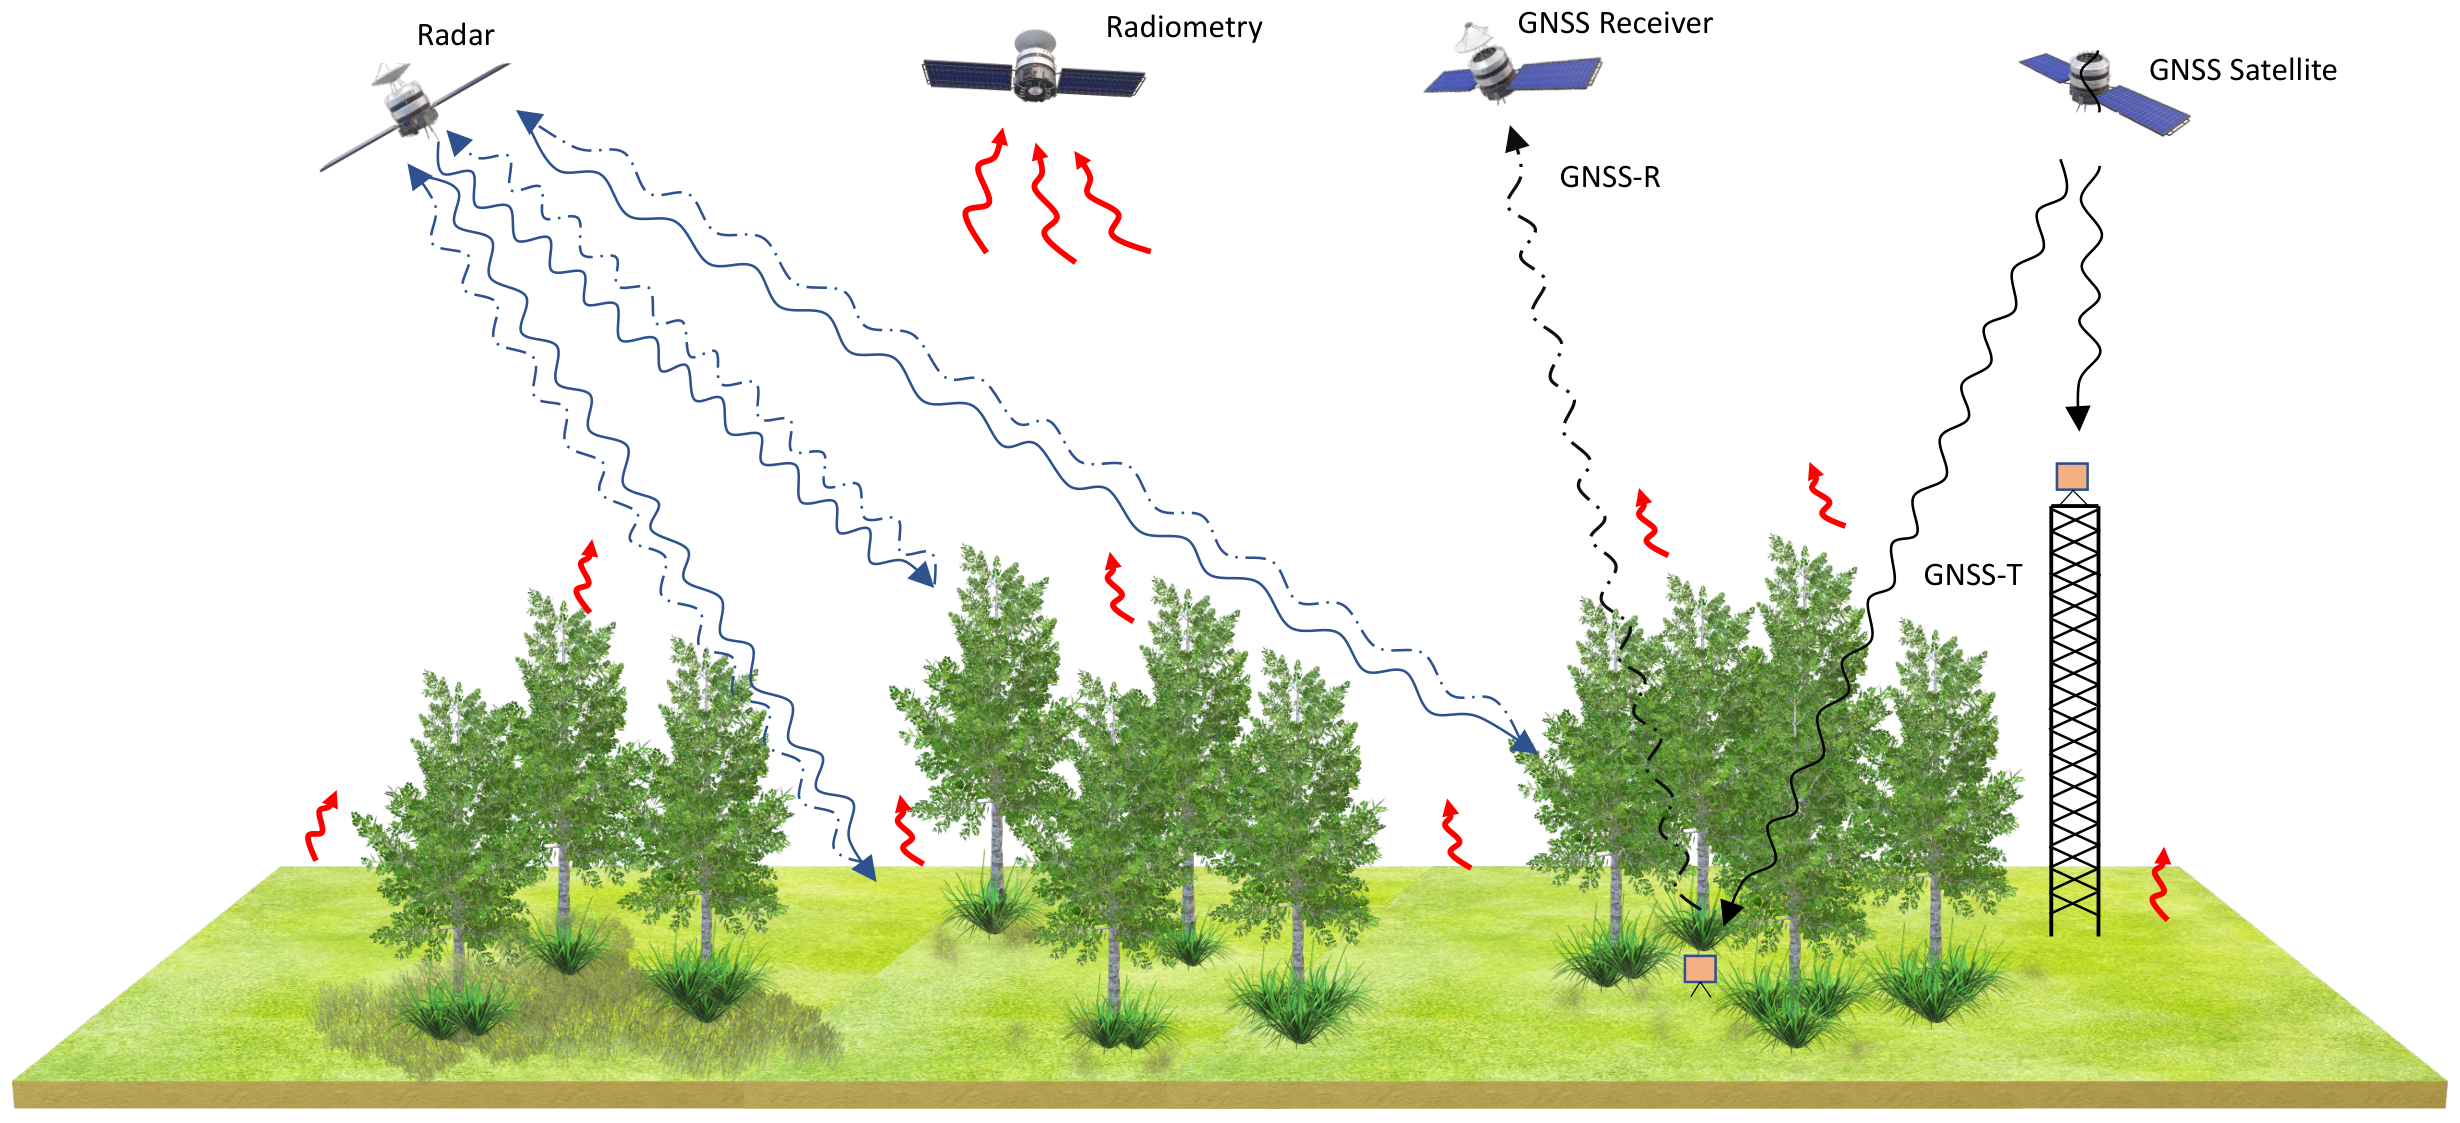
In order to model the Earth’s emitted radiation as observed by satellite sensors, it is essential to consider not only scattering and attenuation of soil radiation but also the intrinsic emission from vegetation [28]. Consequently, the brightness temperatures collected by microwave radiometers (see Figure 2) account for both soil emission and vegetation effects. TBs are influenced by surface physical temperature and emissivity, which, in turn, depend on parameters such as incidence angle, soil moisture, and surface roughness [29]. Some terrestrial emission models have been proposed to infer the contribution of vegetation from the collected brightness temperatures. From these models, SM and VOD are commonly retrieved using the τ ω model derived from the radiative transfer equation [29]. This model is a zeroth-order radiative transfer model that neglects multiple scattering and does not explicitly account for the scattering phase function. Also, it represents the vegetation components and soil by a single homogeneous layer. Thus, the modeled TBs are represented as the sum of: (1) the upward emission from vegetation, (2) the downward emission from vegetation that reflects off the soil surface and is then attenuated by the canopy, and (3) the direct emission from soil, attenuated as it passes through the vegetation layer [29]. The impact of scattering is represented by the single-scattering albedo (ω), whereas the attenuation of microwave radiation through the vegetation is parametrized by the vegetation optical depth (VOD, which is more often represented in retrieval equations by the Greek letter τ) [29]. Several studies have proposed higher-order radiative transfer models applicable over dense canopies. For instance, the stream emission model (1S) [30], and the two-stream emission model (2S) [31] tackle the limitation of the τ ω model by considering the multiple reflections between soil and vegetation. Nevertheless, most of the alternative models proposed have not shown relevant improvement in VOD retrievals, which makes the τ ω model the current framework of vegetation modelling in microwave radiometry observations.
Numerous algorithms have been developed to retrieve VOD depending on the chosen emission model, observational characteristics of the sensor (e.g., polarization, incidence angles, overpasses over the same pixel), and other assumptions related to vegetation and soil temperature, scattering albedo, dielectric models, and soil roughness modelling. These retrieval techniques aim to use the least amount of ancillary data to acquire the maximum environmental parameters from the received microwave signal. Different algorithms are used to retrieve VOD from different satellite missions. In the case of the European Space Agency (ESA) Soil Moisture and Ocean Salinity (SMOS) mission, the satellite interferometric radiometer collects the brightness temperatures as it moves along the track, thus acquiring TBs at multiple incidence angles and two polarizations. This multiangular and dual-polarization configuration allows the simultaneous retrieval of SM and VOD without auxiliary data [32]. The retrieval process relies on the inversion of the L-band Microwave Emission of the Biosphere (L-MEB) model [33], which exhibits a remarkable accuracy on a wide range of incidence angles. Currently, the vegetation optical depth (τ) is provided by several SMOS products such as Level 2 (L2) [34], Level 3 (L3) [35], and SMOS-IC [36]. Whilst the L2 and L3 products are derived from the SMOS SM algorithm, which has been continuously improved since 2009, the SMOS-IC differs from the former ones by employing new parametrizations for the soil roughness and effective vegetation scattering albedo.
Regarding the Soil Moisture Active Passive (SMAP) mission [37], considering that the radiometer collects TBs at only one incidence angle (40°), several retrieval algorithms have been proposed depending on the polarization exploited. In that regard, the Single Channel Algorithm (SCA) [38] uses only one polarization of the brightness temperature (SCA-V when TBV or SCA-H when TBH) to obtain SM using the Fresnel equations, with V and H indicating vertical and horizontal polarizations, respectively. Since only one source of information is used, only SM can be retrieved [39]. Thus, the VOD is derived from ancillary data assuming a linear relationship between it and the vegetation water content (VWC): VOD = b·VWC [40]. The b parameter depends on the properties of the vegetation, the wavelength, polarization, and the angle of incidence [40]. It is empirically defined over land cover using look-up tables [41]. Concerning the VWC, which quantifies the amount of water contained within the vegetation canopy, it is estimated from NDVI and a stem factor [42]. Alternatively, the Dual Channel Algorithm (DCA) uses vertical and horizontal polarizations to simultaneously obtain the SM and VOD [43]. In addition to the single angular observation difference between SMAP and SMOS, this algorithm is similar to the SMOS SM one, as both parameters are obtained by minimizing the Root Mean Square Error (RMSE) between modeled and observed TBs. Several other algorithms derived from the DCA have been proposed to reduce the retrieval errors and gain robustness in the VOD retrievals. Konings et al. [44] proposed the Multitemporal DCA (MT-DCA) based on the assumption that optical depth varies more slowly than the SM and remains relatively constant between two successive overpasses. This algorithm uses a moving window of two consecutive overpasses to retrieve two SM values, a single value of VOD, and a single temporally scattering albedo per pixel. Furthermore, Chaubell et al. [45] recently introduced the modified DCA method (MDCA), which retrieves SM and VOD simultaneously and more accurately than the conventional DCA by modifying roughness parameters and adjusting the albedo values. Importantly, efforts have been devoted to improving the effective spatial resolution of SMAP radiometer observations, particularly through the application of Backus–Gilbert interpolation to enhance brightness temperatures to a 9 km resolution [46,47]. These enhanced brightness temperature observations have subsequently enabled the retrieval of higher-resolution estimates of soil moisture, VOD, and scattering albedo, thereby improving the characterization of land-surface and vegetation dynamics [48].
Besides the mentioned algorithms, the Land Parameter Retrieval Model (LPRM) is an alternative method to retrieve SM and VOD from dual-polarized measurements at low frequencies [49,50]. In addition, this algorithm has been tested at higher frequencies (C, X, and Ku bands) [51] using data from multiple sensors, such as the Scanning Multichannel Microwave Radiometer (SMMR) and Special Sensor Microwave/Imager (SSM/I) [52]. The LPRM combines the information of different channels to establish relationships between the indices obtained and indicators of interest [49,50]. Specifically, LPRM uses the Microwave Polarization Difference Index (MPDI), and its relationship with soil dielectric properties to derive SM and VOD data [49,50].

2.2. VOD from GNSS Reflectometry and Transmissometry

In addition to microwave radiometry, VOD can also be derived using GNSS-R and GNSS-T. GNSS-R operates as a bistatic radar configuration based on Signals of Opportunity (SoOp) in which the transmitted signal is sent by GNSS satellites and received after being scattered off the Earth’s surface [53]. The characteristics of the reflected signal depend on various geophysical parameters, including roughness, SM, and VOD, which can be retrieved by processing the signal [53]. On the other hand, the GNSS-T takes advantage of the direct GNSS signals transmitted by measuring the extinction of the signal propagating through the vegetation layers [54]. As all GNSS constellations transmit signals within the L-band range, GNSS-R and GNSS-T are inherently limited to this band [55]. Indeed, GNSS techniques offer high sensitivity to vegetation water content and robust canopy penetration [56], but their single-band operation limits multi-frequency characterization.
Several studies have estimated VOD and VWC using these techniques on different GNSS receiver platforms—ground, airborne, or spaceborne—which significantly impact the spatiotemporal resolution of VOD retrievals. For example, Rodriguez-Alvarez et al. [57] retrieved VOD by estimating the differential attenuation of signals received by two GNSS receivers on the surface: one located in open-sky conditions and the other under the vegetation. Using the attenuation relationship given by (1), VOD was then derived according to (2),
L = P A P B
τ = ln ( L ) cos ( θ i )
where in (1) L is the attenuation due to the vegetation, P A and P B are the powers received by the GNSS receiver in open-sky and the one beneath the vegetation canopy, respectively, whereas in (2) τ is the vegetation opacity and θ i is the incidence angle. Subsequently, the water content of leaves was estimated after determining the b parameter by performing field experiments. Similarly, by deploying two GNSS receivers, one positioned beneath the canopy and the other one in an open-sky location on a tower, Humphrey and Frankenberg [54] measured L-band VOD (LVOD) in a forested site over eight months. The study demonstrated that variations in GNSS Signal-to-Noise Ratio (SNR) reflect biomass density distribution within the canopy and highlighted the ability to capture changes in VOD and canopy water content at sub-hourly intervals. By deploying a GNSS receiver connected to a dual-polarization zenith-looking antenna under a beech forest, Camps et al. [58] analyzed the attenuation and depolarization effects of the vegetation layer on Global Positioning System (GPS) signals at varying elevation angles. When comparing the collected Carrier-to-Noise ( C / N 0 ) to different datasets such as the greenness, blueness, and redness indices, rain data, Leaf Area Index (LAI), and NDVI, the results showed a strong correlation with NDVI ( R 2 > 0.85) independently of the elevation angle. Moreover, large depolarization effects were also significant at elevation angles above 50°. The study demonstrated that NDVI is a good descriptor of vegetation attenuation in GNSS-R soil moisture retrievals, and that L-band multi-angular attenuation measurements can be exploited to infer VWC. For further context and comparison, readers are encouraged to consult some studies such as [59,60,61,62], which present similar research approaches. Given its straightforward instrumentation, cost efficiency, and relevant spatial and temporal resolution, this ground-based technique could serve as a potential method for future validation, as further addressed in Section 4. Although the relevant spatial resolution data, ground-based techniques’ coverage can only reach a small area. In this context, despite their typically coarse spatial resolution, which depends on orbital parameters and surface scattering properties, satellite platforms are essential to provide wider coverage.
Several spaceborne GNSS-R missions, such as TechDemoSat-1 (TDS-1) launched in 2014 [63], NASA’s Cyclone GNSS (CyGNSS) in 2016 [64], and the 3Cat-5 A/B (FSSCat mission) in 2020 [65], have provided extensive spaceborne GNSS-R data and contributed significantly to advancements in various fields, including SM retrieval and vegetation monitoring. However, few studies have attempted to estimate VOD from these missions, resulting in limited availability of established VOD products. Among the few approaches, Xu et al. [66] developed a physics-based model trained using CYGNSS reflectivity, SMAP SM, and NDVI-derived VWC. Firstly, they estimated surface roughness by averaging data over periods when SMAP and CYGNSS observations overlapped, under the assumption that surface roughness remains temporally invariant. Afterward, they were able to correct for the effects of SM and surface roughness, allowing the subsequent retrieval of VOD. As compared to the SMAP-derived VOD, the retrieved VOD showed good agreement in agricultural regions in Asia but tended to underestimate the values in dense forest areas. Bu et al. [67] proposed an Extreme Randomized Tree (ET) ensemble machine learning algorithm to infer VOD by integrating Bistatic Radar Cross Section (BRCS), effective scattering area, CYGNSS variable parameters (e.g., equivalent isotropic radiated power, receiver antenna gain, among others), and surface auxiliary parameters (e.g., SM, surface temperature, and the roughness coefficient). The retrieved VOD correlated well with the SMAP VOD, and results showed that the ET model achieves superior accuracy in regard to other models, such as Adaptive Boosting (AdaBoost), Support Vector Machine (SVM), and Gradient Boosting Decision Tree (GBDT). Similarly, Zhang et al. [68] developed a spaceborne high spatial-temporal resolution GNSS-R model for the retrieval of VWC using five machine learning algorithms—Bagging Tree (BT), GBDT, Extreme Gradient Boosting (XGBoost), Random Forest (RF), and Light Gradient Boosting Machine (LightGBM)—and integrating key inputs such as BRCS, effective scattering area, variables derived from CYGNSS, and surface auxiliary data. When assessing the models with SMAP data, RF and BT showed superior retrieval accuracy as compared to the other models. Although all these approaches exist, globally established VOD datasets derived from GNSS techniques remain scarce compared to those derived from microwave radiometry.

2.3. VOD from Active Observations

Although VOD is derived primarily from passive microwave observations, it has also been retrieved from active microwave observations as they can offer distinct vegetation and soil attributes [69]. In this regard, for instance, several studies have derived VOD by exploiting the extensive long-term dataset at the C-band and VV polarization provided by the Advanced SCATterometer (ASCAT) instruments, onboard the Meteorological Operational satellite constellation (Metop-A/B/C). For example, Vreugdenhil et al. [70] retrieved global VOD (TU-VOD) by a change detection method, using the Water Cloud Model (WCM) [71] as the vegetation scattering model when assessing the vegetation correction in the TU-Wien SM retrieval algorithm. However, the initial TU-VOD version did not account for interannual variability. To address this, Vreugdenhil et al. [72] proposed an updated version that extracts climatological signals and demonstrates TU-VOD’s sensitivity to interannual variability in vegetation dynamics across Australia. Similarly, by using the WCM for vegetation scattering and the Ulaby linear model [73] for soil scattering, and the SM from the ERA5-Land product as an input parameter in the retrieval algorithm, Liu et al. [74] retrieved VOD from ASCAT backscatter over Africa from 2015 to 2019. In terms of spatial correlations, the VOD obtained exhibited a good linear relationship when compared to the Above-Ground Biomass (AGB) (R = 0.92) and Light Detection And Ranging (LiDAR) tree height data (R = 0.89) [74]. As this initial version of the algorithm showed imperfect results when extended globally [75], an updated version was proposed to retrieve global VOD and vegetation scattering parameters [76]. On the other hand, Quast et al. [77] presented a semi-empirical first-order radiative transfer model that uses the angular and temporal variations in the backscattering to infer SM and VOD. Using ASCAT measurements, the model was applied to retrieve SM and VOD at 158 sites in France.
However, as passive radiometers, VOD data derived from scatterometer observations are at low spatial resolution. To overcome this limitation, several studies retrieved VOD over small regions by exploiting the high spatial resolution of Synthetic Aperture Radars (SAR; e.g., 5 m × 20 m in the case of Sentinel-1 single-look and Interferometric Wide Swath mode configuration). For example, by using Sentinel-1A and Sentinel-1B SAR data and employing the WCM, El Hajj et al. [78] estimated VOD separately for σ VV and σ VH polarizations, and ascending and descending modes at a plot scale for non-irrigated regions of Catalonia. Unlike the VOD derived from σ VH polarization, the VOD estimated from σ VV polarization exhibited a medium-good correlation with the temporal dynamics of Sentinel-2 NDVI, with a coefficient of determination ranging between 0.39 and 0.61. Similarly, by using Sentinel-1A backscatter observations and SM to calibrate the Ulaby model and WCM, Zhou et al. [79] retrieved VOD at 1 km resolution over the grasslands of the Heihe River basin. The resultant VOD showed strong temporal dynamics (R ≥ 0.75) when correlated with optical VIs (NDVI, LAI, and EVI). Similarly, more recently, Lu et al. [80] developed a 1 km VOD retrieval algorithm based on Sentinel-1 C-band backscatter by coupling the Water Cloud Model with a semi-empirical soil backscatter model. The retrieval framework was developed over locations with in situ SM measurements, which served as ancillary inputs to the algorithm. The retrieved VOD showed strong consistency with NDVI and EVI, achieving temporal Pearson correlation coefficients of 0.70–0.79 depending on land-cover type, demonstrating the potential of combining the WCM with a semi-empirical soil backscatter model for high-resolution VOD retrieval.

3. VOD Downscaling Methods

While SAR-based approaches have enabled higher-resolution VOD estimation, their application has generally remained restricted to site-specific studies, limiting their scalability to continental and global contexts. Consequently, several strategies have been proposed to enhance VOD spatial resolution. In light of the relatively limited literature (see Table 1), the taxonomy adopted here distinguishes between correlation-based and data fusion approaches, which reflect the two dominant categories found in the literature. Indeed, Section 3.1 focuses on downscaling algorithms that exploit spatial and temporal correlations of VOD products and various satellite vegetation indicators (e.g., optical, radar) and environmental variables across diverse land covers to determine the optimal proxies of VOD. Section 3.2 focuses on downscaling algorithms based on the disaggregation of TBs through active–passive algorithms and other data fusion methods.

3.1. Correlation Between VOD and Proxy Indicators for Downscaling Applications

3.1.1. Optical Indices

The vegetation information represented by the VOD parameter depends notably on the frequency band. Microwave systems operating at lower frequencies (e.g., L-band) are capable of sensing deeper vegetation layers — passive systems by capturing brightness temperatures, and active systems by enabling greater signal penetration. As frequency increases, the signal becomes less susceptible to Radio-Frequency Interference (RFI); however, the penetration capability decreases, thus acquiring information only on the upper layers of the canopy [85]. For this reason, VOD and optical VIs exhibit an increasing correlation for increasing frequencies and for decreasing canopy density [9]. Several studies have explored the relationship between VOD and indices derived from optical sensors, typically NDVI, EVI, and LAI, to understand the representativeness of VOD in green vegetation and assess these indices as possible proxies for downscaling. For instance, Lawrence et al. [86] compared the temporal trends of SMOS L2 VOD product [34] with Moderate-resolution Imaging Spectroradiometer (MODIS) NDVI, EVI, LAI, and Normalized Difference Water Index (NDWI) over crop zones in the USA, obtaining an average R2 of 0.32-0.35 for the different optical vegetation indices considered. When comparing a global vegetation product derived from SSM/I (1987–2007), Tropical Rainfall Measuring Mission/Microwave Imager (TRMM/TMI) (1998–2008), and Advanced Microwave Scanning Radiometer (AMSR-E) (2002–2008) with the Advanced Very High Resolution Radiometer (AVHRR) NDVI product, Liu et al. [87] demonstrated that, like the NDVI, the VOD also captures seasonal cycles and interannual variations. Grant et al. [88] also examined the spatial and temporal behavior at a global scale of the LVOD (from SMOS L3 [89]), the C-band VOD (CVOD) (obtained from AMSR-E), and optical VIs (from MODIS) such as NDVI, EVI, LAI, and NDWI. The CVOD showed a higher correlation with VIs than the SMOS LVOD, and among all VIs considered, NDVI exhibited the highest correlation with both VOD products. In addition, besides a noteworthy correlation with LVOD (R = 0.68), LAI displayed a linear relationship with VOD.
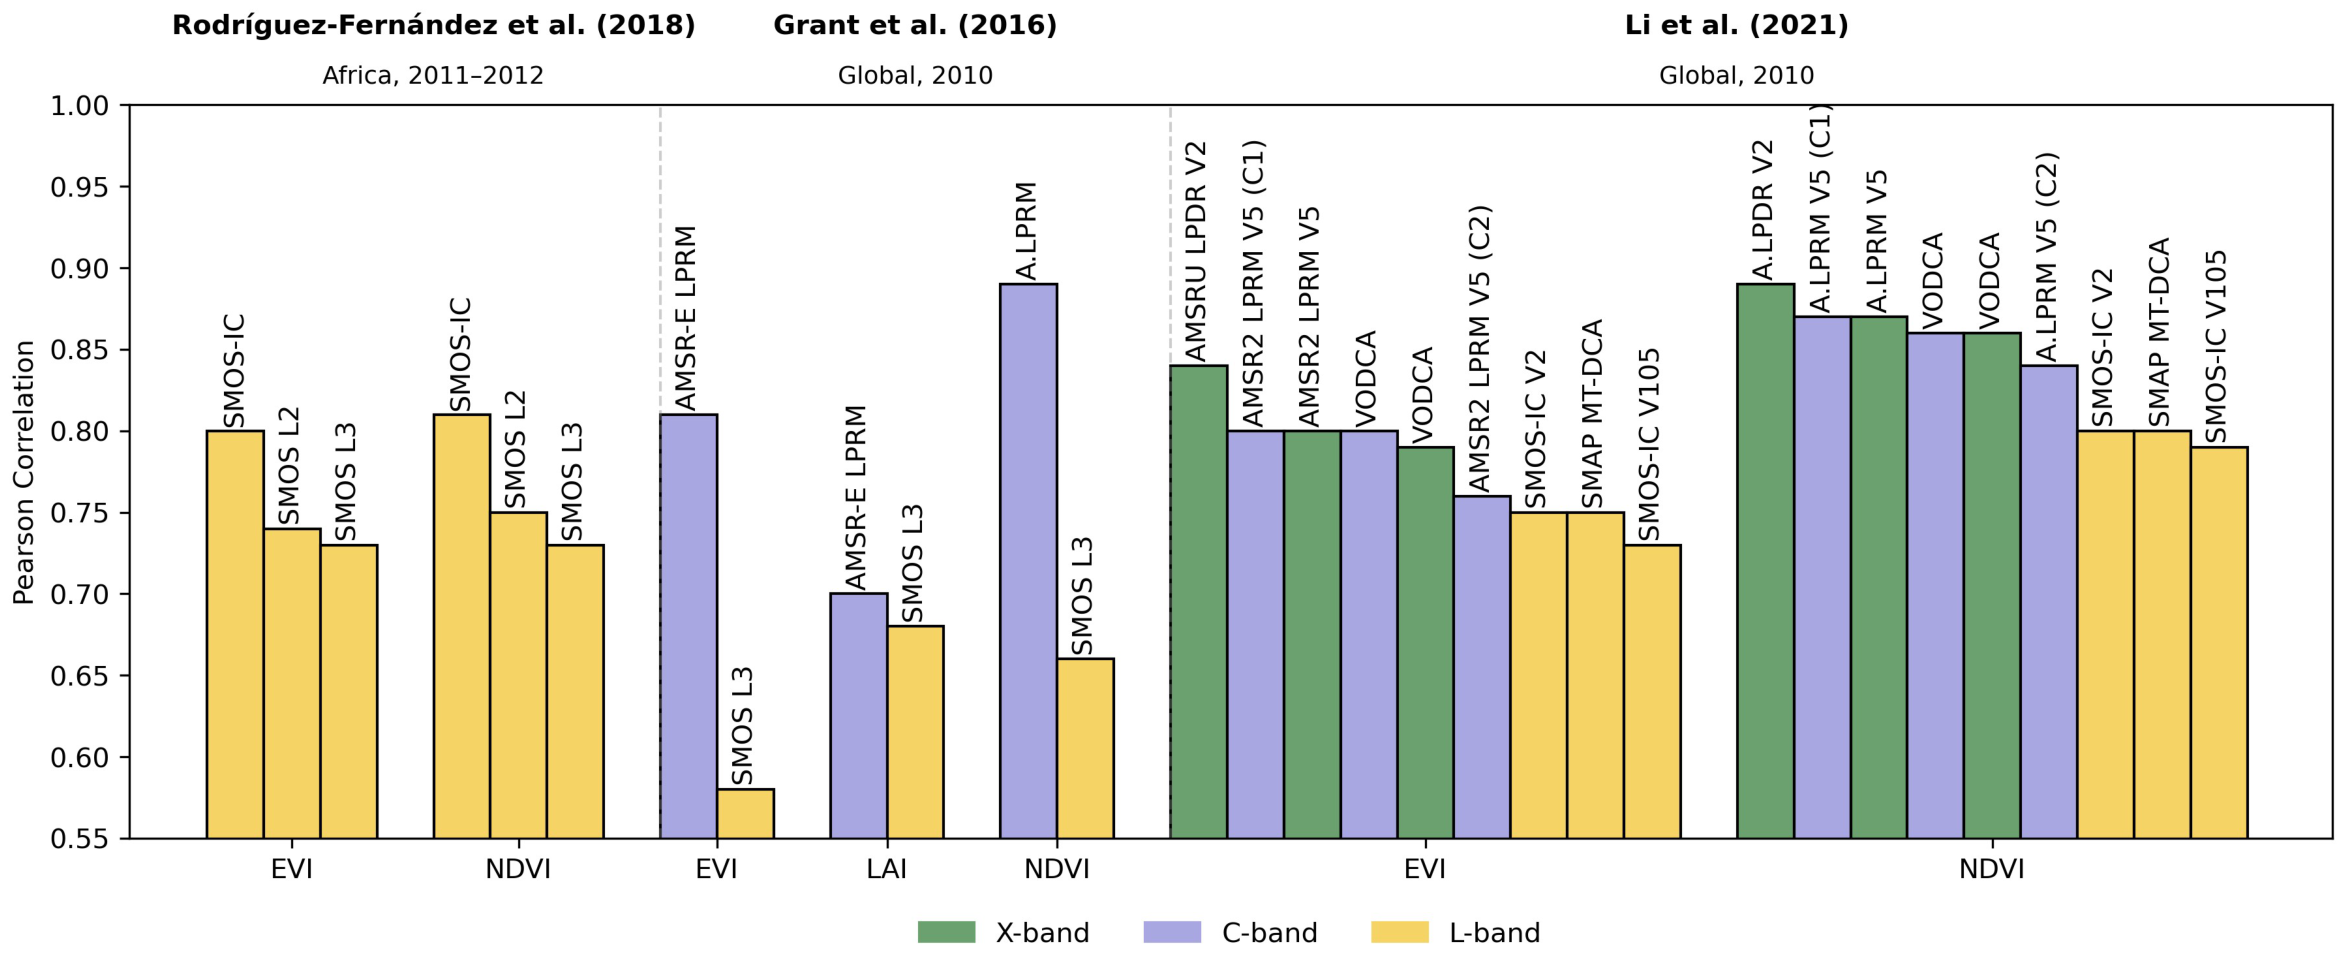
Using the relationship between VOD and biomass [90,91], Chaparro et al. [9] compared the capability of NDVI, X-band VOD (XVOD), CVOD, and LVOD to monitor carbon stocks, finding that L-band is the most appropriate for forest, but also how VOD at higher frequencies and optical VIs perform well at low vegetation densities, in which these signals do not saturate. Considering the linear relationship between VWC and VOD, Chen et al. [92] evaluated the correlation between NDVI and NDWI derived from MODIS and Landsat and ground-based VWC from the Soil Moisture Experiments in 2002 (SMEX02) experiment in corn and soybeans. The results showed a linear regression between corn VWC and NDWI of R2 = 0.72–0.84, demonstrating the possibility of estimating VWC from optical indices. Figure 3, and more extensively Table S1 (Supplementary Material), present additional analogous studies, outlining the indices employed, the regions and periods analyzed, and references to the corresponding studies. Several conclusions can be drawn from Figure 3. From [93], SMOS-IC exhibits a slightly stronger correlation with NDVI and EVI compared to other datasets, highlighting its relevance as a baseline VOD product for initiating resolution enhancement efforts employing optical indices. Similarly, in [74], the correlations obtained demonstrate that passive VOD products (AMSR-2 LPRM V5, VOD Climate Archive (VODCA)) show higher correlations with optical indices than active ones (ASCAT-IB, ASCAT V16). These findings reinforce the importance of passive VOD products for resolution enhancement methods that integrate optical indices. As expected, in [88,94], VOD products at C- and X-band frequencies present stronger correlations with optical indices than LVOD. These results suggest that optical indices serve as more effective proxies for downscaling CVOD and XVOD products than for LVOD.
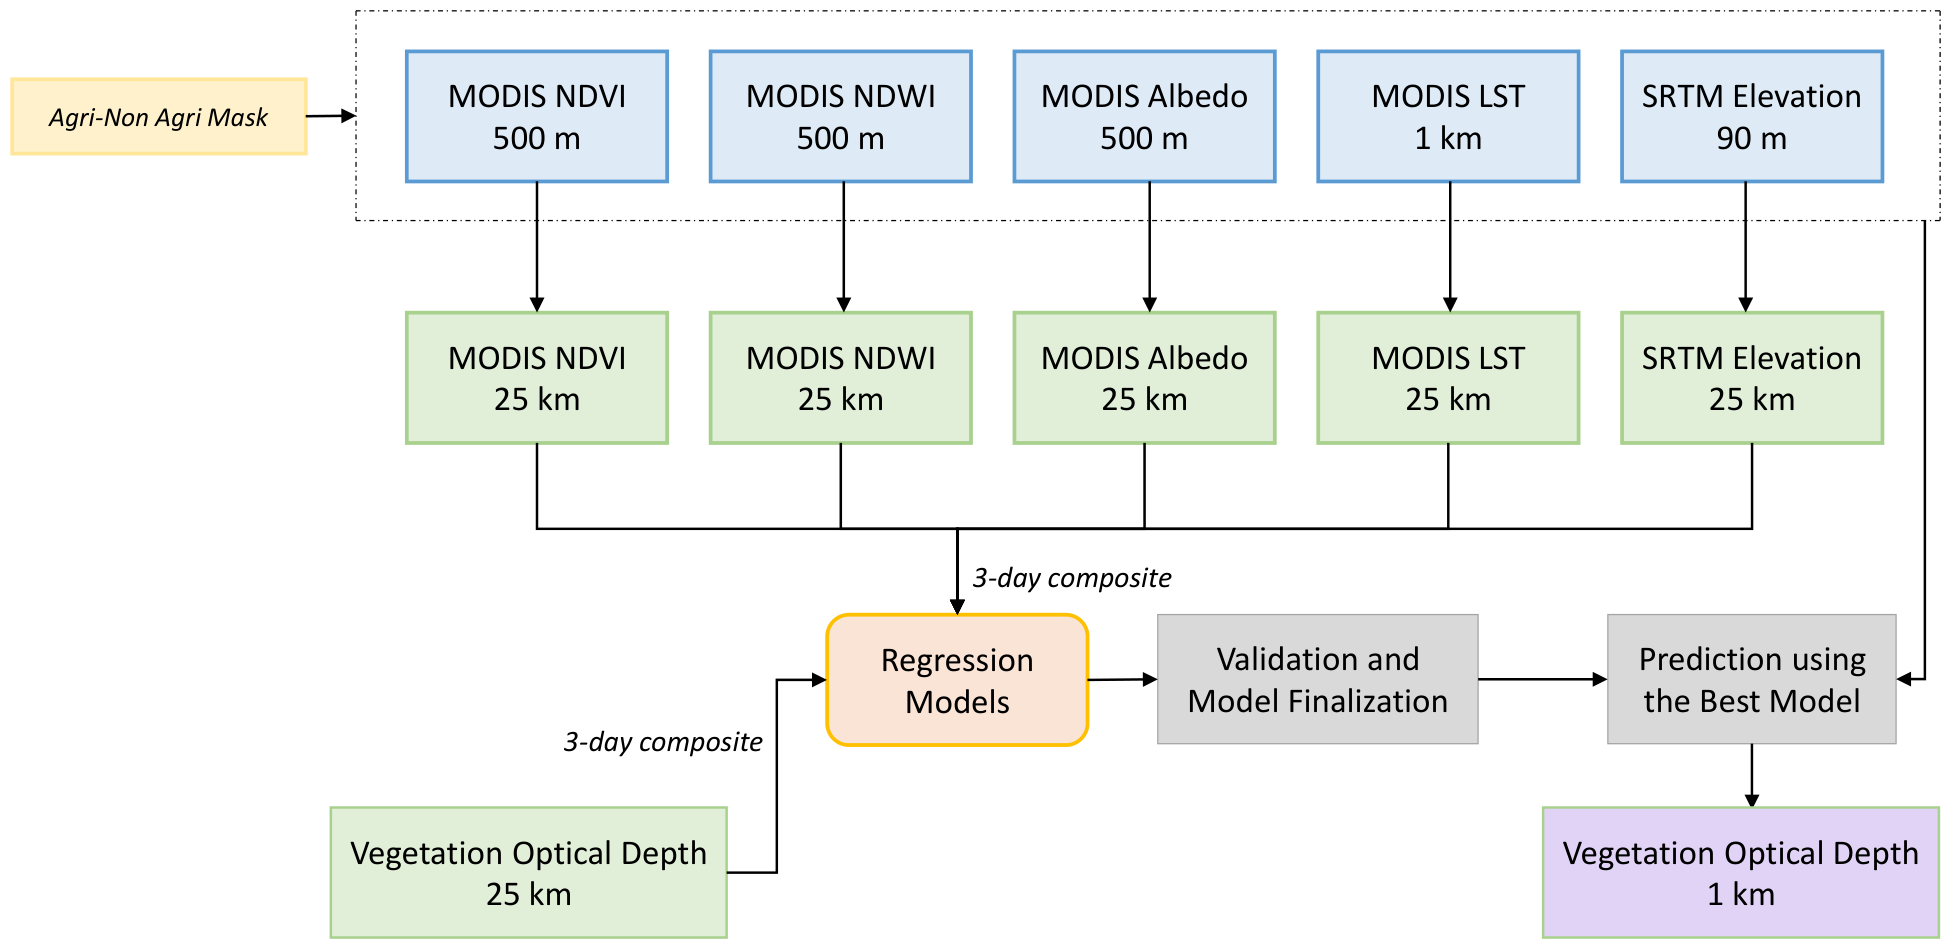
All these statistical relationships show that optical indices can be used as proxies to disaggregate VOD at improved spatial resolution. Nevertheless, few studies (e.g., Mohite et al. [81], Yan et al. [82]) have approached disaggregation algorithms by using these relationships. Among these studies, Mohite et al. [81] proposed a disaggregation algorithm in India to obtain XVOD at a spatial resolution of 1 km using MODIS optical VIs and Shuttle Radar Topography Mission (SRTM) observations as input for the algorithm. Specifically, besides optical VIs, it uses the Land Surface Temperature (LST) and albedo from MODIS at 1km, and elevation data from SRTM at 90 m. After masking and extracting non-agriculture pixels and resampling all the variables to 25 km, it evaluated different regression models (e.g., Random Forest, Support Vector) to obtain VOD at 1 km (see Figure 4). The estimated VOD is correlated with NDVI from Sentinel-2 in a wheat crop, where both variables capture the same trends.

3.1.2. Radar Backscatter

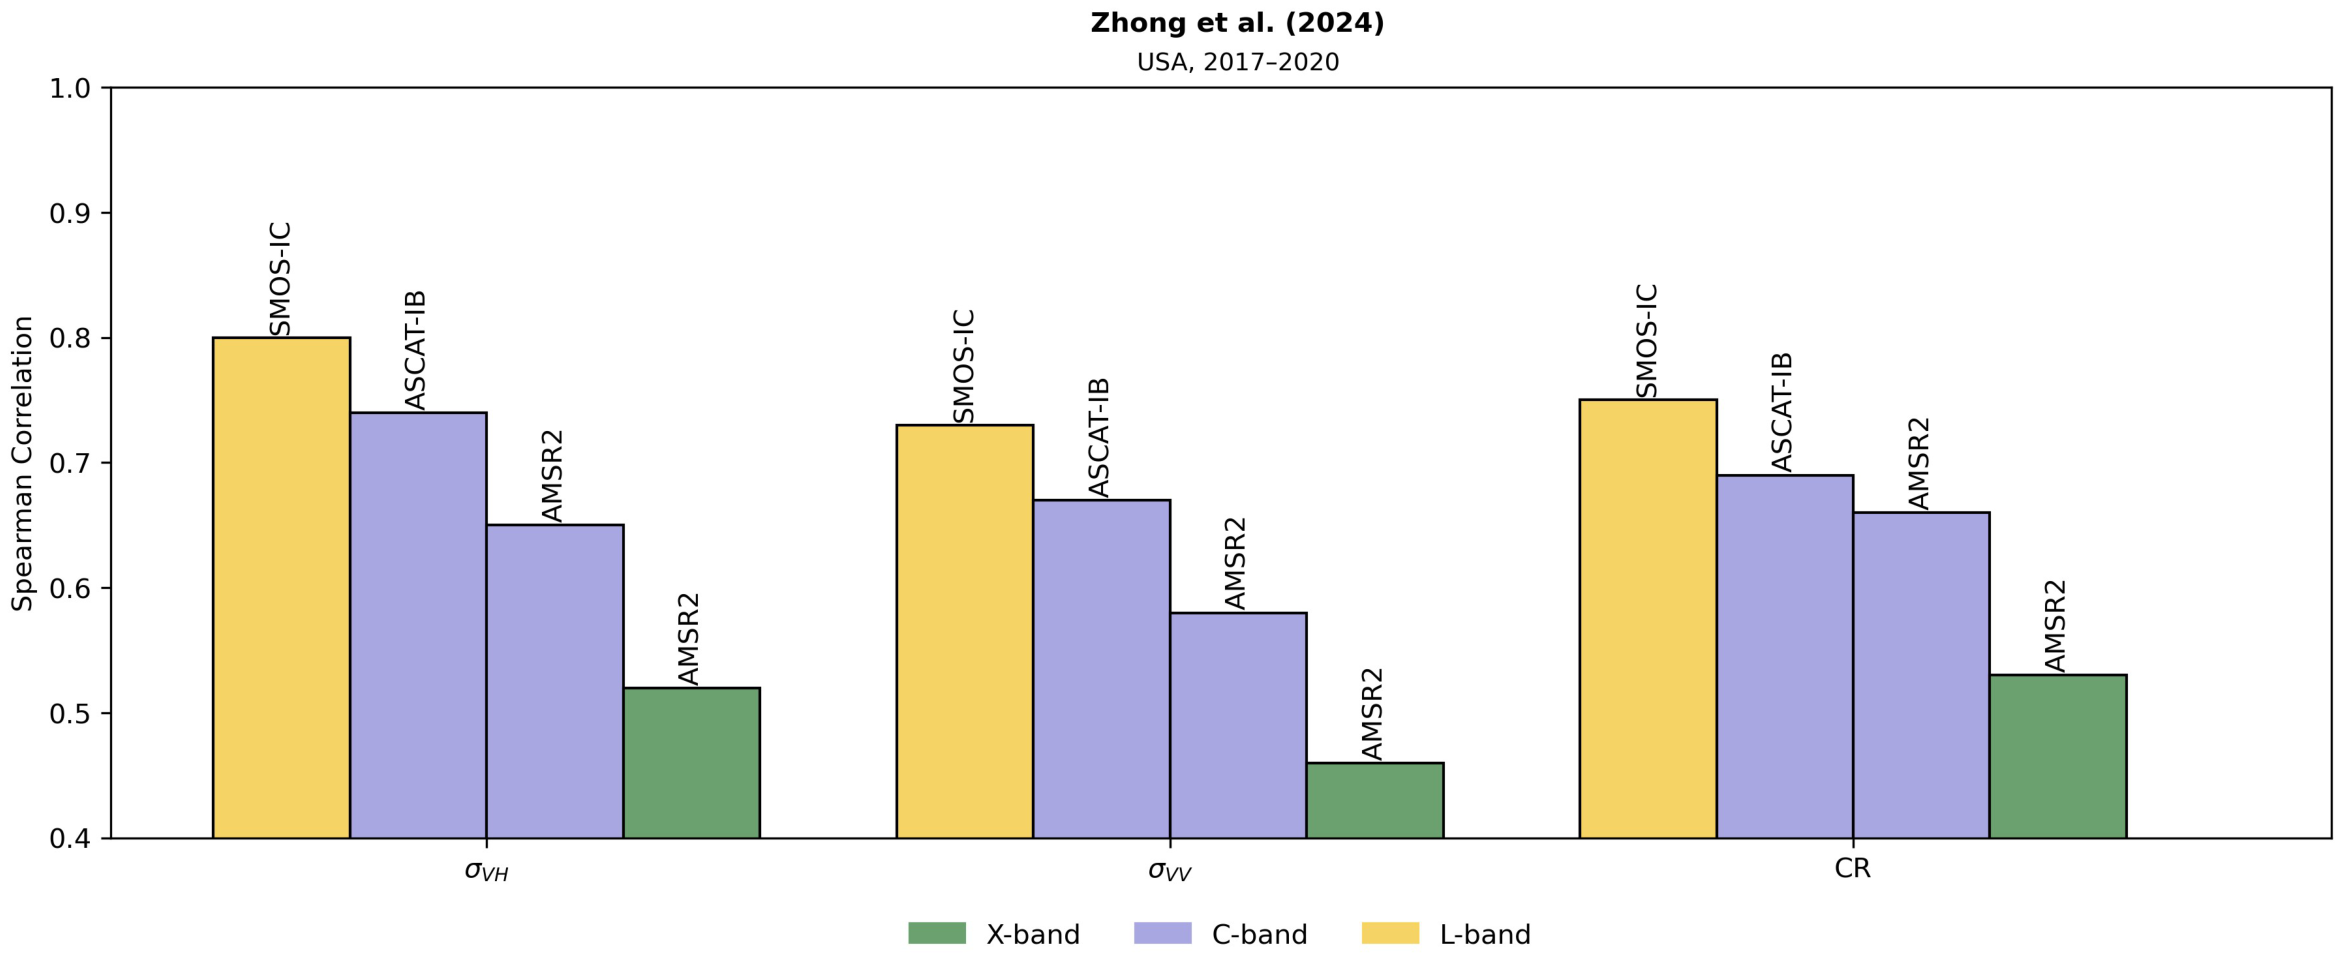
Using optical indices to obtain VOD at higher spatial resolutions exhibits several limitations and gaps. Besides the cloud coverage effects, the optical vegetation indices frequency range may be convenient for VOD disaggregation at high microwave frequencies (e.g., X and Ku bands). However, at low frequencies (e.g., L-band) where optical thickness provides information about different canopy layers, VIs may be necessary but incomplete. Thus, active microwave observations, particularly synthetic aperture radar, with its high sensitivity to vegetation, are a potential proxy for downscaling the coarse-resolution VOD. The high spatial resolution of SARs and the high accuracy and temporal resolution of microwave radiometers can be exploited synergistically to enhance the VOD spatial resolution. In this context, various studies assessed the relationship between VOD and radar backscatter. For instance, L-band radiometer (1.413 GHz) and scatterometer (1.26 GHz) measurements from the Aquarius/Satélite de Aplicaciones Científicas (SAC)-D satellite were used by Rötzer et al. [95] to investigate the relationship between σ HV and VOD at a global scale, finding a linear relationship and that 80% of the variations in VOD are explained by σ HV . Vreugdenhil et al. [96] obtained high spatial and temporal correlations, especially in grasslands and croplands, between Sentinel-1 cross-ratio (CR = σ VH / σ VV ) and active microwave VOD from ASCAT and passive microwave VODCA product over Europe, except for those types of land cover with sparse vegetation and deciduous forests. Likewise, recently Zhong et al. [97] studied the correlation of VOD products at different frequencies (L, C, and X) with active-microwave proxies, particularly, with Sentinel-1 σ VH , σ VV , and CR across the US. Accordingly, the two proxies that showed the strongest spatial relationship with LVOD products were σ VH (R = 0.80) and NDVI (R = 0.77), whereas, in terms of temporal correlation, NDVI had the highest overall performance with all VOD products, although CR and σ VH also demonstrated a good relationship. In contrast to the relationship found with optical indices, LVOD exhibited stronger correlations with radar-derived parameters than CVOD and XVOD (see Figure 5). Similar studies are summarized in Figure 5, and, in more detail, in Table S2 (Supplementary Material). Despite these relationships, no algorithms that utilize radar vegetation parameters at fine and medium resolutions for VOD downscaling have been proposed.

3.1.3. Other Potential Variables for VOD Downscaling

Apart from optical and radar proxies, VOD has shown a significant relationship with various vegetation indicators derived from LiDAR technology, which can be leveraged to advance the development of downscaled VOD datasets. For instance, VOD from SMOS L2 v700 and the maximum above-ground height of the canopy (RH100) from the Global Ecosystem Dynamics Investigation (GEDI) instrument demonstrated a robust monthly spatial correlation (R > 0.8) over a one-year analysis in tropical regions [98]. Further, the cumulative distribution properties showed a significant physical relationship between the two parameters [98]. Although with slightly lower spatial correlations, similar results were observed when substituting RH100 with the GEDI Plant Area Index (PAI) parameter, defined as half of the area of all elements composing the canopy structure divided by the unit ground surface [98]. Konings et al. [48] also compared LiDAR-derived canopy height from the Geoscience Laser Altimeter System (GLAS) with the estimated SMAP VOD, showing that the temporal average of the global VOD has a strong positive correspondence to the LiDAR canopy height estimates. Given these findings and noting that different spaceborne LiDARs have led to medium-high resolution global vegetation height maps [99,100,101], it would be reasonable to use vertical height and explore other LiDAR-derived vegetation metrics to downscale VOD.
Beyond its relationship with other vegetation indicators, VOD also demonstrated connections with environmental and topographic variables. For example, to estimate the effect of temperature on VOD variations, Zhao et al. [102] found a significant impact of temperature on the seasonality of VOD in the X band, particularly at higher latitudes. Similarly, Schwank et al. [103] determined that VOD in the L-band is typically maximal around 0 °C and decreases toward negative and positive temperatures in boreal forests. This temperature-dependent behavior was associated with the freezing of tree sap water and the temperature sensitivity of the dielectric permittivity of the water. On the other hand, from a topographic standpoint, the strong conditioning effect of altitude on vegetation characteristics was reflected in significant VOD variability across different altitudinal ranges [104]. The inclusion of these parameters in downscaling methods, in addition to vegetation proxies, could allow for more precise VOD estimations, particularly in regions with pronounced topographic and significant climatic gradients.

3.2. VOD Estimation Derived from Disaggregated Brightness Temperatures

In addition to the relationship results between various vegetation indicators and VOD products, some approaches have also focused on downscaling the spatial resolution of brightness temperatures as an intermediate step to disaggregate radiometric variables. Specifically, the aim of most brightness temperature disaggregation studies has been focused on enhancing the spatial resolution of SM. However, as VOD and SM are obtained concurrently when employing certain retrieval algorithms (e.g., MT-DCA, SMOS-IC), most of the research can be leveraged for VOD disaggregation purposes. As a result, the disaggregation of brightness temperatures can also be seen as a step toward VOD downscaling. In particular, this section focuses on active–passive algorithms and multifrequency data fusion techniques, two of the most common brightness temperature disaggregation methods.

3.2.1. Active–Passive Algorithms

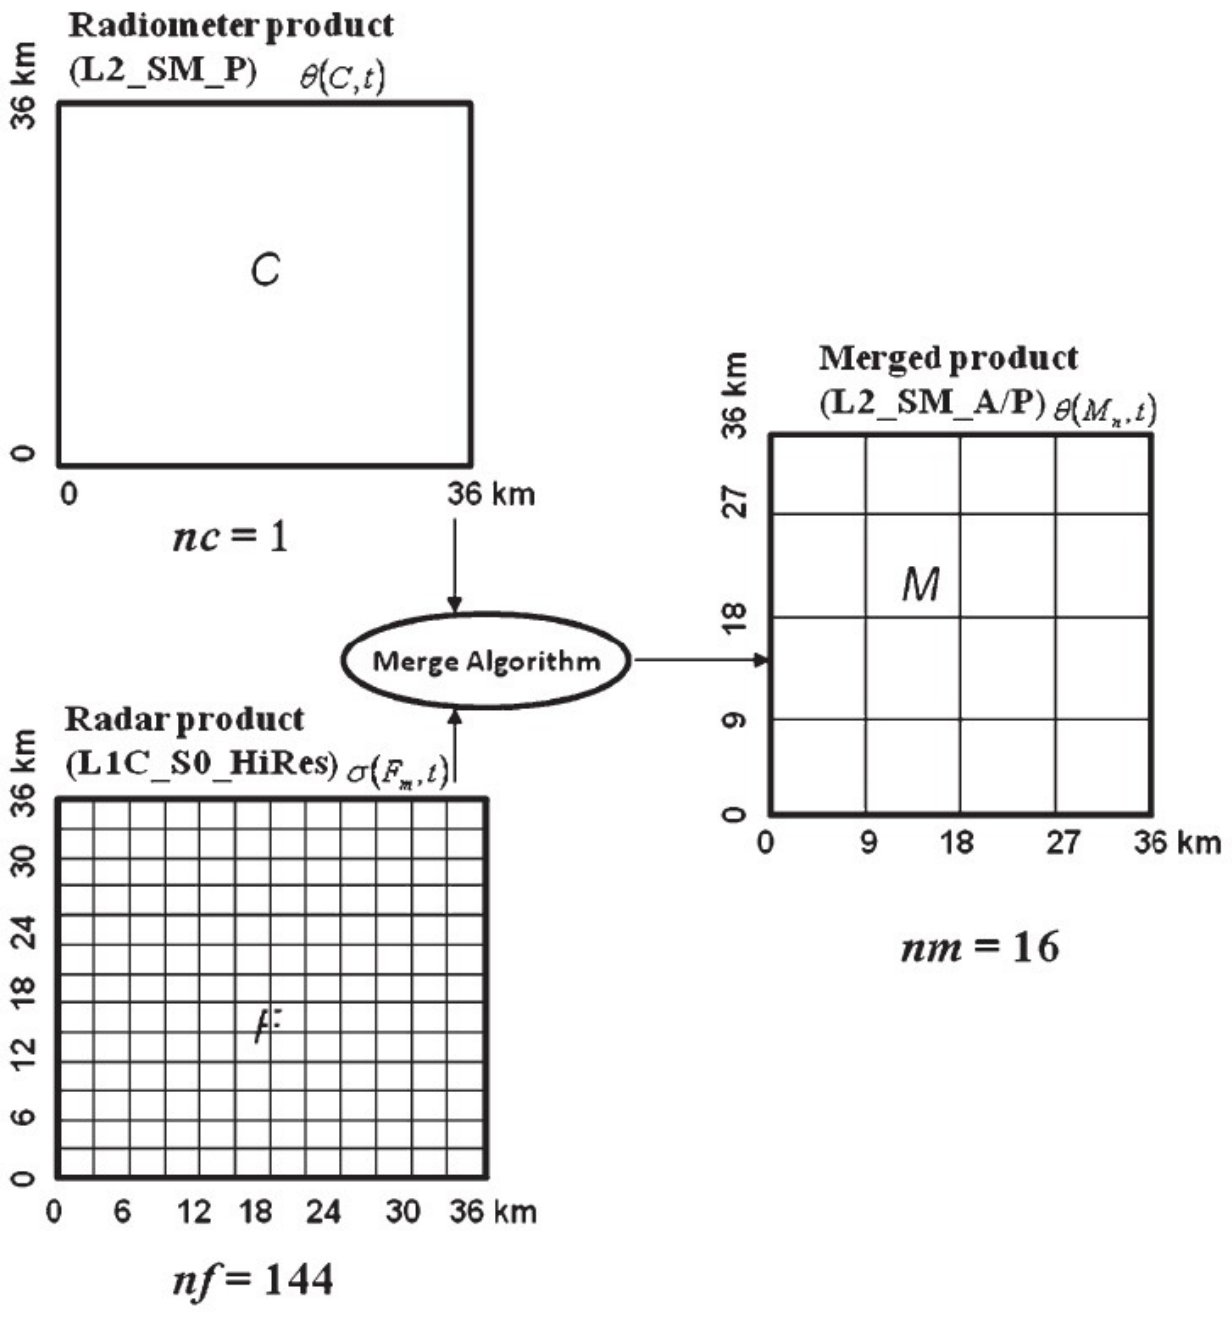
To tackle the inherent limitations of passive and active observations, one method to disaggregate radiometer-based brightness temperatures has been to employ spatial patterns of landscape characteristics inferred from SAR backscatter. Indeed, this constituted the baseline of the SMAP active–passive downscaling algorithm [37,105,106], which disaggregates brightness temperatures from a coarse-resolution (36 km) grid into a medium-resolution grid (9 km) using radar backscatter at 3 km. The algorithm is based on the assumption of a near-linear relationship between the radar backscatter and the radiometer brightness temperatures (see Figure 6). The algorithm equation is given by (3):
T B p ( M j ) = T B p ( C ) + β ( C ) { ( σ pp ( M j ) σ pp ( C ) ) + Γ · ( σ pq ( C ) σ pq ( M j ) ) }
where p and q represent the polarization (V or H), M and C are the medium (9 km) and coarse (36 km) grid cells, respectively, and β(C) is the radiometer grid scale (C) conversion factor that relates the co-polarization backscatter variations to those of brightness temperature. The Γ parameter depends on the vegetation and surface roughness heterogeneity and is determined by linear regression of spatial co-polarization and cross-polarization at the M scale within each C cell. The algorithm performance was tested with the Passive and Active L-band System (PALS) data and the simulated SMAP datasets, thus implementing Equation (3) to obtain the disaggregated brightness temperatures, and afterward, the single channel algorithm to retrieve SM. By using data collected from the Soil Moisture Active Passive Experiments (SMAPEx) in South-Eastern Australia, Wu et al. [107] tested the algorithm across a wide range of land conditions, obtaining an average RMSE in the downscaled TBs of 3.1 K and 2.6 K for V, and H polarizations, respectively, and 8.2 K and 6.6 K when applied at 1 km resolution. Similarly, Leroux et al. [108] evaluated the algorithm using data collected from multiple airplane campaigns. They found that when radar data are combined with radiometer measurements, SM retrievals over different types of cropland are more accurate, demonstrating that the active–passive approach improves temporal correlation and decreases random errors. On the other hand, some studies have estimated SM based on a radar-radiometer change detection method. For instance, Piles et al. [109] proposed an SM downscaling algorithm to retrieve SM at 10 km, assuming that SM and the log of radar backscatter are linearly related at a 10 km scale, and that the variation on vegetation type occurs principally at scales larger than 10 km. These assumptions were verified using PALS data from the SMEX02 field campaign. When applying the method to four-month Observation System Simulation Experiment (OSSE) data, results showed better performance than those from radiometer-only inversions.
Beyond these methods, other downscaling techniques that combine active and passive synergy have been investigated. For example, Wang et al. [110] proposed a SMAP TBs disaggregation method to retrieve SM at a high spatial resolution by using the surface scattering component extracted from polarimetric RADARSAT-2. Compared to the conventional backscattering coefficient, the surface scattering component showed a closer relationship with TBs, while being less influenced by vegetation features. Zhan et al. [111] integrated the 36 km radiometer brightness temperature with noisy 3 km radar backscatter observations using a Bayesian approach. Using Hydros OSSE data sets, this method yielded better SM retrievals than conventional numerical inversions of radar or radiometer-only observations.
Despite these advances, the vast majority of studies employing brightness-temperature disaggregation and active–passive microwave synergies have focused on SM downscaling, with VOD generally treated as an ancillary variable within SM retrieval algorithms. A recent study, however, demonstrated the feasibility of generating 1 km L-band VOD by integrating Sentinel-1 backscatter and SMOS brightness temperatures within an active–passive downscaling framework [84]. The resulting product showed strong agreement with independent vegetation indicators, including NDVI and aboveground biomass, captured finer spatial details than the original SMOS-IC L-VOD product, and successfully captured vegetation responses to hydroclimatic disturbances, including a delayed response to prolonged precipitation deficits. Nevertheless, this work represents one of the first dedicated demonstrations of active–passive VOD retrieval and was evaluated within a specific regional setting. Consequently, the applicability and generalizability of active–passive downscaling approaches for VOD remain considerably less explored than for SM. Further research is therefore needed to assess how these methodologies perform across different environments and to critically examine whether the assumptions originally developed for SM retrieval can be adapted when VOD is treated as the primary retrieval target.

3.2.2. Multifrequency Data Fusion Techniques

Another alternative to improve the spatial resolution of TBs is based on multifrequency data fusion techniques. The Smoothing Filter-based Intensity Modulation technique (SFIM) proposed by Liu [112] is one of the most widely used image fusion methods. As channels operating at higher frequencies have a smaller footprint than those of lower frequencies, thus providing a better spatial resolution, the SFIM technique uses the data at higher-frequency channels to downscale the low-spatial resolution provided by lower-frequency channels. Even though it was applied initially to multispectral images and panchromatic data [112], this technique has been extended to microwave data to retrieve several geophysical variables. For instance, considering the Ka-band and L-band as the high- and low-frequency bands, respectively, the technique consists of two main steps: (1) aggregation of the Ka-band TBs to the coarse spatial resolution of the L-band, and (2) application of the SFIM processing equation given by (4) to obtain the disaggregated TBs at the L-band. Santi [113] was one of the first studies to apply this technique using microwave data. The study proposed an algorithm derived from the SFIM technique to disaggregate the AMSR-E’s C-band brightness temperature from approximately 50 km resolution to 10 km by utilizing the Ka-band’s high spatial resolution. The algorithm was tested over different land cover (e.g., water, ice, and dense vegetation), preserving brightness temperatures collected over uniform areas and allowing the identification of different surface features in mixed pixels.
T B L h i g h = T B L l o w T B K a h i g h T B K a l o w
The forthcoming Copernicus Imaging Microwave Radiometer (CIMR), which will simultaneously carry sensors operating at bands L, C, X, Ku, and Ka, presents new opportunities to apply multifrequency data fusion approaches. In a recent study, Zhang et al. [114] investigated the feasibility of improving the spatial resolution of the CIMR L-band measurements (<60 km) by synergistically combining them with higher-resolution C-band observations (<15 km) through footprint overlap analysis. By means of a linear regression model, and using existing SMAP (L-band) and AMSR2 (C-band) brightness temperature datasets, a global-scale analysis was conducted to assess the C-band’s usefulness for L-band resolution sharpening. The analysis highlighted the potential of the C-band to contribute valuable spatial information that enhances L-band observations and underscored the importance of future CIMR multifrequency capabilities for generating products at different scales.
Nonetheless, only a few studies have taken a step forward and retrieved SM and VOD products from those disaggregated brightness temperatures by exploiting the SFIM and other data fusion techniques. For example, in Parinussa et al. [115], a microwave radiometer SM was obtained at 10 × 10 km over the Iberian Peninsula after using the SFIM approach to downscale the TBs and apply the LPRM retrieval algorithm. The resulting SM was compared to active microwave, thermal infrared, and in situ SM measurements, showing good agreement for approximately 40% of the study area. Similarly, Gevaert et al. [83] presented a VOD and SM resolution enhancement over Australia by applying the SFIM technique to the C-band AMSR-E brightness temperatures, and then using the LPRM as the retrieval algorithm. To evaluate the VOD retrieved, NDVI and VOD anomalies were compared temporally and spatially. High temporal correlations (R = 0.78) were observed in most of Australia, except for some regions with lakes, coastal and dense vegetation, while in terms of spatial correlation, coastal regions showed increases in correlation, except for some inland regions where spatial correlations decreased.

4. Validation Methods of Disaggregated VOD Products

Validation of satellite-derived products is critical to quantify their uncertainties and ensure their adequacy for subsequent use. However, obtaining VOD reference measurements to ensure analytical comparison with satellite-based VOD estimations poses significant challenges. While numerous SM in situ validation networks have been deployed across various countries, leading to significant collaborative efforts, such as the International Soil Moisture Network (ISMN), in situ validation of satellite-derived VOD has been scarce. Aside from that, SM has been the primary focus of the scientific community thus far; the lack of VOD in situ networks is largely attributable to the instruments’ costs and the challenges related to the Relative Water Content (RWC) and biomass in situ measurements [116,117]. Rather, VOD has been compared with in situ measurements of VWC (e.g., [118]), modeled values of the same variable [119], AGB (e.g., [8]), and Live Fuel Moisture Content (LFMC) (e.g., [120]), each yielding varied insights on the VOD. However, these in situ measurements are available at a point spatial scale (<1 m) [117], which hinders an accurate comparison with a satellite-derived 36 km pixel, especially in heterogeneous land covers. Ahead of these constraints, most of the satellite-derived VOD retrievals have been assessed exclusively by investigating spatial and temporal correlations with other satellite-derived vegetation indicators considered as a benchmark.
At large scales, these existing validation methods are the most viable and practical to assess the quality of the downscaled VOD. However, future disaggregated VOD products might take advantage of promising techniques. Among these, field-based GNSS sensors have emerged as a promising technique that can serve for VOD validation purposes. With this technique, VOD is estimated at high spatial resolution (hundred-meter scales), and timescale (e.g., hourly measurements) [117], exhibiting high correlations with leaf water potential [57], and in situ VWC measurements [121]. Alongside the GNSS-based techniques, land surface models integrating plant hydraulic schemes have also emerged as a potential method for VOD validation, being implemented by several studies [122,123]. These models use empirical parameterizations to characterize the resistance of some parts of the plant’s vascular system and the gradients of soil and plant water potentials in addition to the atmospheric vapor pressure deficit, thus simulating water movement along the soil, the plant components, and the atmosphere [117,122,123]. These methods provide VOD estimations at spatial scales over 10 km [117], and then could be used to assess the quality of satellite VOD data, but also as information sources for potential downscaling of VOD. For more details on these emerging methods, the reader is referred to studies such as [57,117,122,123], among others.

5. Conclusions and Future Directions

Satellite VOD data with relevant spatial resolution can significantly facilitate the monitoring of biomass and water stress at small scales. Except for certain plot-scale approaches at specific locations and interpolation methods, little research has been conducted on it compared to other geophysical variables, such as SM. The primary objective of most approaches has been to determine the best spatial and temporal proxies of VOD for use in subsequent potential VOD downscaling algorithms. However, to date, VOD downscaling algorithms are scarce. Several proxies have been evaluated to downscale VOD, outlining several conclusions and key considerations to take into account. First, considering the distinct aspects of vegetation structure and water content captured by VOD across different frequency bands, the proxy selection strategy must be adapted accordingly for each frequency. Second, common proxies correlate differently depending on the characteristics and dynamics of the land cover. Thus, it is important to select downscaling proxies that more accurately reflect the local relationships between VOD and vegetation characteristics. Based on the literature reviewed, NDVI tends to show higher spatial correlations with VOD at C and X bands than at L band, suggesting that, alongside other optical VIs, they hold important relevance when aiming to downscale VOD at C and X bands. However, these correlations depend strongly on land cover characteristics and vegetation density. Thus, as in regions with sparse vegetation, signal sensitivity could remain relatively consistent across bands, in dense vegetation, the correlation between optical VIs and VOD—particularly at L-band—can decline markedly. Interestingly, despite being retrieved at the same frequency band, NDVI, EVI, and LAI exhibited stronger correlations with passive VOD products than with active ones, underscoring the greater reliability of passive retrievals as a reference framework. When radar-based proxies were evaluated, σ VH emerges as the radar proxy that tends to show better spatial correlation with VOD. In particular, VOD at L-band exhibits higher spatial correlation when compared to CVOD and XVOD from both active and passive products, emphasizing the radar’s structural sensitivity, even at C-band. Further, L-band VOD and LiDAR vegetation height demonstrated not only an empirical, but also a physical relationship with VOD [124]. Thus, as VOD at C and X band may rely more on optical indices, given its sensitivity to vertical vegetation structure, downscaling of L-band VOD may rely more heavily on LiDAR proxies such as PAI and RH100 parameters. However, the operational use of LiDAR data at global scale remains constrained by current limitations in spatial and temporal coverage, sampling density, and data continuity. These constraints limit their direct applicability for fully global and routinely updated downscaling products. Future developments aimed at harmonizing multi-mission LiDAR observations and integrating them with complementary globally available datasets will be essential to fully exploit their potential in operational VOD downscaling frameworks.
Apart from vegetation proxies, given the established influence of climatic and topographic conditions on VOD, it is necessary to integrate these variables to reflect the ecological context and refine spatial patterns. Therefore, it is relevant to incorporate parameters such as land surface temperature, rainfall, SM, evapotranspiration, and elevation of the terrain to estimate more accurate and realistic products. Despite the demonstrated relevance of these candidate predictors, strong statistical relationships with VOD alone do not guarantee their suitability for downscaling. Instead, these candidate predictors should be evaluated within the complete downscaling framework, where their contribution depends on the modelling approach, their interaction with other predictors, and the environmental conditions in which the model is applied.
On the one hand, more research is required in several directions when comparing VOD products. First, as VOD retrieved at a similar frequency and land cover must theoretically be the same independently of the remote sensing technique used, significant discrepancies have been observed when contrasting, for instance, VOD derived from radar and radiometry data [97]. Therefore, additional evaluation is necessary to identify the most reliable VOD. Likewise, further investigation is crucial to assess the uncertainties of VODs retrieved at the same frequencies, but from distinct missions or retrieval algorithms, as most of these VODs serve as benchmarks for prospective downscaled VOD products. In addition, whereas VOD from microwave radiometer observations has been inferred at multiple frequencies (e.g., L, C, and X bands), from radar observations it has commonly been inferred only at C-band. Hence, the assessment of radar-derived VOD and its insights at different frequencies remains to be further investigated, particularly in light of forthcoming L-band radar missions such as the Radar Observing System for Europe (ROSE-L), and the synthetic aperture radar of the NASA-ISRO SAR Mission (NISAR). Alongside the P-band BIOMASS mission, these radar missions can significantly improve downscaling methods and retrieval accuracy by refining and validating the assumptions used in passive microwave radiative transfer models to derive VOD. For instance, given dual-pol L-band SAR (σHH and σHV) high sensitivity and characterization of the surface roughness, it will be practical to derive high-resolution dynamic roughness maps from NISAR/ROSE-L to replace the usual static roughness assumptions in passive VOD retrieval models, enabling a more realistic representation of surface dynamics driven by agricultural practices and weather variability [125]. Additionally, as VOD retrievals are derived from models assuming a homogeneous vegetation layer, by using backscatter ratios, Radar Vegetation Index (RVI), and polarimetric decomposition—surface scattering (e.g., soil), volume scattering (e.g., leaves and branches), double bounce (e.g., trunks)—these P- and L-band missions could provide valuable insights on vegetation height, orientation, and structure. Indeed, retrieving these vegetation properties could complement VOD and improve retrieval accuracy, particularly in heterogeneous, structurally complex canopies. Furthermore, the limited availability of active microwave VOD products arises not only from data availability but also from the challenges inherent to active microwave retrieval algorithms. In particular, continued refinement of semi-empirical models, including improved representations of radar scattering and parameter calibration, is essential for advancing enhanced-resolution VOD retrievals.
Although GNSS-R and GNSS-T studies have demonstrated their potential for characterizing vegetation water content, most existing studies remain focused on demonstrating the sensitivity of GNSS signals to vegetation conditions rather than developing scalable VOD retrieval or downscaling frameworks. A major challenge for their broader application is the limited availability of spatially and temporally consistent observations. Ground-based GNSS-T approaches can provide valuable local measurements but are restricted by the distribution of receiver networks and therefore cannot currently provide spatially representative observations at regional or global scales. Satellite-based GNSS-R observations provide a larger spatial domain; however, available missions still have limitations in terms of coverage, observation frequency, and continuity. For example, considering CYGNSS’s limited tropical coverage and the spatial gaps present in its daily observations, future multifrequency multi-GNSS constellations are expected to provide more extensive coverage and improved spatial resolution observations of surface features [126]. Therefore, future research should also consider how the capabilities of upcoming GNSS-R missions can be incorporated to advance VOD downscaling. In particular, ESA’s HydroGNSS mission is expected to broaden coverage into higher latitudes [127], which can aid in research on boreal freeze–thaw dynamics and their implications for VOD retrieval in permafrost regions with vegetation and improve downscaling performance in these areas [94].
On the other hand, despite limited studies on VOD retrievals from disaggregated brightness temperatures, forthcoming Earth Observation missions utilizing various frequency bands may provide a significant opportunity for exploiting the SFIM technique and estimating VOD at better spatial resolution. Specifically, the CIMR mission, scheduled for launch by 2030, is designed to operate across five spectral bands (L, C, X, K and Ka bands), offering multiresolution observation capabilities, and an improved temporal revisit frequency (capable of >95% global coverage of all Earth surfaces every day) [114,128]. In addition to maintaining L-band continuity with established missions like SMAP and SMOS, CIMR’s unique combination of multifrequency capability will offer two key advantages for uncertainty reduction when aiming to apply data fusion techniques. First, simultaneous measurements across all spectral bands at consistent local times (6:00 AM/PM) will minimize temporal collocation errors. Further, the minimal variation in observation zenith angle between bands (52.0° ± 1° for L-band and 55.0° ± 2° for C, X, K, and Ka bands) will significantly reduce the effect of angular dependence [114,128]. However, these downscaling methods rely on the preservation of spatial patterns across bands. Thus, as each frequency is sensitive to different vegetation and soil properties, this assumption may not hold in practice, which could lead to artifacts in the downscaled product. Therefore, it is critical to examine the spatial characteristics of VOD at both the original and downscaled resolutions to ensure that the downscaled product preserves physical relevance [129].
Another critical consideration is related to the temporal resolution at which downscaled VOD products are generated. When larger timescales are targeted (e.g., monthly), short-term variability is generally less influential. However, for shorter timescales (e.g., sub-daily), VOD estimates can be significantly affected by soil–vegetation thermal equilibrium assumptions and by diurnal fluctuations linked to vegetation water stress and transpiration processes. These factors can substantially bias hydrological processes and vegetation water stress responses, thereby limiting the accuracy and interpretation of VOD downscaled measurements. Hence, when aiming to derive VOD at higher spatial resolution and short timescales, the methodology must avoid merging multisensor datasets (e.g., proxies, multifrequency datasets) with differing overpass times. Instead, it is advisable, to the extent possible, to employ time-aligned auxiliary datasets and explore diurnal correction models to account for the VOD diurnal variability.
Based on the evidence and discussion presented throughout this review, the main research priorities for advancing VOD downscaling can be summarized as follows:
  • Comprehensive uncertainty assessment of VOD products derived from different missions, frequencies, and retrieval algorithms to establish reliable benchmarks for future high-resolution products.
  • Standardized validation and benchmarking frameworks for the objective comparison of VOD retrieval and downscaling methods.
  • Extension of radar-derived VOD retrievals at L-band, leveraging upcoming missions such as ROSE-L and NISAR.
  • Further refinement of semi-empirical and physically based retrieval models, including improved scattering representations and parameter calibration.
  • Conducting future research leveraging forthcoming missions, such as CIMR, to develop next-generation VOD downscaling approaches that combine multi-frequency microwave observations with advanced modelling techniques to improve the accuracy, spatial detail, and temporal continuity of VOD products.

Supplementary Materials

The following supporting information can be downloaded at https://www.mdpi.com/article/10.3390/rs18152530/s1, Table S1: Overview of various spatial and temporal correlations found between optical indices and VOD products in several studies; Table S2: Overview of various spatial and temporal correlations found between radar vegetation coefficients and VOD products in several studies.

Author Contributions

Conceptualization, M.E.-K.-R., G.P., C.L.-M., M.V.-l., A.A.-G., D.C. and A.C.; methodology, M.E.-K.-R., G.P., C.L.-M., D.C. and M.V.-l.; investigation, M.E.-K.-R., G.P. and D.C.; resources, C.L.-M. and M.V.-l.; writing—original draft preparation, M.E.-K.-R. and G.P.; writing—review and editing, M.E.-K.-R., G.P., C.L.-M., M.V.-l., D.C., A.A.-G. and A.C.; visualization, C.L.-M., M.V.-l., D.C., A.A.-G. and A.C.; supervision, C.L.-M., M.V.-l., A.C., A.A.-G. and D.C.; project administration, C.L.-M. and M.V.-l.; funding acquisition, C.L.-M. and M.V.-l. All authors have read and agreed to the published version of the manuscript.

Funding

This work was supported by the project PID2023-149659OBC22 funded by MCIU/AEI/10.78113039/501100011033/FEDER, UE. D. Chaparro has been funded by the projects ‘la Caixa’ Junior 782Leader Fellowship LCF/BQ/PI25/12100008 (lead: D. Chaparro) and LCF/BQ/PI23/11970013 (lead: 783O. Binks) as well as by the H2020 FORGENIUS project (#862221).

Data Availability Statement

No new data were created or analyzed in this study. Data sharing is not applicable to this article.

Conflicts of Interest

The authors declare no conflicts of interest.

Abbreviations

AdaBoostAdaptive Boosting
AMSR-EAdvanced Microwave Scanning Radiometer for EOS (Earth Observing System)
AGBAbove Ground Biomass
AVHRRAdvanced Very High Resolution Radiometer
BRCSBistatic Radar Cross Section
C/N0Carrier-to-Noise
CRCross-Ratio
CyGNSSCyclone GNSS
DCADual Channel Algorithm
ETExtreme Randomized Tree
EVIEnhanced Vegetation Index
FSSCatFederated Satellite Systems/3Cat-5
GBDTGradient Boosting Decision Tree
GEDIGlobal Ecosystem Dynamics Investigation
GLASGeoscience Laser Altimeter System
GNSS-RGlobal Navigation Satellite System—Reflectometry
GNSS-TGlobal Navigation Satellite System— Transmissometry
HydrosNASA’s Earth System Science Pathfinder Hydrospheric States
LAILeaf Area Index
LiDARLight Detection And Ranging
LPRMLand Parameter Retrieval Model
LMEBL-band Microwave Emission Biosphere
LSTLand Surface Temperature
MPDIMicrowave Polarization Difference Index
MODISModerate-resolution Imaging Spectroradiometer
MTDCAMultitemporal Dual Channel Algorithm
NDVINormalized Difference Vegetation Index
NDWINormalized Difference Water Index
OSSEObservation System Simulation Experiment
PAIPlant Area Index
PLASPassive and Active L-band System
RFIRadio-Frequency Interference
RMSERoot Mean Square Error
RVIRadar Vegetation Index
SARSynthetic Aperture Radar
SCASingle Channel Algorithm
SFIMSmoothing Filter-based Intensity Modulation
SMSoil Moisture
SMAPSoil Moisture Active Passive
SMAPExSoil Moisture Active Passive Experiments
SMEX02Soil Moisture Experiments in 2002
SMOSSoil Moisture and Ocean Salinity
SMMRScanning Multichannel Microwave Radiometer
SNRSignal-to-Noise Ratio
SoOpSignals of Opportunity
SSM/ISpecial Sensor Microwave/Imager
SVMSupport Vector Machine
TBBrightness Temperature
TDS-1TechDemoSat-1
TMITRMM Microwave Imager
TRMMTropical Rainfall Measuring Mission
VODVegetation Optical Depth
VIVegetation Indices
VWCVegetation Water Content

References

  1. Senf, C.; Buras, A.; Zang, C.S.; Rammig, A.; Seidl, R. Excess forest mortality is consistently linked to drought across Europe. Nat. Commun. 2020, 11, 6200. [Google Scholar] [PubMed]
  2. Ruffault, J.; Limousin, J.M.; Pimont, F.; Dupuy, J.L.; De Càceres, M.; Cochard, H.; Mouillot, F.; Blackman, C.J.; Torres-Ruiz, J.M.; Parsons, R.A.; et al. Plant hydraulic modelling of leaf and canopy fuel moisture content reveals increasing vulnerability of a Mediterranean forest to wildfires under extreme drought. New Phytol. 2023, 237, 1256–1269. [Google Scholar] [PubMed]
  3. Huang, J.; Wang, H.; Dai, Q.; Han, D. Analysis of NDVI Data for Crop Identification and Yield Estimation. IEEE J. Sel. Top. Appl. Earth Obs. Remote Sens. 2014, 7, 4374–4384. [Google Scholar] [CrossRef] [Scilit]
  4. Lenny Wall, D.L.; Léger, P. The early explanatory power of NDVI in crop yield modelling. Int. J. Remote Sens. 2008, 29, 2211–2225. [Google Scholar] [CrossRef] [Scilit]
  5. Petersen, L.K. Real-time prediction of crop yields from MODIS relative vegetation health: A continent-wide analysis of Africa. Remote Sens. 2018, 10, 1726. [Google Scholar] [CrossRef] [Scilit]
  6. Wang, S.; Zhang, L.; Huang, C.; Qiao, N. An NDVI-based vegetation phenology is improved to be more consistent with photosynthesis dynamics through applying a light use efficiency model over boreal high-latitude forests. Remote Sens. 2017, 9, 695. [Google Scholar] [CrossRef] [Scilit]
  7. Frappart, F.; Wigneron, J.P.; Li, X.; Liu, X.; Al-Yaari, A.; Fan, L.; Wang, M.; Moisy, C.; Le Masson, E.; Aoulad Lafkih, Z.; et al. Global monitoring of the vegetation dynamics from the Vegetation Optical Depth (VOD): A review. Remote Sens. 2020, 12, 2915. [Google Scholar] [CrossRef] [Scilit]
  8. Tian, F.; Brandt, M.; Liu, Y.Y.; Verger, A.; Tagesson, T.; Diouf, A.A.; Rasmussen, K.; Mbow, C.; Wang, Y.; Fensholt, R. Remote sensing of vegetation dynamics in drylands: Evaluating vegetation optical depth (VOD) using AVHRR NDVI and in situ green biomass data over West African Sahel. Remote Sens. Environ. 2016, 177, 265–276. [Google Scholar] [CrossRef] [Scilit]
  9. Chaparro, D.; Duveiller, G.; Piles, M.; Cescatti, A.; Vall-Llossera, M.; Camps, A.; Entekhabi, D. Sensitivity of L-band vegetation optical depth to carbon stocks in tropical forests: A comparison to higher frequencies and optical indices. Remote Sens. Environ. 2019, 232, 111303. [Google Scholar] [CrossRef] [Scilit]
  10. Tucker, C.J. Red and photographic infrared linear combinations for monitoring vegetation. Remote Sens. Environ. 1979, 8, 127–150. [Google Scholar] [CrossRef] [Scilit]
  11. Ulaby, F.T.; Moore, R.K.; Fung, A.K. Microwave Remote Sensing: Active and Passive. Volume 1—Microwave Remote Sensing Fundamentals and Radiometry. 1981. Available online: https://teams.public.onecdn.static.microsoft/evergreen-assets/safelinks/2/atp-safelinks.html (accessed on 2 July 2026).
  12. Olivares-Cabello, C.; Chaparro, D.; Vall-llossera, M.; Camps, A.; López-Martínez, C. Global unsupervised assessment of multifrequency vegetation optical depth sensitivity to vegetation cover. IEEE J. Sel. Top. Appl. Earth Obs. Remote Sens. 2022, 16, 538–552. [Google Scholar]
  13. Momen, M.; Wood, J.D.; Novick, K.A.; Pangle, R.; Pockman, W.T.; McDowell, N.G.; Konings, A.G. Interacting effects of leaf water potential and biomass on vegetation optical depth. J. Geophys. Res. Biogeosci. 2017, 122, 3031–3046. [Google Scholar] [CrossRef] [Scilit]
  14. Du, J.; Kimball, J.S.; Jones, L.A.; Kim, Y.; Glassy, J.; Watts, J.D. A global satellite environmental data record derived from AMSR-E and AMSR2 microwave Earth observations. Earth Syst. Sci. Data 2017, 9, 791–808. [Google Scholar] [CrossRef] [Scilit]
  15. Jones, M.O.; Jones, L.A.; Kimball, J.S.; McDonald, K.C. Satellite passive microwave remote sensing for monitoring global land surface phenology. Remote Sens. Environ. 2011, 115, 1102–1114. [Google Scholar] [CrossRef] [Scilit]
  16. Tong, X.; Tian, F.; Brandt, M.; Liu, Y.; Zhang, W.; Fensholt, R. Trends of land surface phenology derived from passive microwave and optical remote sensing systems and associated drivers across the dry tropics 1992–2012. Remote Sens. Environ. 2019, 232, 111307. [Google Scholar] [CrossRef] [Scilit]
  17. Chaparro, D.; Piles, M.; Vall-Llossera, M.; Camps, A.; Konings, A.G.; Entekhabi, D. L-band vegetation optical depth seasonal metrics for crop yield assessment. Remote Sens. Environ. 2018, 212, 249–259. [Google Scholar] [CrossRef] [Scilit]
  18. Hornbuckle, B.K.; Patton, J.C.; VanLoocke, A.; Suyker, A.E.; Roby, M.C.; Walker, V.A.; Iyer, E.R.; Herzmann, D.E.; Endacott, E.A. SMOS optical thickness changes in response to the growth and development of crops, crop management, and weather. Remote Sens. Environ. 2016, 180, 320–333. [Google Scholar] [CrossRef] [Scilit]
  19. Zhang, X.; Zhang, X.; Terfa, B.K.; Nam, W.H.; Zeng, J.; Ma, H.; Gu, X.; Du, W.; Wang, C.; Yang, J.; et al. Mapping global drought-induced forest mortality based on multiple satellite vegetation optical depth data. Remote Sens. Environ. 2024, 315, 114406. [Google Scholar] [CrossRef] [Scilit]
  20. Boulton, C.A.; Lenton, T.M.; Boers, N. Pronounced loss of Amazon rainforest resilience since the early 2000s. Nat. Clim. Change 2022, 12, 271–278. [Google Scholar] [CrossRef] [Scilit]
  21. Dou, Y.; Tian, F.; Wigneron, J.P.; Tagesson, T.; Du, J.; Brandt, M.; Liu, Y.; Zou, L.; Kimball, J.S.; Fensholt, R. Reliability of using vegetation optical depth for estimating decadal and interannual carbon dynamics. Remote Sens. Environ. 2023, 285, 113390. [Google Scholar] [CrossRef] [Scilit]
  22. Mialon, A.; Rodríguez-Fernández, N.J.; Santoro, M.; Saatchi, S.; Mermoz, S.; Bousquet, E.; Kerr, Y.H. Evaluation of the sensitivity of SMOS L-VOD to forest above-ground biomass at global scale. Remote Sens. 2020, 12, 1450. [Google Scholar] [CrossRef] [Scilit]
  23. Vittucci, C.; Laurin, G.V.; Tramontana, G.; Ferrazzoli, P.; Guerriero, L.; Papale, D. Vegetation optical depth at L-band and above ground biomass in the tropical range: Evaluating their relationships at continental and regional scales. Int. J. Appl. Earth Obs. Geoinf. 2019, 77, 151–161. [Google Scholar] [CrossRef] [Scilit]
  24. Bousquet, E.; Mialon, A.; Rodriguez-Fernandez, N.; Mermoz, S.; Kerr, Y. SMOS L-VOD shows that post-fire recovery of dense forests is slower than what is depicted with X-and C-VOD and optical indices. Biogeosci. Discuss. 2021, 2021, 1–31. [Google Scholar]
  25. Pablos, M.; Portal, G.; Camps, A.; Vall-Llossera, M.; López-Martínez, C. Two Disaggregation Algorithms to Estimate Soil Moisture at Moderate (1 km and 300 m) and at High Resolution (60 m): Applications over the North of Africa. In Proceedings of the 2024 IEEE Mediterranean and Middle-East Geoscience and Remote Sensing Symposium (M2GARSS); IEEE: Piscataway, NJ, USA, 2024; pp. 401–405. [Google Scholar]
  26. Portal, G.; Vall-Llossera, M.; Piles, M.; Camps, A.; Chaparro, D.; Pablos, M.; Rossato, L. A spatially consistent downscaling approach for SMOS using an adaptive moving window. IEEE J. Sel. Top. Appl. Earth Obs. Remote Sens. 2018, 11, 1883–1894. [Google Scholar] [CrossRef] [Scilit]
  27. Merlin, O.; Walker, J.P.; Chehbouni, A.; Kerr, Y. Towards deterministic downscaling of SMOS soil moisture using MODIS derived soil evaporative efficiency. Remote Sens. Environ. 2008, 112, 3935–3946. [Google Scholar] [CrossRef] [Scilit]
  28. Schmugge, T.J.; Jackson, T.J. A dielectric model of the vegetation effects on the microwave emission from soils. IEEE Trans. Geosci. Remote Sens. 1992, 30, 757–760. [Google Scholar] [CrossRef] [Scilit]
  29. Mo, T.; Choudhury, B.; Schmugge, T.; Wang, J.R.; Jackson, T. A model for microwave emission from vegetation-covered fields. J. Geophys. Res. Ocean. 1982, 87, 11229–11237. [Google Scholar] [CrossRef] [Scilit]
  30. Feldman, A.F.; Akbar, R.; Entekhabi, D. Characterization of higher-order scattering from vegetation with SMAP measurements. Remote Sens. Environ. 2018, 219, 324–338. [Google Scholar] [CrossRef] [Scilit]
  31. Li, X.; Al-Yaari, A.; Schwank, M.; Fan, L.; Frappart, F.; Swenson, J.; Wigneron, J.P. Compared performances of SMOS-IC soil moisture and vegetation optical depth retrievals based on Tau-Omega and Two-Stream microwave emission models. Remote Sens. Environ. 2020, 236, 111502. [Google Scholar] [CrossRef] [Scilit]
  32. Wigneron, J.P.; Jackson, T.; O’neill, P.; De Lannoy, G.; de Rosnay, P.; Walker, J.; Ferrazzoli, P.; Mironov, V.; Bircher, S.; Grant, J.; et al. Modelling the passive microwave signature from land surfaces: A review of recent results and application to the L-band SMOS & SMAP soil moisture retrieval algorithms. Remote Sens. Environ. 2017, 192, 238–262. [Google Scholar] [CrossRef] [Scilit]
  33. Wigneron, J.P.; Kerr, Y.; Waldteufel, P.; Saleh, K.; Escorihuela, M.J.; Richaume, P.; Ferrazzoli, P.; De Rosnay, P.; Gurney, R.; Calvet, J.C.; et al. L-band Microwave Emission of the Biosphere (L-MEB) Model: Description and calibration against experimental data sets over crop fields. Remote Sens. Environ. 2007, 107, 639–655. [Google Scholar] [CrossRef] [Scilit]
  34. Kerr, Y.H.; Waldteufel, P.; Richaume, P.; Wigneron, J.P.; Ferrazzoli, P.; Mahmoodi, A.; Al Bitar, A.; Cabot, F.; Gruhier, C.; Juglea, S.E.; et al. The SMOS soil moisture retrieval algorithm. IEEE Trans. Geosci. Remote Sens. 2012, 50, 1384–1403. [Google Scholar] [CrossRef] [Scilit]
  35. Al Bitar, A.; Mialon, A.; Kerr, Y.H.; Cabot, F.; Richaume, P.; Jacquette, E.; Quesney, A.; Mahmoodi, A.; Tarot, S.; Parrens, M.; et al. The global SMOS Level 3 daily soil moisture and brightness temperature maps. Earth Syst. Sci. Data 2017, 9, 293–315. [Google Scholar] [CrossRef] [Scilit]
  36. Fernandez-Moran, R.; Al-Yaari, A.; Mialon, A.; Mahmoodi, A.; Al Bitar, A.; De Lannoy, G.; Rodriguez-Fernandez, N.; Lopez-Baeza, E.; Kerr, Y.; Wigneron, J.P. SMOS-IC: An alternative SMOS soil moisture and vegetation optical depth product. Remote Sens. 2017, 9, 457. [Google Scholar] [CrossRef] [Scilit]
  37. Entekhabi, D.; Njoku, E.G.; O’Neill, P.E.; Kellogg, K.H.; Crow, W.T.; Edelstein, W.N.; Entin, J.K.; Goodman, S.D.; Jackson, T.J.; Johnson, J.; et al. The Soil Moisture Active Passive (SMAP) Mission. Proc. IEEE 2010, 98, 704–716. [Google Scholar] [CrossRef] [Scilit]
  38. Jackson, T.J., III. Measuring surface soil moisture using passive microwave remote sensing. Hydrol. Process. 1993, 7, 139–152. [Google Scholar] [CrossRef] [Scilit]
  39. Konings, A.G.; McColl, K.A.; Piles, M.; Entekhabi, D. How many parameters can be maximally estimated from a set of measurements? IEEE Geosci. Remote Sens. Lett. 2015, 12, 1081–1085. [Google Scholar] [CrossRef] [Scilit]
  40. Van de Griend, A.A.; Wigneron, J.P. The b-factor as a function of frequency and canopy type at H-polarization. IEEE Trans. Geosci. Remote Sens. 2004, 42, 786–794. [Google Scholar] [CrossRef] [Scilit]
  41. O’Neill, P.; Bindlish, R.; Chan, S.; Njoku, E.; Jackson, T. Algorithm Theoretical Basis Document. Level 2 & 3 Soil Moisture (Passive) Data Products; Jet Propulsion Laboratory, California Institute of Technology: Pasadena, CA, USA, 2018. [Google Scholar]
  42. Chan, S.; Bindlish, R.; Hunt, R.; Jackson, T.; Kimball, J. Soil Moisture Active Passive (SMAP) Ancillary Data Report: Vegetation Water Content; Jet Propulsion Laboratory, California Institute of Technology: Pasadena, CA, USA, 2013. [Google Scholar]
  43. Njoku, E.G.; Li, L. Retrieval of land surface parameters using passive microwave measurements at 6–18 GHz. IEEE Trans. Geosci. Remote Sens. 1999, 37, 79–93. [Google Scholar] [CrossRef] [Scilit]
  44. Konings, A.G.; Piles, M.; Rötzer, K.; McColl, K.A.; Chan, S.K.; Entekhabi, D. Vegetation optical depth and scattering albedo retrieval using time series of dual-polarized L-band radiometer observations. Remote Sens. Environ. 2016, 172, 178–189. [Google Scholar] [CrossRef] [Scilit]
  45. Chaubell, M.J.; Yueh, S.H.; Dunbar, R.S.; Colliander, A.; Chen, F.; Chan, S.K.; Entekhabi, D.; Bindlish, R.; O’Neill, P.E.; Asanuma, J.; et al. Improved SMAP dual-channel algorithm for the retrieval of soil moisture. IEEE Trans. Geosci. Remote Sens. 2020, 58, 3894–3905. [Google Scholar] [CrossRef] [Scilit]
  46. Chaubell, J.; Yueh, S.; Entekhabi, D.; Peng, J. Resolution enhancement of SMAP radiometer data using the Backus Gilbert optimum interpolation technique. In Proceedings of the 2016 IEEE International Geoscience and Remote Sensing Symposium (IGARSS); IEEE: Piscataway, NJ, USA, 2016; pp. 284–287. [Google Scholar]
  47. Chaubell, J.; Chan, S.; Dunbar, R.; Peng, J.; Yueh, S. SMAP Enhanced L1C Radiometer Half-Orbit 9 km Ease-Grid Brightness Temperatures, Version 3; NASA National Snow and Ice Data Center Distributed Active Archive Center: Boulder, CO, USA, 2020. [Google Scholar] [CrossRef]
  48. Konings, A.G.; Piles, M.; Das, N.; Entekhabi, D. L-band vegetation optical depth and effective scattering albedo estimation from SMAP. Remote Sens. Environ. 2017, 198, 460–470. [Google Scholar] [CrossRef] [Scilit]
  49. Owe, M.; de Jeu, R.; Walker, J. A methodology for surface soil moisture and vegetation optical depth retrieval using the microwave polarization difference index. IEEE Trans. Geosci. Remote Sens. 2001, 39, 1643–1654. [Google Scholar] [CrossRef] [Scilit]
  50. Meesters, A.G.; De Jeu, R.A.; Owe, M. Analytical derivation of the vegetation optical depth from the microwave polarization difference index. IEEE Geosci. Remote Sens. Lett. 2005, 2, 121–123. [Google Scholar] [CrossRef] [Scilit]
  51. Karthikeyan, L.; Pan, M.; Konings, A.G.; Piles, M.; Fernandez-Moran, R.; Kumar, D.N.; Wood, E.F. Simultaneous retrieval of global scale Vegetation Optical Depth, surface roughness, and soil moisture using X-band AMSR-E observations. Remote Sens. Environ. 2019, 234, 111473. [Google Scholar] [CrossRef] [Scilit]
  52. Karthikeyan, L.; Pan, M.; Wanders, N.; Kumar, D.N.; Wood, E.F. Four decades of microwave satellite soil moisture observations: Part 2. Product validation and inter-satellite comparisons. Adv. Water Resour. 2017, 109, 236–252. [Google Scholar] [CrossRef] [Scilit]
  53. Rodriguez-Alvarez, N.; Munoz-Martin, J.F.; Morris, M. Latest advances in the global navigation satellite system—reflectometry (GNSS-R) field. Remote Sens. 2023, 15, 2157. [Google Scholar] [CrossRef] [Scilit]
  54. Humphrey, V.; Frankenberg, C. Continuous ground monitoring of vegetation optical depth and water content with GPS signals. Biogeosciences 2022, 20, 1789–1811. [Google Scholar]
  55. Ruf, C.; Gleason, S. Spaceborne GNSS-R Bistatic Radar Remote Sensing, CYGNSS, and Future Missions. Proc. IEEE 2025, 114, 308–326. [Google Scholar]
  56. Loria, E.; O’brien, A.; Zavorotny, V.; Downs, B.; Zuffada, C. Analysis of scattering characteristics from inland bodies of water observed by CYGNSS. Remote Sens. Environ. 2020, 245, 111825. [Google Scholar] [CrossRef] [Scilit]
  57. Rodriguez-Alvarez, N.; Bosch-Lluis, X.; Camps, A.; Ramos-Perez, I.; Valencia, E.; Park, H.; Vall-Llossera, M. Vegetation water content estimation using GNSS measurements. IEEE Geosci. Remote Sens. Lett. 2011, 9, 282–286. [Google Scholar]
  58. Camps, A.; Alonso-Arroyo, A.; Park, H.; Onrubia, R.; Pascual, D.; Querol, J. L-band vegetation optical depth estimation using transmitted GNSS signals: Application to GNSS-reflectometry and positioning. Remote Sens. 2020, 12, 2352. [Google Scholar] [CrossRef] [Scilit]
  59. Ghosh, A.; Farhad, M.M.; Boyd, D.; Yadav, S.; Colliander, A.; Cosh, M.H.; Kurum, M. Forest vegetation optical depth mapping using gnss signals at smapvex’22. In Proceedings of the IGARSS 2023—2023 IEEE International Geoscience and Remote Sensing Symposium; IEEE: Piscataway, NJ, USA, 2023; pp. 3237–3240. [Google Scholar]
  60. Rodriguez-Alvarez, N.; Camps, A.; Vall-Llossera, M.; Bosch-Lluis, X.; Monerris, A.; Ramos-Perez, I.; Valencia, E.; Marchan-Hernandez, J.F.; Martinez-Fernandez, J.; Baroncini-Turricchia, G.; et al. Land geophysical parameters retrieval using the interference pattern GNSS-R technique. IEEE Trans. Geosci. Remote Sens. 2010, 49, 71–84. [Google Scholar]
  61. Ghosh, A.; Farhad, M.M.; Hoque, M.E.; Boyd, D.R.; Bourgeau-Chavez, L.; Cosh, M.H.; Colliander, A.; Kurum, M. Estimating Vegetation Optical Depth with Mobile GNSS Transmissiometry in Temperate Forests During SMAPVEX22. IEEE J. Sel. Top. Appl. Earth Obs. Remote Sens. 2025, 18, 6451–6463. [Google Scholar] [CrossRef] [Scilit]
  62. Rodriguez-Alvarez, N.; Monerris, A.; Bosch-Lluis, X.; Camps, A.; Vall-Llossera, M.; Marchan-Hernández, J.F.; Ramos-Pérez, I.; Valencia, E.; Martínez-Fernández, J.; Sanchez-Martin, N.; et al. Soil moisture and vegetation height retrieval using GNSS-R techniques. In Proceedings of the 2009 IEEE International Geoscience and Remote Sensing Symposium; IEEE: Piscataway, NJ, USA, 2009; Volume 3, pp. III-869–III-872. [Google Scholar]
  63. Unwin, M.; Jales, P.; Tye, J.; Gommenginger, C.; Foti, G.; Rosello, J. Spaceborne GNSS-reflectometry on TechDemoSat-1: Early mission operations and exploitation. IEEE J. Sel. Top. Appl. Earth Obs. Remote Sens. 2016, 9, 4525–4539. [Google Scholar] [CrossRef] [Scilit]
  64. Ruf, C.S.; Atlas, R.; Chang, P.S.; Clarizia, M.P.; Garrison, J.L.; Gleason, S.; Katzberg, S.J.; Jelenak, Z.; Johnson, J.T.; Majumdar, S.J.; et al. New ocean winds satellite mission to probe hurricanes and tropical convection. Bull. Am. Meteorol. Soc. 2016, 97, 385–395. [Google Scholar] [CrossRef] [Scilit]
  65. Camps, A.; Munoz-Martin, J.F.; Ruiz-de Azua, J.A.; Fernandez, L.; Perez-Portero, A.; Llavería, D.; Herbert, C.; Pablos, M.; Golkar, A.; Gutiérrez, A.; et al. FSSCat: The Federated Satellite Systems 3 Cat Mission: Demonstrating the capabilities of CubeSats to monitor essential climate variables of the water cycle [Instruments and Missions]. IEEE Geosci. Remote Sens. Mag. 2022, 10, 260–269. [Google Scholar] [CrossRef] [Scilit]
  66. Xu, X.; Yueh, S.; Shah, R.; Hayashi, A. Vegetation optical depth retrieval from CYGNSS data. In Proceedings of the 2021 IEEE International Geoscience and Remote Sensing Symposium IGARSS; IEEE: Piscataway, NJ, USA, 2021; pp. 6407–6410. [Google Scholar]
  67. Bu, J.; Wang, Q.; Li, L.; Zhang, Y.; Liu, X. Combining Spaceborne GNSS-R Data and Ensemble Machine Learning Methods for the Retrieval Vegetation Optical Depth. In Proceedings of the IGARSS 2024—2024 IEEE International Geoscience and Remote Sensing Symposium; IEEE: Piscataway, NJ, USA, 2024; pp. 10616–10619. [Google Scholar]
  68. Zhang, Y.; Bu, J.; Zuo, X.; Yu, K.; Wang, Q.; Huang, W. Vegetation Water Content Retrieval from Spaceborne GNSS-R and Multi-Source Remote Sensing Data Using Ensemble Machine Learning Methods. Remote Sens. 2024, 16, 2793. [Google Scholar] [CrossRef] [Scilit]
  69. Li, Y.; Guan, K.; Gentine, P.; Konings, A.G.; Meinzer, F.C.; Kimball, J.S.; Xu, X.; Anderegg, W.R.; McDowell, N.G.; Martinez-Vilalta, J.; et al. Estimating global ecosystem isohydry/anisohydry using active and passive microwave satellite data. J. Geophys. Res. Biogeosci. 2017, 122, 3306–3321. [Google Scholar] [CrossRef] [Scilit]
  70. Vreugdenhil, M.; Dorigo, W.A.; Wagner, W.; De Jeu, R.A.; Hahn, S.; Van Marle, M.J. Analyzing the vegetation parameterization in the TU-Wien ASCAT soil moisture retrieval. IEEE Trans. Geosci. Remote Sens. 2016, 54, 3513–3531. [Google Scholar] [CrossRef] [Scilit]
  71. Attema, E.; Ulaby, F.T. Vegetation modeled as a water cloud. Radio Sci. 1978, 13, 357–364. [Google Scholar] [CrossRef] [Scilit]
  72. Vreugdenhil, M.; Hahn, S.; Melzer, T.; Bauer-Marschallinger, B.; Reimer, C.; Dorigo, W.A.; Wagner, W. Assessing vegetation dynamics over mainland Australia with Metop ASCAT. IEEE J. Sel. Top. Appl. Earth Obs. Remote Sens. 2017, 10, 2240–2248. [Google Scholar] [CrossRef] [Scilit]
  73. Ulaby, F.T.; Batlivala, P.P.; Dobson, M.C. Microwave backscatter dependence on surface roughness, soil moisture, and soil texture: Part I-bare soil. IEEE Trans. Geosci. Electron. 1978, 16, 286–295. [Google Scholar] [CrossRef] [Scilit]
  74. Liu, X.; Wigneron, J.P.; Fan, L.; Frappart, F.; Ciais, P.; Baghdadi, N.; Zribi, M.; Jagdhuber, T.; Li, X.; Wang, M.; et al. ASCAT IB: A radar-based vegetation optical depth retrieved from the ASCAT scatterometer satellite. Remote Sens. Environ. 2021, 264, 112587. [Google Scholar] [CrossRef] [Scilit]
  75. Liu, X.; Wigneron, J.P.; Frappart, F.; Baghdadi, N.; Zribi, M.; Jagdhuber, T.; Ciais, P.; Li, X.; Wang, M.; Fan, L.; et al. First Retrievals of ASCAT IB VOD (Vegetation Optical Depth) at Global Scale. In Proceedings of the 2021 IEEE International Geoscience and Remote Sensing Symposium IGARSS; IEEE: Piscataway, NJ, USA, 2021; pp. 6403–6406. [Google Scholar]
  76. Liu, X.; Wigneron, J.P.; Wagner, W.; Frappart, F.; Fan, L.; Vreugdenhil, M.; Baghdadi, N.; Zribi, M.; Jagdhuber, T.; Tao, S.; et al. A new global C-band vegetation optical depth product from ASCAT: Description, evaluation, and inter-comparison. Remote Sens. Environ. 2023, 299, 113850. [Google Scholar] [CrossRef] [Scilit]
  77. Quast, R.; Albergel, C.; Calvet, J.C.; Wagner, W. A generic first-order radiative transfer modelling approach for the inversion of soil and vegetation parameters from scatterometer observations. Remote Sens. 2019, 11, 285. [Google Scholar] [CrossRef] [Scilit]
  78. El Hajj, M.; Baghdadi, N.; Wigneron, J.P.; Zribi, M.; Albergel, C.; Calvet, J.C.; Fayad, I. First vegetation optical depth mapping from Sentinel-1 C-band SAR data over crop fields. Remote Sens. 2019, 11, 2769. [Google Scholar] [CrossRef] [Scilit]
  79. Zhou, Z.; Fan, L.; De Lannoy, G.; Liu, X.; Peng, J.; Bai, X.; Frappart, F.; Baghdadi, N.; Xing, Z.; Li, X.; et al. Retrieval of High-Resolution Vegetation Optical Depth from Sentinel-1 Data over a Grassland Region in the Heihe River Basin. Remote Sens. 2022, 14, 5468. [Google Scholar] [CrossRef] [Scilit]
  80. Lu, Z.; Fan, L.; Liu, X.; Bai, X.; Baghdadi, N.; Frappart, F.; Zeng, J.; De Lannoy, G.; Peng, J.; Xing, Z.; et al. Sentinel-1 vegetation optical depth retrievals over the international soil moisture network. Int. J. Digit. Earth 2025, 18, 2555412. [Google Scholar] [CrossRef] [Scilit]
  81. Mohite, J.; Sawant, S.; Pandit, A.; Pappula, S. Spatial Downscaling of Vegetation Optical Depth Using the Modis and Srtm Observations. In Proceedings of the IGARSS 2022—2022 IEEE International Geoscience and Remote Sensing Symposium; IEEE: Piscataway, NJ, USA, 2022; pp. 5870–5873. [Google Scholar]
  82. Yan, H.; Wang, C.; Lu, X. Downscaling of vegetation optical depth based on random forest using vegetation optical depth memory. Remote Sens. Lett. 2025, 16, 717–727. [Google Scholar] [CrossRef] [Scilit]
  83. Gevaert, A.; Parinussa, R.M.; Renzullo, L.J.; van Dijk, A.I.; de Jeu, R.A. Spatio-temporal evaluation of resolution enhancement for passive microwave soil moisture and vegetation optical depth. Int. J. Appl. Earth Obs. Geoinf. 2016, 45, 235–244. [Google Scholar] [CrossRef] [Scilit]
  84. Yang, Q.; Huang, Z.; Guo, B. 1 km L-VOD retrieval from the synergy of Sentinel-1 SAR and SMOS radiometer data for subtropical evergreen vegetation dynamics in China. Ecol. Indic. 2026, 183, 114671. [Google Scholar] [CrossRef] [Scilit]
  85. Querol, J.; Perez, A.; Camps, A. A review of RFI mitigation techniques in microwave radiometry. Remote Sens. 2019, 11, 3042. [Google Scholar] [CrossRef] [Scilit]
  86. Lawrence, H.; Wigneron, J.P.; Richaume, P.; Novello, N.; Grant, J.; Mialon, A.; Al Bitar, A.; Merlin, O.; Guyon, D.; Leroux, D.; et al. Comparison between SMOS Vegetation Optical Depth products and MODIS vegetation indices over crop zones of the USA. Remote Sens. Environ. 2014, 140, 396–406. [Google Scholar] [CrossRef] [Scilit]
  87. Liu, Y.Y.; De Jeu, R.A.; McCabe, M.F.; Evans, J.P.; Van Dijk, A.I. Global long-term passive microwave satellite-based retrievals of vegetation optical depth. Geophys. Res. Lett. 2011, 38. [Google Scholar] [CrossRef] [Scilit]
  88. Grant, J.; Wigneron, J.P.; De Jeu, R.; Lawrence, H.; Mialon, A.; Richaume, P.; Al Bitar, A.; Drusch, M.; Van Marle, M.; Kerr, Y. Comparison of SMOS and AMSR-E vegetation optical depth to four MODIS-based vegetation indices. Remote Sens. Environ. 2016, 172, 87–100. [Google Scholar] [CrossRef] [Scilit]
  89. Kerr, Y.; Jacquette, E.; Al Bitar, A.; Cabot, F.; Mialon, A.; Richaume, P.; Quesney, A.; Berthon, L.; Wigneron, J. CATDS SMOS L3 Soil Moisture Retrieval Processor Algorithm Theoretical Baseline Document (ATBD); CESBIO: Toulouse, France, 2013. [Google Scholar]
  90. Liu, Y.Y.; Van Dijk, A.I.; De Jeu, R.A.; Canadell, J.G.; McCabe, M.F.; Evans, J.P.; Wang, G. Recent reversal in loss of global terrestrial biomass. Nat. Clim. Change 2015, 5, 470–474. [Google Scholar] [CrossRef] [Scilit]
  91. Fan, L.; Wigneron, J.P.; Ciais, P.; Chave, J.; Brandt, M.; Fensholt, R.; Saatchi, S.S.; Bastos, A.; Al-Yaari, A.; Hufkens, K.; et al. Satellite-observed pantropical carbon dynamics. Nat. Plants 2019, 5, 944–951. [Google Scholar] [CrossRef] [Scilit] [PubMed]
  92. Chen, D.; Huang, J.; Jackson, T.J. Vegetation water content estimation for corn and soybeans using spectral indices derived from MODIS near-and short-wave infrared bands. Remote Sens. Environ. 2005, 98, 225–236. [Google Scholar] [CrossRef] [Scilit]
  93. Rodríguez-Fernández, N.J.; Mialon, A.; Mermoz, S.; Bouvet, A.; Richaume, P.; Al Bitar, A.; Al-Yaari, A.; Brandt, M.; Kaminski, T.; Le Toan, T.; et al. An evaluation of SMOS L-band vegetation optical depth (L-VOD) data sets: High sensitivity of L-VOD to above-ground biomass in Africa. Biogeosciences 2018, 15, 4627–4645. [Google Scholar] [CrossRef] [Scilit]
  94. Li, X.; Wigneron, J.P.; Frappart, F.; Fan, L.; Ciais, P.; Fensholt, R.; Entekhabi, D.; Brandt, M.; Konings, A.G.; Liu, X.; et al. Global-scale assessment and inter-comparison of recently developed/reprocessed microwave satellite vegetation optical depth products. Remote Sens. Environ. 2021, 253, 112208. [Google Scholar] [CrossRef] [Scilit]
  95. Rötzer, K.; Montzka, C.; Entekhabi, D.; Konings, A.G.; McColl, K.A.; Piles, M.; Vereecken, H. Relationship between vegetation microwave optical depth and cross-polarized backscatter from multiyear Aquarius observations. IEEE J. Sel. Top. Appl. Earth Obs. Remote Sens. 2017, 10, 4493–4503. [Google Scholar] [CrossRef] [Scilit]
  96. Vreugdenhil, M.; Navacchi, C.; Bauer-Marschallinger, B.; Hahn, S.; Steele-Dunne, S.; Pfeil, I.; Dorigo, W.; Wagner, W. Sentinel-1 cross ratio and vegetation optical depth: A comparison over Europe. Remote Sens. 2020, 12, 3404. [Google Scholar] [CrossRef] [Scilit]
  97. Zhong, S.; Fan, L.; De Lannoy, G.; Frappart, F.; Zeng, J.; Vreugdenhil, M.; Peng, J.; Liu, X.; Xing, Z.; Wang, M.; et al. Quantitative assessment of various proxies for downscaling coarse-resolution VOD products over the contiguous United States. Int. J. Appl. Earth Obs. Geoinf. 2024, 130, 103910. [Google Scholar] [CrossRef] [Scilit]
  98. Vittucci, C.; Guerriero, L.; Ferrazzoli, P.; Richaume, P.; Kerr, Y.H. SMOS L-VOD retrieved by level 2 algorithm and its correlation with GEDI LIDAR products. IEEE J. Sel. Top. Appl. Earth Obs. Remote Sens. 2021, 14, 11870–11878. [Google Scholar] [CrossRef] [Scilit]
  99. Potapov, P.; Li, X.; Hernandez-Serna, A.; Tyukavina, A.; Hansen, M.C.; Kommareddy, A.; Pickens, A.; Turubanova, S.; Tang, H.; Silva, C.E.; et al. Mapping global forest canopy height through integration of GEDI and Landsat data. Remote Sens. Environ. 2021, 253, 112165. [Google Scholar] [CrossRef] [Scilit]
  100. Simard, M.; Pinto, N.; Fisher, J.B.; Baccini, A. Mapping forest canopy height globally with spaceborne lidar. J. Geophys. Res. Biogeosci. 2011, 116, G04021. [Google Scholar] [CrossRef] [Scilit]
  101. Lang, N.; Jetz, W.; Schindler, K.; Wegner, J.D. A high-resolution canopy height model of the Earth. Nat. Ecol. Evol. 2023, 7, 1778–1789. [Google Scholar] [CrossRef] [Scilit] [PubMed]
  102. Zhao, M.; Humphrey, V.; Feldman, A.F.; Konings, A.G. Temperature is likely an important omission in interpreting vegetation optical depth. Geophys. Res. Lett. 2024, 51, e2024GL110094. [Google Scholar] [CrossRef] [Scilit]
  103. Schwank, M.; Kontu, A.; Mialon, A.; Naderpour, R.; Houtz, D.; Lemmetyinen, J.; Rautiainen, K.; Li, Q.; Richaume, P.; Kerr, Y.; et al. Temperature effects on L-band vegetation optical depth of a boreal forest. Remote Sens. Environ. 2021, 263, 112542. [Google Scholar] [CrossRef] [Scilit]
  104. Chaparro Danon, D. Applications of L-Band Missions for Environmental Research. Ph.D. Thesis, Universitat Politècnica de Catalunya, Barcelona, Spain, 2018. [Google Scholar]
  105. Das, N.N.; Entekhabi, D.; Njoku, E.G. An algorithm for merging SMAP radiometer and radar data for high-resolution soil-moisture retrieval. IEEE Trans. Geosci. Remote Sens. 2010, 49, 1504–1512. [Google Scholar] [CrossRef] [Scilit]
  106. Das, N.N.; Entekhabi, D.; Njoku, E.G.; Shi, J.J.; Johnson, J.T.; Colliander, A. Tests of the SMAP combined radar and radiometer algorithm using airborne field campaign observations and simulated data. IEEE Trans. Geosci. Remote Sens. 2013, 52, 2018–2028. [Google Scholar] [CrossRef] [Scilit]
  107. Wu, X.; Walker, J.P.; Das, N.N.; Panciera, R.; Rüdiger, C. Evaluation of the SMAP brightness temperature downscaling algorithm using active–passive microwave observations. Remote Sens. Environ. 2014, 155, 210–221. [Google Scholar] [CrossRef] [Scilit]
  108. Leroux, D.J.; Das, N.N.; Entekhabi, D.; Colliander, A.; Njoku, E.; Jackson, T.J.; Yueh, S. Active–passive soil moisture retrievals during the SMAP validation experiment 2012. IEEE Geosci. Remote Sens. Lett. 2016, 13, 475–479. [Google Scholar] [CrossRef] [Scilit]
  109. Piles, M.; Entekhabi, D.; Camps, A. A change detection algorithm for retrieving high-resolution soil moisture from SMAP radar and radiometer observations. IEEE Trans. Geosci. Remote Sens. 2009, 47, 4125–4131. [Google Scholar] [CrossRef] [Scilit]
  110. Wang, H.; Magagi, R.; Goïta, K.; Colliander, A. Multi-resolution soil moisture retrievals by disaggregating SMAP brightness temperatures with RADARSAT-2 polarimetric decompositions. Int. J. Appl. Earth Obs. Geoinf. 2022, 115, 103114. [Google Scholar] [CrossRef] [Scilit]
  111. Zhan, X.; Houser, P.R.; Walker, J.P.; Crow, W.T. A method for retrieving high-resolution surface soil moisture from hydros L-band radiometer and radar observations. IEEE Trans. Geosci. Remote Sens. 2006, 44, 1534–1544. [Google Scholar] [CrossRef] [Scilit]
  112. Liu, J. Smoothing filter-based intensity modulation: A spectral preserve image fusion technique for improving spatial details. Int. J. Remote Sens. 2000, 21, 3461–3472. [Google Scholar] [CrossRef] [Scilit]
  113. Santi, E. An application of the SFIM technique to enhance the spatial resolution of spaceborne microwave radiometers. Int. J. Remote Sens. 2010, 31, 2419–2428. [Google Scholar] [CrossRef] [Scilit]
  114. Zhang, M.S.; AlNasser, F.; Piles, M.; Entekhabi, D. Feasibility of L-band Sharpening with C-band using SMAP and AMSR Radiometry Data for Future Application to CIMR. IEEE Trans. Geosci. Remote Sens. 2025, 63, 4403010. [Google Scholar] [CrossRef] [Scilit]
  115. Parinussa, R.; Yilmaz, M.; Anderson, M.; Hain, C.; De Jeu, R. An intercomparison of remotely sensed soil moisture products at various spatial scales over the Iberian Peninsula. Hydrol. Process. 2014, 28, 4865–4876. [Google Scholar] [CrossRef] [Scilit]
  116. Konings, A.G.; Rao, K.; Steele-Dunne, S.C. Macro to micro: Microwave remote sensing of plant water content for physiology and ecology. New Phytol. 2019, 223, 1166–1172. [Google Scholar] [CrossRef] [Scilit] [PubMed]
  117. Feldman, A.F. Emerging methods to validate remotely sensed vegetation water content. Geophys. Res. Lett. 2024, 51, e2024GL110505. [Google Scholar] [CrossRef] [Scilit]
  118. Meyer, T.; Weihermüller, L.; Vereecken, H.; Jonard, F. Vegetation optical depth and soil moisture retrieved from L-band radiometry over the growth cycle of a winter wheat. Remote Sens. 2018, 10, 1637. [Google Scholar] [CrossRef] [Scilit]
  119. Togliatti, K.; Hartman, T.; Walker, V.A.; Arkebauer, T.J.; Suyker, A.E.; VanLoocke, A.; Hornbuckle, B.K. Satellite L–band vegetation optical depth is directly proportional to crop water in the US Corn Belt. Remote Sens. Environ. 2019, 233, 111378. [Google Scholar] [CrossRef] [Scilit]
  120. Fan, L.; Wigneron, J.P.; Xiao, Q.; Al-Yaari, A.; Wen, J.; Martin-StPaul, N.; Dupuy, J.L.; Pimont, F.; Al Bitar, A.; Fernandez-Moran, R.; et al. Evaluation of microwave remote sensing for monitoring live fuel moisture content in the Mediterranean region. Remote Sens. Environ. 2018, 205, 210–223. [Google Scholar] [CrossRef] [Scilit]
  121. Zribi, M.; Motte, E.; Fanise, P.; Zouaoui, W. Low-Cost GPS Receivers for the Monitoring of Sunflower Cover Dynamics. J. Sens. 2017, 2017, 6941739. [Google Scholar] [CrossRef] [Scilit]
  122. Yao, Y.; Humphrey, V.; Konings, A.G.; Wang, Y.; Yin, Y.; Holtzman, N.; Wood, J.D.; Bar-On, Y.; Frankenberg, C. Investigating diurnal and seasonal cycles of Vegetation Optical Depth retrieved from GNSS signals in a broadleaf forest. Geophys. Res. Lett. 2024, 51, e2023GL107121. [Google Scholar] [CrossRef] [Scilit]
  123. Kennedy, D.; Swenson, S.; Oleson, K.W.; Lawrence, D.M.; Fisher, R.; Lola da Costa, A.C.; Gentine, P. Implementing plant hydraulics in the community land model, version 5. J. Adv. Model. Earth Syst. 2019, 11, 485–513. [Google Scholar] [CrossRef] [Scilit]
  124. Baur, M.J.; Jagdhuber, T.; Feldman, A.F.; Chaparro, D.; Piles, M.; Entekhabi, D. Time-variations of zeroth-order vegetation absorption and scattering at L-band. Remote Sens. Environ. 2021, 267, 112726. [Google Scholar] [CrossRef] [Scilit]
  125. Zhang, H.; Shi, Z.; Gao, L.; Sun, Z.; He, B.; Wang, Y.; Wang, H. Improved vegetation optical depth retrievals based on LAI climatology and dynamic surface roughness. Remote Sens. Environ. 2026, 341, 115443. [Google Scholar] [CrossRef] [Scilit]
  126. Jin, S.; Camps, A.; Jia, Y.; Wang, F.; Martin-Neira, M.; Huang, F.; Yan, Q.; Zhang, S.; Li, Z.; Edokossi, K.; et al. Remote sensing and its applications using GNSS reflected signals: Advances and prospects. Satell. Navig. 2024, 5, 19. [Google Scholar] [CrossRef] [Scilit]
  127. Santi, E.; Comite, D.; Dente, L.; Guerriero, L.; Pierdicca, N.; Clarizia, M.P.; Floury, N. Global soil moisture mapping at 5 km by combining GNSS reflectometry and machine learning in view of HydroGNSS. Sci. Remote Sens. 2024, 10, 100177. [Google Scholar] [CrossRef] [Scilit]
  128. Donlon, C.; Galeazzi, C.; Midthassel, R.; Sallusti, M.; Triggianese, M.; Fiorelli, B.; De Paris, G.; Kornienko, A.; Khlystova, I. The Copernicus Imaging Microwave Radiometer (CIMR): Mission Overview and Status. In Proceedings of the IGARSS 2023—2023 IEEE International Geoscience and Remote Sensing Symposium; IEEE: Piscataway, NJ, USA, 2023; pp. 989–992. [Google Scholar]
  129. Pablos, M.; Turiel, A.; Camps, A.; Vall-Llossera, M.; Portabella, M.; González-Haro, C.; Olmedo, E.; López-Martínez, C. Spatial spectra assessment of SMOS soil moisture at different spatial scales. In Proceedings of the IGARSS 2024—2024 IEEE International Geoscience and Remote Sensing Symposium; IEEE: Piscataway, NJ, USA, 2024; pp. 5147–5150. [Google Scholar]
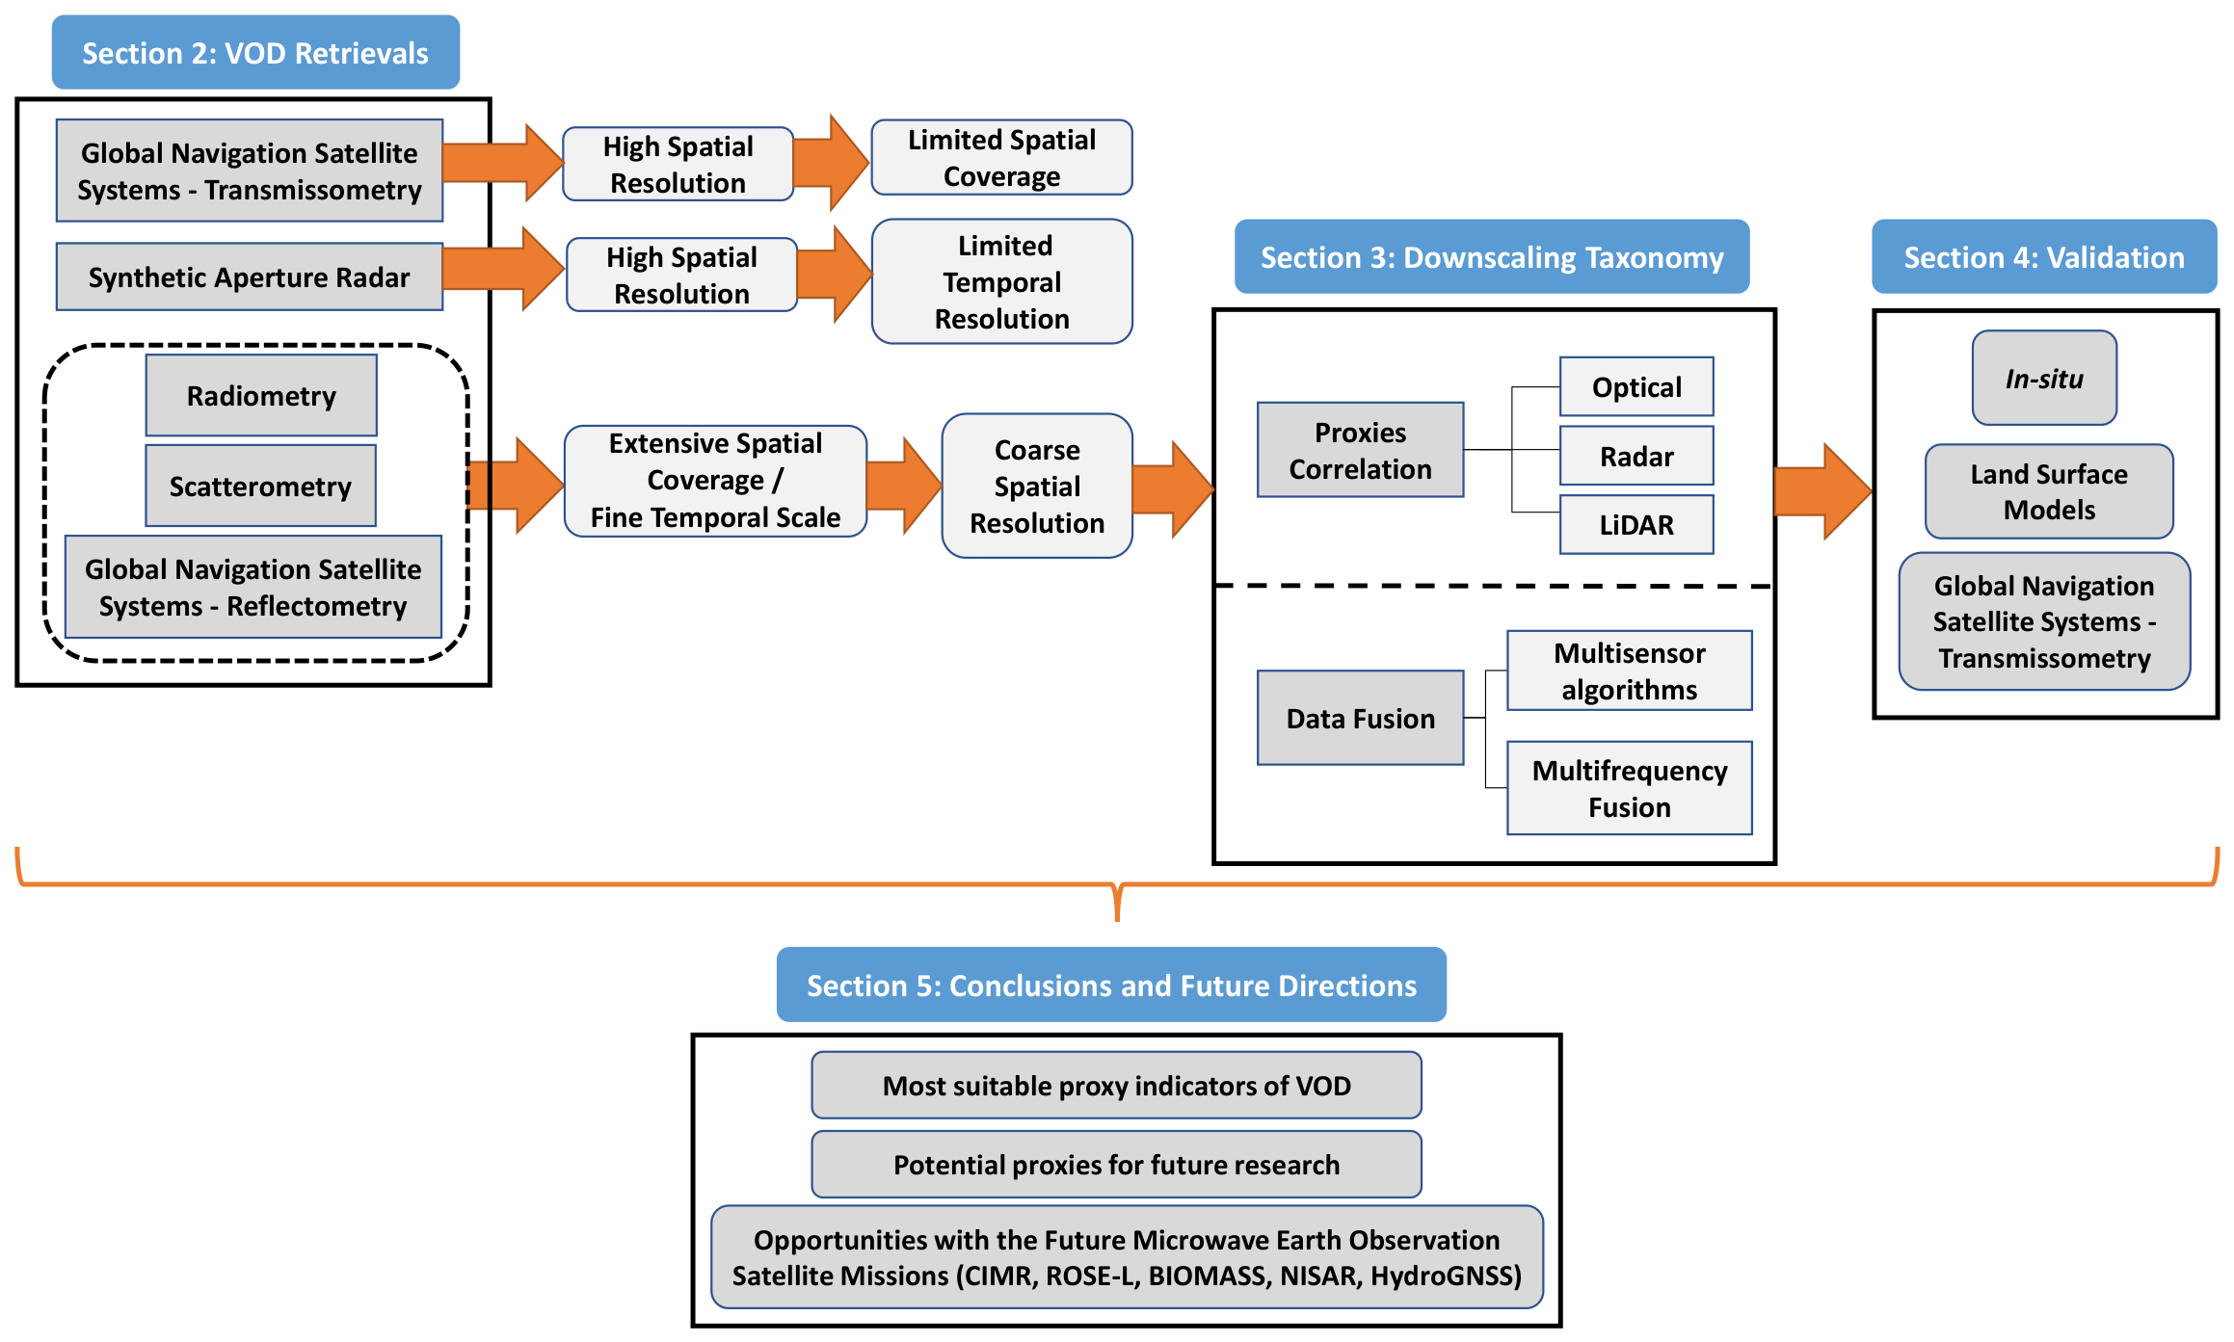
Figure 1. Schematic framework of the review, outlining the review’s core sections and their conceptual progression.
Remotesensing 18 02530 g001
Figure 2. Visual representation of vegetation monitoring using microwave radiometry, radar, spaceborne GNSS-R, and GNSS-T techniques. As microwave radiometers collect the emissions from the soil and the vegetation, radars exploit the backscattering of the emitted signal to infer vegetation properties. In GNSS-T, the differential attenuation is used to infer the canopy attenuation and VOD.
Remotesensing 18 02530 g002
Figure 3. Pearson spatial correlation found between MODIS optical indices and VOD products in several studies. Table S1 (Supplementary Material) highlights the temporal correlations, other correlation types (e.g., Spearman, Kendall), and the precise sensor frequency, among other supporting information. For simplicity, VOD products are categorized into three frequencies (L, C, and X). Certain products, such as VODCA and AMSR-2 LPRM V5, are available at multiple frequencies (C and X). Accordingly, the color of the bars represents the frequency associated with each product. References: Grant et al. [88], Rodríguez-Fernández et al. [93], Li et al. [94].
Remotesensing 18 02530 g003
Figure 4. Algorithm baseline proposed by Mohite et al. [81]. Figure adapted from Mohite et al. [81].
Remotesensing 18 02530 g004
Figure 5. Spearman spatial correlation found between radar parameters and VOD products. Table S2 (Supplementary Material) highlights spatial and temporal correlations of additional studies. Here, for simplicity, VOD products are categorized into three frequencies (L-, C-, and X-band). Note that AMSR-2 LPRM V5 product is available at multiple frequencies (C and X). Accordingly, the color of the bars represents the frequency associated with each product. References: [97].
Remotesensing 18 02530 g005
Figure 6. Grid topology of radiometer, radar, and merged products, where nf and nm are the numbers of area pixels of radar and merged products, respectively, within one radiometer area pixel nc. Figure extracted from Das et al. [105].
Remotesensing 18 02530 g006
Table 1. Overview of published VOD downscaling approaches, with details on input datasets, target resolutions, methodologies approached, and performance assessments. Direct VOD retrieval approaches based on active microwave observations or GNSS-T techniques are not included, as they aim to estimate VOD directly at medium-high spatial resolution rather than downscale existing coarse VOD products.
VOD
Product
Auxiliary
Data
Spatial/Temporal
Resolution
Algorithm
Type
Performance
Assessment
Ref.
XVOD AMSR2MODIS NDVI/NDWI/Albedo/
LST/SRTM Elevation
1 km/3-day compositeMachine LearningCompared with Sentinel-2 NDVI[81]
AMSR-E/AMSR2 VODNDVI/LST/Elevation/
Slope/Lagged VOD/Precipitation
0.01°Machine LearningCompared with NDVI/LAI/EVI[82]
-AMSR-E C/Ka band Brightness Temperature10 km/DailySharpeningCompared with MODIS NDVI[83]
-SMOS L3 Brightness Temperature/Sentinel-1 VV/VH1 km/AnnuallyActive–Passive SynergyCompared with MODIS NDVI/ESA CCI AGB/SMOS-IC[84]
Disclaimer/Publisher’s Note: The statements, opinions and data contained in all publications are solely those of the individual author(s) and contributor(s) and not of MDPI and/or the editor(s). MDPI and/or the editor(s) disclaim responsibility for any injury to people or property resulting from any ideas, methods, instructions or products referred to in the content.