1. Introduction
Land cover classification is a fundamental task in remote sensing, supporting environmental monitoring, urban planning, agricultural assessment, forestry management, and disaster response [
1,
2]. Modern Earth observation missions provide diverse data sources, including optical multispectral imagery and synthetic aperture radar (SAR). Optical imagery, such as Sentinel-2, captures rich spectral information related to vegetation health, soil composition, water bodies, and built environments [
2,
3]. However, optical observations are frequently affected by cloud cover, atmospheric haze, illumination variation, and missing spectral bands, which limit their reliability in operational settings [
1,
2]. In this work, land cover classification is addressed at the patch level: each image patch receives a single scene-level label, which differs from pixel-level semantic segmentation and wall-to-wall land cover mapping. Because the dataset consists of independent patches rather than contiguous scenes, wall-to-wall predicted-classification maps, reference-label maps, and spatial error maps cannot be produced from this distribution; the qualitative patch galleries in
Section 3.6 (including correct and incorrect examples and cross-model comparisons) provide the corresponding visual evidence at the patch level, and spatially explicit mapping is identified as future work.
Synthetic aperture radar (SAR), such as imagery from the Sentinel-1 constellation, offers a complementary observation modality [
4]. SAR operates independently of solar illumination and can penetrate cloud cover, providing structural and surface-scattering information under conditions where optical imagery is unreliable [
4,
5]. However, SAR imagery is affected by speckle noise, is less visually intuitive than optical imagery, and generally provides weaker discriminative performance for fine-grained land cover categories when used alone [
5].
The complementary nature of SAR and optical data has motivated substantial research into multimodal fusion for remote sensing classification [
6,
7]. Different fusion strategies have been applied to fuse SAR and optical data, including early fusion, feature-level fusion, late fusion, attention-based fusion, and confidence-based fusion [
6,
7]. While effective under clean input conditions, simple fusion can be unreliable when one modality is degraded: corrupted optical features may introduce misleading information into the fused representation, sometimes producing worse predictions than using the uncorrupted modality alone.
Optical satellite imagery has been widely used for land cover and land-use classification because multispectral observations capture vegetation response, soil properties, water features, and built-up surface patterns. Reviews of optical remote sensing and Sentinel-2 land cover mapping show that optical data are highly effective for land cover classification due to their spectral richness, spatial resolution, revisit frequency, and broad public availability [
1,
2]. However, optical imagery is inherently sensitive to cloud cover, haze, illumination differences, seasonal variation, missing bands, and sensor-related artifacts. These limitations create a gap between clean benchmark performance and operational reliability, because models trained and evaluated under ideal conditions may behave unpredictably when optical inputs are degraded.
Sentinel-1 synthetic aperture radar provides a complementary observation source because radar acquisitions are less dependent on solar illumination and can provide information under cloudy conditions [
4,
5]. SAR observations capture surface structure, roughness, and scattering properties that are not directly represented in optical imagery. As noted above, these characteristics mean that SAR should not be treated as a simple replacement for optical imagery; its main value lies in complementing optical observations when optical quality is reduced.
Multisource remote sensing fusion has been studied through early fusion, feature-level fusion, decision-level fusion, attention-based fusion, and deep-learning-based multimodal fusion [
6,
7]. Early fusion combines modalities at the input level and is simple to implement, but it can allow degraded optical channels to influence the entire shared representation. Feature-level fusion combines learned SAR and optical representations, which improves flexibility but may still carry unreliable optical features into the fused vector. Decision-level or logit-level fusion preserves modality-specific prediction paths, but fixed or weakly adaptive decision fusion may still be suboptimal because the reliability of each modality can change across images and degradation conditions. More recent work continues this direction with transformer-based SAR-optical fusion [
8], cross-modal feature learning [
9], and multi-scale attention-based fusion networks [
10] for land cover classification, as well as incomplete-multimodal learning that explicitly addresses missing or degraded modalities in remote sensing data fusion [
11].
The relevance of optical-radar fusion for land cover and land-use mapping has also been emphasized in prior review work. Joshi et al. reviewed optical and radar data fusion studies and concluded that the two sensing types provide complementary spectral and structural information for land cover/use analysis [
12]. Schmitt and Zhu further positioned remote sensing data fusion as an increasingly important direction because modern Earth observation systems produce heterogeneous observations that must be combined to exploit their full value [
13]. These findings support the central motivation of the present study: robust land cover classification should not rely on a single sensing modality when complementary SAR and optical information are available.
Large-scale multimodal benchmark datasets further demonstrate the growing importance of paired SAR-optical learning. BigEarthNet-MM, for example, provides paired Sentinel-1 and Sentinel-2 image patches for multimodal multilabel remote sensing image classification and retrieval [
14]. Although the present study uses a smaller four-class dataset derived from SEN12MS, both datasets reflect the same broader research direction: learning from paired radar and optical observations rather than treating each modality independently. The difference is that this study focuses specifically on reliability-aware fusion under degraded optical inputs rather than large-scale multilabel scene retrieval.
Prior multimodal deep-learning studies also show that the stage at which fusion occurs can strongly affect model behavior. Audebert et al. investigated multimodal deep networks for remote sensing and compared fusion strategies, showing that early and late fusion can have different strengths and weaknesses [
15]. This observation is directly relevant to the ablation design in the present study, where feature-level fusion, logit-level fusion, and reliability-aware fusion are compared under clean and degraded optical input conditions. The goal is not only to determine whether multimodal fusion helps, but also to identify which type of fusion remains reliable when one modality is corrupted.
Related SAR-optical cloud-removal studies further demonstrate the practical value of radar-optical complementarity. For example, prior deep learning work has used SAR-optical data fusion to support cloud removal in Sentinel-2 imagery, showing that SAR can provide useful structural information when optical observations are obscured [
16]. Other multisensor cloud-removal studies have emphasized the importance of evaluating models across diverse global and seasonal conditions rather than relying only on narrow controlled cases [
17]. These studies are closely related because they address the problem of degraded optical observations. However, their primary goal is image reconstruction or cloud removal, whereas this study focuses on land cover classification. For classification, the model does not need to reconstruct a cloud-free optical image; it needs to decide how much each modality should be trusted for the final class prediction.
The research gap addressed in this study is therefore the need for a classification-oriented SAR-optical fusion model that explicitly estimates modality reliability under degraded optical conditions. Existing fusion methods can improve clean-input performance, but they may not indicate whether the model is relying on reliable or corrupted information at inference time. The proposed framework addresses this gap by combining modality-specific encoders, auxiliary per-modality classification heads, and a reliability gate that estimates adaptive SAR and optical weights from learned features, prediction confidence, and optical quality descriptors. This design allows the model to preserve the advantages of optical imagery when it is informative while increasing the role of SAR when optical observations become less reliable.
This study proposes a reliability-aware cross-modal fusion framework for patch-level land cover scene classification using paired Sentinel-1 SAR and Sentinel-2 optical imagery. The proposed method learns modality-specific representations through independent convolutional encoders, produces per-modality classification predictions through dedicated heads, and adaptively fuses the predictions through a noise-aware reliability gate. The gate estimates fusion weights from learned feature representations, prediction confidence indicators, and optical-quality features. During training, random optical degradation teaches the gate to detect and respond to input corruption without requiring explicit degradation labels.
The main contributions of this study are:
A noise-aware reliability-guided cross-modal fusion framework that adaptively combines Sentinel-1 SAR and Sentinel-2 optical classification predictions using learned modality confidence and optical-quality indicators.
A controlled robustness evaluation protocol that compares single-modality, early-fusion, feature-level, logit-level, and reliability-aware fusion models under clean and five synthetically degraded optical input conditions, with all the results reported as mean ± standard deviation over five random seeds under deterministic training settings.
A spatially independent scene-held-out evaluation and a qualitative test on real cloud-contaminated imagery, quantifying the gap between random-split and spatially independent performance.
An interpretability and stability analysis of the learned reliability gate, including per-sample weight distributions, per-class weights, correctness-conditioned weights, and an assessment of gate behavior under heavy noise, which is identified as the most seed-sensitive condition.
The remainder of this paper is organized as follows.
Section 2 presents the dataset, the proposed method, and the experimental setup.
Section 3 reports classification and robustness results.
Section 4 discusses the findings and limitations.
Section 5 concludes the paper.
2. Materials and Methods
2.1. Study Design
This study compares single-modality baselines, a simple early-fusion baseline, ablation fusion variants, and the proposed reliability-aware fusion model under both clean and degraded optical inputs. The task addressed here is patch-level scene classification: each 128 × 128 patch receives a single land cover label. Extending the framework to spatially explicit, pixel-level mapping is identified as future work. The primary baselines are a radar-only classifier, an optical-only classifier, and an early-fusion classifier that concatenates SAR and optical channels. To isolate the contribution of the fusion mechanism,
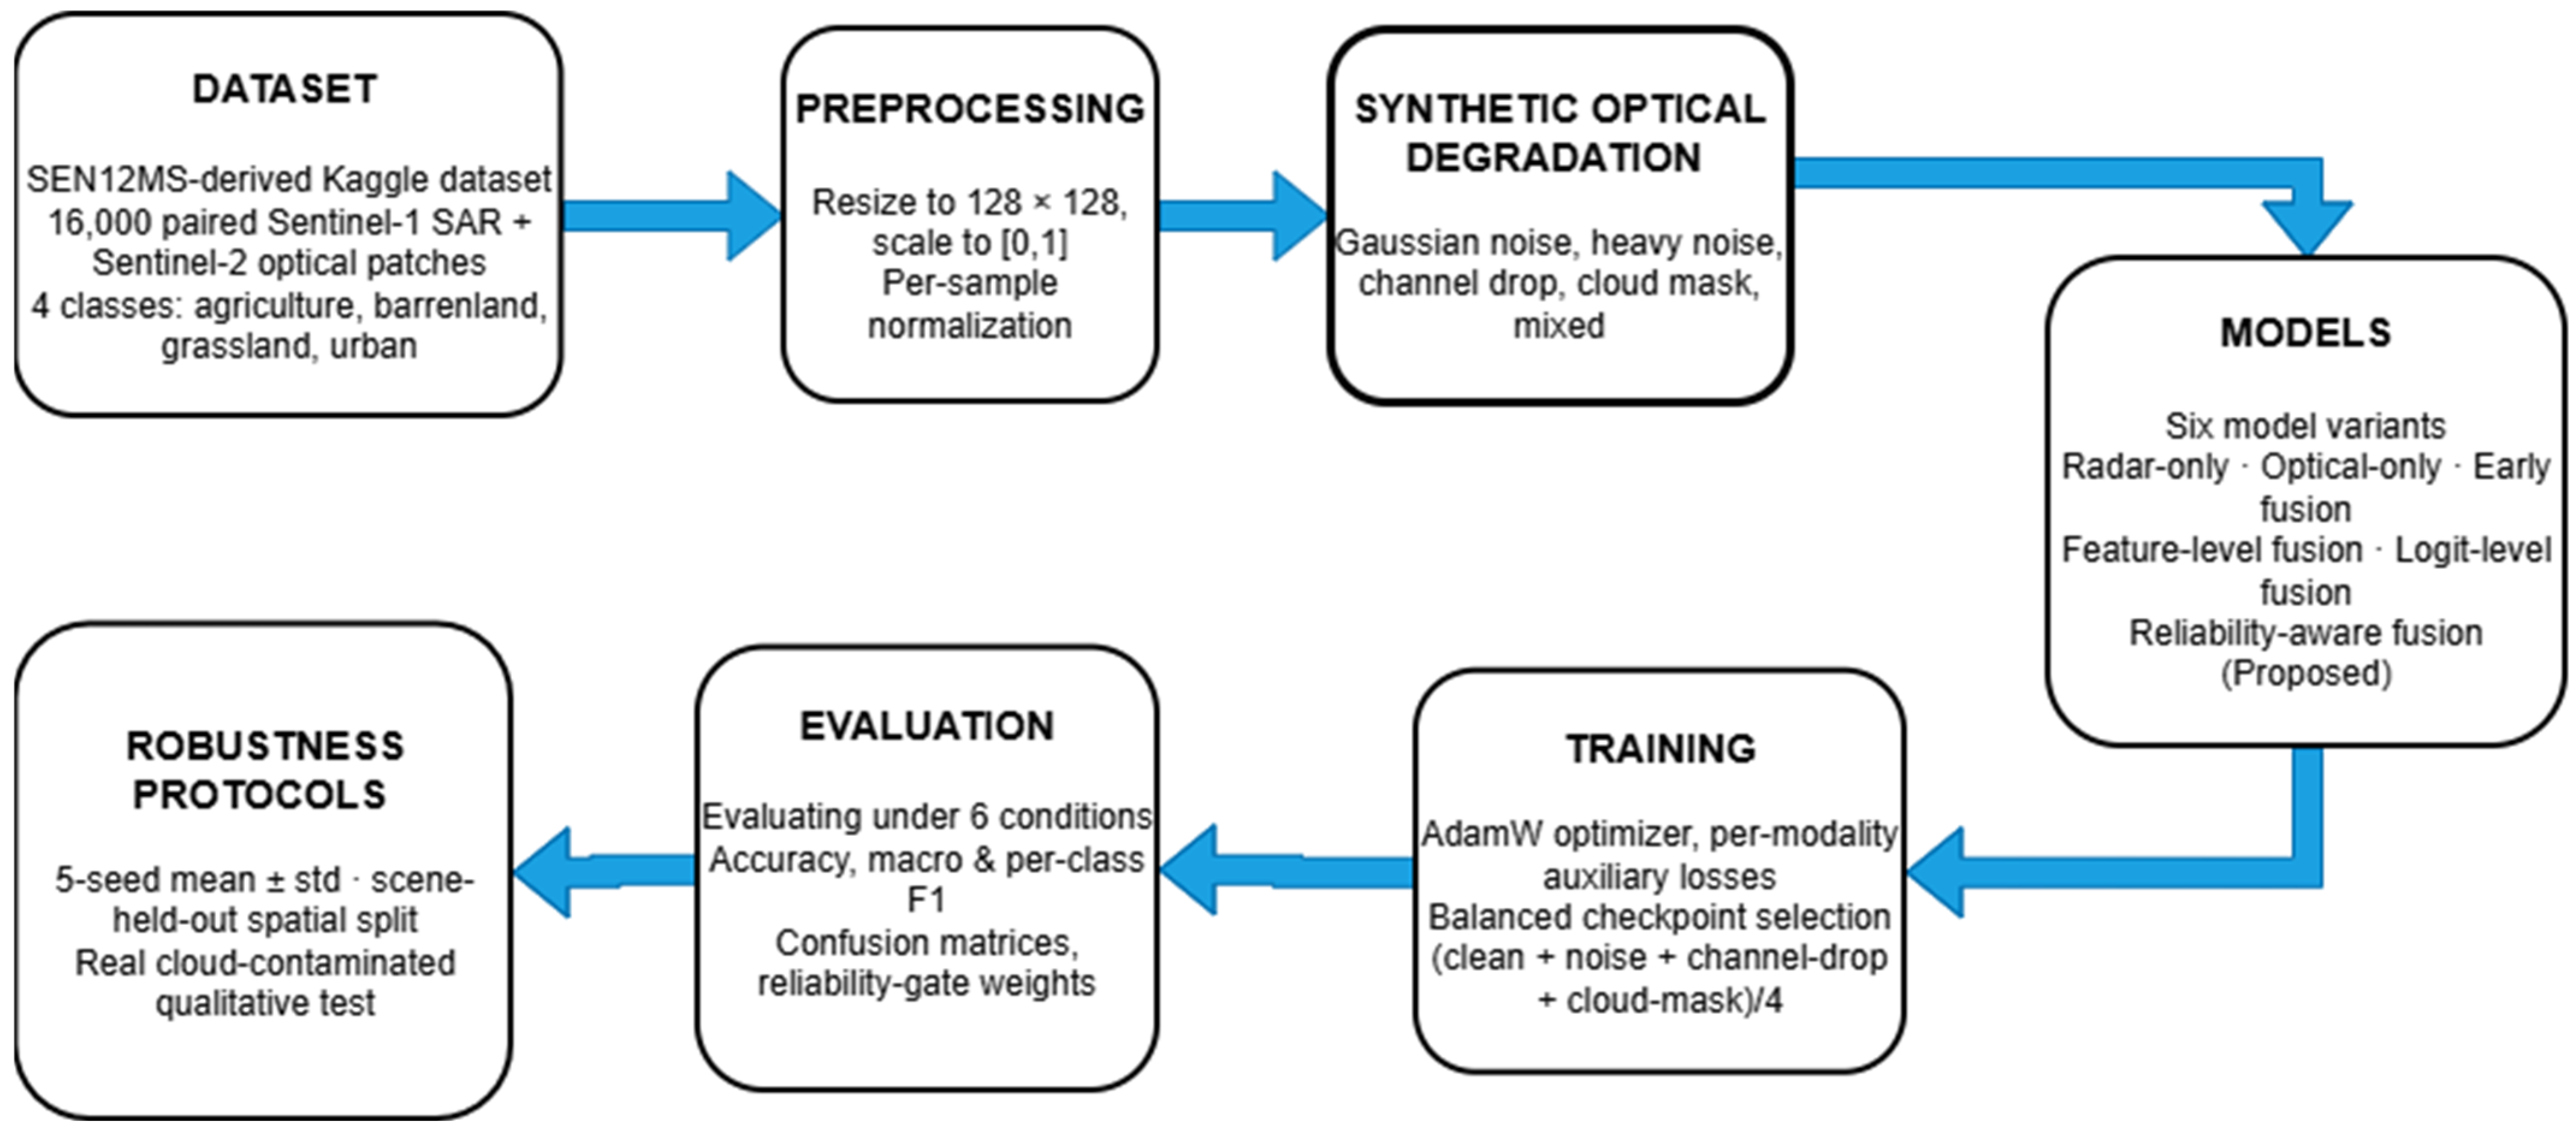
Section 3.2 also reports a feature-level fusion variant and a logit-level fusion variant. The proposed reliability-aware fusion model integrates modality-specific encoders, per-modality classification heads, confidence descriptors, optical-quality indicators, and a noise-aware reliability gate. The experimental design uses identical training data, the same encoder template, and the same evaluation protocol across all models to support a controlled comparison of the fusion strategies. The task addressed here is patch-level scene classification: each 128 × 128 patch receives a single land cover label. Extending the framework to spatially explicit, pixel-level mapping is identified as future work. The overall workflow of the study is summarized in
Figure 1.
2.2. Dataset
Experiments were conducted using a four-class land cover dataset derived from the SEN12MS benchmark [
18], distributed through the Kaggle platform [
19] as paired Sentinel-1 SAR and Sentinel-2 optical image patches segregated by terrain. The dataset contains 16,000 paired samples organized into four balanced classes: agriculture, barren land, grassland, and urban, with 4000 paired samples per class. The SEN12MS naming convention (e.g., ROIs1868_summer, ROIs1970_fall) is preserved in the filenames, indicating the geographic region and season of acquisition.
The 16,000 paired patches constitute the full curated Kaggle distribution of this SEN12MS-derived subset; no additional sampling was performed by the authors. Parsing the preserved SEN12MS filename convention shows that the distribution originates from a small number of regions of interest-predominantly ROIs1970_fall, plus one summer scene (ROIs1868_summer) for the agriculture class-organized into 30 distinct Sentinel scenes containing between 75 and 1370 patches each. The four classes (agriculture, barren land, grassland, and urban) are those provided by the dataset curation; classes such as forest or water are not included in this distribution. The four available classes nevertheless form a useful controlled benchmark, combining spectrally distinctive categories (urban, barren land) with spectrally similar, texture-dependent categories (agriculture, grassland). The limited regional diversity of the source data is discussed as a limitation in Section Limitations and Future Work.
2.3. Preprocessing
SAR images were loaded as single-channel grayscale images and resized to 128 × 128 pixels, yielding input tensors of shape [1, 128, 128]. Optical images were loaded as three-channel RGB composites and resized to 128 × 128 pixels, yielding input tensors of shape [3, 128, 128]. Pixel values were scaled to [0, 1] by dividing by 255 and then normalized per sample using per-channel mean and standard deviation to produce zero-mean, unit-variance inputs.
The SAR patches are provided by the distribution as single-channel intensity images derived from the Sentinel-1 acquisitions in SEN12MS, and the optical patches as three-channel true-color (RGB) composites derived from the corresponding Sentinel-2 visible bands; the exact polarization and band composition of the composites is not documented by the distribution. The use of full dual-polarization SAR and multispectral optical bands is identified as future work.
The dataset was split into training and validation subsets using stratified random sampling with an 80/20 ratio and random seed 2026, resulting in 12,800 training pairs and 3200 validation pairs. The same split was used for the baseline, ablation, and proposed models reported in the main comparison to ensure that performance differences reflect model behavior rather than data partitioning differences.
2.4. Baseline Models
Three primary baseline approaches were compared against the proposed framework;
Table 1 summarizes all baseline, ablation, and proposed model variants. The radar-only baseline is a single-modality classifier using only the SAR encoder and a classification head, trained with cross-entropy loss on SAR inputs. The optical-only baseline is a single-modality classifier using only the optical encoder and a classification head, trained with cross-entropy loss on optical inputs. The early-fusion baseline uses a single encoder that receives the concatenation of SAR and optical inputs as a four-channel input (1 SAR + 3 optical). For the ablation comparison, the feature-level fusion variant combines learned SAR and optical feature representations before classification, while the logit-level fusion variant combines modality-specific prediction logits using auxiliary modality heads. The final reliability-aware fusion model extends logit-level fusion by estimating adaptive modality weights from learned features, prediction confidence descriptors, and optical-quality indicators. All baseline and ablation models use the same compact convolutional encoder template described in
Section 2.5, adapted only for the appropriate number of input channels or fusion pathway.
2.5. Proposed Reliability-Aware Fusion Framework
In this paper, reliability refers to the estimated trustworthiness of each modality’s decision evidence for a given input. It is operationalized through three complementary signal types:
- (i)
Input quality, captured by optical quality descriptors;
- (ii)
Prediction confidence, captured by per-branch softmax confidence, margin, and entropy;
- (iii)
Learned feature evidence from both encoders. The gate receives no explicit degradation labels; reliability behavior is learned implicitly from randomized degradation during training.
The proposed architecture has four components: a SAR encoder, an optical encoder, modality-specific classification heads, and a noise-aware reliability gate. Both encoders share the same architectural template: three convolutional blocks (each containing a 3 × 3 convolution, batch normalization, ReLU activation, and 2 × 2 max pooling), followed by adaptive global average pooling and a linear projection to a 128-dimensional feature vector. The SAR encoder accepts 1-channel input while the optical encoder accepts 3-channel input; parameters are learned independently.
Each encoder is paired with an independent linear classification head that produces a 4-dimensional logit vector for the four land cover classes. The reliability gate then estimates a pair of fusion weights and combines the per-modality logits as follows:
where
zSAR and
zopt are the per-modality logit vectors, and (
wSAR,
wopt) are the adaptive fusion weights produced by the gate (with
wSAR +
wopt = 1). The final class prediction is obtained from the argmax of
zfused.
2.6. Inputs for the Reliability Gate
The reliability gate receives three categories of input. First, it receives the learned feature vectors from both encoders (256 dimensions total). Second, it receives a six-dimensional confidence descriptor computed from the per-modality logits, comprising three confidence features per branch: maximum softmax probability, prediction margin (the difference between top 1 and top 2 softmax probabilities), and normalized entropy of the softmax distribution. Third, it receives a four-dimensional optical-quality descriptor computed directly from the optical input: mean absolute pixel value, overall pixel standard deviation, fraction of near-zero pixels, and fraction of pixels with absolute values exceeding 2.5 standard deviations.
The full 266-dimensional gate input is processed by a three-layer network with hidden dimensions of 128 and 64, dropout (
p = 0.20) after the first hidden layer, and a final softmax layer producing the two-dimensional weight vector (
wSAR,
wopt). Each convolutional block uses 3 × 3 kernels with channel widths of 32, 64, and 128, batch normalization, ReLU activations and 2 × 2 max pooling, followed by adaptive global average pooling and a linear projection to 128 dimensions. The complete proposed model contains 263,434 trainable parameters; parameter counts and inference times for all model variants are compared in
Table 2. The reliability gate adds only approximately 9400 parameters (3.7%) and 0.7 ms per batch over the logit-level fusion variant, so the robustness mechanism is computationally inexpensive.
2.7. Optical Degradation Protocol
To evaluate model robustness under imperfect optical observations, five controlled degradation operations were applied to the Sentinel-2 optical inputs during evaluation. Each simulates a realistic failure mode in optical remote sensing:
Gaussian noise: additive Gaussian noise with standard deviation σ = 0.95 was added to all optical channels, simulating sensor noise and atmospheric distortion;
Heavy Gaussian noise: additive Gaussian noise with a higher standard deviation σ = 1.45 was applied to represent extreme corruption;
Channel drop: each optical channel was independently set to zero with probability 0.35, simulating missing spectral bands or partial sensor failure;
Cloud mask: a rectangular region covering 45% of the image height and 45% of the image width was set to zero at a random position, simulating partial cloud contamination;
Mixed degradation: Gaussian noise (σ = 0.75) and channel drop (probability 0.20) were applied together to simulate co-occurring corruption.
During training of the fusion model, a degradation mode was randomly selected for each optical input from the set {clean, noise, heavy noise, channel drop, cloud mask, mixed}, with Gaussian noise sampled more frequently to emphasize robustness to additive noise. No degradation was applied to the SAR inputs, reflecting the assumption that SAR acquisition is more stable than optical acquisition. These operations are controlled by synthetic approximations. Real cloud contamination exhibits variable opacity, shadows, edge effects and band-dependent attenuation, and haze differs from additive Gaussian noise; the protocol therefore evaluates robustness to synthetic corruption rather than full operational robustness under real atmospheric conditions. A complementary qualitative evaluation on real cloud-contaminated imagery is reported in
Section 3.9.
2.8. Training Strategy
The proposed model was trained end-to-end using a composite loss function that combines the fused classification loss with auxiliary per-modality losses:
where
LCE denotes the cross-entropy loss,
y is the ground-truth label, and
λ = 0.45 controls the contribution of the auxiliary losses. The auxiliary losses encourage each modality branch to remain individually predictive, which is essential for the gate to receive meaningful confidence signals.
Training used the AdamW optimizer [
20] with a learning rate of 8 × 10
−4 and weight decay of 10
−4. The batch size was 32, and training was carried out for 15 epochs. Baseline models were trained for 10 epochs using AdamW [
20] with a learning rate of 10
−3 and standard cross-entropy loss. All stochastic components of the pipeline (data splitting, parameter initialization, mini-batch ordering, and random degradation sampling) were controlled by a global random seed, and deterministic cuDNN settings were enabled where supported. The run with seed 2026 is reported as the representative run: all detailed tables, figures, gate analyses, and confusion matrices correspond to this single trained model, and its checkpoint is published in the project repository. To quantify sensitivity to training randomness, the proposed model, the logit-level fusion variant, and the optical-only baseline were each additionally retrained with five random seeds (7, 42, 123, 777, 2026), re-drawing the train/validation split, parameter initialization, and batch ordering per seed;
Section 3.7 reports mean ± standard deviation across seeds. All experiments were conducted on Google Colab using a single NVIDIA Tesla T4 Graphics Processing Unit (GPU; NVIDIA Corporation, Santa Clara, CA, USA) with 16 GB memory, with the framework implemented in PyTorch (version 2.11.0) [
21].
To avoid overfitting the model to any single degradation setting, the best training checkpoint was selected using a balanced robustness score computed as the average of validation accuracies across four degradation conditions:
This selection criterion was found to produce more consistent performance across degradation types than selecting based on accuracy under any single condition.
2.9. Evaluation Metrics
Model performance was evaluated using classification accuracy on the validation set under each degradation condition. In addition to accuracy, macro F1-score, per-class F1-score, and confusion matrices are reported for the proposed model (see
Section 3.5). F1-scores and confusion matrices were computed using scikit-learn (version 1.6.1) [
22], and the result visualizations were generated using Matplotlib (version 3.10.0) [
23]. For the representative seed-2026 analysis, accuracy, F1-score, confusion matrices, and average reliability-gate weights are reported. The learned fusion weights (
wSAR,
wopt) are reported as Model parameter counts, and per-batch inference times are additionally reported to characterize computational cost (
Table 2).
2.10. Spatially Independent Evaluation Protocol
Because random splits can overestimate performance when visually similar patches from the same acquisition appear in both training and validation sets, an additional spatially independent evaluation was conducted. Since only two region-season combinations are present in Sentinel scenes (parsed from the SEN12MS filename convention) were used as the spatial unit. Whole scenes totaling approximately 20% of the samples per class were held out as a test set (8 of 30 scenes; 4795 test patches), and the optical-only, logit-level fusion, and proposed models were retrained from scratch on the remaining 11,205 patches. No scene appears in both partitions.
2.11. Qualitative Evaluation on Real Cloud-Contaminated Imagery
To complement the synthetic protocol, six real partly cloudy Sentinel-2 true-color patches and co-located Sentinel-1 patches were exported from the Copernicus Data Space browser over sites with known land cover and processed with the same normalization pipeline. This evaluation is qualitative: browser-rendered exports differ from the curated dataset patches in radiometric scaling, spatial footprint, and SAR visualization, so it probes out-of-distribution behavior rather than in-distribution accuracy.
2.12. Use of Generative AI Tools
During the preparation of this manuscript, the authors used Claude (Anthropic, Claude Fable and Claude opus model families) for the purposes of manuscript drafting, organization, and language refinement. The authors have reviewed and edited the output and take full responsibility for the content of this publication.
3. Results
3.1. Experimental Setup
The baseline models and fusion variants were trained on the same 12,800 training pairs and evaluated on the same 3200 validation pairs. Each model was evaluated under clean inputs and under the optical degradation conditions described in
Section 2.7. The proposed reliability-aware fusion model was additionally evaluated under heavy-noise and mixed-degradation settings to examine behavior beyond the four conditions used in the baseline comparison.
3.2. Baseline and Ablation Fusion Comparison Under Clean and Degraded Inputs
Table 3 reports the classification accuracy of the single-modality baselines, the early-fusion baseline, the ablation fusion variants, and the proposed reliability-aware fusion model under clean and degraded optical conditions. The feature-level fusion variant combines learned SAR and optical representations before classification, while the logit-level fusion variant combines modality-specific prediction logits. The proposed reliability-aware fusion model extends logit-level fusion by estimating adaptive modality weights from feature representations, prediction confidence, and optical quality descriptors.
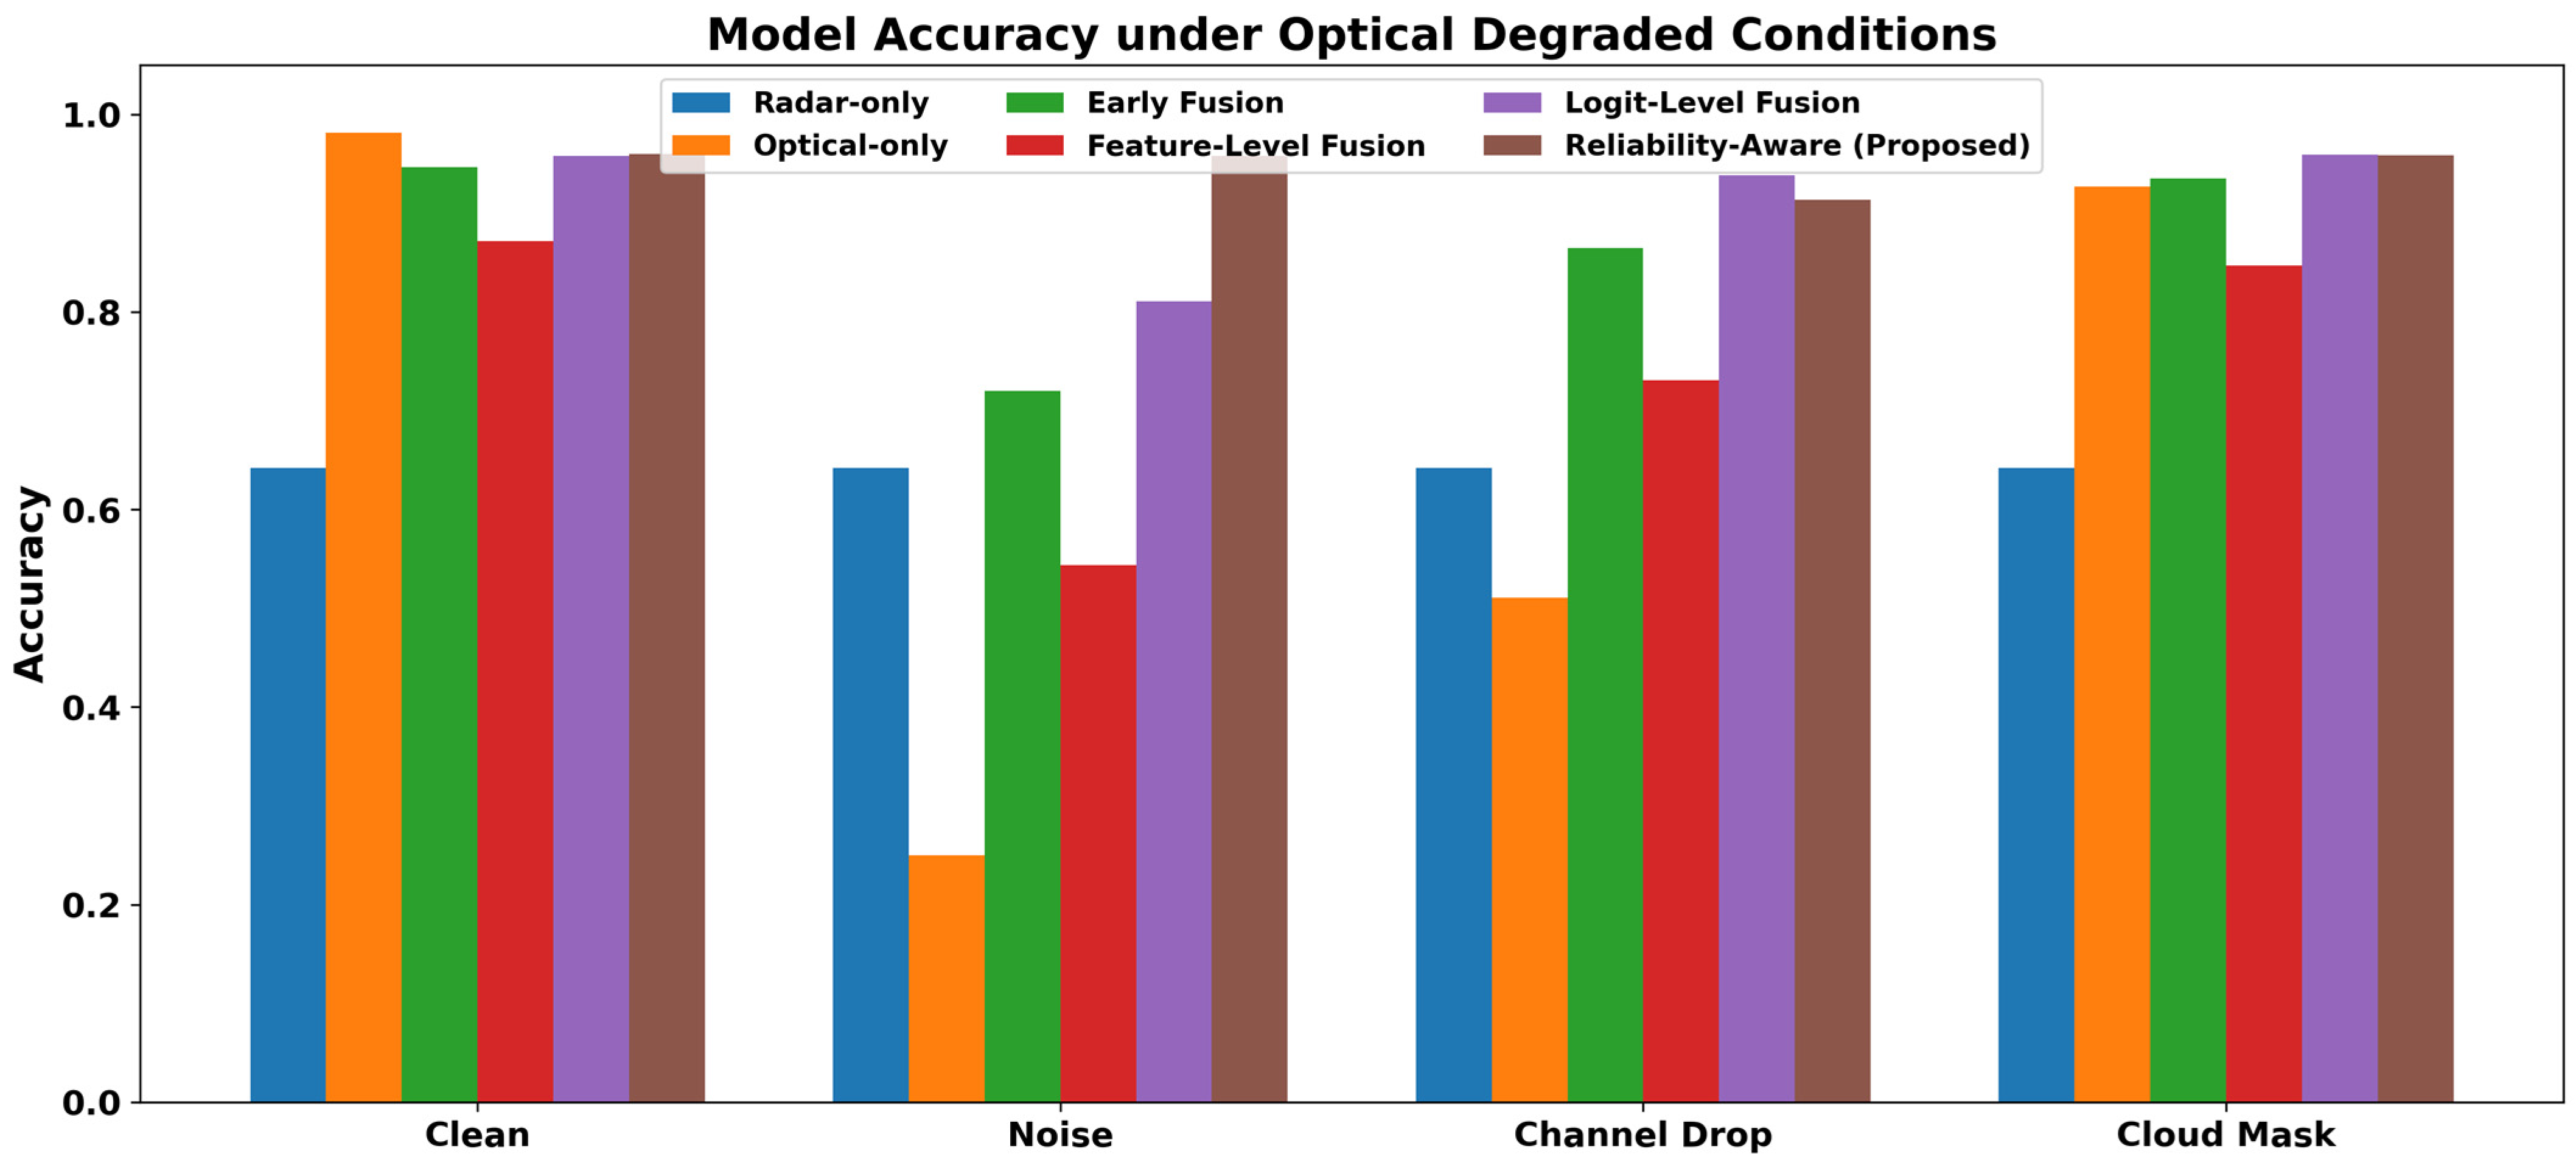
Under clean inputs in the representative run, the optical-only model achieved 98.2% accuracy, and the proposed reliability-aware fusion model achieved 96.0%. Early fusion reached 94.7%, the feature-level variant 87.2%, and the logit-level fusion variant 95.8%. This indicates that the proposed model should be interpreted primarily as a robustness-oriented design rather than as the strongest clean-input classifier.
Under Gaussian noise, the optical-only model dropped sharply to 25.0% accuracy and early fusion to 72.0%, while the feature-level and logit-level fusion variants reached 54.3% and 81.1%; the proposed model achieved 95.8%, its clearest advantage. This shows that reliability-aware weighting can protect the final prediction when optical features are strongly corrupted by additive noise. This is the clearest advantage of the proposed method and shows that reliability-aware weighting can protect the final prediction when optical features are strongly corrupted by additive noise.
Figure 2 visualizes the model-level accuracy trends reported in
Table 3 for the baselines, ablation variants, and proposed reliability-aware fusion model. In this representative run, the proposed model attains the highest accuracy in all four settings, with by far the largest margin under Gaussian noise;
Section 3.7 shows which of these single-run differences remain statistically meaningful across seeds. The figure highlights that the proposed model is strongest under Gaussian-noise degradation, while the logit-level fusion variant remains the strongest or near-strongest under clean, channel-drop, and cloud-mask settings.
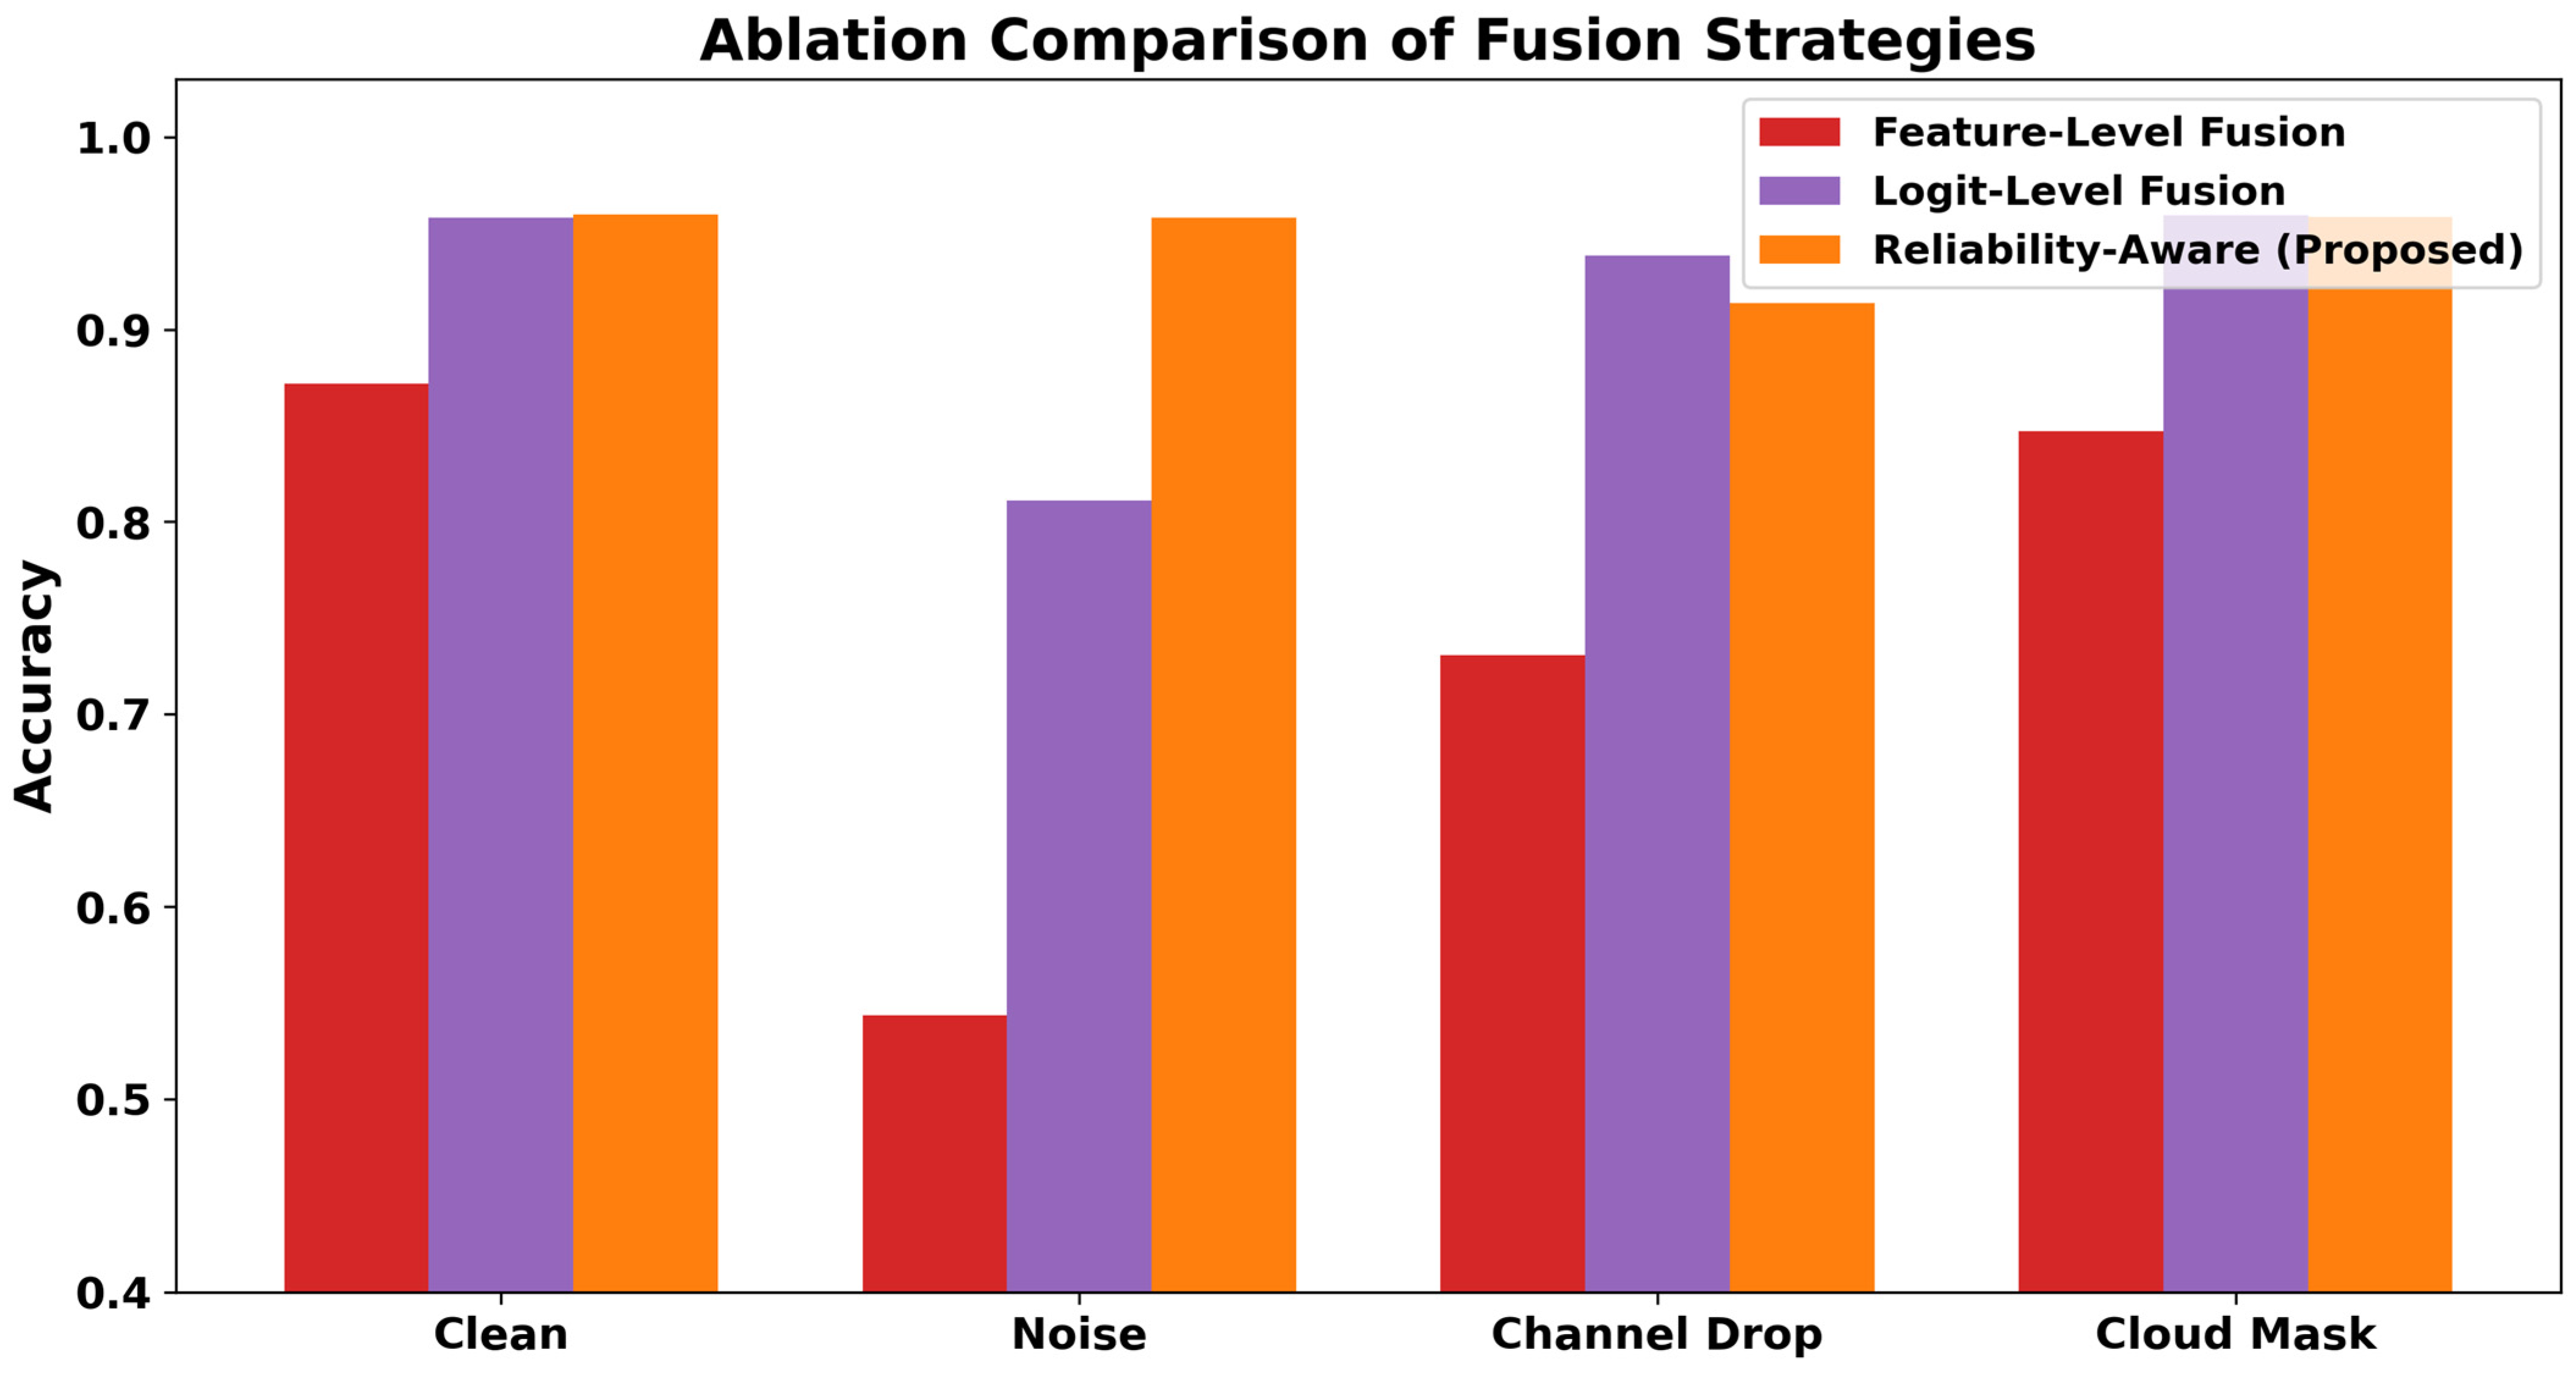
Figure 3 focuses on the ablation fusion variants. The main design trend is that moving fusion from the feature level to the decision (logit) level improves robustness under degraded inputs, and adding reliability-aware weighting provides the largest additional gain under Gaussian noise.
Under channel-drop degradation, the optical-only model achieved 51.1% accuracy and early fusion 86.5%; the proposed model achieved 91.4%, with the logit-level fusion variant at 93.8%. Under cloud masking, optical-only and early-fusion models reached 92.7% and 93.5%, the logit-level variant 95.9%, and the proposed model 95.8%. These single-run comparisons must be interpreted together with the multi-seed statistics in
Section 3.7, where the proposed model is the highest or statistically comparable method in every setting and clearly strongest under Gaussian noise.
3.3. Proposed Model Performance Under the Representative Seed-2026 Run
The proposed reliability-aware fusion model was evaluated across clean and degraded optical input conditions using the representative seed-2026 split.
Table 4 reports the proposed model accuracy for clean, Gaussian-noise, heavy-noise, channel-drop, cloud-mask, and mixed-degradation settings. The mixed and heavy-noise settings are included to characterize behavior beyond the main baseline comparison in
Table 3.
The proposed model achieved 96.0% accuracy under clean inputs, 95.8% under Gaussian noise, and 94.8% under mixed degradation. Under heavy Gaussian noise, it retained 86.3% accuracy in the representative run, with the gate maintaining a near-balanced weighting (average optical weight 0.533). Heavy noise nevertheless remained the most difficult and least stable condition: across five seeds it averaged only 0.604 ± 0.236 (
Section 3.7), the widest spread of any setting, indicating that performance under severe optical corruption depends strongly on the training run.
3.4. Reliability Gate Weight Analysis
The reliability gate provides partly interpretable, diagnostic modality weights for SAR and optical inputs.
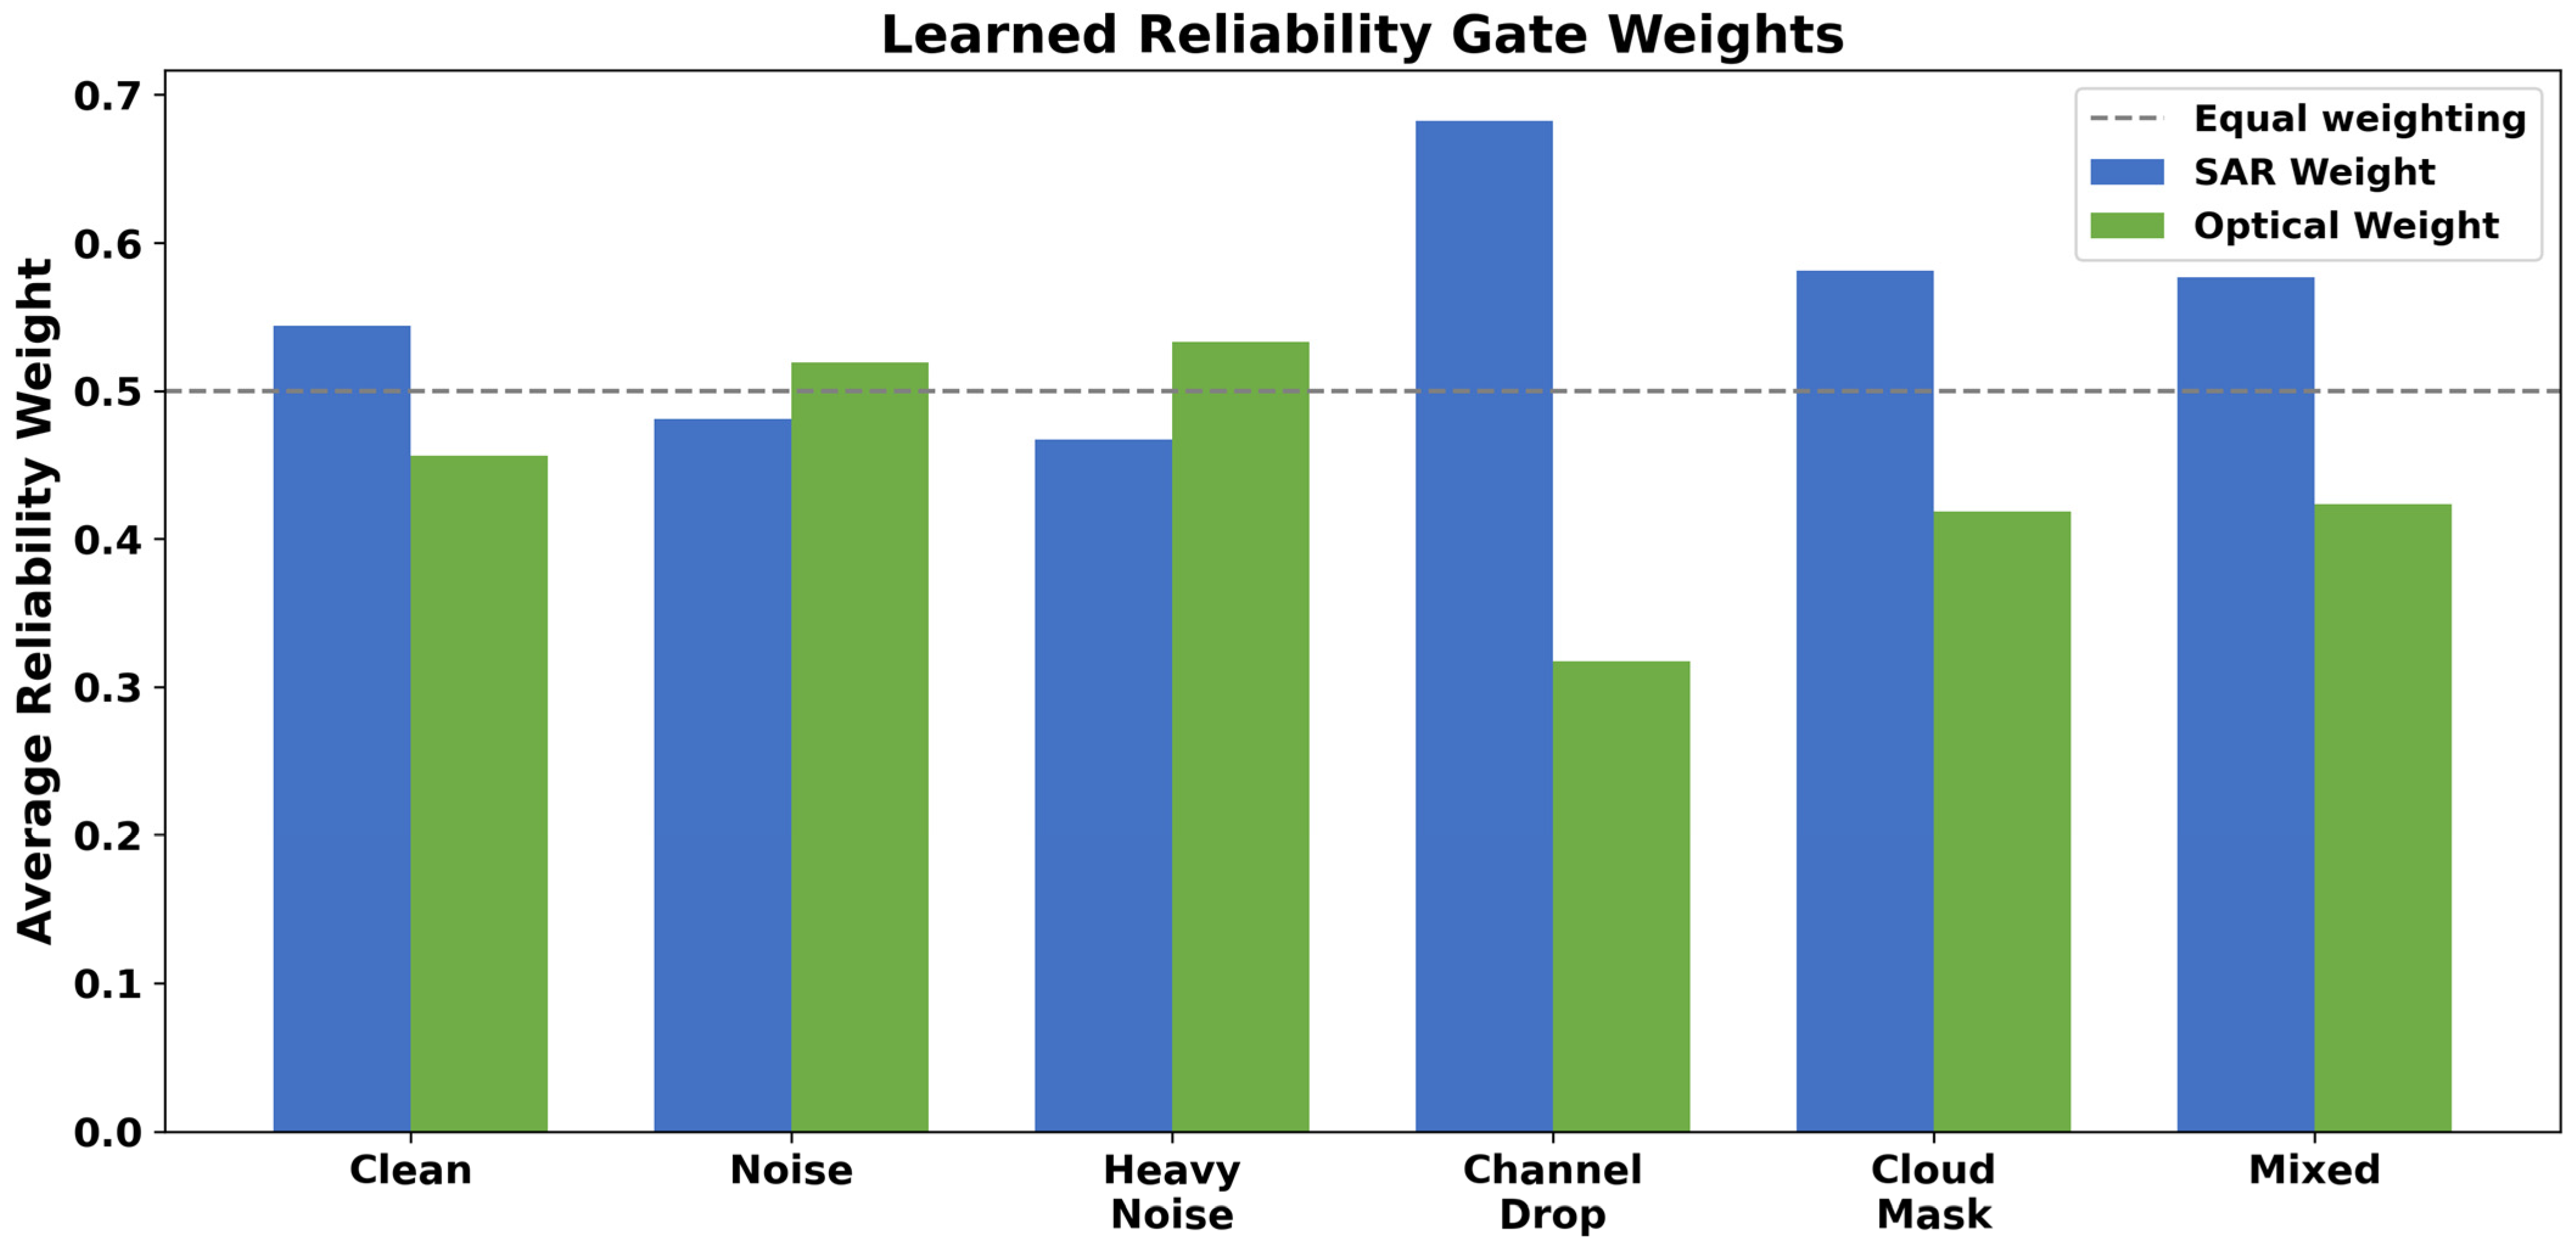
Table 5 reports, and
Figure 4 visualizes, the average gate weights from the representative seed-2026 run. These values are reported alongside accuracy to show how the model distributes trust between modalities under each evaluation condition.
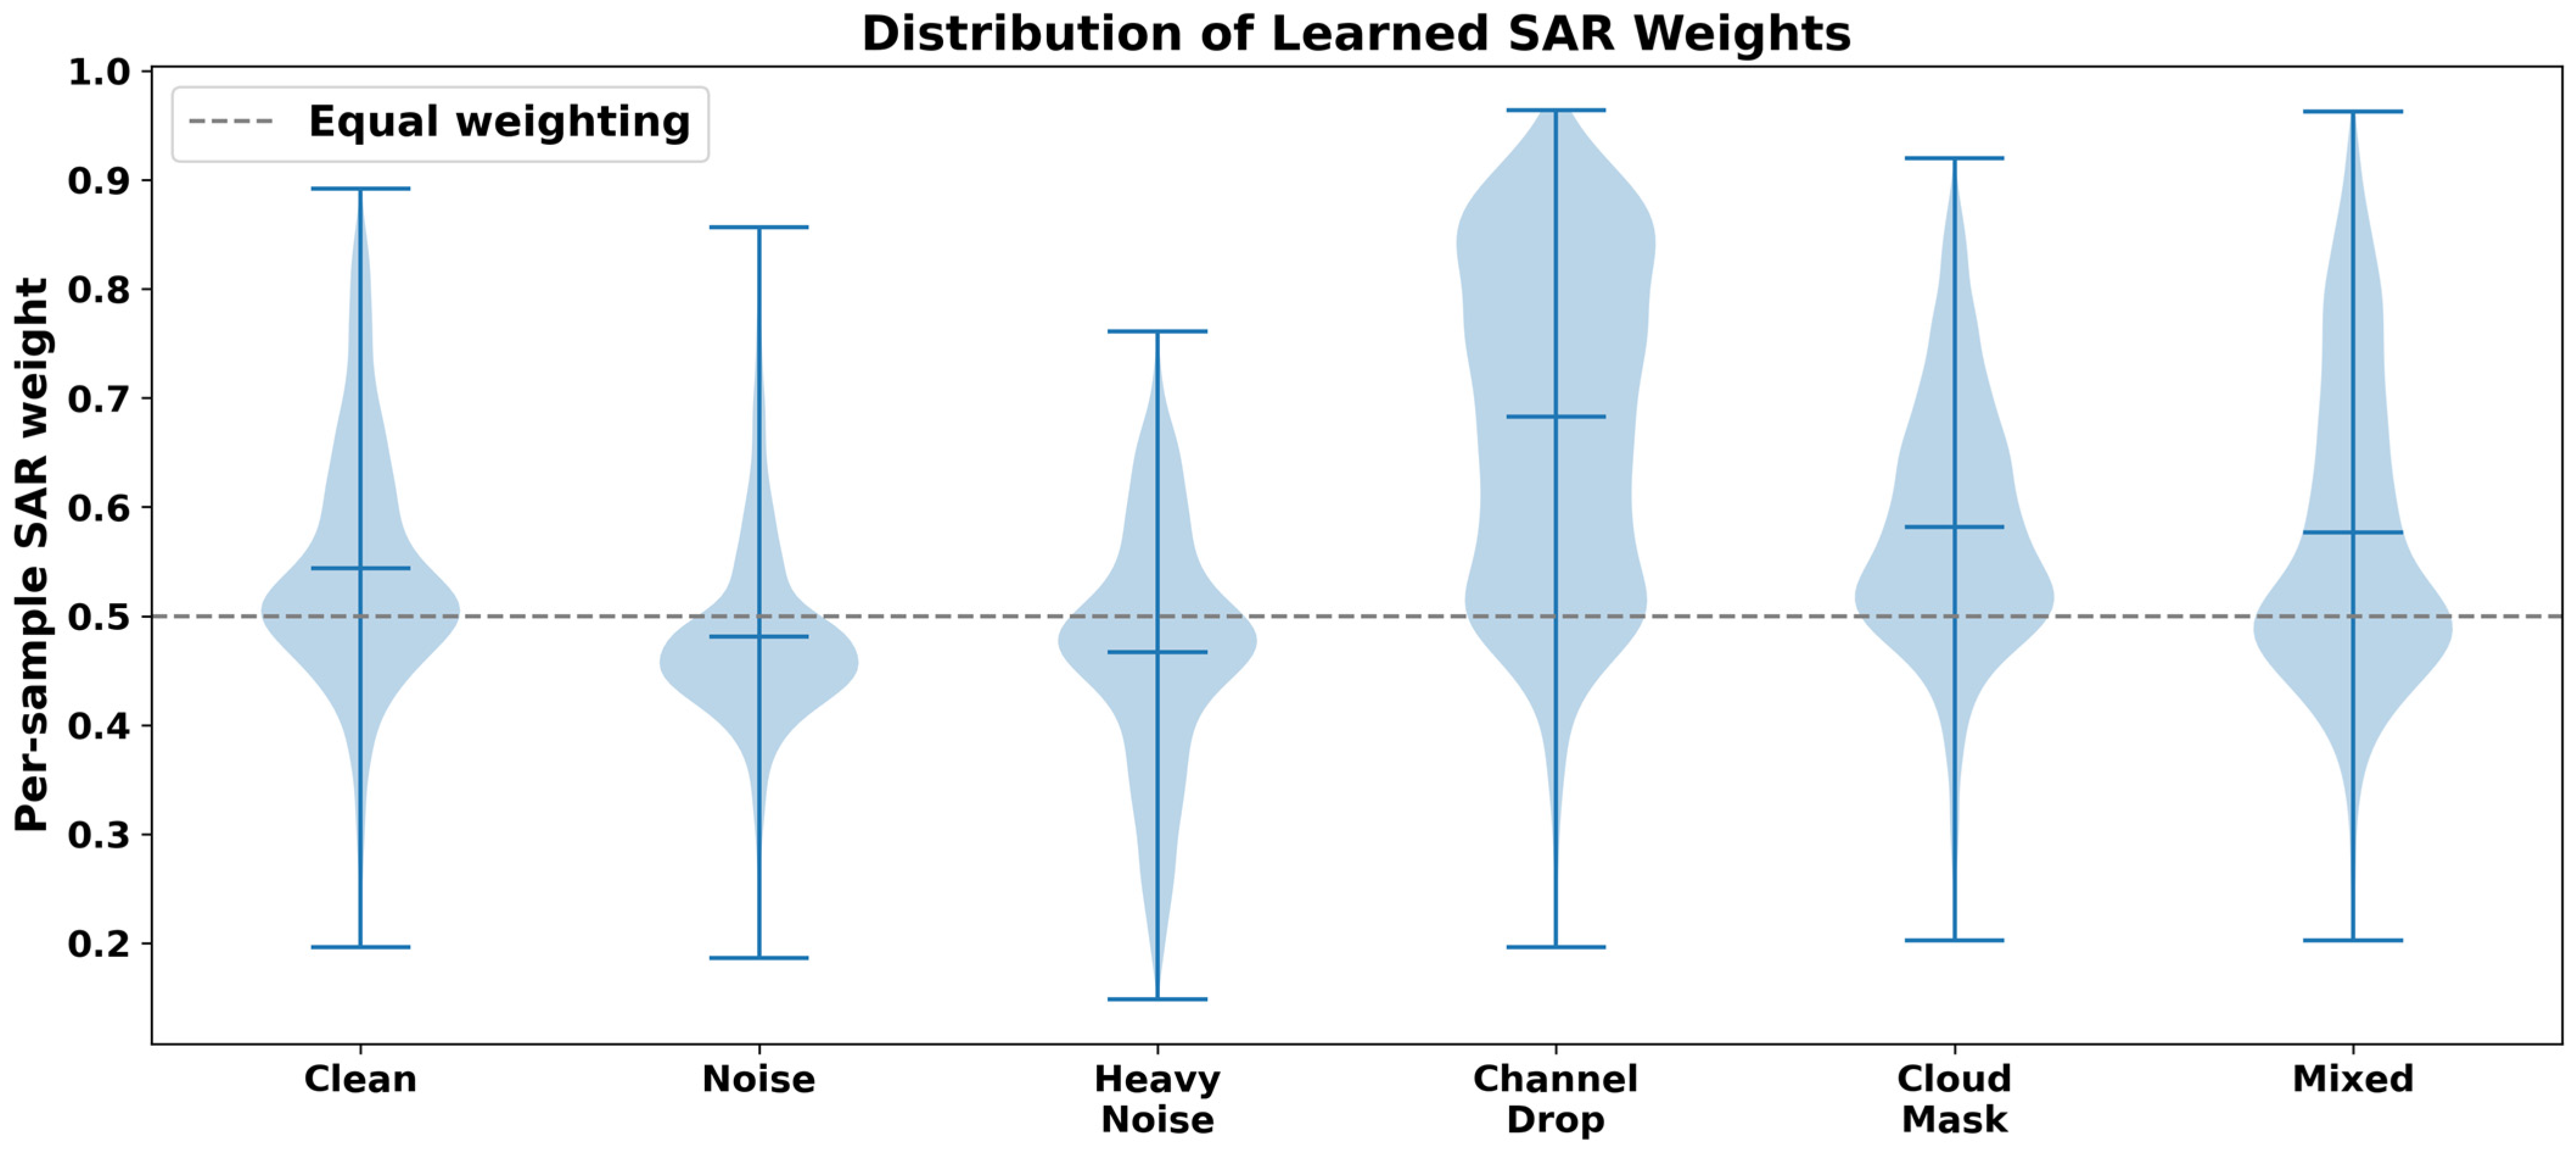
Under clean conditions, the gate assigned moderately higher average weight to SAR (0.544) than to optical inputs (0.456). Under channel-drop degradation, the SAR weight increased to 0.683, and the model remained SAR-leaning under cloud-mask (0.581) and mixed (0.577) degradation. Under Gaussian and heavy noise, the gate shifted slightly toward optical (SAR weights 0.481 and 0.467), keeping a near-balanced combination rather than collapsing onto either modality.
Beyond averages, the per-sample weight distributions (
Figure 5) are broad (standard deviations of 0.09–0.16 within each condition), showing that the gate produces sample-specific rather than constant weights. Per-class averages reveal systematic structure: SAR weights are consistently highest for barren land and grassland and lowest for urban and agriculture. Weights conditioned on correctness show that the gate tends to assign more optical weight when the optical branch is correct than when it is wrong, indicating that the gate is directionally calibrated with the true reliability of the optical branch under moderate degradation.
Unlike the earlier single-run behavior, the representative model in this run did not invert under heavy noise: the gate held a near-balanced weighting (optical 0.533) and preserved 86.3% accuracy. The wide cross-seed spread under heavy noise (
Section 3.7), however, shows that this stability is not guaranteed—some seeds degrade substantially—so heavy additive noise remains the regime where reliability estimation is most fragile.
Figure 4 visualizes the average gate weights across conditions, and
Figure 5 shows the full per-sample weight distributions.
3.5. Per-Class Performance Analysis
To complement the aggregate accuracy results, per-class F1-scores were computed for the proposed model under all degradation conditions.
Table 6 reports macro F1 and per-class F1 across the four land cover classes for the representative seed-2026 evaluation. These class-level results help identify whether robustness is balanced across classes or concentrated in specific categories.
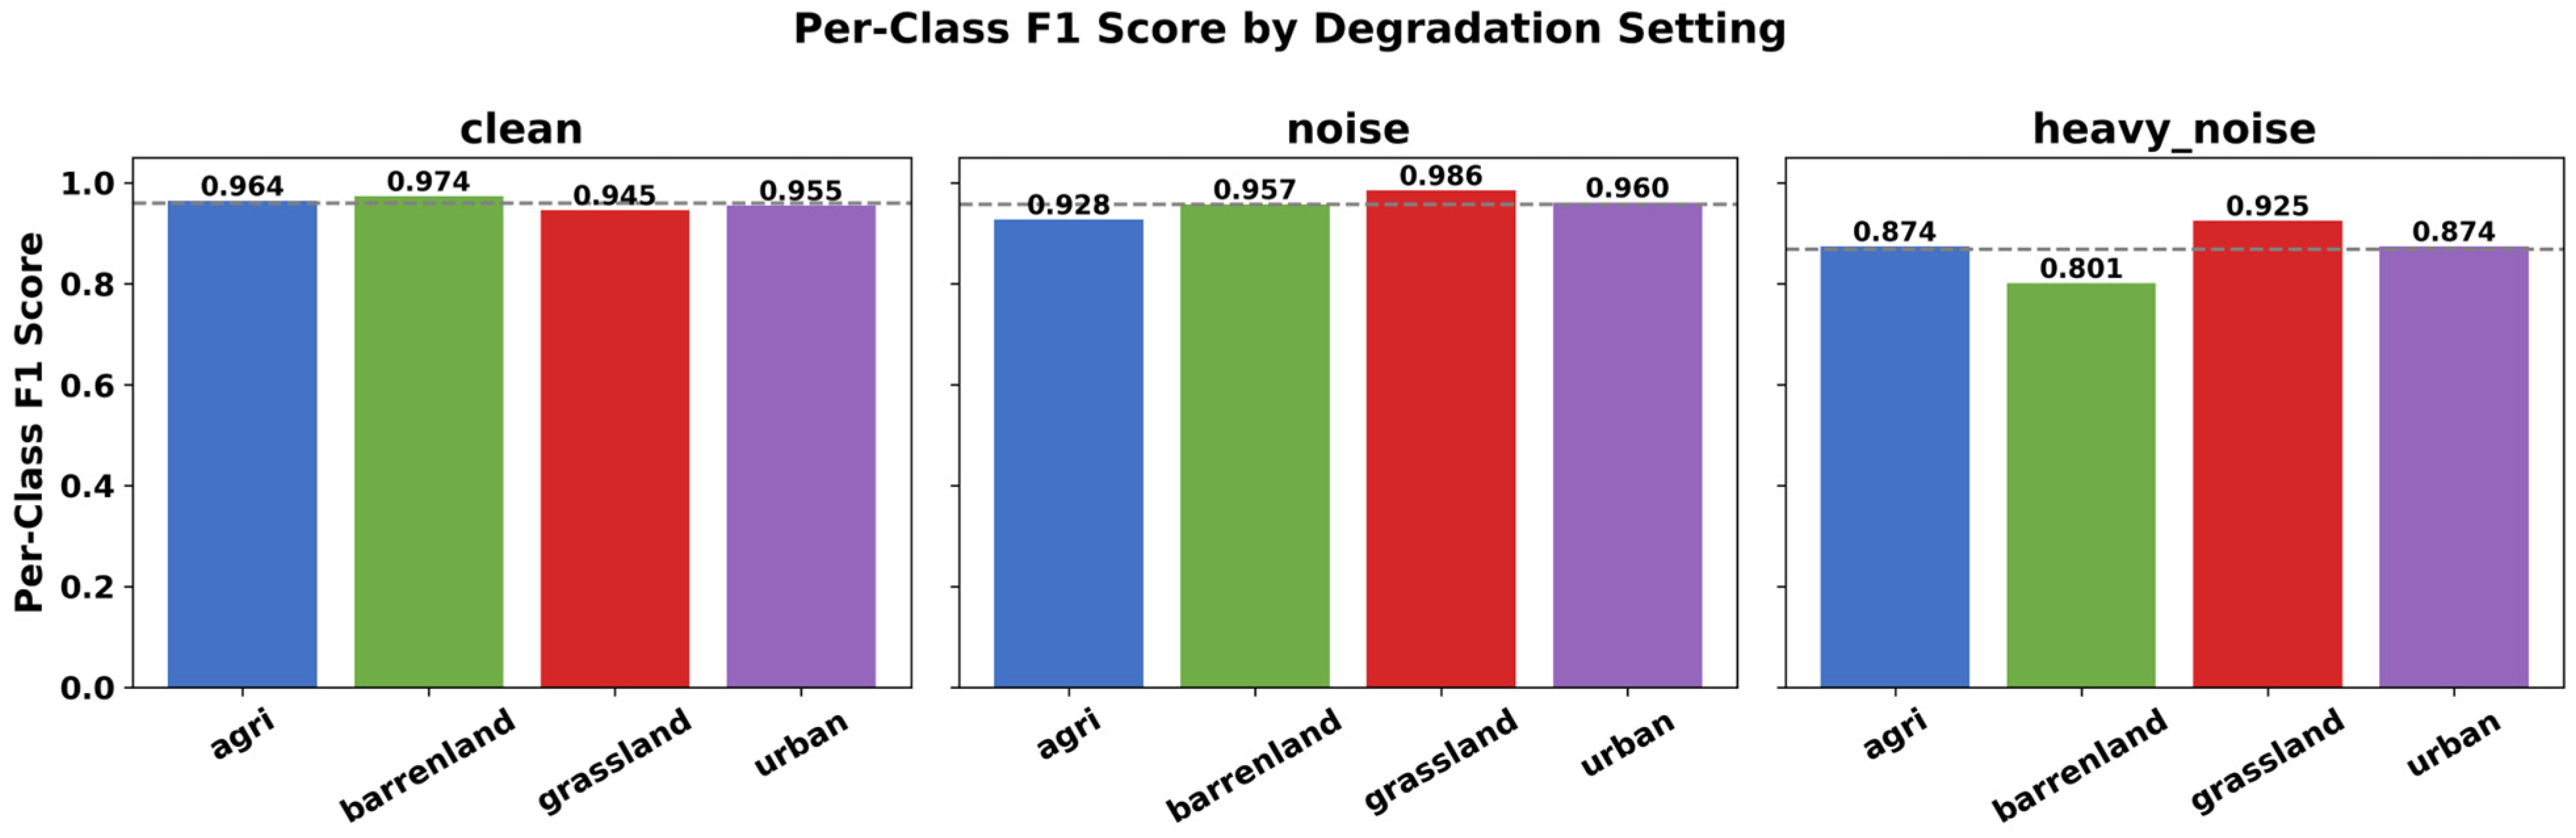
Figure 6 summarizes per-class F1 behavior under clean, Gaussian-noise, and heavy-noise conditions. The figure shows that class-level performance remains high under clean and standard Gaussian-noise settings, while heavy noise produces more uneven behavior, especially for the agriculture and grassland classes.
Under clean, Gaussian-noise, channel-drop, cloud-mask, and mixed conditions, per-class F1 remains high and balanced (0.884–0.986), confirming that aggregate accuracy does not depend on a single class.
Under heavy noise, macro F1 decreases to 0.868 but remains well above chance, with per-class F1 ranging from 0.801 (barren land) to 0.925 (grassland); in the representative run, the model does not collapse onto a single class, in contrast to the instability observed for some other seeds (
Section 3.7).
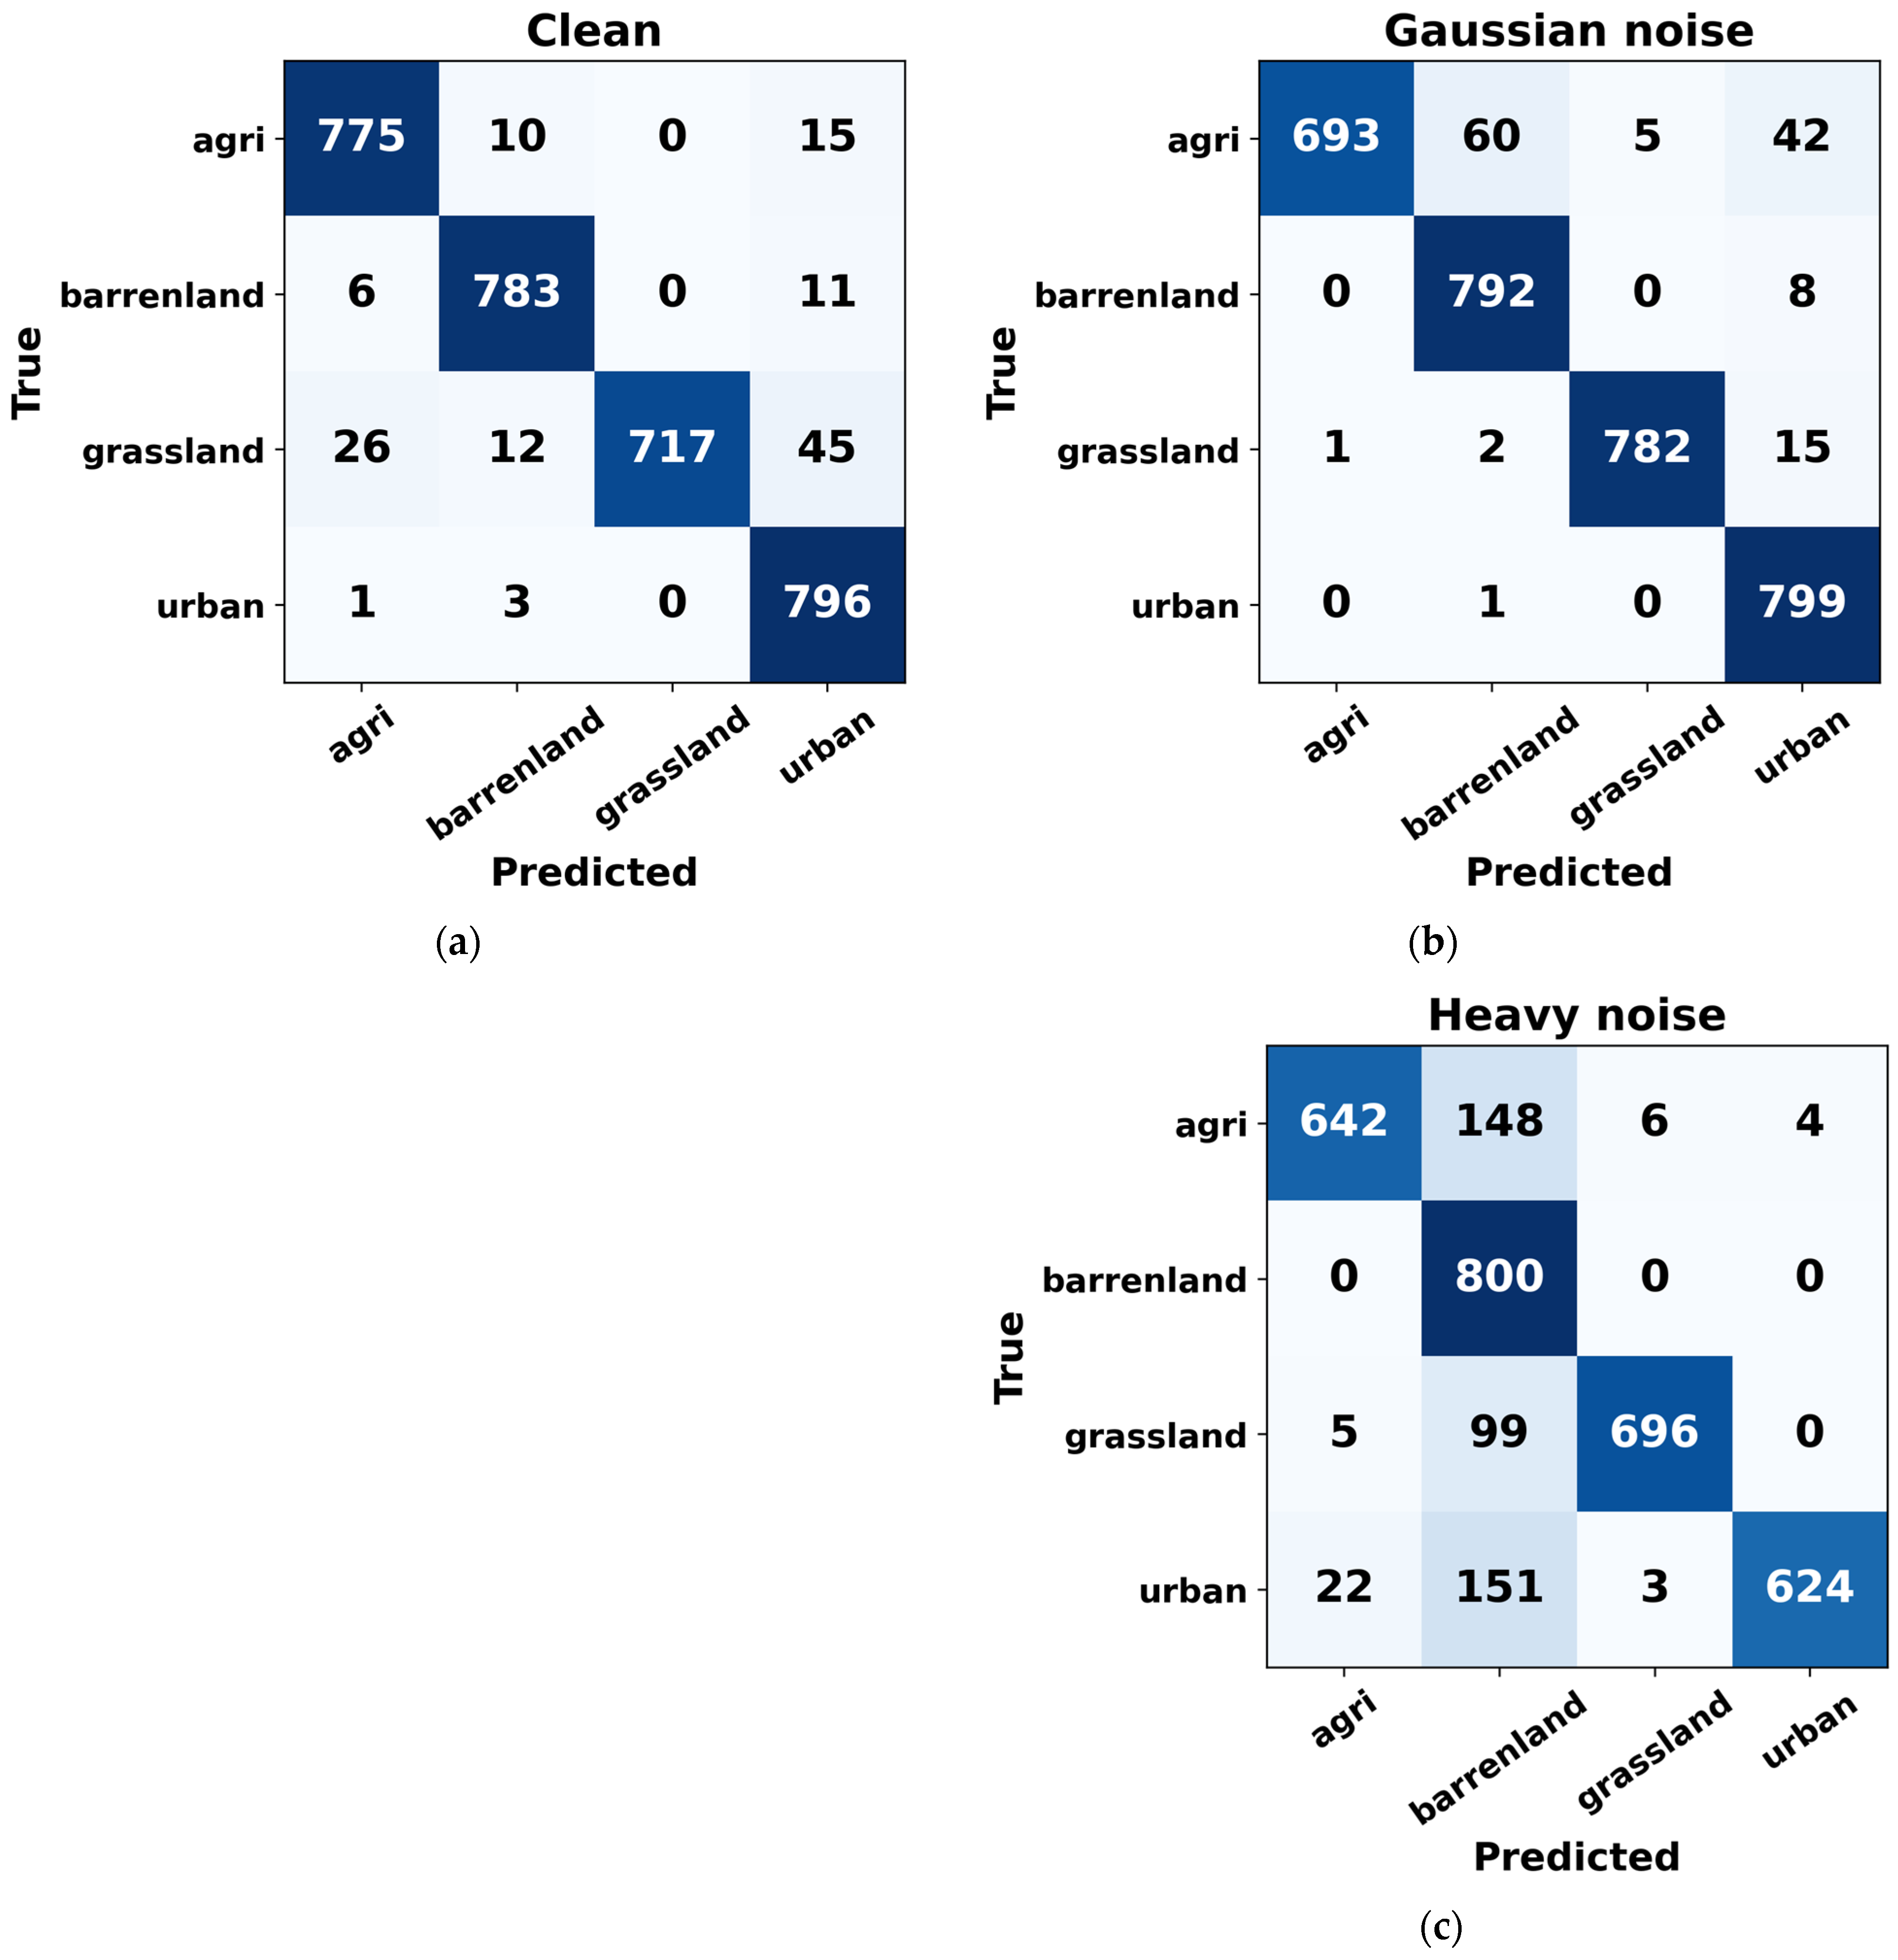
Figure 7 presents confusion matrices under the clean, Gaussian-noise, and heavy-noise settings, making the degraded-condition error structure explicit alongside the clean condition. Most predictions fall on the diagonal, but the matrix also shows the main remaining error patterns, especially grassland samples classified as urban and barren land samples classified as agriculture.
3.6. Qualitative Prediction Examples
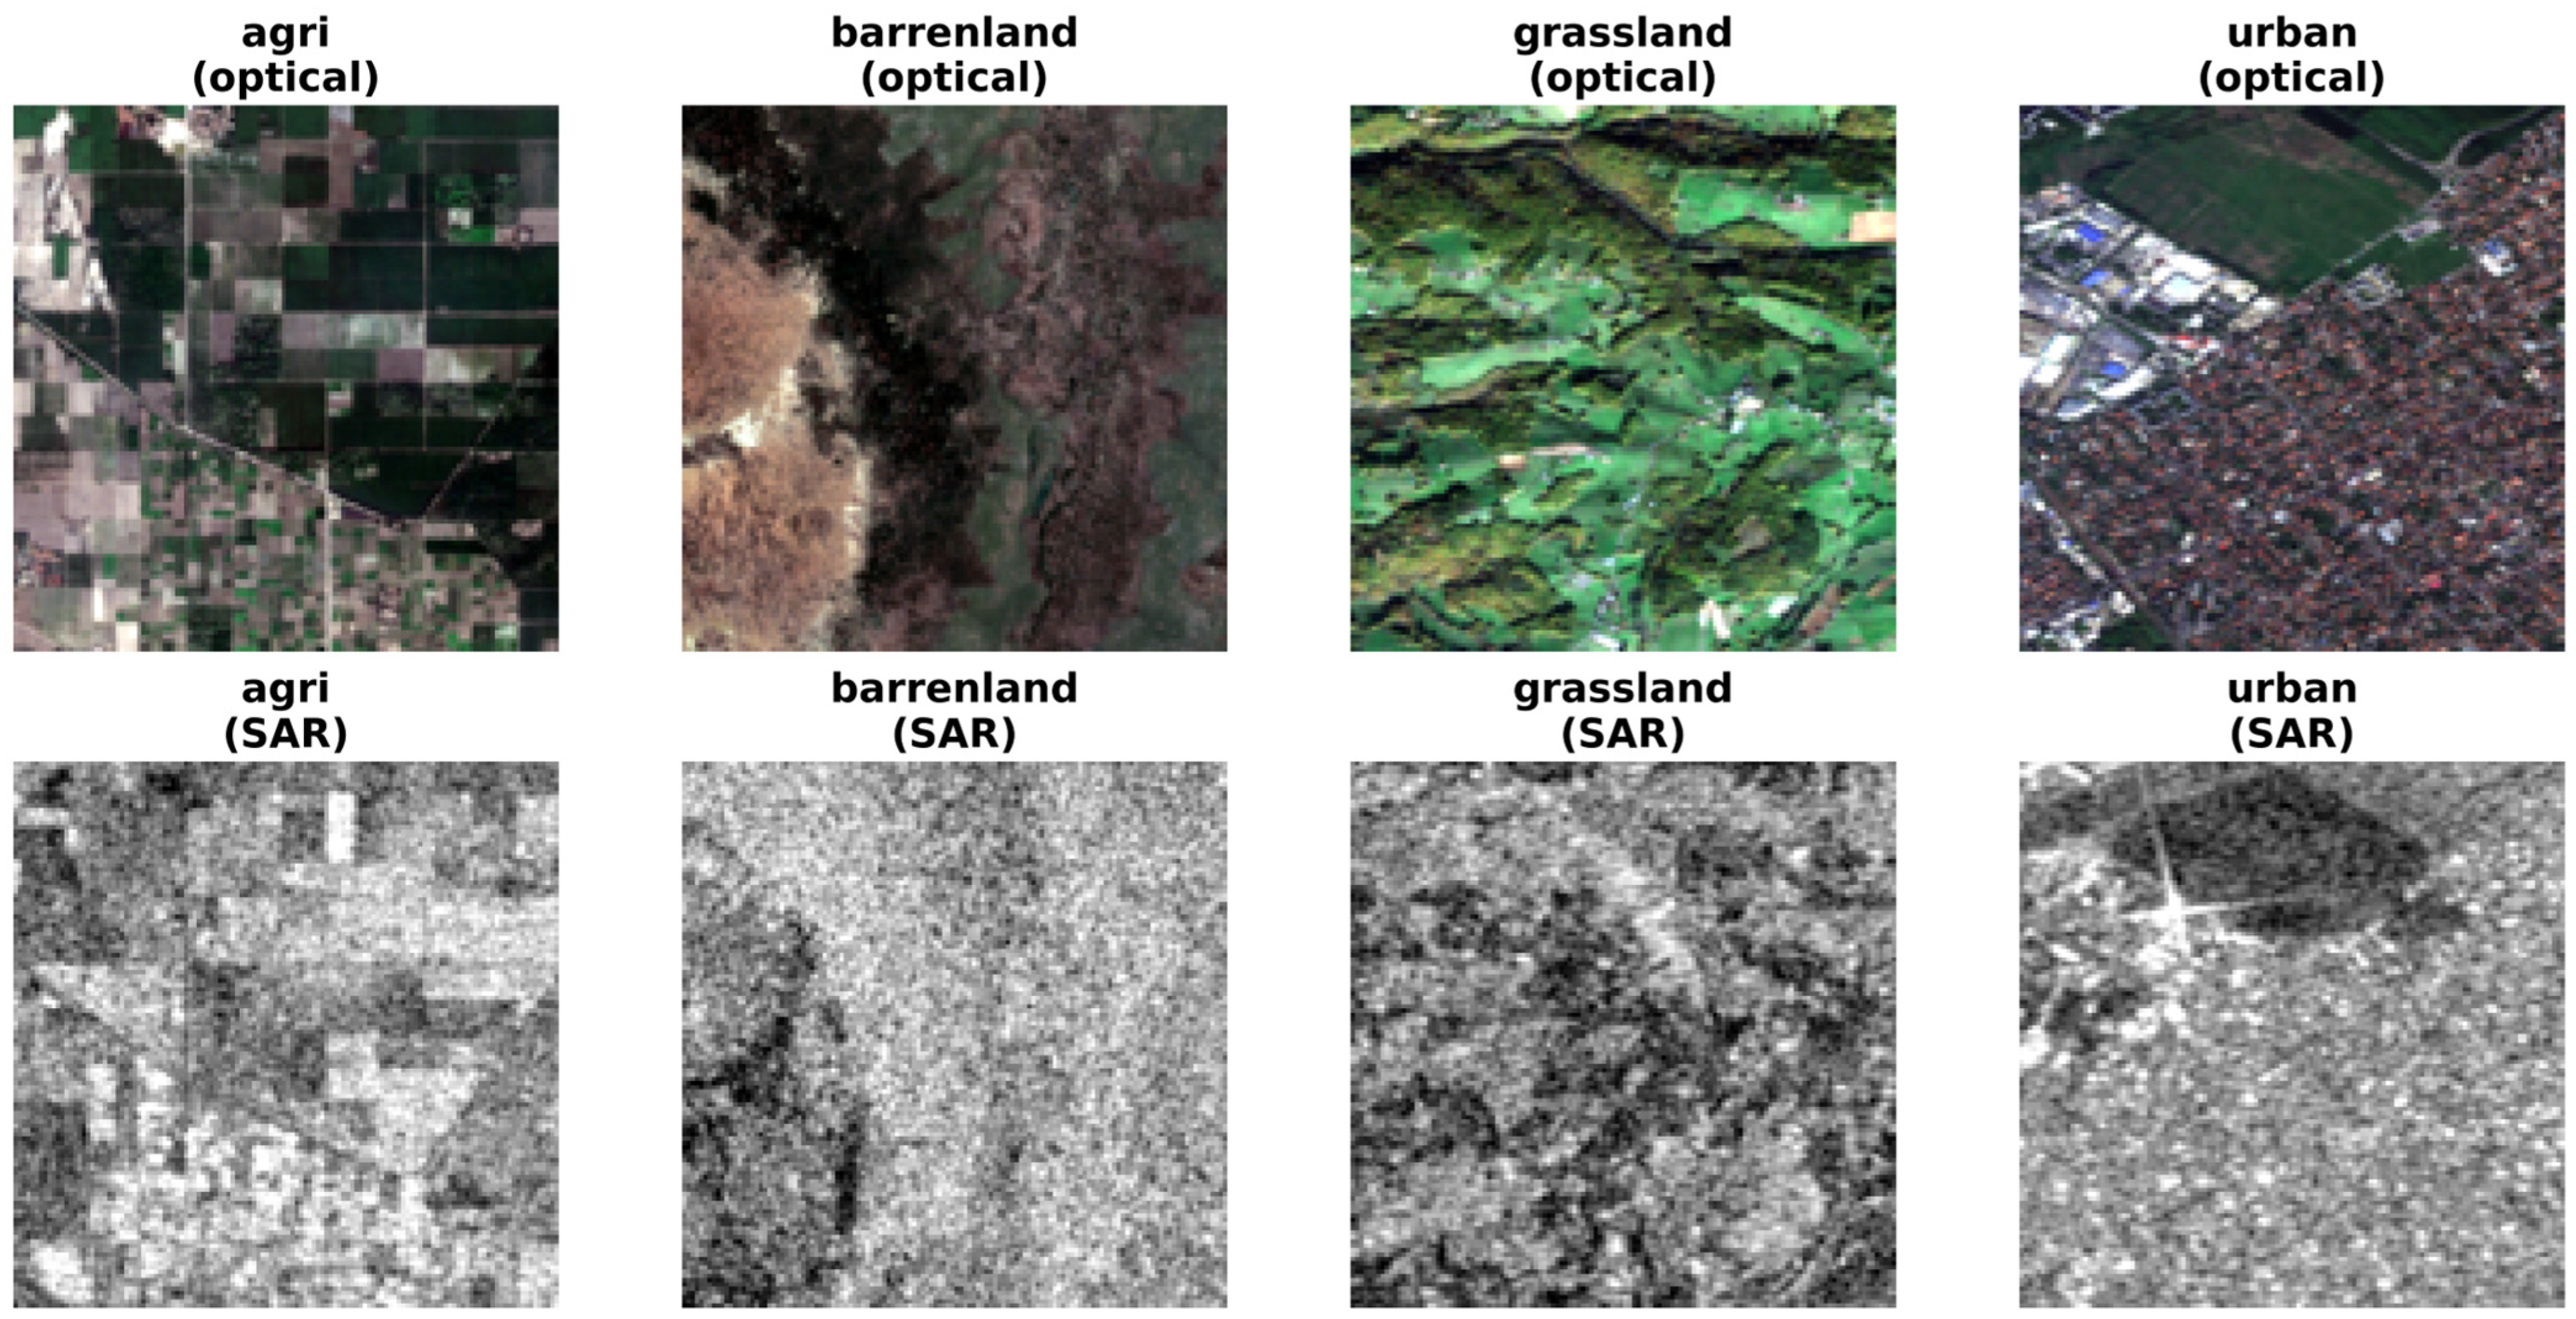
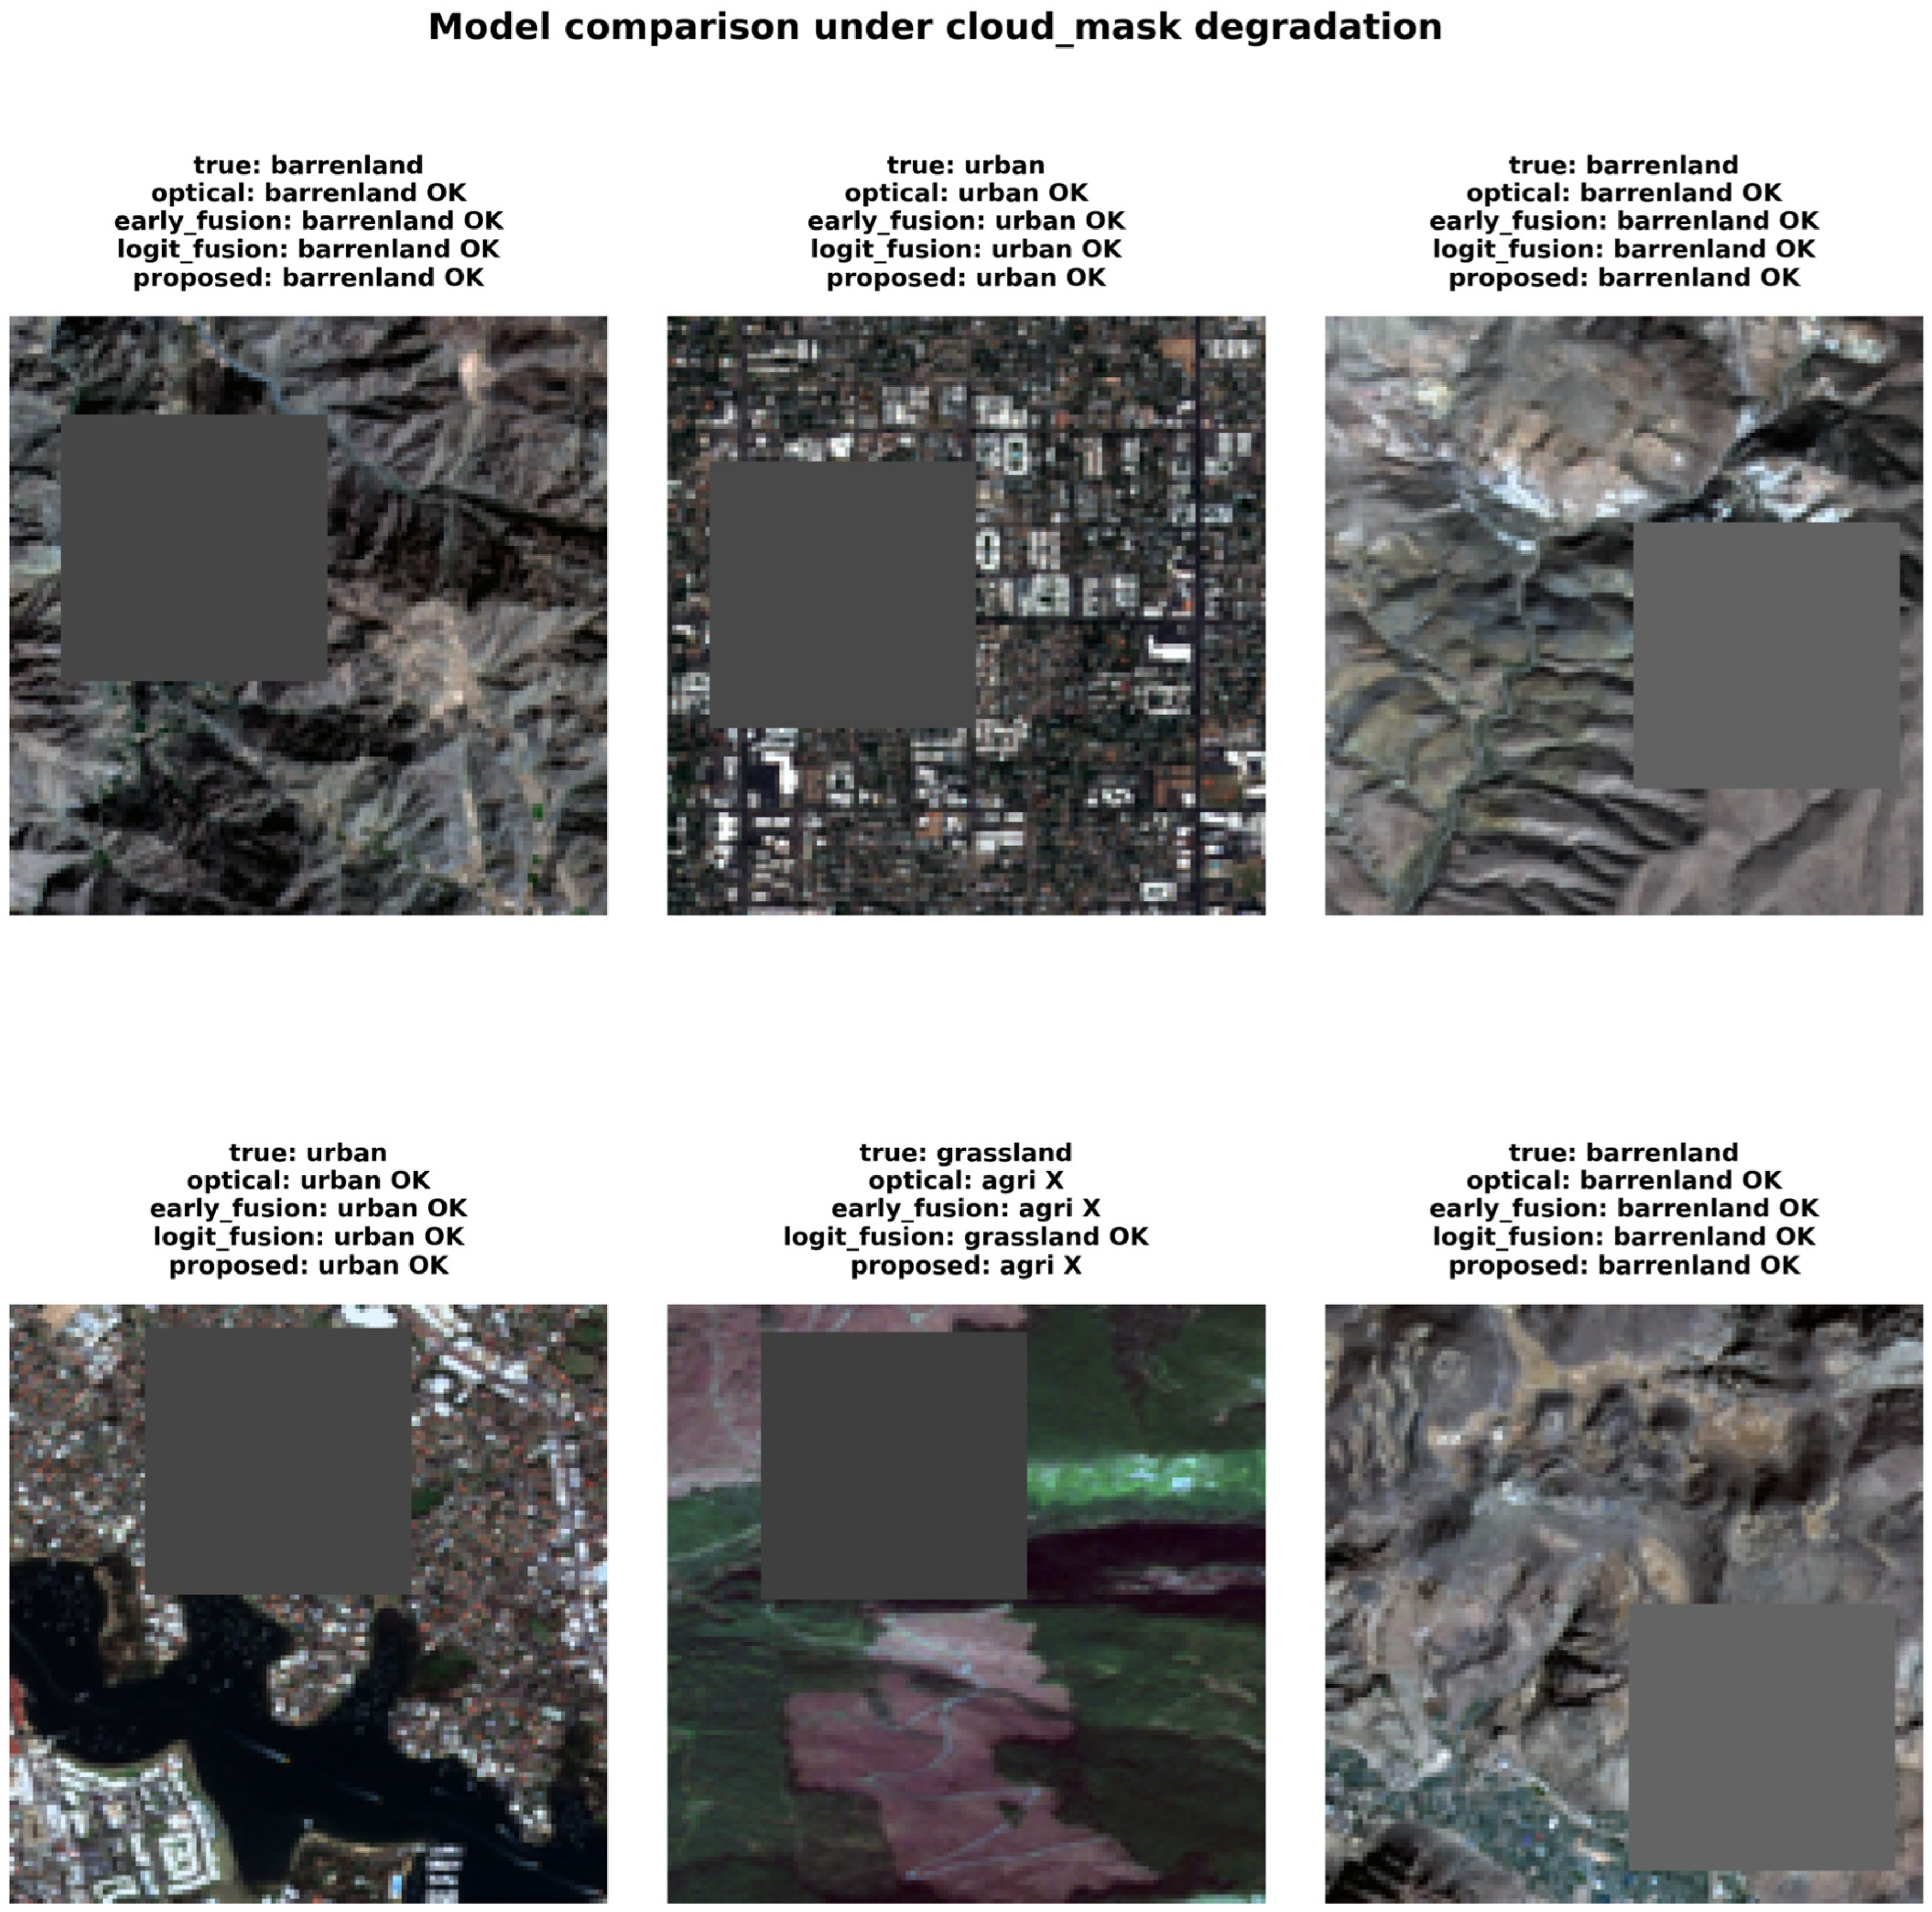
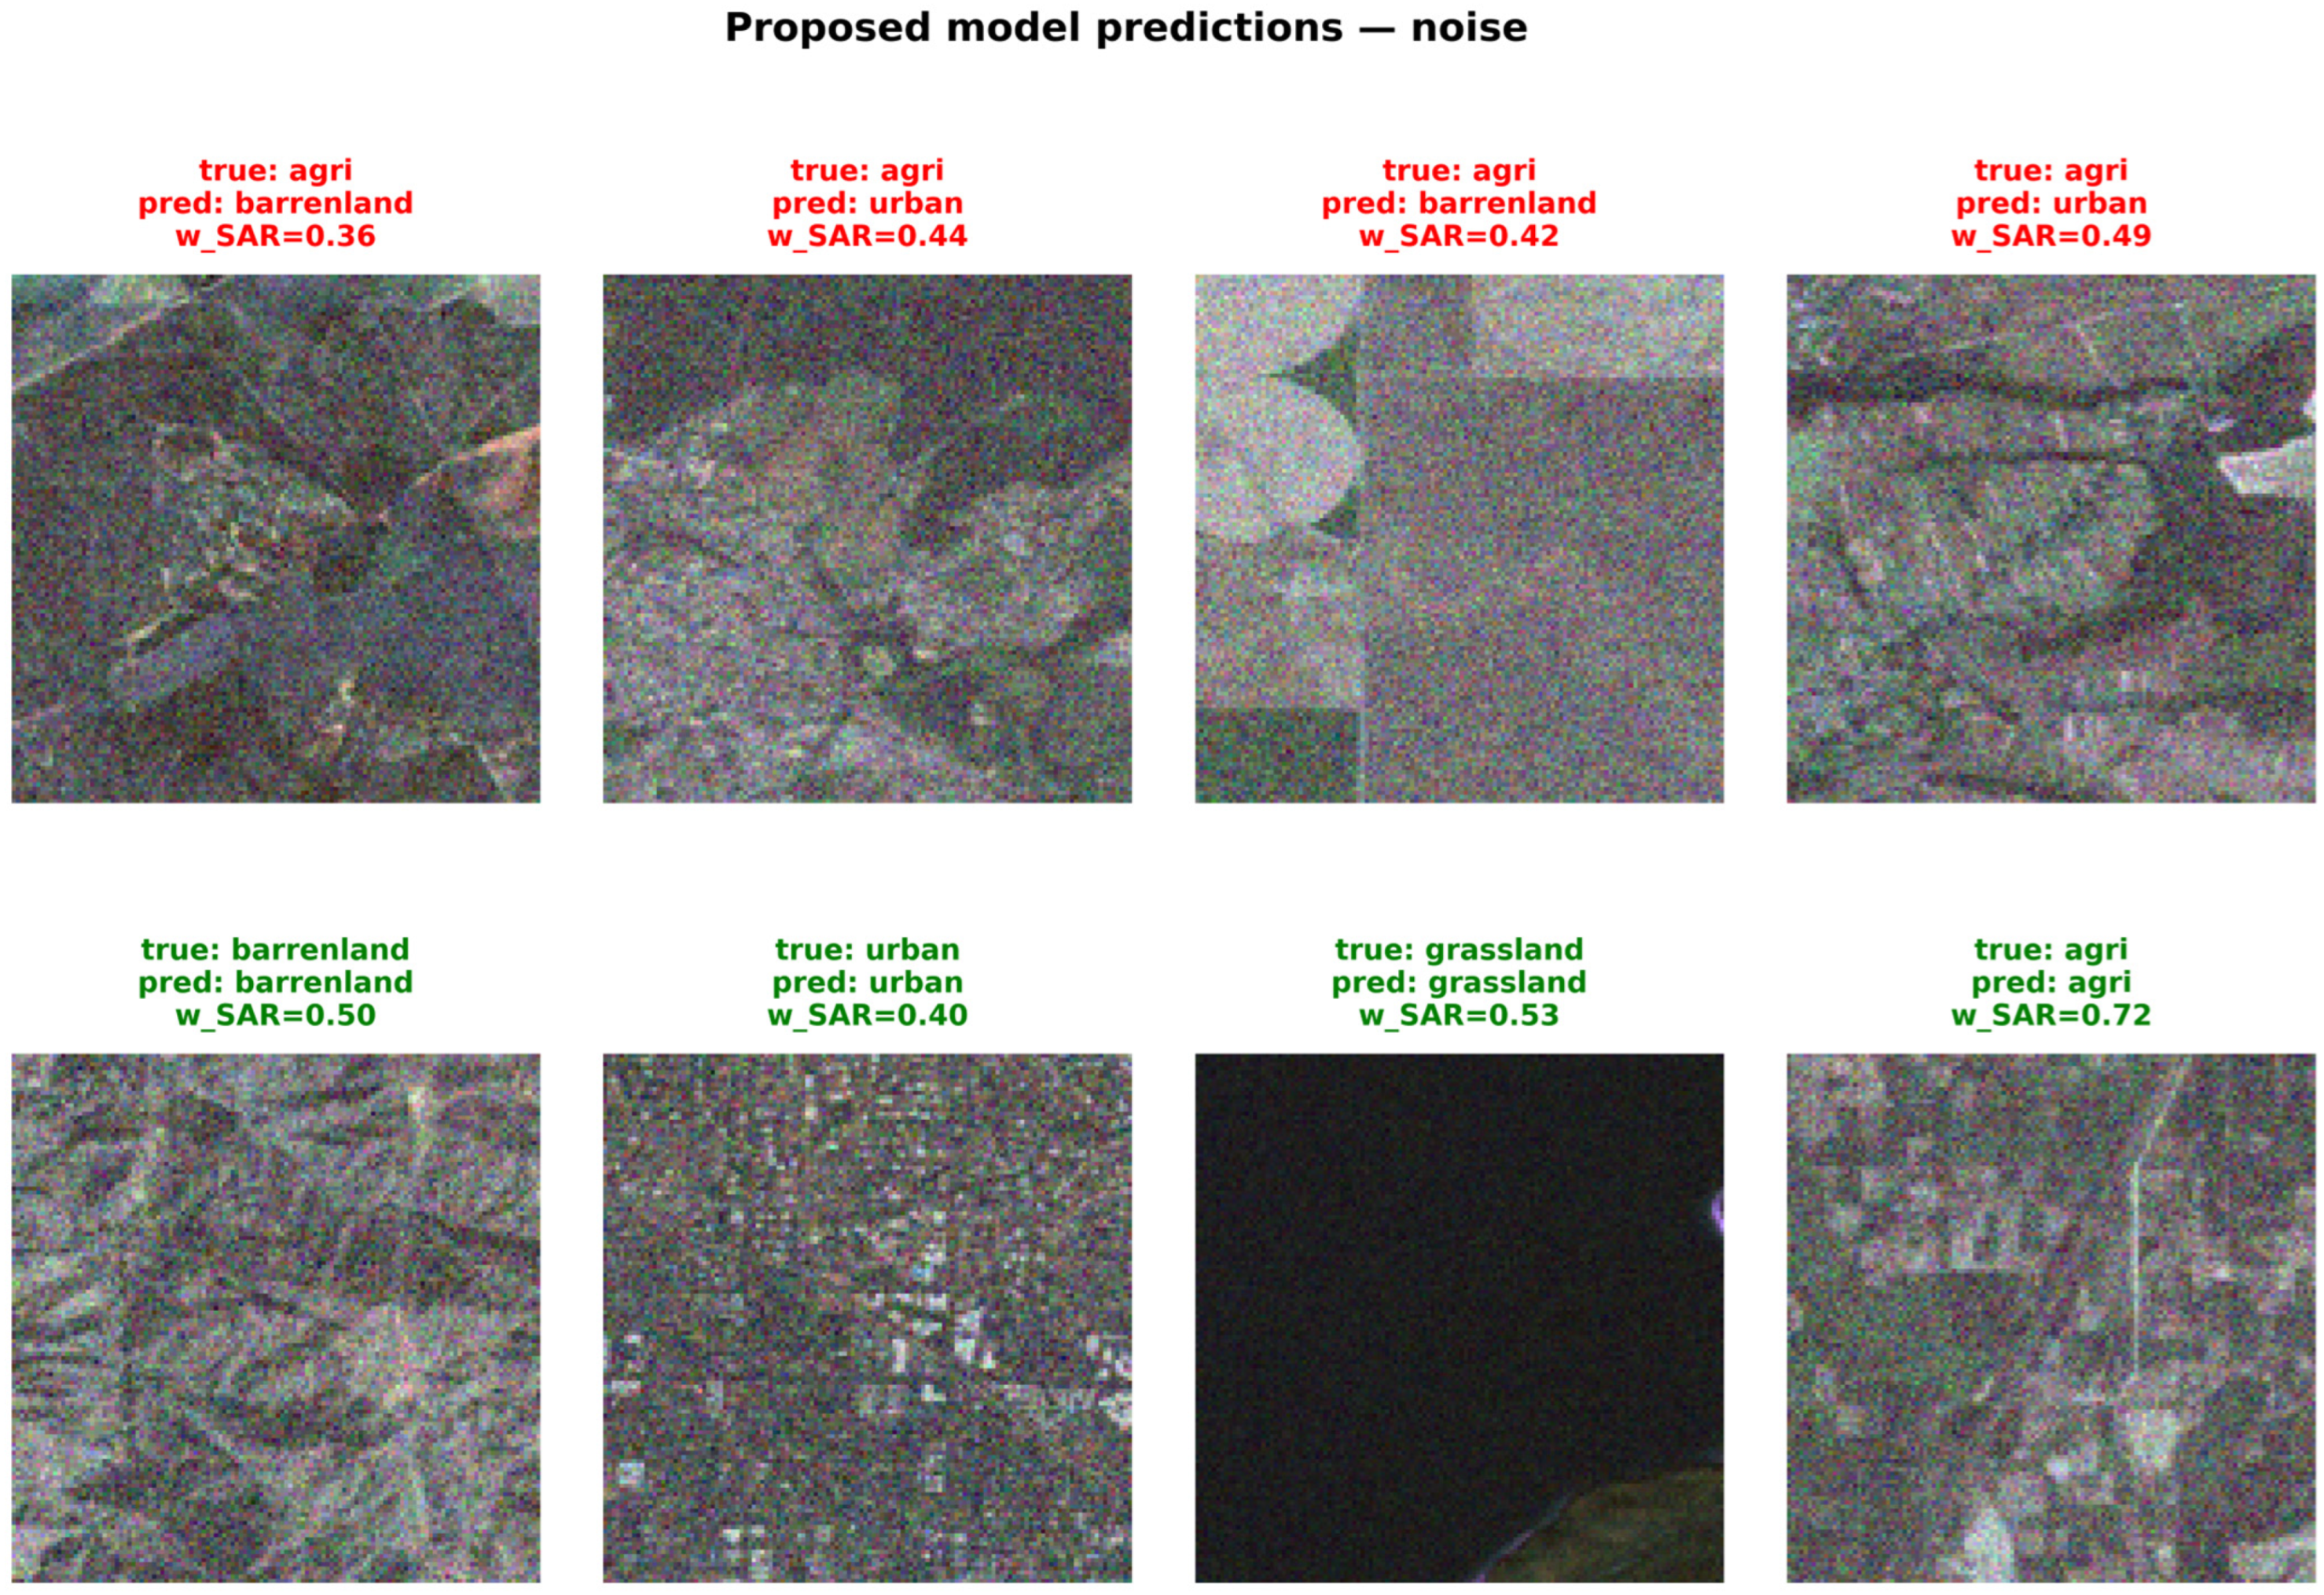
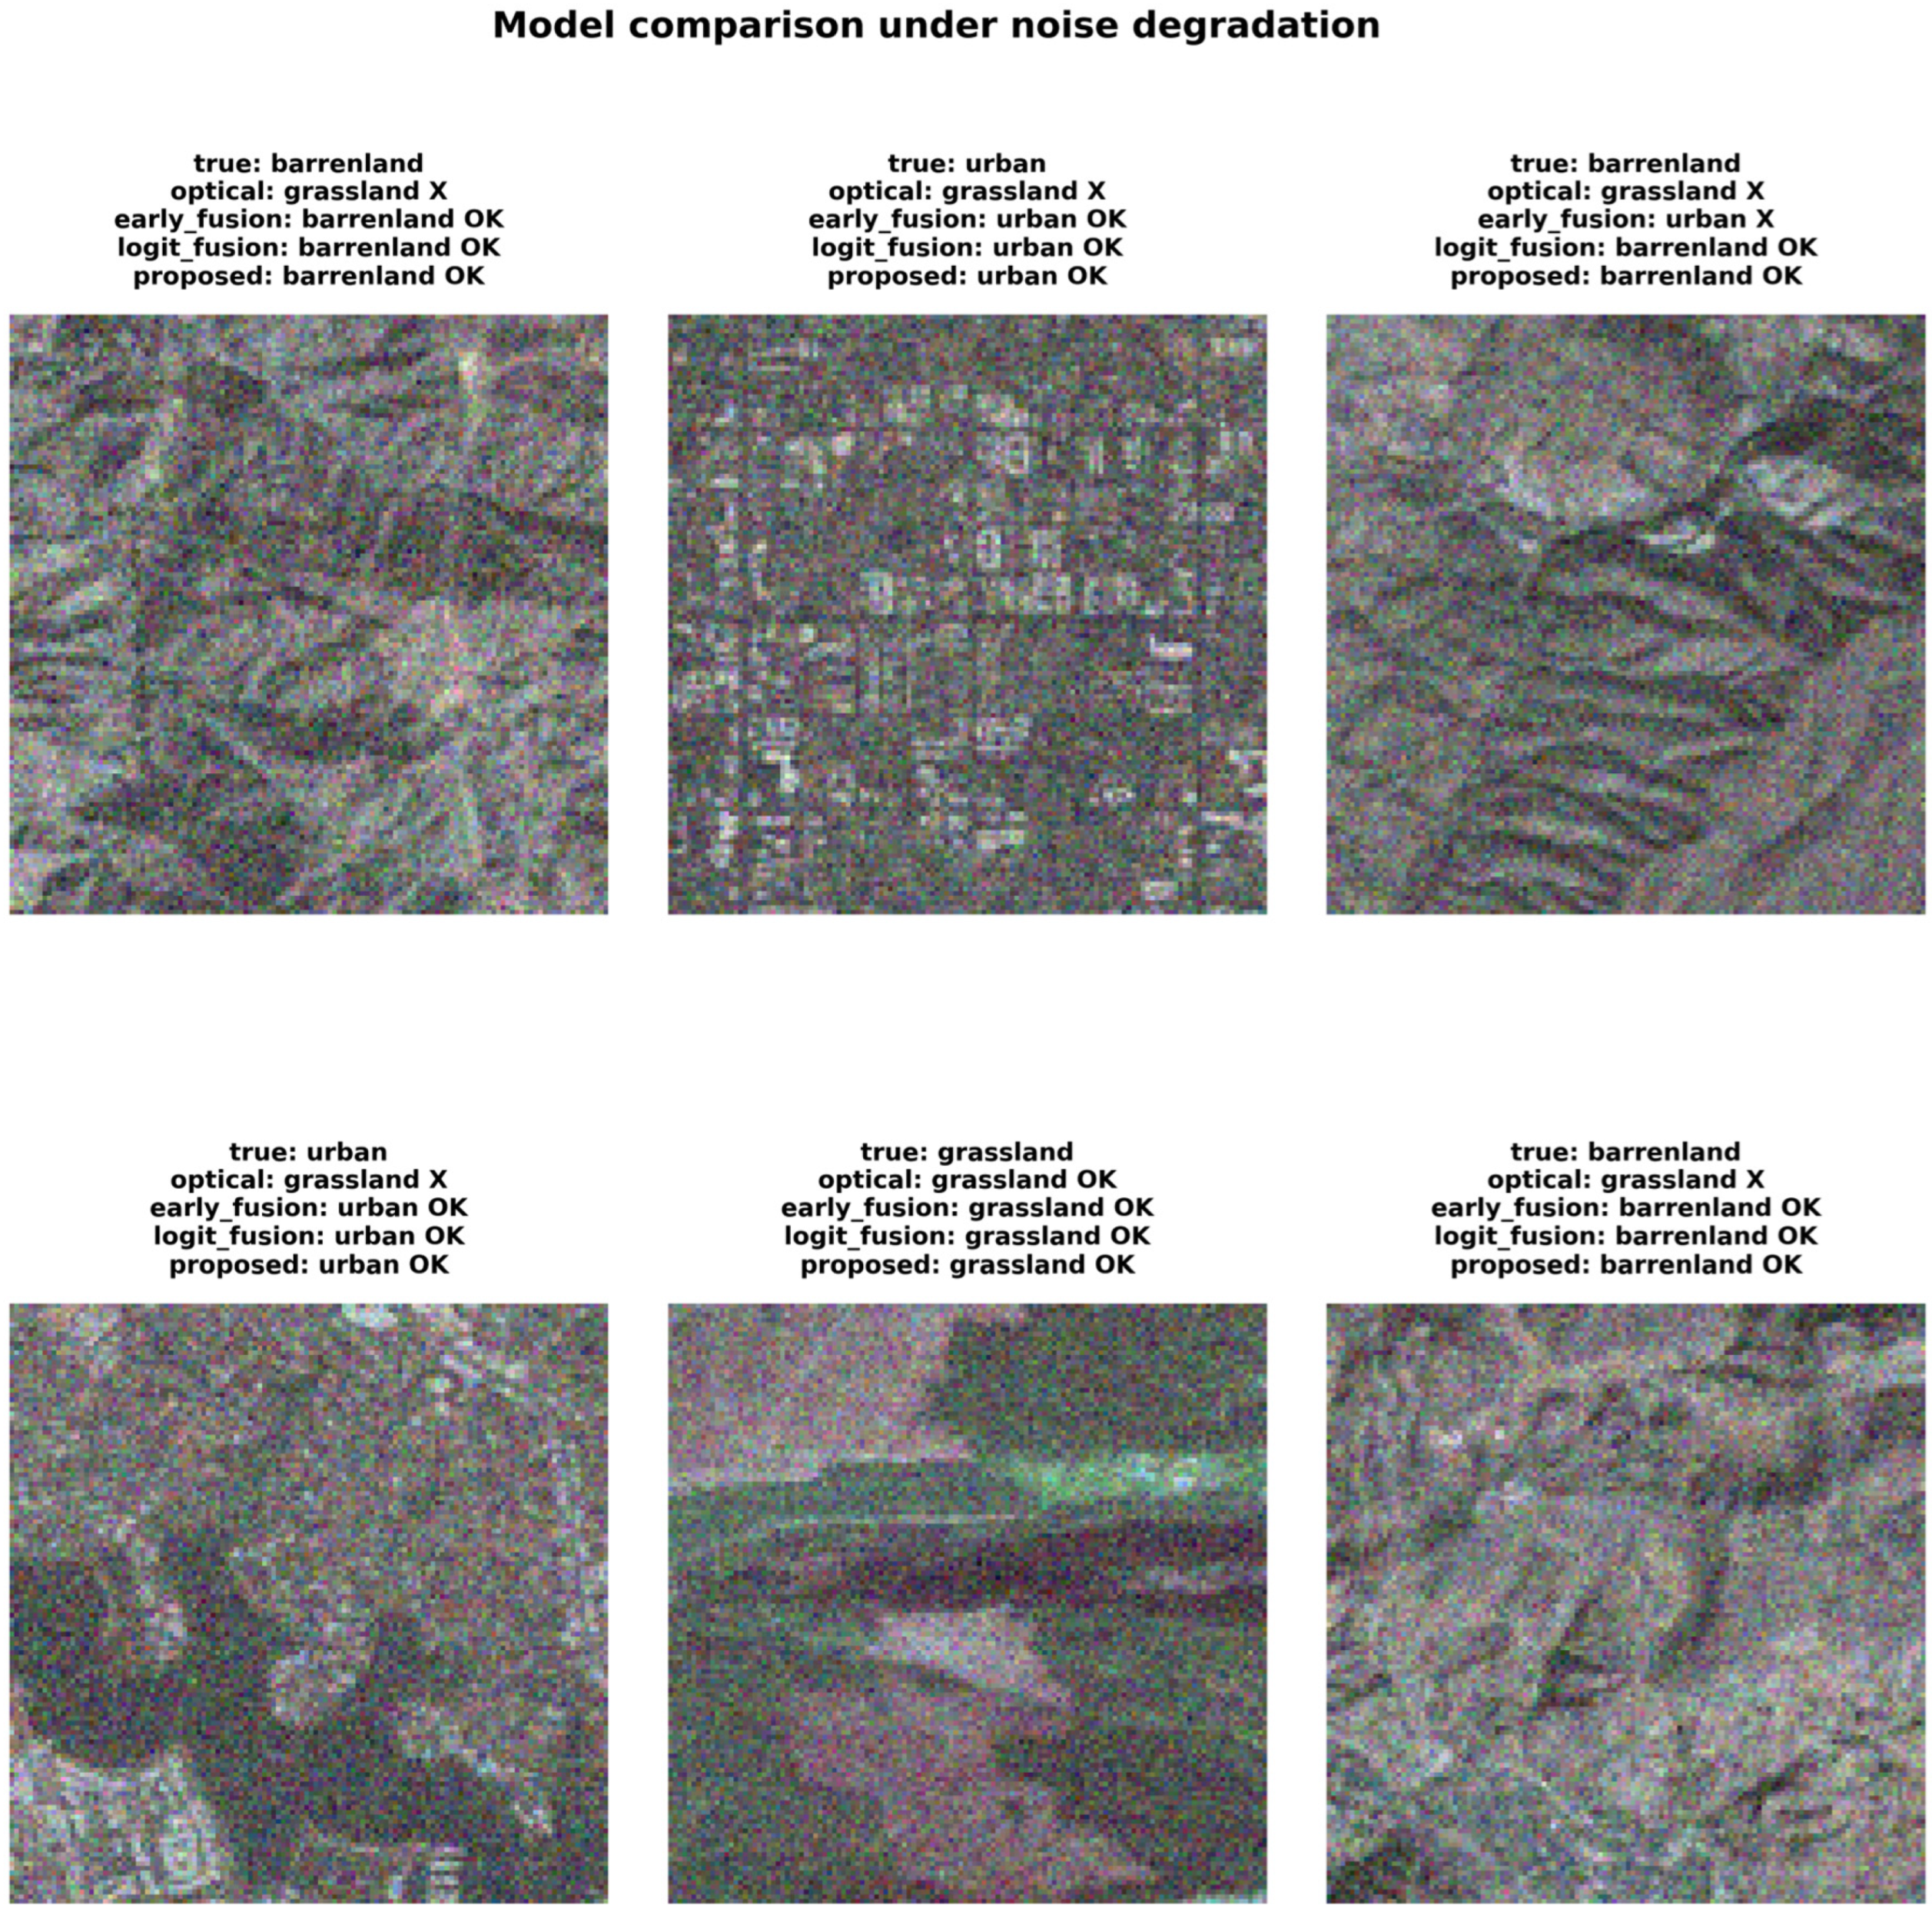
Figure 8,
Figure 9 and
Figure 10 provide qualitative evidence of model behavior.
Figure 8 shows representative Sentinel-1/Sentinel-2 patch pairs for each class, illustrating the complementary appearance of the two modalities.
Figure 9 presents correct and incorrect predictions of the proposed model under clean, Gaussian-noise, channel-drop, and cloud-mask conditions, with the per-sample SAR gate weight annotated above each patch; errors concentrate on visually ambiguous agriculture–barren land and grassland–urban patches, and the annotated per-sample SAR weights (ranging from approximately 0.36 to 0.72 under Gaussian noise) illustrate the sample-specific gating behavior quantified in
Section 3.4, with the gate remaining close to balanced under additive noise rather than committing fully to either modality.
Figure 10 compares optical-only, early-fusion, logit-level fusion, and the proposed model on identical degraded patches, showing cases under Gaussian noise where the optical-only and early-fusion models fail while decision-level models remain correct.
3.7. Multi-Seed Robustness Statistics
Across five seeds, three findings emerge (
Table 7). First, the proposed model’s advantage under Gaussian noise is large and consistent (0.922 ± 0.051, versus 0.651 ± 0.201 for logit-level fusion and 0.293 ± 0.096 for optical-only). Second, under clean, channel-drop, and cloud-mask conditions, the proposed model attains the highest mean accuracy, but the differences from the logit-level fusion variant fall within the cross-seed standard deviation, so these settings should be interpreted as statistically comparable rather than as clear wins. Third, cross-seed variability is greatest under heavy noise (standard deviation 0.236) and modest in the other settings (0.006–0.051), and gate-weight averages also vary across seeds. These statistics quantify the training-variance concern raised during review and are the basis for all comparative claims in this paper.
3.8. Spatially Independent Scene-Level Evaluation
All models lose substantial accuracy under the scene-held-out split relative to the random split (for example, the proposed model decreases from 96.0% to 67.5% on clean inputs), quantifying how strongly random splits overestimate performance on this dataset. This scene held-out split is a limited spatial-independence test rather than a full spatial-transferability assessment; broader spatial generalization across different ecoregions, seasons, and acquisition contexts remains future work. Under spatially independent testing, the optical-only model is strongest on clean inputs (78.6%), suggesting that the fusion models partly overfit scene-specific SAR texture. The robustness ordering, however, is preserved: the proposed model remains clearly strongest under Gaussian noise (77.0%, versus 36.3% for logit-level fusion and 51.0% for optical-only) and performs at 58.1% under heavy noise and 65.7% under mixed degradation. The noise-robustness contribution of reliability-aware fusion therefore persists under spatially independent evaluation, while absolute performance levels from random splits should not be interpreted as operational estimates. The scene-held-out models were trained separately under the spatially independent protocol described in
Section 2.10; the absolute values in
Table 8 therefore correspond to that protocol rather than to the representative random-split run reported in
Table 3,
Table 4,
Table 5 and
Table 6.
3.9. Qualitative Results on Real Cloud-Contaminated Imagery
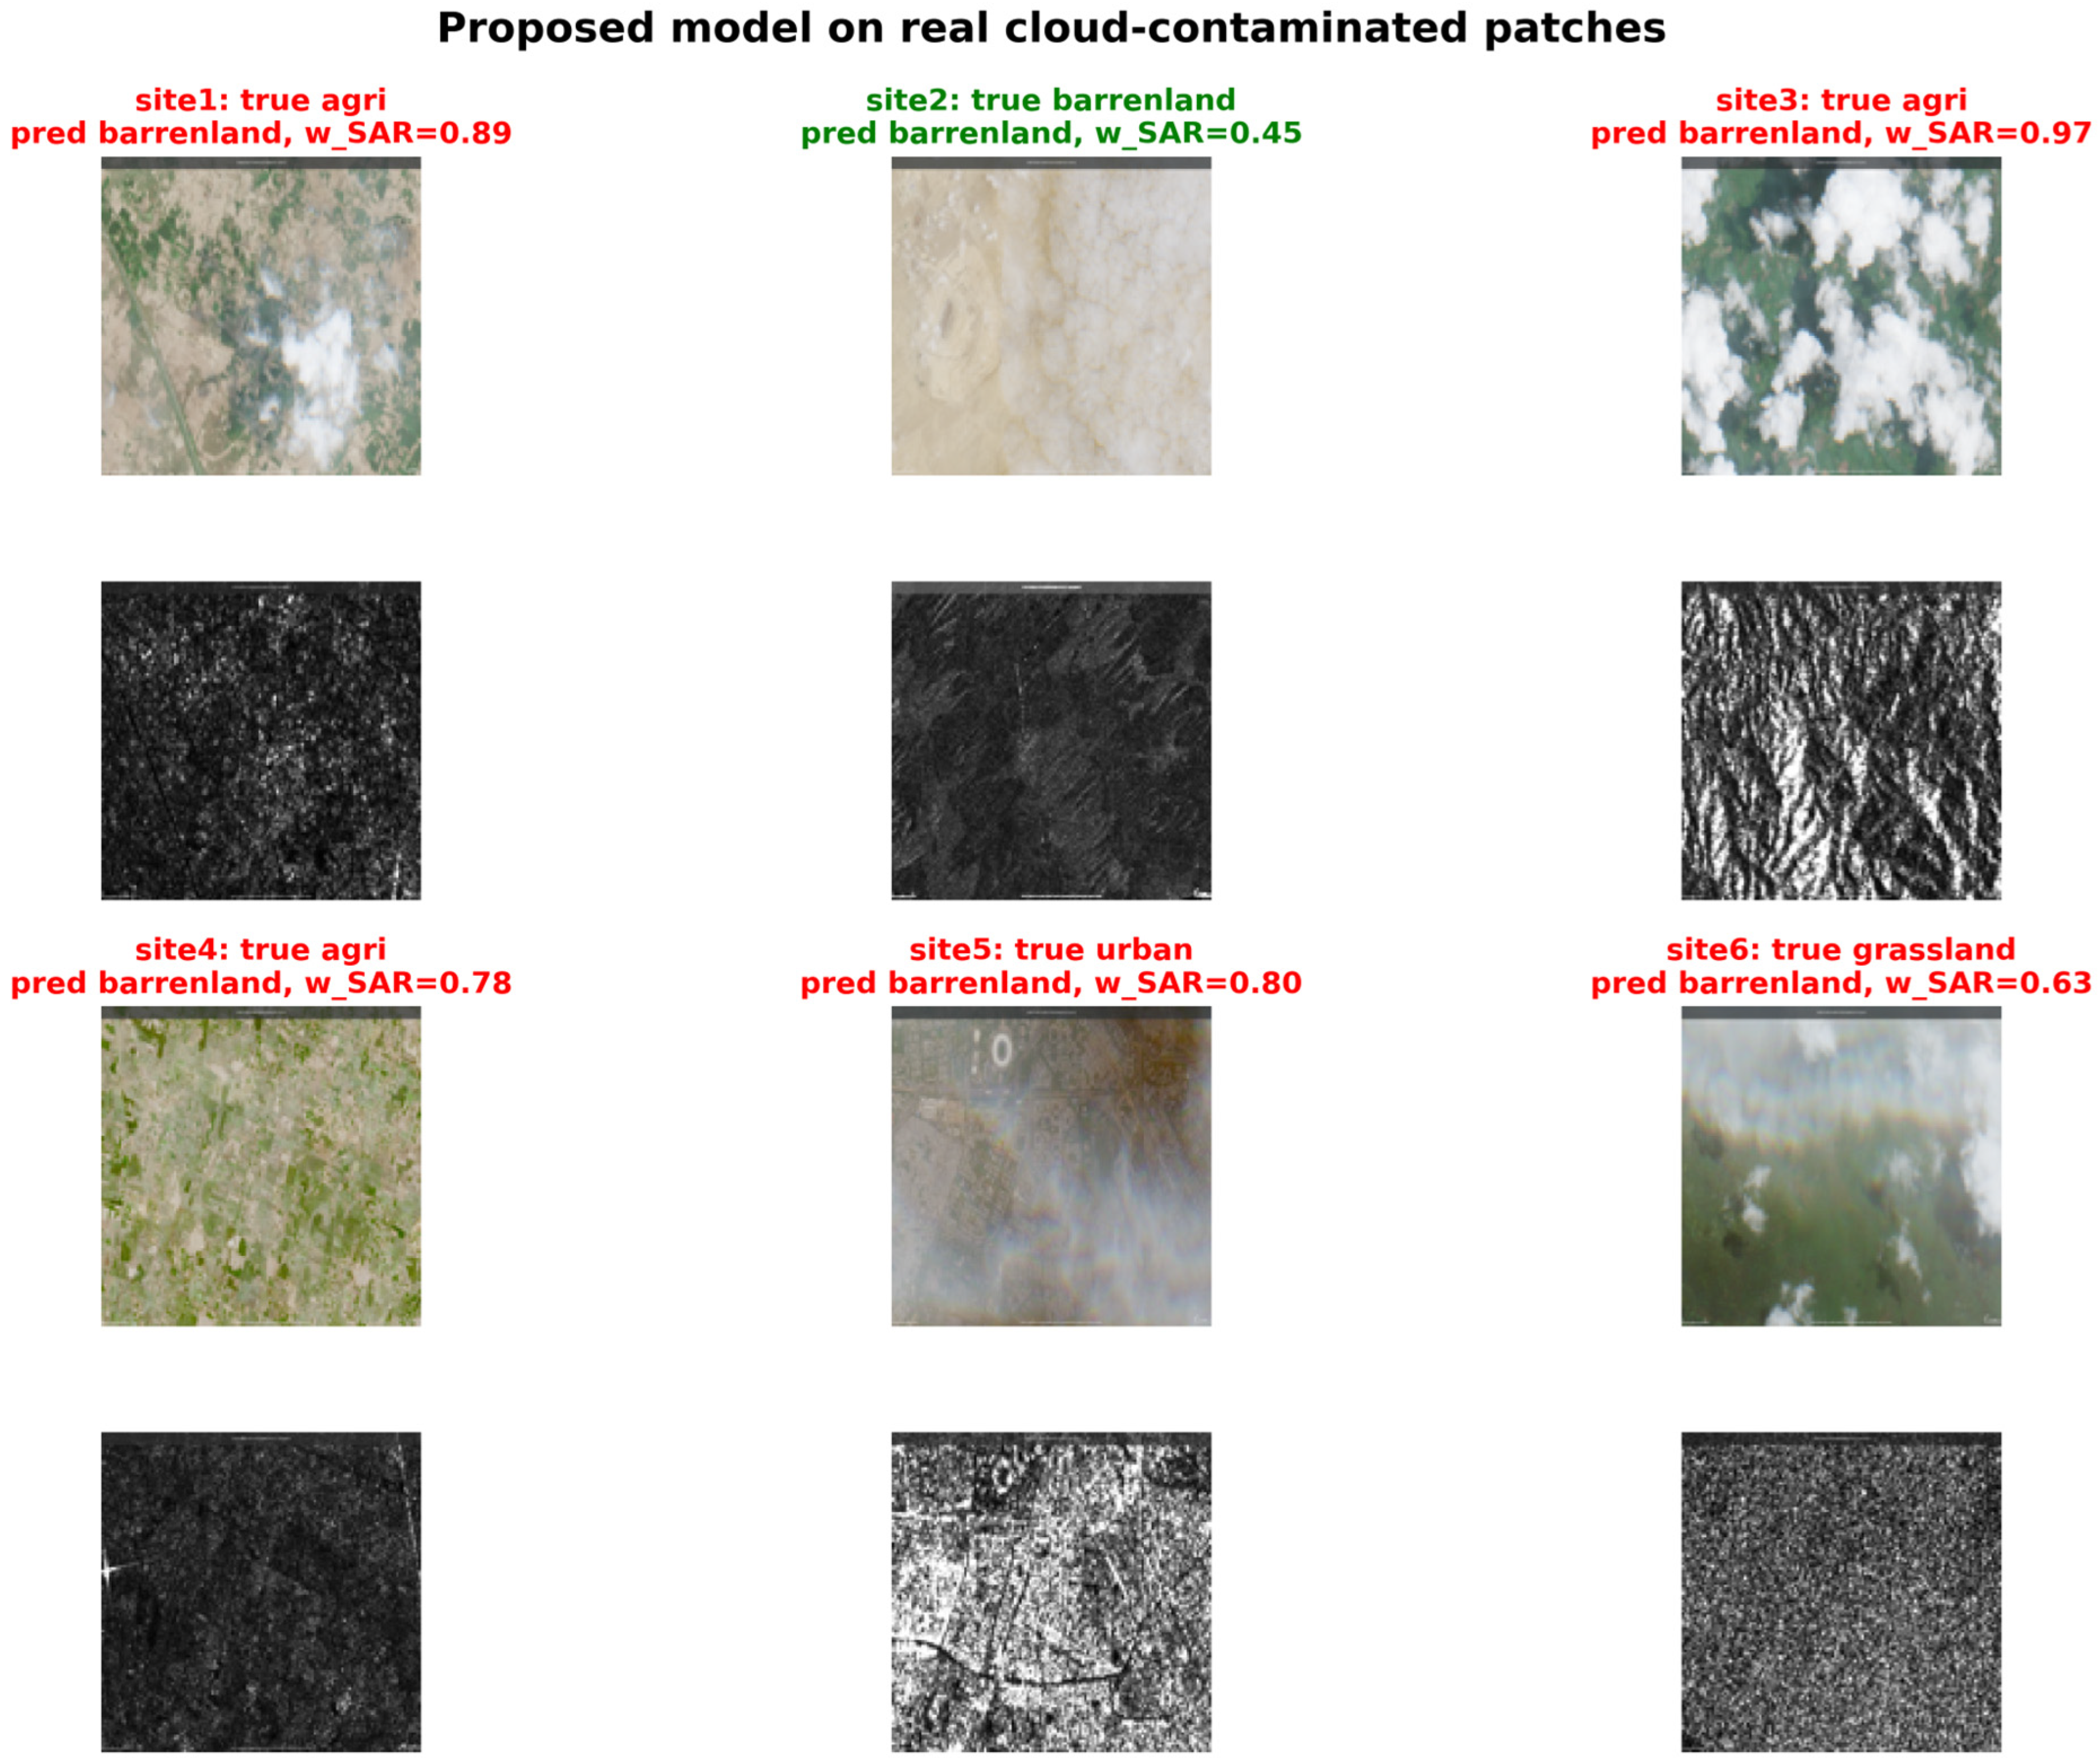
On the six browser-exported real cloudy sites (
Figure 11), the model predicted barren land for all inputs, with only the genuinely barren land site (site 2) classified correctly. The SAR branch predicted barren land for five of six sites and the optical branch for two of six, while gate weights ranged from 0.45 to 0.97 (SAR), indicating that the gate’s sample-specific weighting did not correct the underlying misclassification. This uniform failure pattern indicates strong sensitivity to the domain shift between browser-rendered exports and the curated dataset patches (different radiometric scaling, spatial footprint, and SAR visualization), rather than cloud contamination alone. This result demonstrates that robustness to synthetic degradation does not imply out-of-distribution operational robustness, and that deployment would require preprocessing that matches the training distribution.
3.10. Summary of Results
Four main findings emerge from the experimental results. First, optical imagery is highly effective for clean patch classification, but optical-reliant models can fail sharply under Gaussian noise. Second, across five seeds, the proposed reliability-aware model is statistically comparable to the strongest baselines under clean, channel-drop, and cloud-mask conditions and is clearly the strongest under Gaussian noise; this noise-robustness advantage persists under a scene-held-out spatial split. Third, training variance is substantial for all fusion models, so multi-seed statistics-not single runs-are required for reliable comparisons. Fourth, the reliability gate is partly interpretable and directionally calibrated under moderate degradation, but exhibits a documented failure mode under heavy noise and does not transfer to out-of-distribution browser-rendered imagery, defining clear boundaries of the current method.
4. Discussion
The experimental results support a more nuanced interpretation of reliability-aware SAR-optical fusion. Optical imagery remains highly effective for clean land cover classification, as shown by the strong optical-only and early-fusion results under clean inputs. This is consistent with prior work showing that Sentinel-2 and other optical imagery provide rich spectral information for distinguishing vegetation, soil, urban surfaces, and other land cover types [
1,
2]. However, the same optical-only model dropped sharply under Gaussian noise, confirming the central issue raised in the Introduction: clean-input performance alone is not sufficient for evaluating the operational reliability of remote sensing classifiers.
The results also align with multisource remote sensing studies that emphasize the complementary roles of SAR and optical imagery [
6,
7]. Sentinel-1 SAR provides structural and backscattering information and is less dependent on illumination and cloud-free optical conditions [
4,
5], whereas Sentinel-2 optical imagery provides discriminative spectral information under favorable acquisition conditions [
3]. In this study, the radar-only baseline was stable because optical degradation did not affect it, but it was less accurate than the best multimodal models under clean and several degraded settings. This supports the interpretation that SAR should not be treated as a full replacement for optical imagery; rather, it is most useful as a complementary modality when optical observations become unreliable.
Compared with early fusion, the proposed reliability-aware model better addresses the risk of corrupted optical information entering the final prediction. Early fusion combines SAR and optical channels before feature extraction, which is simple but can allow degraded optical patterns to influence the shared representation. This weakness is clearest under Gaussian noise, where optical-only and early-fusion performance declined severely, while the proposed reliability-aware model achieved the strongest accuracy among all compared models. This result suggests that preserving modality-specific evidence and applying adaptive reliability weighting can improve robustness when optical inputs are noisy.
The ablation comparison further clarifies the role of fusion design. The feature-level fusion variant was less robust because it combines intermediate representations before the model produced modality-specific decision evidence. The logit-level fusion variant improved clean, channel-drop, and cloud-mask performance by preserving separate prediction pathways for SAR and optical inputs. The proposed reliability-aware fusion model extended this design by using feature representations, prediction confidence, and optical quality descriptors to estimate adaptive fusion weights. Its advantage is clearest and largest under additive Gaussian noise; under clean, channel-drop, and cloud-mask conditions, the proposed model attains the highest mean accuracy across seeds, though the margins over the logit-level fusion variant fall within the cross-seed standard deviation (
Section 3.7). Therefore, the proposed method should be framed as a robustness-oriented fusion strategy whose comparative claims rest on multi-seed statistics rather than single-run rankings.
The reliability-gate analysis provides interpretability beyond aggregate accuracy. In the representative run, the gate assigned moderately higher average weight to SAR under most settings and shifted most strongly toward SAR under channel-drop degradation, which is physically reasonable because channel drop directly removes optical information. The correctness-conditioned analysis in
Section 3.4 further shows that the gate is directionally calibrated under moderate degradation, assigning more optical weight when the optical branch is correct. Under heavy noise, however, the gate inverted, over-trusting the corrupted optical branch, which caused the largest failure observed in this study.
The reliability gate has clear limitations. First, its behavior under heavy noise is unstable across training runs: although the representative model retained 86.3% accuracy with near-balanced weighting, the cross-seed mean was only 0.604 ± 0.236, so some seeds degrade sharply. Second, the fused prediction can follow the branch with larger logit magnitudes even when its gate weight is near 0.5, so logit-scale calibration between branches matters. Third, the gate is trained on a fixed synthetic degradation menu, and degradations outside this menu—including the domain shift in browser-rendered real imagery in
Section 3.9—are not recognized. These limitations motivate calibration-aware confidence measures, logit standardization between branches, and training with broader degradation families.
The per-class F1 and confusion-matrix analyses show that the proposed model retains strong multi-class discrimination under most conditions, but the errors are not uniformly distributed. Under Gaussian noise, all four classes maintained high F1-scores, which supports the robustness claim. Under heavy noise, the representative model maintained balanced per-class F1 (0.801–0.925) rather than collapsing, though the wide cross-seed variance indicates this balance is run-dependent. Residual errors under moderate degradation concentrate on visually similar agriculture–barren land and grassland–urban patch pairs (
Figure 9), suggesting future work should focus on separating spectrally and structurally similar classes.
Limitations and Future Work
Several limitations should be considered when interpreting the results. First, the current implementation uses one grayscale Sentinel-1 SAR channel and three-channel Sentinel-2 RGB optical composites rather than the full Sentinel-1 dual-polarization and full Sentinel-2 multispectral band set. Although this simplified configuration supports controlled experimentation and reduces computational cost, it does not fully exploit the spectral and polarimetric information available from the original satellite products. Future work should evaluate the same reliability-aware fusion strategy using full Sentinel-1 Vertical transmit, Vertical receive (VV)/Vertical transmit, Horizontal receive (VH) polarizations and additional Sentinel-2 multispectral bands.
Second, the degradation protocol uses synthetic corruptions rather than real atmospheric or sensor artifacts. Gaussian noise, channel drop, cloud masks, and mixed degradation provide controlled stress tests that make it possible to compare model behavior across known failure modes. However, real cloud cover, haze, shadow, seasonal differences, atmospheric scattering, and acquisition artifacts are more complex than rectangular masks or additive noise. Future experiments should evaluate the model on real cloud-contaminated Sentinel-2 observations and, where possible, compare synthetic degradation performance with real degraded-scene performance.
Third, although the proposed model attains the highest mean accuracy in every evaluated setting across five seeds, its advantage is decisive only under Gaussian noise; under clean, channel-drop, and cloud-mask conditions, the margins over simpler logit-level fusion fall within the cross-seed standard deviation and should not be interpreted as clear superiority. This does not invalidate the reliability-aware approach, but it narrows the interpretation of the contribution. The main contribution is not universal accuracy dominance; rather, it is the demonstration that adaptive reliability estimation can substantially improve robustness when optical information becomes noisy while also providing interpretable modality-weight behavior.
Fourth, the reliability gate uses relatively simple confidence and optical quality descriptors. These descriptors capture useful signals such as prediction confidence, entropy, near-zero-pixel fractions, and high-absolute-value pixel fractions, but they may not fully characterize all forms of degradation. Future work should investigate stronger uncertainty estimation, calibration-aware confidence measures, learned quality-estimation modules, and explicit corruption-level supervision. These improvements may allow the gate to distinguish more reliably between optical inputs that are clean, partially missing, cloud-contaminated, or severely corrupted.
Fifth, although this revision adds multi-seed statistics (
Section 3.7) and a scene-held-out spatial evaluation (
Section 3.8), the dataset itself originates almost entirely from a single region-season combination (ROIs1970_fall), so cross-region and cross-season generalization cannot be assessed with this distribution; the scene-held-out split is the strongest spatial test available here. The large gap between random-split and scene-held-out accuracy further indicates that random-split results should not be interpreted as operational performance estimates. A stronger future evaluation would test whether the learned reliability behavior generalizes to geographically diverse datasets, additional seasons, full-band inputs, and real-world deployment settings.
Finally, the current study focuses on four land cover classes: agriculture, barren land, grassland, and urban. These classes provide a useful controlled benchmark, but operational land cover mapping often requires more classes and finer distinctions. Future work should extend the framework to larger land cover taxonomies, pixel-level semantic segmentation, temporal image sequences, and uncertainty-aware operational mapping workflows.
Overall, the findings are consistent with the broader SAR-optical fusion literature in showing that multimodal data can improve remote sensing classification, but they add a specific robustness-oriented perspective: fusion should account for the reliability of each modality at inference time. The proposed framework is most compelling when optical imagery is degraded by additive noise, and the learned gate provides useful diagnostic information about modality trust. Future work should evaluate the approach using real cloudy imagery, full multispectral inputs, independent geographic test sets, stronger uncertainty estimation, and calibration-aware reliability gates.
5. Conclusions
This study proposed a reliability-aware cross-modal fusion framework for patch-level land cover scene classification using paired Sentinel-1 SAR and Sentinel-2 optical imagery. The framework uses modality-specific encoders, independent classification heads, and a noise-aware reliability gate to adaptively combine SAR and optical predictions.
Experiments on a balanced four-class SAR-optical dataset derived from SEN12MS, regenerated under deterministic settings and reported over five random seeds, showed that the proposed model achieves the highest or statistically comparable mean accuracy under clean (0.961 ± 0.008), channel-drop (0.931 ± 0.018), and cloud-mask (0.961 ± 0.006) conditions, and a clear advantage under Gaussian noise (0.922 ± 0.051, versus 0.651 ± 0.201 for logit-level fusion and 0.293 ± 0.096 for optical-only). In the representative run, the proposed model reached 96.0% clean accuracy and 95.8% under Gaussian noise. A scene-held-out spatial evaluation confirmed that the noise-robustness advantage persists under spatially independent testing (77.0% versus 36.3% for logit-level fusion), although absolute accuracy decreases for all models.
The study also establishes the boundaries of the method: heavy Gaussian noise remains the most difficult and least stable condition (0.604 ± 0.236 across seeds), even though the representative run retained 86.3% accuracy; and a qualitative test on browser-exported real cloudy imagery revealed strong sensitivity to out-of-distribution preprocessing. These findings define where reliability estimation must become more robust—through calibration-aware confidence measures, cross-branch logit standardization, and broader degradation training.
Future work should evaluate the framework using full Sentinel-1 and Sentinel-2 bands, real cloud-contaminated imagery, geographically diverse datasets, and additional land cover classes. Overall, the results suggest that adaptive reliability-aware SAR-optical fusion can support more dependable patch-level land cover scene classification under imperfect observation conditions, particularly when optical imagery is corrupted by noise. Robust classification under real cloud contamination and domain shift is not yet demonstrated and remains future work.