Article

Evaluation of IMERG V07 Precipitation Datasets at Hourly and Daily Scales in Texas, USA

by
Temesgen Gashaw Tarkegn
,
Samiksha Ray
,
Gebrekidan Worku Tefera
and
Ram Lakhan Ray
*
College of Agriculture, Food and Natural Resources, Prairie View A&M University, Prairie View, TX 77446, USA
*
Author to whom correspondence should be addressed.
Remote Sens. 2026, 18(14), 2401; https://doi.org/10.3390/rs18142401
Submission received: 8 June 2026 / Revised: 17 July 2026 / Accepted: 18 July 2026 / Published: 20 July 2026
(This article belongs to the Special Issue Remote Sensing for Hydrological Management)

Highlights

What are the main findings?
  • IMERG performance varies by station, timescale, and precipitation metrics.
  • Although IMERG-Final is the calibrated product recommended for research, IMERG-Early and IMERG-Late performed better for certain metrics, timescales, and stations.
What are the implications of the main finding?
  • The variations in the performance of IMERG products across temporal resolutions, monitoring sites, and precipitation metrics highlight the importance of selecting the most appropriate IMERG product for a specific region and application.
  • Because IMERG-Final does not consistently perform best across all precipitation metrics, temporal scales, and locations, using it without prior evaluation may lead to less accurate precipitation estimates for specific applications.

Abstract

This study evaluates the performance of the Integrated Multi-satellite Retrievals for Global Precipitation Measurement (IMERG) version 7 (IMERG v07) datasets (IMERG-Early, IMERG-Late, and IMERG-Final) in estimating precipitation at hourly and daily scales using PIERS station data from Texas collected from October 2023 to September 2025. Four stations were analyzed to evaluate precipitation occurrence, total precipitation, mean precipitation, 99th percentile extreme precipitation, and precipitation intensity. Model performance was assessed using both categorical and continuous statistical metrics, along with probability density function (PDF) and cumulative distribution function (CDF) analyses. IMERG datasets detected 53–75% of hourly precipitation events and 71–87% of daily precipitation events. IMERG-Late and IMERG-Final exhibited comparable performance in detecting precipitation events at the hourly timescale, whereas IMERG-Late performed better at the daily timescale across most stations and performance metrics. The ability of IMERG products to simulate precipitation totals was station-specific and depended on the temporal resolution level. At the hourly scale, IMERG-Final performed best at PIERS0035 and PIERS0034; IMERG-Early performed best at PIERS0030, and IMERG-Early and IMERG-Late performed equally well at PIERS0032. On the daily scale, IMERG-Early provided the best results at PIERS0030 and PIERS0032, whereas IMERG-Final performed better at PIERS0035 and PIERS0034. The performance of the IMERG datasets also varied across stations and temporal scales in simulating mean precipitation and different precipitation percentiles. Overall, although IMERG-Final is the calibrated dataset and is generally recommended for research applications, this study found that IMERG-Early and IMERG-Late outperformed IMERG-Final at specific temporal scales, for certain precipitation metrics, and at particular stations. The results further demonstrate that IMERG dataset performance varies across temporal scales, precipitation metrics, and observation sites.

1. Introduction

In regions where meteorological observations are limited because of sparse station networks, gridded precipitation datasets are widely used worldwide as an alternative for various applications [1,2]. These datasets have been applied in hydrological modeling, drought and flood assessment, crop modeling, and variability and trend analyses, as well as serving as reference data for downscaling coarse-resolution climate models to the station level [3,4,5]. Among these products, the Integrated Multi-satellite Retrievals for Global Precipitation Measurement (GPM) (IMERG) is one of the most extensively used gridded precipitation datasets [1,6,7]. However, the performance of gridded precipitation datasets varies across regions and temporal scales [8,9,10]. Therefore, evaluating their performance in accurately estimating precipitation at different temporal scales and across diverse regions is essential.
Several studies have evaluated the performance of IMERG products at the global scale [11] and across various regions worldwide [12,13,14,15,16]. For example, Zhu, Li, Chen, Wen, Liu, Huffman, Tsoodle, Ferraro, Wang and Hong [11] conducted a global assessment of IMERG performance; however, their analysis focused on version 06 and was limited to the IMERG-Final product. Similarly, Xiong et al. [17] evaluated the IMERG version 07 dataset at sub-daily temporal scales across a continental domain, but their assessment did not include the IMERG-Early and IMERG-Late products. At the regional scale, Aksu and Yaldiz [18] investigated the performance of IMERG version 06 and version 07 Final products for detecting precipitation extremes in Turkey; however, their study did not examine hourly temporal scales or compare the IMERG-Early and IMERG-Late products with IMERG-Final.
Similarly, many studies have evaluated the performance of IMERG datasets across the United States [17,19] and within specific U.S. watersheds [20,21,22]. For example, Li et al. [23] and Li et al. [24] evaluated the IMERG dataset across the entire United States; however, both studies focused exclusively on IMERG-Final version 06. Recent evaluations comparing IMERG version 07 with version 06 in other regions have demonstrated notable improvements in the latest version [18,25], emphasizing the need for comprehensive assessments following the release of IMERG version 07. Moreover, most evaluations conducted in the United States have not examined IMERG performance at the hourly scale [22,26,27]. Furthermore, most studies have focused on the IMERG-Final dataset and have rarely assessed the three IMERG products (Early, Late, and Final) concurrently [20,26]. Although IMERG-Final incorporates additional gauge-based corrections, studies from other regions indicate that it does not consistently outperform IMERG-Early or IMERG-Late. For instance, Tang et al. [28] found that IMERG-Late outperformed IMERG-Final for several continuous statistical metrics at the hourly scale in the Sichuan Basin, China. Similarly, Andualem et al. [29] reported that IMERG-Early exhibited better performance than IMERG-Final at the daily scale in the Gilgel Abay watershed, Ethiopia. Overall, although previous studies have provided valuable insights into the performance of IMERG products, most have not conducted a comprehensive evaluation of the latest version 07 (v07) IMERG-Early, IMERG-Late, and IMERG-Final products simultaneously across multiple temporal scales. In particular, studies that simultaneously assess all three products at both hourly and daily timescales remain limited. This gap underscores the need for a comprehensive evaluation to better characterize the performance and consistency of the latest IMERG products across different temporal resolutions.
To strengthen the evaluation capability of IMERG datasets, the National Aeronautics and Space Administration (NASA) has established several Precipitation Instrument Evaluation and Research Sites (PIERS) across the United States [30] to expand validation coverage beyond the sites used in earlier IMERG assessments. Five of these stations are located in Texas, providing a valuable opportunity for regional evaluation. Evaluating the latest IMERG product (IMERG v07) against observations from these PIERS stations will improve our understanding of IMERG’s performance in representing precipitation. Nevertheless, no prior studies have evaluated the capability of IMERG v07 products to estimate hourly and daily precipitation using comprehensive performance metrics in Texas, or more broadly in the United States, using these stations. Therefore, this study aims to assess the performance of the IMERG-Early, IMERG-Late, and IMERG-Final datasets in estimating precipitation at both hourly and daily temporal scales.

2. Study Area and Datasets

Texas, the second-largest state in the United States [31], is the study area for the PIERS rain gauge network. The state has diverse climatic and geographic conditions, with landscapes that include coastal plains, forests, prairies, rolling hills, plateaus, deserts, and mountains [32,33]. Its physiography ranges from eastern forests and southern Coastal Plains to elevated plateaus in the north and west [34]. The climate varies from humid coastal regions in eastern Texas to arid deserts in the west [31]. Summers are generally hot and winters are mild, while annual precipitation decreases from east to west [33] (Figure 1).
A total of five PIERS stations are located in Texas (Figure 1). The PIERS station IDs are PIERS0030 (Lat: 27.713017, Lon: −97.318275), PIERS0032 (Lat:33.610540, Lon: −102.050540), PIERS0034 (Lat: 30.10494, Lon: −95.96503), PIERS0035 (Lat: 30.09067, Lon: −95.9777), and PIERS0036 (Lat: 30.09576, Lon: −95.96945) (https://gpm-gv.gsfc.nasa.gov/Gauge/index.php, Accessed date 12 May 2026; Figure 1). Three of these stations are situated at Prairie View A&M University, while the remaining two are located at Texas A&M University–Corpus Christi (ID: PIERS0030) and Texas Tech University (ID: PIERS0032). The stations at Prairie View A&M University began operations on 26 August 2023 (PIERS0036) and on 25 September 2023 (PIERS0034 and PIERS0035). The other two stations, PIERS0030 and PIERS0032, had already been operational before these dates. One of the primary objectives of these PIERS stations is to provide ground-based validation for evaluating the performance of the IMERG datasets.
At PIERS stations, raw tipping-bucket gauge measurements are recorded in real time each time the bucket fills and tips, providing precipitation data at a 15 min temporal resolution. Each site is equipped with two collocated gauges (i.e., A and B) to support instrument evaluation and quality assurance. PIERS is a gauge network operated by the NASA Global Precipitation Measurement (GPM) Ground Validation (GV) team, in which a value of 0 is inserted whenever no precipitation is recorded during a 15 min interval. This processing step clearly distinguishes periods with no precipitation from intervals with missing data.
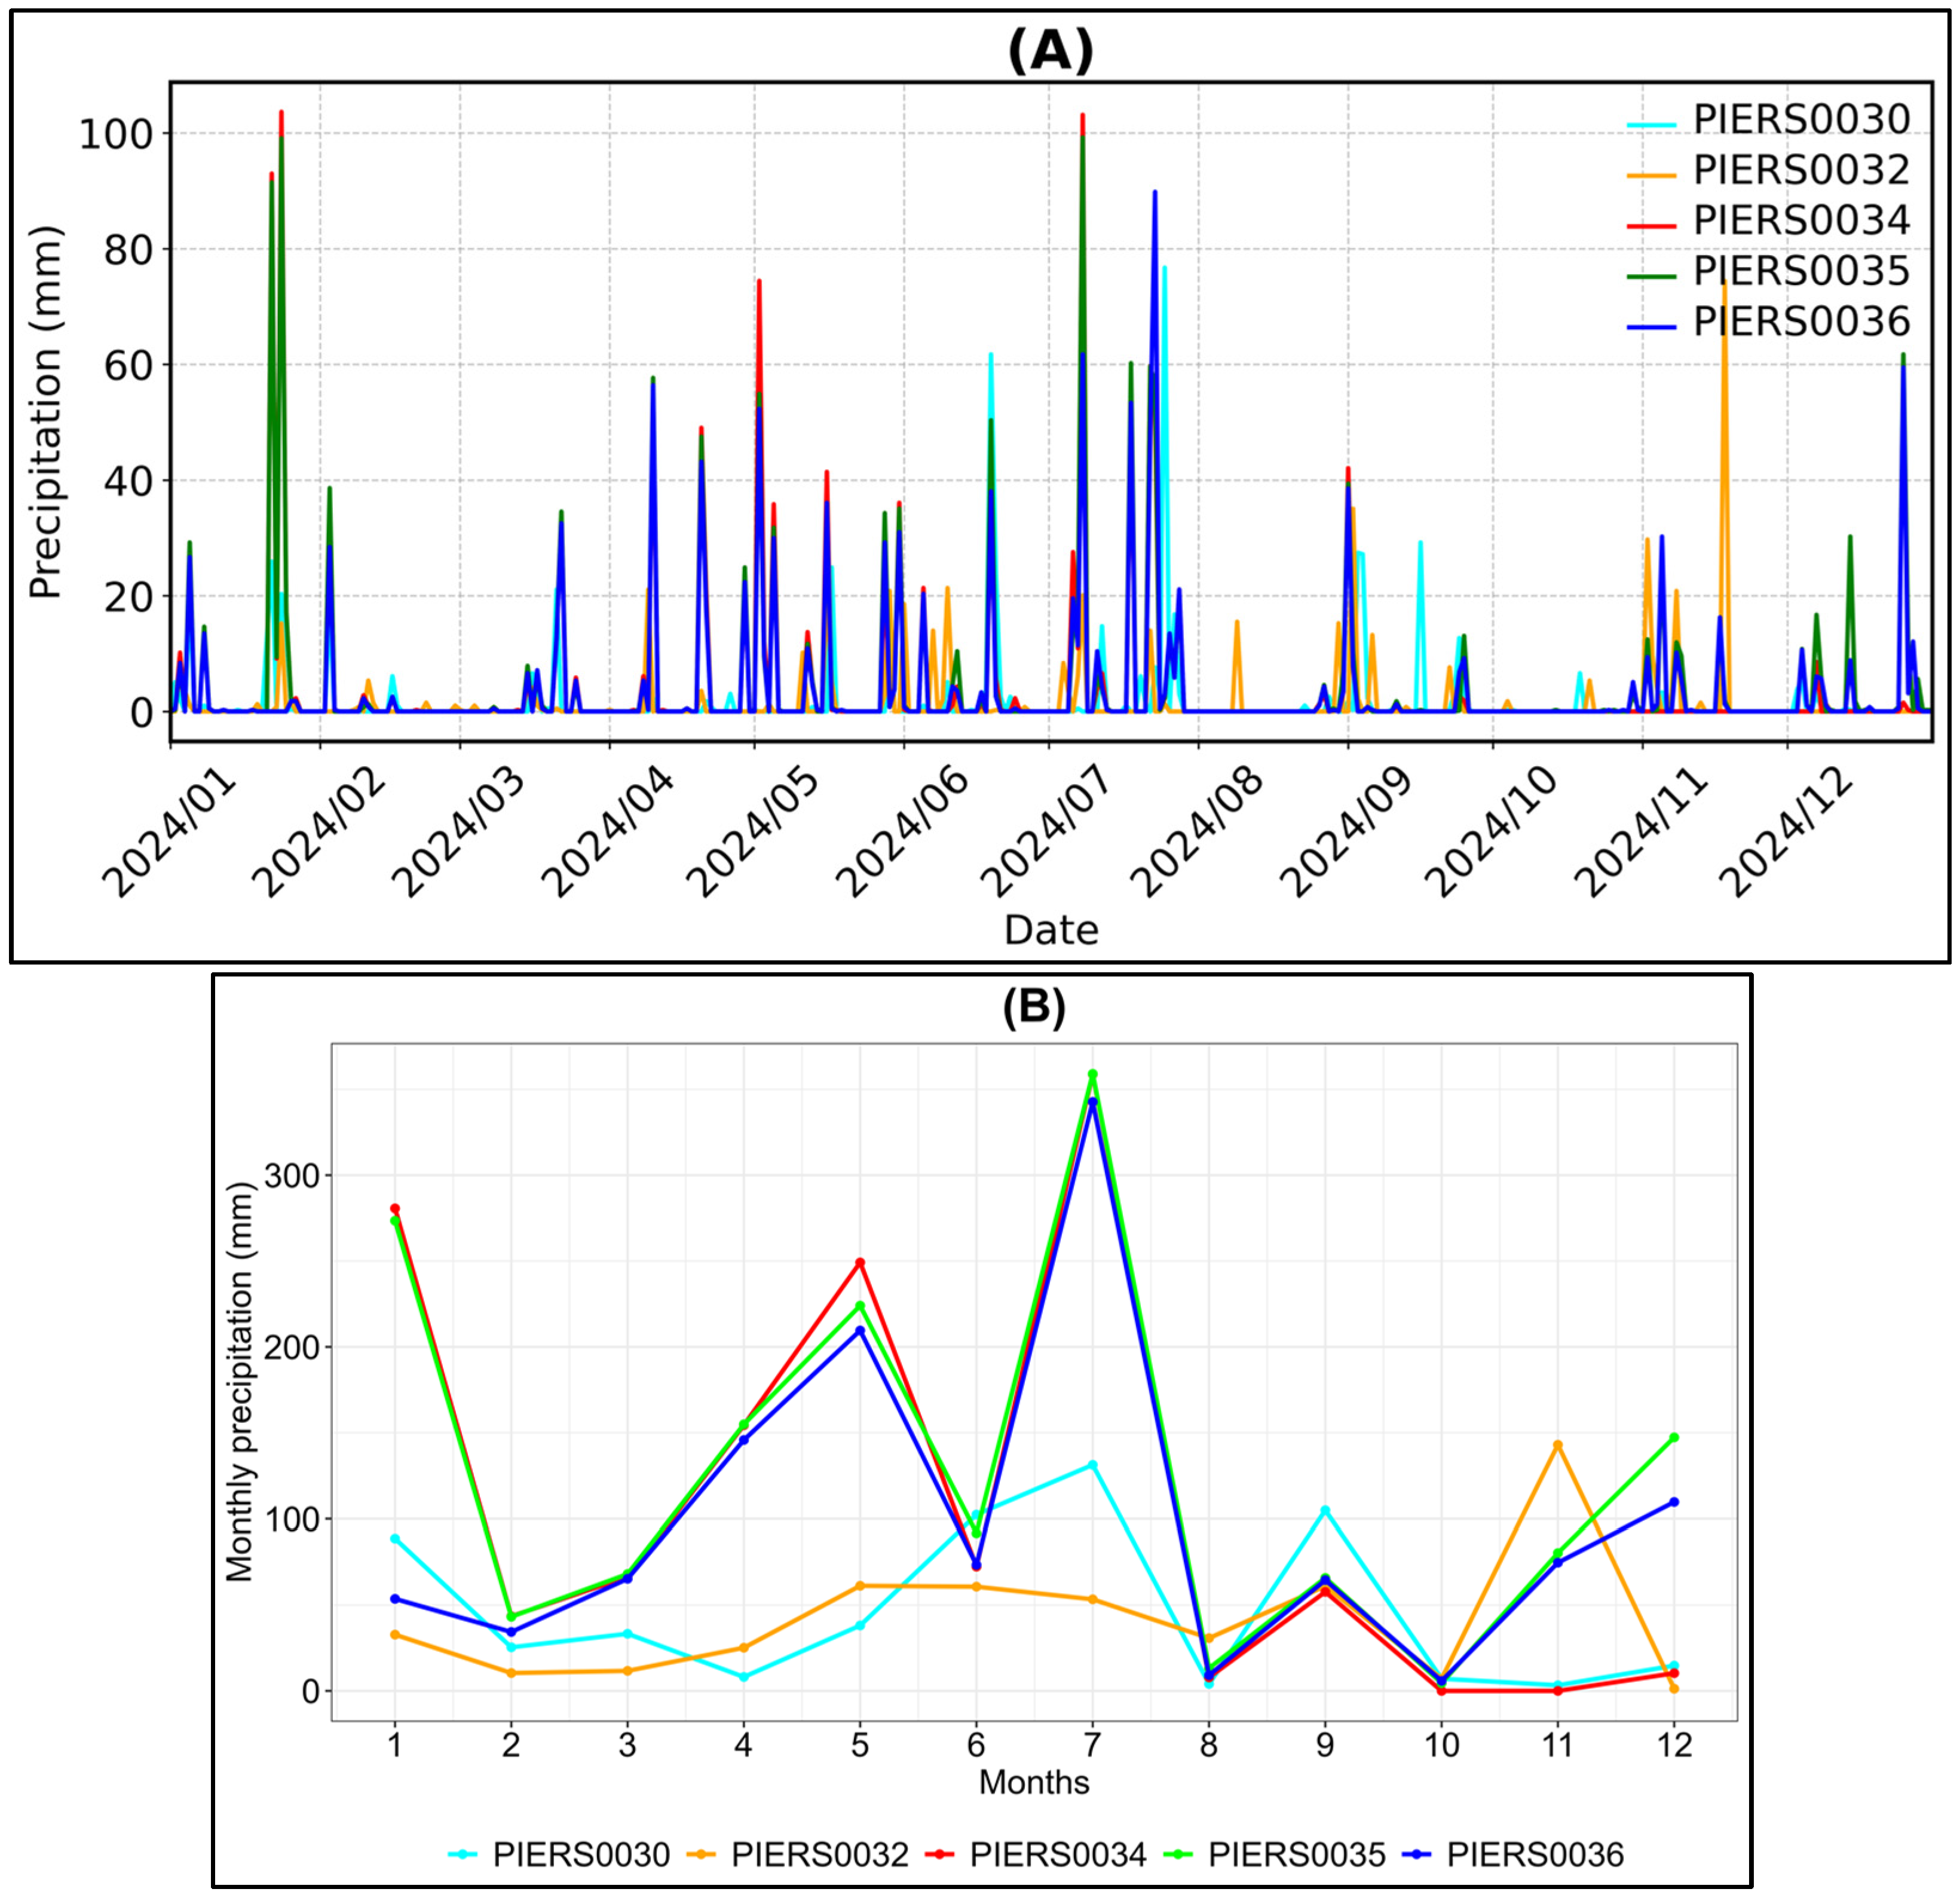
The annual precipitation recorded in 2024 at the PIERS stations PIERS0030, PIERS0032, PIERS0034, PIERS0035, and PIERS0036 was 561 mm, 498 mm, 1301 mm, 1526 mm, and 1189 mm, respectively, highlighting variations in precipitation across the stations. The daily and monthly precipitation totals for 2024 further demonstrate these differences among the stations (Figure 2). The mean daily precipitation was 1.5 mm at PIERS0030, 1.4 mm at PIERS0032, 3.6 mm at PIERS0034, 4.2 mm at PIERS0035, and 3.2 mm at PIERS0036. The 99th percentile daily precipitation at PIERS0030, PIERS0032, PIERS0034, PIERS0035, and PIERS0036 stations was 27.3 mm, 21.2 mm, 64.9 mm, 60.7 mm and 54.4 mm, respectively. Overall, precipitation measurements at annual, monthly, and daily time scales, as well as the 99th precipitation percentile across the five PIERS stations, reveal notable variability among stations.
In addition to the observed station data, this study used the IMERG v07 precipitation datasets. IMERG v07 is a global precipitation product covering most regions of the world, except some polar areas, and is available at half-hourly and daily temporal resolutions. It is produced in three runs: IMERG-Early, IMERG-Late, and IMERG-Final, which are released approximately 4 h, 14 h, and 3.5 months after observation, respectively. The datasets have a spatial resolution of 10 km (0.1°). These products differ primarily in latency, processing level, and the use of gauge-based bias correction (Table 1). IMERG-Early and IMERG-Late are near-real-time products based on satellite observations, whereas IMERG-Final is a retrospective product that incorporates additional satellite data and monthly gauge-based bias correction, making it the recommended product for research applications. For this study, all three IMERG runs were downloaded from the Giovanni platform (https://giovanni.gsfc.nasa.gov/giovanni/ (Accessed date 15 May 2026).

3. Methodology

The IMERG-Early, IMERG-Late, and IMERG-Final datasets were evaluated against observations from the PIERS stations in Texas (Figure 1). Of the five PIERS stations in the state, PIERS0034, PIERS0035 and PIERS0036 are located at Prairie View A&M University. Data collection began at PIERS0036 on 26 August 2023 and at PIERS0034 and PIERS0035 on 25 September 2023. Because PIERS0036 had substantial missing data in 2025, it was excluded from the analysis. Consequently, the evaluation was conducted using data from the remaining four stations: PIERS0035, PIERS0034, PIERS0032, and PIERS0030. As a result, the evaluation covered October 2023 through September 2025 at hourly and daily temporal resolutions. Between the two collocated gauges at each PIERS site (i.e., A and B), precipitation measurements from gauge B were used in this study.
Missing PIERS hourly precipitation data at the four stations accounted for less than 2.4% at each site. These missing values were filled in using the Multivariate Imputation by Chained Equations (MICE) package (Version 3.18.0) in R software (Version 4.4.2) [35], which has been widely used for filling in missing climate data in many studies [9,36,37,38]. The MICE procedure uses information from complete precipitation observations at the remaining stations to iteratively predict missing values, producing multiple imputations that reflect the uncertainty associated with the estimation process and corresponding standard errors. Predictor variables were limited to precipitation data from the PIERS station network. After imputation, precipitation values identified as outliers (i.e., values exceeding four standard deviations from the mean) were assessed using the RClimDex package (Version 1.0) in R software (Version 4.4.2) [39] and managed in accordance with World Meteorological Organization recommendations [40].
Since the PIERS precipitation data have a 15 min temporal resolution and the IMERG datasets have a 30 min temporal resolution, both datasets were aggregated to hourly and daily time scales [41]. Furthermore, because the PIERS reference data are station-based, the IMERG datasets were evaluated using a point-to-pixel approach, which is widely adopted when only point-based station observations are available [18,42].
This study evaluated the ability of the IMERG datasets to detect precipitation events, estimate precipitation totals, and capture precipitation intensities. The datasets were further assessed for their ability to estimate mean hourly and daily precipitation amounts over the study period. To examine the precipitation detection performance of the IMERG datasets, four categorical metrics were employed (Table 2): Probability of Detection (POD), False Alarm Ratio (FAR), Frequency Bias Index (FBI), and Critical Success Index (CSI) [8,18,42,43,44,45]. POD measures the proportion of observed precipitation events correctly identified by IMERG, while FAR indicates the proportion of falsely detected precipitation events. FBI evaluates the ability of IMERG to capture the frequency of rainy days. The FBI compares the frequency of rainfall-day detection in the IMERG datasets with that observed in the PIERS measurements. Its values range from 0 to ∞. An FBI value less than 1 indicates that the IMERG datasets underestimate the number of rainfall days, whereas a value greater than 1 indicates an overestimation [46,47]. CSI combines information from both POD and FAR to provide a composite measure of detection performance. The optimal values for POD, FBI, and CSI are 1, whereas the optimal value for FAR is 0. In this study, a 1 mm threshold was applied to classify rainy and non-rainy days [42,46,48] for both hourly and daily temporal scales. Further details on these categorical metrics can be found in the referenced studies.
The performance of the IMERG datasets in estimating precipitation totals was evaluated using continuous statistical measures. Specifically, three widely adopted metrics, Pearson’s correlation coefficient (R), Root Mean Squared Error (RMSE), and percent bias (PBIAS), were employed in this study [42,44,49]. The correlation coefficient (R) quantifies the degree of association between the IMERG datasets and observations from the PIERS stations. PBIAS evaluates the estimation bias of the IMERG datasets relative to the PIERS stations (Table 2), with a positive PBIAS indicating underestimation and a negative PBIAS indicating overestimation. RMSE assesses the magnitude of error in the IMERG estimates relative to the PIERS observations. An ideal R value is 1, whereas the optimal values for both PBIAS and RMSE are 0.
To further evaluate how well the IMERG datasets capture the distribution of precipitation intensities, the Probability Density Function (PDF) was used. The PDF is a widely used method in precipitation data evaluation studies [27,47,50]. In addition, the Cumulative Distribution Function (CDF) was applied to assess the datasets’ ability to represent precipitation totals. To further assess the ability of the IMERG datasets to capture precipitation totals, the Cumulative Distribution Function (CDF) was also used. The CDF is a widely applied tool for evaluating gridded precipitation datasets and climate models across various regions worldwide [13,51,52,53].
The IMERG datasets were further evaluated for their ability to simulate the 99th precipitation percentile, consistent with methodologies commonly applied in the global literature [54,55]. This percentile provides insight into the datasets’ performance in capturing extreme precipitation events. The selected precipitation percentile is particularly relevant for understanding the performance of the IMERG datasets in applications such as extreme weather analysis, flood risk management, and urban drainage design studies.
Table 2. Equations used in this study and their brief descriptions.
Metrics Range UnitReferences
P O D = H i t s H i t s + M i s s e s 0 to 1 None[16,50,56,57]
F A R = False   alarms False   alarms + H i t s 0 to 1 None[16,56]
F B I = H i t s + False   alarms H i t s + M i s s e s 0 to ∞ None[9,27,46]
C S I = H i t s H i t s + M i s s e s + False   alarms 0 to 1 None[16,47]
R = ( P P ¯ ) ( I I ¯ ) ( P P ¯ ) 2 ( I I ¯ ) 2 −1 to 1None[56,58]
R M S E = ( P I ) 2 N 0 to ∞mm[27,58]
P B I A S = ( P I ) ( P ) × 100% −∞ to ∞%[27,59,60,61]
Where, R is Pearson’s correlation coefficient; P and P ¯ represent the PIERS precipitation data and their mean, respectively; I and I ¯ represent the IMERG precipitation data and their mean, respectively; and N is the number of paired observations used in the comparison.

4. Results

4.1. Performance in Detecting Precipitation Occurrence

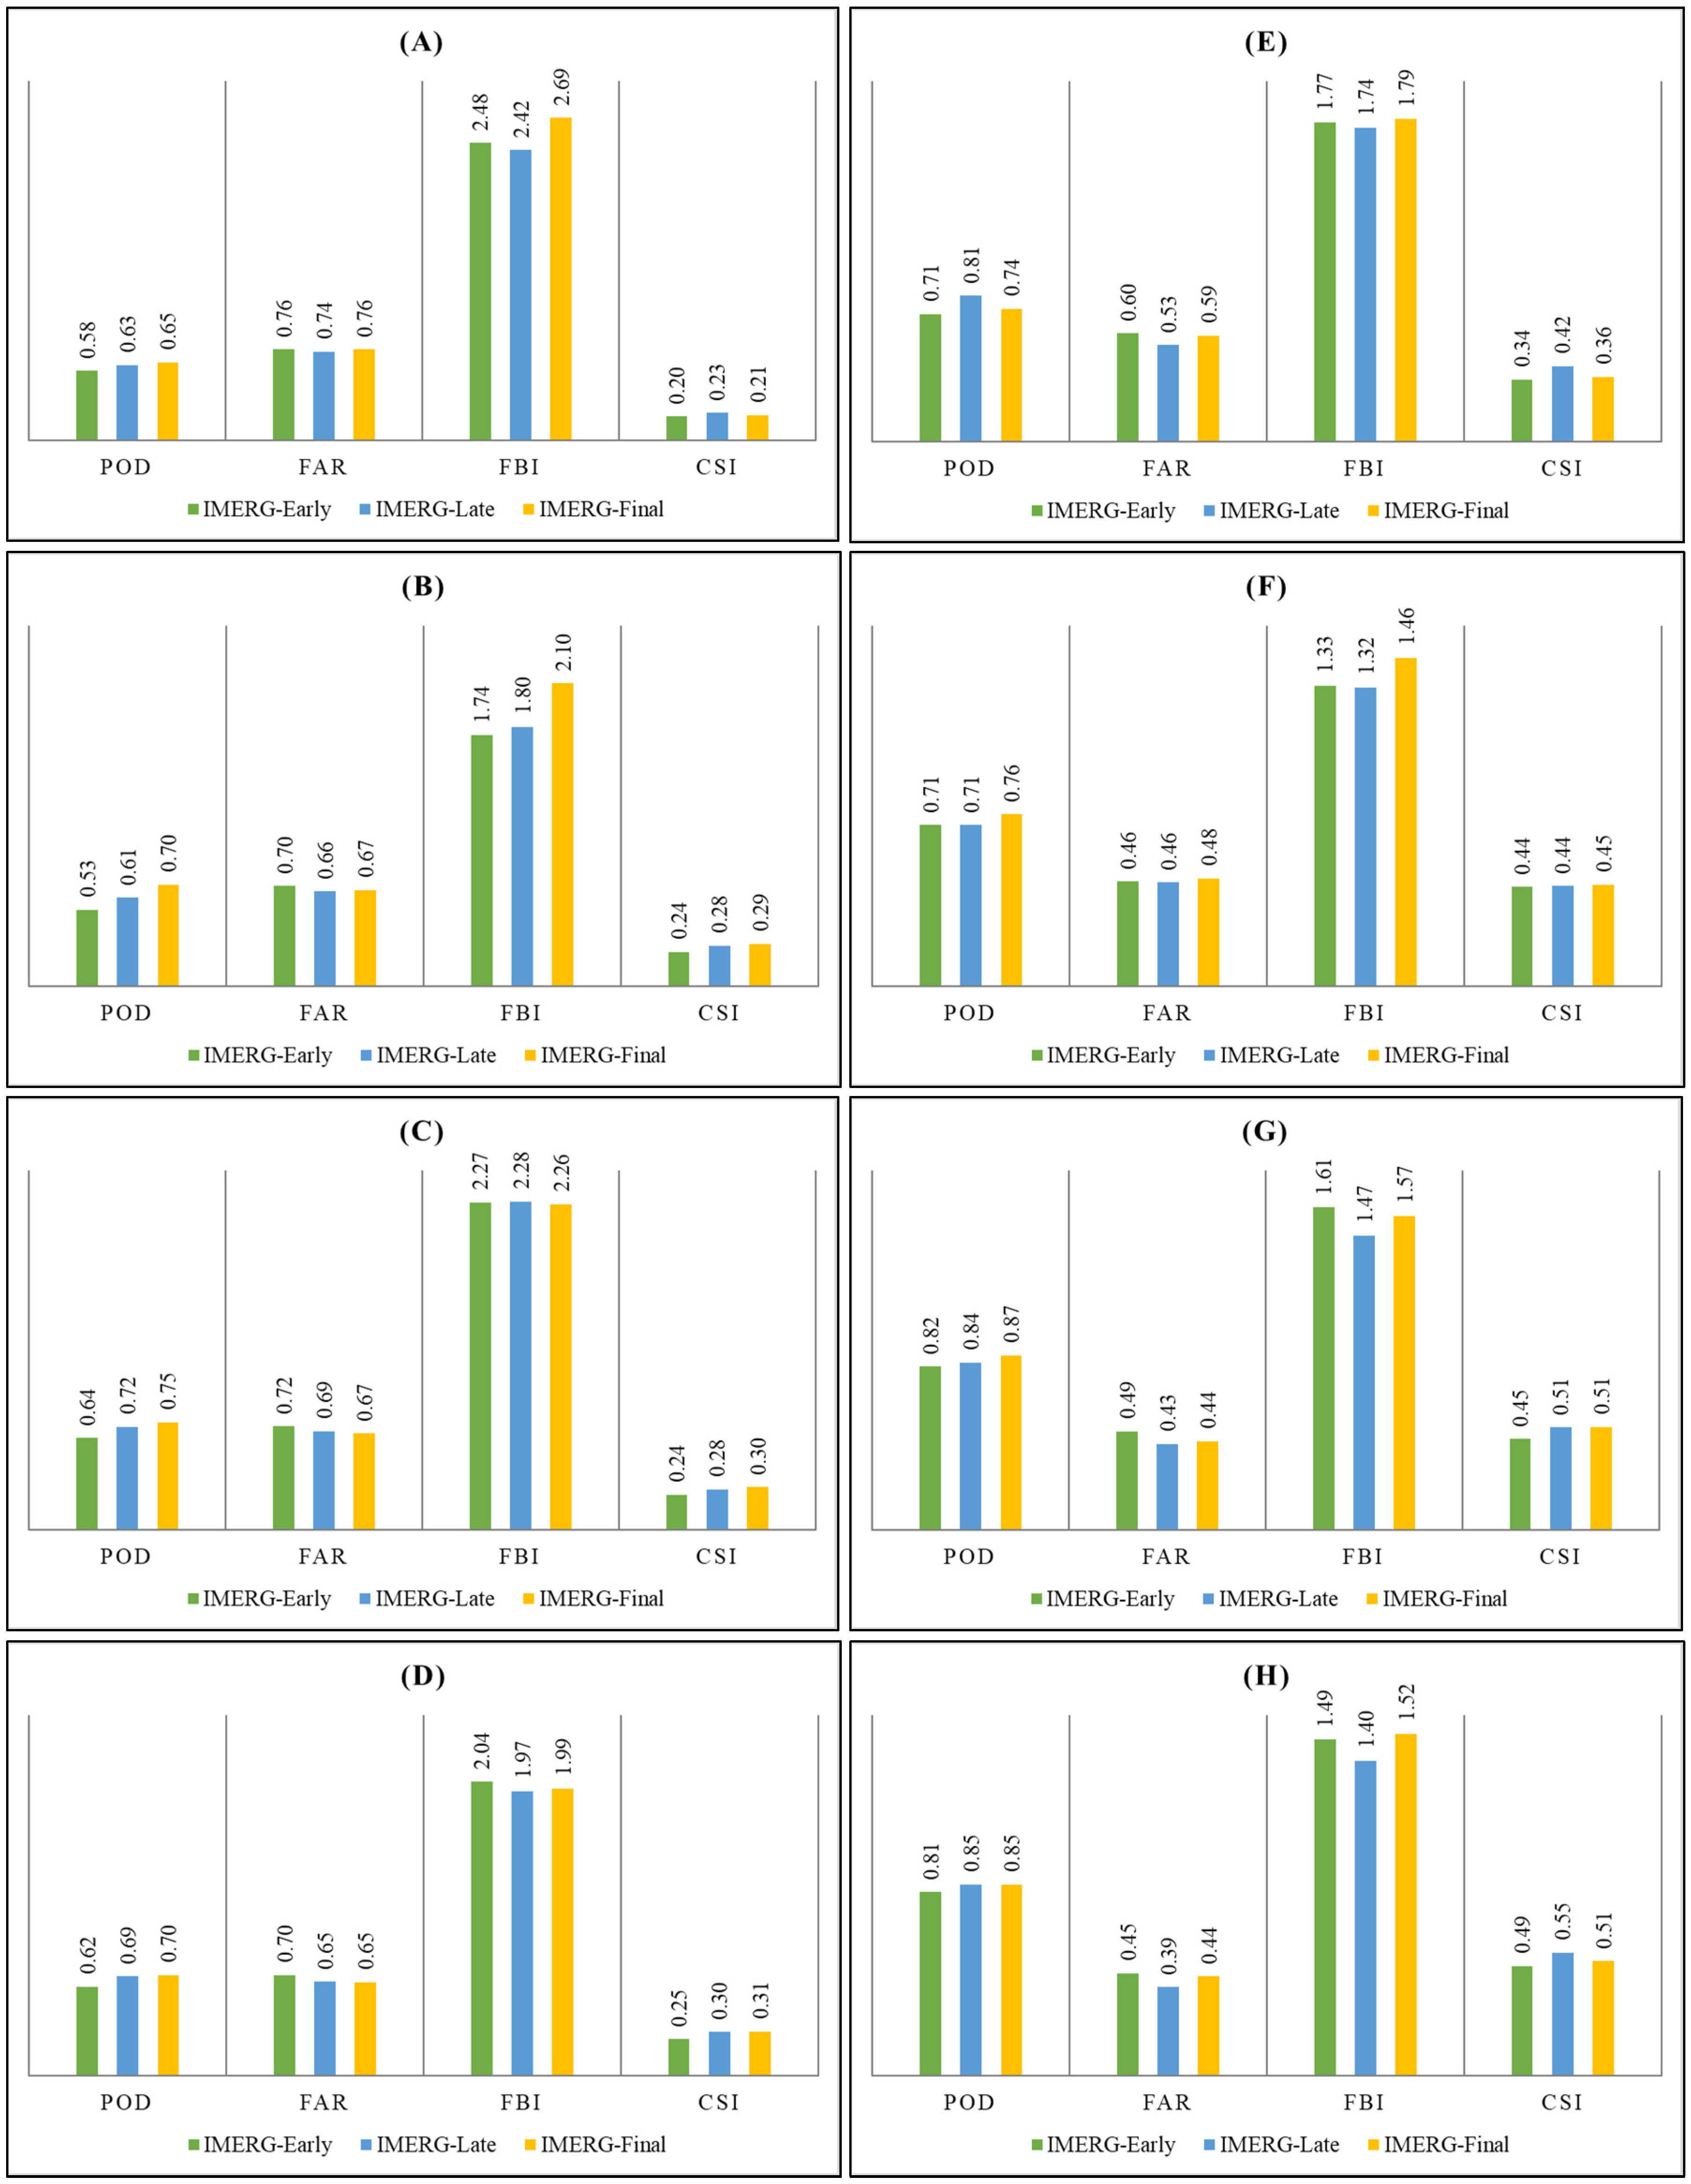
Figure 3 presents the performance of the IMERG datasets in detecting precipitation occurrence at hourly and daily temporal scales. At the hourly scale, the precipitation event detection (POD values) of the IMERG datasets studied ranged from 53% to 75%. In contrast, all three IMERG products exhibited relatively high FAR values (65–76%) across the stations, indicating frequent false identification of precipitation events. The studied datasets also exhibited high FBI values (1.74 to 2.69) and low CSI values (0.20 to 0.31).
Comparisons of the three IMERG datasets across the four PIERS stations revealed that IMERG-Final outperformed IMERG-Early and IMERG-Late in detecting hourly precipitation events. Specifically, IMERG-Final successfully detected 65%, 70%, 75%, and 70% of precipitation events at stations PIERS0030, PIERS0032, PIERS0034, and PIERS0035, respectively. Regarding the false alarm ratio (FAR), the performance of the IMERG datasets varied across stations (Figure 3). For example, IMERG-Late outperformed both IMERG-Early and IMERG-Final at PIERS0030 and PIERS0032, whereas IMERG-Final demonstrated superior performance at PIERS0034 relative to the other two products. At PIERS0035, IMERG-Late and IMERG-Final both achieved lower and identical FAR values of 0.65, whereas IMERG-Early showed comparatively poorer performance, with a FAR value of 0.70. Overall, IMERG-Late exhibited superior FAR performance across most stations on the hourly scale.
Performance variations among the studied datasets were also observed in FBI. For example, IMERG-Late performed better than the other two IMERG products at stations PIERS0030 and PIERS0035. However, at PIERS0032, IMERG-Early outperformed the other IMERG products, whereas IMERG-Final performed better at PIERS0034. Similarly to the FAR results, IMERG-Late generally performed better than the other two IMERG products at most stations, according to FBI. Based on the CSI results, IMERG-Final ranked as the best-performing dataset at three of the four stations, with PIERS0030 being the exception. Overall, the results of this study indicate that IMERG-Final performed better than IMERG-Late at most stations, with superior POD and CSI, whereas IMERG-Late performed better for FAR and FBI. These findings highlight the comparatively better performance of IMERG-Final and IMERG-Late in detecting hourly precipitation events.
Compared with the hourly-scale performance of the IMERG products, overall improvement in detecting precipitation occurrence was observed at the daily scale (Figure 3). At the daily scale, the POD values for the IMERG datasets across the four stations indicated detection of 71% to 87% of precipitation events. Similarly, the FAR values at the daily scale (0.39–0.60) were considerably lower than those recorded at the hourly scale, reflecting improved detection reliability (Figure 3). The FBI and CSI values also improved at the daily scale across the IMERG datasets studied at the four PIERS stations.
Comparisons among the IMERG datasets revealed that IMERG-Final performed better at the PIERS0032 and PIERS0034 stations and was comparable to IMERG-Late at PIERS0035 (Figure 3). At PIERS0030, IMERG-Late performed better. These results indicate that IMERG-Final generally performed better in detecting daily precipitation occurrence at most stations. For FAR at the daily scale, IMERG-Late performed better at PIERS0030, PIERS0034, and PIERS0035 and performed comparably to IMERG-Early at PIERS0032, indicating overall stronger FAR performance of IMERG-Late at most stations. For FBI, IMERG-Late performed better across all stations. For CSI, IMERG-Late performed better at PIERS0030 and PIERS0035 and performed comparably to IMERG-Final at PIERS0034, whereas IMERG-Final outperformed the other two IMERG products at PIERS0032. Overall, the results show that IMERG-Late performed better for FAR, FBI, and CSI at most studied stations, whereas IMERG-Final performed better for POD at most stations. These findings indicate the overall stronger performance of IMERG-Late in detecting daily precipitation events across most stations and performance metrics. Furthermore, FBI values greater than 1 at both hourly and daily scales across the PIERS stations suggest a general tendency of the IMERG products to overestimate the frequency of daily precipitation events (Figure 3).

4.2. Performance in Estimating Precipitation Totals

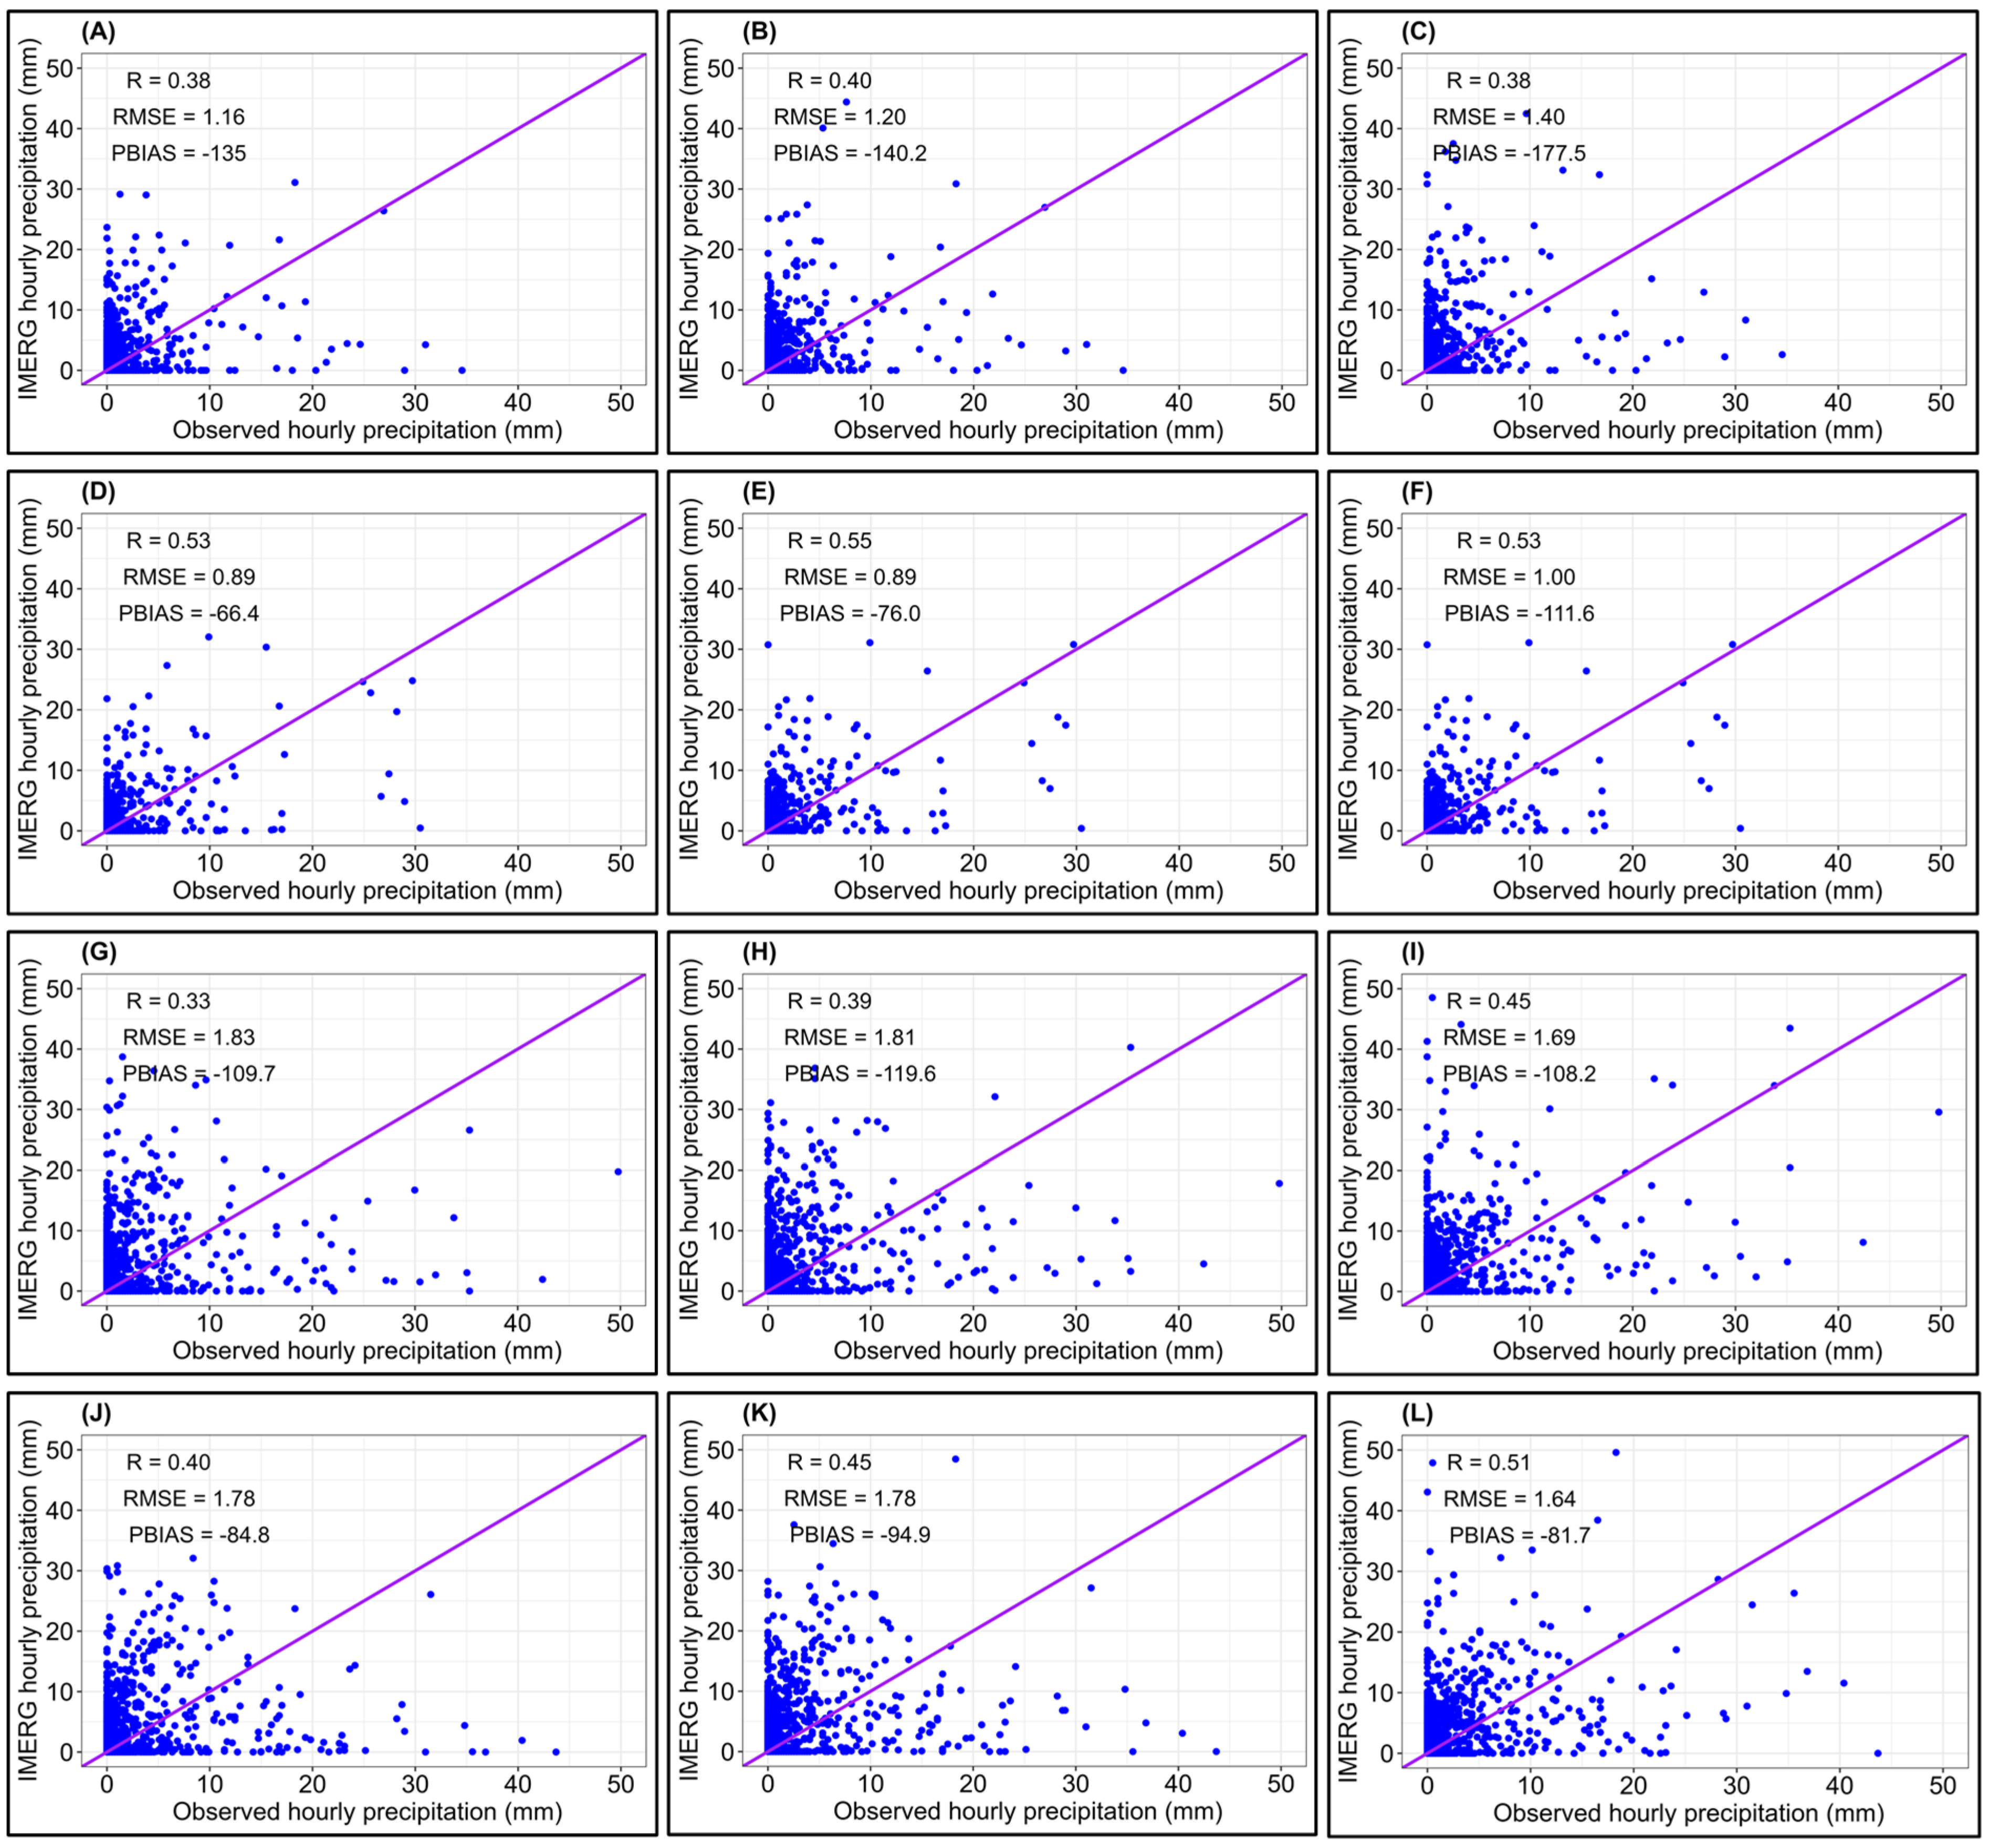
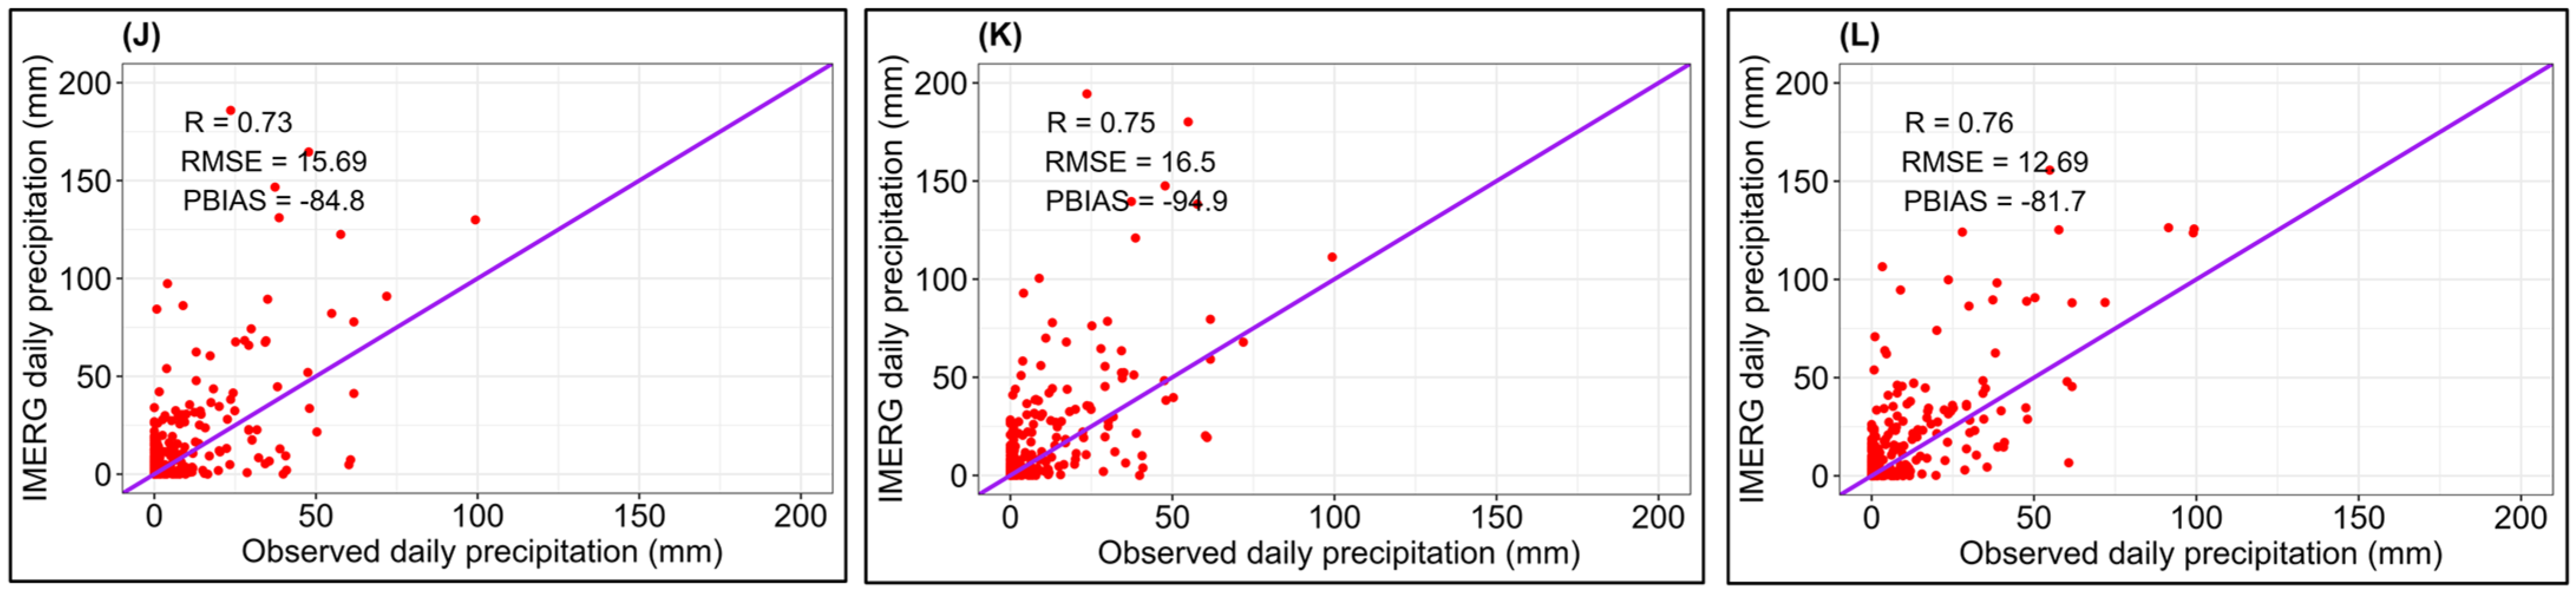
The performance of the three IMERG datasets in estimating total hourly and daily precipitation is presented in Figure 4 and Figure 5. At the hourly scale, the datasets across the four studied stations exhibited correlation coefficients ranging from 0.33 to 0.55, RMSE values between 0.89 and 1.83 mm, and PBIAS values ranging from −66.4% to −177.5% (Figure 4). Comparisons among the IMERG datasets for estimating total hourly precipitation revealed substantial spatial variability across the studied stations. At PIERS0034 and PIERS0035, IMERG-Final consistently outperformed the other datasets across all evaluation metrics. In contrast, performance at PIERS0032 varied by metric: IMERG-Late achieved the highest correlation coefficient, whereas IMERG-Early produced the lowest PBIAS value, while both IMERG-Early and IMERG-Late yielded identical RMSE values. These results indicate that IMERG-Early and IMERG-Late performed comparably at PIERS0032. Conversely, IMERG-Final showed the poorest performance at this station based on most evaluation metrics.
At PIERS0030, IMERG-Early outperformed the other datasets across most performance metrics, whereas IMERG-Final again showed the weakest performance based on most evaluation metrics. Overall, IMERG-Final performed best at PIERS0034 and PIERS0035; IMERG-Early performed best at PIERS0030; and IMERG-Early and IMERG-Late performed comparably at PIERS0032. These results indicate that the accuracy and reliability of IMERG products for total hourly precipitation estimation are highly station-dependent and may vary with local climatic or environmental conditions.
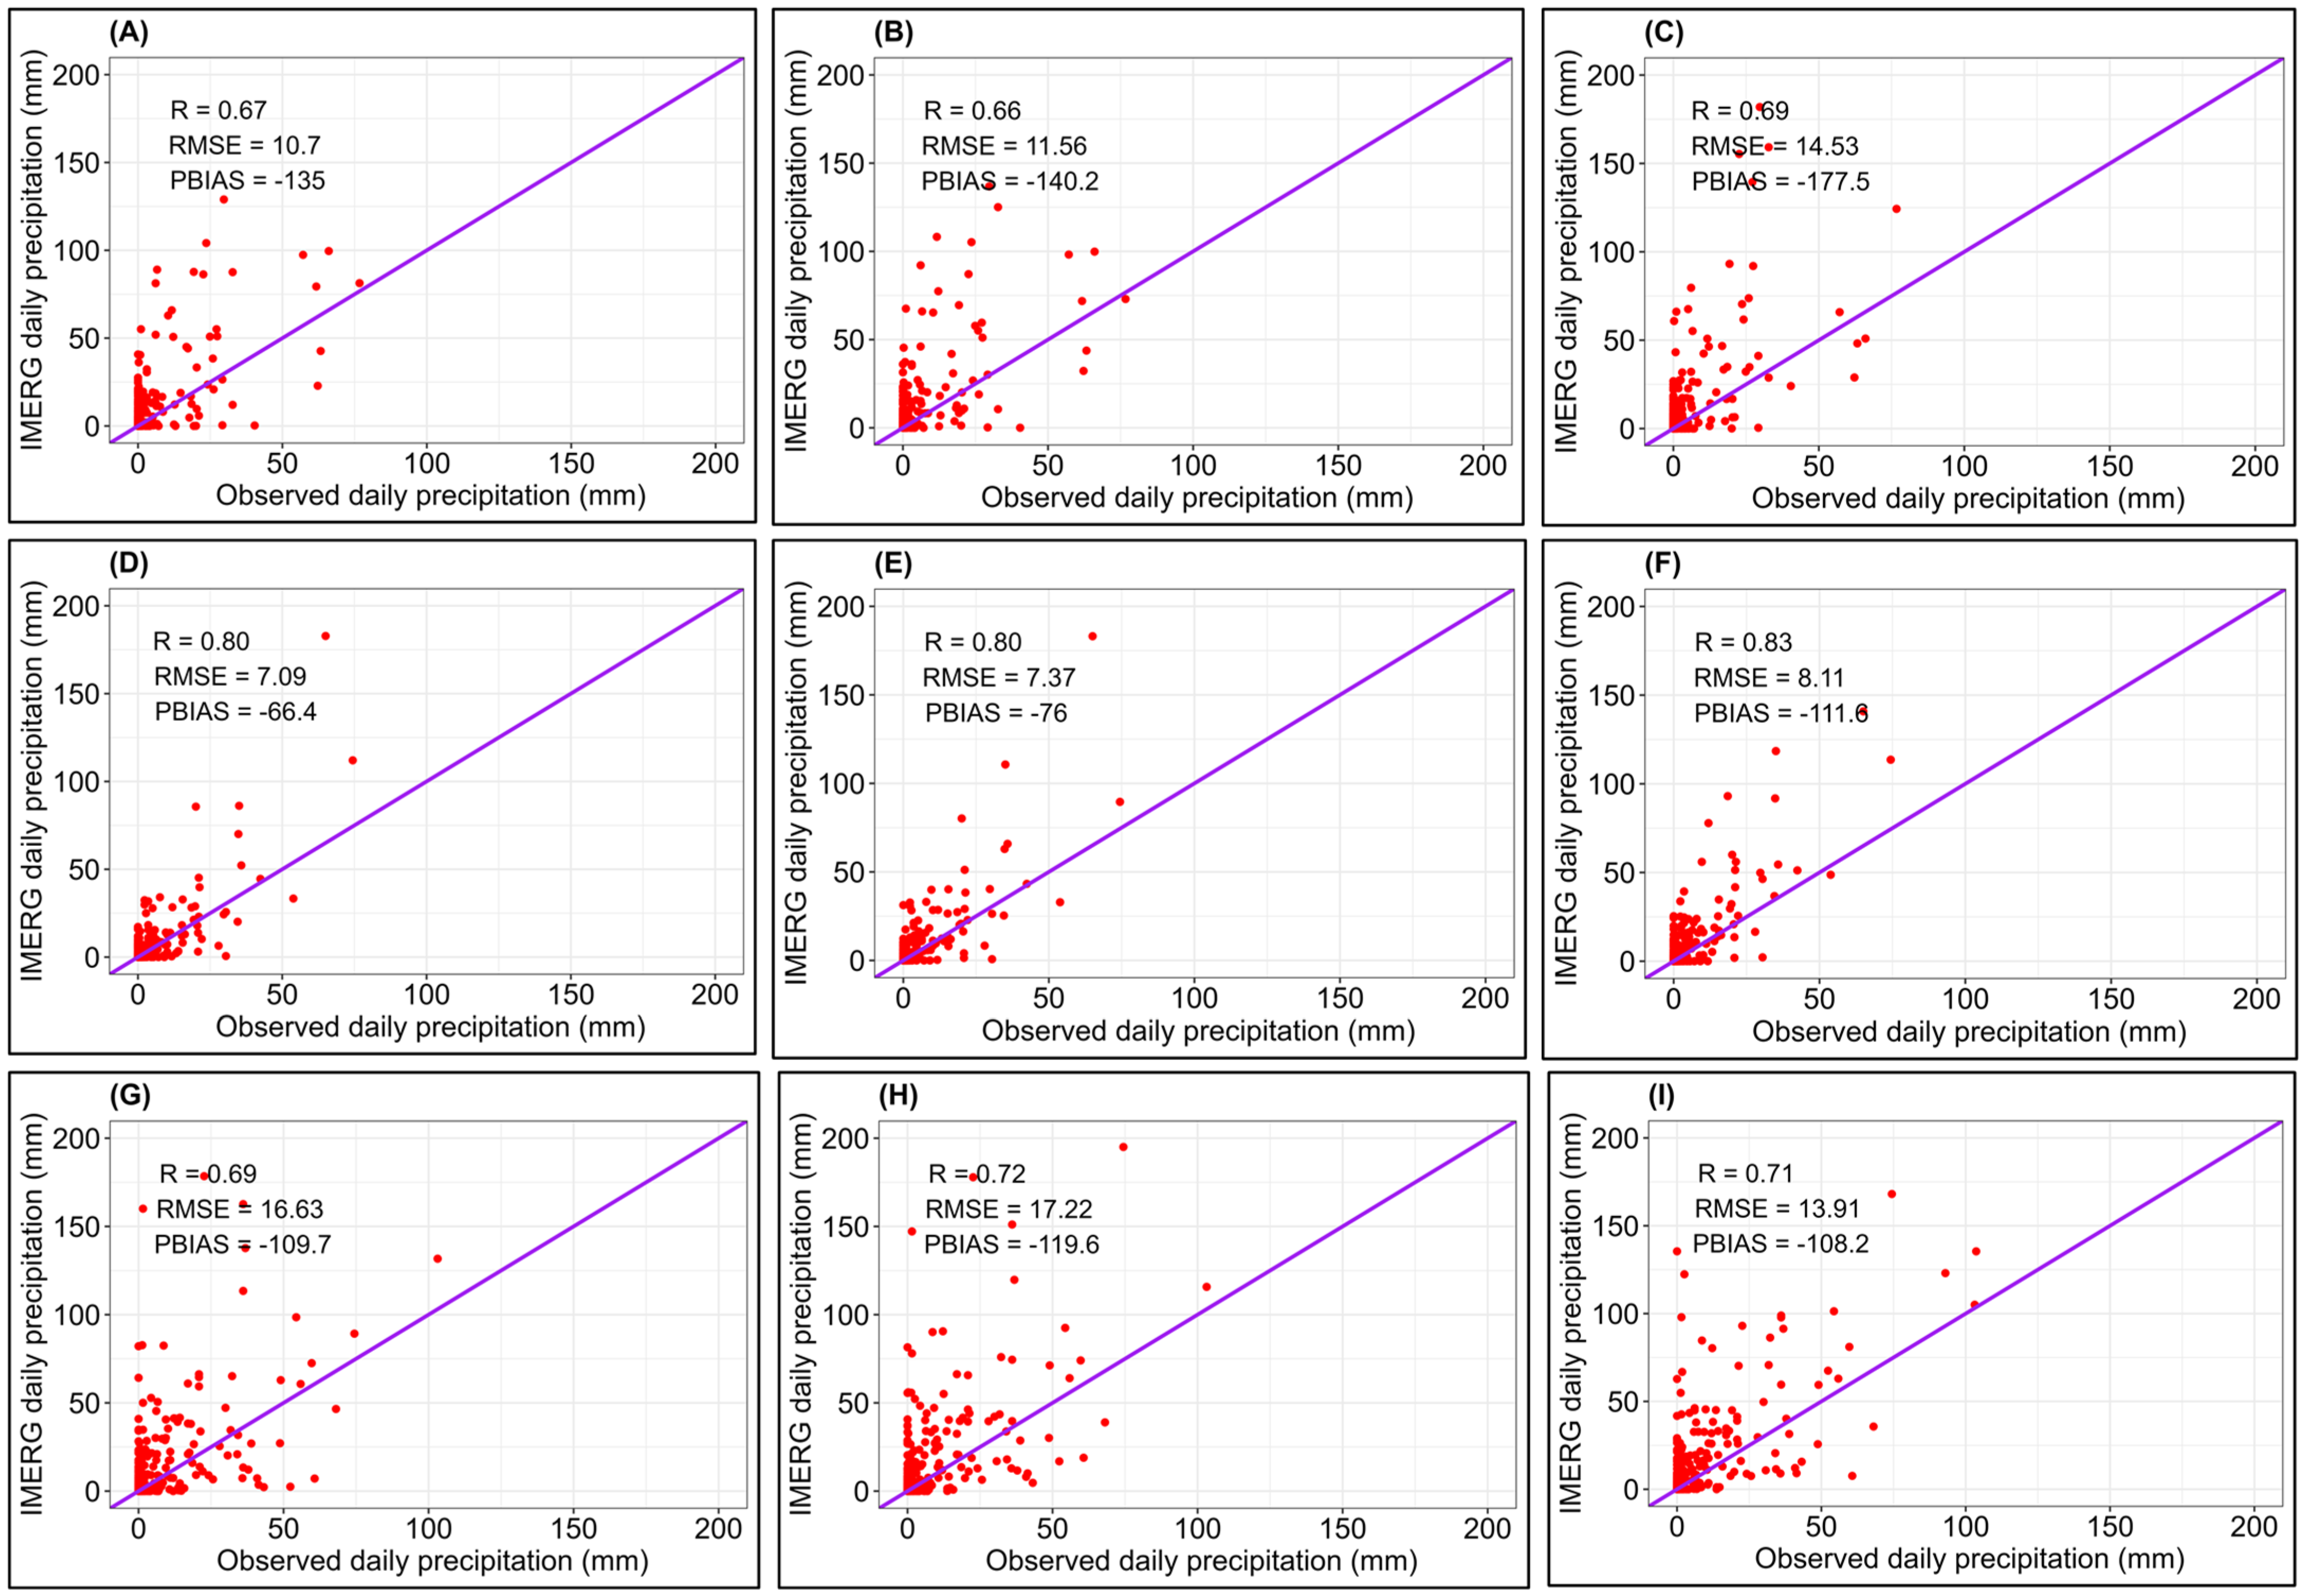
At the daily scale, the performance of the IMERG datasets improved in terms of correlation, with coefficients across the four studied stations ranging from 0.66 to 0.83 (Figure 5). However, the PBIAS values at the daily scale showed no improvement compared with those at the hourly scale at any station. Across both hourly and daily scales, all IMERG datasets consistently overestimated precipitation.
As observed at the hourly scale, the IMERG datasets also showed notable differences in their ability to estimate daily precipitation across the studied stations. The results showed that IMERG-Early performed better at PIERS0030 and PIERS0032 based on RMSE and PBIAS, whereas IMERG-Final achieved higher correlation coefficients at these stations. Nevertheless, IMERG-Early’s stronger performance across most evaluation metrics highlights its overall suitability for daily precipitation estimation at PIERS0030 and PIERS0032. At these stations, IMERG-Final generally showed the weakest performance based on most evaluation indices. In contrast, IMERG-Final consistently performed best at PIERS0035 across all evaluation metrics and at PIERS0034 based on RMSE and PBIAS. Meanwhile, IMERG-Late showed the poorest performance at PIERS0034 and PIERS0035 across most evaluation metrics.
The ability of the IMERG datasets to estimate mean hourly and daily precipitation during the study period at the PIERS stations is summarized in Table 3. The results reveal substantial deviations between IMERG estimates and observed station measurements. For example, the observed mean daily precipitation at PIERS0030, PIERS0032, PIERS0034, and PIERS0035 was 1.793, 1.584, 3.165, and 3.640 mm/day, respectively, whereas the corresponding IMERG estimates ranged from 4.215 to 4.976, 2.635 to 3.352, 6.590 to 6.949, and 6.613 to 7.096 mm/day, respectively (Table 3).
Among the three datasets, IMERG-Early performed better than IMERG-Late and IMERG-Final in estimating mean hourly and daily precipitation at PIERS0030 and PIERS0032. In contrast, IMERG-Final showed the weakest performance at these stations across both temporal scales. Conversely, at PIERS0034 and PIERS0035, IMERG-Final performed best in estimating mean hourly and daily precipitation during the study period, whereas IMERG-Late consistently showed the poorest performance. These findings underscore considerable station-to-station variability in the performance of the IMERG datasets for simulating hourly and daily precipitation (Table 3).
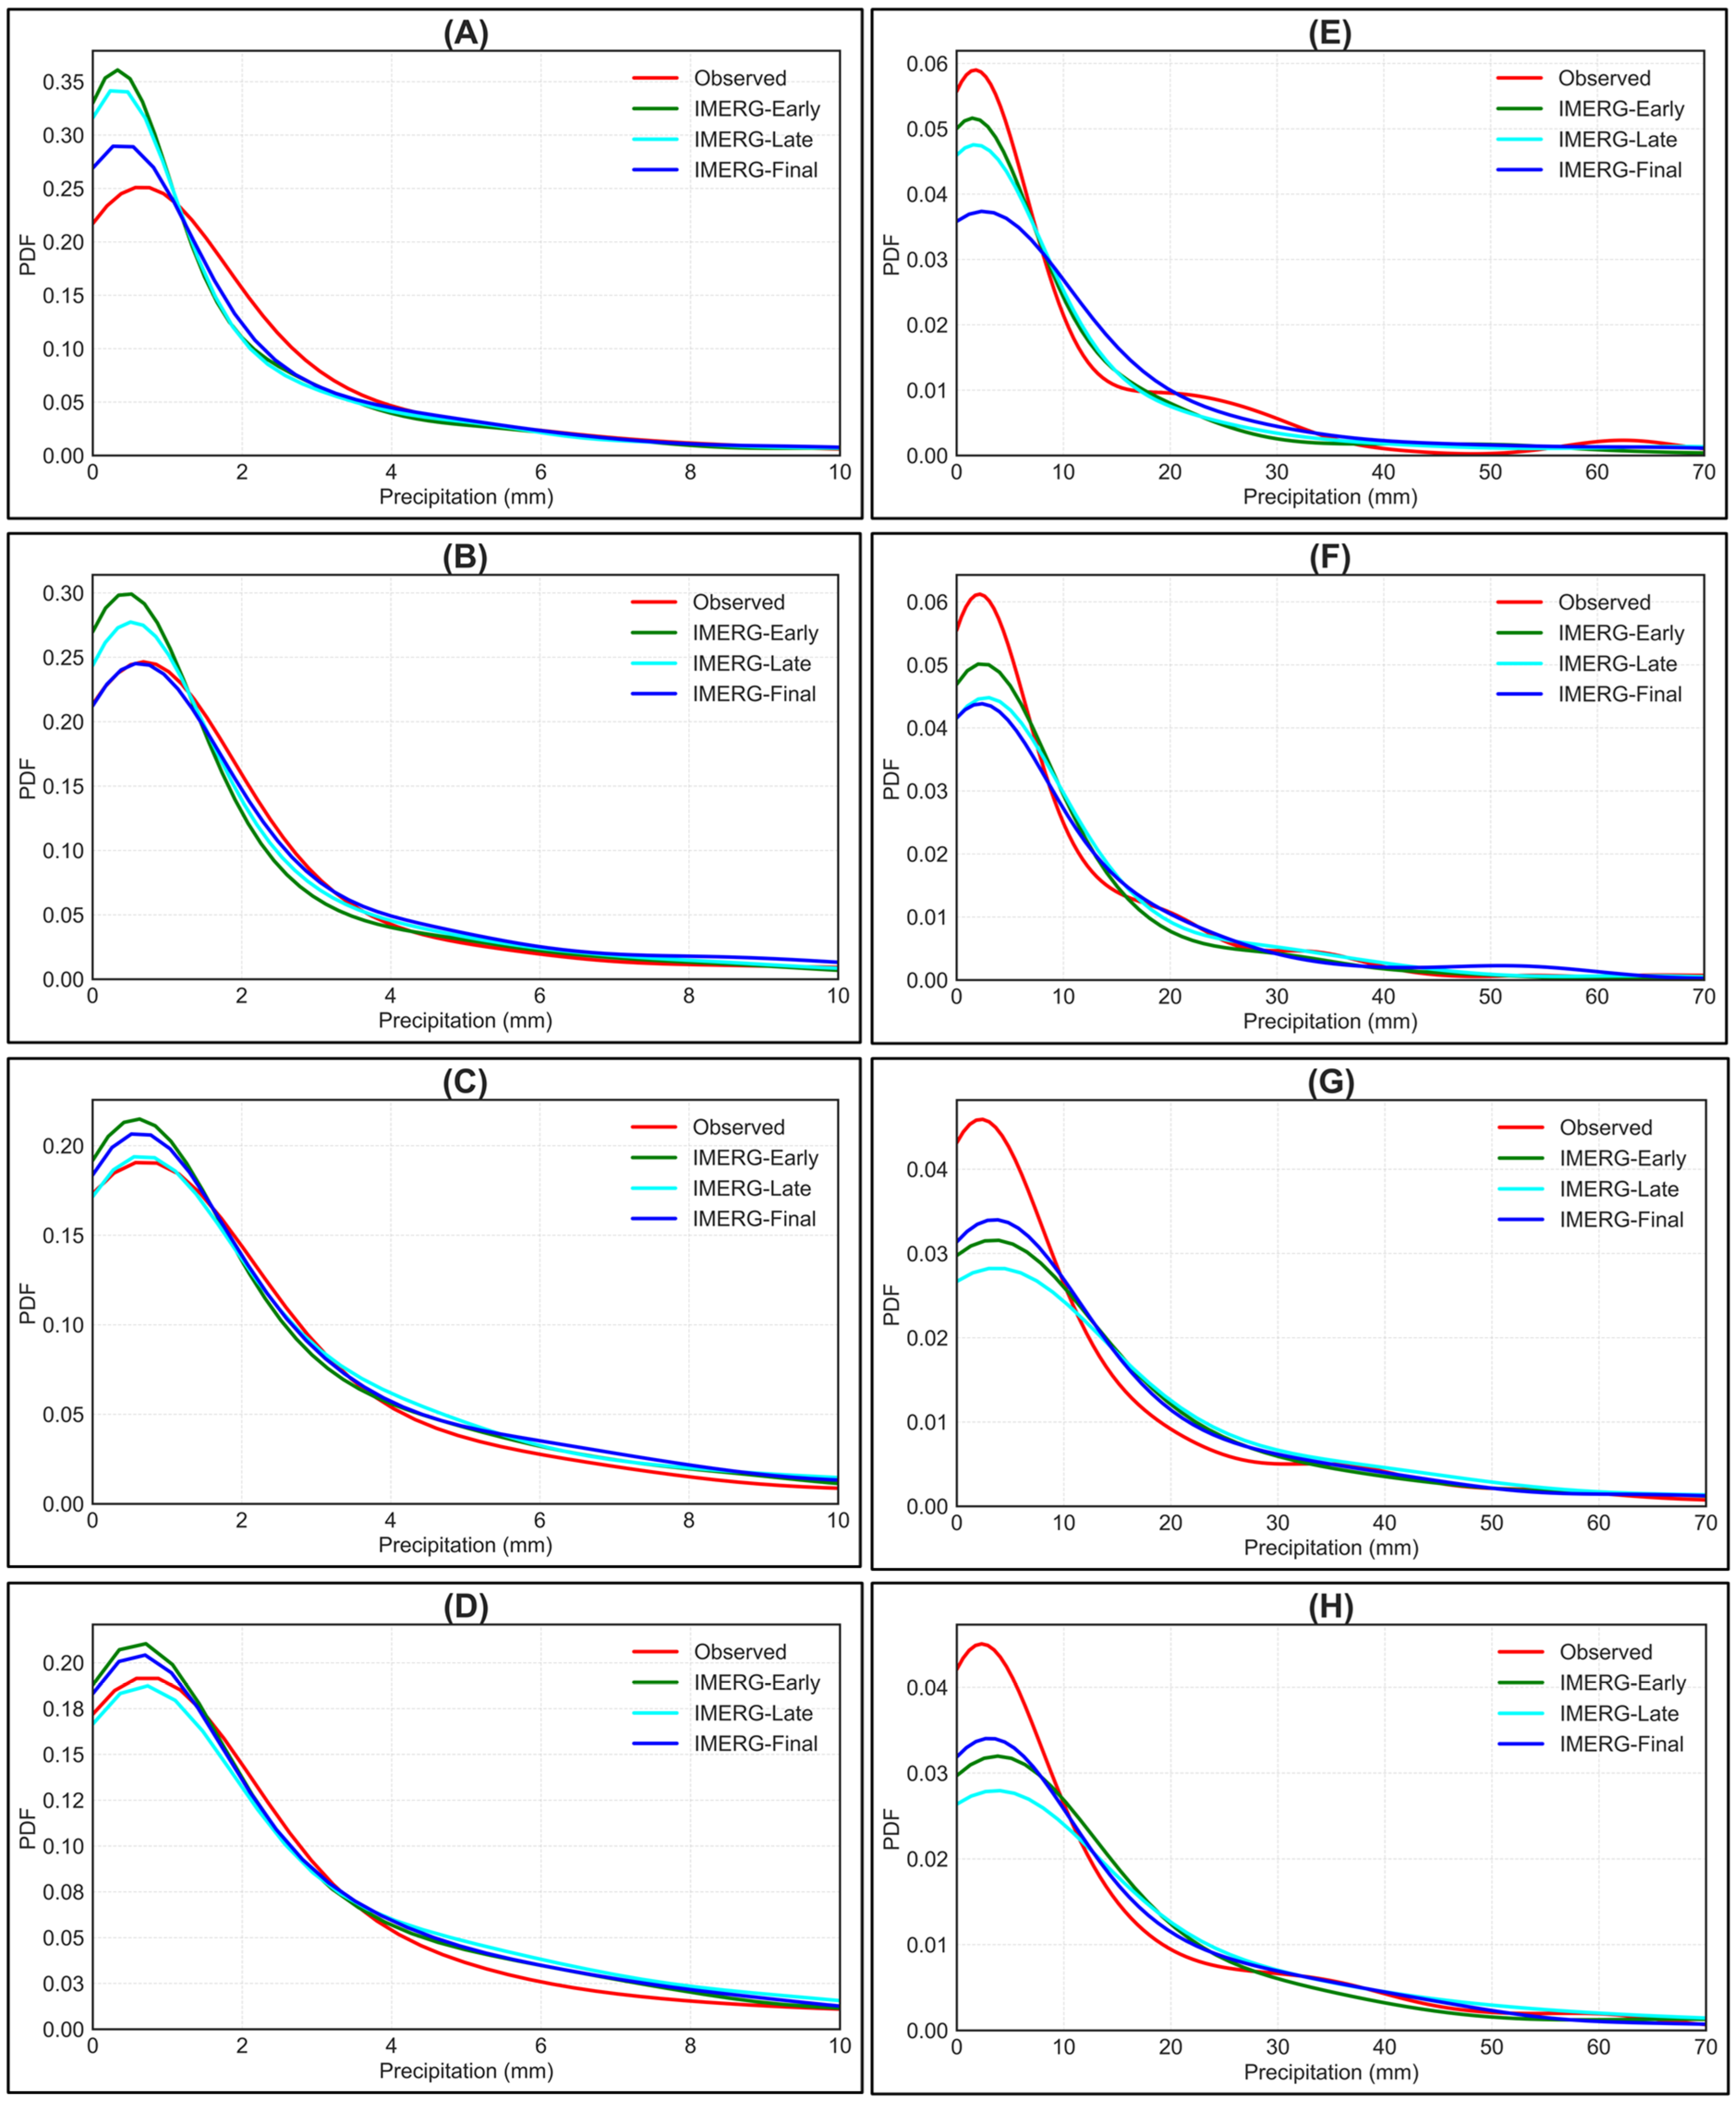
Figure 6 presents the PDF plots of the IMERG datasets at hourly and daily temporal scales. At the hourly scale, performance varies by precipitation intensity and station. In the >0–1 mm range, all three IMERG products differ markedly from the PIERS observations at PIERS0030. At PIERS0032, only IMERG-Early and IMERG-Late show substantial deviations, whereas IMERG-Final closely agrees with the PIERS estimates. At PIERS0034 and PIERS0035, IMERG-Early and IMERG-Final show greater departures from the observations, while IMERG-Late aligns more closely with PIERS. In the 4–10 mm range, the IMERG estimates generally agree more closely with PIERS at PIERS0030 and PIERS0032 but show some deviations at the remaining two stations. In contrast, the IMERG datasets exhibit larger deviations from PIERS in the >0–1 mm precipitation range. Overall, these findings indicate that hourly IMERG performance depends on both precipitation intensity class and station (Figure 6).
Like the hourly-scale analysis, IMERG performance varies by precipitation intensity class and monitoring station (Figure 6). In the low-intensity range (>0 to ~8 mm), all three IMERG products show noticeable deviations from the PIERS observations. By contrast, in the 30–70 mm range, all IMERG datasets closely match the PIERS estimates across the four stations. Among the products, IMERG-Early agrees more closely with PIERS at PIERS0030 and PIERS0032, while IMERG-Final performs better at PIERS0034 and PIERS0035 for light precipitation (>0 to ~8 mm). Overall, the IMERG products tend to underestimate precipitation in the low-intensity range. In the other intensity classes, both underestimation and overestimation occur, depending on the precipitation intensity and station (Figure 6). These findings indicate that IMERG performance varies with precipitation intensity and station at the daily temporal scale.
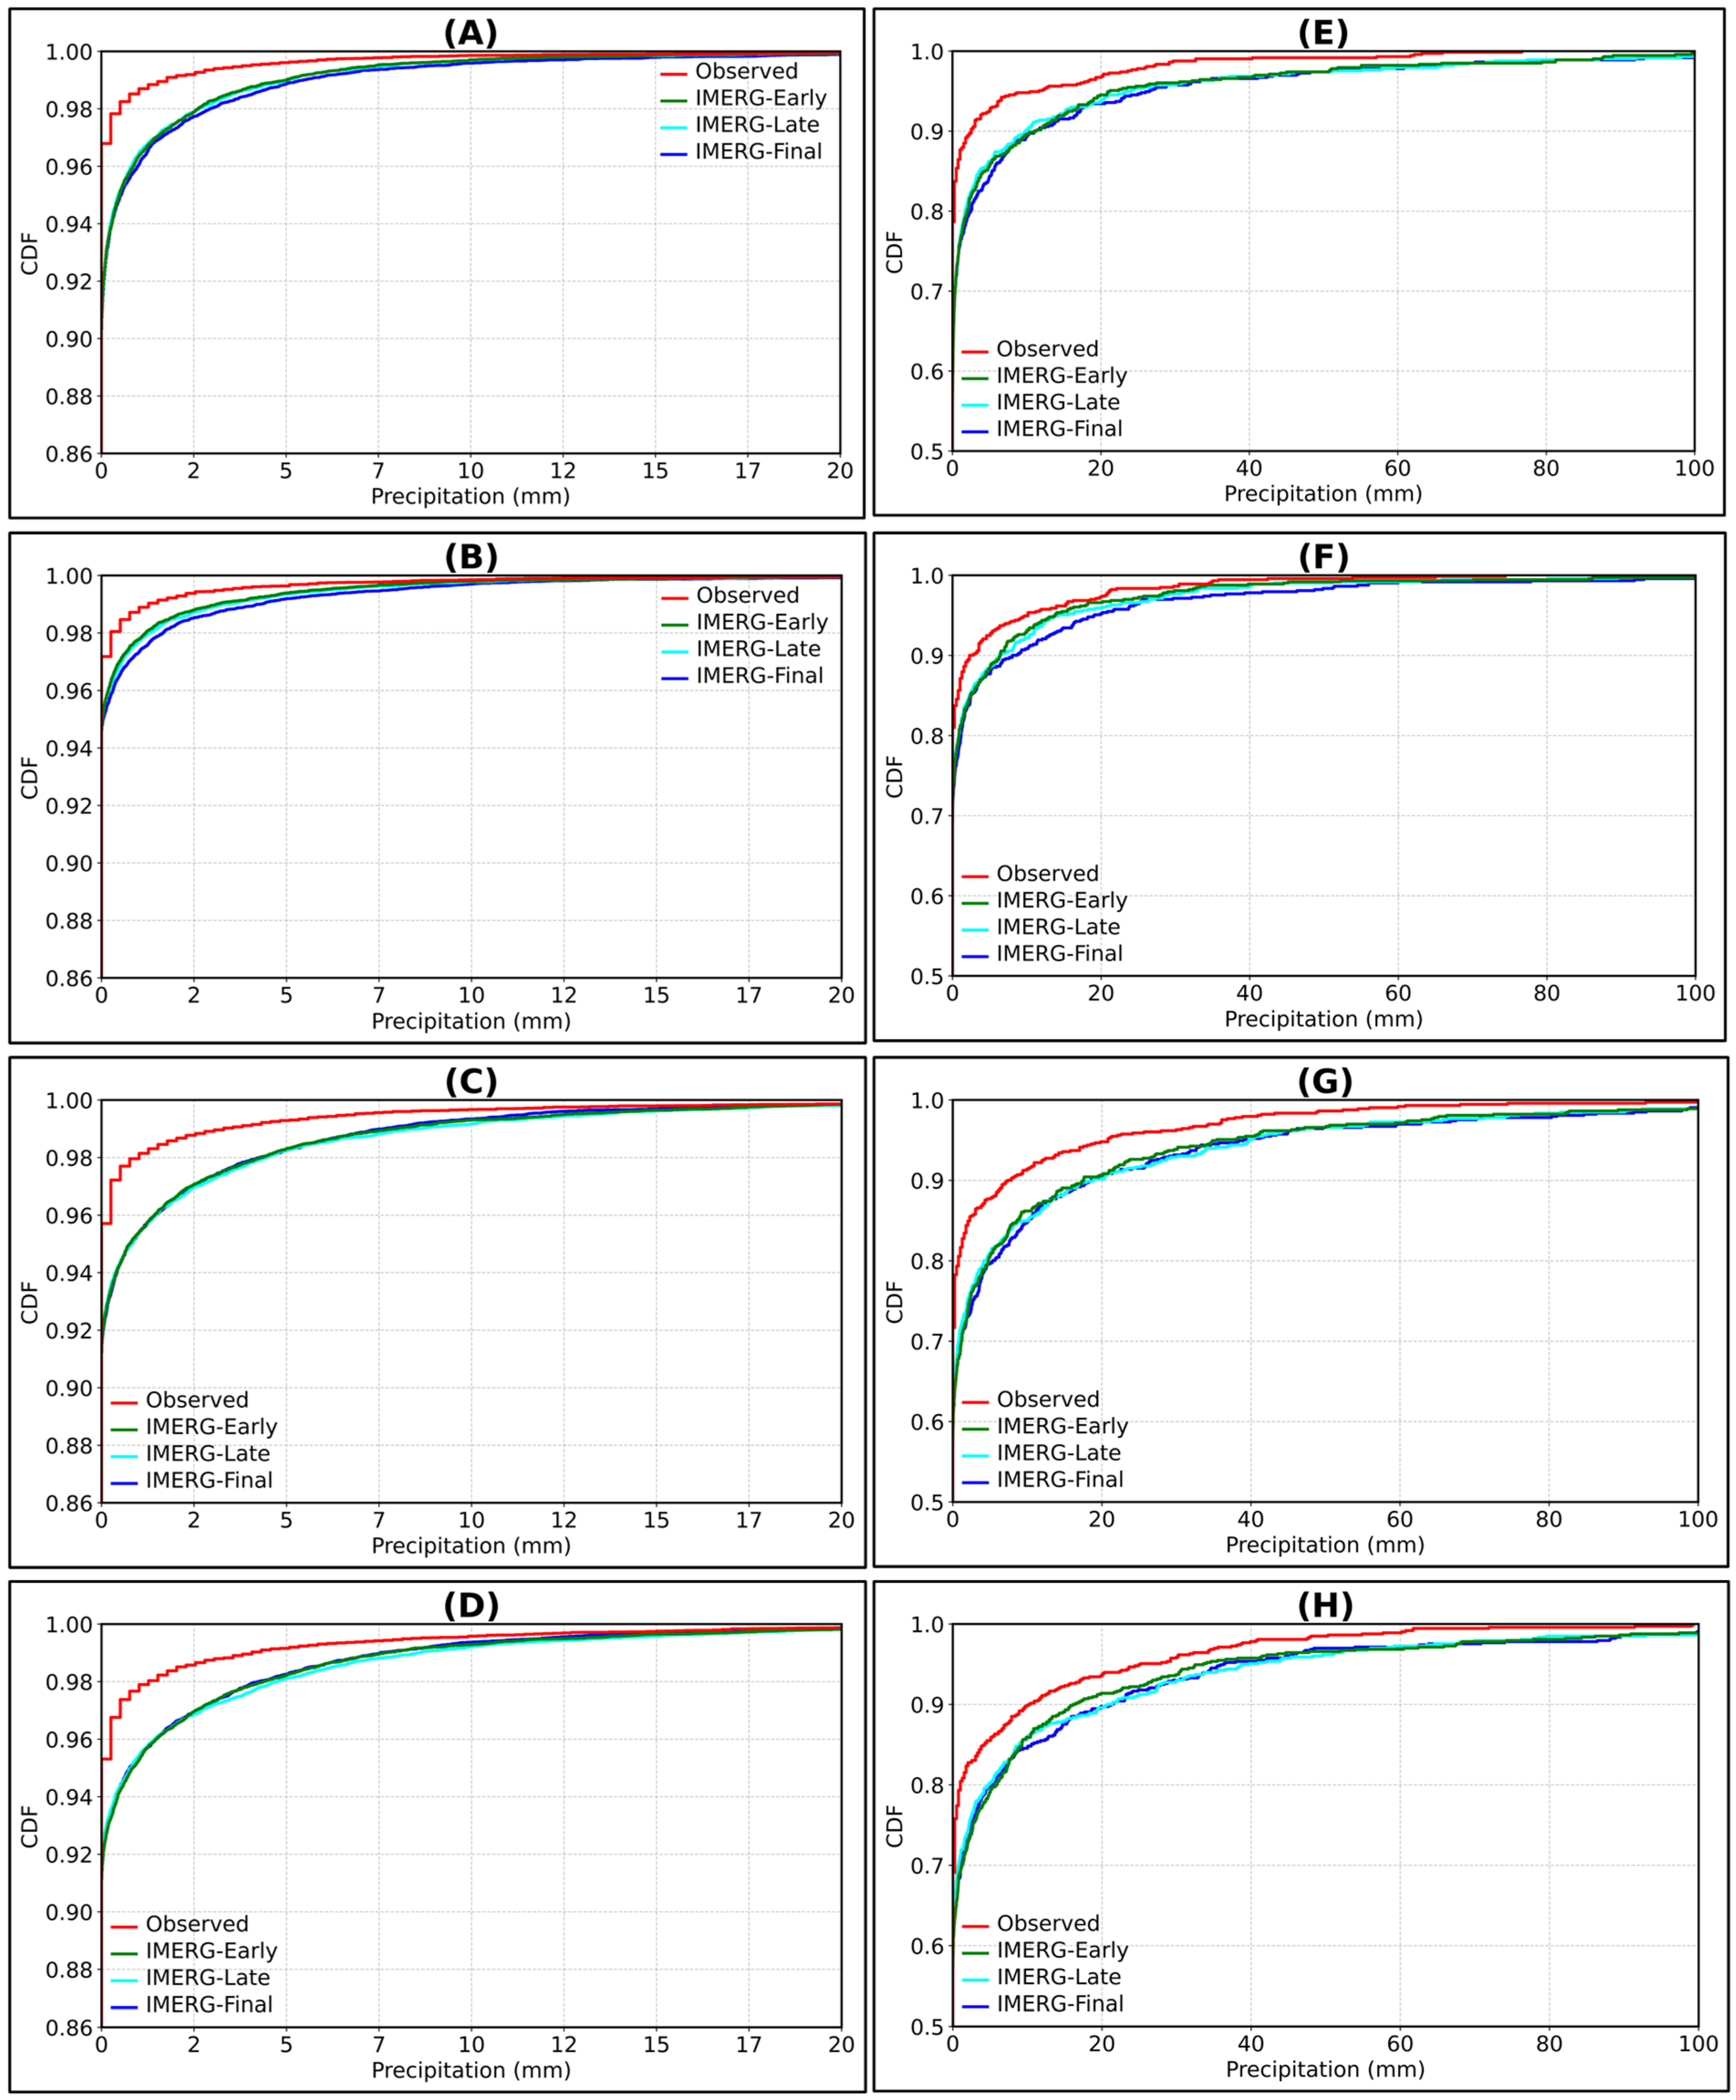
Figure 7 illustrates the CDF plots of the IMERG datasets compared with the PIERS station data at hourly and daily scales. At the hourly scale, the CDF curves of the IMERG datasets exhibit noticeable differences from the PIERS station data. On the other hand, no significant differences are observed among the IMERG datasets at PIERS0034 and PIERS0035. However, slight variations among the IMERG datasets are evident at PIERS0030 and PIERS0032.
IMERG-Early performed better at PIERS0030 and PIERS0032, whereas IMERG-Final deviated considerably from the PIERS observations at these stations. In contrast, at PIERS0034 and PIERS0035, IMERG-Final showed closer agreement with the observed data than the other IMERG datasets, while IMERG-Late exhibited larger deviations from the PIERS station data. These results highlight that the performance of datasets varies across stations (Figure 7).
Like at the hourly scale, the IMERG datasets exhibited noticeable differences from the observed PIERS data at the daily scale, although the discrepancies were relatively smaller at PIERS0032 than at the other three stations. Comparisons among the IMERG datasets also revealed clear performance variations across stations. For example, IMERG-Early performed better than the other IMERG datasets at PIERS0034 for most precipitation amounts, whereas IMERG-Final showed poorer agreement at PIERS0032. These observations imply that the accuracy and consistency of IMERG data vary spatially, highlighting the need for station-wise assessment before their use in hydro-meteorological analysis. The daily CDF plots provide a clearer representation of the IMERG performance variations across different precipitation magnitudes than the hourly CDF plots (Figure 7).

4.3. Performance in Estimating the 99th Percentile Precipitation

The estimates of the 99th precipitation percentile from the IMERG datasets at hourly and daily temporal scales are summarized in Table 4. The results indicate that noticeable deviations were observed between the IMERG estimates and the corresponding PIERS measurements for estimating the 99th percentile precipitation (Table 4). Among the evaluated datasets, IMERG-Early performed better at PIERS0030 and PIERS0032, while IMERG-Final produced better estimates at PIERS0034 and PIERS0035 at the hourly scale. Conversely, IMERG-Late provided better estimates at PIERS0030 and PIERS0032 at the daily time scale, while IMERG-Final performed best at PIERS0034 and PIERS0035 in reproducing the PIERS observations.
The results indicate that IMERG-Final is the best-performing dataset for estimating the 99th precipitation percentile at two stations (PIERS0034 and PIERS0035) at both hourly and daily temporal scales. However, it is not among the best-performing datasets at the other two stations (PIERS0030 and PIERS0032), highlighting spatial variability in the performance of the IMERG products across stations. The results further show that IMERG-Early performs best at the hourly scale, whereas IMERG-Late performs best at the daily scale for PIERS0030 and PIERS0032, demonstrating that the relative performance of the IMERG datasets also varies with temporal scale when estimating the 99th precipitation percentile.

5. Discussion

5.1. Performance of the IMERG Datasets

Based on the findings of this study, IMERG-Late and IMERG-Final exhibited comparable performance in detecting precipitation events at the hourly scale, but differed at the daily scale, with IMERG-Late outperforming IMERG-Final across most stations and performance metrics. In contrast to these findings, several studies conducted in other regions reported that IMERG-Final was more accurate than IMERG-Late in detecting daily precipitation [18,62]. For example, Aksu and Yaldiz [18] in Turkey and Weng, Tian, Jiang, Chen and Kang [62] in Xijiang River Basin, China, found that IMERG-Final performed better than both IMERG-Late and IMERG-Early in detecting daily precipitation occurrence. These discrepancies between the present study and previous studies from other regions highlight the spatial variability in IMERG dataset performance.
Our results indicate that IMERG-Final did not consistently outperform IMERG-Late and IMERG-Early across all stations, temporal resolutions, and precipitation characteristics. This finding is consistent with Tang, Li, He, Wang, Fan and Yao [28] in the Sichuan Basin, China, who reported that IMERG-Late outperformed IMERG-Final for certain hourly statistical measures. However, it contrasts with the findings by Aksu, Taflan, Yaldiz and Akgül [16] in Turkey and Andualem, Malede and Ejigu [29] in the Gilgel Abay watershed, Ethiopia, who identified IMERG-Final and IMERG-Early, respectively, as the most accurate products for daily precipitation estimation. These comparisons highlight that IMERG product performance is highly region- and scale-dependent and emphasize the need for location-specific validation before hydrological or climate applications. The findings further revealed that the ability of the datasets to estimate precipitation percentiles varied across temporal scales and monitoring stations, emphasizing the need to select the most suitable dataset for the specific region, timescale, and intended application.
As mentioned earlier, the results of this study indicate that the performance of the IMERG datasets varies among the PIERS stations examined. Consistent with the spatial variability observed in this study, several studies conducted in other regions have also reported significant spatial differences in IMERG dataset performance [16,21,63]. For example, Gan, Gao and Xiao [63] reported variations in the performance of the three IMERG datasets across different stations in the Nanliujiang River Basin, China.
Regarding estimation bias, the three IMERG datasets exhibited overestimation at both hourly and daily scales across the four studied stations. Consistent with these findings, several studies have also reported overestimation by IMERG datasets [41,45]. For example, Aksu, Taflan, Yaldiz and Akgül [16] in Turkey, Gadelha, Coelho, Xavier, Barbosa, Melo, Xuan, Huffman, Petersen and Almeida [45] in Brazil, and Anjum, Ding, Shangguan, Ahmad, Ijaz, Farid, Yagoub, Zaman and Adnan [41] in the northern highland regions of Pakistan documented overestimation by the IMERG-Final dataset at the daily scale. In contrast, Andualem, Malede and Ejigu [29] in the Gilgel Abay watershed, Ethiopia, reported overestimation by IMERG-Final but underestimation by IMERG-Early and IMERG-Late. Furthermore, Kazamias et al. [64] observed differing directions of estimation bias across regions in Greece.
The IMERG datasets exhibited relatively high estimation bias in this study, with values ranging from −66.4% to −177.5%. These results indicate substantial overestimation across the evaluated datasets. Consistent with our findings, although bias is generally expected to decrease at the monthly scale relative to the daily scale, Kawo, Hordofa and Karuppannan [14] reported estimation biases of 91.54% for IMERG-Early and 77.03% for IMERG-Late at the monthly scale in the Lake Awasa catchment, Ethiopia. However, several studies reported lower estimation bias, below 50%, at the hourly [65] and daily [16,29] scales. In addition, estimation bias in this study varied across the four PIERS stations. The findings from this and previous studies highlight that the estimation biases of IMERG datasets differ substantially across regions.

5.2. Contributions and Limitations of the Study

This study has some limitations. One limitation is the relatively short analysis period. Although the IMERG-Early and IMERG-Late datasets are available for more recent periods, the IMERG-Final dataset was available only through September 2025 at the time of analysis (15 May 2026). To maintain consistency across all IMERG products, the evaluation was therefore restricted to the common period ending in September 2025.
Another limitation of the study is the small number of stations included in the analysis. This is because the primary objective of the study was to evaluate the IMERG datasets using PIERS ground station observations collected in Texas. Of the five PIERS stations in Texas, three are at Prairie View A&M University. Data collection at two of these stations, PIERS0034 and PIERS0035, began on 25 September 2023. As described in the methods section, one of the Prairie View A&M University stations (PIERS0036) also contained substantial missing data during 2025. Consequently, the analysis covered the period from October 2023 to September 2025 and was conducted using observations from four PIERS station locations. Similarly to our study, several previous studies that evaluated the three IMERG runs also relied on relatively short data records of 3 years or less because of limited data availability [29,41,43].
We also acknowledge that the PIERS stations are unevenly distributed spatially: PIERS0034 and PIERS0035 are located close to each other, whereas PIERS0030 and PIERS0032 are farther apart (Figure 1). Missing values were imputed with the MICE package, which iteratively predicts missing values using complete precipitation observations from the other stations. Because missing data accounted for less than 2.4% of records at each site, the imputation is expected to have minimal influence on the study findings.
In this study, we used Pearson correlation along with other performance metrics, including PBIAS, RMSE, four categorical measures (POD, FAR, FBI, and CSI), PDF, CDF, and the 99th percentile, to provide a more comprehensive assessment. Pearson correlation values can be influenced by the large number of matched zeros (dry–dry pairs) rather than by the model’s ability to capture rainy time steps, mainly on the hourly time scale. Therefore, this study also acknowledges this limitation.
Despite these limitations, the findings of this study provide valuable insights for both developers and users of the IMERG datasets in hydroclimatic applications. For example, the better performance of IMERG-Late and IMERG-Early at specific temporal scales, for certain precipitation metrics, and at particular stations highlights their strong potential for near-real-time forecasting and agricultural planning applications. In addition, the observed variations in dataset performance across temporal scales, stations, and precipitation metrics emphasize the importance of carefully selecting the most suitable IMERG product for a specific region and application.

6. Conclusions

This study evaluated the performance of the IMERG-Early, IMERG-Late, and IMERG-Final datasets in estimating hourly and daily precipitation from October 2023 to September 2025 using PIERS stations installed in Texas, United States. Due to substantial missing data at one station during 2025, the analysis was conducted using four PIERS stations. The results demonstrate that IMERG-Late achieved superior performance in detecting daily precipitation events across most stations and categorical performance metrics, whereas IMERG-Late and IMERG-Final showed comparable performance in detecting hourly precipitation events. For precipitation total estimation, the performance of the IMERG products varied across stations and temporal scales. At the hourly scale, IMERG-Final performed best at PIERS0034 and PIERS0035, IMERG-Early performed best at PIERS0030, and IMERG-Early and IMERG-Late showed comparably strong performance at PIERS0032. At the daily scale, IMERG-Early produced the best results at PIERS0030 and PIERS0032 for most metrics, whereas IMERG-Final achieved the best performance for most metrics at PIERS0034 and PIERS0035. The performance of the evaluated IMERG products varied across stations and temporal scales in estimating mean precipitation, precipitation intensity, and 99th percentile precipitation.
The evaluated IMERG datasets exhibited substantial estimation biases, which ranged from −66.4% to −177.5%, emphasizing the need to identify appropriate bias-correction techniques for research applications. Moreover, although IMERG-Final is the calibrated dataset and is recommended for research applications, IMERG-Late and IMERG-Early performed better at specific temporal scales, for certain precipitation characteristics, and at some stations. Therefore, further research is needed to understand why IMERG-Final performs worse than IMERG-Late and IMERG-Early under these conditions. Overall, this study provides valuable insights into the variability of the IMERG dataset’s performance across different temporal scales, station locations, and precipitation metrics.

Author Contributions

Conceptualization, T.G.T., G.W.T. and R.L.R.; Methodology, T.G.T., G.W.T. and R.L.R.; Software, T.G.T.; Formal analysis, T.G.T.; Investigation, T.G.T., G.W.T. and R.L.R.; Data curation, T.G.T.; Writing—original draft, T.G.T.; Writing—review & editing, T.G.T., S.R., G.W.T. and R.L.R.; Visualization, T.G.T.; Project administration, R.L.R.; Funding acquisition, G.W.T. and R.L.R. All authors have read and agreed to the published version of the manuscript.

Funding

This study was supported by the National Aeronautics and Space Administration (NASA) under the Award No. 80NSSC22K1781.

Data Availability Statement

The IMERG datasets evaluated in this study are freely available at https://giovanni.gsfc.nasa.gov/giovanni/ (Accessed date 15 May 2026), while the PIERS station data used as reference data are publicly available at https://gpm-gv.gsfc.nasa.gov/Gauge/index.php (Accessed date 12 May 2026).

Conflicts of Interest

The authors declare no conflicts of interest.

References

  1. Delgado, D.; Sadaoui, M.; Ludwig, W.; Méndez, W. Spatio-temporal assessment of rainfall erosivity in Ecuador based on RUSLE using satellite-based high frequency GPM-IMERG precipitation data. CATENA 2022, 219, 106597. [Google Scholar] [CrossRef] [Scilit]
  2. Yu, L.; Leng, G.; Python, A. A comprehensive validation for GPM IMERG precipitation products to detect extremes and drought over mainland China. Weather Clim. Extrem. 2022, 36, 100458. [Google Scholar] [CrossRef] [Scilit]
  3. Aksu, H.; Cavus, Y.; Aksoy, H.; Akgul, M.A.; Turker, S.; Eris, E. Spatiotemporal analysis of drought by CHIRPS precipitation estimates. Theor. Appl. Clim. 2022, 148, 517–529. [Google Scholar] [CrossRef] [Scilit]
  4. Abate, B.Z.; Alaminie, A.A.; Assefa, T.T.; Tigabu, T.B.; He, L. Modeling climate change impacts on blue and green water of the Kobo-Golina River in data-scarce upper Danakil basin, Ethiopia. J. Hydrol. Reg. Stud. 2024, 53, 101756. [Google Scholar] [CrossRef] [Scilit]
  5. Yu, C.; Hu, D.; Duan, X.; Zhang, Y.; Liu, M.; Wang, S. Rainfall-runoff simulation and flood dynamic monitoring based on CHIRPS and MODIS-ET. Int. J. Remote Sens. 2020, 41, 4206–4225. [Google Scholar] [CrossRef] [Scilit]
  6. Ghasemifar, E.; Sonboli, Z.; Hedayatizade, M. Comprehensive analysis of droughts over the Middle East using IMERG data over the past two decades (2001–2020). J. Atmos. Sol.-Terr. Phys. 2023, 252, 106135. [Google Scholar] [CrossRef] [Scilit]
  7. Ekpetere, K.O.; Coll, J.M.; Mehta, A.V. Revisiting the PMP return periods: A Case study of IMERG data in CONUS. Total Environ. Adv. 2025, 13, 200120. [Google Scholar] [CrossRef] [Scilit]
  8. Zhou, C.; Gao, W.; Hu, J.; Du, L.; Du, L. Capability of IMERG V6 Early, Late, and Final Precipitation Products for Monitoring Extreme Precipitation Events. Remote Sens. 2021, 13, 689. [Google Scholar] [CrossRef] [Scilit]
  9. Gashaw, T.; Worqlul, A.W.; Lakew, H.; Teferi Taye, M.; Seid, A.; Haileslassie, A. Evaluations of satellite/reanalysis rainfall and temperature products in the Bale Eco-Region (Southern Ethiopia) to enhance the quality of input data for hydro-climate studies. Remote Sens. Appl. Soc. Environ. 2023, 31, 100994. [Google Scholar] [CrossRef] [Scilit]
  10. Li, Z.; Tang, G.; Hong, Z.; Chen, M.; Gao, S.; Kirstetter, P.; Gourley, J.J.; Wen, Y.; Yami, T.; Nabih, S.; et al. Two-decades of GPM IMERG early and final run products intercomparison: Similarity and difference in climatology, rates, and extremes. J. Hydrol. 2021, 594, 125975. [Google Scholar] [CrossRef] [Scilit]
  11. Zhu, S.; Li, Z.; Chen, M.; Wen, Y.; Liu, Z.; Huffman, G.J.; Tsoodle, T.E.; Ferraro, S.C.; Wang, Y.; Hong, Y. Evaluation of IMERG climate trends over land in the TRMM and GPM eras. Environ. Res. Lett. 2025, 20, 014064. [Google Scholar] [CrossRef] [Scilit]
  12. Li, R.; Qi, D.; Zhang, Y.; Wang, K. A new pixel-to-object method for evaluating the capability of the GPM IMERG product to quantify precipitation systems. J. Hydrol. 2022, 613, 128476. [Google Scholar] [CrossRef] [Scilit]
  13. Gentilucci, M.; Barbieri, M.; Pambianchi, G. Reliability of the IMERG product through reference rain gauges in Central Italy. Atmos. Res. 2022, 278, 106340. [Google Scholar] [CrossRef] [Scilit]
  14. Kawo, N.S.; Hordofa, A.T.; Karuppannan, S. Performance evaluation of GPM-IMERG early and late rainfall estimates over Lake Hawassa catchment, Rift Valley Basin, Ethiopia. Arab. J. Geosci. 2021, 14, 256. [Google Scholar] [CrossRef] [Scilit]
  15. Li, X.; Liu, J.; Cui, W.; Wang, H.; Liao, A.; Wang, Y.; Gao, W. Comparative evaluation of GPM IMERG V07 early, late and final run products compared to IMERG V06 in Sichuan Province, China. Theor. Appl. Clim. 2025, 156, 354. [Google Scholar] [CrossRef] [Scilit]
  16. Aksu, H.; Taflan, G.Y.; Yaldiz, S.G.; Akgül, M.A. Evaluation of IMERG for GPM satellite-based precipitation products for extreme precipitation indices over Turkiye. Atmos. Res. 2023, 291, 106826. [Google Scholar] [CrossRef] [Scilit]
  17. Xiong, J.; Tang, G.; Yang, Y. Continental evaluation of GPM IMERG V07B precipitation on a sub-daily scale. Remote Sens. Environ. 2025, 321, 114690. [Google Scholar] [CrossRef] [Scilit]
  18. Aksu, H.; Yaldiz, S.G. Performance comparison of GPM IMERG V07 with its predecessor V06 and its application in extreme precipitation clustering over Türkiye. Atmos. Res. 2025, 315, 107840. [Google Scholar] [CrossRef] [Scilit]
  19. Hosseini-Moghari, S.M.; Tang, Q. Can IMERG Data Capture the Scaling of Precipitation Extremes with Temperature at Different Time Scales? Geophys. Res. Lett. 2022, 49, e2021GL096392. [Google Scholar] [CrossRef] [Scilit]
  20. Jarrin-Perez, F.; Jeong, J.; Bieger, K.; Roger, J.-C.; Choi, S. Evaluating IMERG-F precipitation for SWAT hydrologic modeling in data-rich and sparse watersheds. Environ. Model. Softw. 2025, 192, 106574. [Google Scholar] [CrossRef] [Scilit]
  21. Bartuska, E.; Beighley, R.E. Assessing precipitation event characteristics throughout North Carolina derived from GPM IMERG data products. Front. Water 2024, 6, 1296586. [Google Scholar] [CrossRef] [Scilit]
  22. Ray, R.L.; Sishodia, R.P.; Tefera, G.W. Evaluation of Gridded Precipitation Data for Hydrologic Modeling in North-Central Texas. Remote Sens. 2022, 14, 3860. [Google Scholar] [CrossRef] [Scilit]
  23. Li, Z.; Tang, G.; Kirstetter, P.; Gao, S.; Li, J.L.F.; Wen, Y.; Hong, Y. Evaluation of GPM IMERG and its constellations in extreme events over the conterminous united states. J. Hydrol. 2022, 606, 127357. [Google Scholar] [CrossRef] [Scilit]
  24. Li, R.; Guilloteau, C.; Kirstetter, P.-E.; Foufoula-Georgiou, E. How well does the IMERG satellite precipitation product capture the timing of precipitation events? J. Hydrol. 2023, 620, 129563. [Google Scholar] [CrossRef] [Scilit]
  25. Gan, F.; Cai, X.; Gao, Y.; Zhang, X. A performance-enhancement-oriented evaluation system to scrutinize the changes from IMERG V06 updated to V07 in capturing and presenting typhoon process. Atmos. Res. 2025, 326, 108292. [Google Scholar] [CrossRef] [Scilit]
  26. Zhu, S.; Li, Z.; Chen, M.; Wen, Y.; Gao, S.; Zhang, J.; Wang, J.; Nan, Y.; Ferraro, S.C.; Tsoodle, T.E.; et al. How has the latest IMERG V07 improved the precipitation estimates and hydrologic utility over CONUS against IMERG V06? J. Hydrol. 2024, 645, 132257. [Google Scholar] [CrossRef] [Scilit]
  27. Tarkegn, T.G.; Ray, R.L.; Tefera, G.W. Comprehensive evaluations of gridded precipitation datasets across diverse climate zones of Brazos River Basin, Texas, USA. Remote Sens. Appl. Soc. Environ. 2026, 41, 101947. [Google Scholar] [CrossRef] [Scilit]
  28. Tang, S.; Li, R.; He, J.; Wang, H.; Fan, X.; Yao, S. Comparative Evaluation of the GPM IMERG Early, Late, and Final Hourly Precipitation Products Using the CMPA Data over Sichuan Basin of China. Water 2020, 12, 554. [Google Scholar] [CrossRef] [Scilit]
  29. Andualem, T.G.; Malede, D.A.; Ejigu, M.T. Performance evaluation of integrated multi-satellite retrieval for global precipitation measurement products over Gilgel Abay watershed, Upper Blue Nile Basin, Ethiopia. Model. Earth Syst. Environ. 2020, 6, 1853–1861. [Google Scholar] [CrossRef] [Scilit]
  30. Pabla, C.S.; Wolff, D.B.; Marks, D.A.; Wingo, S.M.; Pippitt, J.L. GPM Ground Validation at NASA Wallops Precipitation Research Facility. J. Atmos. Ocean. Technol. 2022, 39, 1199–1215. [Google Scholar] [CrossRef] [Scilit]
  31. Sonet, M.S.; Reygadas, Y. Unveiling four decades of spatiotemporal climate trends in Texas (1981–2023). J. Hydrol. Reg. Stud. 2025, 60, 102539. [Google Scholar] [CrossRef] [Scilit]
  32. Ray, R.L.; Ibironke, A.; Kommalapati, R.; Fares, A. Quantifying the Impacts of Land-Use and Climate on Carbon Fluxes Using Satellite Data across Texas, U.S. Remote Sens. 2019, 11, 1733. [Google Scholar] [CrossRef] [Scilit]
  33. Valiya Veettil, A.; Fares, A.; Awal, R.; Mohtar, R. Assessing Future Water Scarcity in Texas under Climate Change and Growing Water Demands. J. Hydrol. Eng. 2024, 29, 05024022. [Google Scholar] [CrossRef] [Scilit]
  34. Mishra, A.K.; Singh, V.P. Changes in extreme precipitation in Texas. J. Geophys. Res. Atmos. 2010, 115, D14106. [Google Scholar] [CrossRef] [Scilit]
  35. Buuren, S.v.; Groothuis-Oudshoorn, K.; Vink, G.; Schouten, R.; Robitzsch, A.; Rockenschaub, P.; Doove, L.; Jolani, S.; Moreno-Betancur, M.; White, I.; et al. Multivariate Imputation by Chained Equations (MICE), Version 3.18.0. 2025. Available online: https://cran.r-project.org/web/packages/mice/index.html (accessed on 8 September 2025).
  36. Gashaw, T.; Wubaye, G.B.; Worqlul, A.W.; Dile, Y.T.; Mohammed, J.A.; Birhan, D.A.; Tefera, G.W.; van Oel, P.R.; Haileslassie, A.; Chukalla, A.D.; et al. Local and regional climate trends and variabilities in Ethiopia: Implications for climate change adaptations. Environ. Chall. 2023, 13, 100794. [Google Scholar] [CrossRef] [Scilit]
  37. Ali Mohammed, J.; Gashaw, T.; Worku Tefera, G.; Dile, Y.T.; Worqlul, A.W.; Addisu, S. Changes in observed rainfall and temperature extremes in the Upper Blue Nile Basin of Ethiopia. Weather Clim. Extrem. 2022, 37, 100468. [Google Scholar] [CrossRef] [Scilit]
  38. Worku, G.; Teferi, E.; Bantider, A.; Dile, Y.T.; Taye, M.T. Evaluation of regional climate models performance in simulating rainfall climatology of Jemma sub-basin, Upper Blue Nile Basin, Ethiopia. Dyn. Atmos. Ocean. 2018, 83, 53–63. [Google Scholar] [CrossRef] [Scilit]
  39. Zhang, X.; Yang, F. RClimDex (1.0) User Manual; Climate Research Branch Environment: Toronto, ON, Canada, 2004; p. 22. [Google Scholar]
  40. WMO. Guidelines on Analysis of Extremes in a Changing Climate in Support of Informed Decisions for Adaptation; WMO: Geneva, Switzerland, 2009; 55p. [Google Scholar]
  41. Anjum, M.N.; Ding, Y.; Shangguan, D.; Ahmad, I.; Ijaz, M.W.; Farid, H.U.; Yagoub, Y.E.; Zaman, M.; Adnan, M. Performance evaluation of latest integrated multi-satellite retrievals for Global Precipitation Measurement (IMERG) over the northern highlands of Pakistan. Atmos. Res. 2018, 205, 134–146. [Google Scholar] [CrossRef] [Scilit]
  42. Yang, M.; Liu, G.; Chen, T.; Chen, Y.; Xia, C. Evaluation of GPM IMERG precipitation products with the point rain gauge records over Sichuan, China. Atmos. Res. 2020, 246, 105101. [Google Scholar] [CrossRef] [Scilit]
  43. Cao, M.; Chen, M.; Walker, J. Intercomparison of GPM hourly precipitation products: Assessing the strengths in capturing precipitation events and their properties. Atmos. Res. 2025, 325, 108231. [Google Scholar] [CrossRef] [Scilit]
  44. Yao, N.; Ye, J.; Wang, S.; Yang, S.; Lu, Y.; Zhang, H.; Yang, X. Bias correction of the hourly satellite precipitation product using machine learning methods enhanced with high-resolution WRF meteorological simulations. Atmos. Res. 2024, 310, 107637. [Google Scholar] [CrossRef] [Scilit]
  45. Gadelha, A.N.; Coelho, V.H.R.; Xavier, A.C.; Barbosa, L.R.; Melo, D.C.D.; Xuan, Y.; Huffman, G.J.; Petersen, W.A.; Almeida, C.d.N. Grid box-level evaluation of IMERG over Brazil at various space and time scales. Atmos. Res. 2019, 218, 231–244. [Google Scholar] [CrossRef] [Scilit]
  46. Fenta, A.A.; Yasuda, H.; Shimizu, K.; Ibaraki, Y.; Haregeweyn, N.; Kawai, T.; Belay, A.S.; Sultan, D.; Ebabu, K. Evaluation of satellite rainfall estimates over the Lake Tana basin at the source region of the Blue Nile River. Atmos. Res. 2018, 212, 43–53. [Google Scholar] [CrossRef] [Scilit]
  47. Aniley, E.; Gashaw, T.; Abraham, T.; Demessie, S.F.; Bayabil, H.K.; Worqlul, A.W.; van Oel, P.R.; Dile, Y.T.; Chukalla, A.D.; Haileslassie, A.; et al. Evaluating the performances of gridded satellite/reanalysis products in representing the rainfall climatology of Ethiopia. Geocarto Int. 2023, 38, 2278329. [Google Scholar] [CrossRef] [Scilit]
  48. Li, D.; Shen, Y.; Ye, X.; Fu, X.; Yang, Y.; Ou, T.; Chen, D.; Tian, F.; Yang, L. A ten-year (2012–2021) fine-resolution (1 km, hourly) precipitation dataset over southeastern Tibetan Plateau. Sci. Data 2025, 12, 335. [Google Scholar] [CrossRef] [Scilit] [PubMed]
  49. Zhuang, Q.; Zhou, Z.; Liu, S.; Wright, D.B.; Gao, L. The evaluation and downscaling-calibration of IMERG precipitation products at sub-daily scales over a metropolitan region. J. Flood Risk Manag. 2023, 16, e12902. [Google Scholar] [CrossRef] [Scilit]
  50. Sungmin, O.; Foelsche, U.; Kirchengast, G.; Fuchsberger, J.; Tan, J.; Petersen, W.A. Evaluation of GPM IMERG Early, Late, and Final rainfall estimates using WegenerNet gauge data in southeastern Austria. Hydrol. Earth Syst. Sci. 2017, 21, 6559–6572. [Google Scholar] [CrossRef] [Scilit]
  51. Tefera, G.W.; Ray, R.L.; Wootten, A.M. Evaluation of statistical downscaling techniques and projection of climate extremes in central Texas, USA. Weather Clim. Extrem. 2024, 43, 100637. [Google Scholar] [CrossRef] [Scilit]
  52. Singh, A.K.; Singh, V. Assessing the accuracy and reliability of satellite-derived precipitation products in the Kosi River basin (India). Environ. Monit. Assess. 2024, 196, 671. [Google Scholar] [CrossRef] [Scilit] [PubMed]
  53. Omay, P.O.; Muthama, N.J.; Oludhe, C.; Kinama, J.M.; Artan, G.; Atheru, Z. Evaluation of satellite-based rainfall estimates over the IGAD region of Eastern Africa. Meteorol. Atmos. Phys. 2025, 137, 22. [Google Scholar] [CrossRef] [Scilit]
  54. Akinsanola, A.A.; Jung, C.; Wang, J.; Kotamarthi, V.R. Evaluation of precipitation across the contiguous United States, Alaska, and Puerto Rico in multi-decadal convection-permitting simulations. Sci. Rep. 2024, 14, 1238. [Google Scholar] [CrossRef] [Scilit] [PubMed]
  55. Chen, T.C.; Collet, F.; Di Luca, A. Evaluation of ERA5 precipitation and 10-m wind speed associated with extratropical cyclones using station data over North America. Int. J. Clim. 2024, 44, 729–747. [Google Scholar] [CrossRef] [Scilit]
  56. Dinku, T.; Funk, C.; Peterson, P.; Maidment, R.; Tadesse, T.; Gadain, H.; Ceccato, P. Validation of the CHIRPS satellite rainfall estimates over eastern Africa. Q. J. R. Meteorol. Soc. 2018, 144, 292–312. [Google Scholar] [CrossRef] [Scilit]
  57. Ageet, S.; Fink, A.H.; Maranan, M.; Diem, J.E.; Hartter, J.; Ssali, A.L.; Ayabagabo, P. Validation of Satellite Rainfall Estimates over Equatorial East Africa. J. Hydrometeorol. 2022, 23, 129–151. [Google Scholar] [CrossRef] [Scilit]
  58. Ayehu, G.T.; Tadesse, T.; Gessesse, B.; Dinku, T. Validation of new satellite rainfall products over the Upper Blue Nile Basin, Ethiopia. Atmos. Meas. Tech. 2018, 11, 1921–1936. [Google Scholar] [CrossRef] [Scilit]
  59. Woldesenbet, T.A.; Elagib, N.A.; Ribbe, L.; Heinrich, J. Hydrological responses to land use/cover changes in the source region of the Upper Blue Nile Basin, Ethiopia. Sci. Total Environ. 2017, 575, 724–741. [Google Scholar] [CrossRef] [Scilit] [PubMed]
  60. Moriasi, D.N.; Arnold, J.G.; van Liew, M.W.; Bingner, R.L.; Harmel, R.D.; Veith, T.L. Model evaluation guidelines for systematic quantification of accuracy in watershed simulations. Trans. ASABE 2007, 50, 885–900. [Google Scholar] [CrossRef] [Scilit]
  61. Abreu, M.C.; de Souza, A.; Lyra, G.B.; de Oliveira-Júnior, J.F.; Pobocikova, I.; de Almeida, L.T.; de Souza Fraga, M.; Aristone, F.; Cecílio, R.A. Assessment and characterization of the monthly probabilities of rainfall in Midwest Brazil using different goodness-of-fit tests as probability density functions selection criteria. Theor. Appl. Clim. 2022, 151, 491–513. [Google Scholar] [CrossRef] [Scilit]
  62. Weng, P.; Tian, Y.; Jiang, Y.; Chen, D.; Kang, J. Assessment of GPM IMERG and GSMaP daily precipitation products and their utility in droughts and floods monitoring across Xijiang River Basin. Atmos. Res. 2023, 286, 106673. [Google Scholar] [CrossRef] [Scilit]
  63. Gan, F.; Gao, Y.; Xiao, L. Comprehensive validation of the latest IMERG V06 precipitation estimates over a basin coupled with coastal locations, tropical climate and hill-karst combined landform. Atmos. Res. 2021, 249, 105293. [Google Scholar] [CrossRef] [Scilit]
  64. Kazamias, A.-P.; Sapountzis, M.; Lagouvardos, K. Evaluation of GPM-IMERG rainfall estimates at multiple temporal and spatial scales over Greece. Atmos. Res. 2022, 269, 106014. [Google Scholar] [CrossRef] [Scilit]
  65. Lv, P.; Wu, G. The Performance of GPM IMERG Product Validated on Hourly Observations over Land Areas of Northern Hemisphere. Remote Sens. 2024, 16, 4334. [Google Scholar] [CrossRef] [Scilit]
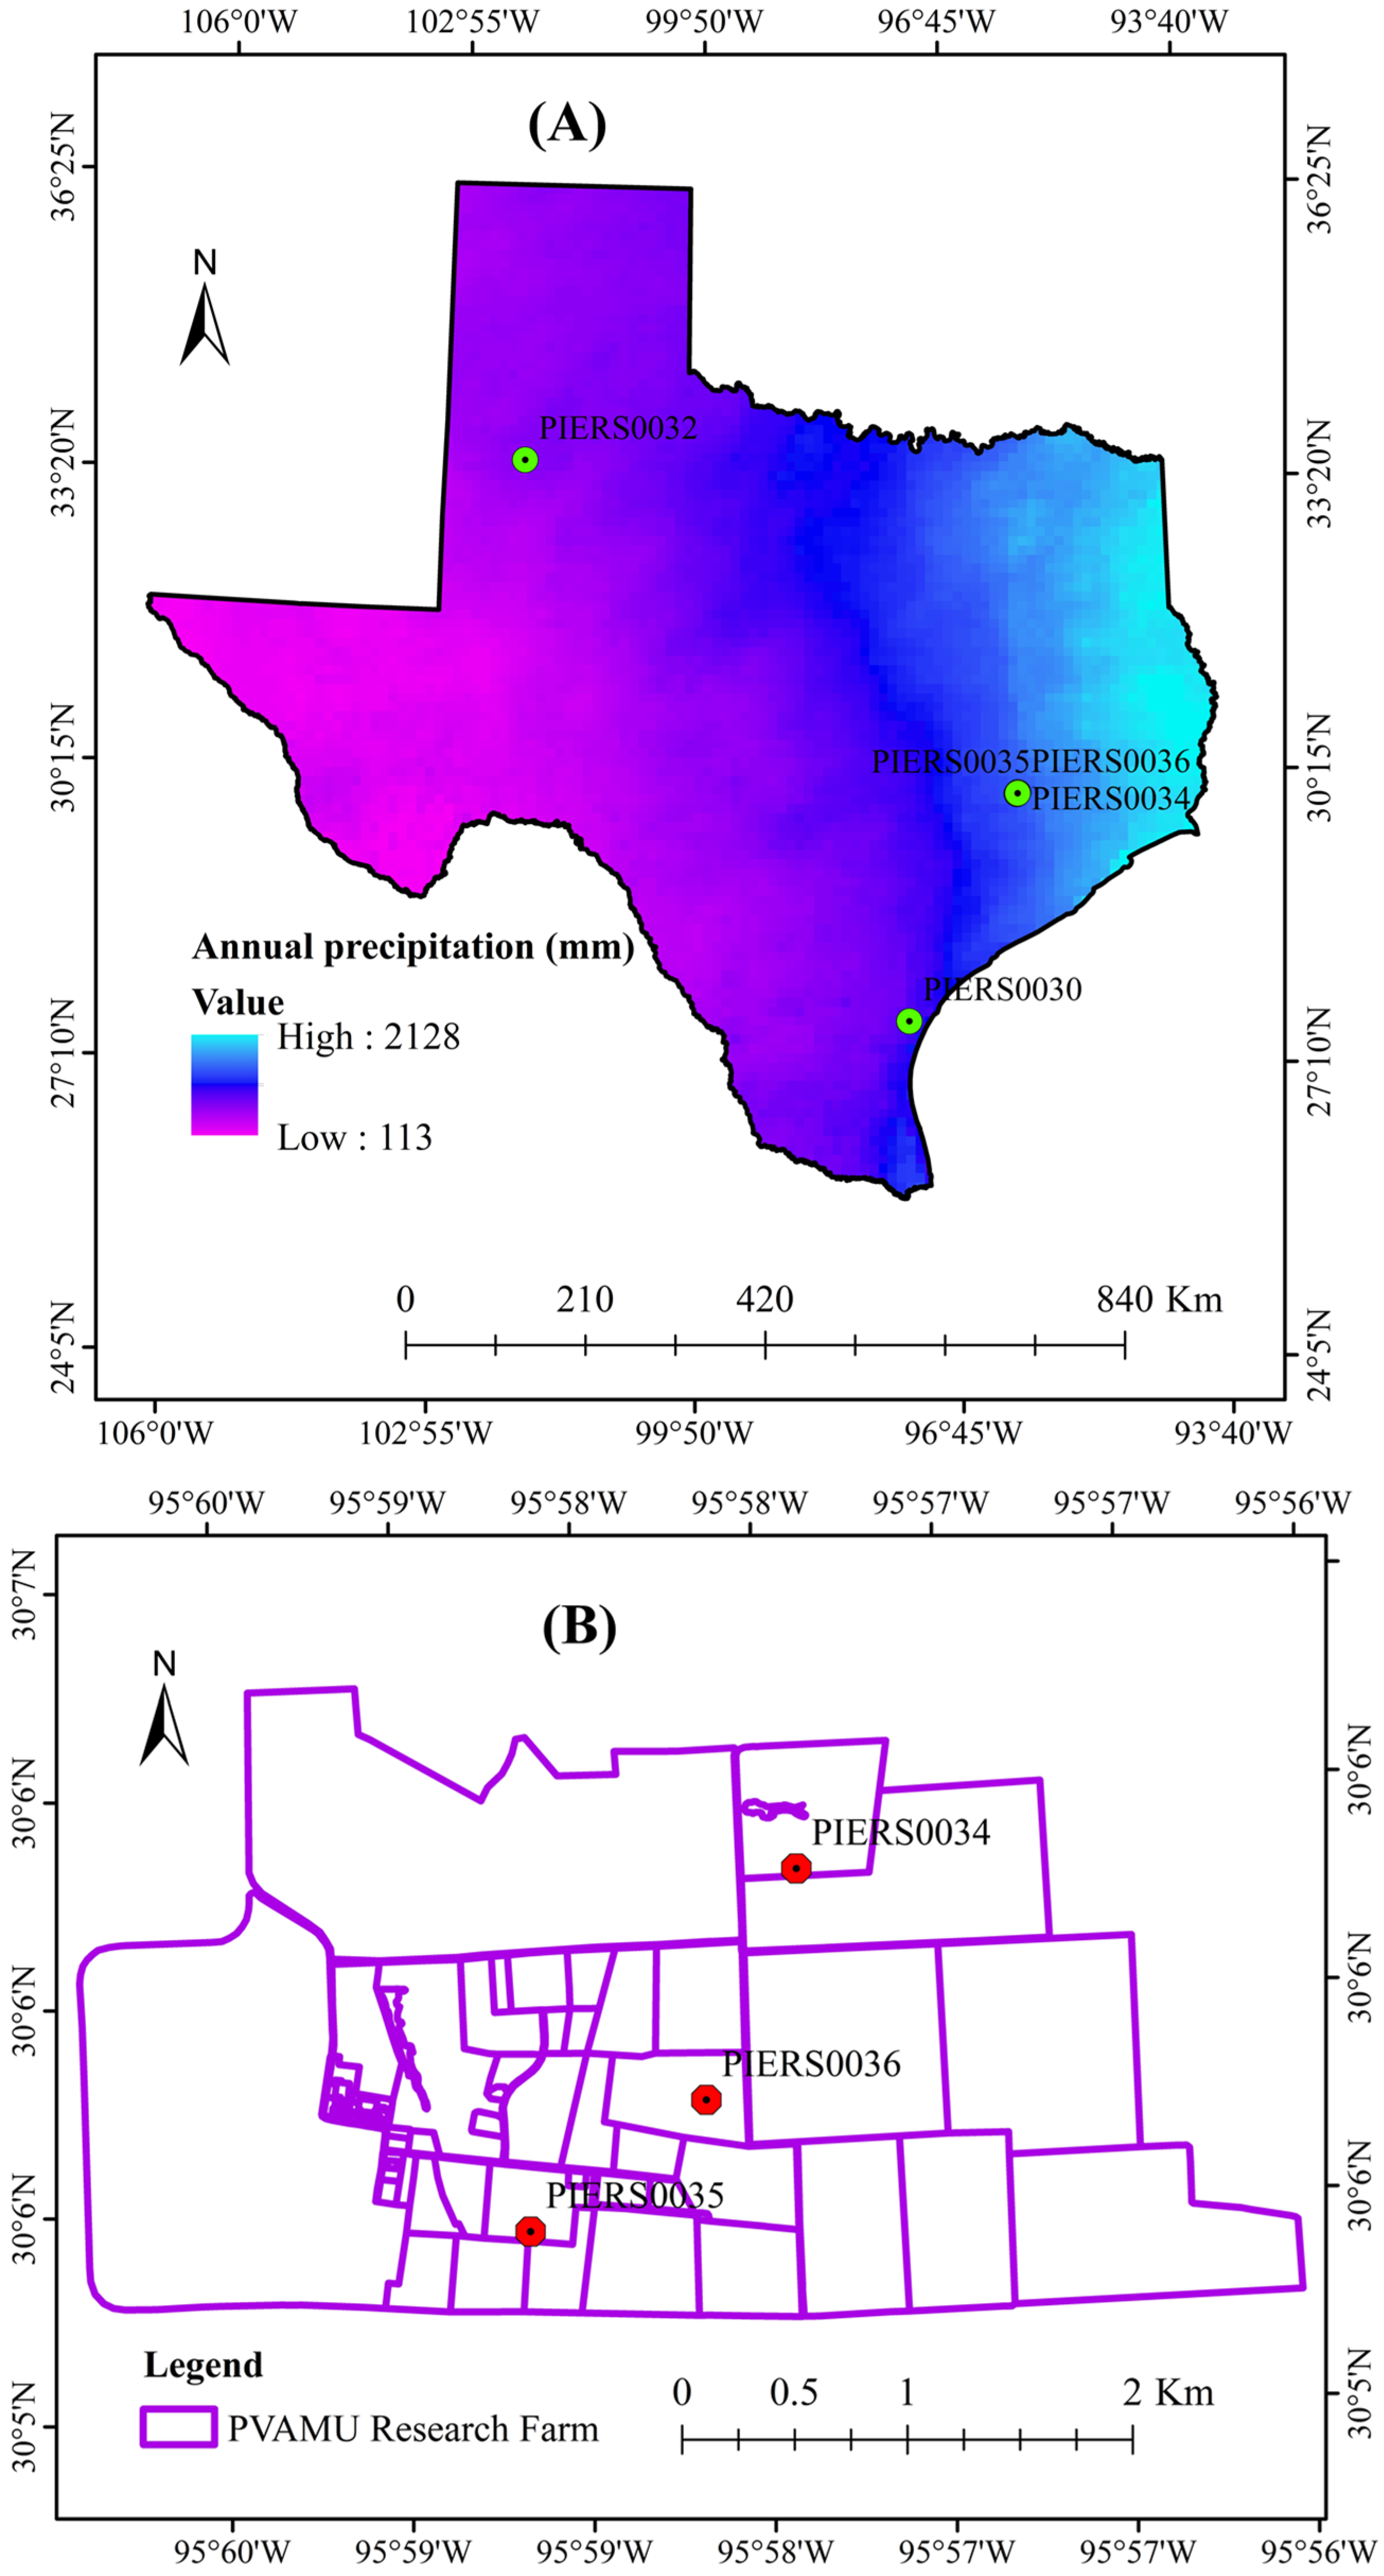
Figure 1. Locations of the five PIERS stations in Texas overlaid on the 2024 annual precipitation total from IMERG-Final (A), along with a detailed view of the PIERS stations at the Prairie View A&M University (PVAMU) Research Farm (B).
Remotesensing 18 02401 g001
Figure 2. Daily precipitation in 2024 at the five PIERS stations included in this study (A) and monthly precipitation totals (B).
Remotesensing 18 02401 g002
Figure 3. Performance of the three IMERG datasets in detecting precipitation at the hourly scale for PIERS stations PIERS0030 (A), PIERS0032 (B), PIERS0034 (C), and PIERS0035 (D) and at the daily scale for PIERS0030 (E), PIERS0032 (F), PIERS0034 (G), and PIERS0035 (H).
Remotesensing 18 02401 g003
Figure 4. Hourly-scale performance of the IMERG products at four PIERS stations. Panels (AC) show IMERG-Early, IMERG-Late, and IMERG-Final at PIERS0030; panels (DF) show IMERG-Early, IMERG-Late, and IMERG-Final at PIERS0032; panels (GI) show IMERG-Early, IMERG-Late, and IMERG-Final at PIERS0034; and panels (JL) show IMERG-Early, IMERG-Late, and IMERG-Final at PIERS0035.
Remotesensing 18 02401 g004
Figure 5. Daily-scale performance of IMERG-Early (A), IMERG-Late (B), and IMERG-Final (C) at PIERS0030; IMERG-Early (D), IMERG-Late (E), and IMERG-Final (F) at PIERS0032; IMERG-Early (G), IMERG-Late (H), and IMERG-Final (I) at PIERS0034; and IMERG-Early (J), IMERG-Late (K), and IMERG-Final (L) at PIERS0035.
Remotesensing 18 02401 g005aRemotesensing 18 02401 g005b
Figure 6. PDF plots of the IMERG datasets at the hourly scale for PIERS0030 (A), PIERS0032 (B), PIERS0034 (C), and PIERS0035 (D) and at the daily scale for PIERS0030 (E), PIERS0032 (F), PIERS0034 (G), and PIERS0035 (H). Zero-precipitation values were excluded from both the hourly and daily PDF plots. The hourly and daily precipitation distributions are truncated at 10 mm and 70 mm, respectively.
Remotesensing 18 02401 g006
Figure 7. CDF plots of the IMERG datasets at the hourly scale for PIERS0030 (A), PIERS0032 (B), PIERS0034 (C), and PIERS0035 (D) and at the daily scale for PIERS0030 (E), PIERS0032 (F), PIERS0034 (G), and PIERS0035 (H). The hourly and daily precipitation CDFs are truncated at 20 mm and 100 mm, respectively.
Remotesensing 18 02401 g007
Table 1. Brief characteristics of the studied IMERG datasets.
IMERG Product Latency Processing Gauge AdjustmentTypical Use
IMERG-Early~4 hNear-real-time retrieval using available satellite observationsNo gauge correctionRapid monitoring and forecasting
IMERG-Late~14 hNear-real-time retrieval with more complete satellite observationsNo gauge correctionNear-real-time applications requiring higher accuracy
IMERG-Final~3.5 monthsFully reprocessed retrieval using all available satellite observations and gauge calibrationAdjusted for bias using monthly rain gauge analysesClimate studies, hydrological analysis, and long-term evaluations
Table 3. Mean hourly and daily precipitation (mm) at the four studied stations during October 2023 to September 2025.
Scheme Time ScalePIERS IMERG-EarlyIMERG-LateIMERG-Final
PIERS0030Hourly0.0750.1760.1790.207
PIERS0032Hourly0.0660.1100.1160.140
PIERS0034Hourly0.1320.2770.2900.275
PIERS0035Hourly0.1520.2800.2960.276
PIERS0030Daily1.7934.2154.3074.976
PIERS0032Daily1.5842.6352.7883.352
PIERS0034Daily3.1656.6376.9496.590
PIERS0035Daily3.6406.7297.0966.613
Table 4. Comparison of the IMERG datasets in estimating the 99th percentile precipitation (mm) at the hourly and daily scales for the four studied PIERS stations.
StationsTemporal Scale PIERSIMERG-EarlyIMERG-LateIMERG-Final
PIERS0030Hourly 1.7785.0135.0305.461
PIERS0032Hourly 1.2703.1063.3504.251
PIERS0034Hourly 3.3027.8808.5407.620
PIERS0035Hourly 4.0647.6618.5317.536
PIERS0030Daily 32.76684.80384.19388.267
PIERS0032Daily 33.32543.11942.37856.011
PIERS0034Daily 55.423108.984108.77898.622
PIERS0035Daily 59.436114.951118.06199.318
Disclaimer/Publisher’s Note: The statements, opinions and data contained in all publications are solely those of the individual author(s) and contributor(s) and not of MDPI and/or the editor(s). MDPI and/or the editor(s) disclaim responsibility for any injury to people or property resulting from any ideas, methods, instructions or products referred to in the content.