Article

Geohazard Risk Identification and Validation in Hunan Province Using Synergistic Multi-Resolution SAR Monitoring

1
School of Computer Science, China University of Geosciences, Wuhan 430078, China
2
The Second Surveying and Mapping Institute of Hunan Province, Changsha 410029, China
3
Key Laboratory of Natural Resources Monitoring and Supervision in Southern Hilly Region, Ministry of Natural Resources, Changsha 410029, China
4
Hunan Center of Natural Resources Affairs, Changsha 410029, China
5
Changsha Geotechnical Engineering & Surveying Institute, Changsha 410007, China
*
Author to whom correspondence should be addressed.
Remote Sens. 2026, 18(14), 2307; https://doi.org/10.3390/rs18142307
Submission received: 23 April 2026 / Revised: 4 June 2026 / Accepted: 17 June 2026 / Published: 9 July 2026

Highlights

What are the main findings?
  • A collaborative monitoring framework using Sentinel-1 and LT-1 data acquired within an overlapping 2024–2025 observation window was developed, delineating 180 suspected geohazard target areas and confirming 83 active hidden-danger points, with a field-confirmed rate of 83/180 = 46.11%.
  • Joint Sentinel-1/LT-1 observation improved temporal sampling efficiency by 23.6%, while LT-1 provided finer spatial continuity and recovered 80.8% of the peak deformation amplitude that was not captured by Sentinel-1A in a large-gradient area.
What are the implications of the main findings?
  • The proposed block-based PS/DS-InSAR strategy resolves the spatial-efficiency trade-off, alleviating decorrelation effects and improving monitoring-point continuity in complex vegetated mountainous terrain.
  • The shortened observation intervals support more complete tracking of landslide evolution processes, providing a robust technical reference for early geohazard identification and mitigation.

Abstract

As a natural event that poses a serious threat to human life, property, and the natural ecology, the effective identification, assessment, and early prevention of geological hazards are crucial. Hunan Province in China is a region with a high incidence of geological hazards, exhibiting complex chain-generated characteristics due to the influence of terraced topography, heavy rainfall, and human activities. Existing landslide monitoring methods have insufficient ability to capture weak deformation at small spatial scales, making it challenging to identify landslide disaster precursors in this region effectively. This paper proposes a multi-resolution SAR collaborative monitoring method using SBAS-InSAR technology for wide-area screening, followed by a joint PS/DS-InSAR processing framework to identify weak deformation signals at small spatial scales. Using 2441 registered geohazard sites in the work area as the background dataset, wide-area InSAR monitoring and remote-sensing interpretation delineated 180 suspected geohazard target areas. Field investigation confirmed 83 of the 180 candidate target zones as active hidden-danger points, corresponding to a field-confirmed rate of 46.11% among the interpreted candidates.

1. Introduction

Geological disasters are natural events triggered by the interaction between geological processes and human activities, which pose a serious threat to human life, property, and the natural ecological environment [1]. As a typical representative of the geological disaster-prone area, Hunan Province, China, has a unique terraced topography, easily weathered lithology, and the coupling effect of heavy rainfall and human activities, which makes the disasters in this area present a composite chain-generated characteristic. According to the 2024 geological-hazard prevention information released by the Hunan Provincial Department of Natural Resources, mountains, hills, and uplands account for 80.5% of the province, and 18,570 registered geohazard hidden-danger sites were recorded by the end of 2023 [2]. Therefore, it is of great theoretical significance and practical value to construct a comprehensive remote sensing identification and verification technology and methodology system of geological disaster hidden hazards, to identify, judge and assess potential and hidden major geological disaster hidden hazards and their chain geological disasters earlier from the source to safeguard the safety of people’s lives and properties and the sustainable development of the region.
Interferometric Synthetic Aperture Radar (InSAR), with the advantages of all-weather, all-day observation capability and high-precision detection of millimetre-scale micro-deformation of the ground surface, has been widely used in the identification and monitoring of geological hazards [3,4]. In recent years, the application of InSAR technology has been deepened. Kang et al. [5] designed an interferogram selection method and an InSAR segmentation processing technique to monitor landslide phenomena in active mountains. Bayer et al. [6] used InSAR to measure small surface displacements in different situations to monitor ground settlement and landslides caused by tunnel construction. However, single-resolution InSAR applications still face significant challenges: it is difficult to obtain key geo-environmental parameters, such as stratigraphic lithology and hydrogeology, and there is insufficient characterization of the mechanisms of disaster breeding and disaster chaining, resulting in biased risk zoning.
Multi-source data integration technology provides a new path for this purpose. Cao et al. [7] corrected the traditional susceptibility model zoning bias by fusing InSAR deformation fields and UAV multispectral data to achieve accurate mapping of high landslides. Furst [8] combined the advantages of SAR data in terms of temporal and spatial coverage, as well as leveling data in terms of accuracy, to reconstruct the three-dimensional deformation field of the mining area. This allowed for monitoring the underground collapse of the rock formation below the mining shaft. These studies show that multi-source integration can construct a multi-dimensional parameter system for geological hazard monitoring by integrating the complementary advantages of different sensors, which significantly improves the accuracy and reliability of hidden hazard identification.
Recent studies have further demonstrated the rapid development of InSAR-based landslide identification from both methodological and operational perspectives. Cai et al. [9] developed an automatic active-landslide identification method that combines time-series InSAR measurements with Faster R-CNN, showing the potential of deep learning to reduce the labor cost of wide-area visual interpretation. Lu et al. [10] proposed an integrated remote-sensing framework for active landslide detection over wide regions and multiple stages, emphasizing the importance of combining InSAR, optical interpretation, geological background, and field investigation. In addition, comparative studies using C-band Sentinel-1A and L-band ALOS/PALSAR-2 data have shown that L-band SAR can maintain stronger coherence and better landslide-detection capability in densely vegetated mountainous areas, while Sentinel-1A still provides advantages in wide-area and high-frequency observations [11]. Deep-learning methods that combine InSAR deformation images with topographic features have also been explored for wide-area landslide detection [12]. These advances indicate that recent landslide monitoring is moving toward multi-source, multi-resolution, and intelligent interpretation; nevertheless, an operational workflow that combines wide-area Sentinel-1 screening, high-resolution L-band SAR refinement, and field-verified geohazard interpretation is still needed for complex vegetated mountainous regions.
However, the existing mainstream methods still face significant challenges in identifying weak deformation of landslides at small spatial scales. On the one hand, the moderate-resolution SAR data relied on for wide-area monitoring have insufficient spatial resolution, which makes it difficult to clearly depict the acceptable boundaries and internal deformation differences of landslides at scales of tens to hundreds of metres [13,14]. On the other hand, although high-resolution SAR data have the potential for detection, direct full-domain time-series processing of them faces the difficulties of computational inefficiency and unsuitability of algorithmic models, which makes it difficult to efficiently and reliably extract the weak deformation signals of the key targets from the huge amount of data [15]. This core contradiction between monitoring range and spatial accuracy severely restricts the ability to identify potential isolated and small landslide hazards early.
To this end, this study proposes a multi-resolution SAR collaborative monitoring framework designed to improve weak-deformation monitoring of landslides at small spatial scales and support the identification of potential geological hazards in Hunan Province. The contributions of this study are as follows:
(1)
A multi-resolution SAR data synergistic hierarchical monitoring framework is proposed. Taking advantage of the wide coverage of Sentinel-1 data, the SBAS-InSAR technology is used to screen deformation at the regional level, and for these key areas, domestic high-resolution LT-1 data are used to achieve a fine transition in the monitoring scale. This framework provides a practical way to balance monitoring efficiency and spatial resolution, and improves the ability to identify small-scale geological hazards.
(2)
A collaborative processing framework for multi-source InSAR data is constructed. Through the grid-based distributed processing strategy, the differences in spatial resolution, temporal coverage, and scattering characteristics of the multi-source data products are jointly exploited to improve the monitoring point density and the ability to capture weak deformation signals, reduce the computational complexity, and support robust extraction of deformation temporal sequences over wide areas.
(3)
System validation is conducted in four typical areas of Hunan Province, and the applicability of the technical framework is evaluated through field investigation of 180 suspected target zones. Among these zones, 83 are confirmed as active hidden-danger points, yielding a field-confirmed identification rate of 83/180 = 46.11% among the interpreted candidates. The 2441 registered geological hazard sites within the work area are used as the background dataset for regional monitoring and interpretation.
The overall structure of this paper is as follows. Section 2 presents the overview of the study area and data preparation. Section 3 systematically describes the proposed multi-resolution SAR collaborative monitoring method. Section 4 presents the results of deformation monitoring and the identification of geological hazards, and discusses them in the context of field validation. Section 5 summarises the innovation and practical value of the technical framework and proposes directions for future improvement.

2. Study Areas and Data Preparation

In order to systematically verify the monitoring framework proposed in this paper, four representative geological disaster-prone areas in Hunan Province are selected as test areas in this study, and multi-source SAR observation data are prepared. The study areas and data situation are described below respectively.

2.1. Study Areas

This study selects Hunan Province as the research area. Located in the hilly and mountainous region of southern China, Hunan features significant topographic relief, complex geomorphic types, diverse lithological combinations, and frequent heavy rainfall. Concurrently, human engineering activities are relatively frequent, resulting in significant spatial differences and complexities in the incubation and development conditions for geological hazards such as landslides and collapses. For InSAR monitoring, regional differences in lithology, topography, geomorphology, hydrology, and human disturbances directly affect the detectability of surface deformations and the accuracy of hidden danger identification. Therefore, Hunan is not only a typical area for geological hazard development but also an ideal region for testing the applicability of the multi-resolution SAR collaborative monitoring method.
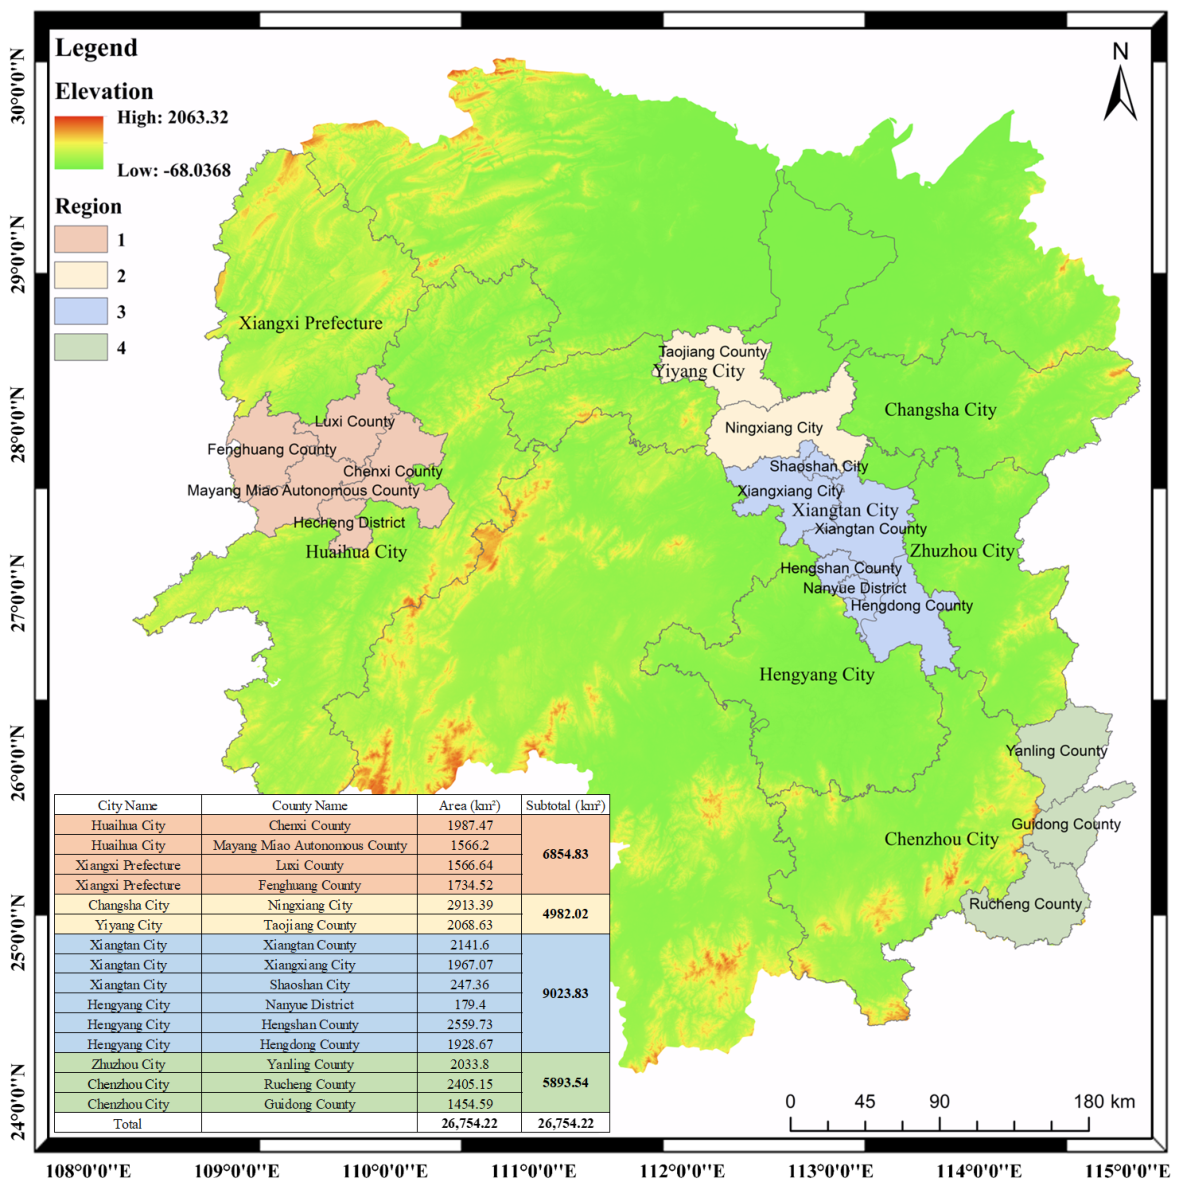
Based on this background, comprehensively considering geomorphic types, lithological combinations, rainfall differences, and hazard development characteristics, this paper selects 4 typical areas across the province as research regions. These four areas respectively represent erosional denudation in low mountain and hilly areas, mountain-plain transition zones, hilly areas at basin edges, and tectonic erosional medium-low mountainous areas. They also cover different geological backgrounds such as soft clastic rocks, epimetamorphic rocks, granites, and red bed sedimentary rocks, while factoring in high-frequency rainstorm zones and areas with significant engineering disturbances. The four study areas are Study Area 1, comprising Chenxi, Mayang, Fenghuang, and Luxi, with an area of 6854.83 km2; Study Area 2, comprising Taojiang and Ningxiang, with an area of 4982.02 km2; Study Area 3, comprising Shaoshan, Xiangxiang, Xiangtan, Hengshan, Hengdong, and Nanyue, with an area of 6464.10 km2; and Study Area 4, comprising Yanling, Guidong, and Rucheng, with an area of 5893.54 km2. The specific regions are shown in Figure 1.
Study Area 1 (Chenxi–Mayang–Fenghuang–Luxi) belongs to an erosional denudation in a low mountain and hilly area. Soft clastic rocks are widely distributed, rock masses are severely weathered, and rainfall-induced effects are prominent, with geological hazards mainly consisting of shallow landslides and local collapses. This study area presents typical rainfall-induced hazard development characteristics and favorable regional-scale observation conditions, making it suitable for testing the effectiveness of the multi-resolution SAR method in regional-scale deformation screening.
Study Area 2 (Taojiang–Ningxiang) is situated in the transition zone from mountains to plains, featuring strong topographic cutting. Metamorphic and sedimentary rocks coexist, superimposed with engineering disturbances, and the occurrence of geological hazards exhibits obvious natural–human coupling characteristics. This study area can characterize hazard development scenarios under the combined action of complex geological environments and human activities, making it suitable for testing the method’s capability to identify hidden dangers in natural–human-coupled geological hazards.
Study Area 3 (Shaoshan–Xiangxiang–Xiangtan–Hengshan–Hengdong–Nanyue) is a hilly area at the edge of a basin with a thick cover layer. Hazards are mostly manifested as shallow sliding, weathering crust instability, and slow creep, characterized by weak overall deformation and strong concealment. Given its features of weak deformation and small-scale hidden danger bodies, this study area is suitable for testing the capability of high-resolution LT-1 in finely identifying concealed geological hazards.
Study Area 4 (Yanling–Guidong–Rucheng) is a tectonic erosional medium–low mountainous area with steep terrain and developed layered structures of slates. The impact of heavy rainfall is prominent, and geological hazards are primarily characterized by bedding sliding, continuous creep, and concurrent collapses. This study area has a strong topographic control effect and hazard activity, making it suitable for testing the identification effect of the multi-resolution SAR method on slope instability bodies and its applicability in complex mountainous environments.
Overall, the four study areas are comparative selection zones targeting different hazard-forming environments, hazard development modes, and deformation response characteristics. Conducting systematic analyses in these typical scenarios provides a representative experimental basis for verifying the joint multi-resolution InSAR surface deformation monitoring framework presented in this paper. The lithological and structural background of the study areas was considered together with geomorphology, rainfall, and engineering disturbance during target-zone interpretation.

2.2. Data Preparation

This subsection describes the two types of data used in the study: medium-resolution SAR data (Sentinel-1) and high-resolution L-band SAR data (LT-1), as described below.

2.2.1. Medium-Resolution SAR Data (Sentinel-1)

This study employed medium-resolution C-band Sentinel-1 data to statistically analyse Sentinel-1 coverage across four study areas during the overlapping monitoring period from January 2024 to December 2025, as presented in Table 1. The time span was selected to match the stable and usable LT-1 observation period. Therefore, the Sentinel-1A and LT-1 deformation products used for the multi-source comparison were generated within the same 2024 to 2025 observation window. Ascending-track Sentinel-1A data were selected because they provided continuous temporal sampling and spatially complete coverage for the selected Hunan study areas during the 2024 to 2025 monitoring period. Supplementary Sentinel-1 data from additional ascending-orbit frames were incorporated to achieve full-area InSAR deformation monitoring across the study regions.

2.2.2. High-Resolution SAR Data (LT-1)

The Lutan-1 (LT-1) L-band differential interferometric SAR satellite features multiple imaging modes, with a maximum resolution of 3 m and a maximum observation width of up to 400 km. LT-1 data feature high resolution, a long wavelength, sufficient data volume, and accuracy, meeting the requirements of the project. By utilizing interferometric altimetry and differential deformation measurement technology, high-precision, all-weather, and all-time topographic surveys, surface deformation monitoring, and geological disaster monitoring tasks can be accomplished.
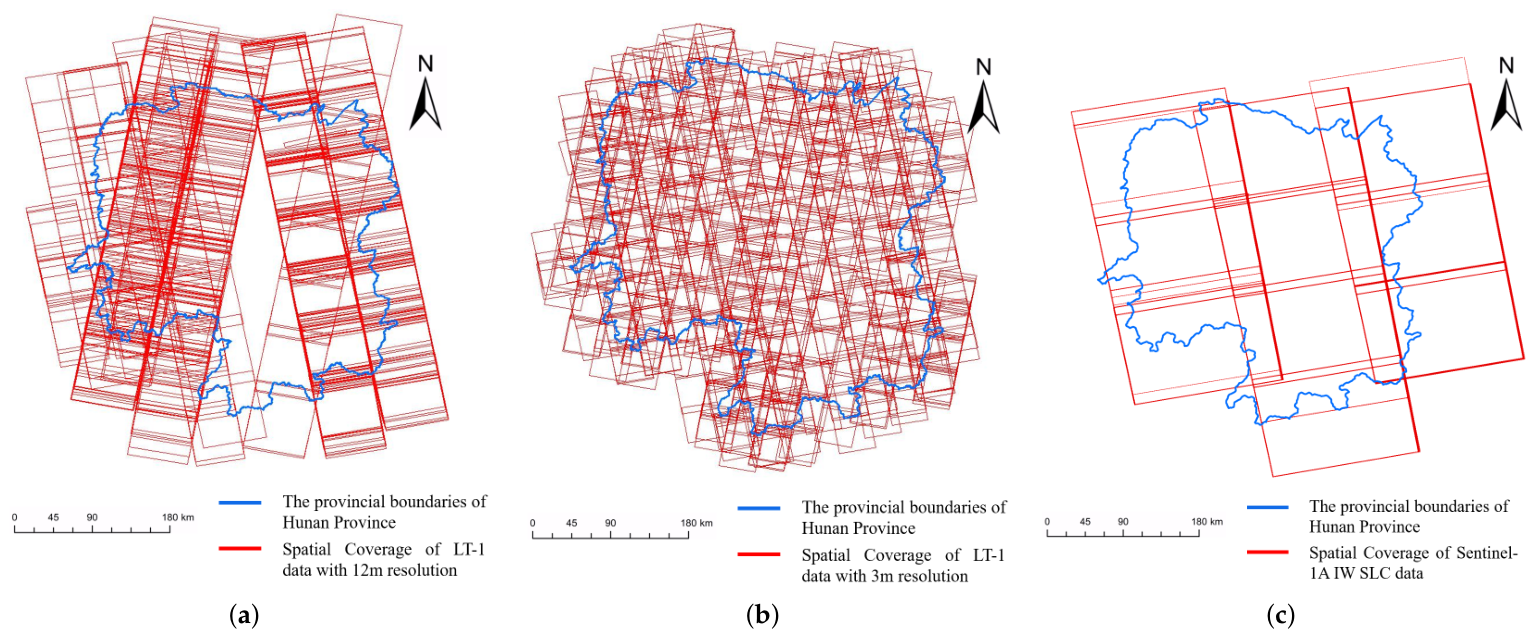
To reduce the impact of temporal decorrelation, high-resolution InSAR monitoring in this study uses longer-wavelength LT-1 data. This satellite is equipped with 3 m-class L-band SAR sensors and has reasonable orbit control, as well as strong temporal and spatial coherence retention capabilities. The 12 m LT-1 project-level dataset includes 499 scenes, and key areas have been covered more than ten times. The 3 m LT-1 project-level dataset includes 1458 scenes, and the provincial coverage has reached six times. These 12 m and 3 m scene counts describe the project-level LT-1 coverage statistics. For the refined monitoring and typical-case analysis in this study, 15 scenes of L-band LT-1 SAR images acquired from 11 January 2024 to 29 December 2025 were used. The data were acquired from an ascending track in full-polarization stripmap mode, with a spatial resolution of 3 m, as summarized in Table 2. LT-1 data became operationally usable after June 2023 and provided a stable observation period for interferometric processing in 2024–2025; therefore, the LT-1 observation period was used as the reference period for acquiring the corresponding Sentinel-1A data. The data coverage situation is shown in Figure 2.

3. Methodology

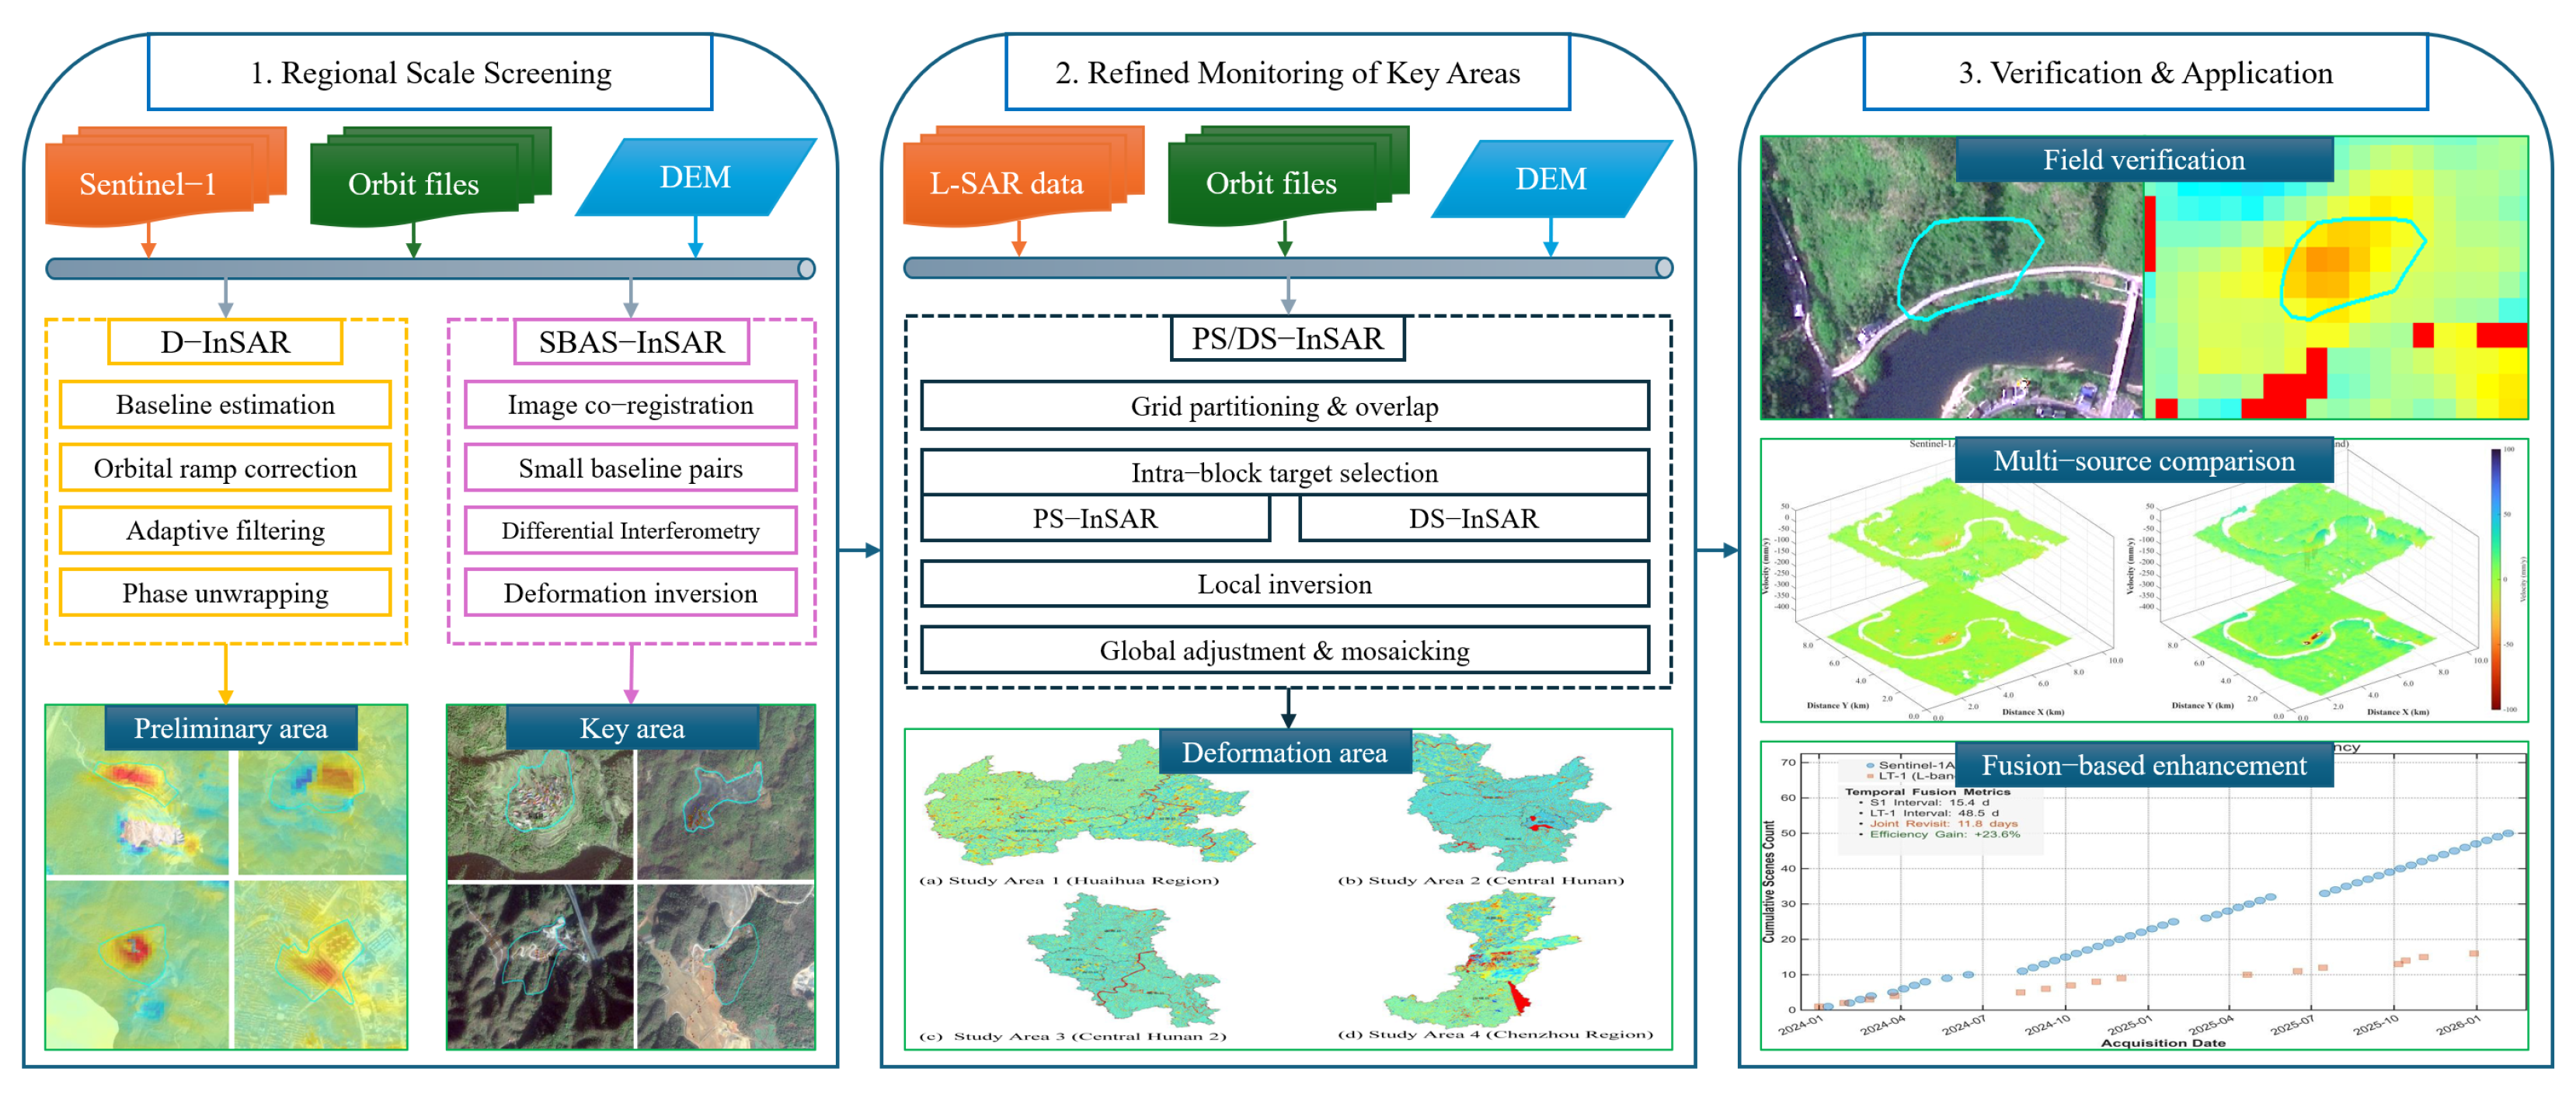
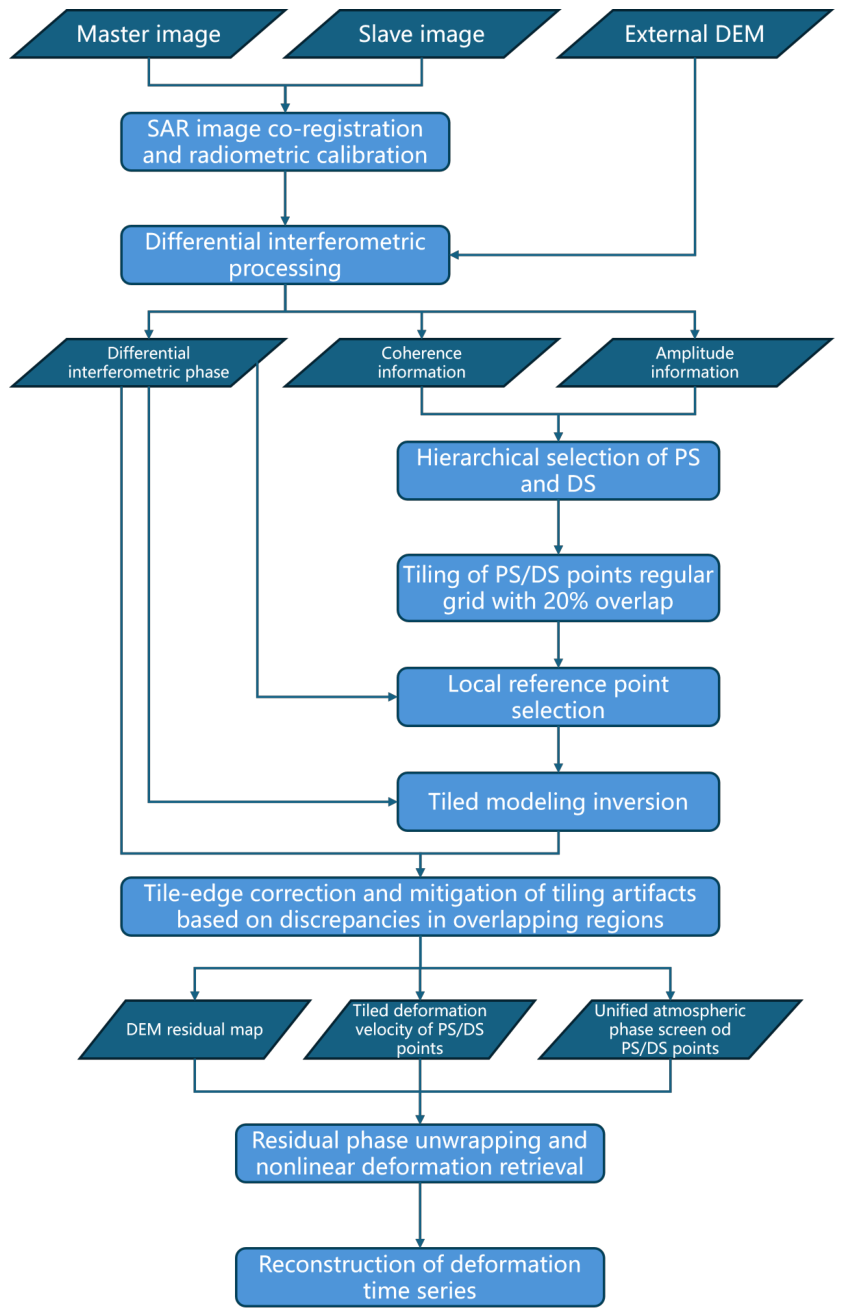
Building upon existing geological hazard data and relevant industry information, and combining medium-resolution Sentinel-1 data with high-resolution LT-1 imagery, this study conducts hierarchical monitoring and analysis of surface deformations in the study area. Initially, Sentinel-1 data is employed at a regional scale to acquire wide-area continuous deformation information, identify abnormal deformation zones, and delineate key areas. Subsequently, targeting these delineated key areas, high-resolution LT-1 imagery is used in conjunction with the block-based PS/DS-InSAR method to conduct refined deformation inversion, breaking through the technical bottleneck of identifying weak deformations in small-scale landslides and further analyzing their spatiotemporal evolution. The overall technical workflow is depicted in Figure 3.

3.1. Regional-Scale Deformation Screening Processing Framework

To address the difficulty of simultaneously achieving “wide-area coverage” and “fine identification” for geological hazard identification in complex hilly and mountainous areas, this paper first constructs a regional-scale deformation screening framework. This framework relies predominantly on medium-resolution Sentinel-1 data, integrating the rapid anomaly detection capability of D-InSAR with the time-series deformation monitoring capability of SBAS-InSAR. This combination enables wide-area deformation information acquisition, anomaly identification, and key area delineation, providing boundary constraints for subsequent high-resolution LT-1 refined inversion. The overarching process follows: “data preprocessing–differential interferometric detection–time-series deformation inversion–anomaly area identification–key region delineation”.
For any interferometric pair, its observed phase Δ ϕ can be expressed as [16]:
Δ ϕ = ϕ d e f + ϕ t o p o + ϕ a t m + ϕ o r b + ϕ n o i s e
where ϕ d e f is the deformation phase, ϕ t o p o is the residual topographic phase, ϕ a t m is the atmospheric delay phase, ϕ o r b is the orbital error term, and ϕ n o i s e is the noise term. This equation signifies that the InSAR interferometric phase is a superposition of multiple phase components; hence, it is necessary to progressively isolate phase components unrelated to surface deformation via differential processing and time-series modeling.
First, multi-temporal Sentinel-1 data for the study area were preprocessed, including orbit optimization, fine registration of master and slave images, interferogram generation, filtering, terrain phase removal, and phase unwrapping to extract differential interferometric phase. The primary function of D-InSAR is to rapidly identify local abnormal deformation signals and determine the spatial locations of potential hazards such as landslides and subsidence. Based on the preliminary screening by D-InSAR, SBAS-InSAR [17] was employed to conduct a large-scale temporal deformation analysis of the study area. Assuming that N + 1 SAR images form M pairs of interferograms, the model for the ith pair of interferogram phases δ ϕ i after terrain phase removal can be expressed as:
δ ϕ i 4 π λ ( d t B d t A )
where λ denotes the wavelength, and d t A and d t B represent the cumulative line-of-sight (LOS) deformations at the master and slave image acquisition times relative to a reference time, respectively. This formula demonstrates the fundamental relationship between the interferometric phase and the cumulative deformation difference between adjacent time intervals. A linear observation equation is established for all small baseline interferometric pairs:
B ϕ = δ ϕ
where δ ϕ is the unwrapped interferometric phase observation vector, ϕ is the time-series deformation phase vector to be estimated, and B is the coefficient matrix structured by the interferometric pair combinations.
After removing the topographic phase, atmospheric phase, orbital error, and noise as much as possible, the unwrapped differential phase can be converted to LOS displacement difference as:
δ d i = λ 4 π δ ϕ d ( t B ) d ( t A )
Recognizing that directly solving for the time-series phase often introduces discontinuities, this paper establishes a velocity domain observation model by replacing phase increments with the average deformation velocities of adjacent periods:
A v = δ d ,
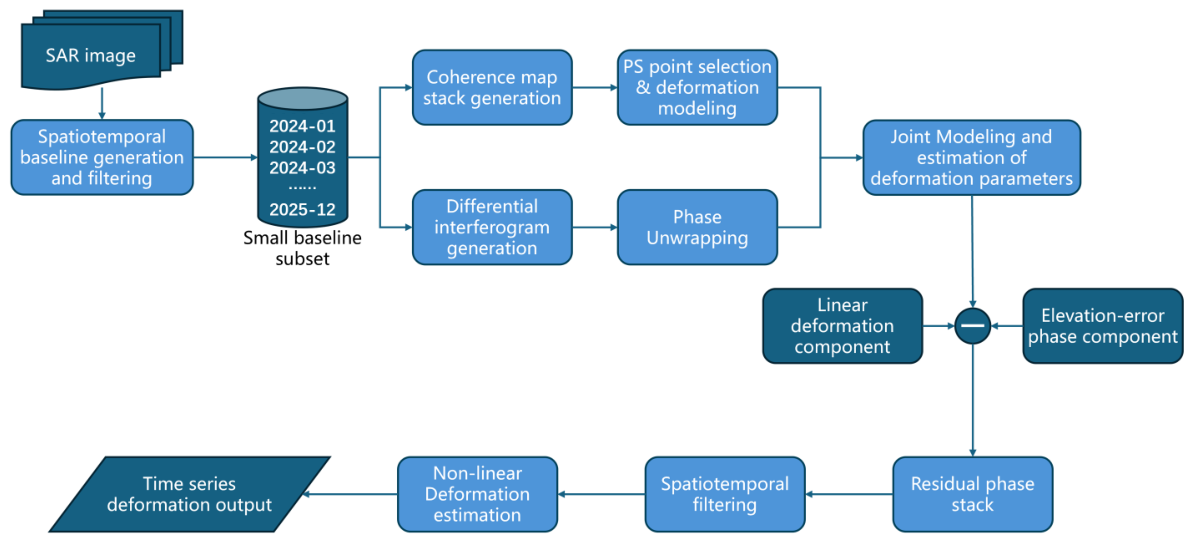
where v is the average LOS deformation velocity vector for each time segment, A is the design matrix constituted by time intervals, and δ d is the LOS displacement-difference vector converted from the unwrapped interferometric phase. After deriving the velocity vector via least squares [18], temporal integration yields the cumulative deformation at each epoch and the average deformation velocity field. Subsequently, coupled with spatiotemporal filtering, residual atmospheric phases and nonlinear deformation components are further partitioned, resulting in more robust time-series deformation results for the study area, as mapped out in the Figure 4 workflow.
In the SBAS-InSAR processing, the maximum temporal baseline and spatial baseline were limited to 100 days and 500 m, respectively. Under these baseline constraints, a multi-master interferometric network was constructed, and the maximum connection step between adjacent images was limited to 3 to maintain sufficient multi-temporal coherence. For atmospheric correction, the topography-related stratified atmospheric phase was first simulated and removed using an external DEM, and residual local atmospheric disturbances were then separated and suppressed using spatiotemporal adaptive filtering.
Within this framework, D-InSAR and SBAS-InSAR operate interdependently rather than in isolation, assuming the roles of “rapid anomaly detection enhancement” and “time-series deformation information recovery,” respectively: the former elevates the distinguishability of local abnormal deformation responses, while the latter restores long-term continuous deformation evolutionary processes at the regional scale. Their integration supports wide-area coverage and improves the basis for anomaly-zone delineation. Ultimately, synthesizing spatial clustering traits of deformation anomalies, existing registered hazard points, foundational geological data, and remote sensing interpretations, key areas are comprehensively delineated for subsequent high-resolution LT-1 refined PS/DS-InSAR inversion.

3.2. Refined Block-Based Monitoring Framework for Key Areas

Based on regional-scale deformation screening, this study leverages high-resolution LT-1 imagery to conduct refined deformation monitoring on the delineated key areas to obtain high-spatial-resolution surface deformation time series. Unlike the regional screening with medium-resolution data, high-resolution LT-1 can better preserve spatial details of small-scale landslide boundaries, slopes adjacent to buildings, and local weak-deformation targets in key areas; however, employing it directly for large-scale unified solving presents significant challenges. On one hand, the large pixel scale of high-resolution imagery incurs immense computational time and memory overhead for global scenes. On the other hand, the severe topographic relief, dense vegetation cover, and uneven spatial distribution of coherence in mountainous areas result in distinct differences in available scatterer density; applying a globally unified calculation can lead to unstable reference networks, diminished local anomalies, and submerged weak-deformation targets. Consequently, this paper devises a block-based PS/DS-InSAR refined monitoring framework, adopting a “local robust solving–cross-block unified splicing” strategy, which trims computational complexity while preserving the spatial integrity of deformation inversion in key areas.
The block calculation technique segments the study area into grids based on monitoring imperatives and atmospheric delay traits, forging fundamental PS/DS calculation units per grid. This method utilizes the overlapping regions between adjacent blocks to efficiently stitch together the PS/DS-InSAR output results of the grid and control errors. This significantly reduces the time and memory required for deformation processing, as illustrated in the workflow shown in Figure 5.

3.2.1. Block Calculation

Block-based processing is not only intended to facilitate calculations but also to better accommodate the characteristics of high-resolution InSAR data in mountainous regions. First, while high-resolution LT-1 imagery reveals greater detail in key areas, establishing a uniform reference grid across the entire region can lead to ill-posed or unstable solutions when determining parameters. Second, atmospheric delays and residual orbital errors typically manifest spatial correlation, more easily satisfying stationarity assumptions within local bounds, whereas traversing expansive areas significantly magnifies the heterogeneity of the error field, impeding unified modeling. Third, the complex land cover in mountainous areas results in an extremely uneven spatial distribution of PS and DS points, with dense and sparse regions coexisting within the same local area; the global unified solution is easily dominated by high-density regions, thereby reducing sensitivity to subtle deformations and edge targets. Therefore, this paper divides key areas into regular grids, using individual grids as the basic computational units to establish stable joint PS/DS reference networks locally, followed by global unified stitching through common observation targets across grids.
Taking into account monitoring requirements and the spatial correlation characteristics of atmospheric delay, this paper adopts a 1 km × 1 km regular grid as the basic unit and sets a 20% overlap zone between adjacent grids. This configuration satisfies two critical requirements: it ensures that each individual grid contains a sufficient number of high-quality scatterers to support the construction of a local reference network and robust parameter estimation; and it preserves common PS/DS points between adjacent grids through the overlap zones, providing reliable constraints for subsequent cross-grid stitching.

3.2.2. Joint PS/DS Solving

Within a single block, this paper incorporates PS points and DS points into the same solution framework. PS points are primarily selected based on the temporal stability of pixel amplitude, using an amplitude dispersion index threshold of 0.3 for preliminary identification, following the persistent-scatterer concept proposed in PS-InSAR studies [19]. Building on the PS point selection, DS points are further identified from candidate pixels with similar scattering characteristics through statistical homogeneity tests, with a minimum coherence threshold of 0.75, drawing on the logic of distributed-scatterer enhancement in multi-temporal InSAR processing [20]. Using the sample covariance matrix and assuming a complex Wishart distribution, the optimized temporal phase is obtained via maximum likelihood estimation. The core logic of this process is that PS points provide a highly stable reference framework, while DS points address the scarcity of target points in vegetated areas, bare soil areas, and gentle slopes, thereby significantly improving the density and spatial continuity of monitoring points.
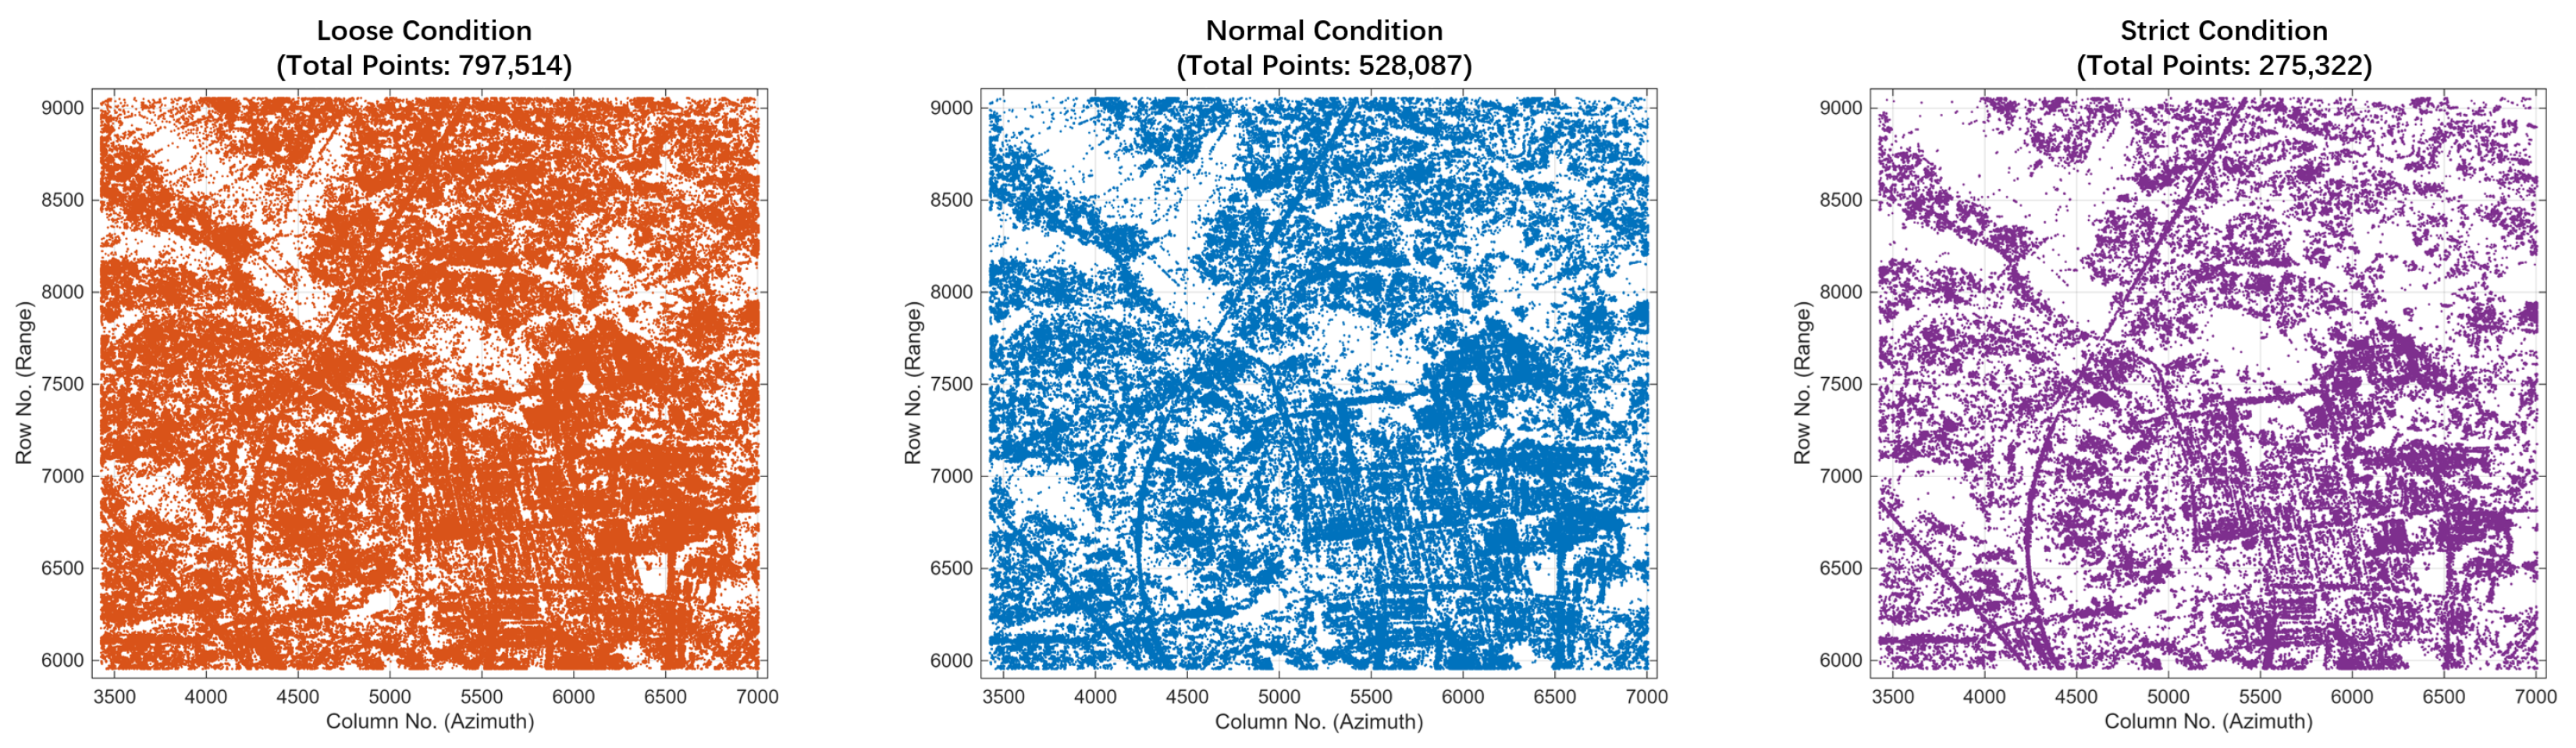
To justify the adopted PS/DS screening thresholds for the study area, a threshold-sensitivity comparison was carried out around the adopted amplitude-dispersion and coherence criteria. As summarized in Table 3 and illustrated in Figure 6, a looser threshold scheme extracted 797,514 valid points. Although this scheme produced a very high point density, it also filled vegetated mountainous areas with excessive scattered points and increased redundant noisy observations. A stricter scheme reduced the number of valid points to 275,322, improving the apparent stability of the retained points but causing local discontinuities and point loss on natural slopes where weak geohazard deformation needs to be monitored. The adopted threshold scheme, with an amplitude dispersion index of 0.3 for PS selection and a minimum coherence threshold of 0.75 for DS selection, extracted 528,087 valid points. This setting provided a more balanced spatial distribution: it preserved clear outlines of artificial structures and major infrastructure while maintaining sufficient point continuity on natural slopes and potential geohazard-prone hillsides. Therefore, the adopted thresholds were used as a compromise between noise suppression, computational efficiency, and the spatial continuity required for early geohazard identification.
To integrate PS points and DS points, this study constructs a unified reference network within individual pixels. Specifically, an initial reference skeleton is first constructed using high-quality PS points within the pixel; subsequently, DS points that satisfy statistical consistency criteria are incorporated into this network, enabling them to share the same reference framework and deformation parameter solution model with the PS points.

3.2.3. Boundary Area Processing

Overlapping regions are defined to provide a common scattering reference for adjacent grid blocks, thereby enabling the alignment of local solution results within a unified reference coordinate system. If the grid is completely independent and lacks overlapping regions, although relative deformation results can be obtained within each grid block, inconsistencies in the reference phase constant and line velocity reference between grid blocks will lead to boundary discontinuities or banding artifacts after assembly. Configuring an overlap zone ensures that adjacent grid blocks share at least a portion of PS/DS points. These points serve both as geometric bridges connecting the grid blocks and as constraints for uniformly adjusting the velocity field and reference phase.
For boundary regions, this paper does not employ a hard-seam method to handle single-block solution results; instead, it utilizes common points within the overlap region to provide redundant constraints and ensure smooth transitions. Based on all common PS/DS points within the overlap region, a set of inter-block constraint equations can be established, and correction parameters for each block relative to the global reference frame can be determined through unified adjustment. After correction, the line velocity fields and reference phase benchmarks of different grid blocks are integrated into a single system, thereby achieving seamless grid block joining. For regions near the boundary that lack common points, the boundary discontinuity effect can be mitigated through redundant constraints from adjacent grid blocks and local weighted smoothing.
Mathematically, for a common PS/DS point p located in the overlap area between adjacent blocks a and b, the inter-block velocity offset and phase-constant offset are constrained as:
( v p a + Δ v a ) ( v p b + Δ v b ) = 0
( ϕ p a + Δ ϕ a ) ( ϕ p b + Δ ϕ b ) = 0
where v p and ϕ p denote the local LOS velocity and reference phase of the common point, and Δ v and Δ ϕ denote the block-wise correction parameters. All overlap constraints are stacked into a least-squares adjustment,
x ^ = arg min x C x d 2 2
where x contains the velocity and phase correction parameters for all blocks, with one stable reference block fixed to remove rank deficiency. The estimated correction parameters are then applied to each local block before mosaicking, yielding a unified deformation reference frame.

3.2.4. Cross-Block Unified Splicing

After completing the local solution for each block, this paper further constructs a Delaunay triangulation for all grid control points and performs a unified adjustment using inter-block common-point constraints. The key to this stage lies in the fact that while the local solution preserves high-resolution details and local stability, the estimation of cross-block velocity offsets and reference phase constant offsets re-establishes a globally consistent LOS deformation reference. For the residual phase after extracting linear deformation terms and elevation residuals, nonlinear deformation components are separated through spatiotemporal filtering and superimposed onto the linear deformation results, ultimately reconstructing the comprehensive deformation time series of observed targets within key areas. This achieves a progression from high-precision local solutions to a consistent regional-scale representation.
Compared to traditional global unified PS-InSAR or DS-InSAR processing paradigms, the main highlights of this method are reflected in three aspects. First, addressing the issues of massive computational load, uneven scatterer distribution, and global solution instability associated with high-resolution LT-1 in vast mountainous scenes, a block-based local-global collaborative solution method is proposed. Second, by integrating PS and DS points into a unified reference grid and parameter model, the method increases the density of target points while maintaining the overall consistency of deformation inversion results. Third, by utilizing common PS/DS points in overlapping regions, the method explicitly estimates inter-block line-of-sight velocity shifts and reference phase constant shifts, thereby facilitating unified adjustment and seamless stitching of cross-block results, which in turn ensures boundary continuity and the comprehensive characterization of deformation fields in key areas.

3.3. Practical InSAR Processing Workflow and Quality Control

All InSAR data processing in this study was implemented using the GAMMA software platform (version 2024v1.3). Because LT-1 images were acquired in full-polarization stripmap mode whereas Sentinel-1A images were acquired in Interferometric Wide Swath (IW) mode, the two datasets were processed through sensor-specific preprocessing steps before entering a unified differential-interferometric and time-series analysis framework. For Sentinel-1A IW data, orbit refinement, TOPS burst handling, debursting, co-registration, interferometric pair generation, and geocoding were performed following the standard Sentinel-1 TOPS workflow. For LT-1 stripmap data, SLC generation, orbit refinement, stripmap image co-registration, interferogram generation, and geocoding were carried out using the corresponding LT-1 stripmap processing modules.
After sensor-specific preprocessing, the two data streams were processed under a consistent differential-InSAR logic. To ensure near-square ground pixels while preserving the signal-to-noise ratio, different multilook factors were used according to the original sampling characteristics of each sensor. Sentinel-1A images were multilooked using a 5:1 ratio, producing an equivalent ground resolution of approximately 20 m. LT-1 images were multilooked using a 2:4 ratio, producing an equivalent ground resolution of approximately 19 m. A 30 m Copernicus DEM GLO-30 product obtained from the Copernicus Data Space Ecosystem (https://dataspace.copernicus.eu) was introduced as the external elevation reference to remove the topographic phase and to support terrain correction and geocoding. After the preliminary differential phase was obtained, flat-earth phase residuals were removed through polynomial fitting. Adaptive filtering was then applied to suppress interferometric fringe noise [21], and phase unwrapping was performed using a minimum-cost-flow strategy with a unified reference point [22,23].
Quality control was conducted throughout the workflow. Interferometric pairs with poor coherence, strong residual fringes, or obvious unwrapping discontinuities were inspected and excluded where necessary. In mountainous areas with strong topographic relief, a terrain-correlated atmospheric model was further constructed by establishing a linear relationship between unwrapped phase and elevation. This procedure reduced tropospheric vertical-delay contamination and improved the comparability of Sentinel-1A and LT-1 deformation products within the common 2024–2025 observation period. The final deformation-rate products were geocoded into a unified geographic reference frame before multi-source comparison and field interpretation. The key processing parameters are summarized in Table 4.

4. Results and Analysis

Based on the proposed framework, this section systematically presents the identification results for potential geohazards in Hunan Province: wide-area deformation results are generated from synergistic LT-1 and Sentinel-1 data; the characteristics of identified hazard sites are analyzed; and the framework’s applicability is evaluated through field validation in typical areas.

4.1. Production Status of Deformation Results

4.1.1. LT-1 D-InSAR Deformation Results

Addressing the challenges in identifying and interpreting geological hazard risks within southern hilly regions, the primary difficulties in processing LT-1 data stem from the inherent difficulty of eliminating orbital errors and the significant topographical variations within the operational area, which hinder the effective suppression of terrain-related errors. To address these issues, this study first analyses the patterns and impacts of orbital errors in LT-1 data. Based on the types of orbital errors present, a correction method is proposed to rectify different error categories, thereby maximising data extraction for acquiring high-resolution deformation information across the complex, extensive hilly terrain of southern China. Concurrently, a combined approach of three spline curves and robust estimation is employed to correct orbital errors, enhancing both the robustness and accuracy of the data. Finally, the orbital error model fitting component is subtracted from the total phase signal in InSAR, thereby achieving effective correction of orbital errors.
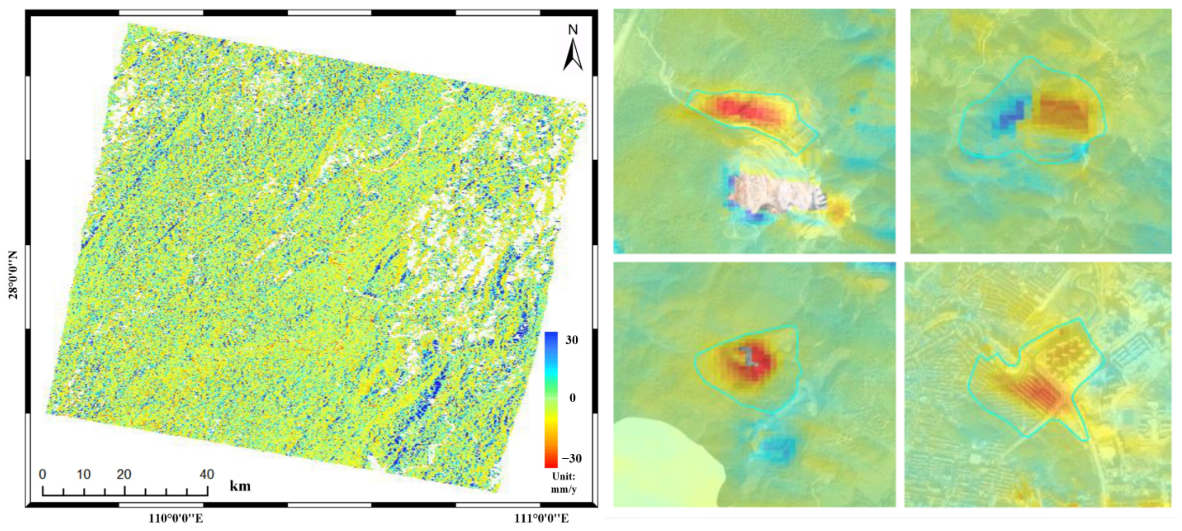
Considering the regional characteristics of geological hazards in Hunan Province, a 24,000 km2 area with high geological hazard risk within the province is designated as the study zone. LT-1 D-InSAR products and Sentinel-1 time-series InSAR products were jointly used to identify potential geological hazard sites. Specifically, LT-1 D-InSAR was used to produce high-resolution subsidence results covering 22,357 km2 across twelve counties: Chenxi, Fenghuang, Xiangtan, Luxi, Mayang, Taojiang, Guidong, Hengshan, Rucheng, Yanling, Xiangxiang City, and Ningxiang City. The LT-1 coverage used for project-level screening included 499 scenes at 12 m resolution, with key areas covered more than 10 times, and 1458 scenes at 3 m resolution, with provincial coverage reaching 6 times. These coverage conditions supported both regional hazard screening and refined interpretation of key candidate areas. A representative LT-1 D-InSAR subsidence map of Chenxi County is shown in Figure 7.

4.1.2. Sentinel-1 Time-Series InSAR Deformation Results

Given that Hunan Province is a typical southern hilly region characterised by undulating terrain and dense vegetation, relying solely on D-InSAR results to support the identification of geological hazard sites within the study area presents particular difficulties. Consequently, Sentinel-1 data are employed to supplement the analysis. For the medium-resolution C-band Sentinel-1 data, this study utilized SBAS-InSAR to generate regional-scale time series deformation products from Sentinel-1 data. These products were applied to supplement LT-1 D-InSAR results and to support the delineation of candidate geohazard targets. Furthermore, employing block-based processing techniques, the study area is divided into grid cells based on monitoring requirements and atmospheric delay characteristics, establishing PS/DS fundamental processing units at the grid cell level. Through unified adjustment methods for large-scale measurements, leveraging block-to-block and scene-to-scene overlap information, the study achieves effective stitching and error control of grid-based PS/DS-InSAR observations. This significantly reduces computational time and memory consumption for deformation solutions, enabling efficient and high-precision detailed measurements of building deformation rates and time series within areas of significant subsidence and key focus zones.
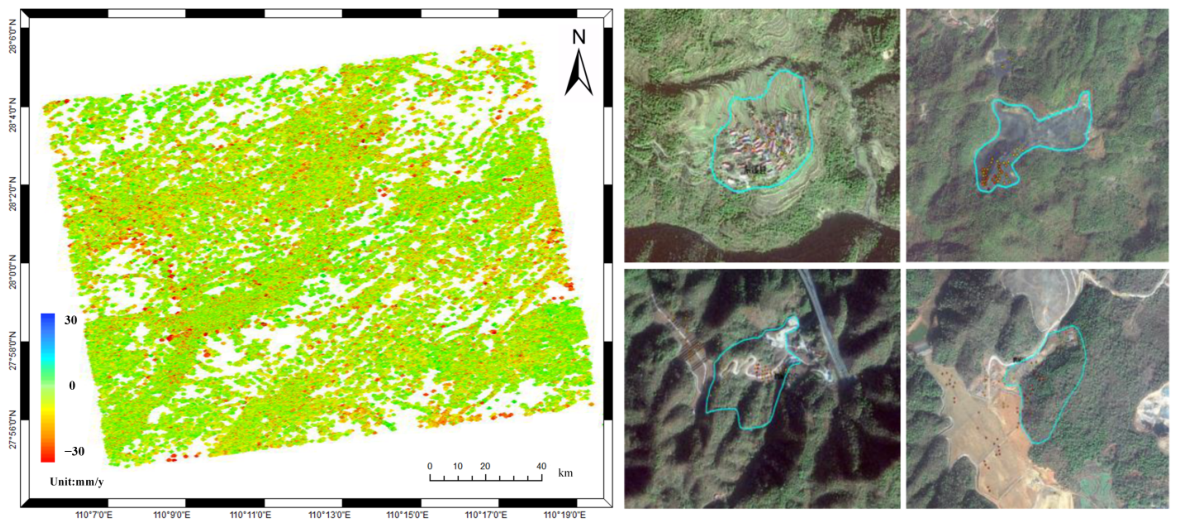
Ultimately, the time series InSAR subsidence rate results of a total of 31,436 square kilometers in 17 districts and counties, including Chenxi County, Mayang County, Luxi County, Fenghuang County, Taojiang County, Ningxiang City, Xiangxiang City, Xiangtan County, Hengdong County, Hengshan County, Nanyue District, Shaoshan City, Rucheng County, Yanling County, Guidong County, Zhongfang County, and Hecheng District, are processed using C-band Sentinel-1 data as a supplement. The Sentinel-1A results were used within the corrected 2024–2025 observation window described in Table 1, so the regional screening and the LT-1 comparison were interpreted within the same monitoring period. The corresponding Sentinel-1 time-series InSAR result for Chenxi County is shown in Figure 8.

4.1.3. Overall Production Status of Deformed Products

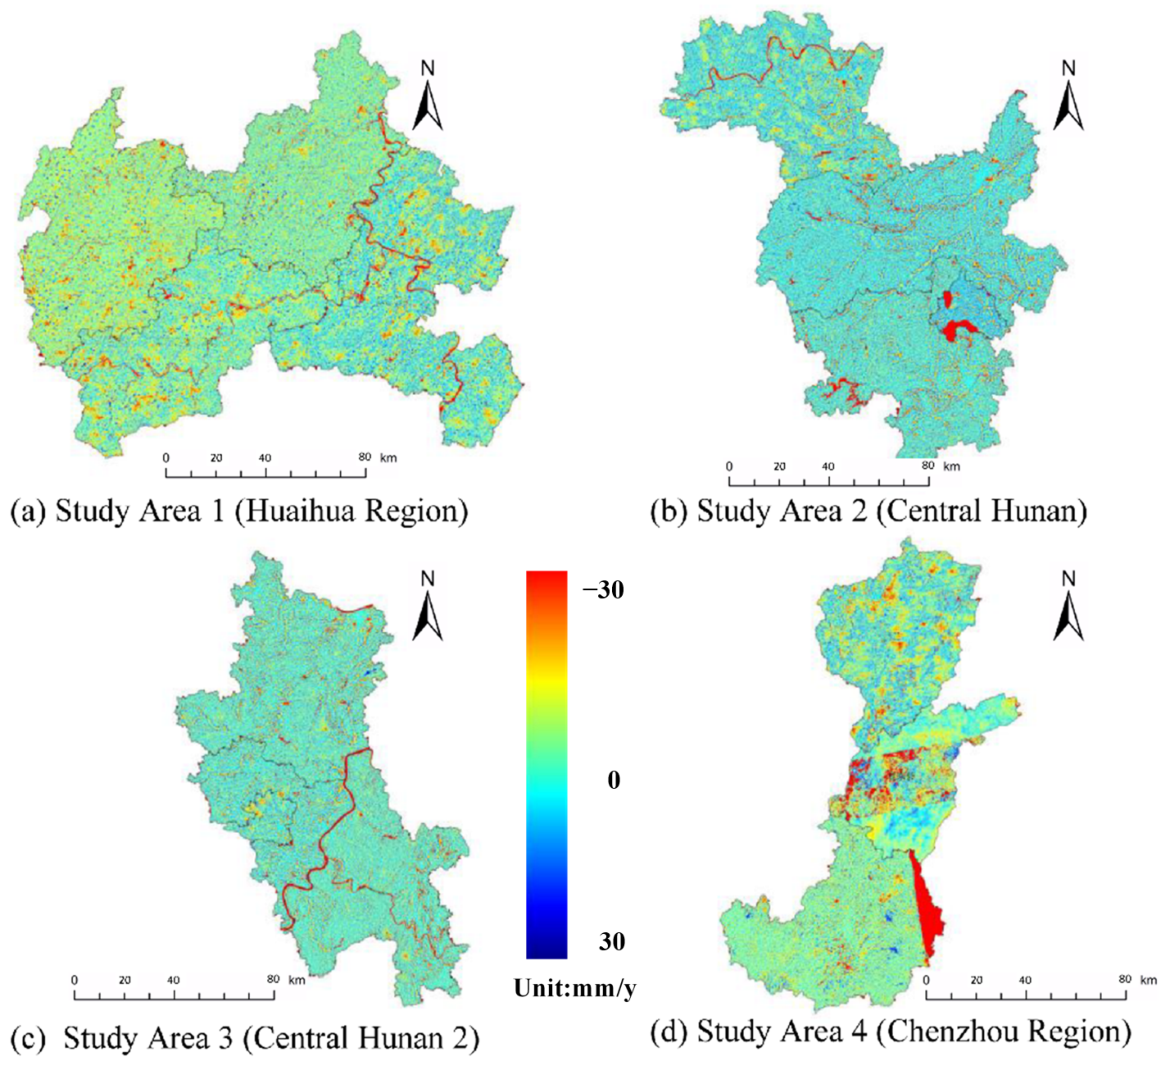
This study employed D-InSAR and time-series InSAR techniques to comprehensively identify geological hazard hotspots, producing LT-1 D-InSAR subsidence results covering an area of 22,357 km2. C-band Sentinel-1 data were processed to generate time-series InSAR subsidence rate results for 31,436 km2. The overall production status of deformation products is illustrated in Figure 9. Note that in Study Area 4, the lower-right region represents an invalid-data area rather than a continuous deformation signal, and this area was not used in the subsequent deformation interpretation.

4.2. Characteristics Analysis of Geological Hazard Hotspots

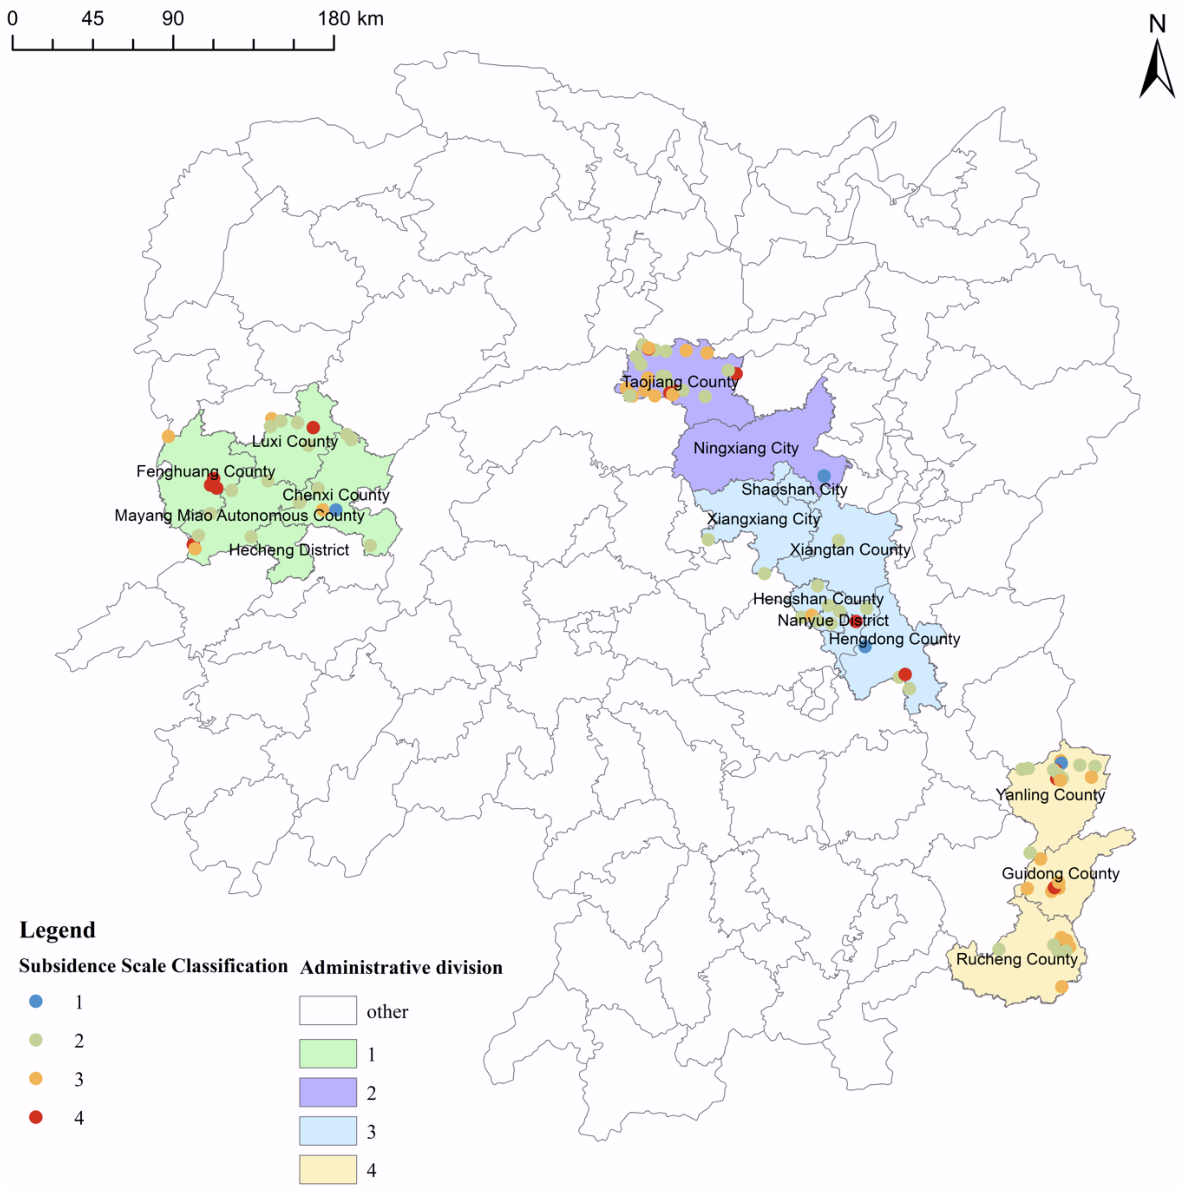
Figure 10 illustrates the classification and distribution of ground subsidence scales within the target areas of potential geological hazard sites identified in this study. Different colors represent different study areas: light green represents Study Area 1, which includes Chenxi, Mayang, Fenghuang, and Luxi counties, with a total area of 6854.83 km2; purple represents Study Area 2, which includes Taojiang and Ningxiang counties, with an area of 4982.02 km2; blue indicates Study Area 3, comprising Shaoshan City, Xiangxiang City, Xiangtan County, Hengshan County, Hengdong County, and Nanyue District, with an area of 6464.10 km2; yellow indicates Study Area 4, comprising Yanling County, Guidong County, and Rucheng County, with an area of 5893.54 km2.
The classification color of the geological disaster hazard point target area indicates the settlement scale grade of the hazard point target area. The grade thresholds are based on the empirical InSAR background-noise level of approximately ±3 mm/y in densely vegetated mountainous areas of Hunan Province; therefore, the settlement classes are divided at 3 mm/y intervals. Blue indicates a level 1 settlement scale, with an average annual settlement rate of over 9 mm/y. Light green indicates the level 2 settlement scale grade, with an average annual settlement rate of 6–9 mm/y. Orange indicates the level 3 settlement scale grade, with an average annual settlement rate ranging from 3 to 6 mm/y. Red indicates the level 4 settlement scale grade, with an average annual settlement rate of less than 3 mm/y.
From the perspective of overall distribution, a total of 180 suspected geological disaster target zones were extracted within the working area through wide-area InSAR deformation screening and interactive remote-sensing interpretation. These target zones were used as candidates for field investigation. The final hazard type was jointly interpreted using InSAR anomalies, high-resolution optical images, geological background, and field verification evidence such as surface tension cracks, building cracks, slope deformation, and local collapse traces.
The field-confirmed targets are distributed across regions with different vegetation coverage, terrain slope, lithology, and human engineering disturbance. Accordingly, this study reports the overall field-confirmed identification rate and uses typical verified cases to demonstrate framework performance under different terrain and land-cover conditions. The 83/180 value represents the field-confirmed rate of the interpreted candidate target zones under the adopted InSAR screening and field-verification workflow.
Several extracted target zones with moderate to strong subsidence signals were confirmed during field investigation, indicating that the InSAR-derived deformation anomalies can effectively guide the field screening of active hidden-danger points. For example, the level 1 settlement-scale HD002 patch in Hengdong County has an average settlement rate of 11.985 mm/y, and field verification identified landslide-related deformation signs. The LX002 target area has a maximum settlement rate of 8.598 mm/y, and field investigation identified both landslide and ground-collapse signs. These verified cases show that the settlement-scale classification provides useful deformation clues for prioritizing field inspection, and that the final hazard interpretation was supported by the consistency between InSAR anomalies and on-site deformation evidence.
The need to combine InSAR deformation, topographic factors, optical interpretation, and field evidence is also supported by previous studies in Hunan Province. For example, multi-source remote-sensing work in the Changli area of northern Hunan combined InSAR deformation, multispectral images, DEM-derived terrain factors, and GIS interpretation to identify small-scale and concealed landslide hazards [24]. Rainfall-landslide risk assessment in Mayang County further showed that regional lithology, rainfall, slope conditions, and human engineering activities jointly control landslide risk [25]. Recent LT-1 and multi-temporal polarimetric InSAR studies in Longshan County and the Yuanjiang Basin of northwestern Hunan also demonstrated that long-wavelength SAR and field validation are valuable for identifying landslide-prone sites in densely vegetated hilly terrain [26,27]. In addition, Sentinel-1A DS-InSAR monitoring of mining areas in Hunan confirmed that InSAR-derived subsidence patterns can be linked with optical evidence and field-investigation signs such as damaged houses and roads [28]. These studies support the interpretation strategy used in this work, in which InSAR deformation anomalies are treated as candidate evidence and are further constrained by terrain, geological background, optical imagery, and field verification.

4.3. Typical Cases of Field Verification

The 180 suspected target zones described above were delineated from wide-area InSAR deformation screening and remote-sensing interpretation, and all were checked through field investigation. The field verification campaign began in January 2025 and lasted for approximately two months. Among the 180 interpreted candidate zones, 83 target zones were confirmed as active hidden-danger points, corresponding to a field-confirmed rate among the interpreted candidate zones of 83/180 = 46.11%. This statistic is defined as the confirmation rate of InSAR- and remote-sensing-derived candidates after field checking.
The research team conducted field verification of the extracted target areas, primarily investigating geological and environmental information, including topography and landforms, terrain gradient, slope aspect, surface water bodies, current land use types, vegetation coverage, and primary vegetation types. Additionally, they examined stratigraphic lithological data, including overburden types, overburden thickness, bedrock lithology, bedrock geological age, stratigraphic bedding, slope structural types, joints and fractures, and unstable rock and soil masses. Deformation signs were recorded for each field-checked target zone, and analyses were conducted on the primary causes of subsidence. Furthermore, the fundamental hazard characteristics of sites verified in the field were documented as geological hazard risk points. Finally, the threatened entities, the number of people at risk, and the affected areas for each hazard point were definitively established.
The field-confirmation criteria combined InSAR deformation centers with surrounding surface-deformation evidence. A target zone was confirmed as an active landslide hidden-danger point when field evidence showed arcuate tensile cracks at the rear edge of the slope with widths of at least 0.5 cm, transverse or oblique shear cracks accompanied by scarps, local subsidence or bulging on the middle part of the slope, or dynamic changes such as crack widening, extension, or newly formed cracks. In red-bed slopes typical of Hunan Province, the coexistence of shallow slip traces and deeper cracks was also used as evidence of active slope deformation. For road and engineering-slope areas, pavement cracking, offset, settlement, slope collapse, retaining-wall deformation, seepage, and repeated small-scale failures were used to identify road-slope landslide hazards. For houses near or on cut slopes, through-going wall cracks, building tilt, foundation deformation, and ground-slab deformation were used as important indicators, especially when multiple through-going cracks and wall tilting occurred together. Additional auxiliary evidence included soil bulging, abnormal groundwater outflow, tilted trees, and continuous shallow collapse or soil fall on the slope surface, as summarized in Table 5.
Representative field-confirmed cases were used to link the InSAR-derived deformation signals with on-site geological evidence under different regional and terrain conditions. Table 6 summarizes three typical examples extracted from the field-verification material. These cases cover different study-area settings and include both landslide deformation and ground-collapse signs. They provide case-level support for interpreting the 83/180 value as a field-confirmed rate of the candidate zones generated by the InSAR and remote-sensing workflow.
The other target zones were retained as interpreted candidates with weaker confirmation evidence. Their deformation signals were generally weak or discontinuous, or the field survey recorded no clear surface cracks, slope deformation, building cracks, or collapse traces. Some targets may also correspond to temporarily stable slopes or non-geohazard-related deformation.
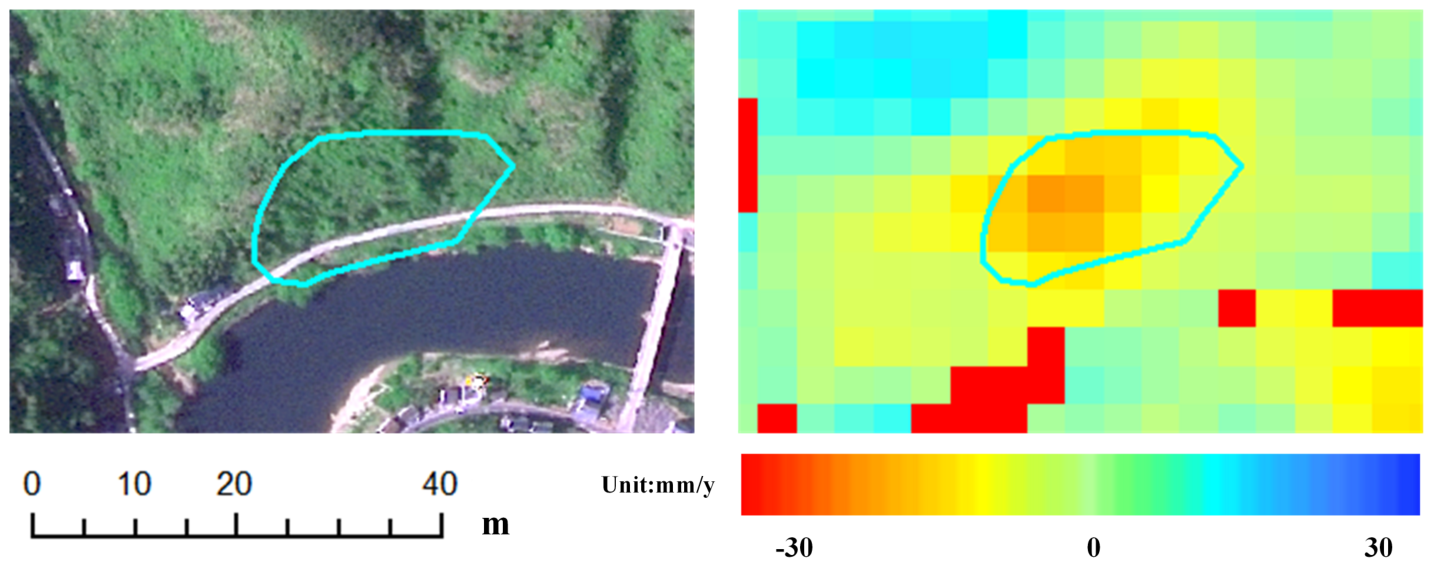
Spot LX002 is located in Songbaitan Village, Tanxi Town, Luxi County, with a longitude and latitude of 109.87 and 28.24, respectively. The indoor interpretation area of the spot is 15,746 square meters, and the maximum settlement within the spot is 8.598 mm/y. The on-site determination of the interpretation point type is landslide and ground collapse. In terms of geological environment, on-site verification shows that the plot is a hilly landform with an erosion structure. The current land type is forest land, with a mountain slope of 50° to 60° and a slope direction of 162°. The vegetation coverage rate is approximately 80%. The lithology of the bedrock is mudstone, siltstone, and siltstone mudstone, with a rock formation of 320° to 12°. The thickness of the soil layer is about 0.5–1.0 m. The main human engineering activities on site are cutting slopes for road construction and house building. There is a river at the foot of the slope. The optical interpretation and C-band Sentinel-1 PS/DS-InSAR deformation map of LX002 are shown in Figure 11.
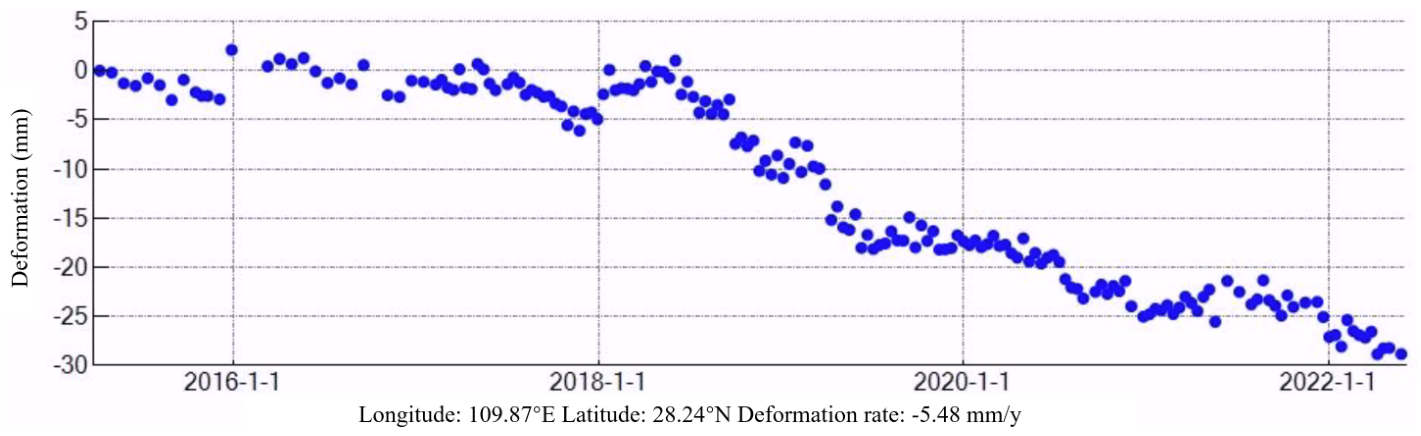
The time-series deformation scatter plot at LX002 was derived from C-band Sentinel-1 PS/DS-InSAR observations acquired from 2015 to 2023. The plotted series contains approximately 140 effective time-series observation epochs after InSAR processing and shows a cumulative subsidence trend at the representative point located near 109.87°E and 28.24°N, as shown in Figure 12.
Among the on-site deformation signs, the slope is high and steep, and dangerous rocks are seen in many places. The largest diameter of the dangerous rock blocks is approximately 3 m × 1 m × 2 m. Due to the unstable softening of the mud layer, small-scale landslides and slippage can be observed in the patches and many nearby areas. The main reasons for the settlement amount, as determined on-site, are as follows: 1. The slope is too high and steep, with soil erosion existing; 2. Weathering and loss of the clayey layer, softening and sinking; 3. Decomposition of organic matter in residual slope accumulation layers and compression settlement of loose accumulation layers.
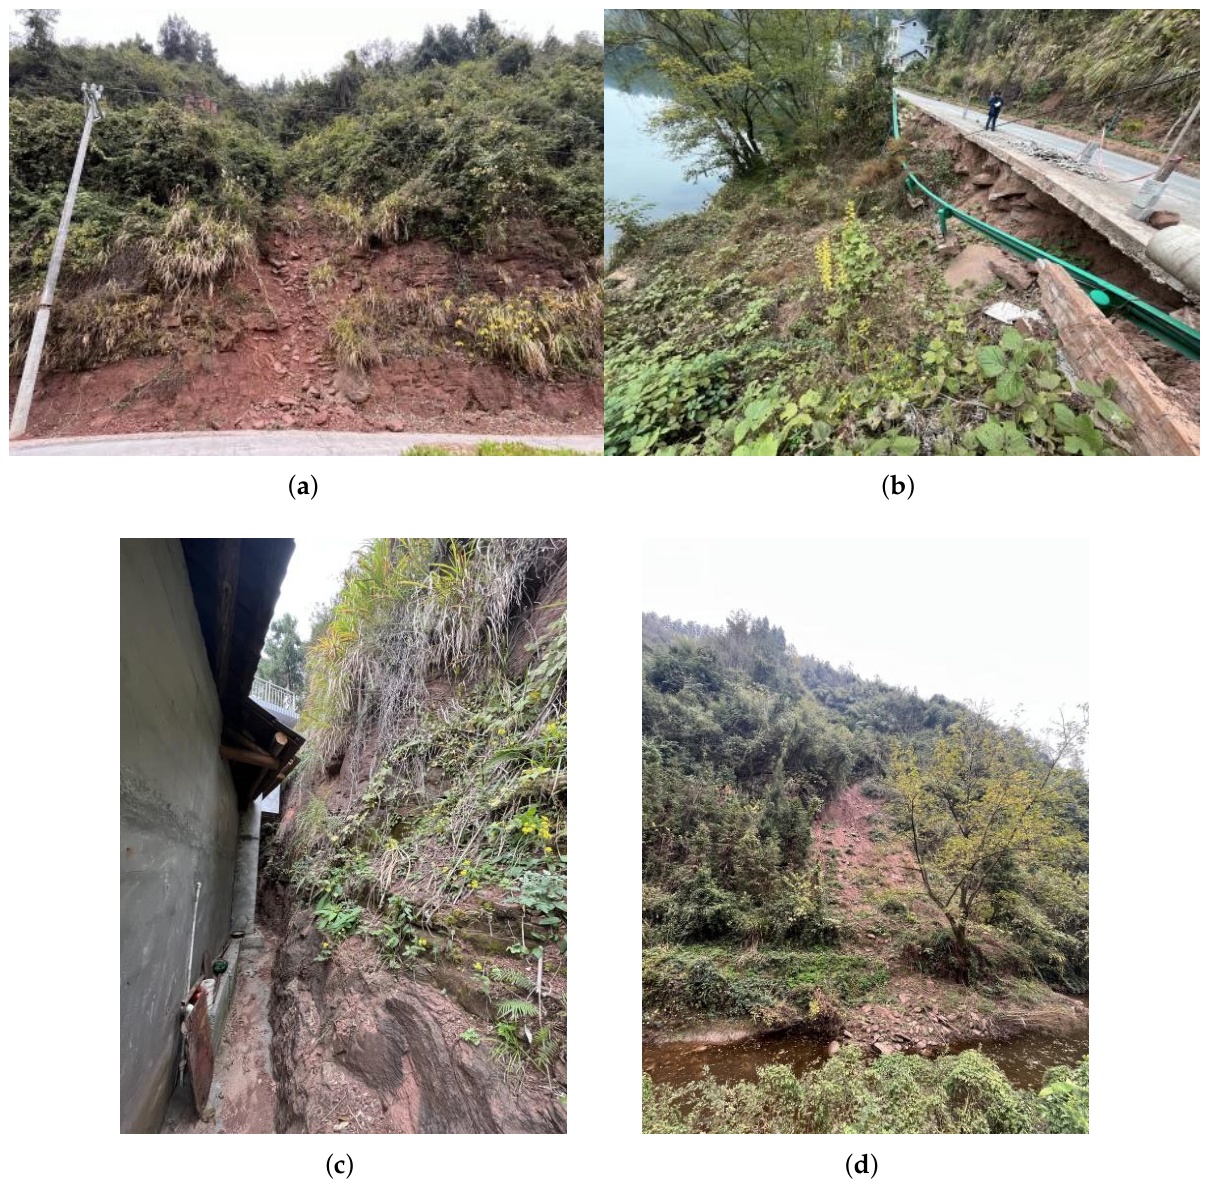
The fundamental characteristics of this hazard site are as follows: a landslide has developed on the inner side of the road, with the landslide mass primarily composed of loose fill soil, and the dual effects of load-bearing and river erosion influence it. The vertical drop is approximately 10 metres, the slope length is about 20 metres, the width is roughly 10 metres, the thickness is approximately 2 metres, and the volume is about 400 cubic metres. A deposit has formed at the toe of the slope, directly impacting road traffic and the safety of pedestrians and vehicles. Field investigation photographs of LX002 are shown in Figure 13.

4.4. Multi-Source Comparison and Integrated Monitoring Analysis of Typical Cases

To further validate the efficacy of the multi-resolution SAR collaborative monitoring framework in pinpointing typical hidden dangers in complex hilly and mountainous domains, this paper selects a representative deformation hazard point to conduct a comparative analysis between Sentinel-1A and LT-1 monitoring results within the common 2024–2025 observation period. Supplementary verification is executed across four dimensions: time-series deformation evolution, large-gradient deformation restoration, temporal sampling improvement through joint observation, and result consistency.

4.4.1. Spatiotemporal Evolutionary Characteristics of the Deformation Field

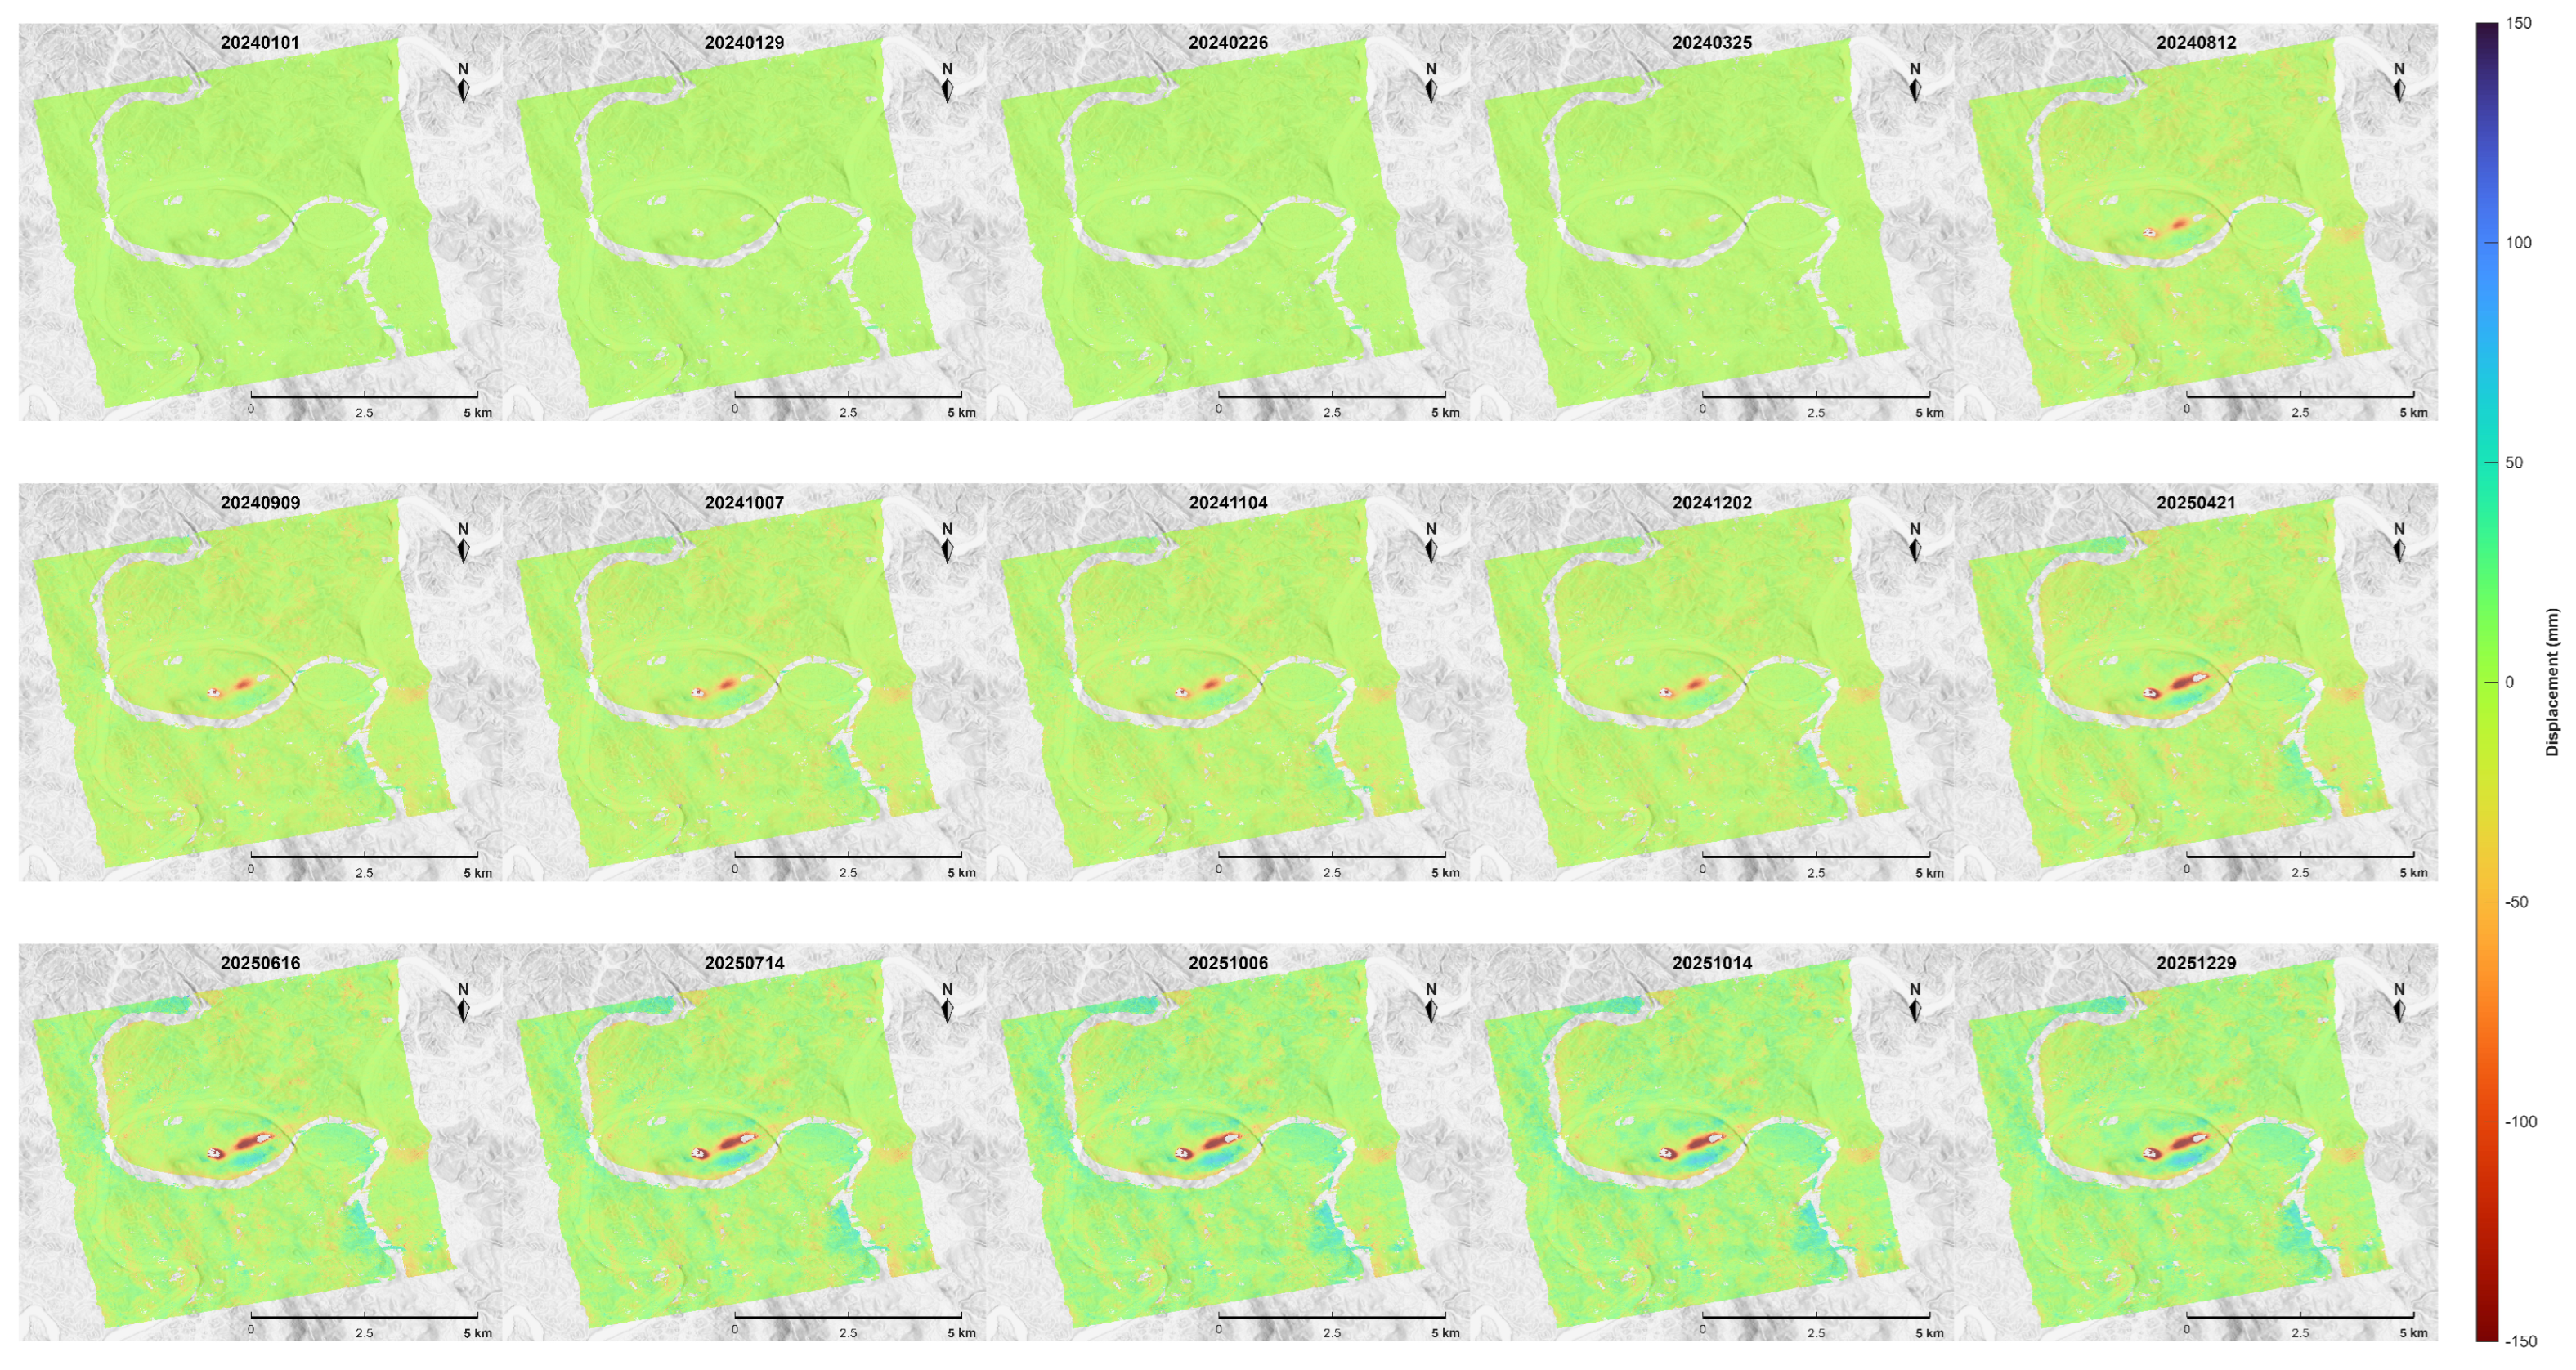
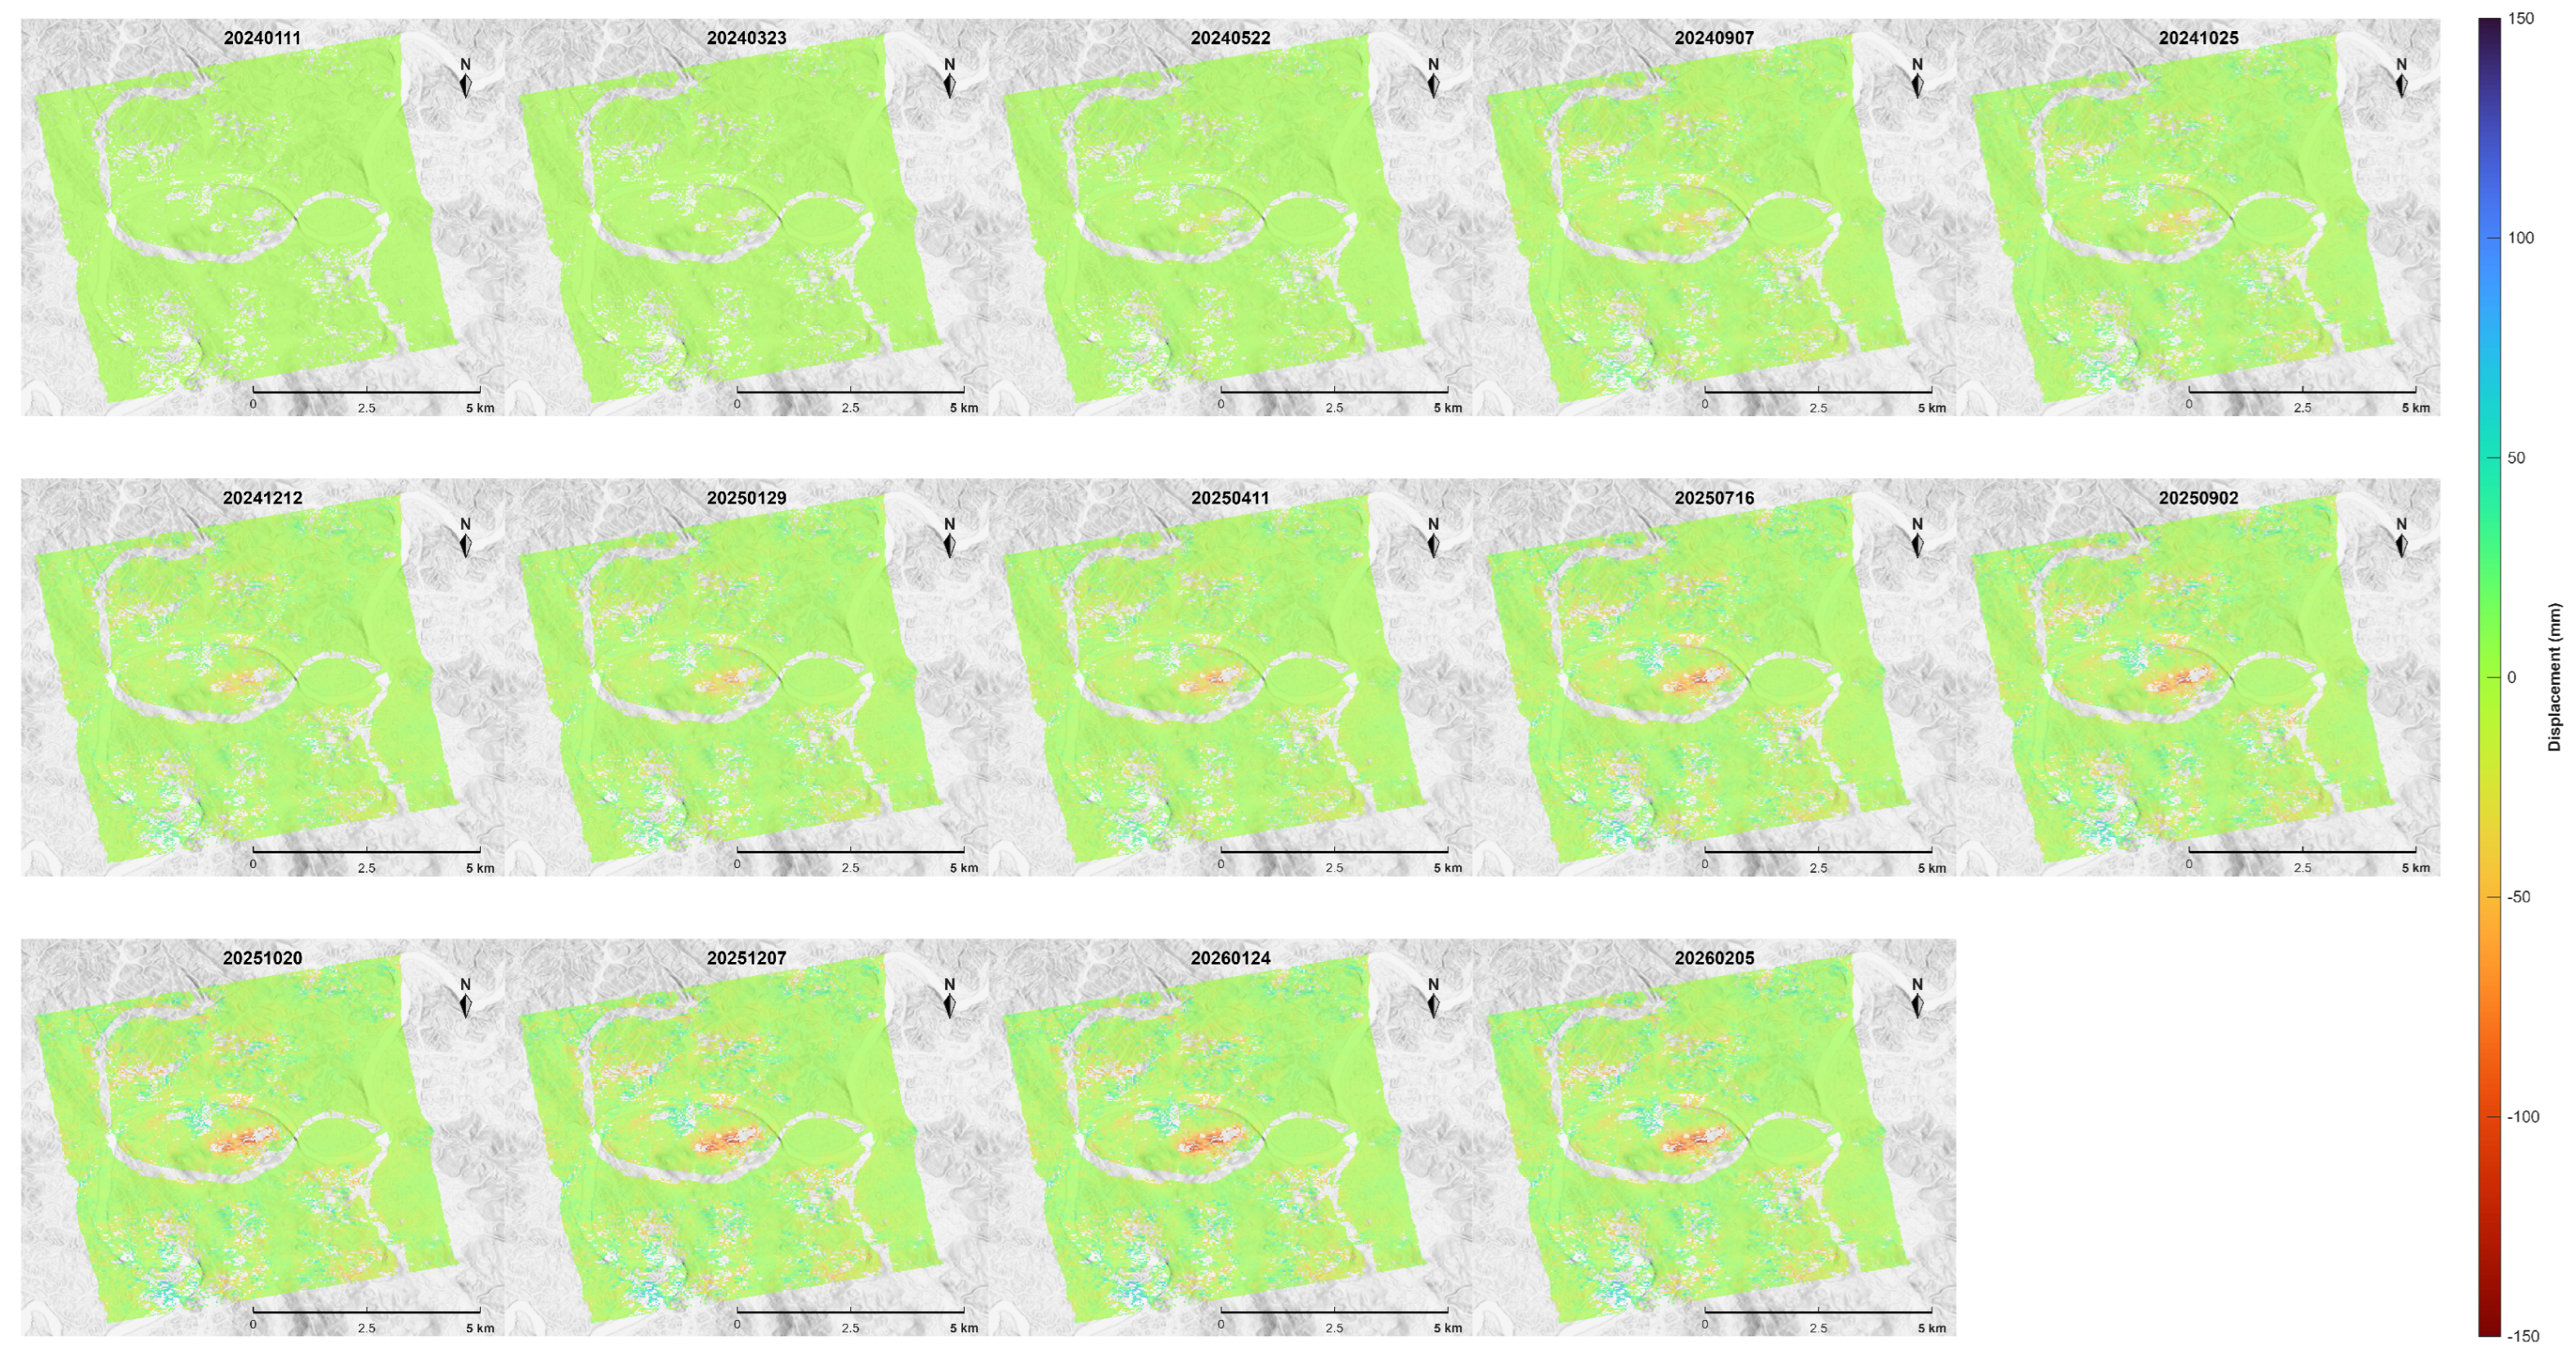
The LT-1 and Sentinel-1A time-series deformation results for the typical hidden danger point are depicted in Figure 14 and Figure 15, respectively. These maps use a DEM as the geographic base map and employ terrain rendering to enhance the 3D topographic representation of the hazard site. During the monitoring period, both types of sensors identified a persistent area of abnormal deformation, with the center of subsidence gradually shifting from the periphery toward the core; the transition from light green to deep red in the color bands reflects the site’s evolution from an initial stage of slow creep to a phase of ongoing development.
From a spatial distribution perspective, the distribution of the deformation field is spatially consistent with local topographic features, indicating that satellite radar interferometry can provide useful deformation evidence for geological-hazard interpretation in complex hilly environments. Further comparisons indicate that, for this vegetated and large-gradient case within the same observation period, LT-1 results provide stronger spatial continuity and more detailed deformation characterization. Compared with the Sentinel-1A result, which is more affected by decorrelation and data gaps in vegetated areas, the LT-1 result maintains higher coherence in the core deformation area due to the stronger penetration capability of the L-band, resulting in smoother deformation gradient transitions and clearer delineation of the central deformation zone.

4.4.2. Spatial Restoration of Large-Gradient Deformation Fields

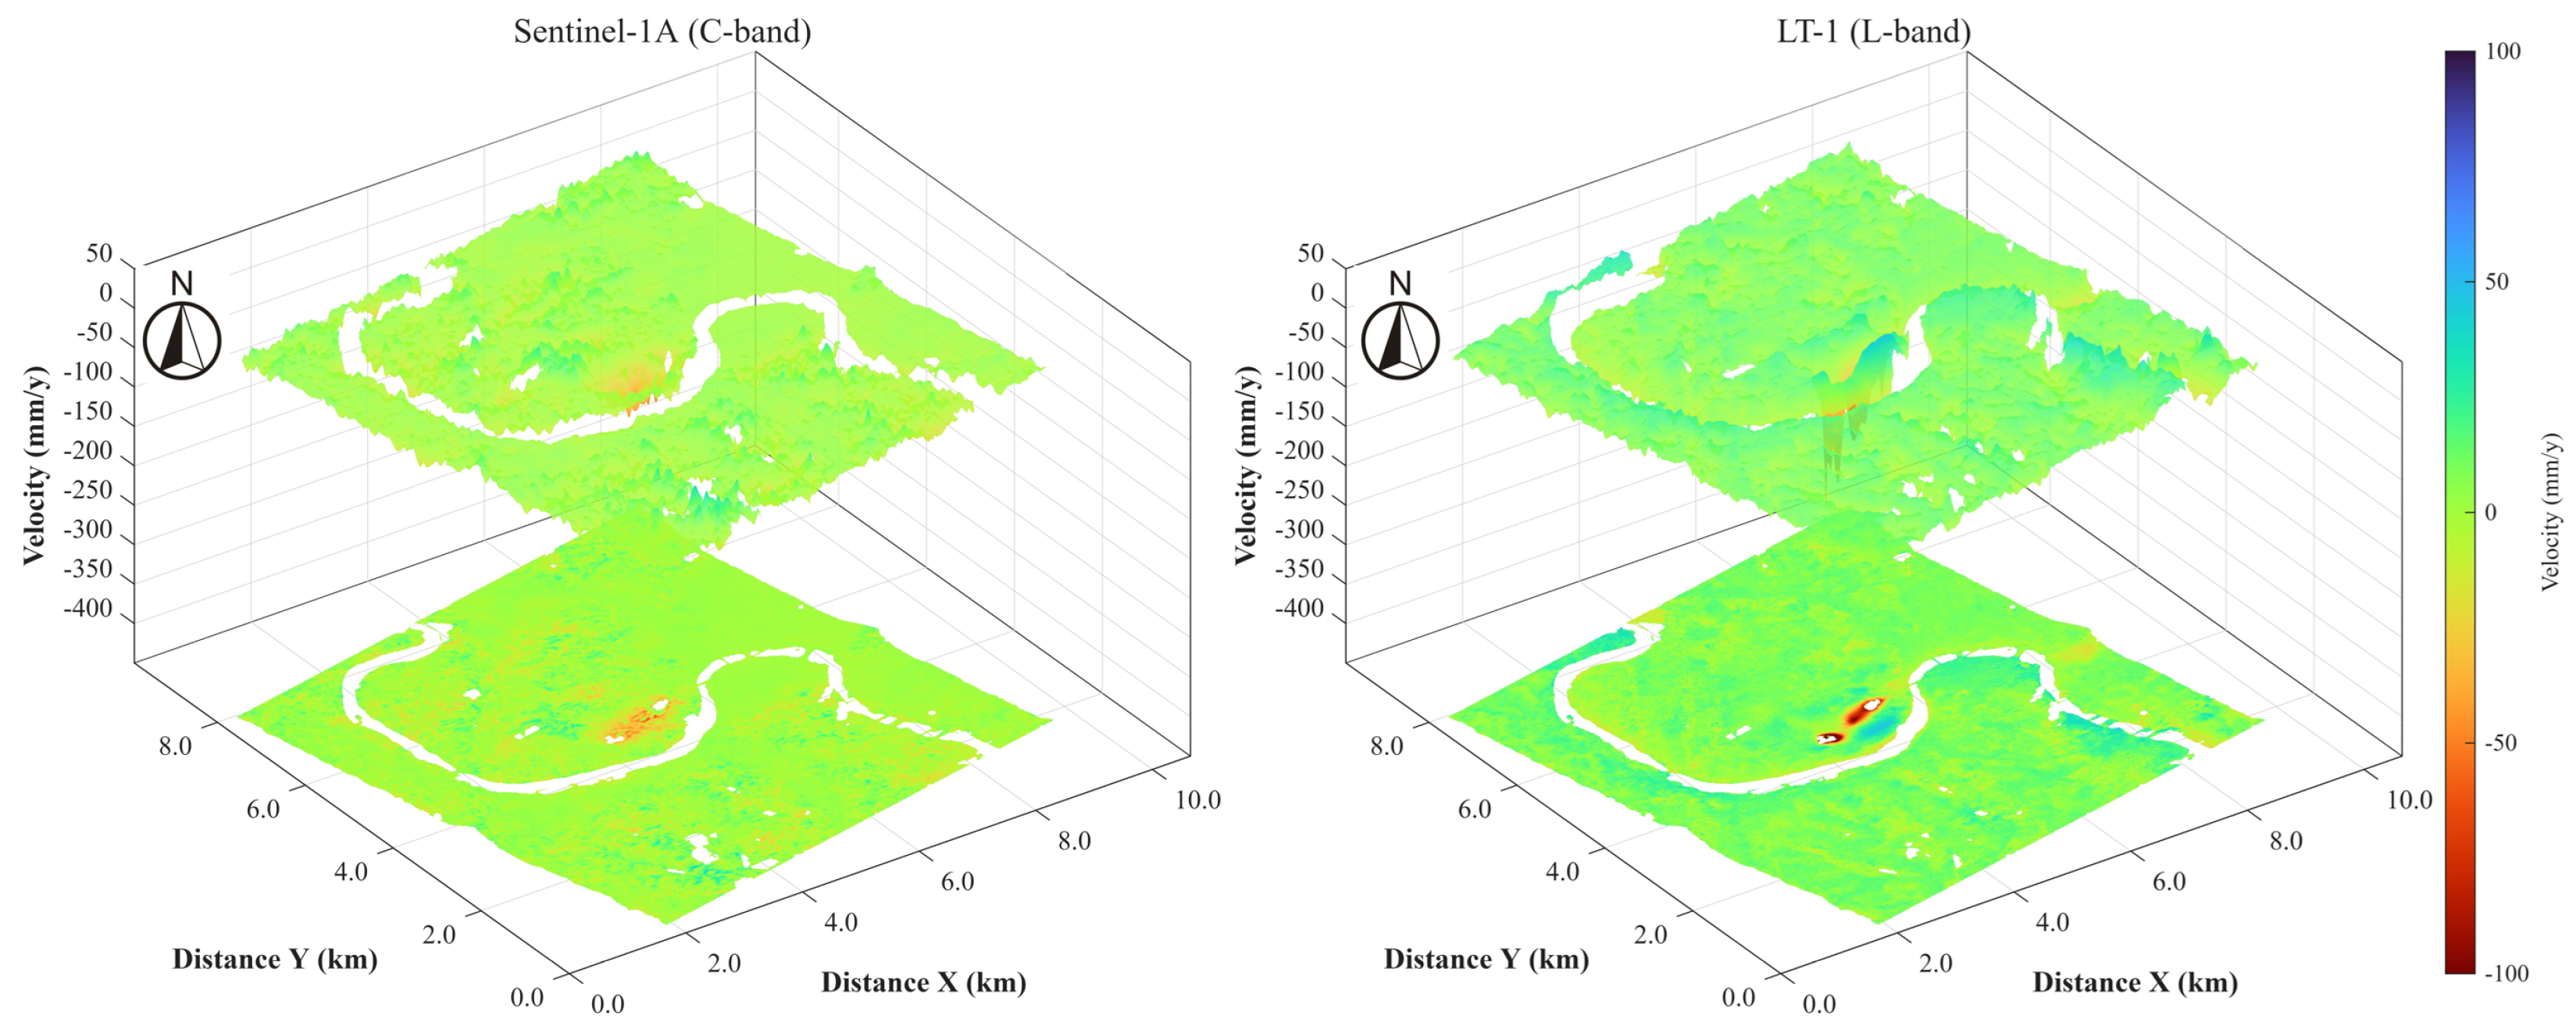
Figure 16 shows the annual average surface LOS deformation velocity field derived from Sentinel-1A and LT-1 data within the common observation period. In the Sentinel-1A observations, the spatial distribution of the subsidence areas is relatively scattered, with significant data gaps and noise interference in the central regions; in contrast, the LT-1 results show stronger spatial continuity in this vegetated large-gradient case, enabling a more complete mapping of the boundaries and core areas of the subsidence funnels. Analysis of the data overlaid on a 3D topographic model reveals that Sentinel-1A shows a relatively gentle deformation gradient in the central subsidence area, with a maximum deformation rate of only −69.6 mm/y; in contrast, LT-1 captures a more steep-sided, funnel-shaped subsidence center, with a maximum deformation rate as high as −362.2 mm/y.
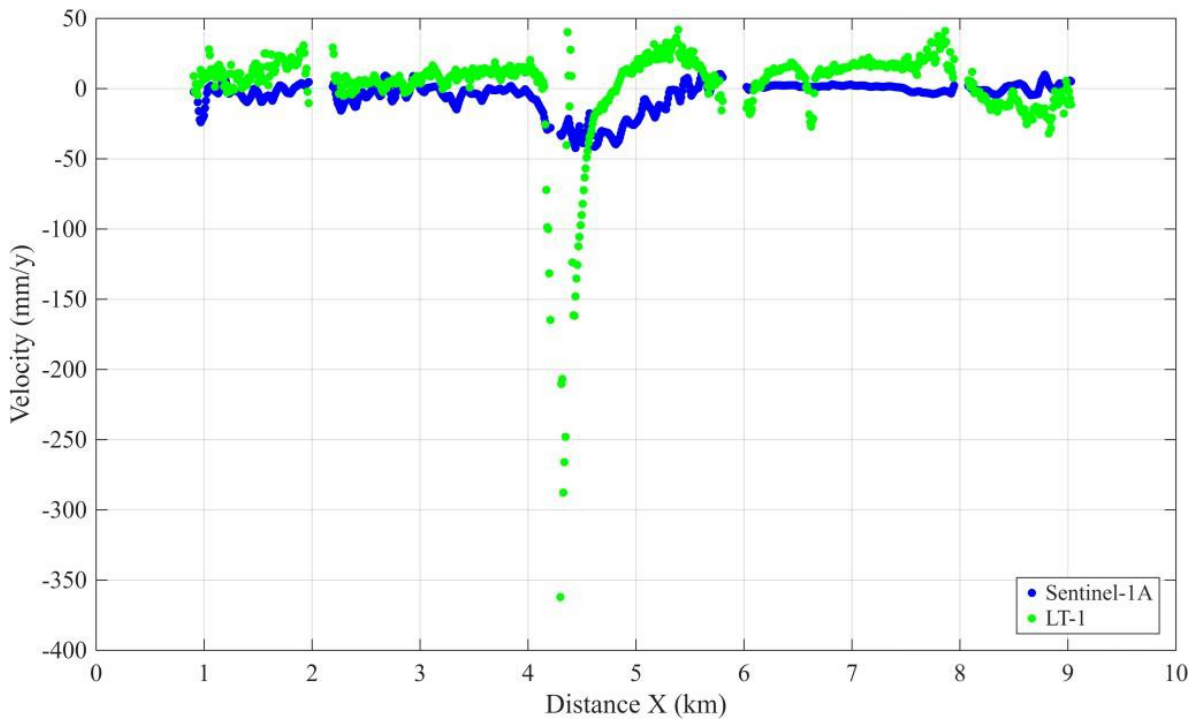
To further quantitatively assess the sensitivity of these two sensors to large-gradient deformation, a deformation profile approximately 9 km long was extracted along the east–west axis passing through the center of the subsidence area, as shown in Figure 17. Near the subsidence center at X = 4.3 km, LT-1 recorded a distinct peak in deformation, whereas Sentinel-1A exhibited only a weak response at the same coordinates. The profile results indicate that Sentinel-1A data points are sparsely distributed in the area of severe deformation, suggesting reduced sensitivity under large phase gradients; conversely, the LT-1 scatter plot maintains stronger continuity in this profile. Using the LT-1 peak magnitude as the reference, the additional peak deformation amplitude recovered by LT-1 is calculated as:
Improvement = | V LT 1 | | V Sentinel 1 A | | V LT 1 | × 100 % = 362.2 69.6 362.2 × 100 % = 80.8 % .
This result indicates that Sentinel-1A captured only 19.2% of the LT-1 peak magnitude in this high-gradient area, whereas LT-1 recovered the remaining 80.8% of the peak deformation amplitude.
The interpretation of the larger high-gradient deformation recovered by LT-1 is based on its consistency with field investigation evidence rather than on deformation magnitude alone. In this case, the LT-1 deformation pattern corresponds better with surface tension cracks, building cracks, slope deformation, and local collapse traces observed during field investigation. Sentinel-1A may underestimate the deformation magnitude in this area because of its shorter C-band wavelength, vegetation-related decorrelation, and phase-gradient loss under rapid deformation.

4.4.3. Temporal Resolution Enhancement Under Joint Sentinel-1/LT-1 Observation

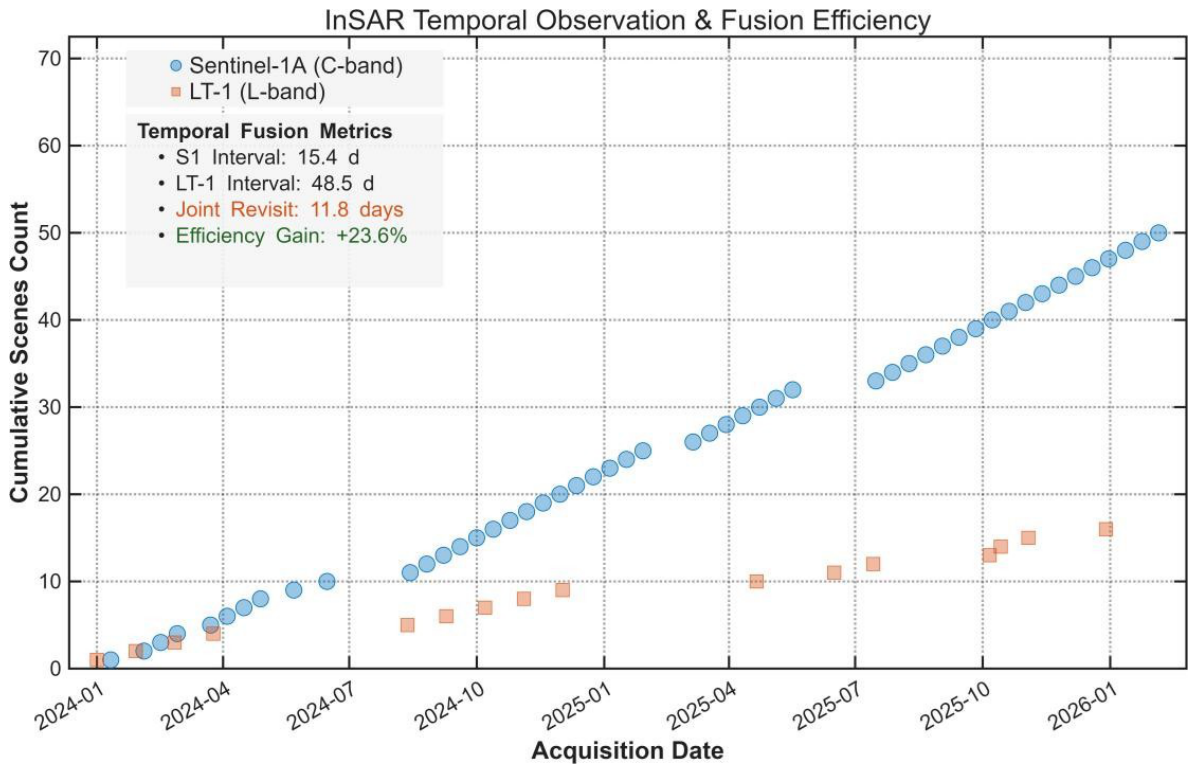
Figure 18 shows the cumulative observation sequences of Sentinel-1 and LT-1 during the overlapping 2024–2025 monitoring period, highlighting the complementarity of the two data sources in terms of temporal sampling. All acquisition dates used in this analysis fall within the common observation window. Sentinel-1 has a high revisit frequency, with an average observation interval of 15.4 days, whereas longer observation intervals may occur during critical stages of complex geological hazard evolution. LT-1 provides complementary high-resolution L-band observations, and its average revisit cycle of 48.5 days is complemented by the denser Sentinel-1 observation sequence. Through joint Sentinel-1/LT-1 observation, the average revisit interval of the integrated observation sequence was reduced to 11.8 days, representing a 23.6% improvement in temporal sampling efficiency. This enhancement supports denser temporal sampling for tracking the creep, acceleration, and instability-related evolution of geological hazard hotspots.

4.4.4. Consistency Evaluation of Multi-Source Comparison Results

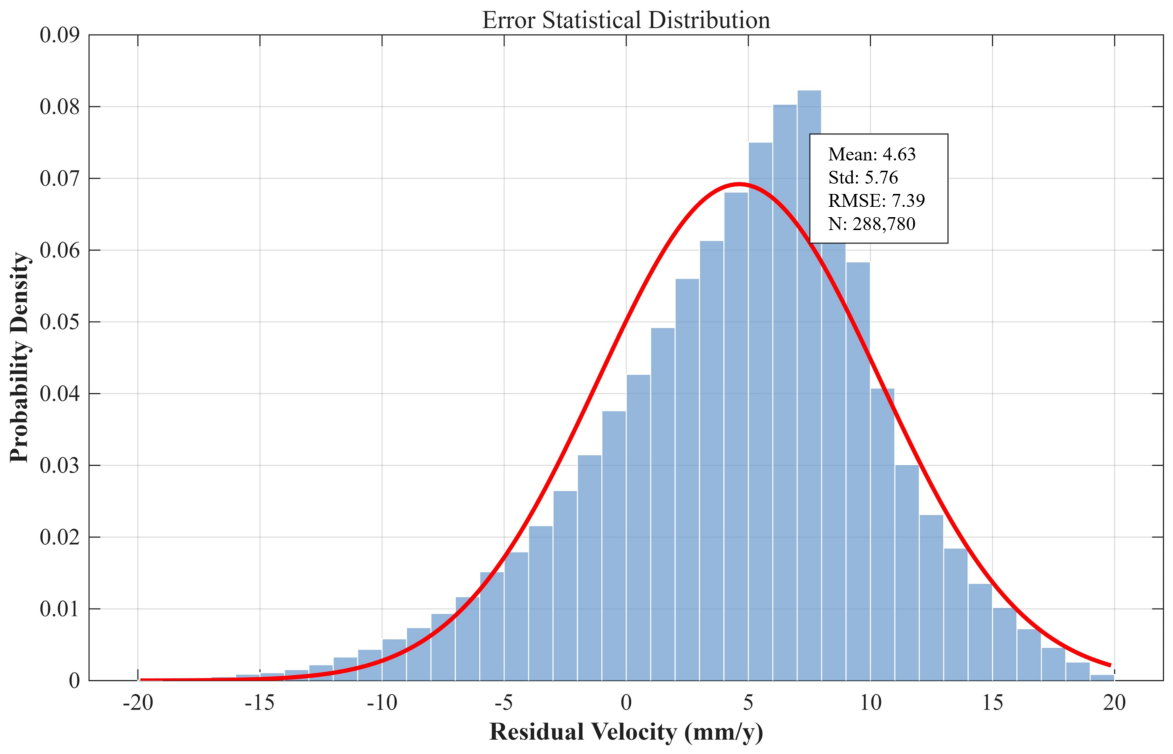
To quantitatively assess the reliability of multi-source monitoring results, this study employs a full-pixel masking statistical method to perform a consistency analysis of deformation rate results from Sentinel-1A and LT-1. First, data from the two satellites were spatially registered and resampled within a unified geographic reference frame; subsequently, a stable region reference mask was extracted by setting an empirical threshold of less than 10 mm/y for absolute values, to minimize interference from true geological deformation. Constrained by this mask, a total of 288,780 valid observation samples were collected to evaluate the overall robustness against sensor noise, atmospheric phase residuals, and processing workflows.
Consistency was quantitatively characterized using the root mean square error (RMSE) metric. The results show that the RMSE for samples from stable regions is 7.39 mm/y, which is lower than the deformation intensity within the core areas of hazard zones. This result supports the numerical consistency of the multi-source comparison in non-deformation zones. Further integration with Figure 19 shows that the residual frequency distribution is broadly consistent with a fitted normal curve. However, the mean residual of 4.63 mm/y should not be interpreted simply as random noise. This systematic residual may be related to orbital residuals, DEM errors, residual atmospheric phase, wavelength-dependent scattering differences, viewing-geometry differences, and resampling errors between Sentinel-1A and LT-1 datasets. The standard deviation of 5.76 mm/y further indicates that the two datasets are generally consistent in stable regions while retaining sensor- and processing-related differences.

4.5. Discussion

The proposed framework is intended as an operational geohazard screening and validation workflow rather than a purely image-based classification model. Compared with deep-learning-based recognition methods, which usually require large numbers of labeled hazard samples and may be sensitive to transferability across regions, the proposed method combines Sentinel-1 regional deformation screening, LT-1 refined monitoring, optical image interpretation, geological background analysis, and field verification. This design is better suited to engineering-oriented screening in mountainous areas where labeled geohazard samples are limited and field confirmation remains essential.
The complementary roles of the two SAR data sources are also important. Sentinel-1 provides broad coverage and relatively frequent observations, making it suitable for regional-scale anomaly screening. LT-1, with its L-band wavelength and higher spatial resolution, provides stronger coherence preservation and finer deformation details in vegetated mountainous terrain, which is useful for refined monitoring of key target zones. The block-based PS/DS-InSAR strategy further reduces the computational burden of high-resolution processing while preserving local deformation details.
Nevertheless, several uncertainties should be considered when interpreting the results. First, InSAR measures the projection of deformation onto the radar line-of-sight (LOS) direction. When the slope movement direction is close to the LOS direction, the observed LOS deformation can sensitively reflect slope-parallel motion. When the slope aspect is approximately perpendicular to the LOS direction, however, the true slope displacement may be underestimated or even partly invisible in the LOS measurement. In landslide-oriented PSI interpretation, previous studies commonly use the angular relationship between slope movement direction and satellite LOS to evaluate measurement observability, and a projection coefficient such as cos β can be used as a semi-quantitative indicator of whether slope displacement is well represented in the LOS measurement [29]. In this study, low LOS deformation rates were therefore interpreted cautiously and jointly assessed with slope aspect, terrain conditions, optical imagery, geological background, and field evidence. The LOS observability categories used to guide this interpretation are summarized in Table 7.
This LOS observability limitation may partly affect the field-confirmed rate of the interpreted candidate target zones. Some unconfirmed targets may correspond to deformation directions that are weakly projected into the available ascending-track LOS geometry, while some active slopes with unfavorable geometry may show only weak InSAR signals. For this reason, the reported 83/180 = 46.11% value is specific to candidate zones derived from the available SAR viewing geometry and field-checking criteria. Vegetation decorrelation, seasonal rainfall, soil-moisture variation, and vegetation phenology can also reduce coherence and affect deformation retrieval. Residual atmospheric phase, DEM errors, orbital residuals, wavelength-dependent scattering differences, and resampling errors may further contribute to systematic differences between Sentinel-1A and LT-1 deformation products. These limitations indicate that multi-source InSAR results are best interpreted together with geological context, optical imagery, and field evidence as part of an integrated hazard-screening workflow.


5. Conclusions

This study proposes a multi-resolution InSAR surface deformation monitoring framework and establishes a collaborative monitoring method using Sentinel-1 and LT-1 data acquired within an overlapping 2024–2025 observation period. The LT-1 D-InSAR products covered 22,357 km2, and the Sentinel-1 time-series InSAR products covered 31,436 km2. Using 2441 registered geohazard sites in the work area as the background dataset, the proposed wide-area InSAR screening and remote-sensing interpretation workflow delineated 180 suspected geohazard target zones. All 180 target zones were checked through field investigation, and 83 were confirmed as active hidden-danger points, corresponding to a field-confirmed rate of 83/180 = 46.11% among the interpreted candidate zones.
The multi-source strategy improves both monitoring efficiency and deformation characterization. Sentinel-1 provides wide-area and relatively frequent observations, while LT-1 provides stronger spatial detail and coherence in vegetated mountainous terrain. Based on actual acquisition dates within the common observation window, the joint Sentinel-1/LT-1 observation sequence reduced the average observation interval to 11.8 days, improving temporal sampling efficiency by 23.6%. In the typical high-gradient deformation case, LT-1 recovered 80.8% of the peak deformation amplitude that was not captured by Sentinel-1A, supporting its value for refined monitoring of rapidly deforming or densely vegetated slopes.
Several limitations remain. Sentinel-1 C-band observations can be affected by vegetation decorrelation in densely vegetated mountainous areas, and LOS deformation may underestimate the true downslope displacement where slope aspect and radar viewing geometry are unfavorable. Therefore, low LOS deformation is interpreted together with terrain and field-evidence constraints. Seasonal rainfall, soil-moisture variation, and vegetation phenology may also affect coherence and deformation retrieval. In addition, residual orbital errors, DEM errors, atmospheric phase residuals, wavelength differences, and resampling errors can introduce systematic differences between multi-source products. Future work will accumulate longer LT-1 time-series observations, improve atmospheric and geometric correction, and further integrate slope-direction or multi-geometry deformation analysis for more reliable geohazard early identification.

Author Contributions

Conceptualization, L.C. and Y.W.; methodology, L.C., G.Z. and K.Y.; validation, F.L.; Y.X., M.L. and H.Z.; formal analysis, L.C. and J.G.; investigation, C.Y. and F.L.; resources, Y.X. and Y.W.; data curation, K.Y. and Z.Z.; writing—original draft preparation, L.C.; writing—review and editing, Y.W., G.Z. and F.Z.; visualization, G.Z. and F.Z.; supervision, Y.W.; project administration, Y.W.; funding acquisition, Y.W. and L.C. All authors have read and agreed to the published version of the manuscript.

Funding

This research was funded by the Key Research and Development Program of the Ministry of Emergency Management grant number 2024EMST030301 and the Natural Science Foundation of Hunan Province grant number 2025JJ80009. The APC was funded by L.C.

Data Availability Statement

The data used in this study are available from the corresponding author upon reasonable request.

Conflicts of Interest

The authors declare no conflicts of interest.

References

  1. Muço, B.; Alexiev, G.; Aliaj, S.; Elezi, Z.; Grecu, B.; Mandrescu, N.; Milutinovic, Z.; Radulian, M.; Ranguelov, B.; Shkupi, D. Geohazards assessment and mapping of some Balkan countries. Nat. Hazards 2012, 64, 943–981. [Google Scholar] [CrossRef]
  2. Hunan Provincial Department of Natural Resources. Press Conference Transcript of the 2024 Annual Geological Hazard Prevention and Control Plan of Hunan Province. Available online: https://zrzyt.hunan.gov.cn/zrzyt/stbs/202405/t20240520_33306950.html (accessed on 2 June 2026).
  3. Yang, Z.; Li, Z.; Zhu, J.; Wang, Y.; Wu, L. Use of SAR/InSAR in mining deformation monitoring, parameter inversion, and forward predictions: A review. IEEE Geosci. Remote Sens. Mag. 2020, 8, 71–90. [Google Scholar] [CrossRef]
  4. Li, Z.; Cao, Y.; Wei, J.; Duan, M.; Wu, L.; Hou, J.; Zhu, J. Time-series InSAR ground deformation monitoring: Atmospheric delay modeling and estimating. Earth-Sci. Rev. 2019, 192, 258–284. [Google Scholar] [CrossRef]
  5. Kang, Y.; Lu, Z.; Zhao, C.; Xu, Y.; Kim, J.-W.; Gallegos, A.J. InSAR monitoring of creeping landslides in mountainous regions: A case study in Eldorado National Forest, California. Remote Sens. Environ. 2021, 258, 112400. [Google Scholar] [CrossRef]
  6. Bayer, B.; Simoni, A.; Schmidt, D.; Bertello, L. Using advanced InSAR techniques to monitor landslide deformations induced by tunneling in the Northern Apennines, Italy. Eng. Geol. 2017, 226, 20–32. [Google Scholar] [CrossRef]
  7. Cao, C.; Zhu, K.; Xu, P.; Shan, B.; Yang, G.; Song, S. Refined landslide susceptibility analysis based on InSAR technology and UAV multi-source data. J. Clean. Prod. 2022, 368, 133146. [Google Scholar] [CrossRef]
  8. Furst, S.L.; Doucet, S.; Vernant, P.; Champollion, C.; Carme, J.-L. Monitoring surface deformation of deep salt mining in Vauvert (France), combining InSAR and leveling data for multi-source inversion. Solid Earth 2021, 12, 15–34. [Google Scholar] [CrossRef]
  9. Cai, J.; Zhang, L.; Dong, J.; Guo, J.; Wang, Y.; Liao, M. Automatic identification of active landslides over wide areas from time-series InSAR measurements using Faster R-CNN. Int. J. Appl. Earth Obs. Geoinf. 2023, 124, 103516. [Google Scholar] [CrossRef]
  10. Lu, H.; Li, W.; Xu, Q.; Yu, W.; Zhou, S.; Li, Z.; Zhan, W.; Li, W.; Xu, S.; Zhang, P.; et al. Active landslide detection using integrated remote sensing technologies for a wide region and multiple stages: A case study in southwestern China. Sci. Total Environ. 2024, 931, 172709. [Google Scholar] [CrossRef] [PubMed]
  11. Yang, S.; Zhang, J.; Fu, L.; Chen, C.; Liu, Z.; Zhang, W. Adaptability analysis of Sentinel-1A and ALOS/PALSAR-2 in landslide detection in the Qinling-Daba Mountains. Appl. Sci. 2023, 13, 12080. [Google Scholar] [CrossRef]
  12. Li, N.; Feng, G.; Zhao, Y.; Xiong, Z.; He, L.; Wang, X.; Wang, W.; An, Q. A deep-learning-based algorithm for landslide detection over wide areas using InSAR images considering topographic features. Sensors 2024, 24, 4583. [Google Scholar] [CrossRef] [PubMed]
  13. Zhou, C.; Cao, Y.; Yin, K.; Wang, Y.; Shi, X.; Catani, F.; Ahmed, B. Landslide characterization applying sentinel-1 images and InSAR technique: The muyubao landslide in the three Gorges Reservoir Area, China. Remote Sens. 2020, 12, 3385. [Google Scholar] [CrossRef]
  14. Li, S.; Xu, W.; Li, Z. Review of the SBAS InSAR Time-series algorithms, applications, and challenges. Geod. Geodyn. 2022, 13, 114–126. [Google Scholar] [CrossRef]
  15. Manzoni, M.; Monti-Guarnieri, A.; Molinari, M.E. Joint exploitation of spaceborne SAR images and GIS techniques for urban coherent change detection. Remote Sens. Environ. 2021, 253, 112152. [Google Scholar] [CrossRef]
  16. Massonnet, D.; Feigl, K.L. Radar interferometry and its application to changes in the Earth’s surface. Rev. Geophys. 1998, 36, 441–500. [Google Scholar] [CrossRef]
  17. Berardino, P.; Fornaro, G.; Lanari, R.; Sansosti, E. A new algorithm for surface deformation monitoring based on small baseline differential SAR interferograms. IEEE Trans. Geosci. Remote Sens. 2003, 40, 2375–2383. [Google Scholar]
  18. Golub, G.H.; Van Loan, C.F. Matrix Computations, 4th ed.; Johns Hopkins University Press: Baltimore, MD, USA, 2013. [Google Scholar]
  19. Ferretti, A.; Prati, C.; Rocca, F. Permanent scatterers in SAR interferometry. IEEE Trans. Geosci. Remote Sens. 2002, 39, 8–20. [Google Scholar]
  20. Ferretti, A.; Fumagalli, A.; Novali, F.; Prati, C.; Rocca, F.; Rucci, A. A new algorithm for processing interferometric data-stacks: SqueeSAR. IEEE Trans. Geosci. Remote Sens. 2011, 49, 3460–3470. [Google Scholar] [CrossRef]
  21. Goldstein, R.M.; Werner, C.L. Radar interferogram filtering for geophysical applications. Geophys. Res. Lett. 1998, 25, 4035–4038. [Google Scholar] [CrossRef]
  22. Goldstein, R.M.; Zebker, H.A.; Werner, C.L. Satellite radar interferometry: Two-dimensional phase unwrapping. Radio Sci. 1988, 23, 713–720. [Google Scholar] [CrossRef]
  23. Chen, C.W.; Zebker, H.A. Two-dimensional phase unwrapping with use of statistical models for cost functions in nonlinear optimization. J. Opt. Soc. Am. A 2001, 18, 338–351. [Google Scholar] [CrossRef]
  24. Zhang, L.; He, S.; Zhang, J.; Peng, G.; Xu, Z.; Xie, J.; Tang, K.; Bu, J. Identification of landslide hazards based on multi-source remote sensing technology: A case study of the Changli area in Hunan Province. Remote Sens. Nat. Resour. 2024, 36, 173–187. [Google Scholar] [CrossRef]
  25. Sui, H.; Su, T.; Hu, R.; Wang, D.; Zheng, Z. Study on the risk assessment method of rainfall landslide. Water 2022, 14, 3678. [Google Scholar] [CrossRef]
  26. Chen, H.; Qin, Z.; Liu, B.; Peng, R.; Yu, Z.; Yao, T.; Yang, Z.; Feng, G.; Wang, W. Assessing the landslide identification capability of LuTan-1 in hilly regions: A case study in Longshan County, Hunan Province. Remote Sens. 2025, 17, 960. [Google Scholar] [CrossRef]
  27. Liu, B.; Chen, Y.; Hu, J.; Yao, T.; Tan, Y.; Qin, Z.; Wang, C.; Yin, W. Landslide identification in the Yuanjiang Basin of northwestern Hunan, China, using multi-temporal polarimetric InSAR with comparison to single-polarization results. Remote Sens. 2025, 17, 1525. [Google Scholar] [CrossRef]
  28. Zhang, L.; Gao, P.; Gan, Z.; Wu, W.; Sun, Y.; Zhu, C.; Long, S.; Liu, M.; Peng, H. Surface subsidence monitoring of mining areas in Hunan Province based on Sentinel-1A and DS-InSAR. Sensors 2023, 23, 8146. [Google Scholar] [CrossRef] [PubMed]
  29. Bianchini, S.; Herrera, G.; Mateos, R.M.; Notti, D.; Garcia, I.; Mora, O.; Moretti, S. Landslide activity maps generation by means of persistent scatterer interferometry. Remote Sens. 2013, 5, 6198–6222. [Google Scholar] [CrossRef]
Figure 1. Schematic diagram of the four study areas in Hunan Province. Study Area 1 includes Chenxi, Mayang, Fenghuang, and Luxi; Study Area 2 includes Taojiang and Ningxiang; Study Area 3 includes Shaoshan, Xiangxiang, Xiangtan, Hengshan, Hengdong, and Nanyue; and Study Area 4 includes Yanling, Guidong, and Rucheng. The elevation color scale is expressed in meters, while the “Subtotal” column in the embedded table represents the total area of each study area in km2.
Remotesensing 18 02307 g001
Figure 2. Coverage maps of SAR datasets used in this study: (a) LT-1 12 m resolution coverage, (b) LT-1 3 m resolution coverage, and (c) Sentinel-1A coverage. The LT-1 12 m and 3 m panels denote project-level coverage statistics, whereas the refined LT-1 monitoring dataset used in this study is summarized in Table 2; Sentinel-1A acquisition information is summarized in Table 1.
Remotesensing 18 02307 g002
Figure 3. Overall framework for multi-resolution SAR collaboration and block-based PS/DS-InSAR joint calculation.
Remotesensing 18 02307 g003
Figure 4. SBAS -InSAR technology processing workflow. Deformation-rate products generated in this workflow are expressed in mm/y.
Remotesensing 18 02307 g004
Figure 5. Flowchart of the block-based PS/DS-InSAR method. The final deformation-rate products are expressed in mm/y.
Remotesensing 18 02307 g005
Figure 6. Representative comparison of monitoring-point density under loose, adopted, and strict threshold schemes.
Remotesensing 18 02307 g006
Figure 7. D-InSAR-derived subsidence map of Chenxi County using LT-1 data, with examples of identified potential geohazard target areas. The color scale represents LOS deformation velocity in mm/y.
Remotesensing 18 02307 g007
Figure 8. Time-series InSAR-derived subsidence velocity map of Chenxi County using Sentinel-1 data, with examples of identified potential geohazard target areas. The color scale represents LOS deformation velocity in mm/y.
Remotesensing 18 02307 g008
Figure 9. Spatial distribution of deformation-rate products in the four study areas: (a) Study Area 1, Chenxi–Mayang–Fenghuang–Luxi; (b) Study Area 2, Taojiang–Ningxiang; (c) Study Area 3, Shaoshan–Xiangxiang–Xiangtan–Hengshan–Hengdong–Nanyue; and (d) Study Area 4, Yanling–Guidong–Rucheng. Deformation-rate products are expressed in mm/y.
Remotesensing 18 02307 g009
Figure 10. Distribution of subsidence magnitude grades for identified geohazard target areas.
Remotesensing 18 02307 g010
Figure 11. Target area LX002 shown by the high-resolution optical image and C-band Sentinel-1 PS/DS-InSAR-derived subsidence velocity map. The subsidence velocity unit is mm/y.
Remotesensing 18 02307 g011
Figure 12. C-band Sentinel-1 PS/DS-InSAR-derived time-series deformation scatter plot of target area LX002 during 2015–2023. The series contains approximately 140 effective observation epochs, and the representative point is located at 109.87°E, 28.23670°N.
Remotesensing 18 02307 g012
Figure 13. Field investigation photographs of target area LX002 (a) exposed steep roadside slope with local erosion and shallow slippage; (b) collapse of the road shoulder and adjacent riverbank slope; (c) unstable rock–soil mass immediately behind a building; (d) overall view of the landslide slope and the river at its toe.
Remotesensing 18 02307 g013
Figure 14. LT-1 data time-series deformation results for the typical hidden-danger point during the 2024–2025 monitoring period. Deformation velocity is expressed in mm/y.
Remotesensing 18 02307 g014
Figure 15. Sentinel-1A data time-series deformation results for the typical hidden-danger point during the overlapping 2024–2025 monitoring period. Deformation velocity is expressed in mm/y.
Remotesensing 18 02307 g015
Figure 16. Comparison of annual average LOS deformation velocity results between Sentinel-1A and LT-1. The color scale represents LOS deformation velocity in mm/y.
Remotesensing 18 02307 g016
Figure 17. Profile deformation velocity comparison between Sentinel-1A and LT-1. The vertical-axis unit is mm/y.
Remotesensing 18 02307 g017
Figure 18. Sentinel-1 and LT-1 joint observation sequence and temporal sampling improvement analysis within the overlapping 2024–2025 observation window.
Remotesensing 18 02307 g018
Figure 19. Distribution of residual LOS deformation velocities between Sentinel-1A and LT-1 in stable reference areas.
Remotesensing 18 02307 g019
Table 1. Acquisition schedule of Sentinel-1 ascending orbit data.
Study AreaData TypeTime SpanOrbital OrientationPathFrameNumber of Images
Study Area 1Sentinel-1AJanuary 2024∼December 2025Ascending track118162
Sentinel-1AJanuary 2024∼December 2025Ascending track1138160
Study Area 2Sentinel-1AJanuary 2024∼December 2025Ascending track848560
Study Area 3Sentinel-1AJanuary 2024∼December 2025Ascending track118662
Study Area 4Sentinel-1AJanuary 2024∼December 2025Ascending track1139160
Table 2. Acquisition information for the LT-1 data used for refined monitoring.
Data TypeTime SpanOrbital OrientationImaging ModeResolutionNumber of Images
LT-1 L-band SAR11 Januray 2024∼29 December 2025Ascending trackFull-polarization stripmap3 m15
Table 3. Sensitivity comparison of PS/DS screening threshold schemes.
Threshold SchemeValid PointsSpatial CoverageResult Stability
Looser than adopted797,514Very dense coverage, including excessive points in vegetated mountain areasHigher redundancy and more scattered noise
Adopted: 0.3/0.75528,087Balanced coverage in built-up areas, infrastructure, and natural slopesStable results with good spatial continuity
Stricter than adopted275,322Sparse coverage with local point loss and discontinuity on slopesFewer noisy points but reduced deformation-field continuity
Table 4. Key processing parameters and quality-control settings used in the practical InSAR workflow.
Processing ItemSentinel-1A IW DataLT-1 Stripmap Data
Software platformGAMMA software, version 2024v1.3GAMMA software, version 2024v1.3
Mode-specific preprocessingOrbit refinement, TOPS burst handling, debursting, co-registration, interferometric pair generation, and geocodingSLC generation, orbit refinement, stripmap co-registration, interferogram generation, and geocoding
Multilooking strategy5:1 multilooking, corresponding to an equivalent ground resolution of approximately 20 m2:4 multilooking, corresponding to an equivalent ground resolution of approximately 19 m
External DEM and topographic correction30 m Copernicus DEM GLO-30 product obtained from the Copernicus Data Space Ecosystem; used for topographic phase removal, terrain correction, and geocodingSame DEM source and role as used for the Sentinel-1A workflow
Residual phase processingPolynomial fitting for flat-earth residual removal, adaptive filtering, and minimum-cost-flow phase unwrapping with a unified reference pointSame differential-interferometric processing logic as used for the Sentinel-1A workflow
Atmospheric correction and product outputTerrain-correlated atmospheric correction based on the relationship between unwrapped phase and elevation; geocoding into a unified geographic reference frameSame atmospheric-correction and geocoding logic as used for the Sentinel-1A workflow
Quality-control criteriaInspection and exclusion of pairs affected by poor coherence, strong residual fringes, or obvious unwrapping discontinuitiesInspection and exclusion of pairs affected by poor coherence, strong residual fringes, or obvious unwrapping discontinuities
Table 5. Main field-confirmation evidence used for candidate geohazard target zones.
Target TypeMain Field EvidenceInterpretation Role
Natural slope or landslide-prone hillsideRear-edge tensile cracks, shear cracks, scarps, bulging, subsidence, new or widening cracksConfirms active slope deformation around the InSAR anomaly center
Road or engineering slopePavement cracking, offset, settlement, slope collapse, retaining-wall deformation, seepageIdentifies road-slope or construction-related landslide hazards
Cut-slope residential areaThrough-going wall cracks, building tilt, foundation and ground-slab deformationIdentifies hidden danger where deformation threatens buildings and residents
Auxiliary surface signsSoil bulging, abnormal groundwater outflow, tilted trees, continuous shallow collapse or soil fallSupports interpretation where direct cracks are discontinuous
Table 6. Representative field-confirmed candidate target zones used to support hazard interpretation.
TargetLocationInSAR Deformation EvidenceField EvidenceInterpretation
LX002Songbaitan Village, Tanxi Town, Luxi County; 109.87°E, 28.24°NTarget area of 15746 m2; maximum subsidence rate of 8.598 mm/ySteep forested slope, road-cutting and house-building disturbance, river at slope foot, landslide and ground-collapse signsActive landslide-related hidden-danger target with local collapse evidence
TJ014Yiyanglun Village, Majitang Town, Taojiang County; 111.76°E, 28.42°NTarget area of 10,863 m2; maximum subsidence rate of 5.905 mm/ySlope deformation signs developed in a vegetated hilly setting with engineering disturbanceField-confirmed landslide hidden-danger target
HD002Dayuandu Village, Xialiu Town, Hengdong CountyLevel 1 settlement-scale target; average settlement rate of 11.985 mm/yField verification identified landslide-related deformation signsStrong deformation candidate confirmed as a landslide-related hidden-danger target
Table 7. Semi-quantitative LOS observability framework used when interpreting candidate geohazard target zones.
LOS Observability ClassProjection-Coefficient ConditionGeometric MeaningInterpretation in This Study
High | cos β | 0.75 Slope movement direction is close to the radar LOSLOS deformation can strongly represent slope-parallel motion
Moderate 0.35 | cos β | < 0.75 Slope movement direction has an oblique relationship with the LOSLOS deformation is interpreted together with terrain and field evidence
Low | cos β | < 0.35 Slope movement direction is nearly perpendicular to the LOSLOS deformation may underestimate true slope displacement
Disclaimer/Publisher’s Note: The statements, opinions and data contained in all publications are solely those of the individual author(s) and contributor(s) and not of MDPI and/or the editor(s). MDPI and/or the editor(s) disclaim responsibility for any injury to people or property resulting from any ideas, methods, instructions or products referred to in the content.