1. Introduction
Storms and floods are among the most common natural disasters, after which it is crucial to quickly identify injured humans, especially in difficult-to-reach locations such as mountains or forests. Unmanned aerial vehicles (UAVs) have been increasingly used for aerial surveillance to advance search and rescue operations, thereby increasing the overall effectiveness of emergency response systems [
1]. However, human detection in drone images can face several challenges due to flight altitude fluctuations, human-scale variations in images, and changes in lighting conditions. These factors make it difficult to use deep learning methods to locate injured people [
2]. Furthermore, the inherently complex geometric configuration of the human body from different perspectives requires a large and diverse dataset for effective neural network training [
3].
One way to obtain more data is to use multiple drone flights, which can be very expensive and time-consuming, or to improve existing data through data augmentation. The main goal of data augmentation is to help neural networks accurately recognize objects from different perspectives and positions [
4]. Several 2D data augmentation algorithms transform an input image to create different 2D views of a subject, which do not provide any new information about the subject [
5]. Other methods may use deep learning to create new images by creating new views that match the real-world object. However, all images generated through 2D transformations retain the original image, depth, and features of the original subject [
6]. Thus, most current methods do not find new parts of the subject. Another group of methods uses 3D models to generate new data. These methods generate new data by modifying the 3D model and taking pictures of it.
The current methods, despite allowing easy access to different parts of a 3D model, only present different scenes of the model. These techniques have been mainly applied in facial recognition applications [
7]. To overcome these limitations, in this study, we introduce a new data generation method called 3D model-based data generation (3DG), which uses 3D models of people and landscapes acquired in a virtual environment through a specially designed camera configuration.
Our method creates new data without requiring any initial images, which is different from traditional data augmentation methods that do this. It creates 3D views of a 3D human model from different heights and distances. To make things look more realistic, parts of the ground are reconstructed to look like natural backgrounds. This creates images that look very similar to images taken by drone surveillance. Adding realistic backgrounds is important because it resembles people in natural environments. We carefully plan the placement of cameras and the design of the network to ensure that all parts of the human body are covered, especially areas that may not be visible otherwise. This process enriches the dataset in terms of quality and diversity. The proposed 3DG technique ultimately increases the consistency and accuracy of deep learning models when integrated with original data.
The innovations of this paper are:
Development of a novel 3D Model-Based Data Generation Method (3DG): No real images are required because training data is synthetically generated by capturing images of human and terrain models in a virtual environment.
Realistic background simulation: as the method reconstructs terrain elements from the field imagery, the resulting background scenes are in close accordance with real-world environments as seen by UAVs.
Full 3D Coverage: The virtual camera is designed to move translationally and rotationally around the human subject at different heights and angles, ensuring full coverage of all parts of the human body while overcoming occlusions by capturing images from various 3D perspectives.
This paper is structured as follows:
Section 2 presents a review of related works;
Section 3 describes the proposed method, while
Section 4 evaluates the proposed algorithm. Finally, suggestions for future studies are provided in
Section 7, which concludes the paper.
2. Related Works and Background
Developing deep learning models for human recognition in drone images generally requires a large amount of training data. However, sometimes the dataset is limited or more training data is not available. In such cases, the use of data augmentation methods can significantly improve the model performance [
8]. This section provides a brief review of previous work on data augmentation.
In terms of common image data augmentation methods, they can be divided into three categories: the first category involves data augmentation through geometric transformations applied to the image, the second category involves data augmentation based on deep learning generative models, and the third category involves data augmentation using 3D models. The technique introduced in this paper belongs to the third category.
2.1. Data Augmentation Based on Geometric Transformations Applied to Images
In this category of methods, two-dimensional geometric transformations are employed to create supplementary data. These include inversion, rotation, translation, scaling, shearing, and random cropping [
5]. Such transformations represent effective approaches to enlarge the training dataset, as they minimise the chance that the network focuses on particular locations where the object appears. Implementation of these operations is straightforward, since they are available in most image processing libraries and thus are regarded as practical.
Reference [
9] studied several augmentation methods, including inversion, rotation, and cropping. Their results indicated that these techniques improved the accuracy of the model, with the most reliable predictions corresponding to the correct labels and showing a 13.82% improvement. In particular, inversion alone resulted in a 1.6% increase in accuracy, while the probability of the correct label being present among the top five predictions rose by 3%. Reference [
10] proposed an augmentation technique for training convolutional neural networks (CNNs) with greyscale images. Their procedure produced three-channel colour images by combining enhanced greyscale versions, thereby simulating variations such as sensor noise and brightness changes. Their findings confirmed improved performance in both image classification and object detection. Reference [
11] presented Random Erasing as an augmentation method for CNN training. This approach randomly chooses a rectangular region of an image, substitutes its pixels with random values, and imitates occlusion. Applied to the WRN-28-10 architecture on the CIFAR-10 dataset, Random Erasing reduced the top-1 error rate from 3.80% to 3.08%, producing a 0.72% improvement in classification accuracy.
Reference [
12] introduced an augmentation method based on perspective transformation. By altering the viewpoint, new images can be generated from virtual camera positions that are otherwise inaccessible. Their approach created new two-dimensional images from unseen perspectives. Experimental evaluation on several datasets showed that this view-based augmentation improved the mean average precision (mAP) from 3.2% to 17.5%.
In general, augmentation methods based on geometric transformations apply operations such as rotation, scaling, inversion, and other transformations, together with filters including edge detection and sharpening, to enrich the dataset. The application of these methods can yield notable improvements in model accuracy and feature detection, thereby enhancing the performance of the network. Nevertheless, it should be stressed that although these methods extend the training data, they remain dependent on the original input images. All generated data are obtained only through two-dimensional transformations, without introducing any additional attributes of the target object. Thus, the new images are produced solely by geometric modification of the pixels of the original image.
2.2. Deep Learning-Based Methods
Deep learning has been used to enhance data sets and create novel images [
13]. One of the most noteworthy approaches is the use of Generative Adversarial Networks (GANs). In a new survey, reference [
14] developed an in-depth analysis of the evolution, use, and obstacles of GANs in the last decade. Focusing on the use of Convolutional Neural Networks, these systems can be trained on collections of images and synthesize novel images to provide a different impression of the world. The resultant images, though novel and not present in the training set, possess a striking resemblance to real images. The capabilities of GANs in performing complex tasks have enabled them to be employed for data augmentation [
15].
Developing the work of [
16], the GAN architecture proposed sets the stage for generative modeling using adversarial training. Like all models of a generative nature, GANs are able to produce new content and thus fall under the umbrella of generative models. In the context of machine learning, GANs are able to perform unsupervised learning to produce new data samples. A GAN comprises two models: the generator and the discriminator. The generator produces fake data that is meant to appear real, while the discriminator attempts to tell the difference between real data and data that has been generated. This makes it possible to create new data samples that can be considered as replicas of the original data. Such samples can be utilized as auxiliary data in deep learning models to enable better prediction. “Neural augmentation” is a markup technique in which augmentation in the form of cropping, rotating, flipping, and style transferring using GANs is automatically learned by convolutional neural networks. It was applied to the Tiny ImageNet subsets of dogs vs. goldfish and cats vs. dogs and achieved a 6% increase in validation accuracy on both tasks. Another form of deep learning, which has been applied for data augmentation, is neural style transfer [
17]. The neural style transfer process is a technique whereby data in the form of images is augmented through the modification of neural networks in a convolutional neural network. Neural style transfer has become quite popular due to its artistic implementations, but it uniquely offers excellent data augmentation. It involves a circumstance whereby an original image and a target image are used as input, and the target image can transfer its style to the original image through a convolutional window. In so doing, the target image is able to retain its original content while having its style transferred to it.
Because of the augmentation methods highlighted above, new images are primarily formed through the application of two-dimensional transformations on already existing images. Although the outcomes differ from the originals, they still carry the same meaning. Changing the image of a chair, for instance, could result in a differently shaped or designed chair as long as it is still identifiable as a chair. In other situations, these methods concentrate on modifying the focal object of the image while the rest of the elements in the image are kept unchanged. Hence, the augmented data maintains the contextual integrity of the original scene while offering corresponding varied representations of the focal object. These approaches, however, do have several shortcomings. They ignore the realistic conditions or changes in the scene, such as occlusions, changes in illumination, and changes in the observer’s angle. Also, the models could be less performant in novel situations, as these techniques are data-driven and can be limited in their ability to provide different viewpoints on the objects.
2.3. Data Augmentation Using 3D Models
Several approaches need 3D models to obtain novel data. The present study generates synthetic data using 3D models. The general idea in the methods is to derive novel data from viewpoints and angles of observation that a virtual observer would have on the 3D model. Reference [
18] analysed facial recognition using machine learning to generate synthetic data through the construction of 3D models. Their study needed the identity creation, facial shape, and texture adjustments from photographs, hair, clothing, and background scene modeling. Their findings showed that on the FR (10%) criterion, the artificial data set scored 0.5, whereas the natural data reached a value of 1.17. Reference [
19] employed a 3D approach to create synthetic data of the objects. They used an RGB camera and depth image data to produce a 3D model. By extracting the skeletal structure and using image input as a basis, it was possible to generate new 3D models capable of capturing new positions and behaviours of images. Their experiments were devoted to the 3D modeling of children and toy animals.
In another study, reference [
20] suggested a novel framework to enhance visual pose regression via domain adaptation from synthetic to real images. Their method transfers the style of synthetic images to real ones and vice versa. They proposed two strategies to bridge this domain gap: one aims to train on realistic-looking synthetic images and test on the real ones, while the other targets training on fully synthetic data and testing on stylized real images. The experimental results showed that the second approach was more effective in achieving more accurate pose estimation. Furthermore, the synthetic data generated from 3D models is equally important for other applications beyond image classification, such as indoor LiDAR-based localization. For example, reference [
21] describes how synthetic LiDAR scans of a 3D building model are used to train the pose regression network that is later applied to real-world LiDAR data. It also importantly demonstrates that approximate spatial data (e.g., BIM) can be used for generating massive synthetic labeled datasets to tackle the problem of insufficient real-world data.
3D model-based data augmentation takes advantage of 3D models to generate realistic training samples by varying the perspectives, lighting conditions, and settings. This can make them very useful for tasks that rely on spatial variation, such as detecting objects in aerial images. However, the application of these strategies has been limited. This is largely due to the difficulty of creating or obtaining 3D assets, the rendering cost of large datasets, and the expertise required to integrate such an approach into a standard workflow. Due to this, many researchers still turn to the easier 2D methods, which offer less semantic diversity.
Most existing 3D-based approaches above have been developed for specific and often constrained settings. Several target close-range facial analysis [
7,
18], others rely on depth-camera input for indoor human-pose augmentation [
19], and still others address different sensing modalities or tasks, such as synthetic-to-real domain adaptation and LiDAR-based indoor relocalisation [
20,
21]. Consequently, the use of 3D-model-based generation for outdoor, aerial, full-body human detection, where both the subject and the surrounding terrain must appear realistic from a UAV perspective, has received comparatively little attention.
2.4. Recent Generative and Simulation-Based Augmentation Paradigms
Beyond the conventional geometric augmentations discussed above, several recent paradigms have emerged for generating synthetic training data. Diffusion-based generative models [
22] learn the distribution of a training corpus and synthesise new images by progressively denoising random noise, offering a powerful means of diversifying a dataset. Neural Radiance Fields [
23] reconstruct a scene from a set of calibrated images and synthesise novel views with high visual fidelity. Domain randomization [
24] randomises rendering parameters such as textures, lighting, and object placement so that a model trained on synthetic images becomes robust to the gap between simulation and reality. Synthetic-to-real transfer learning addresses the distribution shift between simulated and real domains through feature alignment or adaptation [
20]. Finally, transformer-based architectures such as the Vision Transformer [
25] have advanced image recognition by modelling images as sequences of patches through self-attention.
2.5. Research Gaps and Motivations
As stated, various data augmentation techniques aim to enhance the neural network’s performance by expanding the training dataset through generating new examples. Most of the methods are based on simple 2D transformation techniques, such as scaling, rotation, and translation or intensity variation, or on deep learning generative models. While these methods can improve model accuracy, they frequently ignore the geometric variation necessary for effective feature learning. Image acquisition is the method by which a three-dimensional scene is projected onto a two-dimensional plane. Many existing augmentation approaches operate in the 2D image space but do not account for changes in depth and perspective associated with different camera positions. In reality, multiple factors jointly affect pixel intensities, such as the surface orientation and spatial position of the object relative to the camera and light sources. Therefore, pixel values change naturally when the perspective shifts; two-dimensional transformations alone cannot achieve this.
Conversely, 3D model-based methods enable data augmentation under more realistic conditions, since 3D objects can be modelled from all possible angles and distances relative to the target. This is especially important for applications in which changes in camera position, height, and angle inevitably affect the appearance of an image. The present study belongs to this category. Specifically, we propose an algorithm that generates synthetic images of humans by building precise 3D human models, placing them against 3D terrain backgrounds, and simulating the movement of a virtual camera around them, so that images can be rendered from different views, depths, and lighting conditions. Unlike conventional methods, all training data are generated from 3D models and do not depend on existing input images.
A defining feature of our approach is that these 3D models are not artificially designed but are obtained from photogrammetric reconstructions of real physical objects, namely, real human subjects and mannequins for the foreground and real terrain captured by UAVs for the background. Both components, therefore, retain genuine geometry and real surface appearance, while still allowing free variation in viewpoint, altitude, and angle. Against this background, the present study does not aim to outperform or replace the learned-generative and simulation-based paradigms outlined above, but rather to examine a distinct and, to the best of our knowledge, under-explored question: how images derived from photogrammetric reconstructions of real physical objects affect the training of a UAV human detector. In this sense, 3DG is complementary to those paradigms rather than in conflict with them, and could in principle be combined with them. This also distinguishes the proposed method from earlier 3D-based approaches: rather than addressing close-range faces, indoor pose, or non-optical modalities, 3DG reconstructs both the human subject and the surrounding terrain photogrammetrically from real scenes and images them from calibrated UAV-like viewpoints, directly targeting the outdoor, aerial, full-body detection setting that those methods do not address.
The remainder of this paper develops our idea. The following section presents the proposed 3DG methodology in detail, after which we describe the generation of the synthetic dataset, the network used for evaluation, and a series of experiments that assess the effect of the photogrammetrically derived images on UAV human-detection performance.
The following sections describe the proposed methodology and evaluate its effect on the performance of deep learning models for human detection.
3. Proposed Methodology
As previously stated, the purpose of this study is to develop a photogrammetry-based data augmentation algorithm for human detection in drone images. Our approach is based on generating virtual images of people to train a deep learning model for human detection. Unlike the standard approaches that are based on geometric or radiometric variations in existing images, our methodology models image acquisition in a virtual world and generates entirely new representations of human presence. At its core is the realistic integration of 3D human models into complex earth models, specifically those constructed from drone images. The “scenes” are shot by a network of virtual cameras at various heights and angles. Thus, virtual images contain views that did not exist in physical drone images.
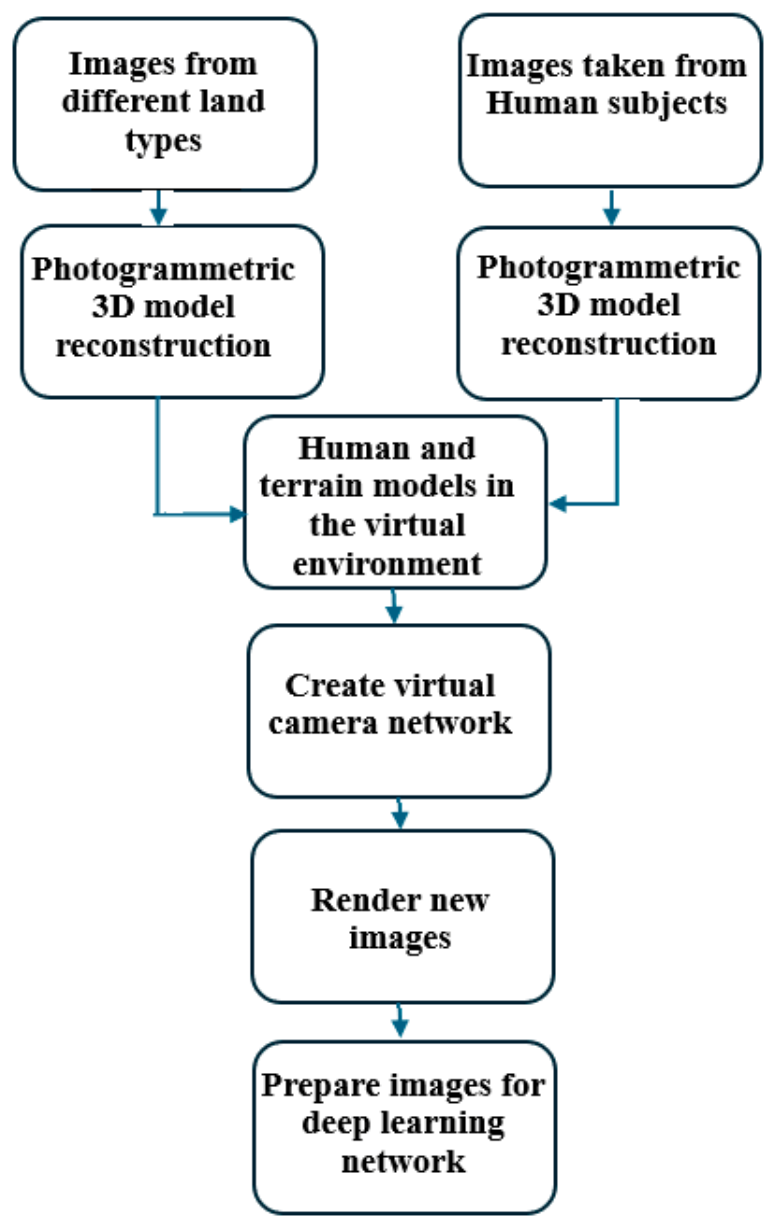
The proposed pipeline (
Figure 1) comprises three main components:
Generation of human models: Human subjects are either modeled through photogrammetry or acquired from existing 3D models. The addition of public models, which were combined with the ones we created, was done to achieve more detailed and undistorted 3D models. This is because live models can move when the photographs are taken.
Background Earth modeling: the images obtained by drones are used to build background models of Earth for human models to be put on.
Human model and background are rendered in a virtual environment from multiple virtual camera angles at once. This way, aerial views, which are diverse in scale, orientation, and occlusion, are generated. Each image offers a distinct viewpoint, which enhances the diversity of the training dataset.
We produce a rich dataset of virtual human images that not only appear realistic but also include a wider range of setups and visual backgrounds than traditional 2D image-based methods usually achieve. This can potentially increase the diversity needed for training robust deep learning models and is capable of generalizing to real-world UAV imagery. In the following, the above steps are further explained.
3.1. Generation of Human Models
The main goal of this stage is to obtain 3D models of human bodies, which are the fundamental datasets for human virtual image synthesis. To increase the diversity of the training datasets, two types of 3D human models were used:
Pre-existing 3D human models: These are the publicly available models that are adequate for testing and comparison purposes (see
Section 6 for examples).
Photogrammetrically Reconstructed Models: These are the models obtained through the photogrammetric reconstruction of photographs of human-shaped mannequins and real human subjects. Additionally, the mannequins provided a significant practical advantage: since they do not move while pictures for 3D modelling are being taken, there were no motion artefacts, and the resulting models were cleaner and more geometrically consistent. In contrast, real human participants were occasionally prone to partial data misalignment due to involuntary movements.
By combining both classes, i.e., models based on static mannequins and models created as dynamic reconstructions of real people, we ensured a database that was both visually diverse and geometrically accurate. The dual nature of the model acquisition approach allows for flexibility, scalability, and accuracy in constructing the dataset required for virtual human image synthesis.
3.2. Background Terrain Modeling
Human targets imaged by drones show up in a wide variety of backgrounds due to their aerial nature. To accurately model such conditions, the drone images from diverse locations of interest are collected and photogrammetrically processed to produce accurate 3D Earth surface models of its natural aspects. High-resolution drone images are captured using drones equipped with both nadir and oblique cameras to obtain full acquisition of the target area. The camera grid should allow for high levels of overlap (e.g., look angle 70–75% and side overlap 60%) as well as sufficient ground sample distance (GSD) in the range of 2 to 5 cm per pixel, depending on flight height/above ground level (AGL) and sensor settings required.
These image acquisition parameters are necessary to have enough redundancy in the images for correct photogrammetric reconstruction. Photos are processed using an advanced photogrammetric workflow, including feature matching, tie point filtering, and bundle adjustment for 3D mesh surface texture map generation. Efficient Structure from Motion (SfM) algorithms are used to estimate initial camera poses, followed by robust MVS methods to produce dense 3D reconstructions.
High-resolution orthophotomosaics and digital surface models (DSMs) are generated from the reconstructed 3D models. Orthophotos are produced by correcting geometric distortions stemming from perspective and ground relief, thereby achieving a consistent scale in each pixel throughout the entire imagery scene. Parts of these orthophotos are cut out and used as background elements in the creation of synthetic images, which can then be filled with human subjects within diverse environments. By positioning the 3D human models atop different 3D background models and simulating various UAV imaging perspectives, the proposed algorithm generates synthetic aerial images that closely replicate real-world conditions. Examples of these synthesized backgrounds are shown in the
Section 6.
3.3. Virtual Image Generation
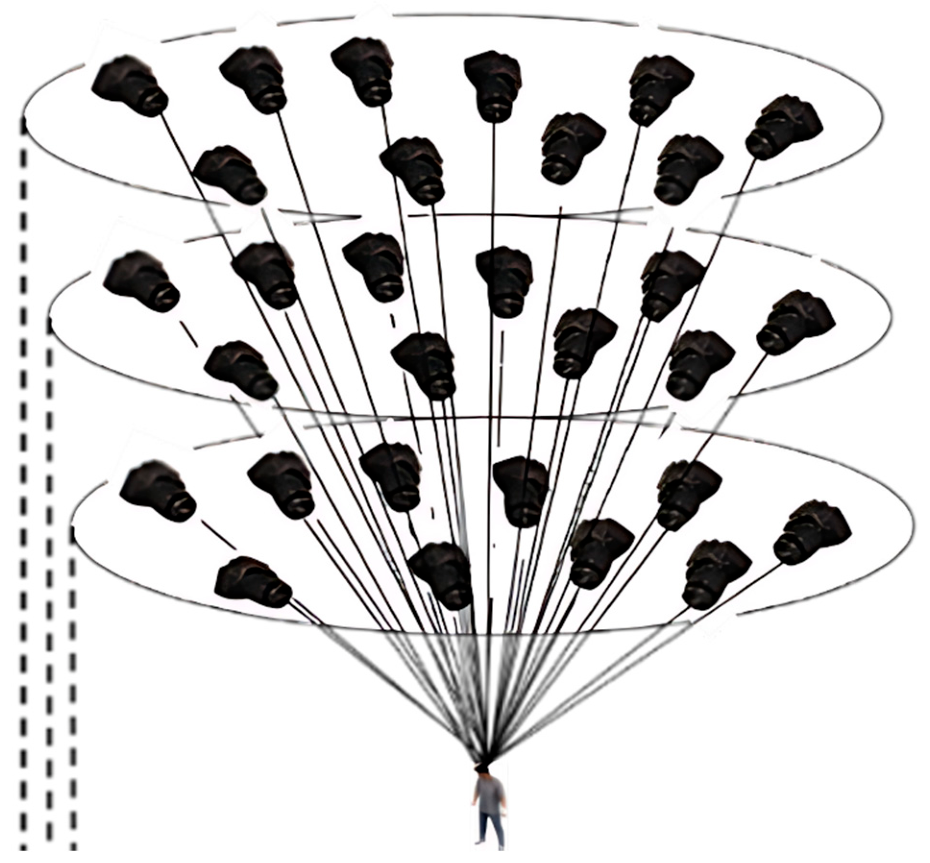
Once the 3D models of the human body and earth elements are generated via photogrammetry, we place them in a virtual environment designed for generating artificial images. 3ds Max 2022 software is used for rendering since it allows for the precise positioning of objects, cameras, and lighting. The 3D earth model is positioned as a background while the 3D human model vertically stands on the ground in a natural position. Subsequently, we create a multicamera virtual setup. The cameras are positioned at different heights and angles around the human model (
Figure 2). This ensures that all parts of the subject’s body are completely covered by the cameras. The cameras obtain body images at different levels (horizontal-vertical) and in various modes. To simulate drone flight, the camera height during photoshoots is adjusted from low (5–10 m above the ground) to high levels (20–30 m). This means that the angles, elevations, and image depths change. The more image backgrounds there are, the better the model can learn different distances of a person from the camera. The cameras are set to obtain particular views of the human model, which also include the hidden parts. Each virtual camera is calibrated according to real drone cameras’ parameters (focal length, sensor size, image resolution). This step is necessary to make sure the synthetic images resemble actual drone images.
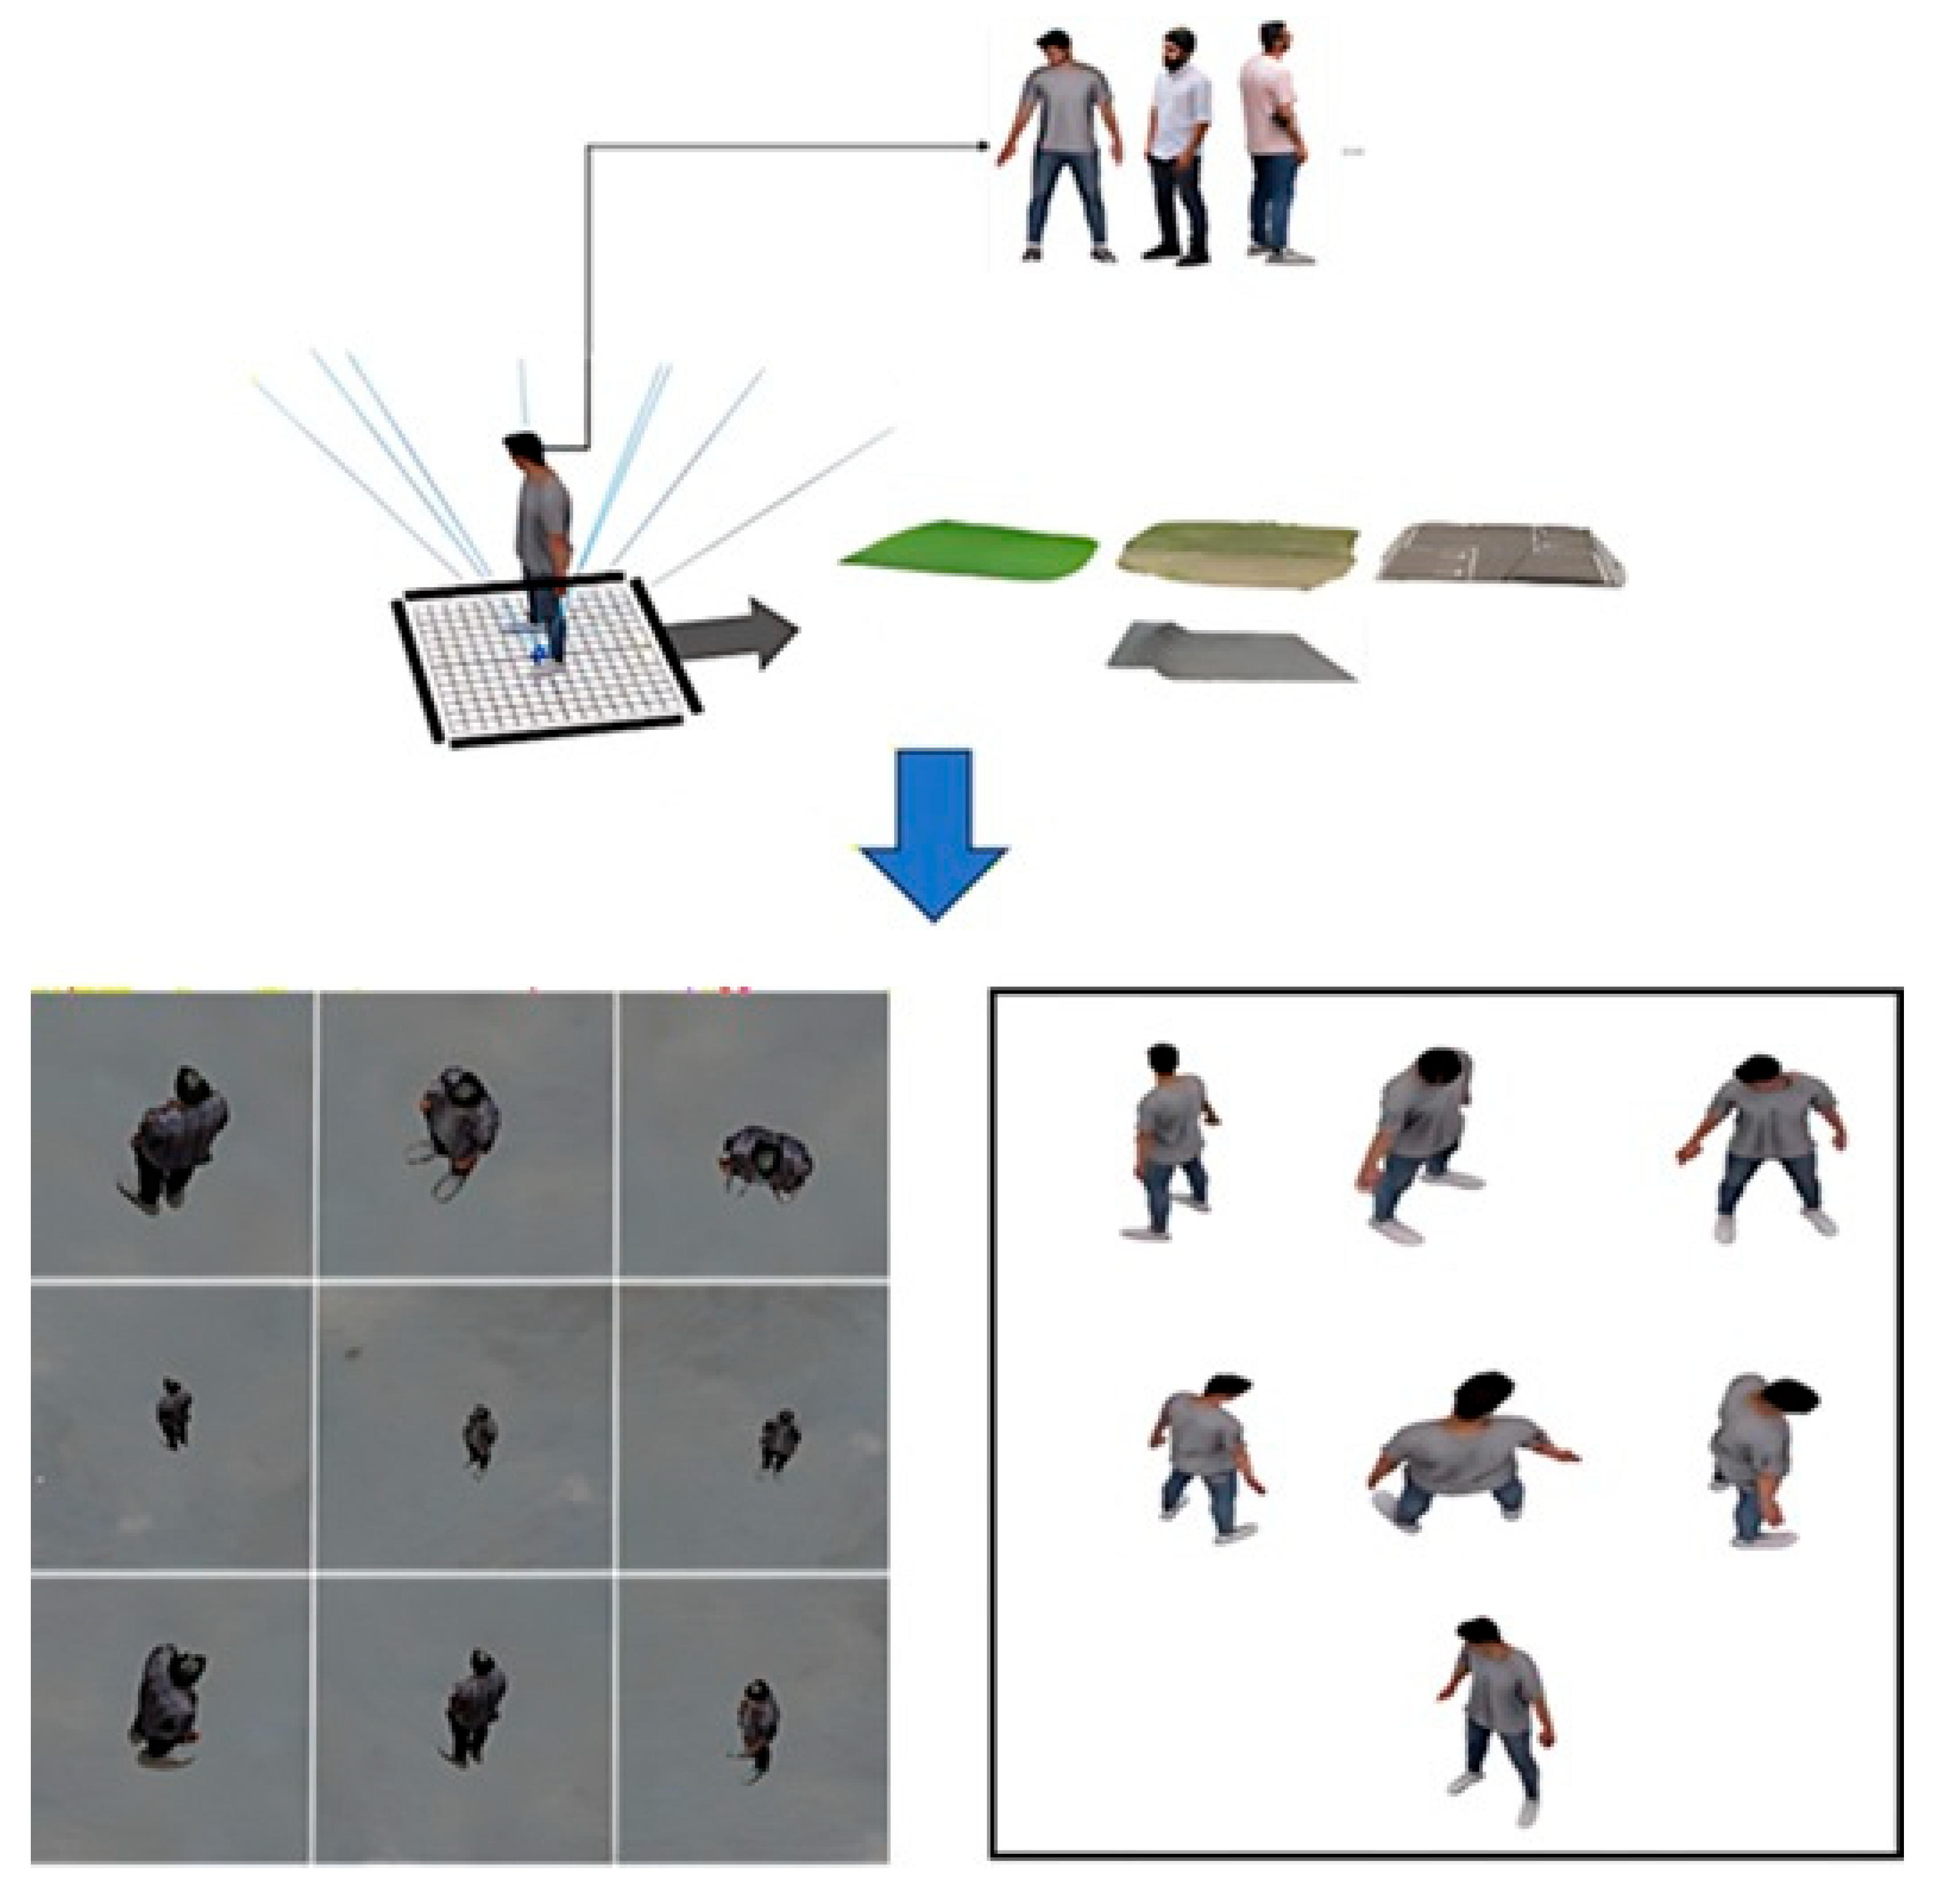
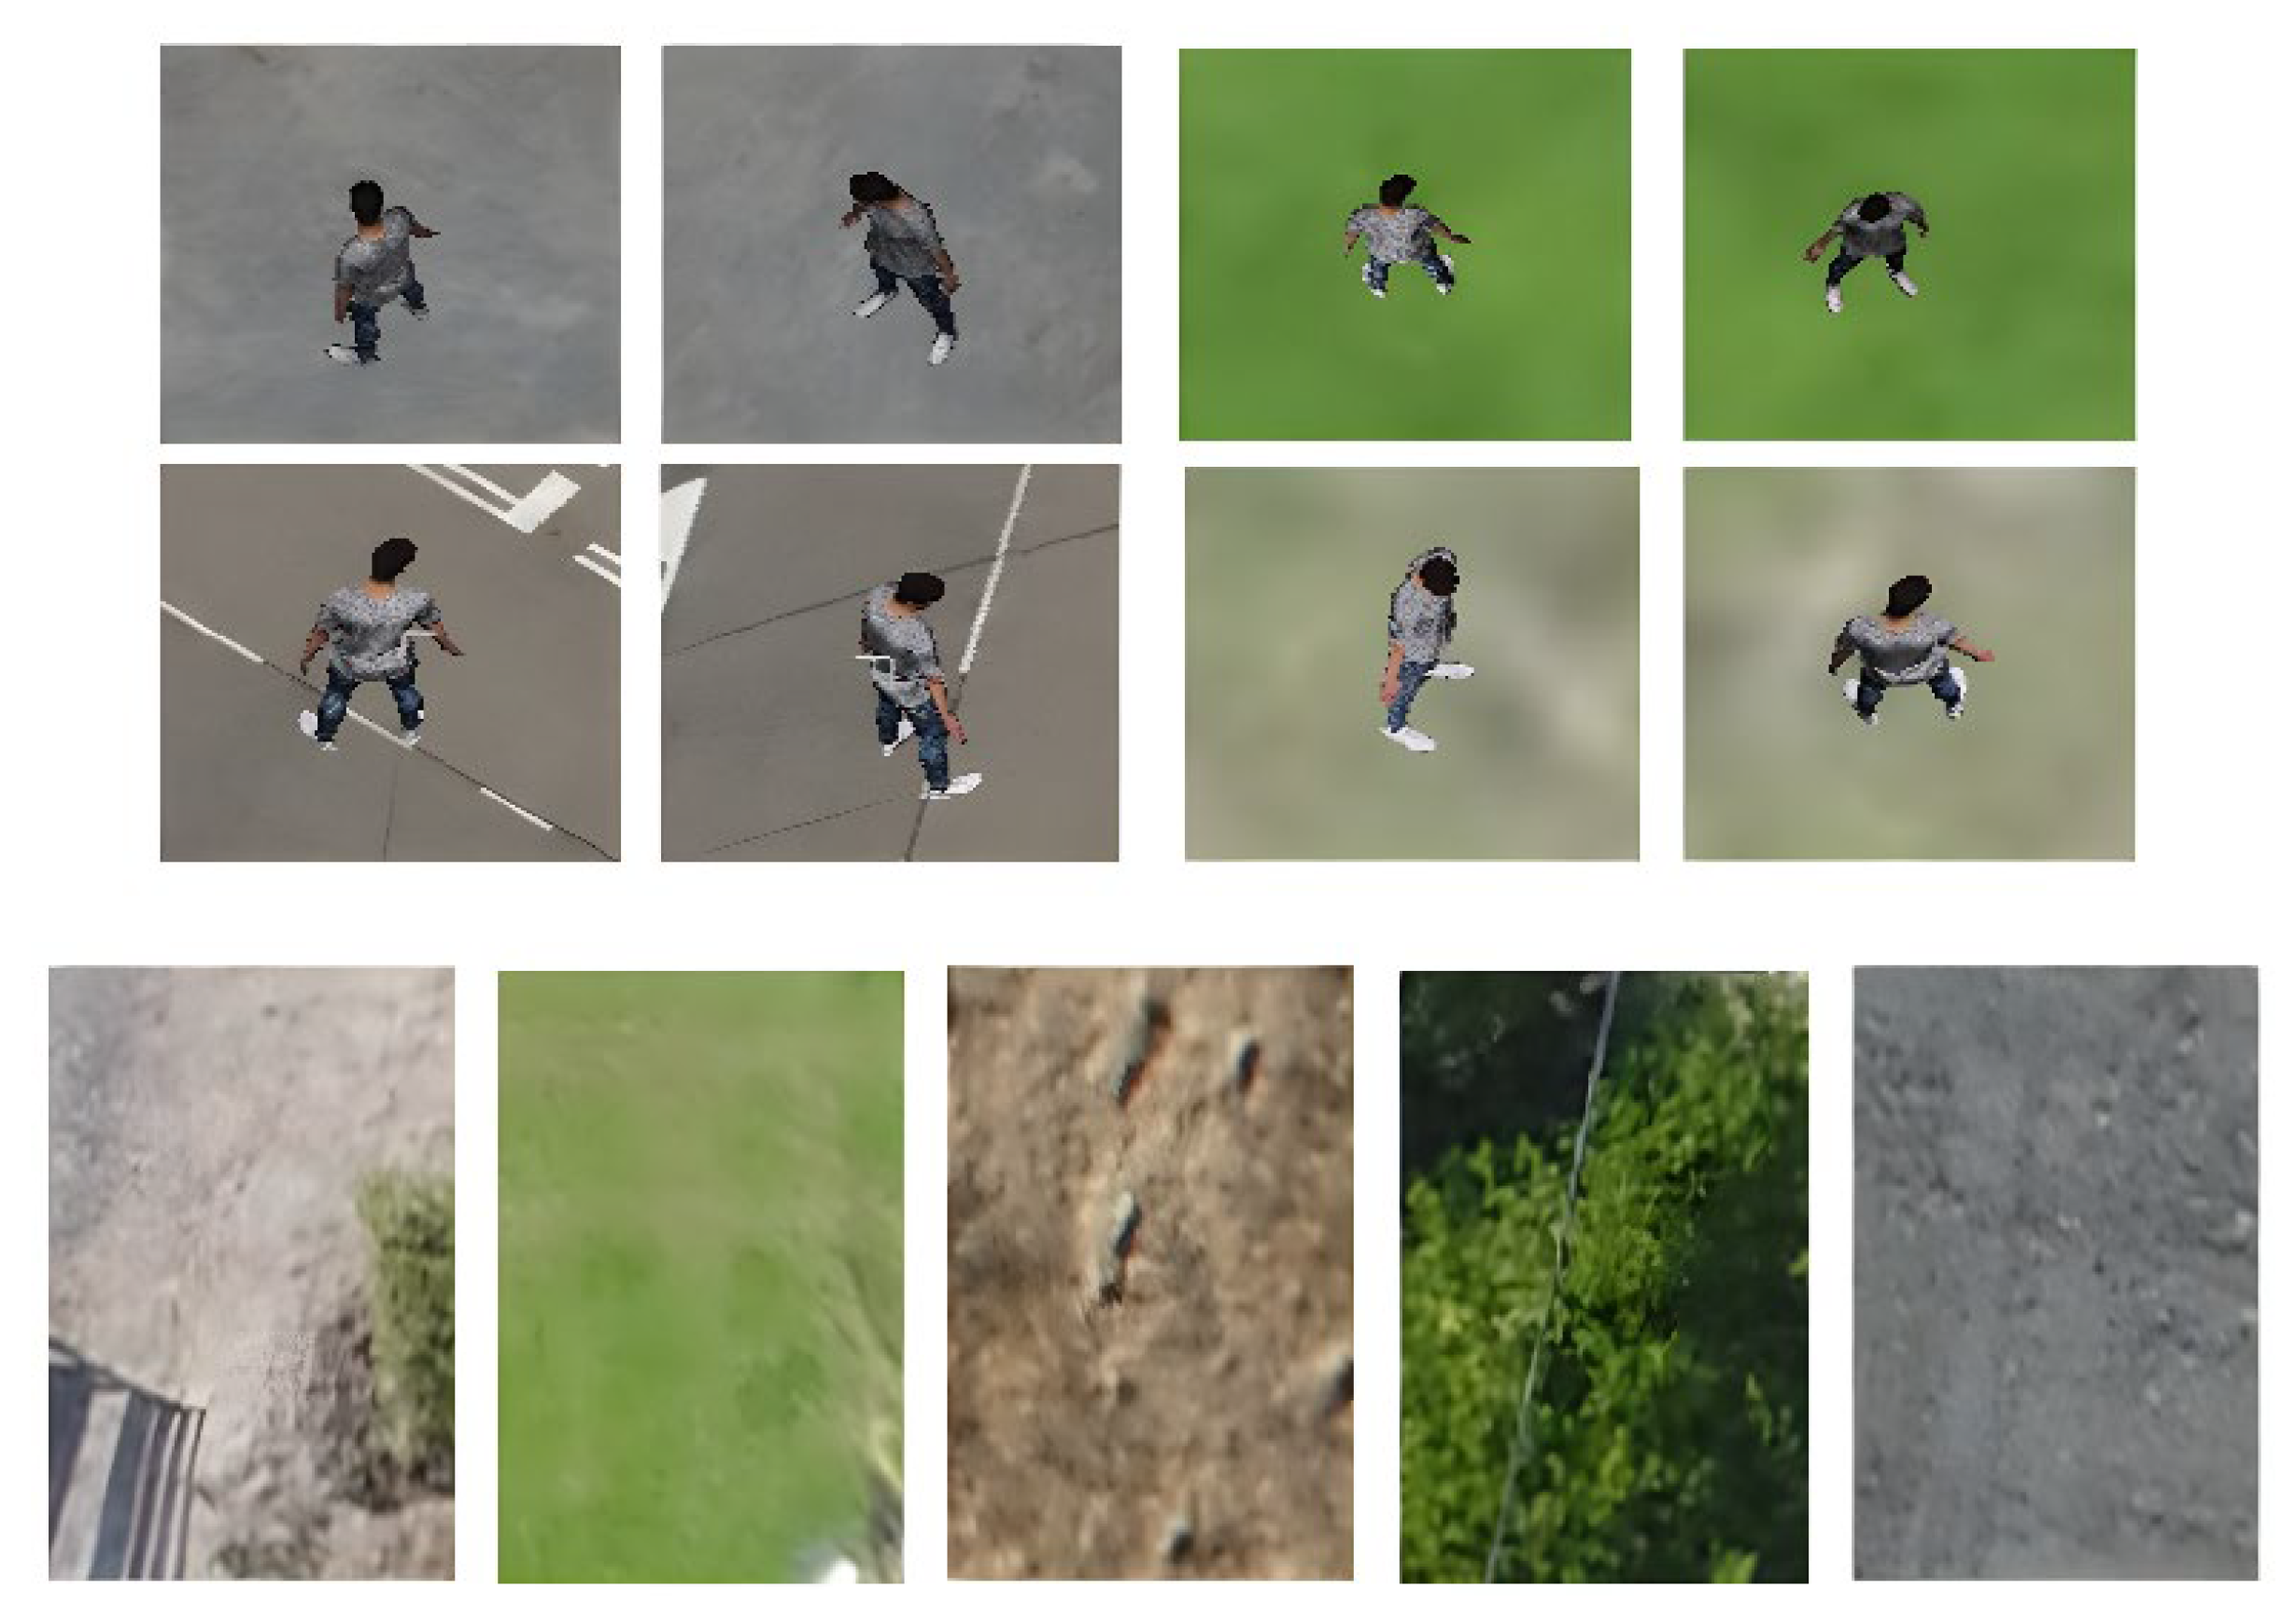
After positioning the cameras, the scene is rendered from each camera’s perspective to generate the initial set of images. After the initial batch of images is generated, the background 3D earth model is replaced with another one and a new human model is placed in front of it. This is repeated for all the compounds and human backgrounds, so that diverse human states and environments are included in the dataset. The photos varied in depth perception depending on camera positioning, terrain, and group members’ posing. Lighting parameters are also changed to achieve realistic shadow and brightness interplay. Differences in such elements allow for pixel value changes in images and, thus, lead to an increase in dataset diversity. Examples of artificial images with and without background are shown in
Figure 3. Thereafter, once all the planned background changes are completed, the human model is replaced by a new one, and the process is repeated.
3.4. Image Preparation for Training the Network: Network Input
Following the generation of synthetic images by the proposed 3DG algorithm, an appropriate resizing and formatting procedure needs to be conducted so that they can be fed into the deep learning framework. Specifically, the spatial dimensions of the generated images have to match both the original dataset and the input layer of a deep convolutional neural network. For the human class, synthetic images are generated by combining detailed 3D human models with terrain backgrounds. The models are rendered from different angles to mimic the real situations when humans would be observed from the air. The non-human class is composed of real aerial drone images that do not include any people or human-related objects.
In order to satisfy the dimensional requirements of the input images to the network, several portions (crops) are taken from the original high-resolution drone images. The cropped areas are selected to be entirely free of human content, yet contain the diversity and complexity present in real-world scenes. This is to make sure that images are correctly sized and accurately labeled with respect to their relevant classes.
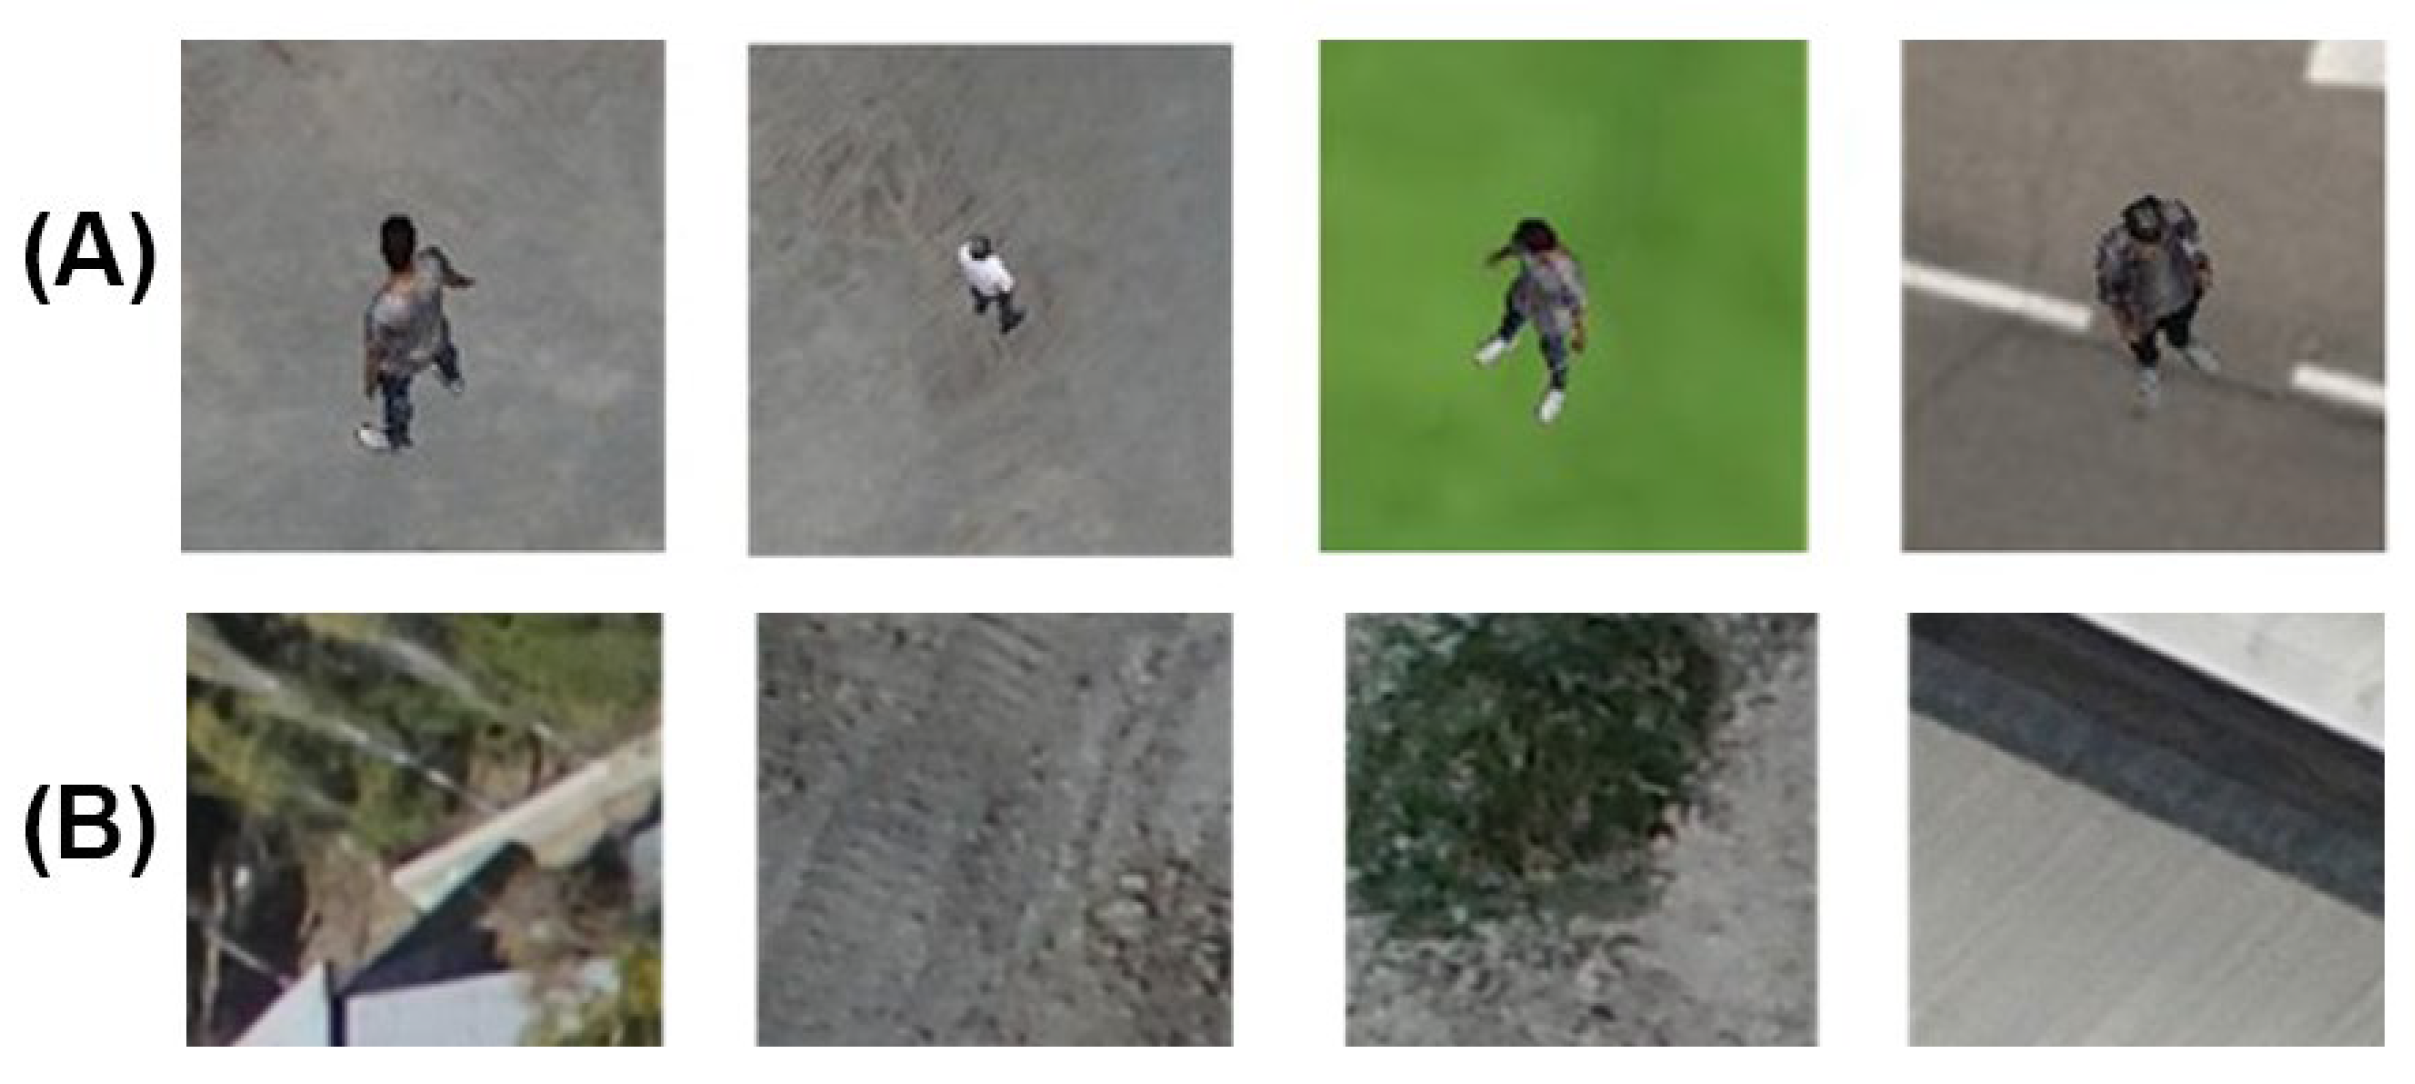
Figure 4 shows examples of some 3DG images, which were generated with various 3D models prepared and formatted for input into the convolutional neural network.
In the following section, we first present the evaluation dataset. We, then, outline the architecture and key components of the baseline convolutional neural network we used to perform the assessments. Finally, we report and analyze a series of experiments designed to evaluate the impact of integrating the data generated by the proposed algorithm.
4. Datasets
As mentioned earlier, three sets of images were used in the experiments: the baseline set, the set generated by general data augmentation techniques, and the set generated by our approach. The section below describes the datasets we used and how we obtained or generated them. Base images refer to the dataset used in the initial experiment to train, evaluate, and test the network model. This dataset comprises 4000 image patches (
Table 1) divided into two classes: human and non-human.
The images were selected from a larger collection captured in nadir view by a Phantom 4 Pro drone across multiple projects. The data were acquired from a variety of regions, including urban and semi-urban environments, encompassing diverse terrain types such as bare soil, green spaces, and asphalt surfaces. Of the total image patches, 2000 belong to the human class and 2000 to the non-human class. From this dataset, 2800 images were allocated for training, 600 for evaluation, and 600 for testing.
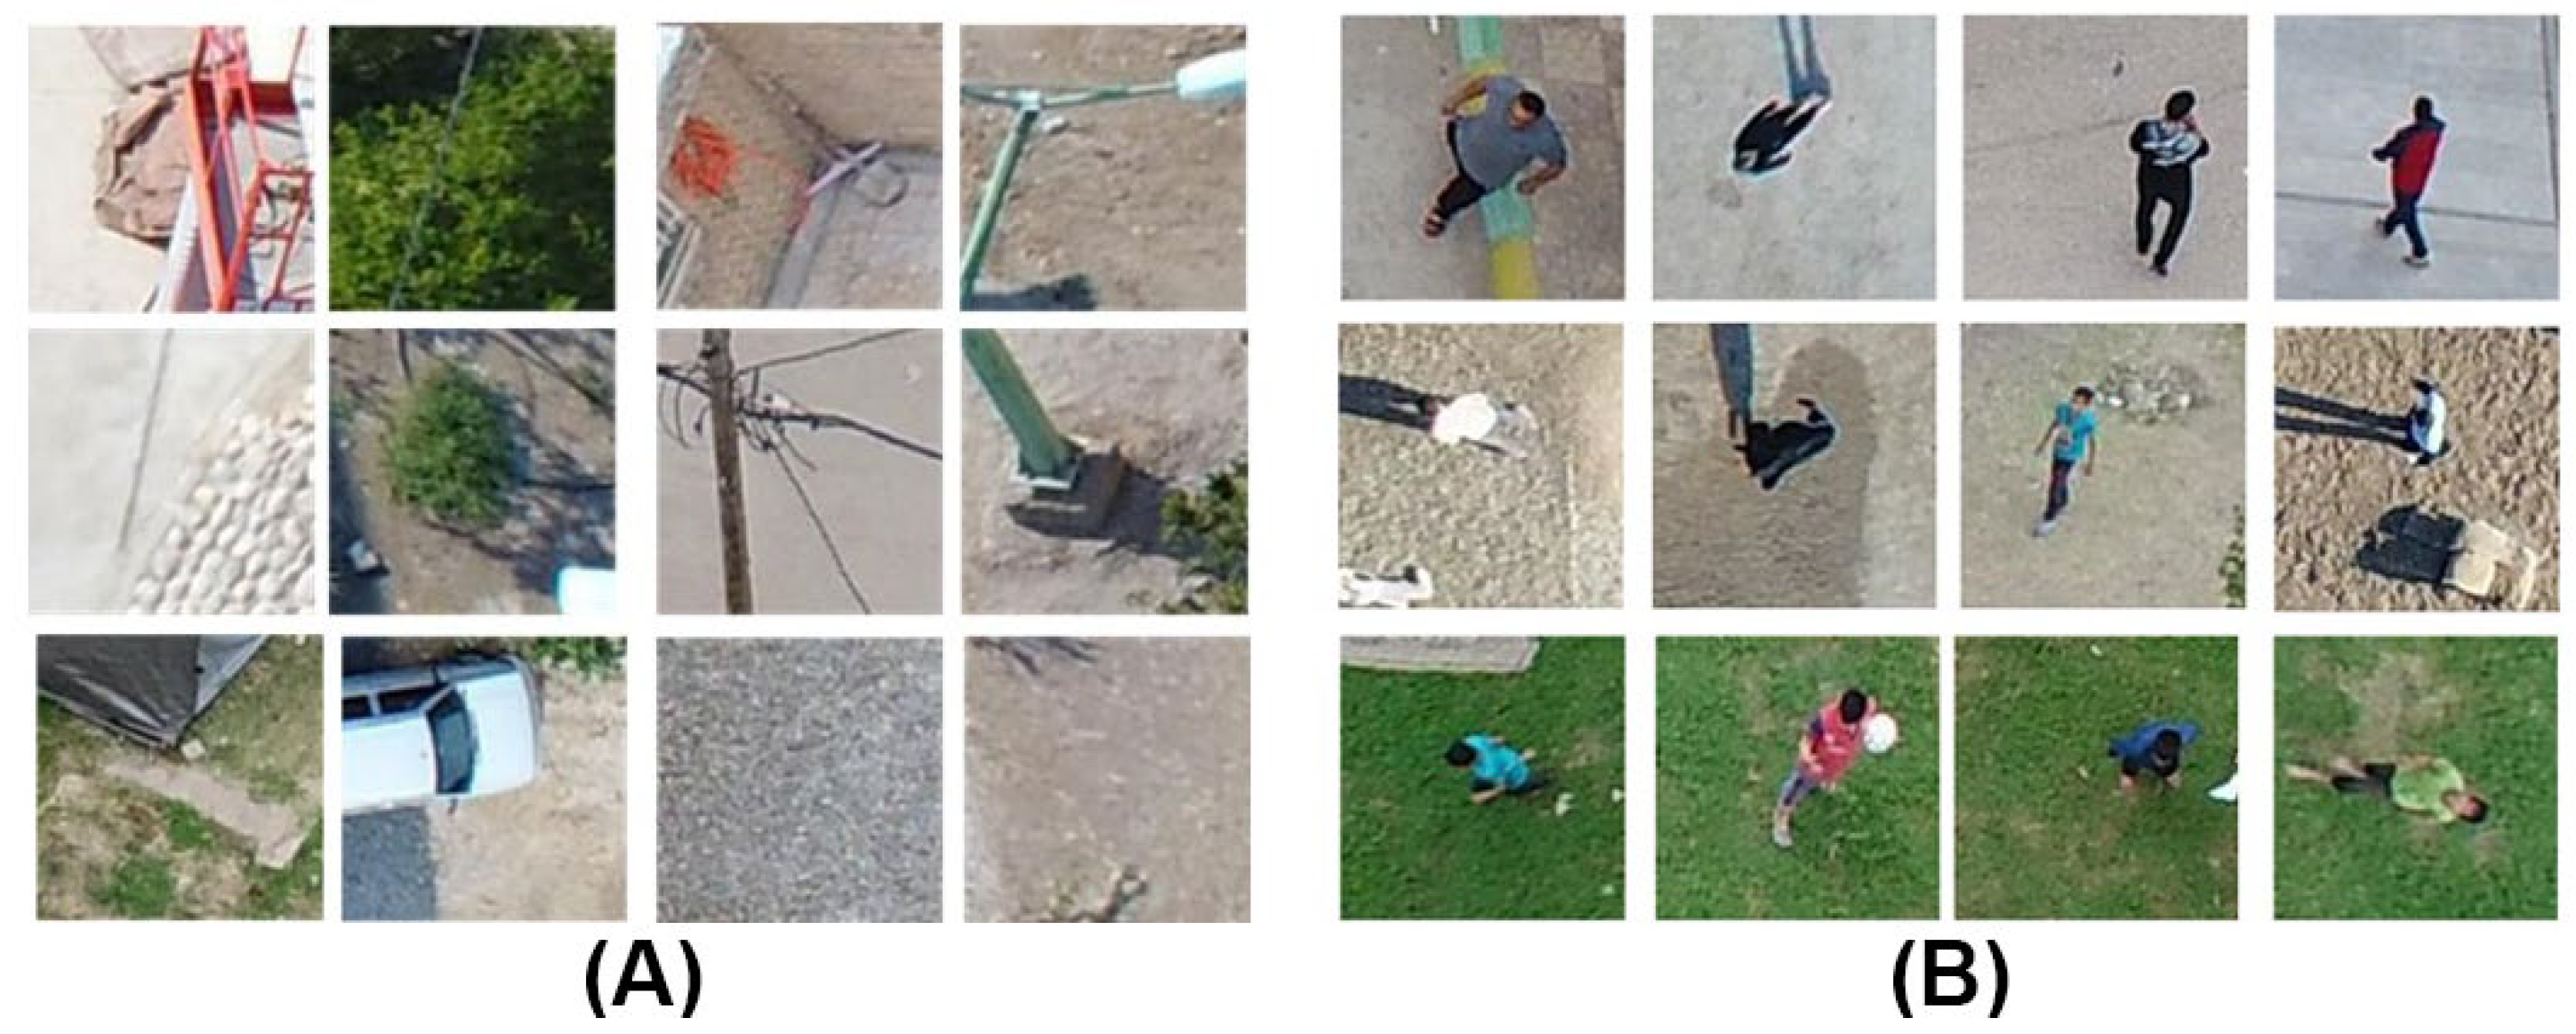
Figure 5 presents representative samples from both classes. It is important to note that the evaluation and test images remained consistent throughout all experiments, as they were sourced from the designated evaluation and test subsets of the baseline dataset. As seen in
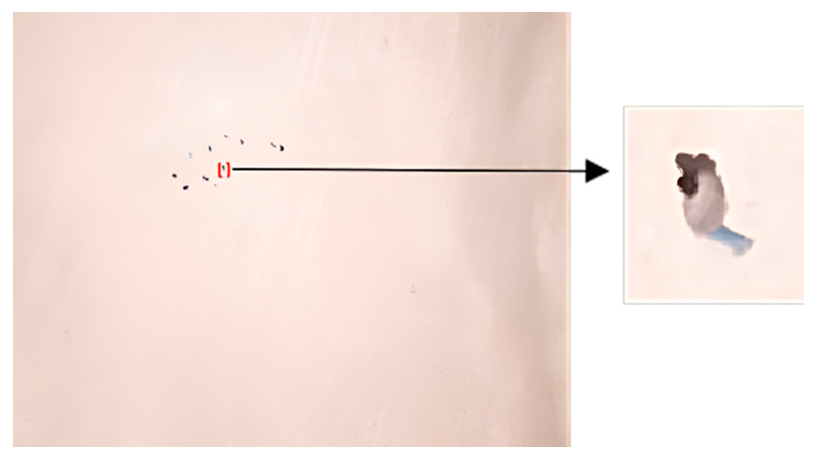
Figure 5B, efforts were made in selecting baseline images to capture humans from oblique angles. It is worth noting that all patches were manually extracted from the original images (
Figure 6). The project specifications from which these images were captured are shown in
Table 1. It is important to mention that in the baseline data, the human images are complete, with all humans appearing upright in the images, and the images were captured vertically. Additionally, in the baseline data, humans are not obscured by other objects such as trees, buildings, or vehicles. However, in some samples (
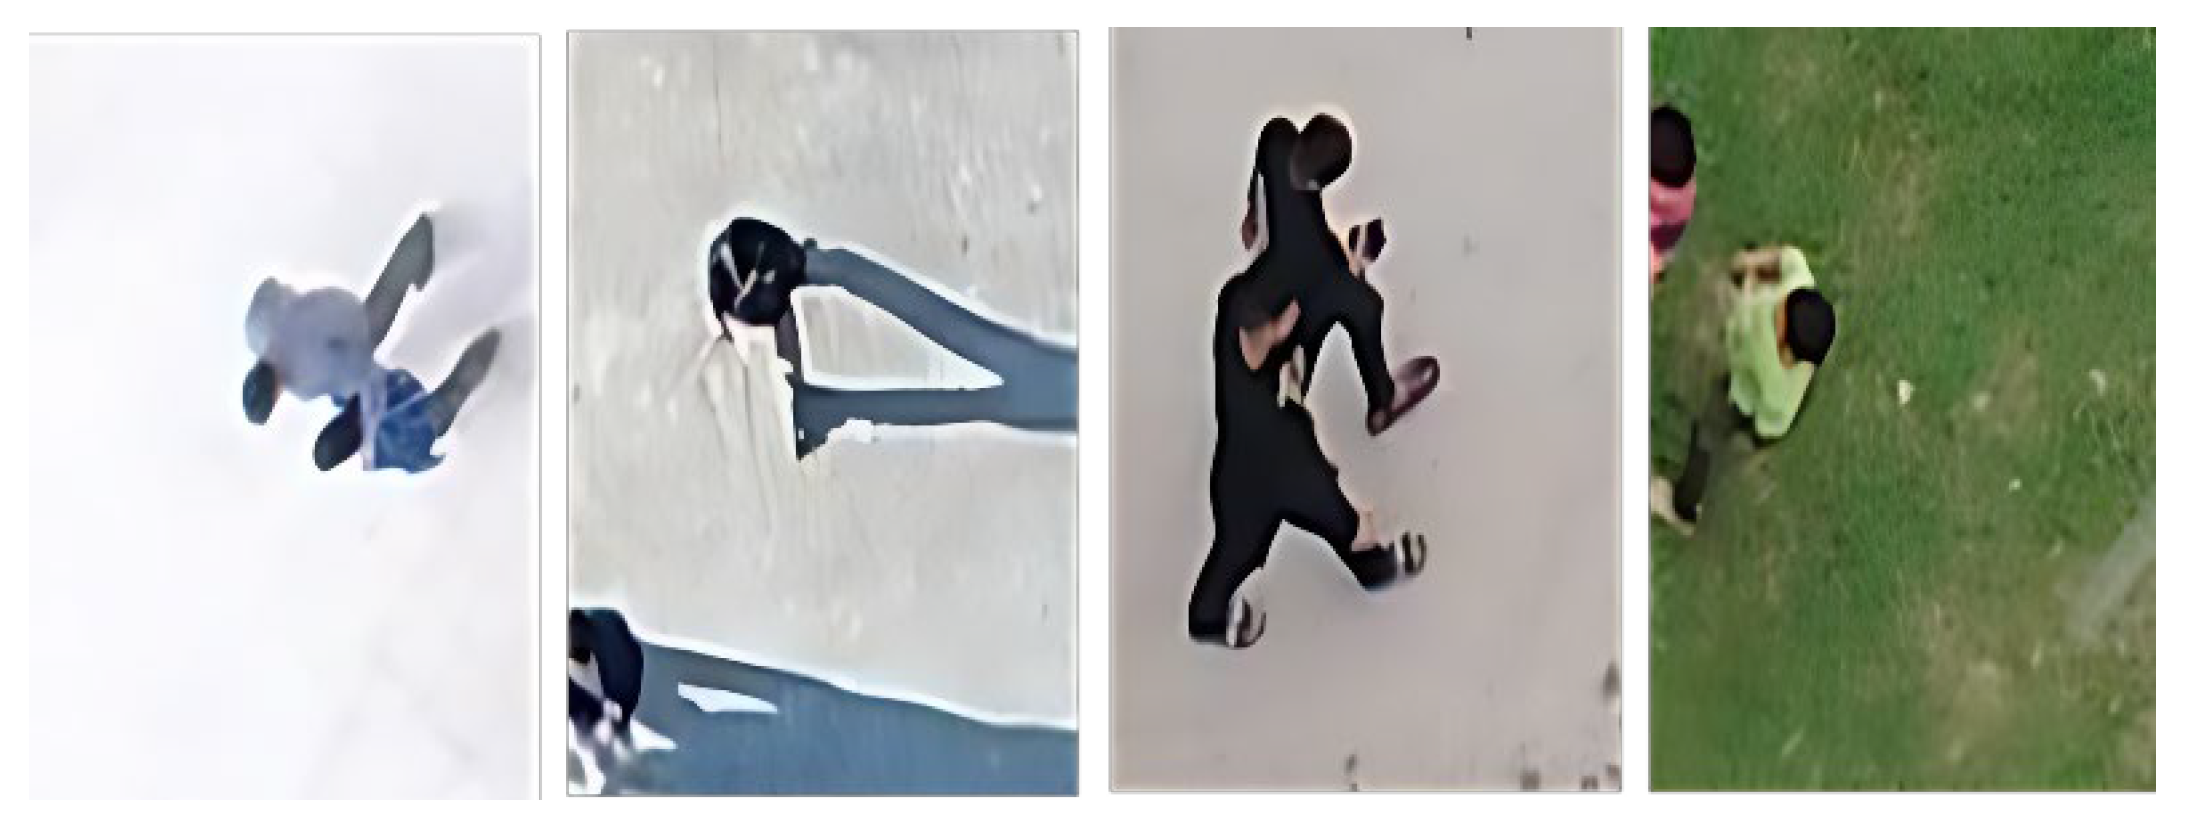
Figure 7), some humans are positioned close to each other. The collected data includes both male and female subjects, and the dimensions of the image patches making up this dataset for both classes are 128 × 128 pixels.
In addition to the base dataset, we created and used several datasets using conventional as well as proposed methods. The following sections provide details on the data produced in each method.
4.1. Images Generated Using Conventional Data Augmentation Techniques
As mentioned in previous sections, various augmentation methods exist for generating new data. Naturally, the impact of new data generated by different methods on the network’s accuracy varies. In this paper, among the available methods, the commonly used data augmentation techniques of rotation, translation, scaling, and flipping were employed. Since these methods can be applied under different conditions, in this paper, each of them was applied with different values to the baseline images, and new images were generated. As previously mentioned, the total number of base images is 4000, of which 2800 images were used for training. To create the augmented image datasets, each original training patch is systematically transformed using a specific augmentation method (such as rotation, translation, scaling, or flipping).
Table 2 shows the resulting number of patches, where the number in the second column represents the total number of images obtained by multiplying the number of training samples (2800) by each method’s settings variants. For instance, in rotation, every training patch is rotated at seven different angles, resulting in 19,600 new image patches (2800 × 7).
4.2. Images Generated Using the Proposed Algorithm
To generate images using the proposed method, various human models and background images must first be generated, which are then combined to create virtual UAV images. Below are the details.
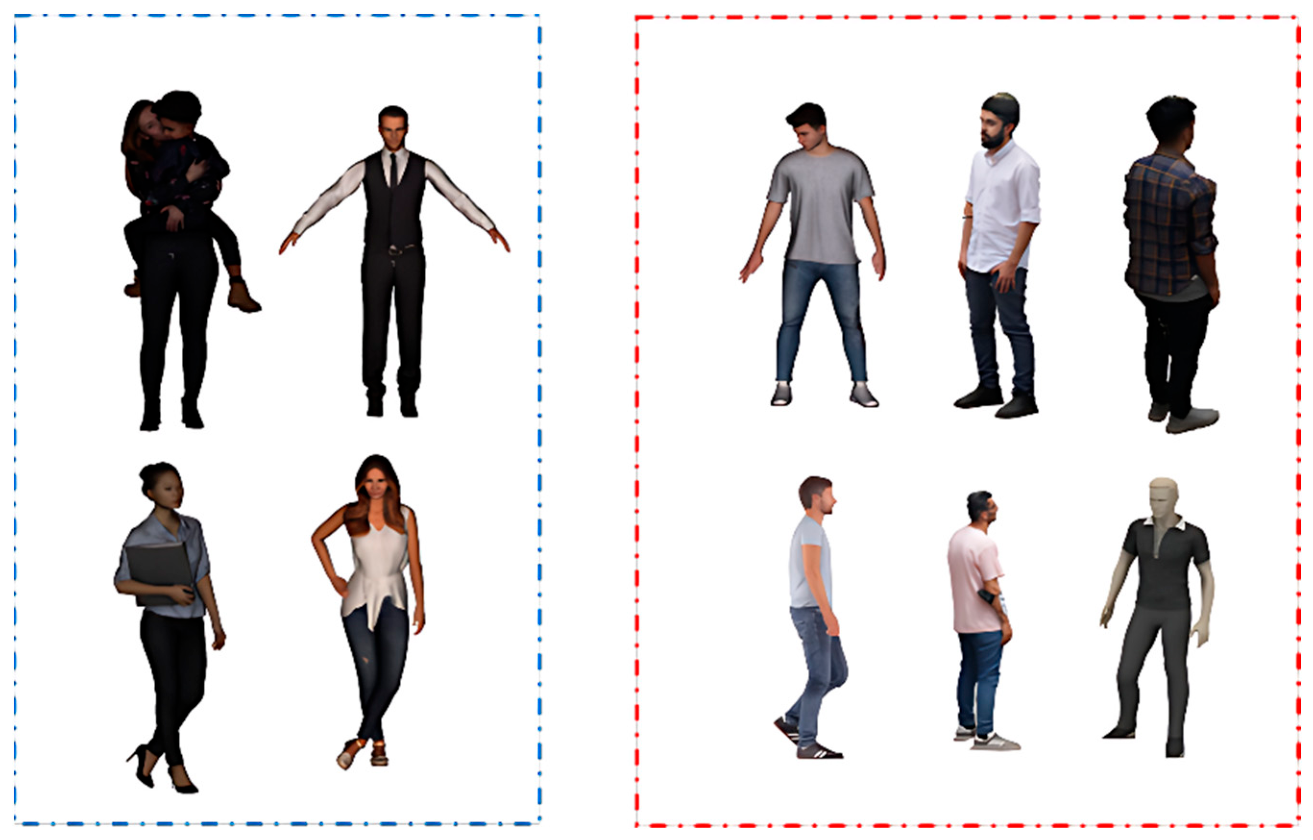
Human model generation: For this purpose, a total of 10 human models (
Figure 8) were employed. Four of these were obtained from publicly available online repositories, while the remaining six were created using photogrammetric reconstruction. Of the photogrammetric models, three were based on real human subjects and the other three on mannequins. Image acquisition for model reconstruction was carried out using a Canon EOS M2 camera, equipped with an 18-megapixel sensor, a 22 mm focal length lens, and a pixel size of 3.4 μm. The photogrammetric processing was performed using Metashape software, version 1.8.5.
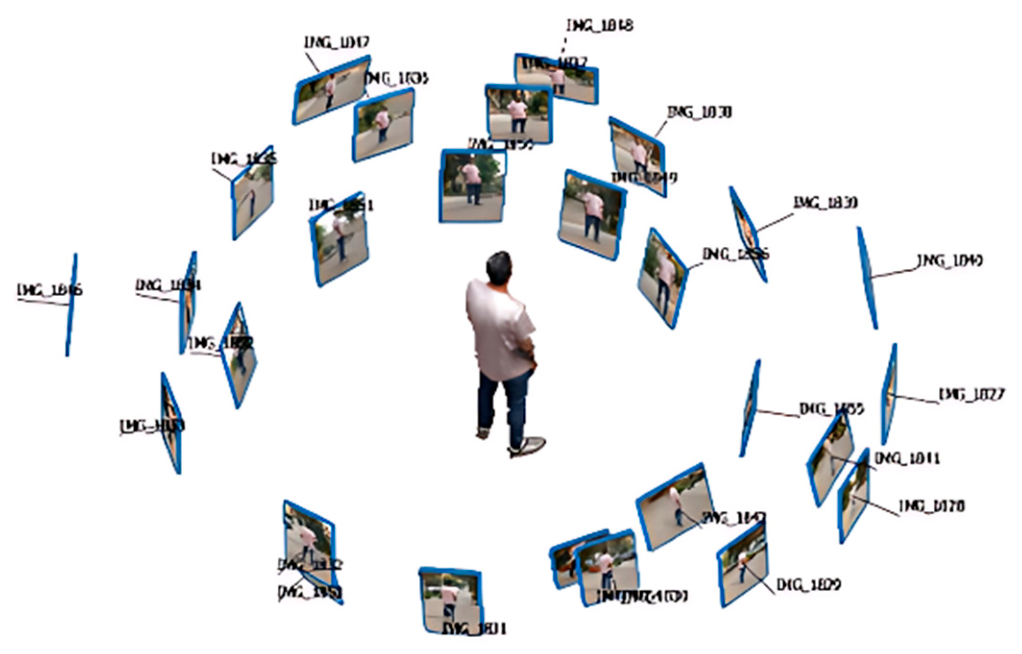
For the mannequin models, 13 to 16 images were captured per subject, sufficient to cover the entire body. In contrast, for real human subjects, 25 to 27 images (
Figure 9) were taken to ensure sufficient coverage while accounting for potential movement during acquisition. To ensure detailed reconstruction and enhance photogrammetric quality, images were captured from an average distance of approximately two meters and from various angles. This approach resulted in an effective ground sampling distance (GSD) of approximately 0.5 mm on the model surface. Due to their static nature, the mannequin models were reconstructed with very high fidelity. However, for real human subjects, involuntary movements posed challenges, occasionally leading to small portions of the models being interpolated, thus introducing minor inaccuracies in those areas.
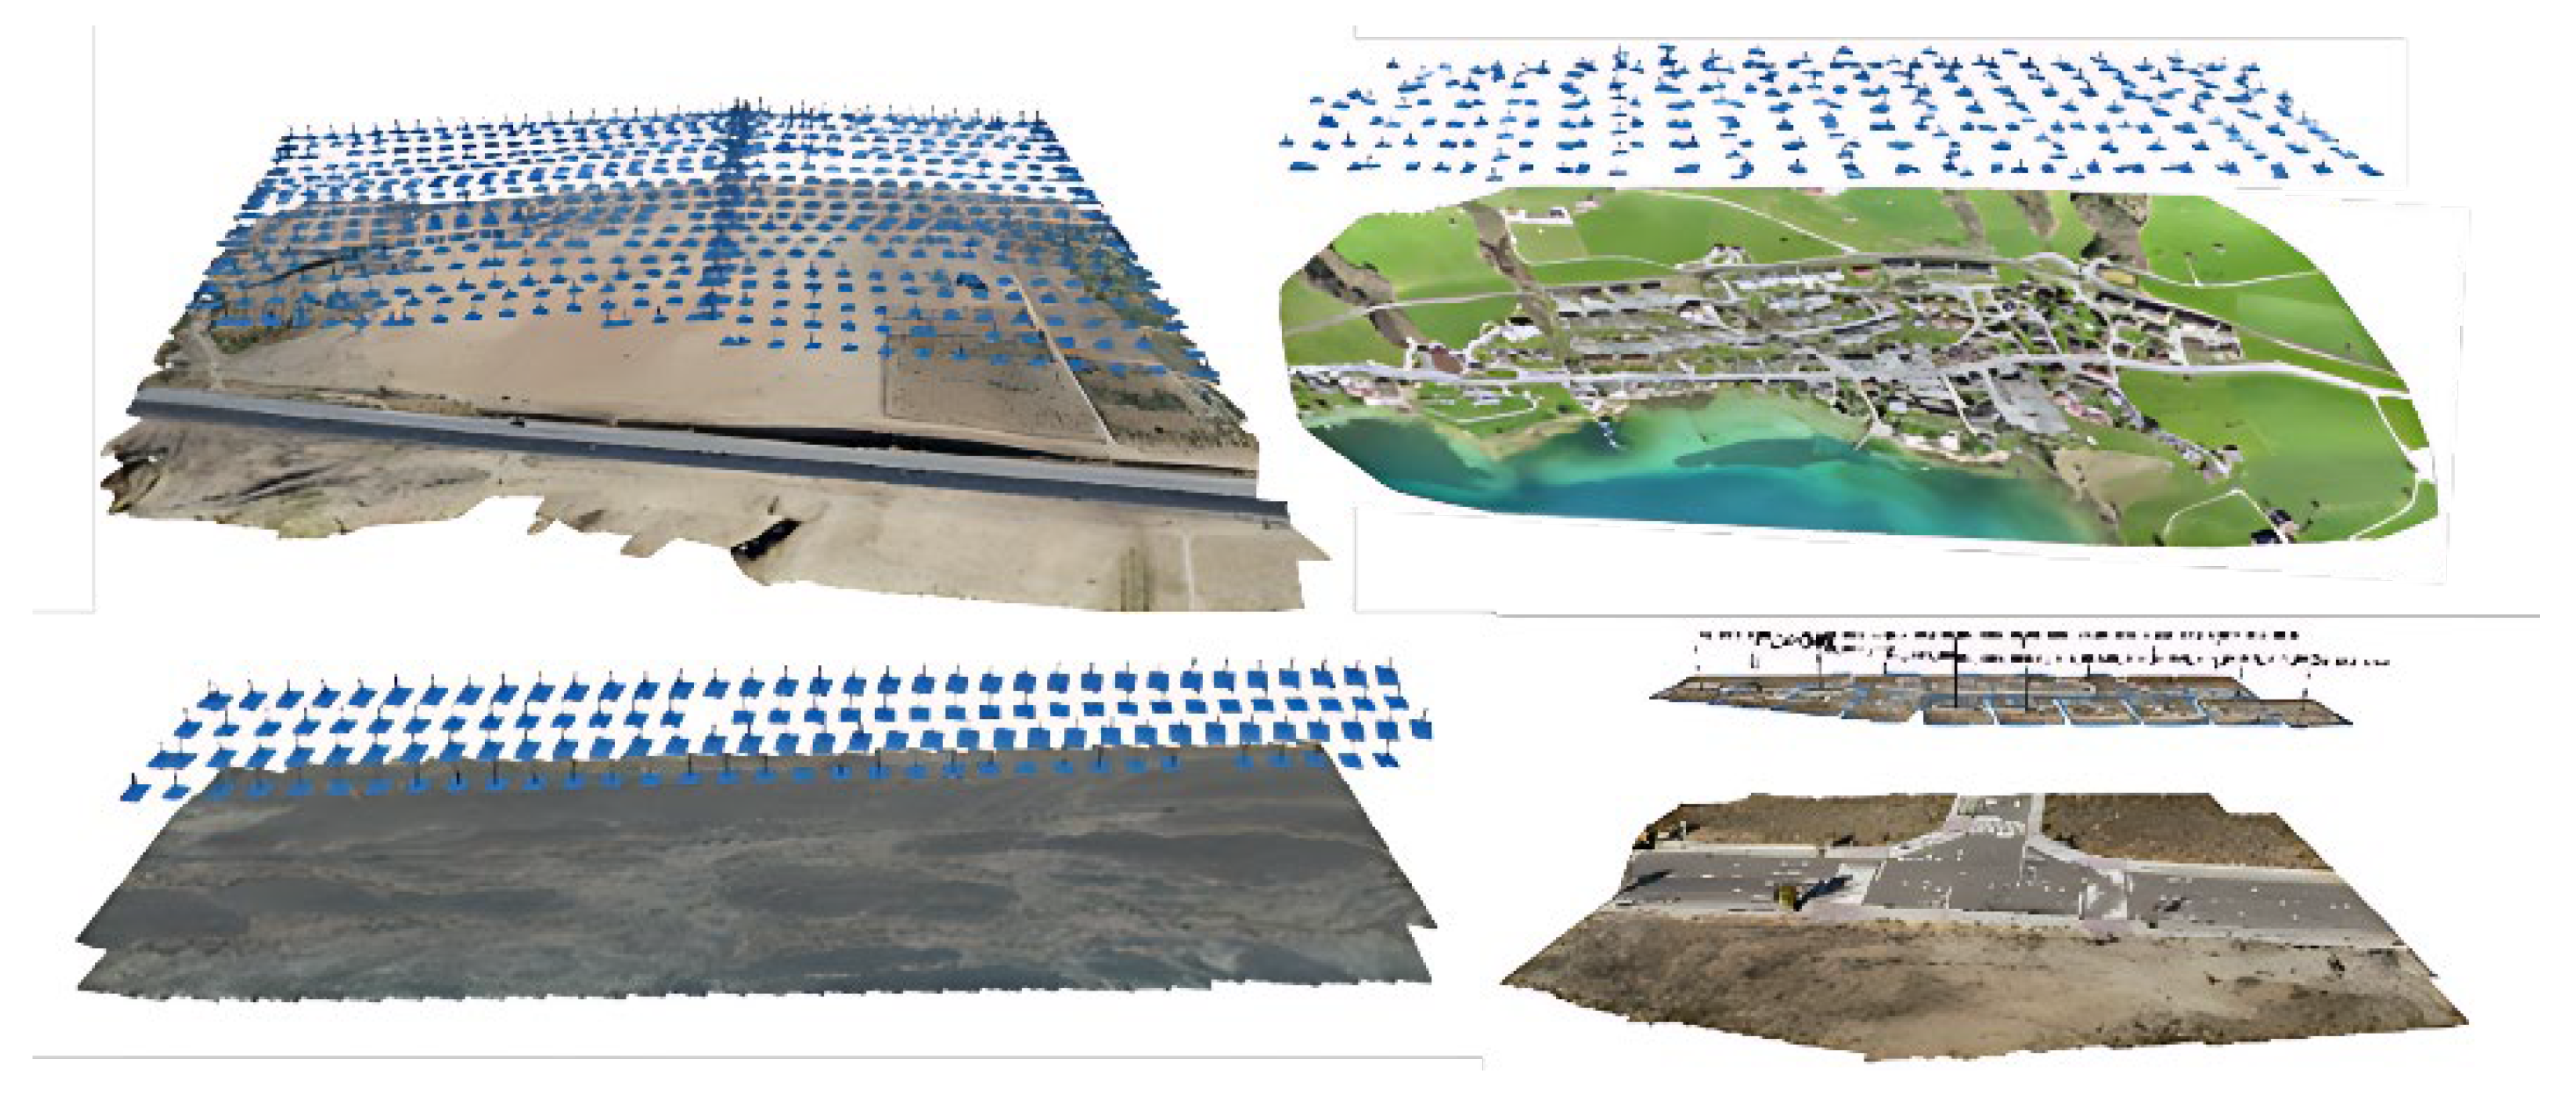
Background image formation: After the 3D human body model was completed, it was essential to build an appropriate 3D ground model as a background. To achieve this, 4 sets of vertical aerial images taken by UAVs in different regions were used. The images were processed in Metashape Professional software, version 1.8.5, to generate the 3D ground model (see
Table 3 and
Figure 10). Specific sections of the model were then selected for use as backgrounds (
Figure 10). Additionally, a uniform gray background image was made and used as the simple background in some of the images.
Generation of Virtual Images: We used 3ds Max software to generate virtual images. In this process, 3D models were created and placed along with 3D background images for human models in the software, as described in the
Section 3. Images from the virtual model were then captured from different viewpoints. A Phantom 4 Pro camera, the same model used to capture the baseline images, was used to simulate the imaging process. Images were captured at three different altitudes, i.e., 60, 50, and 40 m, with 10 images taken at each altitude, separated by 36 degrees in angular spacing. Given that five distinct backgrounds were used, a total of 150 new images were generated for each model. Consequently, the overall number of images produced for the 10 human models and 5 backgrounds was 1500, which were categorized as human-class images.
For the non-human class, an equivalent number of images was extracted from the drone images to generate the 3D background models. These images were resized to match the dimensions of the baseline dataset. Samples of the generated images for the human and non-human classes are shown in
Figure 11.
It should be emphasised that the drone imagery used for background modeling and for generating the non-human 3DG patches is entirely separate from the imagery used to construct the evaluation and test sets. The baseline dataset, from which the fixed validation and test subsets are drawn, was acquired in dedicated urban and semi-urban projects using a Phantom 4 Pro (FC6310) at flight altitudes of 60–80 m (
Table 1). In contrast, the background models, and hence the non-human 3DG crops, were generated from different projects (roads, urban and green spaces, and bare ground) captured in separate flights at altitudes of 120–150 m with different platforms and sensors (
Table 3). Because these two acquisitions share no common source images, there is no overlap between the background-modeling imagery and the test set, and the reported results are therefore free of data leakage from this source.
Table 4 shows a summary of the datasets (image patches) used in our implementations. This table shows the number of patches used for evaluating each augmentation method, as well as the breakdown of each dataset into training, validation, and testing subsets. It should be noted that the numbers in the third column, the total number of image patches for each dataset, are calculated by adding the 4000 original base images with the new images generated by the relevant augmentation method. For example, the 3DG dataset includes 3000 synthetically generated images (1500 human and 1500 non-human) together with the 4000 base images, yielding a total of 7000. Similarly, the rotation dataset is formed by augmenting the original images with 19,600 rotated variants (see
Table 2), resulting in a combined total of 23,600 images (4000 base + 19,600 rotated images). It should be noted that the 3DG without the background dataset comprises 600 synthetic images (300 human and 300 non-human) generated only against plain texture, i.e., without terrain-based backgrounds, which are combined with the 4000 base images, resulting in a total of 4600 images (4000 base + 600 background-free synthetic images).
5. The Base Convolutional Network Model
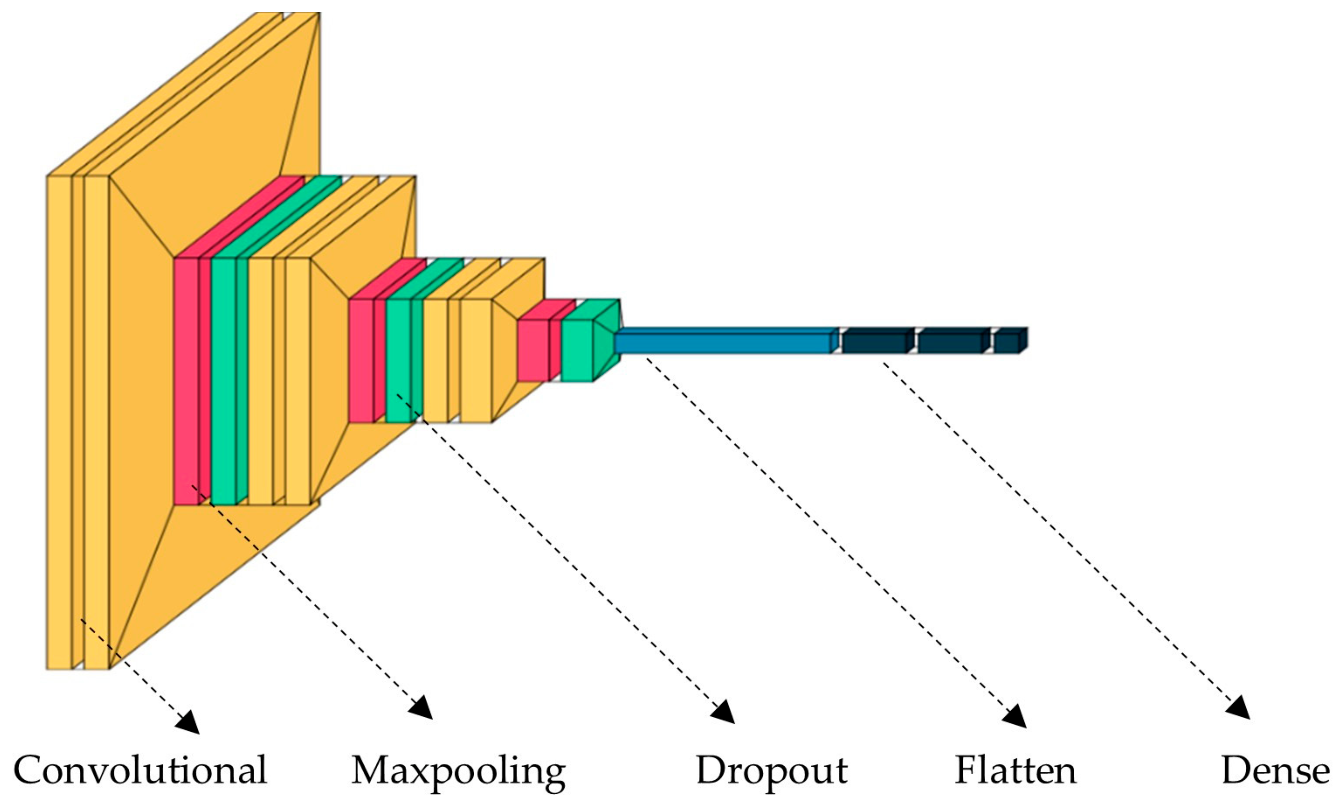
We employed a basic deep neural network model (
Figure 12) to evaluate the impact of the data generated by our method by comparing different scenarios. The values of the hyperparameters are also shown in
Table 5. The model was trained with a batch size of 32 for 100 epochs. A step-decay schedule was applied to the learning rate: starting from an initial value of 0.001, it was halved whenever the validation accuracy did not improve over five consecutive epochs, which helped the model converge more smoothly in the later stages of training.
As seen in
Figure 12, the designed CNN framework has a total of 15 layers. These include six convolutional layers, three max-pooling layers, three dropout layers, and three fully connected (dense) layers. This structure is carefully designed to extract hierarchical features from input images and perform classification. The parameters specific to each layer (filter size, number of filters, dropout rate, activation functions, etc.) were determined through extensive experiments for the purposes of our classification task. The summary of the parameters is presented in
Table 5.
We used the ReLU activation function for the hidden layers and the Adam optimiser for updating the weights and biases because both performed well in similar tasks. To reduce the problem of overfitting, the dropout technique and L2 regularisation were applied. Max pooling of 2 × 2 was used on the convolutional layers. The number of filters and neurons was determined empirically. The final dense layer had one neuron and a sigmoid activation function for binary (human versus non-human) classification, and binary cross-entropy loss was used. Given the small size of the input image, the padding parameter in the convolutional layers was set to “same” to preserve spatial dimensions and prevent a reduction in feature map resolution.
6. Evaluation Results
As stated, we developed a photogrammetry-based data generation algorithm for human detection in drone images. Here, we assess the impact of the data generated by the algorithm on the accuracy of the results. Several models have been compared for evaluation, including:
Baseline model: In this scenario, the model is trained only on original drone-captured images (base images) without including any additional images generated by augmentation methods. The accuracy and performance of this model act as benchmarks for our assessments.
Model trained with images generated by the proposed algorithm: In this case, in addition to base images, model-specific images generated by the proposed algorithm are used for training. The purpose of this model is to see the effects of adding images generated by the proposed algorithm on the base model’s accuracy and performance.
Model trained with images generated by traditional data augmentation methods: In this scenario, besides the base images, the ones obtained from traditional data augmentation techniques (rotation, inversion, translation, and scaling) are employed to train the model. The goal is to compare the results obtained with the model against those from the proposed method.
Model trained with images generated by the proposed algorithm without initial data: The model is trained solely on the images generated by our method. The goal is to evaluate whether the proposed images can help train the model from scratch.
Combining all methods: To evaluate if using all available augmentation approaches will maximize the model’s learning and generalisation capabilities. This aims to test if the combination of data sources results in better learning and retention than when used independently.
In each experiment, the model’s performance is evaluated using several metrics: training accuracy, validation accuracy, training loss, and validation loss. These metrics give an indication of the model’s learning status, convergence, and overfitting. For the test set, we additionally report Precision, Recall, and F1-score to characterise the balance between false positives and false negatives. Because the dataset is balanced by construction, with equal numbers of human and non-human patches in the training, validation, and test sets, specificity coincides with the recall of the non-human class, and the F1-score directly integrates the trade-off between false positives and false negatives. The reported precision and recall, therefore, fully characterise the per-class behaviour of the model. Additionally, the model’s generalisability is examined on the independent test dataset, which reflects how well it performs on unseen data and has practical applicability.
Note: In all figures (
Figure 13,
Figure 14,
Figure 15,
Figure 16,
Figure 17,
Figure 18,
Figure 19,
Figure 20 and
Figure 21), the x axis represents the number of epochs, while the y axis is either accuracy (range 0–1) or the loss error (varied depending on the results). Also, the accuracy and loss curves shown in
Figure 13,
Figure 14,
Figure 15,
Figure 16,
Figure 17,
Figure 18,
Figure 19,
Figure 20 and
Figure 21 correspond to a single representative training run, selected because its final test-set performance was close to the five-run average. The headline performance metrics reported in the tables and text are mean ± standard deviation over five independent runs as detailed in
Table 6 and the
Section 6.6.
6.1. Performance of the Base Network
The base model is the benchmark model in all our experiments. By training the model on original images (without any augmentations), we establish a baseline to which other results will be compared. This approach helps identify model overfitting, understand the general model behavior, and identify gaps in the initial datasets.
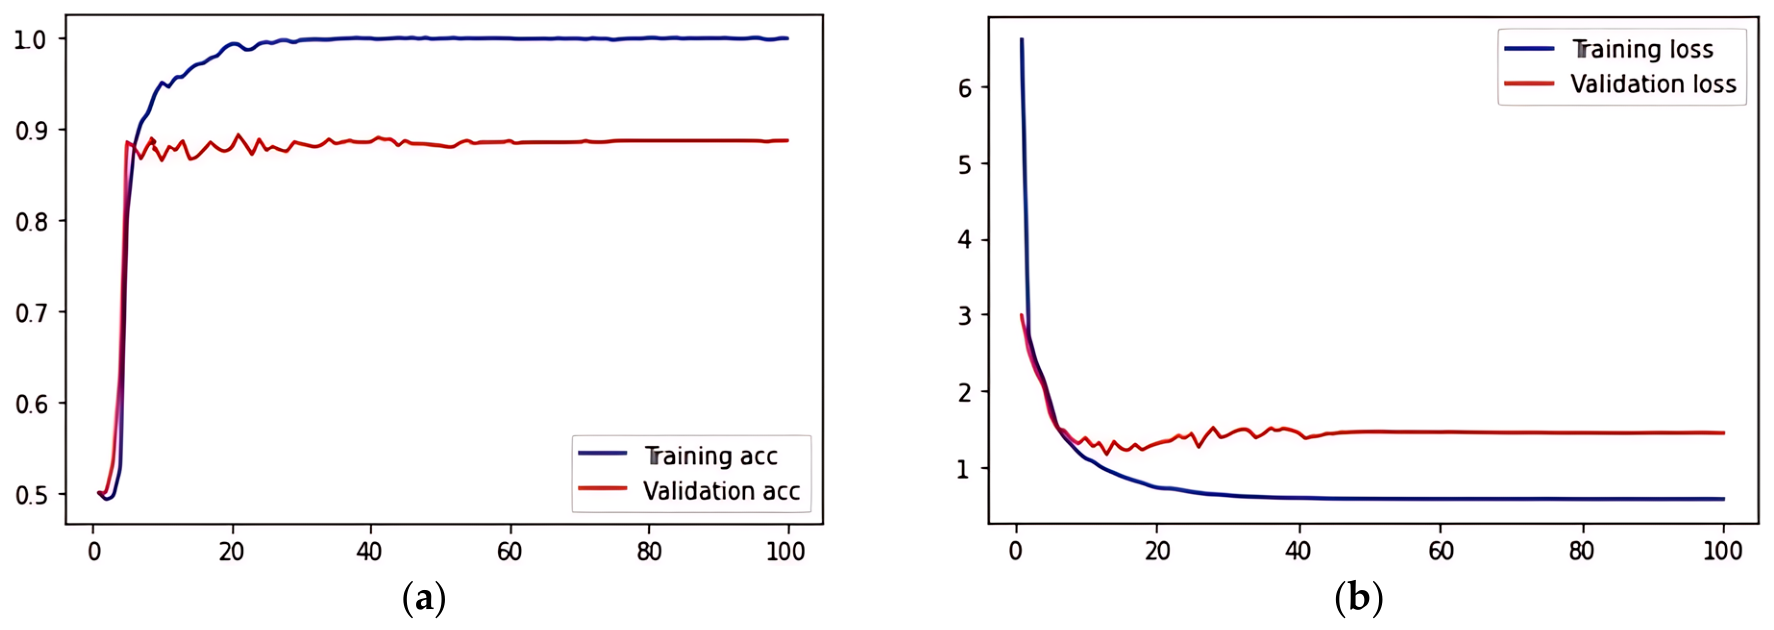
Figure 13 shows the results.
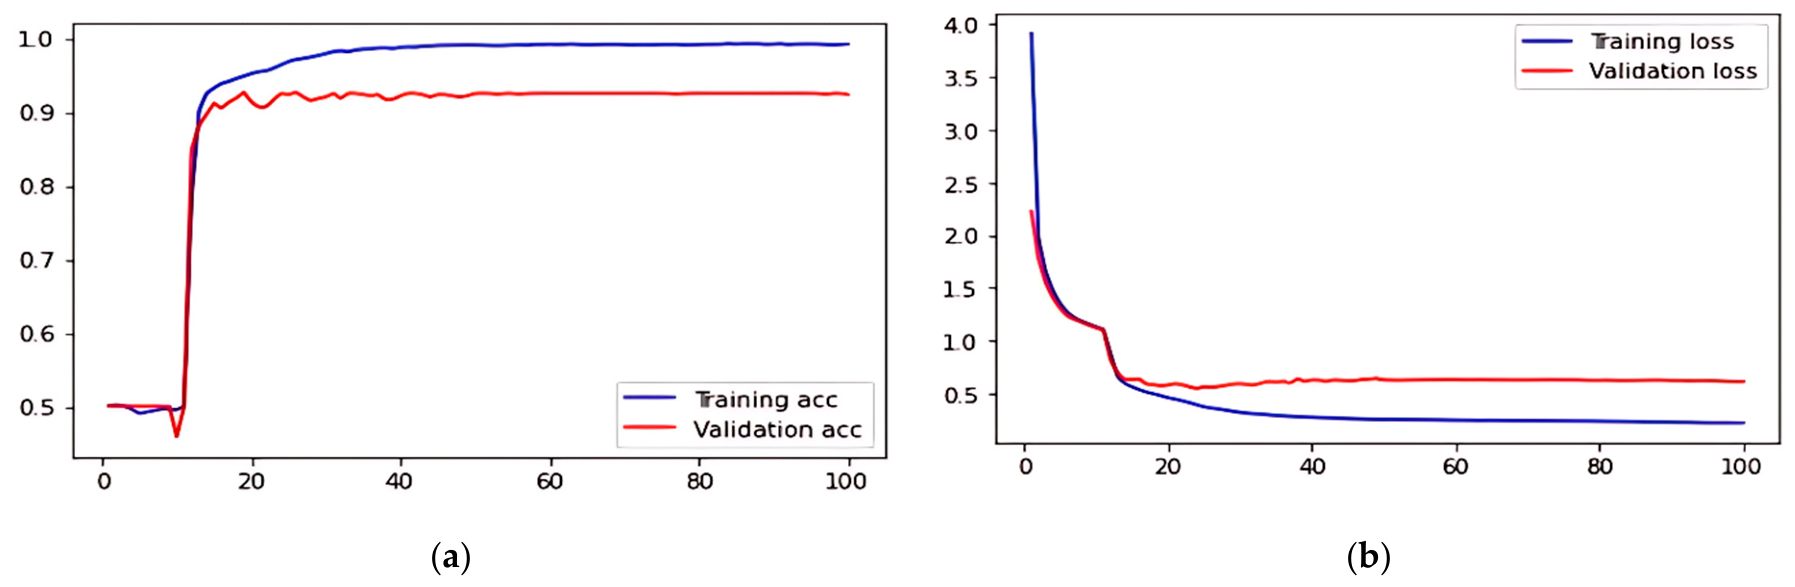
Figure 13a,b show the training and validation accuracy and error curves, respectively. As shown in
Figure 13a, there is a significant increase in validation accuracy from epoch 6 to epoch 21. This indicates that the model effectively learned from the training data in the early phase. However, the validation accuracy remained constant after the 50th epoch, indicating that the model could not improve further. In contrast, training accuracy has continued to rise across all epochs, indicating a potential generalisation issue.
Figure 13b shows the changes in the training and validation loss for the base datasets. The graph indicates that the validation error rate reduced over the first ten epochs, which is a positive sign. However, between epochs 10 and 40, the validation error rate started to rise, indicating that the model was beginning to overfit the training data. After epoch 40, the validation error did not improve any further, even though the training error continued to decrease as the epochs progressed.
The model’s accuracy on the test datasets was found to be 88.04%. When analysing this figure in conjunction with the training and validation error differences, it becomes evident that the base model memorised the base dataset well but struggled to generalise beyond that. The performance differences indicate that the model has likely overfitted, having learned the training data’s characteristics rather than general patterns needed for effective generalisation to new data.
In summary, the findings highlight the base model’s limitations in generalization and the potential benefits of incorporating data augmentation strategies in future experiments.
Figure 13.
Accuracy graph (a) and Loss graph (b) per epoch for the basic network model using the baseline dataset. The x axis represents the number of epochs, while the y axis is accuracy (range 0–1) or the loss error (varied depending on the results).
Figure 13.
Accuracy graph (a) and Loss graph (b) per epoch for the basic network model using the baseline dataset. The x axis represents the number of epochs, while the y axis is accuracy (range 0–1) or the loss error (varied depending on the results).
6.2. Impact of the 3DG on the Base Network
We examined the base network model performance using the 3DG-algorithm images in two scenarios: with background and without background. Testing the model with a background is important for several reasons. First, the background gives clues about the scene’s environment, which helps establish if the model relies on them to differentiate between classes. Second, the model might overfit to the background during training and testing. Studying the results without background also allows one to determine whether the model is memorizing or genuinely learning and generalizing. Finally, model performance in both environments can be assessed and compared, which will improve our understanding of its robustness. A model that performs well without a background is more likely to be robust and generalized.
6.2.1. Evaluation with Background
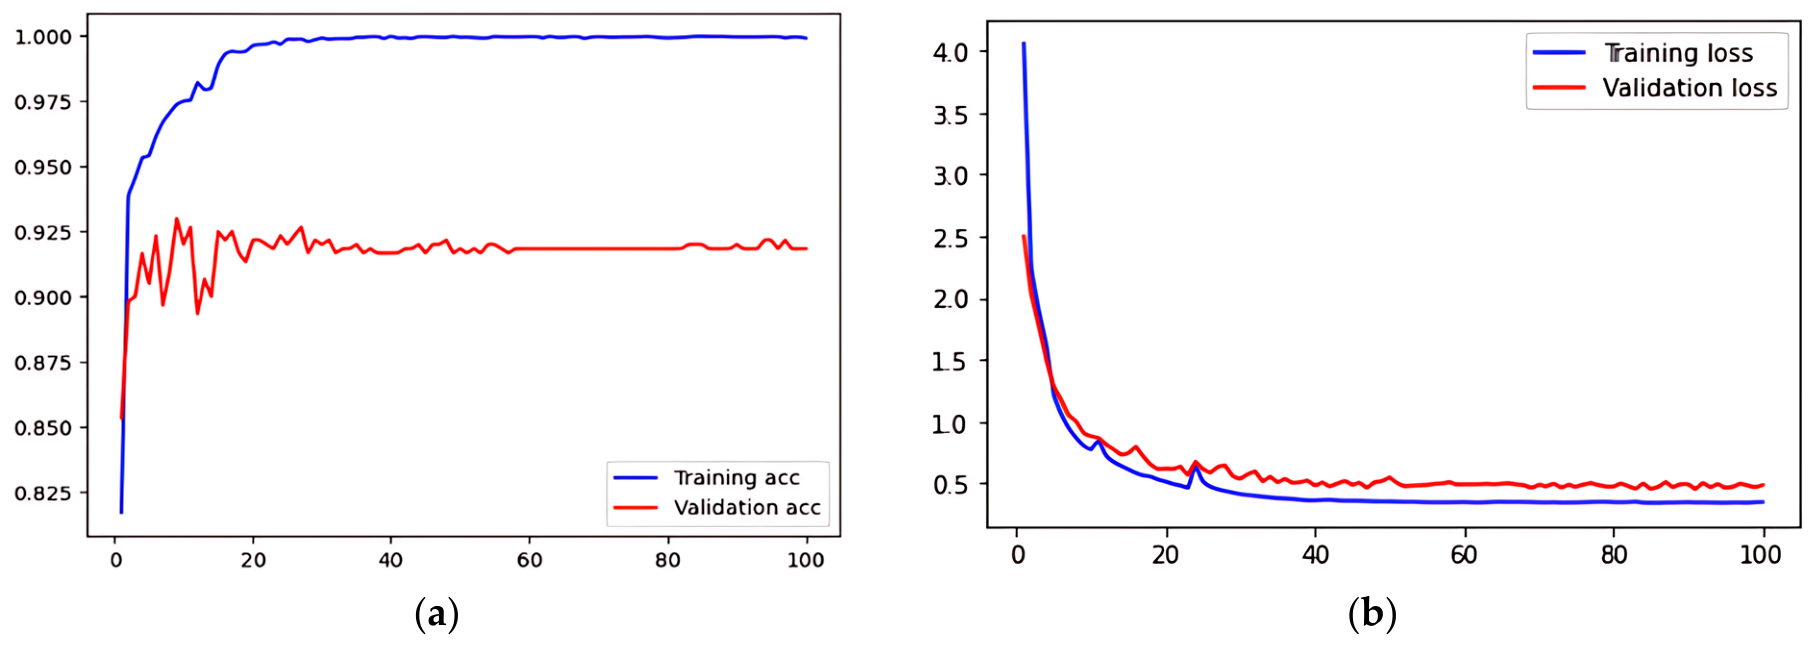
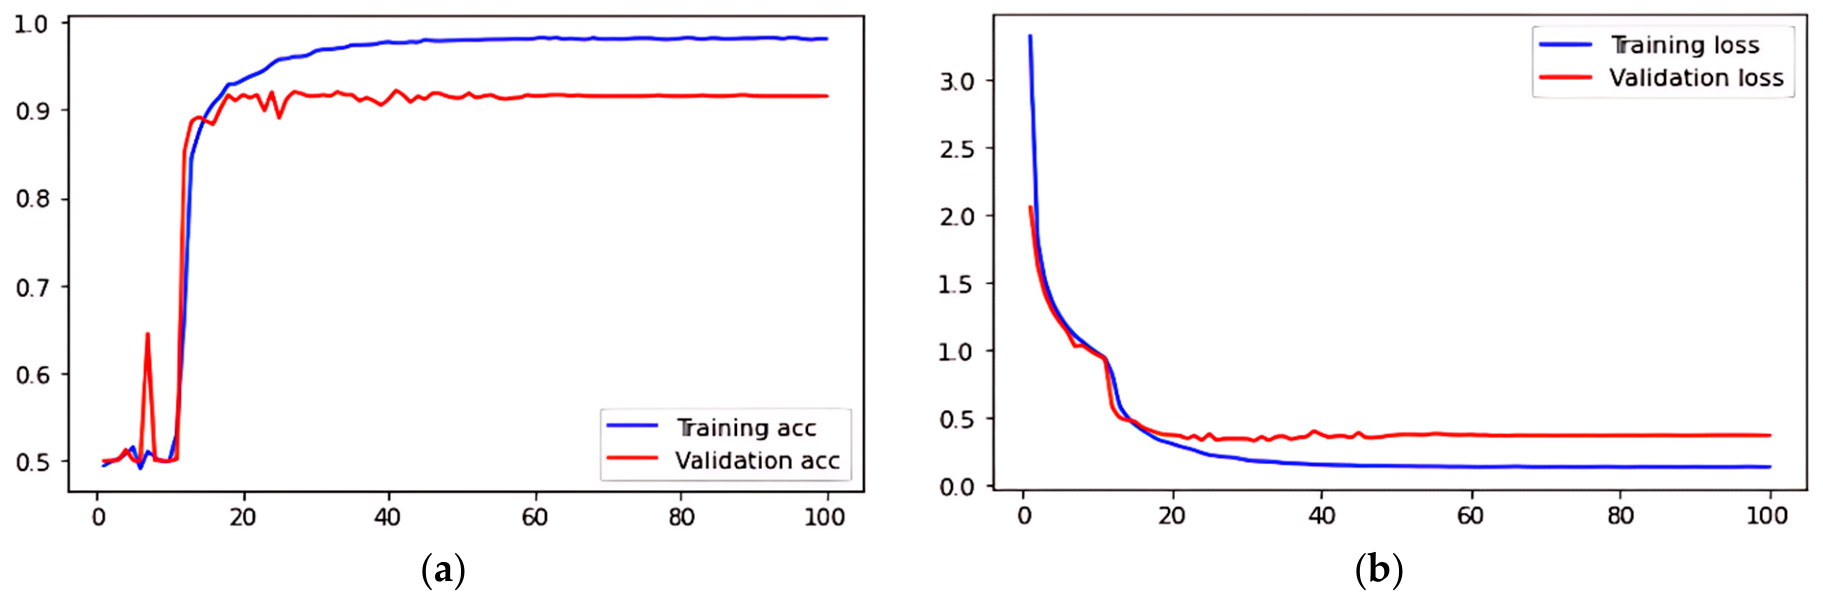
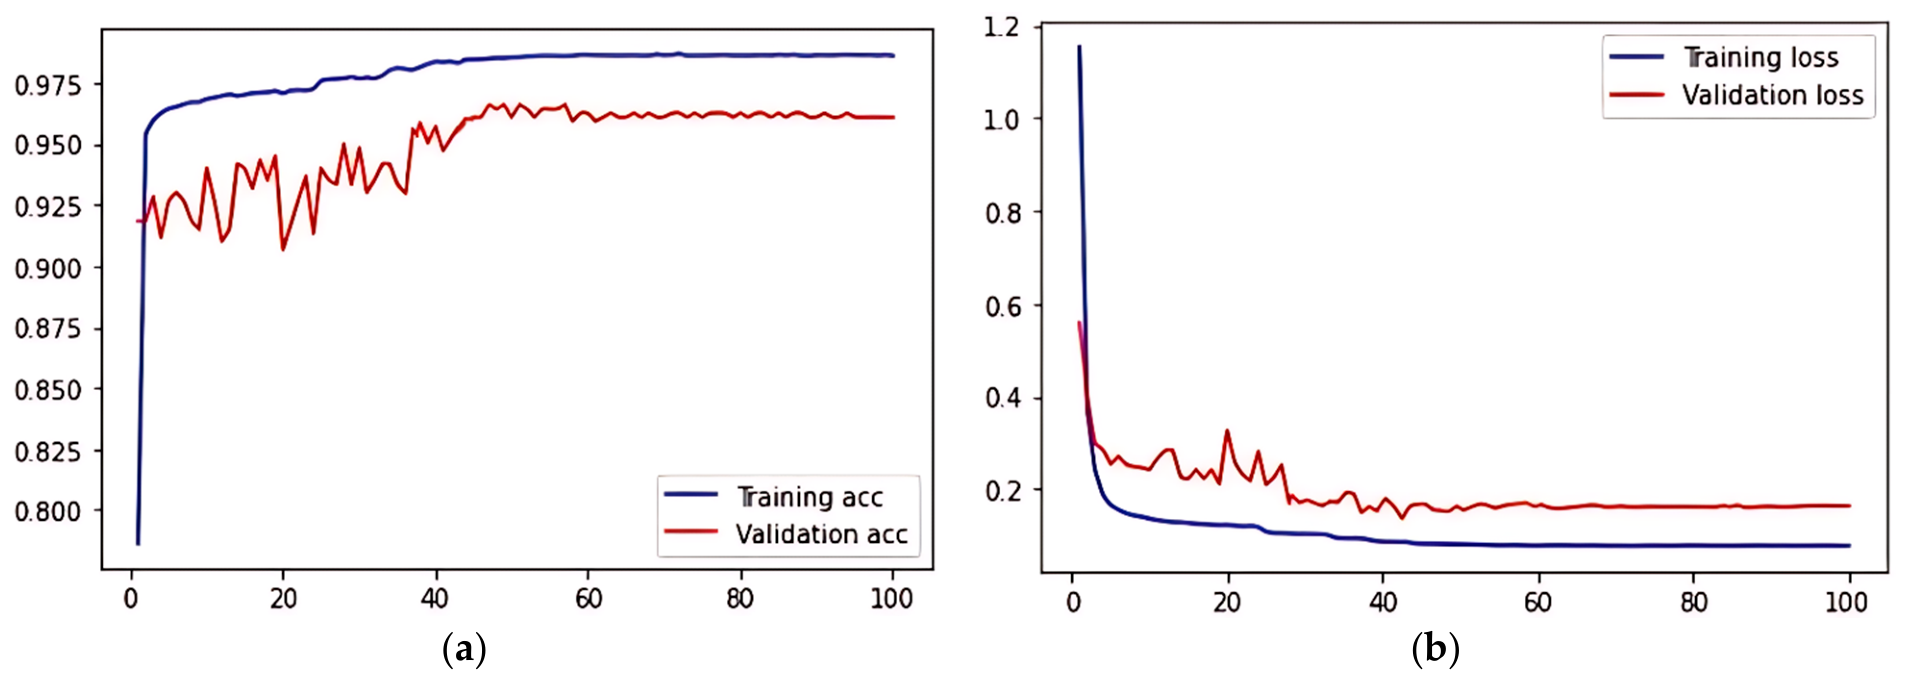
In the first part of our evaluation, the base network model is trained using both the original base images and the images generated by the 3DG algorithm with background. Averaged over five independent runs, the basic network in the 3DG mode achieved a test accuracy of 91.08 ± 1.03%, reflecting a 3.02 percentage-point improvement over the baseline. This enhancement indicates that the 3DG algorithm has positively contributed to the model’s performance, along with a decreasing trend in both training and validation loss values (
Figure 14b), which is also a positive indicator of model learning. The differences in the accuracy and loss parameters of the training and evaluation datasets indicate that the basic network model learned the concepts embedded in the training data. Moreover, it enhanced its generalization of evaluation data, hence avoiding overfitting.
Regarding the test data, 272 out of 300 images belonged to the human class, while 28 images from the human class were incorrectly classified as non-human. Also, it classified 275 images in the non-human class correctly, while 25 images from the non-human class were misclassified as human. The reason for the errors lies in the fact that certain objects resembling humans from a drone’s perspective (such as tree trunks) were erroneously identified as such. Additionally, the posture of humans in pictures often obscures substantial parts of their bodies from the camera. These issues emphasize the necessity of refining both the model and the data manipulation techniques employed.
6.2.2. Evaluation Without Background
In the second part of the evaluation, we look at how well the base network model performs on base images and 3DG algorithm-generated images without a background. The goal of this experiment is to examine the effect of background removal (part of the proposed algorithm) on model performance.
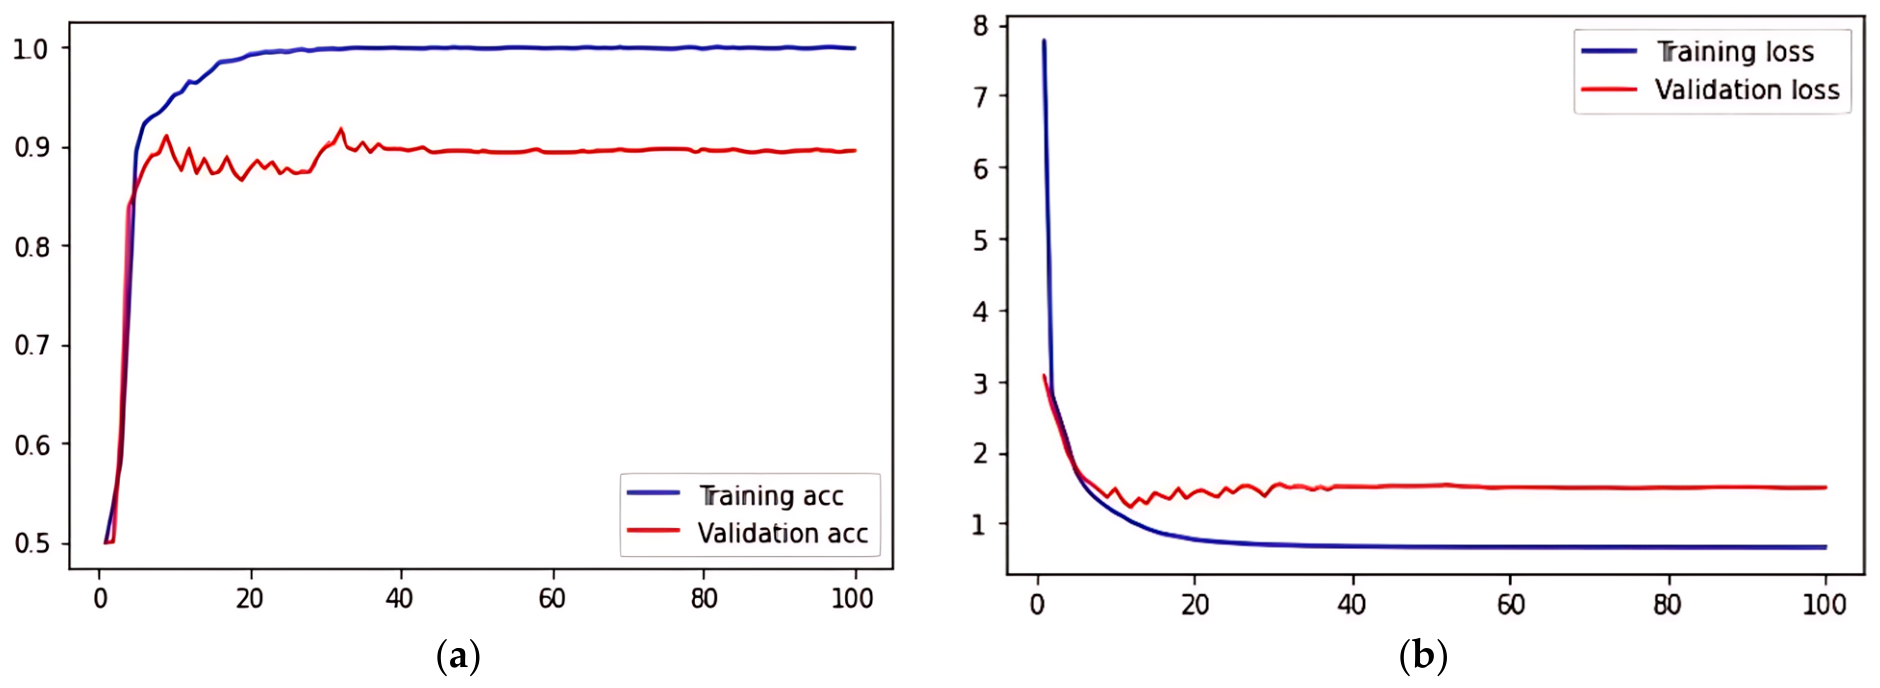
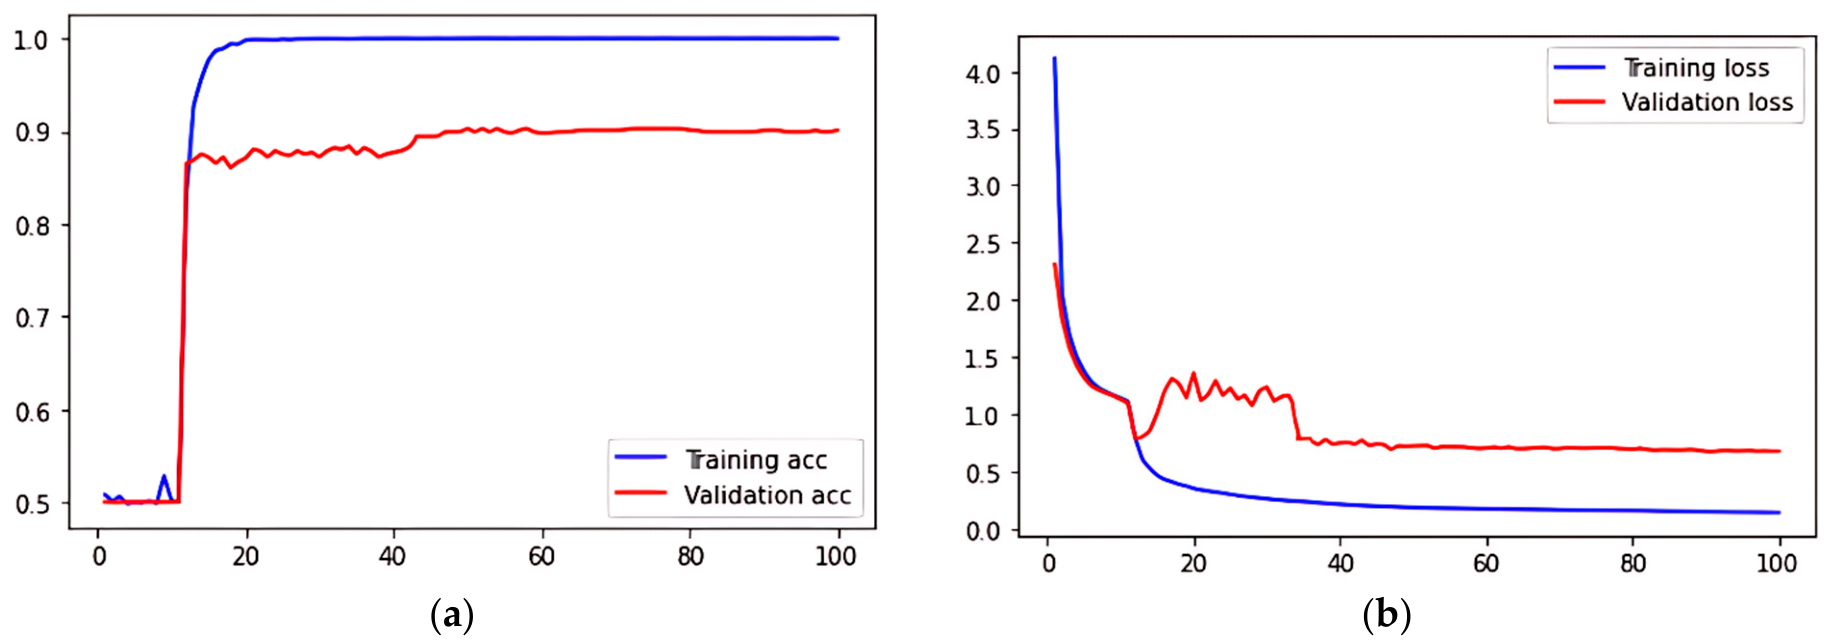
Figure 15a illustrates the changes in training and validation accuracy across each epoch for the combined dataset without background. The graph indicates that after the first seven epochs, the validation accuracy shows a strong upward trend. From period 7 to 28, the validation accuracy shows some fluctuations, which is followed by an upward trend from epoch 28 to 33. Thereafter, the validation accuracy stabilises from the 40th epoch onwards, achieving the highest value in the 33rd epoch and beyond. Meanwhile, the training accuracy continues to increase throughout all epochs, suggesting that the model is learning effectively.
Figure 15b presents the changes in training and validation loss for the same dataset without background. In the first nine epochs, the validation loss demonstrates a downward trend, indicating effective learning. However, from epochs 10 to 30, the validation loss fluctuates and stabilizes from epoch 40 onward, with the lowest value reached at epoch 13. Throughout the training process, the training loss consistently decreases, which is a positive sign of model performance.
Regarding the test data, in this case, averaged over five runs, the network in the 3DG mode without background achieved a test accuracy of 88.85 ± 0.95%, representing a modest increase of 0.79 percentage points over the baseline. In other words, the base network’s accuracy and error values on training and evaluation datasets demonstrate that while the network retained training dataset concepts, it does not generalize well to the evaluation dataset. This suggests that the model still suffers from some overfitting, and, thus, more work is needed to refine the data augmentation techniques.
The comparison between the two versions of the 3DG dataset, i.e., with and without background, shows that background elements can make a meaningful difference in training results. Removing the background slightly improved accuracy compared to the baseline, but the model had some difficulty generalizing to new data. This suggests that background information gives useful context and helps the model learn more effectively. Overall, using realistic scenes in synthetic data generation appears to make deep learning models more reliable when applied to real UAV images. Future improvements could include more variation in backgrounds and human poses to further reduce overfitting and improve accuracy.
Figure 14.
Accuracy graph (a) and Loss graph (b) per epoch for the basic network model using a combination of the baseline and 3DG dataset produced with background present. The x axis represents the number of epochs, while the y axis is accuracy (range 0–1) or the loss error.
Figure 14.
Accuracy graph (a) and Loss graph (b) per epoch for the basic network model using a combination of the baseline and 3DG dataset produced with background present. The x axis represents the number of epochs, while the y axis is accuracy (range 0–1) or the loss error.
Figure 15.
Accuracy graph (a) and Loss graph (b) per epoch for the basic network model using a combination of the baseline and 3DG dataset produced without the background. The x axis represents the number of epochs, while the y axis is accuracy (range 0–1) or the loss error.
Figure 15.
Accuracy graph (a) and Loss graph (b) per epoch for the basic network model using a combination of the baseline and 3DG dataset produced without the background. The x axis represents the number of epochs, while the y axis is accuracy (range 0–1) or the loss error.
6.3. Evaluating the Effectiveness of the 3DG Method Against Conventional Approaches
This section presents a detailed comparison of four conventional data augmentation methods, including rotation, flipping, translation, and scaling, against the proposed 3DG method. The results for this evaluation are illustrated in
Figure 16,
Figure 17,
Figure 18 and
Figure 19. Looking at these results, the following observations can be noted:
Rotation data augmentation: The rotation data augmentation method demonstrated a notable influence on the model’s learning process. As illustrated in
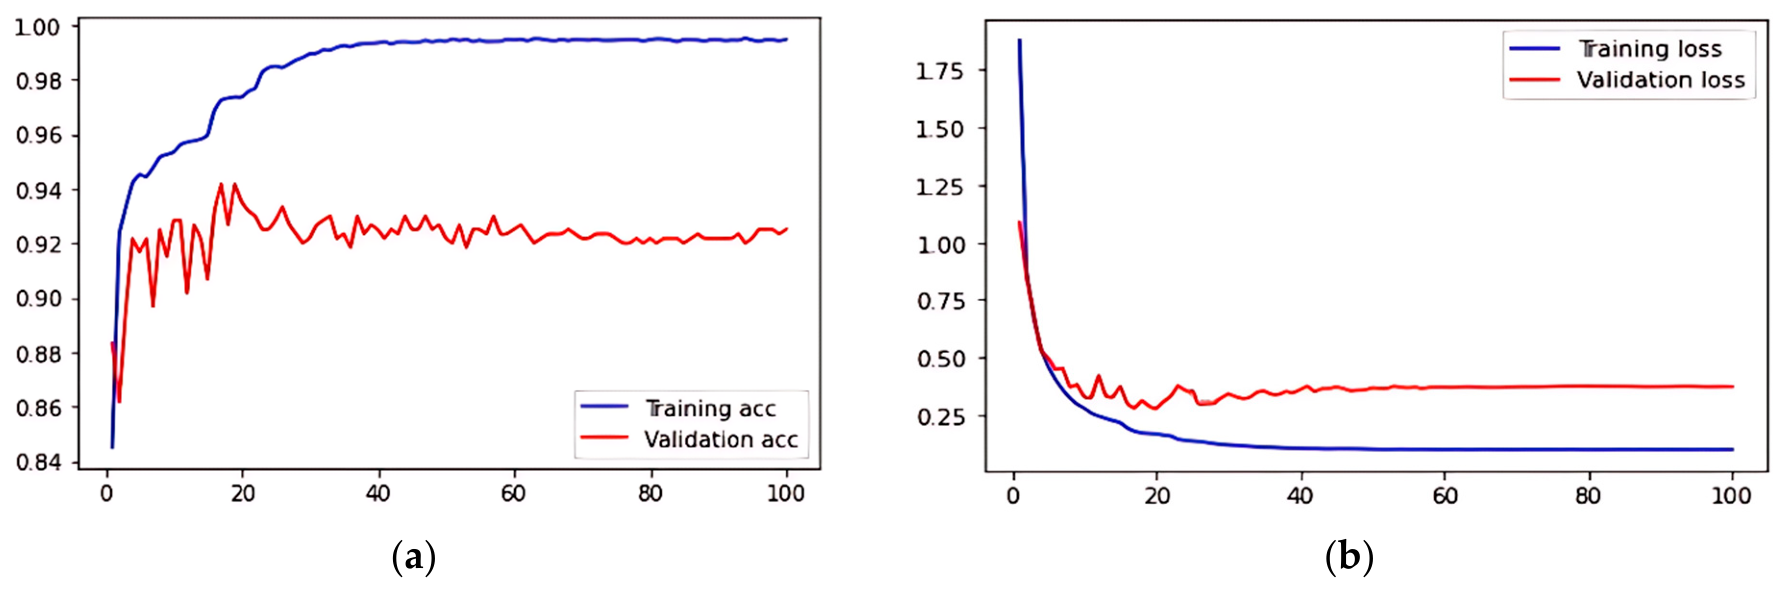
Figure 16a, the validation accuracy exhibited a downward trend in the first two epochs, which was followed by a significant upward trajectory that peaked at epoch 17. The training accuracy consistently has increased, which shows the model was successfully capturing the underlying patterns in the data. Meanwhile, the validation loss,
Figure 16b, exhibited a decreasing trend, reaching its lowest point at epoch 20. Averaged over five independent runs, this configuration achieved a test accuracy of 92.12 ± 0.83%, reflecting a 4.06 percentage-point improvement over the baseline model.
Flipping data augmentation: The flipping data augmentation method (
Figure 17a) shows a strong upward trend in validation accuracy during the first fifteen epochs, which stabilized in later epochs. The validation loss,
Figure 17b, decreased significantly. Averaged over five independent runs, this configuration achieved a test accuracy of 90.98 ± 0.92%, indicating a 2.92 percentage-point improvement over the baseline model.
Translation data augmentation: yielded a different but interesting pattern. As shown in
Figure 18a, although validation accuracy increased in the early epochs, it experienced a slight decrease before resuming a strong upward trend. Looking at
Figure 18b, we observe that the validation error shows a decreasing trend. Averaged over five independent runs, this configuration achieved a test accuracy of 90.13 ± 0.89%, representing a 2.07 percentage-point improvement over the baseline model.
Scaling data augmentation: As observed in
Figure 19a, the change in validation accuracy indicates a continuous increase throughout the training process, suggesting that the model effectively learned from the augmented data. Additionally, the validation error, shown in
Figure 19b, exhibits a continuous decreasing trend, indicating improved model performance. Averaged over five independent runs, this configuration achieved a test accuracy of 89.55 ± 0.87%, a 1.49 percentage-point improvement over the baseline model.
Comparing the proposed method with the individual conventional augmentation techniques shows that 3DG (91.08 ± 1.03%) performs at a similar level to the strongest conventional methods. Among the conventional techniques, rotation reached the highest accuracy (92.12 ± 0.83%), slightly above 3DG, while flipping (90.98 ± 0.92%) was almost the same as 3DG. Translation (90.13 ± 0.89%) and scaling (89.55 ± 0.87%) were slightly lower. As shown in the statistical analysis, the difference between 3DG and rotation, the best conventional method, was not statistically significant, which confirms that 3DG is as effective as the most successful conventional augmentation. In short, although 3DG does not outperform every conventional technique on its own, it reaches an accuracy equal to or higher than these methods while also adding a realistic three-dimensional viewpoint, depth, and background variation that two-dimensional transformations cannot produce.
Figure 16.
Accuracy graph (a) and Loss graph (b) per epoch for the basic network model using a combination of the baseline and rotation dataset. The x axis represents the number of epochs, while the y axis is accuracy (range 0–1) or the loss error.
Figure 16.
Accuracy graph (a) and Loss graph (b) per epoch for the basic network model using a combination of the baseline and rotation dataset. The x axis represents the number of epochs, while the y axis is accuracy (range 0–1) or the loss error.
Figure 17.
Accuracy graph (a) and Loss graph (b) per epoch for the basic network model using a combination of the baseline and flipping dataset. The x axis represents the number of epochs, while the y axis is accuracy (range 0–1) or the loss error.
Figure 17.
Accuracy graph (a) and Loss graph (b) per epoch for the basic network model using a combination of the baseline and flipping dataset. The x axis represents the number of epochs, while the y axis is accuracy (range 0–1) or the loss error.
Figure 18.
Accuracy graph (a) and Loss graph (b) per epoch for the basic network model using a combination of the baseline and translation dataset. The x axis represents the number of epochs, while the y axis is accuracy (range 0–1) or the loss error.
Figure 18.
Accuracy graph (a) and Loss graph (b) per epoch for the basic network model using a combination of the baseline and translation dataset. The x axis represents the number of epochs, while the y axis is accuracy (range 0–1) or the loss error.
Figure 19.
Accuracy graph (a) and Loss graph (b) per epoch for the basic network model using a combination of the baseline and scaling dataset. The x axis represents the number of epochs, while the y axis is accuracy (range 0–1) or the loss error.
Figure 19.
Accuracy graph (a) and Loss graph (b) per epoch for the basic network model using a combination of the baseline and scaling dataset. The x axis represents the number of epochs, while the y axis is accuracy (range 0–1) or the loss error.
6.4. Training the Network Using 3DG-Generated Images with No Base Data Available
In this experiment, we want to establish how effectively the network model can learn from synthetic 3DG images without baseline data. This study is important to understand the advantages and limitations (i.e., learning performance, generalisation, and overfitting) of using only the generated data.
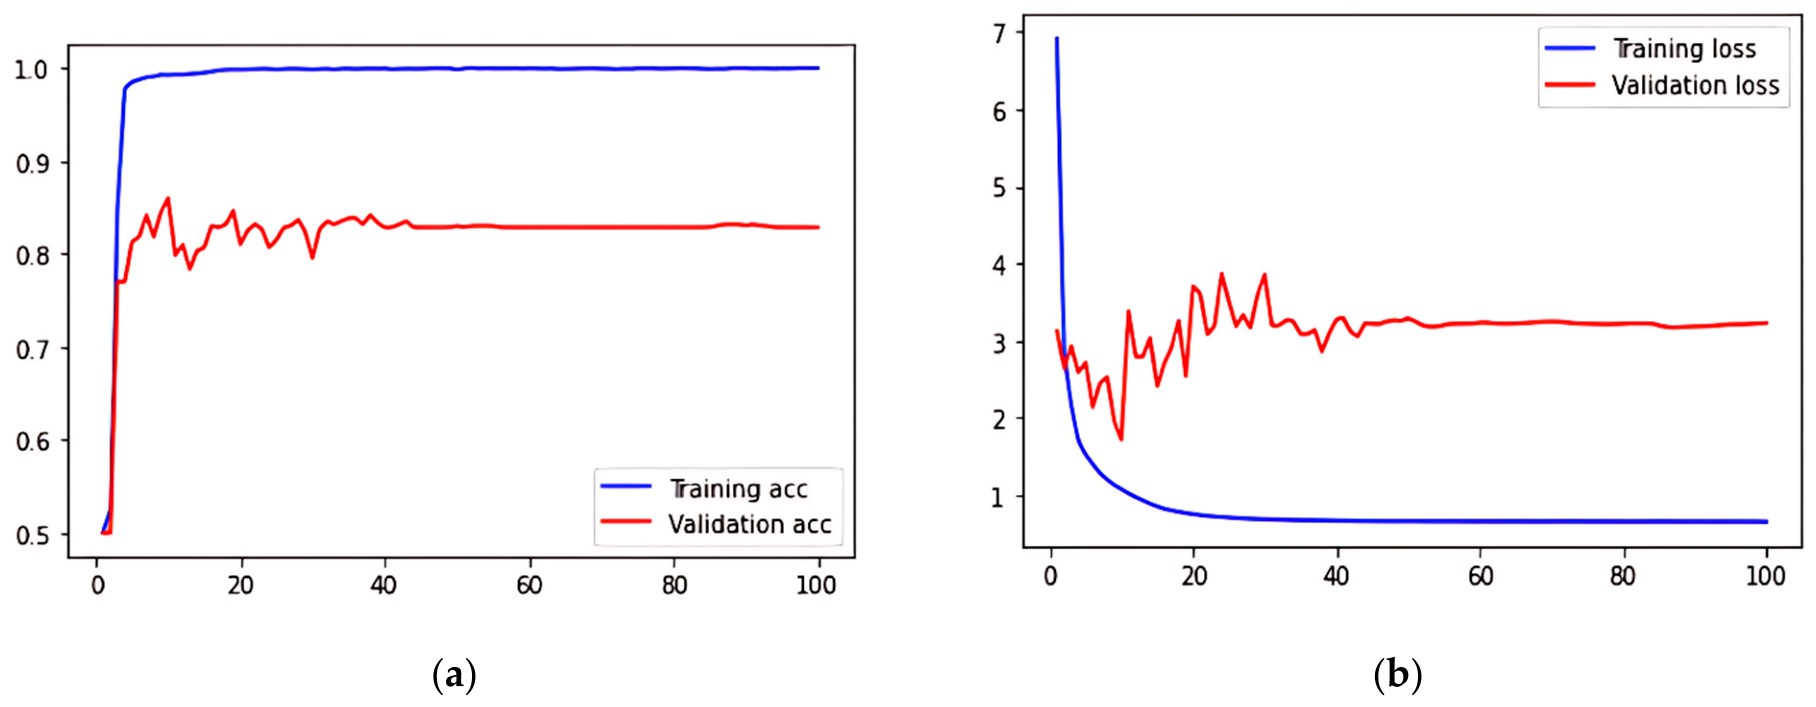
Figure 20 depicts the training and validation accuracy and loss curves for several epochs.
Figure 20a shows that validation accuracy steadily increases for the first 8 epochs, fluctuates in the epoch range of 8–40, and attains stability from epoch 42 onwards, with epoch 11 registering the highest value. At the same time, training accuracy demonstrates an almost linear growth across all epochs.
Figure 20b shows that validation loss fluctuated in the first 40 epochs before it stabilised from epoch 50 onward and reached its minimum at epoch 10. Training loss continuously decreased throughout the entire period. The network model obtained a test accuracy of 82.97%. However, the discrepancies between these metrics indicate that the model has not learned the training data sufficiently, as there is limited generalisation and clear signs of overfitting. It is worth noting that the training was performed exclusively on generated data, ignoring the base images.
The above analysis confirms that although 3DG images can initiate learning, as evidenced by an increase in validation accuracy, they are inadequate for strong model generalisation. The continuous improvement of training parameters and the fluctuating assessment results had a test accuracy of 82.97%, which indicates overfitting in the absence of actual baseline images. Thus, the application of synthetic data generated by 3DG should consider its combination but not its substitution for the baseline data. Real images are necessary to fully capture the diversity of the target distribution and ensure the balanced training of deep learning models. Next, we will consider how 3DG can enhance accuracy in combination with other techniques and methods.
6.5. Combination of All Methods
This section examines the effect of combining data from all augmentation techniques, including base images, conventional data augmentation methods, and 3DG-generated images, on the performance of the basic network model.
Figure 21 presents the training and validation accuracy and loss curves obtained during the training process. As can be seen in
Figure 21a, from epoch 5 to epoch 45, the validation accuracy displays a fluctuating trend. Subsequently, from epoch 45 to epoch 58, the accuracy improves, reaching its peak at epoch 58, and remains constant from epoch 60 onward. In contrast, the training accuracy shows a continuous upward trend throughout the training period.
Figure 21b presents the changes in loss across successive epochs. In the first 7 epochs, the validation loss exhibits a decreasing trend; from epoch 7 to 42, it fluctuates, and from epoch 42 onward, it stabilizes. The training loss, however, consistently declines over the entire period. Notably, averaged over five runs, the network achieved a test accuracy of 95.21 ± 0.61% when all data augmentation methods were integrated, a 7.15 percentage-point improvement over the baseline. The differences between training and validation metrics show that the network learned the data well and generalized to the evaluation set, finding an optimal fit.
The combination of all data augmentation methods and baseline images notably boosts the model performance. The increase in training accuracy, evaluation metrics stabilization, and the substantial improvement of test accuracy due to the comprehensive data augmentation approach show that such an approach helps prevent model overfitting and promotes effective learning and generalization.
Figure 20.
Per-epoch accuracy (a) and loss (b) curves for the model trained exclusively on 3DG data. The x axis represents the number of epochs, while the y axis is accuracy (range 0–1) or the loss error.
Figure 20.
Per-epoch accuracy (a) and loss (b) curves for the model trained exclusively on 3DG data. The x axis represents the number of epochs, while the y axis is accuracy (range 0–1) or the loss error.
Figure 21.
Accuracy graph (a) and Loss graph (b) per epoch for the basic network model using a combination of the baseline and all data augmentation datasets. The x axis represents the number of epochs, while the y axis is accuracy (range 0–1) or the loss error.
Figure 21.
Accuracy graph (a) and Loss graph (b) per epoch for the basic network model using a combination of the baseline and all data augmentation datasets. The x axis represents the number of epochs, while the y axis is accuracy (range 0–1) or the loss error.
6.6. Discussion
In the above, we evaluated the 3DG and the traditional data augmentation techniques against baseline training using real UAV images. Additionally, we examined the potential of 3DG-generated images to be used as a stand-alone training source. To verify that the reported improvements are statistically reliable rather than artefacts of randomness in training, each of the nine dataset configurations was trained and evaluated over five independent runs under identical, controlled conditions. In every run, the training partitions were reshuffled so that the training samples varied between runs, while the validation and test sets were held fixed, ensuring that the runs differ only in the training data and remain directly comparable on the same held-out test set. Within each run, the training, validation, and test sets were strictly separated, with no overlap, to prevent data leakage, and all reported metrics correspond to the held-out test set. The results are summarised as mean ± standard deviation, together with 95% confidence intervals, in
Table 6. Because the runs are paired on a common test set, paired two-tailed
t-tests were then conducted between each configuration and the baseline. Before carrying out the pairwise comparisons, we first performed a one-way analysis of variance (ANOVA) across all nine configurations to check whether the choice of augmentation strategy had a significant effect on test accuracy overall. The test showed a clear difference between the configurations (F(8, 36) = 65.27,
p < 0.001), meaning that the differences in accuracy between strategies are much larger than the small variations expected between runs. This result supports the use of the paired
t-tests that follow, which show exactly which configurations differ from the baseline.
The improvement obtained by the proposed 3DG augmentation over the baseline was statistically significant: test accuracy increased from 88.06 ± 0.97% to 91.08 ± 1.03%, a gain of 3.02 percentage points (t(4) = 3.35, p = 0.029), despite only doubling the dataset size. The validation trends also indicated improved generalization with reduced overfitting, with the 3DG-trained model learning more consistently and showing fewer signs of instability during training. This confirms that 3DG does not merely increase data volume but contributes high-quality, diverse training instances that simulate real-world complexity.
In contrast, the conventional augmentation techniques, which expanded the dataset from 4600 to 23,600 images, yielded either weaker (89.55 ± 0.87% for scaling, not significantly different from the baseline, p = 0.15) or only moderately better performance (between 90.13 ± 0.89% and 92.12 ± 0.83%). Notably, the difference between 3DG and the strongest conventional method, rotation, was not statistically significant (p = 0.28), indicating that 3DG matches the best conventional augmentation while adding a realistic background and depth that two-dimensional transformations cannot provide. Even when trained solely on 3DG images, without any real ones, the model still achieved 82.90 ± 1.02% accuracy; although lower than the baseline, this shows that the synthetic images were realistic enough to support learning and can be a useful option when real images are scarce.
The strongest result was obtained when real UAV data, 3DG images, and conventional augmentations were combined, reaching the highest overall accuracy of 95.21 ± 0.61%, a 7.15 percentage-point gain over the baseline (t(4) = 45.8, p < 0.001). This combination also significantly outperformed 3DG alone (p = 0.006), confirming that photogrammetric diversity and conventional augmentations contribute complementary improvements when both real data and synthetic augmentations are used. Together, these tests confirm that the observed improvements are statistically meaningful and not attributable to random variation between training runs.
As mentioned, unlike traditional augmentations that merely adjust pixel position, orientation, etc., 3DG creates additional spatial details and variations based on the object’s 3D structure. However, the generation of strong 3DG images requires substantial pre-processing efforts aimed at obtaining high-quality human meshes and poses, as well as generating realistic backgrounds. Thus, it can be more time-consuming than traditional methods. Therefore, it is mainly applicable where model generalization is critical and sufficient computational resources are accessible. 3DG can assist in swiftly developing models using only a few real images to obtain sufficient initial data. Hybrid models, which combine real UAV data with 3DG-generated images, seem to provide a good balance of realism and variety, with relatively low complexity. Combining 3DG with real UAV data and other augmentation data can maximize these advantages, making it a valuable tool in the deep learning pipeline for aerial surveillance and human detection.
7. Conclusions
The main goal of this work was to develop a photogrammetry-based data generation algorithm for human detection in drone images. The suggested method for model-based data generation (3DG) creates images of humans in various positions from a bird’s-eye perspective without the need for additional flights that increase the cost of data collection. The method uses photogrammetrically processed 3D models to derive images from different distances and angles. Our images possess 3D features and depths, making them fundamentally three-dimensional. These images can be added to existing datasets to improve the performance of deep learning models for aerial human detection.
A baseline deep learning algorithm was used to evaluate the data generated by our method and compare it against the data obtained using traditional augmentation techniques such as inversion, translation, scaling, and rotation. The results show that the amount of training data is correlated with model accuracy. While traditional techniques achieved the same level of accuracy as our algorithm, rotation-based augmentation performed as the best conventional method. The key point is that 3DG alone improved baseline accuracy, and in combination with standard boosting techniques, boosted performance even further. These findings show that the algorithm can generate high-quality data for model training and that this data significantly affects classification performance.
Future studies should analyse whether the diversity of 3D models has any effect on diagnostic accuracy. Repeated experiments under different conditions elucidated more details regarding the model behaviour (in terms of loss and accuracy). Additionally, testing different network architectures could potentially increase the accuracy of 3D Earth and human models. Expanding the dataset to cover human body positions such as sitting, lying down, and floating in water could also improve the model’s robustness for real-world drone applications. In addition, while the present study focuses on complete, upright human figures, real post-disaster scenes often contain partially visible or occluded bodies, for example, when only a hand, leg, or head is exposed, as well as people lying within wreckage. Future work will therefore extend the 3DG pipeline to generate such partial and non-upright human configurations. The range of background scenes will likewise be broadened to include disaster-specific environments such as mud, flooding, and burned or collapsed structures, so that the synthetic training data more closely reflect real post-disaster conditions.
A further valuable direction would be a systematic empirical comparison of 3DG against recent generative and simulation-based paradigms, such as diffusion models, NeRF, domain randomization, and synthetic-to-real transfer learning, using dedicated and equally tuned baselines on the same UAV human-detection task.